
IDENTIFICATION OF HIGH SEED YIELDING AND STABLE FENUGREEK MUTANTS RAJIB PRASAD
IDENTIFICATION OF HIGH SEED YIELDING AND STABLE
FENUGREEK MUTANTS
RAJIB PRASAD
M. Sc. Biotechnology, Bangladesh Agricultural University
A Thesis
Submitted to the School of Graduate Studies
of the University of Lethbridge
in Partial Fulfillment of the
Requirements for the Degree
MASTER OF SCIENCE
Department of Biological Sciences
University of Lethbridge
LETHBRIDGE, ALBERTA, CANADA
November, 2011
© Rajib Prasad, 2011
Abstract
Fenugreek (Trigonella foenum-graecum L.) was recently introduced to western
Canada as a forage crop. To reach its full potential, high yielding, early maturing
fenugreek cultivars that produce good seed yield and quality within 100 frost free days
need to be developed. In this study, mutation breeding approach was used on five locally
adapted fenugreek genotypes to generate variants showing improved seed yield and yield
attributing traits that can be used for cultivar development. Mutant generations of these
plants were evaluated in multi-location, multi-year trials, and individual plants were
selected for high seed and biomass yield. Seeds from a tetraploid fenugreek line and its
diploid parent Tristar were grown under multiple environments to understand effect of
environment on seed oil content. In addition, mold resistant fenugreek genotypes were
identified by screening a collection of fenugreek accessions against a destructive fungal
pathogen Cercospora traversiana.
iii
Dedication
To my Parents.
iv
Table of Contents
Chapter One: Introduction .......................................................................................... 01
1.1 Introduction ............................................................................................................. 01
1.2 Background ............................................................................................................. 07
1.2.1 Taxonomy of Fenugreek ..................................................................................... 07
1.2.2 Origin and centre of diversity of fenugreek ...................................................... 08
1.2.3 Regions of cultivation .......................................................................................... 09
1.2.4 Biological and morphological features of fenugreek ........................................ 12
1.2.5 Agronomic aspects of fenugreek ........................................................................ 15
1.2.5.1 Environment and soil ....................................................................................... 17
1.2.5.2 Seeding and seed rate ....................................................................................... 17
1.2.5.3 Cultural practices ............................................................................................. 18
1.2.6 Diseases and pests of fenugreek ........................................................................ 23
1.2.7 Uses ....................................................................................................................... 25
1.2.7.1 Ancient use of fenugreek ................................................................................. 25
1.2.7.2 Fenugreek as a spice ........................................................................................ 25
1.2.7.3 Fenugreek uses for remedy and medicinal purposes ................................... 26
1.2.7.4 Fenugreek as animal food ............................................................................... 28
1.2.7.5 Agricultural and others uses .......................................................................... 29
1.2.8 Improvement of fenugreek ................................................................................ 31
1.2.8.1 Selection ........................................................................................................... 31
1.2.8.2 Hybridization .................................................................................................. 33
1.2.8.3 Mutation breedin ............................................................................................ 34
v
Chapter Two: Mutation Breeding .............................................................................. 37
2.1 Introduction ............................................................................................................ 37
2.2 Materials and Methods .......................................................................................... 41
2.2.1 Seed material ....................................................................................................... 41
2.2.2 Treatment with mutagen .................................................................................... 41
2.2.3 Growing M 1 plants .............................................................................................. 42
2.2.4 Growing M 2 plants .............................................................................................. 42
2.2.5 Growing M 3 plants .............................................................................................. 43
2.2.6 Statistical analysis ............................................................................................... 44
2.3 Results ..................................................................................................................... 45
2.4 Discussion ............................................................................................................... 67
Chapter Three: Mutant Evaluation ........................................................................... 71
3.1 Introduction ........................................................................................................... 71
3.2 Materials and Methods ......................................................................................... 73
3.2.1 Seed material ...................................................................................................... 73
3.2.2 Growing environments ...................................................................................... 73
3.2.3 Location parameters .......................................................................................... 74
3.2.4 Experimental design .......................................................................................... 75
3.2.5 Statistical analysis .............................................................................................. 77
3.3 Results .................................................................................................................... 79
3.4 Discussion .............................................................................................................. 94
Chapter Four: Mutant Lines ................................................................................... 101
4.1 Introduction ........................................................................................................ 101
vi
4.2 Materials and Methods .................................................................................... 104
4.2.1 Selected mutant diploid lines ....................................................................... 104
4.2.2 Tetraploid line ............................................................................................... 105
4.2.3 Statistical analysis ........................................................................................ 107
4.3 Results .............................................................................................................. 108
4.3.1 Selected mutant diploid lines ...................................................................... 108
4.3.2 Tetraploid line .............................................................................................. 115
4.4 Discussion ........................................................................................................ 120
Chapter Five: Screening Resistant Fenugreek Genotypes Against Cercospora Leaf
Spot Disease. ......................................................................................................... 124
5.1 Introduction .................................................................................................... 124
5.2 Materials and Methods .................................................................................. 127
5.2.1 Plant genotypes ............................................................................................ 127
5.2.2 Culture of pathogenic fungi ....................................................................... 127
5.2.3 Growth chamber experiment .................................................................... 128
5.2.4 Evaluation of seed-borne nature of Cercospora traversiana.................... 131
5.2.5 Morphology of Cercospora traversiana...................................................... 131
5.3 Results ............................................................................................................. 132
5.4 Discussion ....................................................................................................... 144
Chapter Six: Thesis Summary ........................................................................... 148
References ............................................................................................................ 157
vii
List of Tables
Table 1.1. Countries involved in cultivation of fenugreek and the local names used to
identify it. ..................................................................................................... 11
Table 1.2. Botanical and morphological aspects of fenugreek. .................................. 16
Table 2.1. Survival of M 1 (EMS treated) and untreated plants for each base
population . .................................................................................................. 46
Table 2.2. Survival of M 2 plants in the field and M 3 plants in greenhouse conditions
for each group. ............................................................................................ 48
Table 2.3. Different morphometric parameters (mean ± SE) of field grown M 2
plants and greenhouse grown M 3 plants.
............................................................. 50
Table 2.4. Range of different morphometric parameters (mean ± SE) of field grown
M 2 plants and greenhouse grown M 3 plants. ........................................... 57
Table 3.1. The monthly average temperature, maximum average temperature,
minimum average temperature and monthly average precipitation for
each growing in this study. ........................................................................ 78
Table 3.2. Results of the Analysis of Variance (ANOVA) for seed and forage yield of
fenugreek generations. .............................................................................. 80
Table 3.3. Mean (± SE) seed and forage yield in the seven environments of fenugreek
mutant generations. .................................................................................... 82
Table 3.4. Mean squares taken from ANOVA tables for plant height, pod number
per plant, double pod number per plant, seed weight per plant, dry
biomass weight per plant and basal stalk number per plant of fenugreek
mutant generations grown in 2010. ........................................................... 86
Table 3.5. Main effect of mutant generations and environments on the mean
performance of plant height, pod number per plant, double pod number
per plant, seed weight per plant, dry biomass weight per plant and basal
stalk number per plant of fenugreek. ....................................................... 88
viii
Table 3.6. Correlation coefficients (r) among traits measured on fenugreek mutant
generation and check variety grown across 3 environments. ................. 93
Table 4.1. Mean square results of the Analysis of Variance (ANOVA) for plant
height, pod number per plant, double pod number per plant, seed weight
per plant, dry biomass weight per plant and basal stalk number per plant
of fenugreek selected lines. ...................................................................... 109
Table 4.2. Main effect of selected lines on the mean performance of plant height, pod
number per plant, double pod number per plant, seed weight per plant,
dry biomass weight per plant and basal stalk number per plant of
fenugreek. ................................................................................................. 111
Table 4.3. Results of the Analysis of Variance (ANOVA) for seed oil content (%) and
seed yield (kg/ha) of tetraploid fenugreek line and Tristar fenugreek.
.................................................................................................................... 116
Table 4.4. Main effect of environments and genotypes on the mean performance of
seed oil content (%) and seed yield (kg/ha) of tetraploid fenugreek line
and Tristar fenugreek. ............................................................................ 118
Table 5.1. Results of the Analysis of Variance (ANOVA) for disease severity of
twenty fenugreek accessions used in final disease screening test. ...... 135
Table 5.2. Main effect of disease severity to Cercospora traversiana of 20 fenugreek
genotypes used in final disease trial. ..................................................... 136
Table 5.3. Mean square results identified using Analysis of Variance (ANOVA) for
Cercospora traversiana treatment effects, the genotype effect and
treatment genotype interaction effect on plant height, pod number per
plant, seed weight per plant and dry biomass weight per plant of 20
fenugreek genotypes used in the final disease trial. ............................ 138
Table 5.4. Main effect of Cercospora traversiana treatment on the mean performance
relative to plant height, pod number per plant, seed weight per plant, and
dry biomass weight per plant of 20 fenugreek genotypes used in the final
disease trial. (Mean percentage of the control for each genotype for these
traits is presented in parenthesis.) ......................................................... 140
ix
List of Figures
Figure 2.1. The "which wins where" view of GGE biplot for assessment of variation
in plant height of the mutant groups over two mutant generations
(FL_M2 = field grown M2¬ generation, and GH_M3 = greenhouse
grown M3 generation). Variation in plant height was assessed using a
Principle Component Analysis of mutated plants from five different
genotypes (Tristar, Amber, F80, F70, and F86) over two generations
(FL_M2 and GH_M3). Highly positive PC 1 scores indicate superior
performance, whereas PC 2 scores close to 0.0 indicate trait
stability....................................................................................................... 51
Figure 2.2. Percentage of plant producing different number of pods for M2 and M3
mutant generations for each base population. ....................................... 54
Figure 2.3. The "which wins where" view of GGE biplot for assessment of variation
in pod number per plant of the mutant groups over two mutant
generations (FL_M2 = field grown M2¬ generation, and GH_M3 =
greenhouse grown M3 generation). Variation in pod number per plant
was assessed using a Principle Component Analysis of mutated plants
from five different genotypes (Tristar, Amber, F80, F70, and F86) over
two generations (FL_M2 and GH_M3). Highly positive PC 1 scores
indicate superior performance, whereas PC 2 scores close to 0.0 indicate
trait stability. ............................................................................................. 55
Figure 2.4. Mutant plants showing (A) apical flowers, (B) double pods, and (C)
multiple basal stalks. ................................................................................. 58
Figure 2.5. Percentage of plant producing different number of double pods for M2
and M3 mutant generations for each base population. ......................... 59
Figure 2.6. Percentage of plant producing different amount of seed for M2 and M3
mutant generations for each base population. ....................................... 61
x
Figure 2.7. The "which wins where" view of GGE biplot for assessment of variation
in seed weight per plant of the mutant groups over two mutant
generations (FL_M2 = field grown M2¬ generation, and GH_M3 =
greenhouse grown M3 generation). Variation in seed weight per plant
was assessed using a Principle Component Analysis of mutated plants
from five different genotypes (Tristar, Amber, F80, F70, and F86) over
two generations (FL_M2 and GH_M3). Highly positive PC 1 scores
indicate superior performance, whereas PC 2 scores close to 0.0 indicate
trait stability. ............................................................................................. 62
Figure 2.8. Percentage of plant producing different amount of dry biomass for M 2
and M 3 mutant generations for each base population. ......................... 64
Figure 2.9. The "which wins where" view of GGE biplot for assessment of variation
in dry biomass per plant of the mutant groups over two mutant
generations (FL_M2 = field grown M2¬ generation, and GH_M3 =
greenhouse grown M3 generation). Variation in dry biomass per plant
was assessed using a Principle Component Analysis of mutated plants
from five different genotypes (Tristar, Amber, F80, F70, and F86) over
two generations (FL_M2 and GH_M3). Highly positive PC 1 scores
indicate superior performance, whereas PC 2 scores close to 0.0 indicate
trait stability. ............................................................................................ 65
Figure 3.1. Mean seed yield (kg ha-1) based on plot harvest data of M 3 to M 6
generation along with control Tristar. ................................................... 83
Figure 3.2. Mean forage yield (kg ha-1) based on plot harvest data of M 3 to M 6
generation along with control Tristar. .................................................. 84
Figure 3.3. Trend of seed weight/plant, double pods/plant and basal stalk/plant over
the mutant generations (M 3 to M 7 ) over all the growing environments
(Creston 2010, Lethbridge Irrigation 2010, and Lethbridge Dry 2010).
................................................................................................................... 90
Figure 3.4. Trend of height/plant, pods/plant and biomass weight/plant over the
mutant generations (M 3 to M 7 ) over all the growing environments
(Creston 2010, Lethbridge Irrigation 2010, and Lethbridge Dry 2010).
................................................................................................................... 91
xi
Figure 4.1. Mean plant height/plant, pod number/plant and dry biomass
weight/plant of selected mutant lines and Tristar fenugreek. ......... 112
Figure 4.2. Mean seed weight/plant, double pod number/plant and basal stalk
number/plant of selected mutant lines and Tristar fenugreek. ....... 113
Figure 4.3. Seeds of selected fenugreek lines and Tristar grown in the field of LRC
(Summer, 2010). ................................................................................... 114
Figure 4.4. Seeds of tetraploid fenugreek line and Tristar. ................................ 117
Figure 5.1. Cercospora traversiana fungal structures on diseased fenugreek leaves (A
and B) under a compound microscope. ............................................. 142
Figure 5.2. Scanning Electron Microscopy (SEM) images of Cercospora traversiana
fungal structures on diseased fenugreek leaves showing conidiophores
and conidia (A and B) under an electron microscope (magnification at
1.3×10³x). .............................................................................................. 143
xii
List of Abbreviations
AAFC
Agriculture and Agri-Food Canada
AB
Alberta
ADF
Acid detergent fibre
ANOVA
Analysis of Variance
Ba
Barium
BC
British Columbia
Br
Bromine
Ca
Calcium
CDCS
Crop Diversification Centre South
cm
centimeter
Co
Cobalt
CP
Crude Protein
Cu
Copper
CV
Coefficient of Variation
DF
Degrees of Freedom
DNA
Deoxyribonucleic Acid
EMS
Ethyl Methane Sulphonate
Fe
Iron
g
gram
GPS
Global Positioning System
ha
hectare
HSD
Honestly Significant Difference
xiii
IR
Irrigation/Irrigated
kg
kilogram
Leth
Lethbridge
LRC
Lethbridge Research Centre
LR-NMR Low Resolution Nuclear Magnetic Resonance
m
meter
M
Molar
m3
cubic meter
MCPB
Methyl Phenoxy Butanoic Acid
Mg
Magnesium
Mn
Manganese
Na
Sodium
NDF
Neutral Detergent Fibre
o
Degree Celsius
C
p
Probability
PC 1
First Principal Component
PC 2
Second Principal Component
PDA
Potato-Dextrose Agar
PGRC
Plant Genetic Resources of Canada
r
Correlation coefficient
RF
Rain-fed
SE
Standard Error
SEM
Scanning Electron Microscopy
xiv
USA
United States of America
Zn
Zinc
xv
Chapter One: Introduction
1.1 Introduction
The annual crop fenugreek (Trigonella foenum-graecum L.) is a member of the
family Fabaceae (formerly known as Papilionaceae) within the order Leguminosae. It is
a self-pollinating dicotyledonous plant with branched stems, trifoliate leaves, which bears
white flowers and produces golden yellow seeds (Acharya et al. 2010a; Petropoulos
2002). Although fenugreek cultivation is mostly concentrated in Asia and the
Mediterranean region, it is now widely cultivated in northern Africa, central Europe,
North America and Australia (Fotopoulos 2002).
Fenugreek is primarily used as a spice in countries where it is grown (Acharya et
al. 2006). Especially in India and countries in the Mediterranean regions both seed and
leaves of fenugreek are widely used as a culinary spice to enhance the taste of many
meat, poultry and vegetable dishes (Mary 2009). Seeds and leaves of fenugreek are well
characterized with a distinctive, pungent scent that has made it highly desirable in
culinary applications (Max 1992). The seed is frequently used in Indian sub-continental
cuisine as an ingredient of various curry powders, and in the preparation of pickles, and
pastes (Srinivasan 2006). Fenugreek seed is the main condiment in Yemen and the
Arabian Gulf (Weiss 2002). In south Asia and Egypt young leaves and sprouts of
fenugreek are eaten as green vegetables while dried leaves are used to flavor soups and
curries (Duke 1981). Adding fenugreek leaves in dishes is a tradition of Iranian cooking.
In Ethiopian and Eritrean cuisine the plant is used as a supplement in wheat and maize
flour for bread making while in India fenugreek seed powder is one of the ingredients in
1
making a specialty type of bread (Leela and Shafeekh 2008; Al-Habori and Raman 2002).
Fenugreek plant products are used more for coloring food than flavoring in China. Leafy
stems of fenugreek are ground to produce an organic powdered food color product to
color steamed pastries (Hu 2005).
Fenugreek is also grown for forage. It is regarded as traditional forage in Egypt,
India, Turkey and the Mediterranean region (McCormick et al. 2009). Many researchers
have suggested that it has been used extensively in the past as hay, green fodder and
silage, and as a supplement with other animal feed (Smith 1982; Hardman 1969; Rouk
and Mangesha 1963). In addition fenugreek, mixed with cottonseed is fed to weaning
cows to increase flow of milk (Hidvegi et al. 1984). It is also used to mix with inferior
hay and sour hay (mildewed hay) to increase palatability (Petropoulos 2002). It is
recommended as alternative leguminous forage in alfalfa based cattle farms since it can
prevent bloating in cattle which is a disadvantage associated with use of alfalfa fodder
(Acharya et al. 2007). Fenugreek is reported to provide similar rumen conditions,
digestibility and weight gain in cattle in comparison to alfalfa (Mir et al. 1998). Acharya
et al. (2008) stated that fenugreek forage yield is identical to two cuts of alfalfa. As well,
it is capable of retaining its quality profile throughout the season.
Fenugreek has a long history of use as a medicinal herb. It is extensively used in
both Indian Ayurvedic medicines and traditional Chinese medicines (Tiran 2003). In
herbal medicine it is used in the treatment of diabetes (Leela and Shafeekh 2008). The
crop species has long been used as a galactogogue to promote lactation in weaning
mothers and to promote weight-gain in women (Rgubi and Belahsen 2006; Tiran 2003).
In early times, it has been used to get diverse medicinal benefits that include wound2
healing, aid in digestion, treatment of sinus and lung congestion, inflammation and
infection mitigation, hair treatment, bust enhancement and aphrodisiac effects (Leela and
Shafeekh 2008; Tiran 2003). Advances in nutraceuticals and demand for
phytonutraceuticals and functional foods have renewed interest in fenugreek as a
functional food. These have led to identification of specific health benefits of this novel
crop through extensive research and clinical trials (Acharya and Thomas 2007). Health
benefits that can be obtained using fenugreek comprise anti-inflammatory (Langmeade et
al. 2002), anti-carcinogenic (Raju and Bird 2006; Amin et al. 2005), anti-nociceptive
(Hibasami et al. 2003; Sur et al. 2001); antioxidant (McCue and Shetty 2003; Langmeade
et al. 2002), anti-microbial (Thomas et al. 2006), anti-ulcer (Pandian et al. 2002), antiobesity (Handa et al. 2005), anti-hyperglycemic (Ruby et al. 2005; Basch et al. 2003),
anti-diabetic (Saxsena and Vikram 2004) and hypocholesterolemic (Basch et al. 2003)
effects. Most of the laboratory studies and clinical trials have focused on three bioactive
compounds found in fenugreek namely galactomannan, diosgenin and 4hydroxyisoleucine. The results of these studies indicate that most health benefits of
fenugreek can be attributed to these three key biochemical components.
Fenugreek as a crop provides other environmental, economic and social benefits
(Acharya et al. 2011; Moyer et al. 2003). It is a dry-land adaptive crop which can reduce
water requirement during cultivation. It can passively prevent contamination of ground
water and soil run-off by irrigation water. As a legume it binds nitrogen in root nodules.
Incorporation of the plant into the soil after harvest can serve as a nitrogen source for
subsequent crops; thus fenugreek also can lower the need for application of nitrogenous
3
fertilizers in the field; it can successfully be used in short term rotations to help maintain
soil productivity (Acharya et al. 2008; 2006; Moyer et al. 2003).
The fixed oil in fenugreek seed has a tenacious aroma. Fenugreek oil is used in
flavoring for many canned food and syrups. Artificial maple syrup is flavored with
fenugreek seed extract as it imitates a maple syrup smell (Acharya et al. 2008). It also has
attracted the interest of the perfume trade. It is considered as a secret ingredient in some
French perfumes (Petropoulos 2002).
Since 1992, fenugreek has been grown commercially in western Canada. Initially
it was introduced to Canada for its use as a spice and “AC Amber” was the first Canadian
fenugreek cultivar developed by Agriculture and Agri-Food Canada, Manitoba. Currently
five fenugreek cultivars are being grown commercially in Canada. “Tristar”, developed
by Agriculture and Agri-Food Canada, Lethbridge, is the most recent cultivar developed
among the five and, was the first fenugreek cultivar developed for forage use (Basu et al.
2009). It is well adapted to semi-arid prairie regions of western Canada and can produce a
high biomass yield. However, the released cultivars and adapted fenugreek germ plasm
are unable to support consistent high quality seed production in temperate climates. As a
crop originating from tropical regions, fenugreek is reported to mature in 130-140 days
under tropical climate conditions. Although “Tristar” is a good cultivar for use as forage,
it does not consistently produce a high quality and quantity of seeds when grown in
western Canada where, on average, there are only 100 frost free days available for
cultivation of the plant; i.e., “Tristar” requires about 120 days to produce mature seed in
the temperate climate found in western Canada.
4
Most fenugreek have an indeterminate growth habit where the plants grow
continuously at the shoot apex and keep producing new shoots, flowers and seed pods
that mature slowly (Basu et al. 2009). However, some fenugreek plants can exhibit a
determinate growth habit where the shoot apices fail to branch and redirect plant
resources into flowering and seed development resulting in early plant maturation. In this
study, mutation breeding was used to generate mutants with increased population
variability that can be used to select for early maturity and a determinate growth habit.
Five germplasms adapted for growth in western Canada, namely AC Amber, F70, F80,
F86 and Tristar were treated with EMS to produce mutant plants that can be used for
cultivar improvement. It was hypothesized that production of a diverse group of mutant
plants with a range of genetic backgrounds will better facilitate development of new
fenugreek cultivars, than previous mutant breeding studies that employed only a single
cultivar of the plant.
Increase in ploidy levels of somatic chromosomes often results in an increase in
plant vigour, size of the plant and seeds due to larger cell size (Fehr 1987). Basu (2006)
treated “Tristar” fenugreek with colchicine. He reported that the tetraploid plants
produced had larger leaves, a longer pod length, vigorous growth and larger seeds in
comparison of untreated “Tristar” plants. In my study it is hypothesized that as the seeds
of the tetraploid plants are larger in size than the diploid plants, the seeds may contain
more oil than the seeds of diploid plants. If these tetraploid seeds are found to contain
more oil, the tetraploid plants may be used to develop a cultivar suitable for commercial
use for its oil.
5
Fenugreek crop is affected by many pathogenic fungi. Among the fungal diseases
of fenugreek, Cercospora leaf spot disease caused by Cercospora traversiana is
considered one of the most serious, destructive and widespread disease. Although this
disease is not a yield limiting factor in Canada, the disease has been reported in Canada
in a previous study (Zimmer 1984). The author also reported that the pathogen inflicted
yield up to 80% in that year. As fenugreek is gaining more recognition in Canada and
other countries where it is introduced recently, the acreage of fenugreek will eventually
increase in these countries. With the increases of acreage the pathogen may prevail in
these areas. So, identification of resistant genotypes may be very useful to develop
tolerant cultivars in future.
Objectives of this research study project were:
i.
To produce more variability in the populations through mutation breeding using
five adapted germplasm and characterization of the mutant in their early
generations.
ii.
To advance the mutant generations and their evaluation in multi-location trials.
iii.
To select plants on the basis of their phenotype from different mutant generations
to generate new potential lines.
iv.
To assess the oil content in seeds of tetraploid plants.
v.
To screen for resistant/tolerant genotypes against Cercospora traversiana among
the fenugreek world accessions, and to re-characterize the disease.
6
1.2 Background
1.2.1 Taxonomy of Fenugreek
Fenugreek (Trigonella foenum-graecum L.) is a diploid, annual plant that is
strongly scented. Vasil’chenko (1953), placed the genus “Trigonella” within the family
Leguminosae (currently known as Fabaceae). Heywood (1967), Hutchinson (1964) and
Sinskaya (1961) also described fenugreek as part of this family. Hutchinson (1964)
described the genus “Trigonella” as one of the six genera of the subfamily Trifoliae of
the family Fabaceae within the order Leguminales. Tutin and Heywood (1964) have
investigated the genus Trigonella and divided it into three subgenera, namely Trigonella,
Trifoliastrum and Foenum-graecum and, placed fenugreek under the subgenus Foenumgraecum. Though the scientific name Trigonella foenum-graecum (L.) is well established
now for fenugreek, in much of the published literature it was addressed with different
synonyms for its scientific name; e.g., Mathé (1975) identified nine synonyms for
Trigonella foenum-graecum (L.); i.e., Buceras foenum-graecum (L.), Foenum-graecum
sativum Medik, Foenum-graecum officinale Moench, Foenum-graecum officinale spp.
cultum Alef, Folliculigera graveolens Pasq, Medicago foenu-graeca Ehz Krause, Telis
foenum-graecum (L.) O.ktze, Trigonella graeca St. Lag. non Boiss and Trigonella
ensifera Trautv (Petropoulos 2002).
7
The taxonomic rank of fenugreek is given below:
Domain
:
Eukarya
Kingdom
:
Plantae
Division
:
Magnoliophyta (or Anthophyta)
Class
:
Magnoliopsida
Order
:
Fabales (or Leguminales)
Family
:
Fabaceae
Sub-family
:
Trifoliae
Genus
:
Trigonella
Sub-genus
:
Foenum-graecum
Species
:
Trigonella foenum-graecum (L.)
1.2.2 Origin and centre of diversity of fenugreek
Fenugreek is a diverse species. Authors have widely debated the probable
ancestry of Trigonella foenum-graecum (L.), although the divergent schools of opinion
identify three probable centers of origin for the plant (Acharya et al. 2008). Vavilov
(1951, 1926) suggested that fenugreek originated from the Mediterranean region.
However, according to Fazli and Hardman (1968), and De Candolle (1964) fenugreek has
an Asian/Indian center of origin. Dangi et al. (2004) also proposed that the species
originated in Turkey. Collections of fenugreek from different countries have been made
for the purposes of taxonomic investigation and characterization. Results of these studies
have revealed other probable centers of diversity for fenugreek; e.g., Serpukhova (1934)
8
proposed that Yemen and Abyssinia are centers of diversity for fenugreek, while
Moschini (1958) suggested that Sicily, Tuscany and Morocco are centers of diversity for
fenugreek. In another study, Yemen, the Transcaucasia region of Eurasia, Africa,
Afghanistan, the China-Iran region, and India also have been proposed as diversity
centers for fenugreek (Furry 1950).
The exact number of species of the genus Trigonella is also unsettled. Petropoulos
(2002) indicated that Linneaus suggested that about 260 species of fenugreek exist, while
97 species and 128 species have been described by Fazli (1967) and Vasil’chenko (1953)
respectively. Hutchinson (1964), and Rouk and Mangesha (1963) placed about 70 species
under the Trigonella genus. This decline in specie’s number between the 18th and 20th
centuries suggests that many species of Trigonella may have been lost due to lack of
conservation and species domestication. Recently, Acharya et al. (2008) suggested that a
total of 18 different currently recognized species of fenugreek may still exist.
1.2.3 Regions of cultivation
Fenugreek is now cultivated in all habitable continents of the world. Some of
these continents have a long history of use, while other continents only started cultivating
the crop during the past 2-3 decades. Asia is positioned in 1st place among continents in
terms of fenugreek production and acreage with India leading in fenugreek seed
production, producing about 90% of the world fenugreek grown (Acharya et al. 2008,
2007). Among other Asian countries; Iran, Israel, China and Pakistan also have high
levels of production. Asia is followed by the continent of Africa in terms of fenugreek
production and acreage as well as richness in genetically distinct fenugreek germplasm
9
(Petropoulos 2002). In Africa, fenugreek production is mostly concentrated in Egypt,
Ethiopia, Kenya and Morocco. Spain, Turkey, Greece and Germany are notable for
cultivation of fenugreek in Europe, whereas Argentina is important for production in
South America. Within the literature Italy has a history of cultivation of fenugreek for use
as fodder, although a limited amount of fenugreek cultivation currently is practiced in this
country (Fazli and Hardman 1968; Moschini1958). In Canada fenugreek has been
cultivated commercially for the past two decades and, most of its cultivation is
concentrated in prairie regions of western Canada (Acharya et al. 2010b, 2008, 2007). It
is also a new crop to the USA and different accessions have been evaluated for
cultivation in the mid-western United States (Berti et al. 1993). McCormick et al. (2009,
2006) have reported cultivation of fenugreek as a minor crop in south-eastern regions of
Australia since the mid 1980s.
Fenugreek is known by its English name in countries where fenugreek is
introduced as a new crop in recent years. But interestingly it has retained its local name(s)
in countries where it has been cultivated for many years. Therefore, presence of a local
name for fenugreek may be an indication of a long history of use for the plant in a
respective country (Petropoulos 2002). Names of countries that cultivate fenugreek as a
crop along with its local names are presented in Table 1.1.
10
Table 1.1. Countries involved in cultivation of fenugreek and the local names used to
identify it.
Name of continent
Name of country of cultivation
Local name(s) of fenugreek
Africa
Egypt
Hulba, Hulabah, Hhelbah, Hhelbeh
Ethiopia
Kenya
Morocco
Sudan
Tanzania
Tunisia
Bangladesh
China
India
Iran
Israel
Japan
Lebanon
Pakistan
Russia
Turkey
Australia
Austria
England
France
Germany
Abish
Hulba, Hulabah, Hhelbah, Hhelbeh
Hulba, Hulabah, Hhelbah, Hhelbeh
Hulba, Hulabah, Hhelbah, Hhelbeh
Hulba, Hulabah, Hhelbah, Hhelbeh
Hulba, Hulabah, Hhelbah, Hhelbeh
Methi
K’u-Tou, Hu Lu Ba
Methi
Schemlit
Asia
Ocenia
Europe
Koroba, Koroha
Hulba, Hulabah, Hhelbah, Hhelbeh
Methi
Pazhitnik, Pazsitnyik, Grezsezki szeno
Çemen
Greece
North America
South America
Portugal
Russia
Spain
Switzerland
Ukraine
Canada
United States of America
Argentina
Fenugrec, Senegre
Griechisch Heu, Griechisches Heu,
Bockshornklee, Kuhhornklee, Bisamklee
Trigoniskos, Tsimeni, Tintelis,
Moschositaro, Tili, Tipilina
Alforva
Pazhitnik, Pazsitnyik, Grezsezki szeno
Alholya
Bockhornsklover
Source: Acharya et al. 2008; Berti et al. 1993; McCormick et al. 2006; Petropoulos 2002
11
1.2.4 Biological and morphological features of fenugreek
The genus Trigonella is made up of many species, many of which are diploid.
Darlington and Wylie (1945) reported that the haploid chromosome number (n) of most
species of the genus Trigonella is 8, 9, 11 or 14. However, T. hamosa from Egypt was
found to have 16 and 44 chromosomes; T. geminiflora from Iran and Asia Minor, and T.
grandiflora from Turkey also have 44 chromosomes, while T. polycerata which was
collected in areas around the Mediterranean and in Asia was reported to have 28, 30 and
32 chromosomes, and T. ornithopodioides was reported to possess 18 chromosomes in its
genome (Petropoulos 2002). According to Darlington and Wylie (1945) fenugreek has a
diploid chromosome number of 2n = 16 chromosomes. Other Trigonella species also
show some deviation from the normal chromosome number. Singh and Singh (1976)
isolated primary trisomics along with five double trisomics from the progeny of
autotetraploid fenugreek which had 18 (2n+1+1) chromosomes. Joshi and Raghuvanshi
(1968) looked for the presence of ß-chromosomes in fenugreek and demonstrated that
chromosome number in the plant can increase due to their presence. Roy and Singh
(1968) also produced tetraploid fenugreek by treating shoot apices with colchicine, while
Basu (2006) also reported that he had produced tetraploid fenugreek (2n + 2n = 32) by
treating seeds with colchicine.
Fenugreek seeds require 3-10 days for germination and, follow an epigeal
process where in the presence of sufficient moisture, oxygen and heat, the emergent
cotyledon is bent over as it is pulled from under the surface of the soil during
germination; i.e, imbibitions of water into the seed results in swelling of the seed
endosperm. As the cells absorb water they elongate, extending the radicle to form a
12
primary root in the soil which eventually will develop secondary roots. According to
Petropoulos (2002) protrusion of the radicle by more than 5 mm is considered a sign of
fenugreek seed germination. As the hypocotyl elongates, the cotyledons are pulled above
the soil to form a seedling; an epicotyl is characteristically absent. Release of the
cotyledons leads to growth of the first simple leaf, followed by emergence of the first
trifoliate leaf. Development of stems, flowers, pods and seeds occurs after seed
germination and growth of the seedling (Petropoulos 2002).
Fenugreek stems are erect, hollow, and circular to slightly quadrangular. The
color of the stems is dark green or dark bluish-green due to anthocyanin accumulation.
Two types of stems are found in fenugreek; a monostalk without secondary shoots, and a
multistalk where many shoots extend from the basal and higher nodes. In some cases
where secondary shoots extend from the basal nodes, the main shoot does not differ
markedly from the secondary shoots.
In general, two types of flowering shoots are observed in fenugreek. The most
common type shows an indeterminate growth habit and bears axillary flowers;
occasionally “blind shoots” form which produce both axillary and terminal flowers which
develop seeds at the tip (Petropoulos 2002).
Leaves from fenugreek are simple, distinctly petiolate and consist of three
leaflets. The leaflets of fenugreek are slightly dented over the edge, oval to orbicular in
shape and green in color. The leaves are arranged in an alternate array throughout the
plant (Slinkard et al. 2006). The root system of the fenugreek plant consists of a tap root
and branched side roots arising from the main root. Like other leguminous plants
13
fenugreek is also capable of forming root nodules containing nodule-forming bacteria
(Acharya et al. 2006).
The flowers of fenugreek are complete, papilionaceous and triangular in shape.
The genus name ‘Trigonella’ comes from Latin, meaning ‘little triangle’ in reference to
the triangular shape of the flowers (Rosengarten 1969). The calyx consists of five sepals
fused together to form a calyx tube with five teeth about as long as the tube. The corolla
consists of a large standard or banner, two lateral wing petals, and two fused petals that
form the keel. Each flower contains ten stamens and one pistil. The stamens are arranged
on a stamen tube where nine stamen anthers are grouped and one stamen anther is free.
Flower setting in fenugreek leaf axils is generally paired but, more rarely solitary and
usually starts 35 – 40 days from seed sowing. Two types of flowers are observed in
fenugreek; (i) cleistogamous flowers and (ii) aneictogamous flowers. A majority of
fenugreek flowers are cleistogamous in which the keel of the flower remains closed in
order to favor self-pollination. Aneictogamous flowers represent less than 1% of the total
number of flowers found on a plant, and offer opportunities for cross-pollination since
parts of the corolla remain open (Petropoulos 2002).
The fruit structure in fenugreek is the pod. Fenugreek pods are long, erect,
pointed, sickle-shaped and slender. They have a sharp beak, 2-3 mm in length at the end
(Duke 1981). The pods are green in color during growth of the plant but, turn yellow to
yellowish brown at maturity. Fenugreek plants can be divided into two classes on the
basis of number of pods per node. When there is only one pod per node the plants are
considered to posses a “single” or “solitary pod”, whereas if there are two pods per node
a plant is referred to as having a ”double” or “twin pod”. In “double podded” plants the
14
two pods project in opposite directions from the same node of the stem. In ancient
Greece, fenugreek was called “ox horn” or “goat horn”, probably because of the two seed
pods projecting in opposite directions which resembles an ox or goat horn (Rosengarten
1969). Each pod carries approximately 10-20 seeds and, each pod-bearing branch can
produce about 2-8 pods (Petropoulos 2002).
Fenugreek seeds are yellow to golden-yellow in color when mature, although
some varieties can produce mature seeds which are green or yellow-green in color
(McCormick et al. 2009). The seeds have a rectangular, square or irregular rhomboidal
shape with grooves situated between the radicle and the cotyledons (Slinkard et al. 2006).
Fenugreek seeds are surrounded by a seed coat which is separated from the embryo by a
dark translucent endosperm (Fazli and Hardman 1968). A single layer of living tissue
known as the aleurone layer lies between the seed coat and the endosperm. In mature
seeds, a majority of the cytoplasm found within cells of the endosperm is made up by
storage reserves consisting of ‘galactomannan’ (Petropoulos 2002). Botanical and
morphological characteristics of fenugreek are summarized in Table 1.2.
1.2.5 Agronomic aspects of fenugreek
Agronomic practices are very important in growing a crop successfully. The
agronomic requirements of a crop species often are unique and can differ from one crop
species to another. As a well known cultivated crop, fenugreek has specific agronomic
requirements for its successful production.
15
Table 1.2. Botanical and morphological aspects of fenugreek.
Feature
Ploidy level
Germination
Parts of the organ
Plant habit
Root
Stem
Leaf
Main root and side roots
Primary shoot, primary
shoot and secondary
shoots
Leaf lamina
Petiole
Flower
Calyx
Corolla
Stigma
Style
Pod
Seed
Short description
Mostly diploid (2n = 16)
Epigeal. Hypocotyl pulls
cotyledons above the soil
Dimension
Erect, straight or
profusely branched
Tap root system
Branched, circular to
quadrangular, green or
bluish green
Simple, trifoliate, toothed
on tip
Pale green, often
anthocyanin tinged, very
small
Consist of five fused
green sepals, green
Papilionaceous, white,
papery
Pale green, pale bluish
green, ten stamens (9+1)
Pale green, pale bluish
green
Long, slender, erect,
beaked at the end
Rectangular to oval, pale
brown to golden yellow in
color
20-130 cm in length
16
15-30 cm in length
0.5-1.0 cm in diameter
1.5-4.5 cm × 0.8-1.5 cm
0.5-1.1 mm
6-8 mm × 13-19 mm
1.5-1.9 cm
1.5-2.1 mm
0.2-0.5 mm
0.2-0.6 cm × 10-19 cm
3-5 mm × 2-3mm
1.2.5.1 Environment and soil
Fenugreek is cultivated on every continent. The wide distribution of its cultivation
reflects to its adaptation to a wide range of growing environments and climatic
conditions. Fenugreek likes a temperate and cool growing season, but does not like
extreme temperatures. Moderate to low rainfall is favorable for its cultivation. Fenugreek
is fairly drought resistant.(Del’ Gaudio 1952) and will do poorly during a wet summer
(Petropoulos 2002). In India fenugreek is normally grown as a winter annual crop
(Petropoulos 2002). In European countries, it is grown both as winter crop in areas with a
mild winter and as a spring crop in areas where the soil remains moist in summer
(Petropoulos 2002). Seeding of fenugreek in late-April to mid-May has been successful
in western Canada (Acharya et al. 2008).
Fenugreek grows best on well-drained loamy and/or sandy soils. Heavy clay and
wet soils limit the growth of fenugreek (Petropoulos 2002). Slightly alkaline soils are
ideal for successful fenugreek cultivation. A pH of 8-8.5 is favored by the crop.
Fenugreek is fairly salt tolerant and, can be grown in low to moderate saline soils
(Abdelmoumen and Idrissi 2009).
1.2.5.2 Seeding and seed rate
After seeding, germination of fenugreek may be affected if the seed is sown too
deep, if there is inadequate moisture, very hard soil or freezing conditions (Petropoulos
2002). For seeding, the soil should have a fine granular consistency, not powdery.
Fenugreek seed should be at least 95 per cent pure, have an 80 % germination rate
(Heeger 1989) and, is best planted in rows to maximize yield (Petropoulos 2002). Most
17
favorable productivity has been obtained when fenugreek seeds are planted using a row
spacing of 15 – 30 cm (Baswana and Pandit 1989; Gill et al. 2001; Korla and Saini 2003;
Slinkard et al. 2006).
Various seeding rates have been suggested for fenugreek ranging from 15 to 25
kg/ha (Petropoulos 2002; Duke 1981). In western Canada a seeding rate of 27 – 33 kg/ha
has been suggested for satisfactory yield results (Slinkard et al. 2006).
Legumes are well known for their ability to fix atmospheric nitrogen using
nitrogen-fixing bacteria. As a legume fenugreek seeds must be inoculated with an
appropriate nodule forming bacteria to maximize growth potential. Inoculation of
fenugreek seeds with a suitable strain of Rhizobium, an aerobic, non-sporulating Gram
negative nodule-forming bacterium, can improve quality and quantity of seed produced
by the plant (Abdelgani et al. 1999).
1.2.5.3 Cultural practices
Soil nutrient management is an important practice to achieve high crop yields
from fenugreek. Poor supply of plant nutrients often results in insufficient plant growth,
slow growth, poor grain quality and low biomass yields. These constraints can be
removed by adequate application of a fertilizer and/or manure to the soil. Fenugreek is
sensitive to mineral deficiencies mainly of nitrogen (N) and phosphorous (P) (Yadav and
Kumawat 2003; Petropoulos 1973). Deficiencies in boron (B), magnesium (Mg), and
manganese (Mn) can also result in a poor or reduced seed and biomass yield (Petropoulos
2002). Fenugreek yield can be increased by applying manure and other organic and
inorganic sources of nitrogen and phosphorous to the soil (Khiriya and Singh 2003;
18
Detoroja et al. 1995). When fenugreek crops are properly inoculated with Rhizobium
meliloti, a small amount of nitrogen can be applied as ‘infantile nitrogen” at the same
time as the seed is sown. This infantile nitrogen dose helps promote rapid growth of
fenugreek seedlings until the root nodules can form and the Rhizobium bacteria in the
nodules are able to fix atmospheric nitrogen in large quantities (Petropoulos 2002). Deora
et al. (2009) also reported that application of 20 kg/ha nitrogen in areas of Rajasthan,
India significantly increased yield and nitrogen uptake by the crop, while Singh et al.
(2008) suggested application of 40 kg/ha nitrogen significantly improved growth, seed
yield and nitrogen uptake. Slinkard et al. (2006) reported that nitrogen requirement for
fenugreek is similar to that of lentil in Canada.
Phosphorous can play an important role in crop management of fenugreek as it
accelerates maturity of the crop and hence lessens risk from frost damage in the fall in
cold areas. It also promotes transfer of substances from the stalks, leaves and other
growing parts of the plant to the seed increasing their size at maturity (Petropoulos 2002).
The rate of application of phosphorous fertilizer depends mainly on the amount of
available phosphorous in the soil (Petropoulos 2002). High yields of fenugreek have been
obtained by application of 40 to 50 kg inorganic P 2 O 5 /ha to the soil (Deora et al. 2009;
Tiwari et al. 2006). Sulphur (S) levels of 50 kg/ha also can significantly increase plant
biomass and seed yield.
Although fenugreek is fairly drought resistant, higher yields are obtained (Lee
2009) when irrigation is used to supplement dry land farming and to avoid plant stress
promoting smooth and continuous growth during the period of active growth of the crop.
Irrigation is significant for cultivating fenugreek in arid or semi-arid areas, especially in
19
situations when rainfall plus the residual water does not cover the water requirement of
this crop (Petropoulos 2002). Baricevic and Zupancic (2002) reported lower diosgenin
yield when fenugreek was cultivated under drought stressed condition. However, when
fenugreek was grown under optimal irrigation regime, diosgenin yield increased in
comparison to normal irrigated plants. These results suggest that the plant species does
well under minimal irrigation. Irrigation requirements for fenugreek production are
dependent on some variables that include soil texture and depth, degree of evaporation,
temperature and cropping practices. According to Del’ Gaudio (1952) if the rainfall from
September to April is less than 400 mm, irrigation of fenugreek is necessary. Heavy
watering is not needed for fenugreek as the crop species possesses a shallow root system.
Irrigation with application of 200 m3/ha water every time for sandy soils, and 250 m3/ha
for heavier soils replicated every two weeks have been stated sufficient for a successful
fenugreek crop (Petropoulos 2002). The number of irrigation varies depending on the
region where the crop is being cultivated. Petropoulos (2002) reported that application of
irrigation for five times for the whole growing period of fenugreek under Indian
conditions is sufficient for a successful crop.
Studies on weed competition in genus Trigonella have been mostly concentrated
to fenugreek. Fenugreek is vulnerable to weed intrusion particularly during the seed
germination and seedling establishment phases, as fenugreek grows slowly after
emergence (McCormick et al. 2006; Moyer et al. 2003; Petropoulos 2002). Tripathi and
Govindra (1993) investigated the critical crop-weed competition period in fenugreek.
From their field trials in India they concluded that the crop-weed competition period
extends over the first 30 days after sowing of fenugreek. Their experiment also showed
20
that if the emerged weeds were removed soon in this period caused only 14.2% yield
reduction, while if the weeds were left for the entire cropping season reduced yield to
69%. Weeds compete with fenugreek seedlings for available nutrients, available space
and moisture that results in yield losses of fenugreek (Petropoulos 2002). Studies also
showed that weed interference also causes changes in quality of the plant. It was found
that ensiled fenugreek forage with low weed content had a lower neutral NDF and ADF,
and CP content in cometparison to samples with higher degree of weed infestation
(Moyer et al. 2003).
A range of weed species may be found in fenugreek depending on the
geographical region, soil type and agro-ecologic environment. These weed species are
divided into two groups; (i) winter species and (ii) spring species. Among winter species
Sinapsis spp. (e.g., wild mustard), Melilotus spp., Trifolium spp. are found critical in
fenugreek. Chenopodium spp., Poa annua, Echinochloa crus-galli, and Setaria spp. can
be serious for spring-sown fenugreek (Petropoulos 2002). Certain weed species such as
Imperata cylindrica L. and Argemone mexicana L. have the potential to reduce fenugreek
germination and growth through allelopathy (Inderjit-Dakshini 1991; Leela 1981). Weed
competition in fenugreek can be very strong if there is a heavy infestation by highly
competitive and fast-growing perennial weeds. Perennial species like Convolvulus
arvensis, Cyperusrotundus, and Cyndon dactylon can create a very strong competition
with fenugreek (Petropoulos 2002). In Indian conditions, parasitic flowering plant
Orobanche indica Ham. was found to parasitize fenugreek roots (Bhargva et al. 1976). In
Southern Albarta region of Canada, fenugreek has been reported to be heavily infested by
weed species such as Setaria viridis L., Avena fatua L., and Amaranthus retroflexus L.
21
(Moyer et al. 2003). Contamination of fenugreek fields with alfalfa, flax, canaryseed and
wheat can be problematic as this can cause difficulties in separating the seeds after
harvest (Slinkard et al. 2006).
Prevention of weed competition during the first 30 days should be the primary
objective on any weed control program in fenugreek. Maliwal and Gupta (1989)
concluded, on the basis of field trials in India, that hand weeding on the 20th and 40th days
after sowing were sufficient for a maximal seed yield. Similarly, hand weeding at 15th
and 30th days after sowing resulted in the highest seed yield (Mandam and Maiti 1994).
Richarrdson (1979) identified suitable pre-emergence and post-emergence herbicides for
fenugreek. Post-emergence herbicides such as bentazon, MCPB, diclofop-methyl and
alloxydim-Na were found well tolerated by fenugreek, while chlorthal-dimethyl,
propyzamide, butam, propachlor, trifluralin, tri-allate and chlorpropham were found
suitable among pre-emergence herbicides. Mandam and Maiti (1994) found application
fluchloralin at 3 kg/ha followed by hand weeding to be the best treatment. Field trials
conducted in Sardarkrushinagar, India revealed that pre-emergence application of
pendimethalin at a rate of 0.75 kg/ha followed by hand weeding at 20th and 40th days after
sowing was statistically at same level with weed free checks (Mehta et al. 2010). In
another study, Tiwari et al. (2006) found that application of pendimethalin at a rate of 1
kg/ha followed by hand weeding at the 25th day of sowing reduced the weed population
successfully. In Canada, currently there is no registered herbicide for use on fenugreek
(Slinkard et al. 2006). Moyer et al. (2003) conducted field trials in Alberta, Canada and
found that treatment with imazamox/imazethapyr or mixes of imazamox/imazethapyr
with ethalfluralin, annual weeds were restricted to 5% of dry matter production without
22
fenugreek injury or yield loss. The same investigators also revealed that weeds can
represent 37% to 86% of dry matter if no herbicidal control of weeds is done in
fenugreek.
1.2.6 Diseases and pests of fenugreek
A number of investigations have reported the appearance of pest attacks and
diseases in fenugreek crops that can affect both yield and quality of the plant adversely.
Fenugreek production is affected by both biotic and abiotic agents.
Abiotic diseases or disorders are mainly physiological condition related and are
often caused by a deficiency in nutrients, extremes in temperature, moisture, soil acidity
or alkalinity, an excess of certain micronutrients within the soil and toxic impurities in
the atmosphere (Acharya et al. 2008; Petropoulos 2002). Sinskaya (1961) reported
yellowing of some fenugreek plants under field conditions due to mineral deficiencies. In
western Canada, exposure of fenugreek crops to very dry and hot conditions has resulted
in stunted growth and yellowing, with occasional loss of leaves from the plant (Acharya
et al. 2010a).
Diseases caused by living or biotic agents (pathogens) are often infectious
(Acharya et al. 2010a). The most important diseases of fenugreek are caused by plant
pathogenic fungi. Bacterial diseases are next in degree of importance, followed by viral
diseases (Jongebloed 2004; Petropoulos 2002; Weiss 2002; Fogg et al. 2000; Prakash
and Sharma 2000; AAFRD 1998). The two most common and serious fungal diseases
infecting fenugreek are Cercospora leaf spot and powdery mildew (Acharya et al. 2010a;
AAFRD 1998). Powdery mildew on fenugreek, caused by Erysiphe polygoni, can
23
seriously reduce crop yield (Jongebloed 2004; Prakash and Sharma 2000) and has the
potential to affect biomass and seed yield in crops grown under moist agroclimatic
conditions in North America. Cercospora leaf spot caused by Cercospora traversiana is
becoming a major fenugreek disease concern (Acharya et al. 2010a; Weiss 2002). Other
well-known fungal diseases observed to be associated with fenugreek are wilt, downy
mildew, spring black stem and leaf spot, collar rot, rust, leaf spot and pod spot diseases
(Bretag and Cunnington 2005; Jongebloed 2004; Lakra 2003, 2002; Petropoulos 2002).
McCormick and Hollaway (1999) and Fogg et al. (2000) found that infection of
fenugreek with Pseudomonas syringae resulted in bacterial blight. It has also been
verified that the bacterium Xanthomonas alfalfa can infect fenugreek (Petropoulos,
2002). Bean yellow mosaic virus, alfalfa mosaic virus, cowpea mosaic virus, soybean
mosaic virus, pea mosaic virus, potato virus A and Y, and clover vein mosaic virus are all
common viral infections of fenugreek (Petropoulos 2002; Bhasker and Summanwar
1982). Yellow mosaic potyvirus (Singh 1969) and pea streak carla virus (Hagedorn and
Walker 1949) have also been reported on fenugreek.
Although fenugreek appears very resistant to attacks by insect pests, numerous
insects are reported to attack fenugreek. In Australia, insects such as thrips, podborers
and Heliothis spp. can cause serious damage to forage yield in fenugreek (Lucy 2004).
Aphis craccivora and Myzodes persicae have caused damage to fenugreek crops from
west Asia to India, while various Thysanoptera (thrips), including Scirtothrips dorsalis,
have been found on almost all fenugreek crops grown from the Mediterranean to India
(Petropoulos 2002; Weiss 2002). There have also been reports of Tetranychus cucurbitae
attacks on fenugreek in India (Weiss 2002). Pachymerus pallidus, a seed beetle, is a
24
major pest of fenugreek in the Sudan (Weiss 2002). A number of polyphagous
caterpillars including Diacrisia oblique, D. orichalcea and Prodenia litura, and
especially Maruca testulalis have been reported to affect fenugreek in India (Weiss
2002). In southern Alberta, Canada, a low level of insect pests such as Lygus bugs and, to
a lesser extent, alfalfa plant bugs and aphids, western flower thrips (especially severe
under greenhouse conditions), alfalfa looper, alfalfa weevil and Sitona spp. were found
attracted to standing fenugreek crops under field conditions (Acharya et al. 2010a).
Various nematodes can damage fenugreek roots (Jongebloed 2004; Weiss 2002). The
soilborne nematode Meloidogyne incognita has been shown to cause root rot and the
death of immature fenugreek plants in Australia (Jongebloed 2004).
1.2.7 Uses
1.2.7.1 Ancient use of fenugreek
Historical uses of fenugreek have been reported by many authors. In the tomb of
the Egyptian Pharaoh, Tuthankhamun (1333 BC to 1324 Bc), seeds of fenugreek were
found. The Egyptians also used the leaves of fenugreek as one of the components of holy
smoke in fumigation and embalming rites (Fazli and Hardman, 1968). Yoshikawa et al.
(1997) mentioned that fenugreek was used as an aid to induce labor during childbirth and
delivery in ancient Rome.
1.2.7.2 Fenugreek as a spice
Fenugreek has long been used as a spice in South Asia, the Mediterranean, and in
Africa. Both seed and leaves of fenugreek are widely used as a culinary spice to enhance
the taste of many meat, poultry and vegetable dishes (Acharya et al. 2010a b). Fenugreek
25
seed is often used in the Indian subcontinent cuisine, and in the preparation of pickles,
curry powders, and pastes. The fresh or dried leaves are used to flavor dishes in many
parts of India. In Egypt and Asia, sprouts of fenugreek and the young leaves are eaten as
green vegetables. Fenugreek seed is a natural source of galactomannan gum. This
property of fenugreek seed has provided the food industry with an opportunity to use seed
extracts as thickening agent in foods or as food emulsifier (Slinkard et al. 2006). In India
and China, the seeds are also a source of a food coloring dye and industrial mucilage. In
Chinese cuisine, fenugreek plant products are more used for coloring than flavoring. In
China, there is an organic green powdered food color product commercialized with the
name of ‘fenugreek herb’ prepared from grounded leafy stems of fenugreek to give a
green color to steamed pastry (Acharya et al. 2010ab; Hu 2005). Iran has a particularly
rich tradition cooking with fenugreek leaves. In Africa, fenugreek seeds are mixed with
bread to prepare a traditional food. Moreover, boiled seeds are taken with honey as a
snack in many African countries. In Yemen and Arabian Gulf, fenugreek seed is
considered as the main condiment (Weiss 2002). Fenugreek seeds are an important
constituent of many unique and traditional spice mixes. Fenugreek seed constitutes an
essential part of Bengali five spice mixture- panch foron; Georgian spice mixture- khmeli
suneli; Ethiopian spice mixture- berbere; Bulgarian spice mixture- sharena sol (Acharya
et al. 2010ab).
1.2.7.3 Fenugreek uses for remedy and medicinal purposes
Fenugreek has been documented as a medicinal plant in ancient herbal
publications, religious scriptures, travel records, and anecdotes. The medicinal properties
of fenugreek were recorded by the Egyptians and Hippocrates (Lust 1974). Its use as a
26
traditional medicine is also referred in Indian Ayurvedic, Greek, Chinese and Arabian
medicines (Evidente et al. 2007; Sur et al. 2001). A wide range of medicinal properties
has been attributed to fenugreek such as wound-healing, bust enhancement, enhanced
lactation in weaning mothers, as an aphrodisiac, anti-diabetic, anti-hyperthyroidism,
anticancer, gastro-protective, antioxidant, antipyretic, antimicrobial, anthelmintic,
antisterility, antiallergy, antiinflammatory effects (Acharya et al. 2008; Krishnaswamy
2008). Historical accounts indicate that fenugreek leaves and seeds were used for many
medicinal purposes, such as treating mouth ulcers and chapped lips, cure of baldness, in
alleviation of abdominal and abscesses pain, in alleviation of cardiovascular and hepatic
disorders, treating arthritis, dropsy, heart disease, spleen and liver enlargement, kidney
ailments among several others, in the subcontinent of India, Greece, Arab and China
(Acharya et al. 2010a; Tiran 2003; Weiss 2002).
Fenugreek (mostly seed) is a valuable source of many bio-chemical components
that are attributed to various biological and pharmacological actions. Fenugreek seeds are
also source of many minerals and vitamins. The seeds are found rich in Mg, Ca, Fe, Zn,
Mn, Co, Ba, Cu and Br (Duke 1981; Picci 1959). Fenugreek is considered one of the few
natural sources of steroidal sapogenins (Skaltsa 2002; Petropoulos 2002). Fenugreek is
rich in flavonoids (Skaltsa 2002). Trigonelline, a methylbetaine derivative of nicotinic
acid is one of the major alkaloids found in fenugreek seeds (Skaltsa 2002). The principal
free amino acid of fenugreek is 4-hydroxy-isoleucine. It represents up to 80% free amino
acid in fenugreek dry seeds, but it is absent from seed reserve proteins (Skaltsa 2002;
Sauvaire et al. 1996).
27
In general, fenugreek contains three important phytochemicals with rich
medicinal properties: 1) galactomannans, 2) sapogenins; and 3) 4-hydroxy isoleucine.
Due to the presence of these chemicals fenugreek is currently rated higher among most
commonly competing and well recognized nutraceuticals or health food products
(Srichamroen et al. 2009; Acharya et al. 2008). Fenugreek galactomannan emerged to be
beneficial in controlling type 2 diabetes in animals (Vats et al. 2003, 2002; Puri et al.
2002) and in humans (Puri et al. 2002; Raghuram et al. 1994). Bordia et al. (1997)
showed that taking 2.5 g of fenugreek per day for three months can significantly reduce
human cardiac risks. McAnuff et al. (2002) reported that steroidal sapogenins are
extremely efficient in controlling hypocholesterolaemia. Sapogenins are also appear to
selectively inhibit the growth of tumor cells and cancer prevention (Liagre et al. 2004;
Raju et al. 2004). The amino acid isoleucine, a precursor of 4-hydroxyisoleucine has been
reported for regulating insulin secretion, controlling blood sugar, and obesity prevention
(Handa et al. 2005; Broca et al. 1999; Bordia et al. 1997).
1.2.7.4 Fenugreek as animal food
Although fenugreek is mostly known as a spice crop, the species name foenumgraecum refers to “Greek hay” supporting its use as a forage crop in early years (Acharya
et al. 2008). It is used as green fodder and hay for cattle in India and Turkey (Petropoulos
2002). In Japan, it is used as silage. Petropoulos (2002) reviewed fenugreek as an
alternative to alfalfa or forage peas. Fenugreek seeds are also used as feed for lactating
cattle as it increases the flow of milk (Duke 1981; Hidvegi et al. 1984). Its ability to
provide high quality forage at all stages of growth has made fenugreek a desirable forage
(Acharya et al. 2008). It does not show a marked decline in quality even after
28
reproductive growth has been initiated. Mir et al. (1998) have shown that fenugreek
forage has comparable nutritive value to early-bloom alfalfa and can successfully be used
in beef industries. Acharya et al. (2008) reviewed that this legume is highly palatable and
does not cause bloating in beef cattle. Mir et al. (1998) suggested fenugreek as a close
substitute for alfalfa forage as they observed similar rumen conditions, digestibility, and
weight gain in cattle. Goel et al (2007) have shown increased efficiency of fermentation
in the rumen resulting in lower methane production. This observation suggests that
fenugreek diet for cattle may be environmentally beneficial by reducing methane
production by cattle. Montgomery et al. (2008) have shown its uses in the dairy
industries. Alemu and Doepel (2011) studied the effect of fenugreek haylage to dairy
cattle and observed similar digestibility although intake of fenugreek was slightly lower.
Petropoulos (2002) mentioned that the ancient Greek and Romans used fenugreek hay as
horse feed.
1.2.7.5 Agricultural and others uses
As a legume, fenugreek has the ability to fix atmospheric nitrogen in the soil by
harboring nitrogen-binding bacteria in its roots. The crop requires a minimal amount of
nitrogen fertilizer for its growth, and reduces the need for nitrogen fertilizers for
subsequent crops (Acharya et al. 2010b). Fenugreek is considered a dryland crop thus
water requirement of this crop is low. Use of fenugreek in arid and semi-arid
environments, and in regions with limited water supply can reduce the cost of irrigation,
reduce the potential for eutrophication of surface water and limit contamination of
groundwater sources (Acharya et al. 2008; Basu 2006). Fenugreek is a good choice to
29
incorporate in short-time crop rotation schemes, especially with non-leguminous crops
(McCormick et al. 2006).
Fenugreek possesses insecticidal, nematicidal, molluscicidal and antimicrobial
properties (Acharya et al. 2008; Zia et al. 2001). Fenugreek itself is an insect tolerant
crop; moreover, it provides effective control against stored grain insect pests. Fenugreek
seed and leaf extracts were reported to have widespread antimicrobial activity against
both gram positive and gram negative bacteria (Bhatti et al. 1996).
The aroma and flavor of fenugreek are attributed to volatile constituents it
comprises. Fenugreek seed contains 0.02–0.05% volatile compounds (Petropoulos 2002).
The major components in this group are heptanoic acid, n-hexanol, dihydroactiniolide,
dihydrobenzofuran, tetradecane, a-muurolene, b-elemene and pentadecane (Leela and
Shafeekh 2008). Fenugreek seeds hold 7.5% lipids on a dry matter basis. The total lipids
consisted of 84.1% neutral lipids that mostly consisted of triacylglycerols, 10.5%
phospolipids, and 5.4% glycolipids (Skaltsa 2002). The seeds contain about 7% fixed oil
consisting mainly of linoleic, oleic and linolenic acids (Leela and Shafeekh 2008).
Extractable oil from fenugreek seed carries a particular smell. Being strongly scented, the
oil is used as an insect repellent for wooden furniture and cloths (Duke 1981). Fazli and
Hardman (1968) referred to the use of fenugreek oil in perfumes. Petropoulos (2002)
mentioned the presence of fenugreek oil as a secret ingredient in a very famous perfume
of France. In Europe and North America, fenugreek is familiar as a component in
artificial flavoring such as maple and butterscotch, while this aroma of fenugreek seed is
mostly attributed to fenugreek oil (Slinkard et al. 2006).
30
1.2.8 Improvement of fenugreek
The improvement of a crop that is grown under a wide range of soil and climatic
conditions is a dynamic challenge due to its wide diversity. Fenugreek is one of these
crops. Several important considerations, such as the genetic variation, reproductive
behavior, environmental adaptability, mode of inheritance of desirable characters, and
economical importance, determine the objectives and methods chosen for the genetic
improvement of a crop. Fenugreek is normally diploid in nature and that is an advantage
for genetic development of this plant species, as diploid genetics has been evaluated
extensively. Plant breeding has provided a large number of varieties of fenugreek. The
need for fenugreek varieties with higher productivity, increased vigor, elevated amount of
essential biochemical products mainly with higher diosgenin content, has driven more
breeding efforts in this crop (Petropoulos 2002). Fenugreek is a highly self-pollinated
plant, though cross-pollination is reported to occur in a very little extent. Most of the
breeding endeavor for the genetic improvement of fenugreek has mainly concentrated on
three approaches namely selection, hybridization and mutation used separately or in
combination (Petropoulos 2002, 1973; Green et al. 1981).
1.2.8.1 Selection
Selection is a basic process in plant breeding, most suitable for improvement of
diploid plants like fenugreek (Busbice et al. 1975; Marques de Almeida 1940). Selection
approach consists of choosing the outstanding types and discarding those that are
undesirable because of certain characteristics. Unless the qualities of the superior types of
plants can be readily detected improvement by selection method is not possible. For
31
different inherited traits of fenugreek, suitable morphological and physiological
characters as an index of selection can provide a reliable basis for genetic improvement
through selection. Petropoulos (2002) has reported that in fenugreek presence of twin
pods is an indication of a high diosgenin content in the seeds. This readily detected
phenotypic selection is useful to improve fenugreek cultivar with higher diosgenin
content. Knowledge of dominant and recessively inherited traits is considered very
important as it would have a direct impact on progeny behavior of selected plants.
Ahmed et al. (1989) produced a variety with higher diosgenin content by passively
selecting for plants bearing ‘twin pods’. Two procedures are commonly used for the
process of selection to develop improved varieties of fenugreek: the individual (also
called pedigree and pure line selection) or simple plant selection and the mass selection.
Selection method is very important for producing varieties in an area where the
plant is recently introduced. The first North American forage fenugreek cultivar “Tristar”
has been developed by selecting suitable genotype among fenugreek germplasm, and
subsequent adapting the selected genotype in North American conditions (Acharya et al.
2008a). A group of investigators have evaluated fenugreek landraces for the assessment
of drought tolerance in Iran. Suitable genotype(s) may produce good drought tolerant
fenugreek cultivar in Iran by selection and adaptation in areas of fenugreek cultivation in
Iran (Sadeghzadeh-Ahari 2010; 2009). In Australia where fenugreek is a minor crop,
McCormick et al. (2009) have evaluated a germplasm collection of 205 fenugreek
accessions for a range of phenotypic traits including seed yield. Selection approach has
produced many fenugreek cultivars for various desired traits (as reviewed in Petropoulos
2002). The cultivar RH 2701 and RH 2698 with higher diosgenin content, RH 3128 with
32
higher seed yield, the cultivar RH 2699 with higher percent protein, the cultivar RH 2701
for higher amount of fixed oil were created by continuous selection process among the
mother cultivars (Petropoulos 2002, 1973).
1.2.8.2 Hybridization
Hybridization process is very important in cultivar development. Hybridization is
used to incorporate desired traits into a population, and to create populations with genetic
variability. Fehr (1993) suggested that hybridization is more successful when it is done
between parents with different genetic backgrounds. Hybridization involves crossing two
or more varieties of genetically different individuals. Common methods of hybridization
can involve a 2-parent cross, a 3-parent cross, a 4- parent cross, a back cross, a complex
cross, a convergent cross and/or a polycross (Fehr 1993).
Hybridization offers high probability for increasing variability for further
selection and the greatest possibilities for improvement of fenugreek (Petropoulos 2002).
Fenugreek is a highly self-pollinated in nature, and because of its flower structure
(cleistogamous) hybridization is tedious, laborious in this plant species. In fenugreek,
crosses are normally made by hand. Before pollination the flowers are emasculated to
avoid the risk of self-pollination, and this step is considered an important step for
hybridization in fenugreek. Emasculation and manual pollination has been used
effectively for crossing different lines of fenugreek (Petropoulos 2002). The fenugreek
flower should be emasculated at the end of the first floral developmental stage when the
stigma of the pistil is beginning to be receptive while the anthers of the stamens are
closed and lower than the stigma. Immediate after manual pollination, a bag should be
33
placed over the fenugreek flowers to avoid any chances of unrestricted out-crossing
(Cornish et al. 1983).
To find individual plants that possess unique and desirable combinations of
characters, at times hundreds of crosses need to be made in order to generate a successful
hybrid. Many fenugreek varieties have been produced by hybridization (Petropoulos
2002; Saleh 1996; Edison 1995). For instance, the high seed yielding genotypes RH
3109/32, RH 3110/37, RH 3105/15 and 3111/8, and the genotypes RH 3109/42 and RH
3110/66 with high diosgenin content were produced by crossing Fluorescent and Kenyan
cultivars (Petropoulos 1973). However, this method has a major disadvantage in that
undesirable character combinations often are created; these can be difficult to select out
and can take many generations of selection or back crossing to eliminate.
1.2.8.3 Mutation breeding
Mutation breeding has been used in many crop species to generate new genetic
variability. Mutation breeding can be used when there is little variation in an existing
gene pool for a certain trait (Fehr 1993). Four types of mutations can occur and those are
1) genome mutation; 2) structural mutations; 3) gene mutations; and 4) extranuclear
mutations. Among the above mentioned mutation types, gene mutations are most desired
in plant breeding (Yadav et al. 2007). Gene mutations cause an alteration of gene
expression by substituting one nucleotide base for another or by adding or deleting a
nucleotide to a gene. Potential lines that are generated from these mutations are used to
generate mutant cultivars which can be inbred in order to stabilize a new trait, and then
used in hybridization programs to introduce the trait to other plants. Mutations can either
34
occur spontaneously or may be induced artificially and, are a valuable tool for crop
improvement. Mutation breeding has been successfully utilized to bring desirable genetic
changes in cultivars of legume crops (Toker et al. 2007; Sigurbjornsson 1983;
Sigurbjornsson and Micke 1974); e.g., Manha et al. (1994) used mutation breeding to
increase the diosgenin content in T. corniculata (a close relative of fenugreek).
Various mutagenic chemicals or irradiation processes can be used to introduce
mutations into plants. Ionizing irradiation that includes electromagnetic radiation and
particulate radiation (for example, x-rays, gamma rays, alpha particle and beta particle),
is used to artificially increase the rate of spontaneous mutations. The chemical mutagens
belong to different groups such as base analogs, acridine dyes, nitrous acid,
hydroxylamine and alkylating agent. Mutation breeding is more adaptable for inducing
recessive genes than dominant genes (Toker et al. 2007). Micke and Donini (1993)
suggested that as mutations are mostly recessive, they cannot be selected for until the
second generation, whereas dominant mutations occur at low frequencies and can be
selected for in the first generation. Although mutations are beneficial for producing
variability in populations, the treatments themselves can be detrimental and can cause a
reduction in germination, growth rate, plant vigor, and pollen and ovule fertility in a
plant. Singh (2005) stated that mutations can be recurrent and that the same gene(s) of a
plant species may be induced to mutate again and again. Moreover, mutations generally
have pleiotropic effects due to closely linked gene(s).
Mutation breeding has been utilized to improve fenugreek genotypes for various
traits. Both spontaneous and induced mutations have been exploited to generate suitable
cultivars of fenugreek. A number of fenugreek mutants from spontaneous mutations have
35
been isolated and are in use all over the world (Laxmi and Datta, 1987; Laxmi et al.,
1980; Singh and Singh, 1974; Petropoulos, 1973). The spontaneous mutant RH 3129,
characterized with high proportion of twin pods and with high diosgenin content, were
isolated from the Moroccan cultivar. The cultivar RH 3112 with higher diosgenin
content, RH 3112 with higher seed yield, the cultivar RH 3112 and RH 3118 with higher
percent protein, cultivars with higher amount of fixed oil and cultivars with early
maturity trait were created by induced mutation process (Petropoulos 2002, 1973; Laxmi
et al. 1980). Basu (2006) has generated mutant populations by treating seeds from the
North American cultivar “Tristar” with EMS. These populations were reported to exhibit
variability in height, seed yield, seed number per pod, biomass yield, total number of
pods and number of twin pods.
36
Chapter Two: Mutation Breeding
2.1 Introduction
Fenugreek is gaining more and more attention from an economical, agronomical
and environmental view points in countries where the crop was absent in their cropping
systems and in countries where the crop has been recently introduced. As a crop species,
fenugreek is fairly new to Canada. Since 1992, fenugreek has been grown commercially
in western Canada. The fenugreek genotypes that are adapted to the climatic conditions
of western Canada are few. Cultivars that are currently available in this country are the
result of selection among the world accessions that were introduced to this region.
Further genetic improvement in this species through breeding is very much limited since
the adapted genetic pool is very narrow.
Mutation breeding can be used to generate new genetic variability when there is
little variation in an existing gene pool for a certain trait (Fehr 1993). Mutation breeding
can give rise to many different alleles with different degree of trait modification in crop
species (Chopra 2005). Mutations are theoretically all changes which occur in DNA
sequence and result in changes in the genetic code. Gene mutation is mostly desired in
plant breeding as this adds to variability from which selection can be made (Yadav et al.
2007). Mutation breeding is found to be well suited for genetic improvement of grain
legumes that is also suggested by their evolutionary selection history (Adekola and
Oluleye 2007). Significant progress has been reported on the improvement of nutritional
quality of some legumes by inducing mutation (IAEA 1977, 1991). Yadav et al. (2007)
reported improvement of nutritional properties in Lens culinaris (L.) through induced
37
mutation. In Vigna unguiculata (L.), improved lines with high amount of protein content
and dry matter content, and reduced amount of moisture content were obtained using
induced mutation (Adekola and Oluleye 2007). Mutation breeding has been utilized to
improve fenugreek genotypes for various traits. Both spontaneous and induced mutations
have been exploited to generate suitable cultivars of fenugreek (Laxmi and Datta 1987;
Petropoulos 1973). The spontaneous mutant RH 3129, which has been characterized as
having a high proportion of twin pods with a high diosgenin content, was initially
isolated from a Moroccan cultivar. Cultivars with a high diosgenin content, higher seed
yield, a high percent protein, a high amount of fixed oil, and cultivars with an early
maturity trait have been created by introduction of mutations to fenugreek (Petropoulos
2002, 1973; Laxmi et al. 1980).
Although both physical and chemical mutagens are used in plant breeding for
inducing variability, many researchers reported a number of chemical mutagens to be
more effective and efficient than physical mutagens to produce variability (Begum and
Dasgupta 2010; Basu et al. 2008; Ganapathay et al. 2008). EMS, a chemical mutagen, has
been shown more effective than radiation in inducing polygenic variability in studies with
wheat (Gaul and Aastveit 1966), Arabidopsis thaliana (Brock 1971) and cowpea (Girija
and Dhanavel 2009). Several investigators investigated the effectiveness of chemical
mutagens and physical mutagens (radiations) to induce mutation in legume species lentil
(Lens culinaris L.) (Solanki 2005; Sarker and Sharma 1989). Their studies revealed that
chemical mutagens were more efficient than physical mutagens for inducing mutations in
lentil. Moreover, in their studies it was also found that among the chemical mutagens,
morphological mutation frequency was obtained higher with EMS. As an alkylating
38
mutagen, EMS alkylates phosphate groups, purine and pyrimidine bases in addition to
allelic mutations, small deletions and other chromosomal rearrangements. Henikoff and
Comai (2003) stated that in most cases EMS alkylates guanine bases and leads to
mispairing or mismatch pairing (particularly pairing of G bases with T in place of C)
within the genome. So, it is possible that point mutation in a gene or genes induced by
EMS has the potential to activate morphometric and reproductive changes in the
fenugreek base populations. Basu (2006) investigated the effectiveness of different level
of doses of EMS on Tristar fenugreek. This author found that EMS was very effective to
induce variability in the fenugreek base population, and the mutants generated with 300
µM EMS generated the best possible combination of characters among the mutant plants.
Yadav et al. (2007) suggested that more than one genotype should be used in a mutation
breeding program since response to mutagens is different from a variety to another
variety. The same authors also stated that the genotype selected for mutagenesis should in
particular be one of the best adapted genotypes. This is supported by the study of Begum
and Dasgupta (2010) where significant varietal effect was found on yield and yield
attributed characters in mutant generation of Sesamum indicum (L.).
To produce variability in the available gene pool in this study, mutation breeding
using EMS was applied to some adapted fenugreek genotypes. As mutation breeding
produces variability in a base population, five adapted genotypes, namely Amber, F70,
F80, F86 and Tristar were used as base populations to produce more variability for
regional cultivar improvement. It is hypothesized that as mutant plants conserve a major
portion of the base population DNA, use of a wider variety of mutant plants derived from
more than one adapted genotype as a base population could provide more variability for
39
development of new cultivars with desired seed yield, biomass yield, plant height, seed
number per pod, total number of pods and number of twin pods.
The objective of this mutation study was:
To produce variability in adapted genetic material to help improvement in this
crop through breeding for early maturity and high seed yield.
40
2.2 Materials and Methods
2.2.1 Seed material
The five fenugreek (Trigonella foenum-graecum L.) genotypes used in this study
were Amber, Tristar, F70, F80 and F86. The cultivar Amber was developed by selection
at Agriculture and Agri-Food Canada, Morden, Manitoba, Canada. The cultivar Tristar
was the first Canadian forage-type fenugreek cultivar, and was developed by selection at
Agriculture and Agri-Food Canada, Lethbridge, Alberta, Canada. The genotypes F70,
F80 and F86 were obtained from the United States Department of Agriculture/
Agriculture Research Station, Pullman, Washington, and further selected for their
adaptability and seed yield traits at the Crop Diversification Centre South (CDCS),
Brooks, Alberta, Canada. According to Lee (2009), the genotype Amber appeared to be
the best performing genotype for diosgenin productivity, while Tristar was found to be
the best genotype for production of a high 4-hydroxyisoleucine content, and the genotype
F86 produced relatively high seed yield and galactomannan content among ten genotypes
evaluated in a multi-location trial conducted in Canada. In another multi-location study
conducted by Basu (2006) within the Canadian prairie region, Tristar and F70 were
recognized as the best genotypes for forage production among the genotypes tested.
2.2.2 Treatment with mutagen
Fenugreek seeds of each genotype were presoaked in distilled water for 4 h (for
effective imbibition) and then treated with EMS (Sigma-Aldrich) for 12 hours at a
concentration of 300 µM made up in distilled water. For each genotype 100 seeds (M 0 )
were treated every time. Each treatment was done three times. In Basu (2006), the
41
treatment duration and concentration was found to be the best combination for producing
mutants with desirable characters in fenugreek.
2.2.3 Growing M 1 plants
Treated seeds from each treatment were planted individually in the greenhouse in
6 inch plastic pots containing a non-sterile, soil-free mix (LRC Soiless mix/Cornell mix)
and were designated as M 1 plants. Separate control blocks comprised of 50 plants of
untreated Amber, F70, F80, F86, and Tristar fenugreek were planted for comparison of
survival rates to their treated counterpart in the greenhouse. The soil free mix was
composed of a 3.8 cubic foot bale of sphagnum peat moss, an 18.6 kg bag of medium
horticultural grade vermiculite, 1000 g of calcium carbonate flour, 1500 g of 18-6-12
Osmocote (Southern Agricultural Insecticides, Inc.), 1200 g 0-21-0 fertilizer, 20 g of
“Fritted” trace elements, 15 g of 13.2 % (W/W) chelated iron, 7 g of 14 % (W/W)
chelated zinc and 30 L of washed mortar sand (The Scotts Co.). After maturation, seeds
were collected from the plants that survived from mutant treatment. Seeds from each base
population were bulked and kept separate from others.
2.2.4 Growing M 2 plants
The seeds harvested from M 1 plants grown in the greenhouse were planted in the
field to produce M 2 generation. The M 1 seeds originating from each base population
were seeded in separate rows. The seeds were sown in 2 meter long rows at a rate of 100
seeds/row. Two rows of untreated Tristar seeds were planted at the two edges as controls.
At maturation, seeds were harvested from M 2 plants. Mutant seeds obtained from each
genotype as base population were bulked and kept separate. During the growing period,
42
the field was visited frequently and examined for the presence of any weeds. If any weeds
were found they were pulled out by hand. All surviving plants (Table 2.2) in the M 2
generation were examined individually to gather data on plant height, pod number per
plant, double pod number per plant, seed weight per plant and biomass weight per plant.
Plant height was measured from the ground to the top most point of the plant. Plants were
cut at about 2.54 cm above ground, and then kept for drying. Individual plants was
weighed for dry biomass after drying. Seeds were extracted manually from each plant and
then weighed.
2.2.5 Growing M 3 plants
From each treatment group (groups based on each genotype used as base
population for inducing mutation) of M 2 seeds, 64 seeds were planted individually in the
greenhouse in 6 inch plastic pots containing a non-sterile, soil-free mix (LRC Soiless
mix/Cornell mix) and were designated as M 3 plants. Separate control blocks composed
of 50 plants of untreated Tristar fenugreek were planted for comparison of survival rates
in the greenhouse. After maturation M 3 seeds were collected from the surviving plants.
Seed from each genotype (the base population) was bulked and kept separate from others.
Mutant seeds obtained from each base population genotype (designated as a group) were
bulked and kept separate. All surviving plants (Table 2.2) in the M 3 generation were
measured individually to gather data on plant height, pod number per plant, double pod
number per plant, seed weight per plant and biomass weight per plant.
43
2.2.6 Statistical analysis
The mutation breeding study was not amenable to statistical manipulation as the
objective was to produce variability in mutant population. However, means and standard
errors were calculated using Microsoft Excel 2007 (Microsoft Corporation). GGE Biplot
Softwear (Version 6.7) was used to identify optimum trait values and environments
among the mutant generations (M 2 and M 3 ), and among mutant categories (Amber,
Tristar, F70, F80 and F86) according to the base population used.
44
2.3 Results
The EMS treated plants (M 1 ) based on their treatment groups (groups assigned
based on the genotypes used as base populations for EMS treatments) exhibited a
distinctive pattern of survival rates compared to their respective control groups (Table
2.1). The rate of survival of M 1 plants among the different EMS treated groups varied
from 1.33% to 8.00%, which demonstrated a very low level of survival compared to the
control groups. The survival rate among the control (untreated) groups varied from
40.00% for F70 to 86% Amber (Table 2.1). Among the mutant groups, the group F86
showed the best survival rate (8.00%) followed by the group Amber (5.33%) and F80
(5.33%) in M 1 generation. For the Tristar and F70 groups, the rates of M 1 plant survival
were very poor; i.e., 2.33% and 1.33%, respectively. The survival rate of F70 genotype
(40.00%) was also the lowest among the control plants. The survival rate for the Amber
control group (86.00%) was the best among the control plants followed by F86 (72.00%),
Tristar (62.00%) and F80 (60.00%) (Table 2.1).
The M 2 generation was grown in the field to expose the plants to natural
selection. No other selection pressure was put in the M 2 generation. Selection pressure in
early generations increases chances of eliminating potential plants with suitable
characteristics in successive generations (Fehr 1993). This early mutant generation (M 2 )
was exposed to an outside environment so that mutant plants that could not deal with a
typical crop-environment of western Canada could be eliminated automatically by nature.
Thus the number of detrimental mutants that were not suitable for growth in a temperate
climate was reduced significantly in the M 3 generation by natural selection in M 2
generation. The
45
Table 2.1. Survival of M 1 (EMS treated) and untreated plants for each base
population .
Genotype
used as base
populations
Number of
M 1 plants
survived
Percentage of
M 1 plants
survived
Number of
control plants
survived
Percentage of
control plants
survived
Amber
16
5.33
43
86
F70
4
1.33
20
40
F80
16
5.33
30
60
F86
24
8
36
72
Tristar
7
2.33
31
62
46
M 3 generation was grown under controlled environment (greenhouse) to make sure that
segregating mutants for different plant characters that might be useful in successive
generations were not lost.
The survival rates of M 2 plant groups differed from the survival rates of M 3 plant
groups. The mutant groups showed an increased level of survival with an increase in the
number of the generations. Each mutant group performed differently in every generation
in term of survivability. The survival rate of the M 2 plants among the different treatment
groups varied from 9.2% to 28.9%, whereas the survival rate among the M 3 plant groups
varied between 34.4% to 50% (Table 2.2). The mutant group for Amber showed the best
survival rate (28.9%) followed by the group F70 (17.7%) and F80 (14.8%) among M 2
groups. The lowest survival rate was observed for the F86 group (9.2%) treatment group.
The survival rate of the F70 group (50%) was highest among M 3 , whereas the mutant
group F80 was the poorest (34.4%) in survivability. The plant groups Amber and Tristar
also showed good survivability in the M 3 generation; i.e., 43.8% and 42.2%, respectively
(Table 2.2.). An interesting observation was that the mutant groups F86 and F70 had the
highest and the lowest survival rates in M 1 generation, but in the M 3 generation the F70
group had the highest survival rate while F86 showed the poorest survival rate (Table 2.1,
2.2). A number of mutants showing dwarfness, albinism, virina xanthescens and other
abnormal phenotypes were observed across all three generations (M 1 – M 3 ). However,
many of these plants either died before maturity or did not produce any seed.
47
Table 2.2. Survival of M 2 plants in the field and M 3 plants in greenhouse conditions for each group.
Genotype
used as
base
populations
Number of
seeds
planted to
grow M 2
plants
Number of
M 2 plants
survived
Percentage
of M 2
plants
survived
Amber
246
71
F70
136
F80
Percentage
of control
(Tristar)
survived
used in M 2
Number of
seeds
planted to
grow M 3
plants
Number of
M 3 plants
survived
Percentage
of M 3
plants
survived
28.86
64
28
43.75
24
17.65
64
32
50
418
62
14.83
64
22
34.38
F86
541
50
9.24
64
24
37.5
Tristar
150
21
14
64
27
42.19
72
48
Percentage
of control
(Tristar)
survived
used in
M3
76
The M 2 and M 3 plants also showed a wide range of variability in different
morphometric parameters; i.e., in height, number of pods, number of double pods, seed
weight and biomass weight (Table 2.3, 2.4 and Figure 2.1).
In the M 2 generation the highest mean plant height was obtained in the Tristar
group (41.6±2.0 cm) followed by F86 group (41.6±1.3 cm), while the lowest mean plant
height was observed in F80 group (36.8±1.2 cm) (Table 2.3). In the M 3 generation, the
highest mean plant height was 50.5±1.5 cm and the lowest mean plant height was
33.5±1.8 cm for the groups F70 and Amber, respectively (Table 2.3). For the M 2
generation, the tallest plant (66.8 cm) was found in the F86 treatment group, while the
Amber and Tristar groups produced the shortest plants (18.3 cm) (Table 2.4). For the M 3
generation, the tallest plant (73.4 cm) was found in the Tristar group, and the shortest
plant (15.2 cm) was found in the F80 group (Table 2.4). The overall mean plant height in
the M 3 generation for the groups except for the Amber and the Tristar groups increased
in comparison to that of the M 2 generation (Table 2.3). The mean height for the Amber
treatment group in the M 3 generation decreased profoundly from what was seen in the
M 2 generation, while the mean height for Tristar remained almost the same in both
generations.
The mutant groups (treatment groups for F70, F80, F86, Amber and Tristar)
relative to the mutant generations (M 2 and M 3 ) were analyzed using GGE biplot
methodology (Yan and Hunt 2003) for selected agronomic traits. The "which wins where
or which is best for what" view of the biplot identified the winning mutant groups for the
selected agronomic traits over the mutant generations. The biplot is constructed by
plotting principle component scores for both genotype group (entries) and generation
49
Table 2.3. Different morphometric parameters (mean ± SE) of field grown M 2 plants and greenhouse grown M 3 plants.
Genotype
used as
Plant
base
populations height
(cm)
M 2 generation
Number
of pods
per
plant
Number
of double
pods per
plant
Percent
plants
producing
double
pods
M 3 generation
Seed
weight
per plant
(g)
Biomass Plant
weight
height
per plant (cm)
(g)
Number
of pods
per
plant
Number
of double
pods per
plant
Percent
plants
producing
double
pods
Seed
weight
per plant
(g)
Biomass
weight
per plant
(g)
Amber
38.25 ±
0.42
10.70 ±
0.93
0.76 ±
0.19
25.35
0.90 ±
0.08
10.78 ±
0.45
33.50 ±
0.82
8.71 ±
1.20
3.36 ±
0.83
53.57
1.18 ±
0.18
5.28 ±
0.44
F70
40.18 ±
0.81
18.25 ±
2.02
0.97 ±
0.49
16.66
1.96 ±
0.31
10.30 ±
0.68
50.57 ±
0.58
24.34 ±
1.47
11.06 ±
1.04
96.88
2.73 ±
0.19
12.97 ±
0.50
F80
36.70 ±
0.47
10.31 ±
1.37
0.61 ±
0.18
19.35
0.54 ±
0.10
9.72 ±
0.42
37.51 ±
1.01
10.86 ±
1.70
3.18 ±
0.93
45.45
1.46 ±
0.23
6.79 ±
0.71
F86
41.57 ±
0.52
9.02 ±
1.14
0.56 ±
0.21
16.00
0.64 ±
0.11
8.49 ±
0.45
48.13 ±
0.53
17.88 ±
1.31
8.75 ±
1.13
87.50
1.9 ±
0.18
10.22 ±
0.66
Tristar
41.63 ±
0.86
13.24 ±
1.83
0.38 ±
0.22
14.29
1.11 ±
0.21
12.85 ±
0.81
41.24 ±
0.96
9.59 ±
0.85
1.11 ±
0.37
29.63
1.2 ±
0.11
6.37 ±
0.61
50
Figure 2.1. The "which wins where" view of GGE biplot for assessment of variation
in plant height of the mutant groups over two mutant generations (FL_M2 = field
grown M2¬ generation, and GH_M3 = greenhouse grown M3 generation). Variation
in plant height was assessed using a Principle Component Analysis of mutated
plants from five different genotypes (Tristar, Amber, F80, F70, and F86) over two
generations (FL_M2 and GH_M3). Highly positive PC 1 scores indicate superior
performance, whereas PC 2 scores close to 0.0 indicate trait stability.
51
(testers) simultaneously to create a two-dimensional diagram, using the PC1 scores as the
abscissa (horizontal axis), and the PC2 scores as the ordinate (vertical axis). 'Entries' with
a high PC1 score (positive) indicate superior performance while those that have a PC2
score close to zero indicate stability (Yan and Hunt 2003). The polygon-view or the
"what-wins-where" view of the GGE biplot presents a polygon drawn by connecting all
the genotypes located farthest from the biplot origin. Genotypes positioned at the vertices
of the polygon are referred to as vertex genotypes having longest vectors in their
respective directions. The vertex genotypes are the most responsive in their respective
directions, while those contained in the polygon are less responsive.
The GGE biplot analysis for plant height relative to mutant groups and mutant
generations identified Tristar, Amber, F80, F70 and F86 as the most responsive groups,
given their positions at the vertices of the polygon (Figure 2.1). The mutant group F70
was the superior genotype for plant height, given its high PC 1 scores, followed by the
mutant group F86. The mutant group F86 was the most stable in terms of plant height
given its low PC 2 (close to zero) scores. The mutant groups F70 and F86 also performed
well in the greenhouse grown M 3 generation (revealed by their close proximity to
GH_M 3 in the biplot), while Tristar and Amber groups performed well in field grown M 2
generation. The given scores for PC 1 and PC 2 showed that the M 3 generation was
superior and more stable than the M 2 generation.
The mean pod number per plant and mean double pod number per plant were
calculated for each group in the M 2 and M 3 generations. In the M 2 generation, the
highest mean pod number per plant was obtained for the F70 treatment group
(18.3±2.02), while the lowest mean pod number per plant was observed in F86 group
52
(9.0±1.14) (Table 2.3). In the M 3 generation, the highest mean pod number per plant was
24.3±1.47 and the lowest mean pod number per plant was 8.7±1.2 for the groups F70 and
Amber, respectively.
The F70 group mutant plants had higher number of pods compared to other
mutant groups in the M 2 generation (Fig. 2.2). For the M 2 generation, the plant
producing maximum number of pods (55) was found in the F80 group, while the plant
producing the maximum number of pods (43) was found in F70 group for the M 3
generation (Table 2.4). The overall mean pod number per plant in the M 3 generation for
all groups except for the Amber and Tristar treatments groups increased in comparison to
that of the M 2 generation (Table 2.3). The GGE biplot analysis for pod number/plant for
the mutant treatment groups over mutant generations in a "which wins where" view
(Figure 2.3) showed that pod number/plant was responsive in all mutant groups, given
their positions at the vertices of the polygon. However, the location of the F70 group at
the farthest right of the polygon (high PC 1 score) indicates superior performance for this
trait, while the location of the Amber group at the farthest left of the polygon (low PC 1
score) indicates poor performance. The mutant groups Amber and F70 were found more
stable groups (low PC 2 scores) for this trait. The mutant group F70 performed well in
the greenhouse grown M 3 generation, as well as in the field grown M 2 generation
(revealed by its close proximity to GH_M3 and FL_M2 in biplot). The given scores for
PC 1 and PC 2 showed that the M 3 generation was superior and more stable than the M 2
generation for this trait.
53
Percentage (%)
Figure 2.2. Percentage of plant producing different number of pods for M2 and M3
mutant generations for each base population.
54
Figure 2.3. The "which wins where" view of GGE biplot for assessment of variation
in pod number per plant of the mutant groups over two mutant generations
(FL_M2 = field grown M2¬ generation, and GH_M3 = greenhouse grown M3
generation). Variation in pod number per plant was assessed using a Principle
Component Analysis of mutated plants from five different genotypes (Tristar,
Amber, F80, F70, and F86) over two generations (FL_M2 and GH_M3). Highly
positive PC 1 scores indicate superior performance, whereas PC 2 scores close to 0.0
indicate trait stability.
55
It is encouraging to note that plants with some beneficial traits (such as apical
flowers, double pods, and multiple basal stalks) were found in the mutant treatment
groups in every generation (Figure 2.4). Presence of an apical flower is considered a sign
of the determinate growth habit since presence of apical flowers is a sign of arrested
apical growth, and it is expected that these plants will help the lower pods to fill and
mature early (Petropoulos 2002). Presence of double/twin pods is considered an
indication of higher diosgenin content in fenugreek seeds (Lee 2009; Petropoulos 2002),
whereas presence of multiple basal stalks is reported to have positive correlation with
higher seed yield (Gangopadhyay et al. 2009; Singh and Pramila 2009; Chandra et al.
2000; Sharma et al. 1990). However, these traits were not present in the base populations
and if present, they only are marginally expressed.
The mutant groups produced a good proportion of double or twin pods in the M 2
and M 3 generations. The proportion of plants with double pods was improved as the
number of mutant generations increased (Table 2.3). Very few double pods were
produced in the M 2 generation (Fig. 2.5). In the M 2 generation highest mean for double
pod number per plant was obtained in the F70 group (1.0±0.49), while the lowest mean
was observed in the Tristar treatment group (0.4±0.22) (Table 2.3). In the M 3 generation,
the highest mean for double pod numbers per plant (11.06±1.04) was also observed in the
F70 group, and the lowest mean (1.11±0.37) was found in the Tristar group (Table 2.3.).
The frequency of plant producing double pods was highest (25.4%) in the Amber
treatment group and lowest (14.3%) in the Tristar group for the M 2 generation, while
96.9% of the F70 group had double pods when only 29.6% plants of the Tristar group
showed double pods in M 3 generation (Table 2.3). For the M 2 generation, the plant
56
Table 2.4. Range of different morphometric parameters of field grown M 2 plants and greenhouse grown M 3 plants.
Genotype
used as
Height
base
populations
(cm)
M 2 generation
Pod
number
Double
pod
number
M 3 generation
Seed
weight
(g)
Dry
biomass
weight (g)
Height
Pod
number
Double
pod
number
Seed
weight
(g)
(cm)
Dry
biomass
weight (g)
Amber
18.3 – 59.4
1 - 38
2-6
0.1 – 2.8
4.1 – 19.3
15.5 – 51.5
0 – 24
2 – 18
0–3
F70
25.4 – 56.6
4 – 40
2 – 10
0.1 – 6.2
5.8 – 16.6
28.2 – 63.7
9 – 43
4 – 24
1 – 5.8
6.8 – 19.4
F80
20.0 – 55.9
1 – 55
2–6
0 – 4.7
4.6 – 17.2
15.2 – 62.0
0 – 26
4 – 14
0 – 3.7
0.7 – 13.4
F86
25.9 – 66.8
1 – 40
2–6
0 – 2.9
4.1 – 16.1
37.8 – 64.0
0 – 27
4 – 20
0 – 3.2
4.4 – 16.9
Tristar
18.3 – 59.4
1 - 38
2-6
0.1 – 2.8
4.1 – 19.3
19.8 – 73.4
2 - 18
2-6
0 – 2.7
2.1 – 16.3
57
2.2 – 12.1
Figure 2.4. Mutant plants showing (A) apical flowers, (B) double pods, and (C)
multiple basal stalks.
58
Figure 2.5. Percentage of plant producing different number of double pods for M2
and M3 mutant generations for each base population.
59
producing maximum number of double pods (10) was found in the F70 group, while the
plant producing maximum number of double pods (24) was found in the F70 group for
the M 3 generation (Table 2.4).
The highest mean for seed weight per plant (1.96±0.31g) and the lowest mean
(0.54±0.1 g) were found in the F70 and F80 groups, respectively, for the M 2 plants. For
the M 3 generation, the highest mean for seed weight per plant (2.73±0.19 g) and the
lowest (1.18±0.18 g) were found in the F70 and the Amber groups, respectively (Table
2.3). For the M 2 generation, the plant producing highest amount of seed (6.2 g) was
found in the F70 group. For the M 3 generation, the plant producing highest amount of
seed (5.8 g) was also found in the F70 group (Table 2.4). Every mutant groups produced
plants with different amount of seed in different frequencies in the M 2 and M 3
generations (Figure 2.7). The overall mean seed weight per plant in the M 3 generation for
all the groups increased in comparison to that of the M 2 generation (Table 2.3). The GGE
biplot analysis on seed weight per plant showed that all the mutant groups were
responsive (Figure 2.8). The analysis showed that mutant treatment group F70 (high PC 1
score) was superior for seed yield per plant. The mutant groups Tristar and F70 were
found more stable (low PC 2 scores) for this trait. Although all the mutant groups
performed well in the greenhouse grown M 3 generation in comparison to field grown M 2
generation (revealed by their close proximity to GH_M3 in the biplot), the mutant group
F70 were found more suited in the M 3 generation for this trait. The given scores for PC 1
and PC 2 showed that the M 3 generation was superior and more stable than the M 2
generation for this trait.
60
Figure 2.6. Percentage of plant producing different amount of seed for M 2 and M 3
mutant generations for each base population.
61
Figure 2.7. The "which wins where" view of GGE biplot for assessment of variation
in seed weight per plant of the mutant groups over two mutant generations (FL_M2
= field grown M2¬ generation, and GH_M3 = greenhouse grown M3 generation).
Variation in seed weight per plant was assessed using a Principle Component
Analysis of mutated plants from five different genotypes (Tristar, Amber, F80, F70,
and F86) over two generations (FL_M2 and GH_M3). Highly positive PC 1 scores
indicate superior performance, whereas PC 2 scores close to 0.0 indicate trait
stability.
62
The highest mean for dry biomass per plant (12.9±0.81 g) and the lowest mean
(8.5±0.45 g) were found in the Tristar and F86 groups, respectively, for the M 2 plants.
For the M 3 generation, the highest mean for dry biomass per plant (13.0±0.5 g) and the
lowest mean for dry biomass per plant (5.3±0.44g) were found in the F70 and Amber
groups, respectively (Table 2.3). For the M 2 generation, the plants producing highest
amount of dry biomass (19.3 g) belonged to the Amber and Tristar groups. For the M 3
generation, the plant producing highest amount of dry biomass (19.4 g) was found in the
F70 group (Table 2.4). The overall mean for dry biomass per plant in the M 3 generation
for all the groups except for the F70 group and the F86 group decreased in comparison to
that of the M 2 generation (Table 2.3). The GGE biplot analysis on dry biomass weight
per plant (Figure 2.9) showed that all mutant groups were responsive for this trait. The
location of the F70 group at the farthest right of the polygon (high PC 1 score) indicates
superior performance for this trait. The mutant group Amber was found more stable
groups (low PC 2 scores) for this trait. The mutant group F70 performed well in
greenhouse grown M 3 generation, while the Tristar group performed well in field grown
M 2 generation (revealed by its close proximity to GH_M3 and FL_M2 in the biplot). The
generation M 3 (revealed by its furthest distance from the biplot origin) was found more
discriminating than the M 2 generation. The given scores for PC 1 and PC 2 showed that
the M 3 generation was superior and more stable than the M 2 generation for this trait.
63
Figure 2.8. Percentage of plant producing different amount of dry biomass for M 2
and M 3 mutant generations for each base population.
64
Figure 2.9. The "which wins where" view of GGE biplot for assessment of variation
in dry biomass per plant of the mutant groups over two mutant generations (FL_M2
= field grown M2¬ generation, and GH_M3 = greenhouse grown M3 generation).
Variation in dry biomass per plant was assessed using a Principle Component
Analysis of mutated plants from five different genotypes (Tristar, Amber, F80, F70,
and F86) over two generations (FL_M2 and GH_M3). Highly positive PC 1 scores
indicate superior performance, whereas PC 2 scores close to 0.0 indicate trait
stability.
65
In the mutant generations (M 1 to M 3 ), no distinct pattern in earliness (maturity)
was detected. The mutant plants from different groups exhibited a random pattern of
maturation; i.e., some plants matured earlier while some matured late. Some plants in the
mutant populations produced apical flower that is considered a sign of determinate
growth habit since presence of apical flower refers the arresting of apical growth quickly
thus making the seed pods mature early (Basu et al. 2009; Petropoulos 2002).
66
2.4 Discussion
In this study it was found that mutagenic treatment severely affected
germinability of the mutant groups in M 1 generation confirming earlier mutation work
done on fenugreek using chemical mutagens (Basu et al. 2008; Siddiqui et al. 2008). In
the previous studies the authors concluded that EMS and sodium azide treatment result in
reduction of fenugreek seed germination compared to control in a dose-dependent
manner. In the present study dose was not considered and so comments in this regard
cannot be made. However, the base populations differed in their response to mutagenic
treatment confirming earlier work about use of multiple adapted cultivars for crop
improvement using mutation breeding (Yadav et al. 2007).
Seeds of different base groups treated with EMS produced mutants of different
kinds in the present study. Each group of mutants has shown high level of variability for
all the traits evaluated across all the mutant generations, which was an important
indication of mutation induction on multiple traits. Basu (2006) also observed
modifications in more than one character in fenugreek treated with mutagenic agent. This
may have resulted from a pleiotropic effect of mutated genes or mutations at different
loci. Singh (2005) stated that mutations generally have pleiotropic effects due to closely
linked gene(s). Singh and Singh (1974) also suggested that there is a high possibility that
gene involved for a trait could have pleiotropic effects or that the trait(s) involved is
governed by multiple genes with tight linkage that is being transmitted as a single unit.
Saini et al. (1974) reported that for a sterile mutant of legume crop Phaseolus aureus,
although many characters were affected, only single gene differences were detected.
Sjodin (1971) observed a number of morphological mutations that exhibited
67
modifications in more than one character in legume plants (Sjodin 1971). It is also
possible that a change in a single base pair in the DNA was involved for bringing changes
in each trait separately. Such a phenomenon was observed by Singh and Singh (1974) in
a spontaneous “green-trailing” fenugreek mutant.
The results of the present study indicate that multiple traits have been affected,
but whether this is due to alteration in a single gene or multiple genes or tightly linked
genes acting as one functional gene complex is not clear. The present study indicated that
mutagenesis using EMS was able to generate a large amount of variability in the
fenugreek population and many mutant lines showed important traits that were rare
among world collections (Figure 2.5).
Mutation breeding is more adaptable for inducing recessive genes than dominant
genes (Toker et al. 2007). Micke and Donini (1993) suggested that as mutations are
mostly recessive, they cannot be selected for until the second generation, thus it is
common practice to use only normal-looking M 2 plants to obtain the M 3 generation and
to apply preliminary visual selection in M 3 (Begum and Dasgupta 2010). In this study,
natural selection was applied in M 2 generation. The selection criteria resulted in a
reduction in poor performing phenotypes or deleterious alleles for the traits being
examined in M 3 generation. Strong selection pressure was not used in this study as the
generation was an early generation. The plants in early generations generally segregate
and may not be phenotypically highly desirable, but some of them can give rise to highly
desirable plant(s) with superior combination of desirable traits in successive generations.
Therefore strong selection pressure was not applied in early generations in this study as
68
was suggested by Fehr (1987). In later generations multiple homozygote formation is
likely to take place leading to expression of traits controlled by recessive gene(s).
The natural selection in M 2 generation brought changes in mean values for the
traits in every mutant group. The natural selection in M 2 generation decreased percentage
of poor performing plants and increased percentage of better performing plants for traits
in M 3 generation (Figure 2.3, 2.6, 2.7 and 2.9). Selection has been reported in fenugreek
(Basu 2006), Vigna radiata, Vigna mungo (Kozgar et al. 2010), and soybean (Pavadai et
al. 2010) to have effect to bring increase in mean values for yield and other agronomic
traits in successive mutant generations. Mean seed weight per plant, mean number of
double pod per plant was higher in M 3 groups than M 2 groups (Table 2.3 and Figure 1).
Mean height and mean pod number per plant also increased in M 3 generation except for
Amber and Tristar groups. Mean dry biomass per plant increased for only F70 and F86
groups in M 3 generation. These improvement for the traits evaluated must have been
acquired through mutation induction and effectiveness of natural selection on mutant
generation M 2 (Chatterjee et al. 2011). Basu (2006) also reported reduction in mean
biomass weight per plant in M 3 generation. Increase in mean for the traits evaluated
along with advancement of generations also indicate increase in stability level for the
traits. Continued selection in successive generations for desirable characters is expected
to further stabilize important characters in later generations.
Broadening the genetic base through induced mutation is a supplementary tool by
creating genetic variability for specific traits in a crop when there is lack of variability.
This genetic variability can then be used for crop improvement through conventional
breeding techniques (Chatterjee et al. 2011). Therefore, mutation breeding is an
69
appropriate and valuable method for fenugreek improvement in Canada. The objectives
of the present study were to generate variability in locally adapted genotypes, the results
indicate that this was achieved. Advancement of generations of the generated mutant
groups and appropriate selection for desired trait(s) among the mutant groups can result
in development of superior cultivars in this species. If for some reason all the desirable
traits are not available in any mutant then the selected genotypes can be used as important
germplasm in fenugreek breeding program. More studies should be done in future to
determine if there is any change in the chemical constitution and oil content due to
pleiotropic effects of the mutations.
70
Chapter Three: Mutant Evaluation
3.1 Introduction
As a cultivated crop, fenugreek is gaining popularity in countries that are not
traditionally large producers of this plant species, such as America, Australia and Canada
(Acharya et al. 2008; McCormick et al. 2006; Berti et al. 1993). In Europe and North
America, fenugreek is more admired as a component in artificial flavorings such as maple
and butterscotch, and mostly as a health-food or nutraceutical product (Slinkard et al.
2006). Although fenugreek cultivar development activities have been focused mainly on
development of genotypes for the spice market, interest in fenugreek has also extended to
development of forage-type genotypes in Western Canada (Acharya et al. 2010b, 2007).
“Tristar” is the first forage fenugreek cultivar developed by Agriculture and Agri-Food
Canada (AAFC); it was developed at the Lethbridge Research Centre (LRC) in Alberta,
Canada for its ability to produce a high biomass yield consistently (Acharya et al. 2010b).
Although fenugreek is fairly new to the Canadian agriculture, some genotypes of
this species are found to be adapted for growth under rain-fed conditions of western
Canada (Acharya et al. 2008, 2007). Most of these fenugreek genotypes including
“Tristar”, capable of producing good amount of biomass in western Canada exhibit an
indeterminate growth habit and take more than 120 days to produce a good proportion of
high quality seed (Basu et al. 2006). Although for forage production indeterminate
growth habit helps high biomass production, seed production is adversely affected as the
growing season in western Canada is short (~ 100 days). Previous work has made use of
mutation breeding to generate new breeding material for fenugreek improvement in
western Canada. In that work, seeds from “Tristar” were treated with different levels of
71
EMS and plants generated from the treated seeds that exhibited a determinate growth
habit, high seed yield and relatively early maturity were selected (Basu 2006). This
mutation breeding approach produced new breeding materials exhibiting variation for
different agronomical characteristics (Acharya et al. 2008). The seeds from the mutated
plants were increased to produce a base for plant selection and eventual production of
new early maturing fenugreek cultivar(s) for western Canada.
Objectives of the present study were to:
i.
evaluate and advance the mutant generations in multi-location trials.
ii.
develop stability indices for the agronomic traits.
iii.
identify correlations among morphological traits to facilitate indirect selection for
desirable agronomic traits.
72
3.2 Materials and Methods
3.2.1 Seed material
Fenugreek (Trigonella foenum-graecum L.) seeds from a previous mutation
breeding project were obtained from the Lethbridge Research Centre, Lethbridge,
Alberta. The seeds were results of a mutation breeding experiment that used Tristar as
base population and EMS as mutagenic agent. Bulk seeds derived from M 3 , M 4 , M 5 and
M 6 harvest in 2007, 2009 and 2010 were used for the purpose. In the year 2009, M 7
seeds from a M 6 generation were collected and included in 2010 test. Seeds of “Tristar”
was used as a control in all field tests.
3.2.2 Growing environments
The multi-environment study was conducted over three cropping years (2007,
2009 and 2010) at Lethbridge, Alberta and at Creston, British Colombia. In 2007, the
trials were planted under two growing conditions, rain-fed and irrigation, in Lethbridge.
In 2009, the trials were conducted under rain-fed growing conditions in both Creston and
Lethbridge. For the year 2010, there were two growing conditions, rain-fed and irrigation,
in Lethbridge, and one growing condition (rain-fed) in Creston. For statistical purposes,
each year × growing condition × location was considered as a growing environment (Lin
and Binns 1991). The growing conditions, locations and years produced a multienvironment trial with a total of seven growing environments.
73
3.2.3 Location parameters
Lethbridge: Lethbridge (49º 45' N and 112º 45' W) is located in southern Alberta (AB),
Canada with an average elevation of 900 m MSL (Harsh 1985) and is about 216 km
south-east of Calgary. It is situated in a semi-arid zone, with a moderate continental type
climate characterized by mild summers and warm winters (Harsh 1987). The soil type of
the area is Orthic Dark Brown Chernozem (Wyatt et al. 1939). The average annual
maximum and minimum temperatures are 12.1 ºC and - 1.0 ºC respectively (Environment
Canada). The annual average snowfall is around 1600 mm and the average annual
precipitation is about 262 mm. The GPS coordinates for the 2007 LRC irrigated field was
49º 42' 24.98'' N and 112º 45' 47.77'' W and for the 2007, 2009 and 2010 LRC rain-fed
field was 49º 42' 16.74'' N and 112º 45' 55.41'' W, while the GPS coordinates for the 2010
LRC irrigated field was 49º 42' 1.73'' N and 112º 45' 55.36'' W. The average monthly
temperature, maximum temperature, minimum temperature and monthly average
precipitation for the growing seasons for this location are presented in Table 3.1.
Creston: Creston (49º 10' N and 116º 31' W) is in British Columbia (BC), Canada, 760
km east of Vancouver. The elevation of Creston is 762 m MSL. It represents a temperate
climate with a relatively long growing season. Creston provides good crop growing
weather without the high or low temperature extremes. The summers in Creston are warm
and sunny, though the winters are mild as a result of Pacific systems crossing British
Columbia and the influence of Kootenay Lake (Harsh 1985). The soil type at Creston is a
stone-free alluvial deposit of Carbonated Rego Gleysol (composed of silt loam and silty
clay loam) with poor to moderately poor drainage (Wittneben and Sprout 1971). The
average annual maximum and minimum temperatures are 12.9 ºC and 3.1 ºC respectively
74
(Environment Canada). The average annual snowfall is 1406 mm and the average annual
rainfall is 454 mm (Wittneben and Sprout 1971). The GPS coordinates for the 2009 and
2010 Creston rain-fed field was 49º 06' 28.43'' N and 116º 34' 06.66'' W.
3.2.4 Experimental design
The mutant generations M 3 , M 4 , M 5 and M 6 including Tristar were used every
year, while the mutant generation M 7 was added to the trials for the year 2010. The
fenugreek mutant generations and Tristar were seeded into 3 × 2 m2 plots with 10 rows
spaced 18 cm apart. The plots were arranged in a Randomized Complete Block Design
with four replicates at each growing environment. The seeding rate for each mutant
generation and Tristar in all of the environments was 15 kg ha-1. The seeding was done
on May 18th for 2007 LRC irrigation and rain-fed trials; on May 26 and May 19,
respectively for LRC rain-fed and Creston rain-fed fields in 2009; and in 2010 LRC
irrigation and rain-fed trials were seeded on June 11th while Creston rain-fed trial was
seeded on May 19th.
For weed control Edge (Dow AgroScience Canada Inc.) and Odyssey (BASF
Canada) were used in the field experiments and Reglone (Syngenta Crop Protection
Canada Inc.) desiccant was used for the seed yield trials. Edge was applied about two
weeks before the seeding of fenugreek seeds, while Odyssey was applied on the field
after two weeks of fenugreek seed germination. The plants were desiccated two weeks
before harvesting the seeds using Reglone.
For seed yield trials, at maturity individual plots at each test site were
mechanically harvested using a small plot Wintersteiger combine harvester. The seed
75
harvesting was done on September 5th in 2007 at LRC sites; and on September 23 and
October 7th in 2009 at Creston and LRC sites, respectively. In 2010 the seed harvesting
was done on October 14th and November 4th at Creston and LRC sites, respectively. For
forage yield, fenugreek plants from an 0.25 m2 area were harvested from each plot with
in 10th to 12th week after seeding.
In this study, for seed yield and forage yield whole plots were visually evaluated.
This whole plot evaluation provided a general idea about the performance of the
fenugreek mutant generations (M 3 to M 6 ) over different environments, but did not
provide a quantitative estimation of individual performance of the mutant generations.
For segregating populations, this is a common criterion when the plot harvest data is used
for evaluation (Fehr 1987). To get a specific idea about the mutant generations (M 3 to
M 7 ), randomly picked plants were used to gather data for selected agronomic traits. As
these plants were picked without any biases, the plants represented the generation. The
data from randomly picked plants was often discriminative for different segregating
populations (Begum and Daasgupta 2010; Khan and Wani 2005; Njunie et al. 1996)
For the year 2010, when plants were cut to determine forage yield, five plants
were randomly picked and tagged from each plot. These tagged plants were manually
harvested before two weeks of harvesting for seed yield. These plants were used to
determine generation and environment effects on plant height, pod number, double pod
number, seed yield, biomass yield and basal stalk number. After harvesting, the plants
and the seeds were dried in a ventilated dryer for several days to remove moisture from
the plants and the seeds. Plant height was measured from the ground to the top most point
of the plant. Plants were cut at about 2.54 cm above ground, and then kept for drying.
76
Individual plants was weighed for dry biomass after drying. Seeds were extracted
manually from each plant and then weighed.
3.2.5 Statistical analysis
Treatment (mutant generation and growing environments) effects on seed yield,
forage yield, plant height, pod number, double pod number, seed yield (individual plant),
biomass yield (individual plant) and basal stalk number were subjected to Analysis of
Variance (ANOVA) using PROC MIXED (SAS Institute, Cary, NC) software. The data
were subjected to Square Root Transformation as the CVs were high indicating that some
of the ANOVA assumptions were not met. Whenever the main effects of mutant
generations and environments were found significant at p ≤ 0.05, treatment mean
comparisons were made using Tukey’s Honestly Significant Difference test. Microsoft
Excel 2007 program was used to calculate the correlation coefficient among different
agronomical traits.
77
Table 3.1. The monthly average temperature, maximum average temperature,
minimum average temperature and monthly average precipitation for each growing
in this study.
Location
year
2007
Lethbridge
Month
Average temperature
(oC)
Maximum temperature
(oC)
Minimum temperature
(oC)
Average precipitation
(mm)
Average temperature
2009
Lethbridge (oC)
Maximum temperature
(oC)
Minimum temperature
(oC)
Average precipitation
(mm)
Average temperature
2010
Lethbridge (oC)
Maximum temperature
(oC)
Minimum temperature
(oC)
Average precipitation
(mm)
2009 Creston Average temperature
(oC)
Maximum temperature
(oC)
Minimum temperature
(oC)
Average precipitation
(mm)
2010 Creston Average temperature
(oC)
Maximum temperature
(oC)
Minimum temperature
(oC)
Average precipitation
(mm)
May
June
July
Aug.
Sept.
Oct.
Nov.
12.4
16.7
22.8
17.9
12.5
8.6
0.1
18.6
23.2
31.1
26.3
19.6
14.8
5.9
5.9
10.2
14.6
9.6
5.0
2.3
-5.0
85.6
23.0
0.0
12.3
46.3
12.1
10.1
11.0
14.3
17.6
17.4
16.8
3.6
3.8
18.0
21.2
24.3
24.8
26.0
8.4
9.7
4.4
7.4
10.9
10.1
8.2
-0.7
-1.4
34.8
65.7
53.0
80.4
7.4
46.4
16.4
8.7
15.0
17.9
17.0
11.6
9.8
-3.0
14.4
20.9
24.7
23.6
17.0
16.3
2.8
2.9
9.2
11.2
10.5
6.5
3.2
-8.7
121.2
109.8
59.4
56.4
46.9
4.8
44.7
13.2
17.4
21.4
21.3
16.7
5.7
3
31.2
30.3
35.2
35.5
34
16.6
10.32
2
4.9
7.4
7.5
3.3
-6.6
-2.5
38
19.6
52.6
38.6
18.2
66.6
46.6
11.7
15.5
20.1
19.5
14
9.5
0.3
26
30
33.2
33.4
27.5
25.8
15
0
6
7.6
6.4
4.7
-1.4
-18.6
4
0.4
19
33
60.8
30.2
54.6
Source: Environment Canada
78
3.3 Results
Seed yield among growing environments varied significantly (p ≤ 0.01) with a
range of 229.5±19.7 kg/ha for Lethbridge irrigation in 2010 to 2290.0±121.1 kg/ha for
Lethbridge irrigation in 2007 (Table 3.2 and 3.3). The growing environment for
Lethbridge irrigation, 2010 produced the lowest seed yield, but it was statistically similar
to the seed yield observed at Lethbridge rain-fed (Leth RF) and Creston, 2010.
Lethbridge irrigation (Leth IR) 2007 produced the highest seed yield followed by Leth
RF 2009. Seed yield observed at Leth RF 2007 was statistically similar to that of Creston
2009. Although the generation effect was not statistically significant (p ≥ 0.05) for seed
yield, the mutant generation M 5 (783.5±134.5 kg/ha) and the mutant generation M 6
(776.4±116.5 kg/ha) produced relatively good amount of seed (Figure 3.1). The check
cultivar Tristar produced the higher seed yield (813.7±140.0 kg/ha) compared to the
mutant generations. The generation M 3 was the lowest in seed yield (741.3±117.3 kg/ha),
whereas the generation M 4 was the second lowest (758.0±146.5 kg/ha).
79
Table 3.2. Results of the ANOVA for seed and forage yield of fenugreek
generations.
Seed yield (kg ha-1)
Source of variation
DF
Mean Square
Generation
4
14632
Environment
6
11143012**
Generation × Environment
24
125937
Replication
3
402716*
20.23
Coefficient of variation (%)
-1
Forage yield (kg ha )
Source of variation
DF
Mean Square
Generation
4
1361862
Environment
5
184514478**
Generation × Environment
20
1933605
Replication
3
578817
14.66
Coefficient of variation (%)
** Denotes significance at p ≤ 0.01. * Denotes significance at p ≤ 0.05.
80
The mean forage yield expressed as kg ha-1 significantly (p ≤ 0.01) varied among
growing environments with a range of 1869.4±71.5 kg ha-1 to 8468.8±375.0 kg ha-1
(Table 3.2 and 3.3). Leth IR 2007 produced the highest forage yield among all the
environments, but it was statistically similar with RF 2010, Creston 2010 and Leth IR
2010. Leth RF 2007 and 2009 produced the lowest forage yield among the growing
environments. Like seed yield, generation effect was not statistically significant (p ≥
0.05) for forage yield. The mutant generation M 6 produced the highest forage yield
(6091.2±637.6 kg ha-1) followed by the mutant generation M 3 (5677.4± 577.5 kg ha-1)
(Figure 3.2). The generation M 5 was the lowest in forage yield (5390.6± 507.6 kg ha-1),
whereas the generation M 4 was the second lowest (5556.0±599.2 kg/ha). The control
cultivar Tristar produced 5620.9±638.7 kg ha-1 forage yield.
81
Table 3.3. Mean seed and forage yield in the seven environments of fenugreek
mutant generations.
Environment
Seed yield
(kg/ha)
Forage yield
(kg/ha)
Creston 2009
714.6 ± 97.4c
Creston 2010
240.0 ± 41.1d
7495.2 ± 571.2a
Lethbridge
Irrigation 2007
2290.0 ± 121.1a
8468.8 ± 375.0a
Lethbridge
Irrigation 2010
229.5 ± 19.7d
7175.0 ± 281.7a
Lethbridge dry
2007
869.6 ± 61.1c
1869.4 ± 71.6b
Lethbridge dry
2010
248.2 ± 22.0d
7632.0 ± 210.5a
Lethbridge
dry2009
1216.2 ± 93.2b
1908.0 ± 71.5b
Means sharing similar superscripts within the same column were not significantly
different from each other (Tukey’s Honestly Significant Difference (HSD) at p < 0.05).
82
Figure 3.1. Mean seed yield (kg ha-1) based on plot harvest data of M 3 to M 6
generation along with control Tristar.
83
Figure 3.2. Mean forage yield (kg ha-1) based on plot harvest data of M 3 to M 6
generation along with control Tristar.
84
The mutant generations M 3 , M 4 , M 5 , M 6 , and M 7 , and the control cultivar Tristar
were grown in three growing environments in 2010. Each generation was replicated four
times at every environment. For every generation and for Tristar, five plants were
randomly picked from every replicated plot for the analysis of some agronomic traits.
The plant height of fenugreek mutant generations varied significantly (p ≤ 0.01)
with a range of 52.8 cm for M 7 to 58.8 cm for M 4 (Table 3.4 and 3.5). The highest height
was obtained by the M 4 generation, but it was not statistically different from M 3 , M 5 and
Tristar. The mean plant height of M 6 was statistically comparable to that of M 7 , but was
significantly lower than that of M 3 , M 5 and Tristar. The plant height among growing
environments significantly varied with a range of 47.6 cm to 59.8 cm. The mean plant
height at Leth RF 2010 was the highest among the growing environments, and was
statistically similar to Leth IR 2010. The plant height at Creston 2010 was the lowest.
The Generation × environment interaction was found significant for plant height,
although the interaction effect contributed only 16.6% of the total variation.
Pod number plant-1 of fenugreek generations tested varied significantly with a
range of 19 for M 4 to 32 for M 7 (Table 3.4 and 3.5). The pod number plant-1 of M 7 was
statistically similar to M 6 and M 5 . The effect of growing environments on pod number
plant-1 was not significant.
85
Table 3.4. Mean squares taken from ANOVA tables for plant height, pod number per plant, double pod number per
plant, seed weight per plant, dry biomass weight per plant and basal stalk number per plant of fenugreek mutant
generations grown in 2010.
DF
Height (cm)
Pod number
Double pod
number
Seed weight (g)
Dry biomass
weight (g)
Basal stalk
number
Genarations
5
113.91**
1489.19**
41.75
18.56**
16.26*
8.17**
Environments
2
2228.43**
192.23
9.10
0.40
3.80
24.43**
Generation ×
Environment
10
100.27**
140.77
28.47
0.76
18.55**
0.87
Replication
19
116.41**
117.08*
34.23
1.53
9.65
2.31
8.1
19.9
175.2
26.6
9.0
28.5
Source of
variation
Coefficient of
variation (%)
** Denotes significance at p ≤ 0.01. * Denotes significance at p ≤ 0.05.
86
The effect of mutant generation on double pod number plant-1 was not found
statistically significant. The number of double pods plant-1 among growing environment
was not statistically significant as well. Moreover, the calculated value of coefficient of
variation was very high (175.22) for this character.
Seed weight plant-1 among mutant generations varied significantly with a range of
1.75 g for M 4 to 3.13 g for M 7 (Table 3.4 and 3.5). The highest seed weight plant-1 was
obtained by M 7 generation, and this was statistically similar to M 6 and M 5. The mutant
generation M 4 produced the lowest seed weight plant-1, but this was statistically similar
to M 3 and Tristar. The effect of growing environments on seed weight plant-1 was not
significant.
The dry biomass weight plant-1 of fenugreek mutant generations varied
significantly with a range of 14.11 g for M 3 to 15.54 g for M 4 (Table 3.4 and 3.5). The
highest dry biomass weight plant-1 was obtained by the M 4 generation, but it was
statistically comparable to that of M 5 , M 6 , M 7 and Tristar. The mutant generation M 3
produced the lowest dry biomass weight plant-1 among the generations. The effect of
growing environments on dry biomass weight plant-1 was non-significant. The
Generation × environment interaction was found highly significant for dry biomass
weight plant-1. The Generation × environment interaction effect contributed only 67.60%
of the total variation.
87
Table 3.5. Main effect of mutant generations and environments on the mean performance of plant height, pod number per
plant, double pod number per plant, seed weight per plant, dry biomass weight per plant and basal stalk number per plant of
fenugreek.
Generation
Height (cm)
Pod number
Double pod
number
Seed weight
(g)
Dry biomass
weight (g)
Basal stalk
number
M3
55.14±1.54 ab
21.10±1.09 cd
1.37±0.44 a
1.83±0.12c
14.11±0.35 b
1.70±0.10 b
M4
58.85±1.67 a
18.81±1.12 d
1.00±0.34 a
1.75±0.12 c
15.54±0.38 a
1.85±0.13 b
M5
55.80±0.99 ab
27.60±1.31 ab
2.13±0.54 a
2.65±0.16 ab
14.86±0.25 ab
2.10±0.15 ab
M6
53.61±0.91b
28.95±1.18 ab
3.13±0.66 a
2.84±0.14 ab
14.44±0.26 ab
2.37±0.19 ab
M7
52.88±0.88 b
32.13±1.20 a
2.87±0.50 a
3.13±0.16 a
15.21±0.25 ab
2.70±0.17 a
Tristar
56.97±1.42 ab
25.70±0.97 bc
1.80±0.49 a
2.37±0.11 bc
14.60±0.31 ab
1.93±0.13 b
Creston 2010
47.62±0.76 b
26.60±0.93 a
2.32±0.42 a
2.42±0.12 a
15.00±0.25 a
2.31± 0.11a
Lethbridge
irrigation 2010
59.25±0.81a
24.26±0.86 a
1.77±0.31 a
2.37±0.09 a
14.67±0.20 a
1.59±0.07 b
Lethbridge dry
2010
59.76±0.81b
26.28±0.82 a
2.07±0.35 a
2.49±0.09 a
14.71±0.19 a
2.43±0.12 a
Environment
Means that share similar superscripts within the same column under generation main effect and environment main effect are not
significantly different from each other (Tukey’s Honestly Significant Difference (HSD) at p < 0.05). The sample nimber (N) for each
generation for each trait evaluated was 60.
88
The basal stalk number plant-1 varied significantly among mutant generations of
fenugreek (Table 3.4 and 3.5). The highest basal stalk number plant-1 was obtained by the
M 7 generation, and was statistically comparable to that of M 5 and M 6 . The least basal
stalk number plant-1 was found in M 3 which was statistically similar to that of M 4 and
Tristar. The basal stalk number plant-1 also varied significantly among growing
environments. The highest basal stalk number plant-1 was obtained at Lethbridge dry,
2010 and was statistically similar to Creston, 2010. The least basal stalk number plant-1
was found at Lethbridge irrigation, 2010.
Randomly selected plants from the M 3 , M 4 , M 5 , M 6 and M 7 generations were
subjected for calculation of means for selected agronomic characters (plant height,
number of pods plant-1, number of double pods plant-1, seed weight plant-1, biomass
weight plant-1 and number of basal stalk plant-1) for the above mentioned mutant
generations. These means were plotted in a graph to show the trend of these agronomic
characters over the mutant generations (Figure 3.3 and 3.4).
The mean plant height (Figure 3.4) increased in M 4 generation, and then it
dropped steadily up to the M 6 generation. The mean plant height then again ascended
slightly from M 6 to M 7 generation. The lowest mean difference between two immediate
mutant generations for plant height was observed between M 5 and M 6 . The mean number
of pods plant -1 dropped from M 3 to M 4 generation, and then the mean increased sharply
from M 4 to M 5 generation and continued to increase steadily up to the M 7 generation
(Figure 3.4). The lowest mean difference between two immediate mutant generations for
this character was also observed between M 5 and M 6 . The mean for the character,
89
number of double pods plant-1 dropped from generation M 3 to M 4 , and then it increased
steadily
Figure 3.3. Trend of seed weight/plant, double pods/plant and basal stalk/plant over
the mutant generations (M 3 to M 7 ) over all the growing environments (Creston
2010, Lethbridge Irrigation 2010, and Lethbridge Dry 2010).
90
Figure 3.4. Trend of height/plant, pods/plant and biomass weight/plant over the
mutant generations (M 3 to M 7 ) over all the growing environments (Creston 2010,
Lethbridge Irrigation 2010, and Lethbridge Dry 2010).
91
up to generation M 6 , and slightly dropped in generation M 7 (Figure 3.3). For the
characters seed weight plant-1 and number of basal stalk plant-1, the mean reduced from
M 3 to M 4 , and then increased steadily up to the M 7 (Figure 3.3). The mean for the
character biomass weight plant-1 rose from generation M 3 to M 4 , and then it dropped
steadily up to generation M 6 , and rose again in generation M 7 (Figure 3.4).
The lowest mean differences between most subsequent generations in advanced
mutant generation for the character number of double pods plant-1, seed weight plant-1,
biomass weight plant-1 and number of basal stalk plant-1 were found between M 6 and M 7 .
The data for the selected traits gathered for the mutant generations and the control
cultivar Tristar were analyzed to identify a correlation coefficient (r) for these traits.
Pearson correlation coefficient values (r-values) representing associations among the six
traits examined are presented in Table 3.6. Results indicated a strong significant positive
correlation between seed yield and number of pods. Seed yield was also found positively
correlated with number of twin (double) pods and number of basal stalks. Plant height
was found to respond positively with biomass yield, and negatively with number of pods,
seed yield and number of basal stalks. The number of basal stalks was positively
correlated to number of pods and number of double pods as indicated by their r-values.
Significant positive correlation was also found between number of pods and number of
twin pods.
92
Table 3.6. Correlation coefficients (r) among traits measured on fenugreek mutant
generation and check variety grown across 3 environments.
Height
Number
of pods
Number of
twin pods
Seed
yield
Number of
pods
-0.369
Number of
twin pods
-0.076
0.416
Seed yield
-0.321
0.834
0.379
Biomass
yield
0.575
-0.056
0.034
-0.035
Number of
basal stalks
-0.293
0.631
0.317
0.586
Values in bold are significant at 1% level of probability.
93
Biomass
yield
0.061
3.4 Discussion
The genotype, environment, and genotype by environment interaction effects are
commonly considered as the major factors influencing crop performance and so are
important for plant breeding and crop production studies. Genotype, environment, and
genotype × environment interaction effects for various traits have previously been studied
in various legume crops including fenugreek (Acharya et al. 2010a; Sadeghzadeh-Ahari
2010, 2009; Basu et al. 2009; Berger et al. 2004; Arshad et al. 2003). However,
information on impact of these sources of variation on seed and forage yield and yield
components observed for different mutant generations of fenugreek are extremely
limited.
In this study, the whole plot harvest data for seed and forage yield showed a
significant environment effect for both of these characters. Lee (2009) evaluated ten
adapted fenugreek genotypes in different environments of western Canada, and found
that environment had a significant influence on seed yield. In another study with 83
world accessions of fenugreek, environmental effects were found significant for seed and
forage yield (Basu et al. 2009). In this multi-environment trial, the highest seed yield was
obtained for plots in Lethbridge that were irrigated in 2007. On average, weather
conditions in 2007 were dry during the growing season. Fenugreek is known to be
adapted to rain-fed growing conditions, but its yield can be increased considerably by
application of minimal irrigation in dry areas such as those found in southern Alberta
(Basu et al. 2009; Acharya et al. 2008; Petropoulos 2002). This study also is in agreement
with earlier observations in this regard (Huang and Liang 2000; McCormick et al. 1998;
Mir et al. 1993). The lowest seed yield was obtained for the environments examined in
94
2010. This observation may be due to high levels of precipitation that were available in
Lethbridge during this growing season (Table 3.1). The prolonged rainfall and moisture
availability observed might have delayed shift of the plant to a reproductive phase from a
vegetative phase, and subsequent delay in flower initiation. In legumes flowering is
mainly induced by water stress after the end of a maximum rainfall event (Lascano et al.
2002) and so the delay in flower initiation in 2010 may have been the reason for low seed
yield. Andersson et al. (2006) also reported presence of a similar phenomenon in the
legume crop Cratylia argentea. The opposite condition was observed for the environment
observed at Creston in 2010. In Creston, the weather in 2010 was extremely dry during
the first two months of the growing period (May and June) (Table 3.1). This extreme
weather conditions might have had a negative effect on flower initiation and pod set, and
might have eventually resulted in poor seed yield. Statistically, the highest forage yield in
this study was obtained for environments with a high moisture availability (Leth IR 2007,
Leth IR 2010, Leth RF 2010). This data supports the results of Basu et al. (2009) who
noticed a higher forage yield for fenugreek in environments with high moisture
availability in southern Alberta. Njunie et al. (1996) investigated 18 herbaceous legume
species grown under semi-humid and semi-arid conditions. Their study also found that
higher forage yields for legume crops were obtained at semi-humid sites in comparison to
semi-arid sites. Although the environment at Creston in 2010 was dry, it also produced
the highest forage yield that was significantly different from others. This may be due to
the fact that as the plants produced the lowest amount of seed yield in this environment,
the major portion of plant metabolites might have been utilized for vegetative growth.
Lee (2009) reported significant genotype effects for fenugreek seed yield, whereas Basu
95
et al. (2009) reported significant genotype effects on seed and forage yield of fenugreek.
Effect of mutant generations on seed and forage yield was not statistically significant for
whole plots harvest in this study. Fehr (1987) stated that in segregating populations that
are advanced by the bulk method, all types (high, moderate and low types) of plant
productivity will be present for a certain plant trait when the trait is affected by
hybridization and/or mutation. In this study, early segregating mutant generations were
advanced from the bulked seeds; thus, the mutant populations were a mixture of high
yielding, moderate yielding and low yielding plants for traits such as seed and forage
yield during each mutant generation. This may be the reason why the mutant generations
were found to be statistically similar to each other for these traits. In this study, no mutant
generation out-produced the control Tristar for either seed yield or forage yield. This
result was expected as the mutant generations were segregating generations and had
received little or no active selection for improved seed or forage yield. A similar
interpretation of the data was suggested by Robinson et al. (2007) in a study of perennial
legumes native to Australia which were compared with the growth of other exotic
legumes, Medicago sativa and Lotus corniculatus, that had been subjected to significant
breeding and selection pressures.
There were differences in the results for seed and dry matter yield when data from
randomly sampled individual plants (Table 3.4 and 3.5) rather than whole plot harvest
data were considered. Comparable observations were made in another study focused on
mutant generations of the legume crop, Sesamum indicum L. (Begum and Daasgupta
2010). In this present study, mutant generations were found to have a significant effect on
plant height, pod/plant, seed weight/plant, dry biomass/plant and basal stalk number/plant
96
when data gathered from randomly selected plants were considered. For all of the
selected characters except for double pods/plant and dry biomass/plant, different mutant
generations represented different mean groups from the base population Tristar. This
suggests presence of sufficient variability for the traits examined in the mutant
generations. Similar observations were also made by Chatterjee et al. (2011) when they
examined mutant generations of opium poppy. The presence of sufficient variability for
the selected agronomic traits in the mutant generations suggests a scope for effective
selection for these traits. A significant shift in mean values in a positive direction was
observed for quantitative traits like pods/plant, seed weight/plant and basal stalks/plant.
Furthermore, the highest means for these traits were obtained in the most advanced
generations, which indicates that the most advanced generations harbored plants with
these desired characters in higher frequencies than earlier generations. Earlier studies
involving different fenugreek genotypes have shown that plant height, pods/plant, seed
yield/plant, and basal stalks/plant, all show variation in response to growth in different
environments (Gangopadhyay et al. 2009; Singh and Pramila 2009). Although
quantitative traits are controlled by a polygenic system and are influenced by the
environment, only plant height and basal stalk number/plant traits were influenced by
environmental differences in the present study. As expected, statistically more basal
stalks/plant was obtained under rain-fed growing conditions than under irrigated growing
condition since fenugreek normally produces more basal stalks in response to water stress
(Petropoulos 2002).
The results of the present study showed that mean plant height and biomass
weight/plant increased in the M 4 generation, whereas mean number of pods/plant and
97
seed yield/plant decreased in the M 4 generation (Fig. 2 & 3). Basu (2006) selected high
seed yielding plants with shorter height and a lower biomass yield during growth of the
M 2 generation to produce an M 3 generation. This might be the reason why an immediate
benefit of selection was observed in the M 3 generation in this study, and why segregation
for these traits resulted in increased mean plant height and biomass weight/plant, and
decreased number of pods/plant and seed yield/plant in the M 4 generation. If seeds of the
segregating generations are bulked and a portion of the bulked seeds are used to grow the
next generation, it is likely that the proportion of seeds from high yielding plants will
increase in bulk since plants that produce more seeds will provide a higher ratio of seeds
in the bulk in comparison to plants that produce few seeds (Fehr 1987). The statement is
supported by the results of this study as a steady increase in number of pods/plant and
seed yield/plant was observed for the most advanced generations. This result is consistent
with earlier studies with fenugreek (Singh et al. 1991), Vigna radiata, Vigna mungo
(Kozgar et al. 2010; Wani and Khan 2006; Khan and Wani 2005), and soybean (Paqvadai
et al. 2010). The lowest mean differences between two successive mutant generations for
the traits examined were noticed in the most advanced generations, indicating an increase
in trait stability. The increase in stability in the most advanced generations in comparison
to the earlier generations, may be due to increased homozygosity of the genes involved
(Khan and Wani 2005).
Previous studies on fenugreek have identified several traits associated with seed
yield. In the present study seed yield showed a significant positive correlation between
the number of pods and the number of basal stalks/plant. This result is in agreement with
earlier studies with fenugreek (Gangopadhyay et al. 2009; Singh and Pramila 2009;
98
Chandra et al. 2000; Sharma et al. 1990). Contrary to most previous studies (Zandi et al.
2011; Gangopadhyay et al. 2009; Singh and Pramila 2009; Sharma et al. 1990), in the
present study a negative correlation was found between seed yield and plant height. The
deviation of the present result from the previous studies in this regard, may be due to
differences in agro-climatic conditions of western Canada. The studies that reported a
positive association between seed yield and plant height in fenugreek were conducted in
tropical regions where fenugreek is a native species and have much longer growing
period compared to western Canada, thus getting sufficient time for vegetative and
reproductive growth including seed maturation (Sadeghzadeh-Ahari et al. 2010;
McCormick et al. 2009). In contrast, fenugreek grown in temperate regions like western
Canada appear to remain in a vegetative state for a long time and, do not get sufficient
time for pod formation and seed maturation.
Successful breeding of a crop species to meet the requirements of prevailing
growing conditions depends on the selection criteria used in the breeding program,
together with realistic evaluation systems. This study showed that the mutant generations
are variable enough for generation of important agronomic traits to facilitate effective
selection for genetic improvement of the crop. Moreover, this study also has found a
significant association among plant characteristics such as seed yield and other
agronomic characters. Pods/plant, basal stalks/plant and seed yield/plant have been
reported to be highly heritable in fenugreek (Gangopadhyay et al. 2009; Singh and
Pramila 2009; Yadav and Raje 2008). Yadav and Raje (2008) reported that seed yield
was significantly correlated with pods/plant and basal stalks/plant. These characters can
be used to isolate high and stable seed yielding plants from the current mutant population
99
to generate potential lines which can be evaluated in different environments to develop
new cultivars or used in further breeding work as important germplasm.
100
Chapter Four: Mutant Lines
4.1 Introduction
Fenugreek is fairly new in Canada as a cultivated crop species. It has been grown
commercially in western Canada since 1992. Currently available fenugreek cultivars in
Canada were developed through selection among the world accession and the successive
introduction of these genotypes to this region. Earlier fenugreek cultivar development
activities in Canada were mainly focused on development of genotypes for the spice
market (Lee 2009). Tristar is the first forage fenugreek cultivar developed by Agriculture
and Agri-Food Canada (AAFC) at the Lethbridge Research Centre (LRC), Alberta, for its
ability to produce high biomass yield consistently in western Canada (Acharya et al. 2006
b, 2008). Although Tristar produces high quality and quantity of biomass, it is
indeterminate in nature and slow to mature under prairie environment, making consistent
high quality seed production difficult. Previous work has made use of mutation breeding
to develop new variability for early maturity and determinate growth habit to address this
problem. In that work, seeds of Tristar were treated with different levels of EMS (Basu
2006). The mutant plants generated from the treated seeds were grown to advance the
mutant generations. In the present study, seeds from different mutant generations were
used to select individual plants with desirable agronomic traits such as high seed yield,
early maturity etc.
Another approach for generating variability in the population is through
increasing the ploidy level of this deploid species. The utilization of induced polyploidy
is not so rare for cultivar development in this crop species (Fehr 1987). Increased ploidy
101
levels often result in vigorous plant with bigger seeds. The somatic chromosome number
of a plant can be doubled by a number of physical and chemical agents. Colchicine has
been the chemical most commonly utilized for this purpose (Fehr 1987). Natural and
chemically induced polyploidy has been reported in fenugreek. Singh and Singh (1976)
identified five fenugreek lines with double trisomics (2n+1+1) along with primary
trisomics (2n+1) from the progeny of natural autotetraploids. Singh and Raghuvanshi
(1980) and Roy and Singh (1968) produced tetreaploid fenugreek plants using colchicine
with the intent to develop vigorous plants. In a earlier study, Tristar fenugreek plants
were treated with colchicine to double the chromosome number (Basu 2006). Plants
possessing tetraploid genotypes were selected from the survivors and their seeds were
collected for further studies. Basu (2006) has reported that the seeds produced by the
tetraploid lines are bigger than that of Tristar. As fenugreek seed contains beneficial
chemicals such as diosgenin, 4-hydroxy leucine, and galactomannan, as well as is a good
source extractable aromatic oil. The aroma and flavor of fenugreek are attributed to
volatile oil. Being strongly scented, the oil is used as an insect repellent for grains,
wooden furniture and fabrics (Ciftci et al. 2011; Duke 1986). Fazil and Hardman (1968)
referred to the use of fenugreek oil in perfumes. Petropoulos (2002) mentioned the
presence of fenugreek oil as a secret ingredient in a very famous perfume of France. In
Europe and North America, fenugreek is used for artificial flavoring such as maple and
butterscotch, which is mostly attributed to fenugreek oil (Slinkard et al. 2006). It is
hypothesized that the cholchicine treated tetraploid fenugreek line with larger seeds than
diploid Tristar may contain more extractable oil than Tristar seeds.
102
The objective of this study was:
i) To grow and characterize lines from selected individual mutant (diploid) plants
ii) To assess seed yield and seed oil content of the tetraploid line.
103
4.2 Materials and Methods
4.2.1 Selected mutant diploid lines
The seeds of Fenugreek (Trigonella foenum-graecum L.) were collected from
Lethbridge Research Centre, Lethbridge, Alberta. The seeds were of different mutant
generations developed using Tristar as base population and EMS as mutagenic agent.
Bulk seeds from M 2 , M 3 , M 4 and M 5 were seeded in an irrigated field at Lethbridge in
2008. The test was observed at different growing stages, and plants were selected
according to phenotypic appearance (early maturity, number of pod and biomass
production) and tagged. At maturity, the tagged plants were harvested individually. The
seeds from each selected plants were kept separately.
Ten seeds from each selected plant were planted individually in the greenhouse in
6 inch plastic pots containing a non-sterile, soil-free mix (LRC Soiless mix/Cornell mix)
to increase the seed number. The soil free mix was composed of a 3.8 cubic feet bale of
sphagnum peat moss, 18.6 kg bag of medium horticultural grade vermiculite, 1000 g of
calcium carbonate flour, 1500 g of 18-6-12 Osmocote (Southern Agricultural
Insecticides, Inc.), 1200 g 0-21-0, 20 g of “Fritted” trace elements, 15 g of 13.2 % (W/W)
chelated iron, 7 g of 14 % (W/W) chelated zinc and 30 L of washed mortar sand (The
Scotts Co.). After maturation seeds were collected from individual plants and the seeds
originated from a single mother plant were bulked and kept separate from others such
mother plants.
On 7th June 2010, 50 seeds from each plant group were seeded in a field at LRC
along with the check line Tristar. The seeds from each group were planted in 2 meter
104
long lines, and line to line spacing were maintained at 40cm. The GPS coordinates for the
field was 49º 41' 56.45'' N and 112º 45' 24.93'' W. The field was manually weeded every
two-weeks. At maturity five plants from each line plus the Tristar control were randomly
picked. After harvesting, the plants and the seeds were dried in a ventilated dryer for
several days to remove moisture from the plants and the seeds. Plant height was
measured from the ground to the top most point of the plant. Plants were cut at about 2.54
cm above ground, and then kept for drying. Individual plants was weighed for dry
biomass after drying. Seeds were extracted manually from each plant and then weighed.
4.2.2 Tetraploid line
The tetraploid fenugreek line used in this study was generated by Basu (2006)
using Tristar seeds and colchicine to double the chromosome number. Basu examined
chromosome numbers of the plants generated from the colchicine treated seeds and only
took seeds from plant possessing 4n=32 chromosomes, bulked the seeds and considered it
as the tetraploid fenugreek line.
In the present study, the tetraploid line and Tristar (a diploid) were grown in three
environments. The multi-environment study was conducted over two cropping years
(2008 and 2009) at Lethbridge, Alberta, and at Creston, British Colombia. In 2008, the
trials were planted under one irrigated growing condition in Lethbridge. In 2009, the
trials were conducted under rain-fed growing conditions in both Creston and Lethbridge.
The GPS coordinates for the 2008 LRC irrigated field was 49º 42' 24.98'' N and 112º 45'
47.77'' W, and in 2009 and the Lethbridge rain-fed field was situated at 49º 42' 16.74'' N
105
and 112º 45' 55.41'' W. The GPS coordinates for the 2009 Creston rain-fed field was 49º
06' 28.43'' N and 116º 34' 06.66'' W.
The fenugreek tetraploid line and Tristar diploid control were seeded in 3 × 2 m2
plots with 10 rows spaced 18 cm apart. The plots were arranged in a Randomized
Complete Block Design with five replicates at each growing environment. The seeding
rate for each mutant generation and the Tristar control in all of the environments was 15
kg ha-1.
For weed control, Edge (Dow AgroScience Canada Inc.) and Odyssey (BASF
Canada) were used in the field experiments and Reglone (Syngenta Crop Protection
Canada Inc.) desiccant was used for the seed yield trials Edge was applied about two
weeks before the seeding of fenugreek seeds, while Odyssey was applied after two weeks
of fenugreek seed germination. The plants were desiccated two weeks before seed
harvest. For seed yield trials, at maturity individual plots at each test site were
mechanically harvested. After harvesting, the seeds were dried in a ventilated dryer for
several days to remove moisture from the material.
Total lipid of pre-dried fenugreek seed was analyzed by LR-NMR.
Approximately 6 g of seed was added to a flat-bottomed 16 x 150 mm test tube (to a fill
height of 4 cm) and the seed oil content was measured in a Minispec mq20 LR-NMR
instrument (Bruker Optics Canada, Milton, ON). Before measurement of test samples the
instrument was calibrated using a set of six fenugreek seed samples of known oil content,
and the gain was tuned using the reference sample with the highest oil content. The oil
content of the reference samples was determined gravimetrically following lipid
106
extraction by the hexane:isopropanol method adapted from Hara and Radin (1978). All
analyses were performed in triplicate.
4.2.3 Statistical analysis
Treatment effects were subjected to ANOVA using PROC MIXED (SAS
Institute, Cary, NC) model. The analysis was subjected to Square Root Transformed as
ANOVA assumptions were not met with the raw data. Whenever the main effects of
treatment were found significant at p ≤ 0.05, treatment mean comparisons were made
using Tukey’s Honestly Significant Difference test.
107
4.3 Results
4.3.1 Selected mutant diploid lines
In the present study, the selected mutant lines showed difference from the check
variety Tristar for all of the quantitative traits evaluated except for double pod number
per plant (Table 4.1).
Plant height of the fenugreek mutant lines varied significantly (p ≤ 0.01) with a
range of 44.45 cm for LRCF0805 to 57.09 cm for LRCF0811 (Table 4.1, 4.2 and Figure
4.1). The check line Tristar was among the highest height group along with eight other
mutant lines (LRCF0804, LRCF0806, LRCF0809, LRCF0811, LRCF0815, LRCF0816,
LRCF0819 and LRCF0820). The mean plant height of LRCF0805 was statistically
shorter than Tristar.
Pod number plant-1 of fenugreek mutant lines tested varied significantly (Table
4.1, 4.2 and Figure 4.1). The highest (53.6) number of pods plant-1 was obtained for
mutant line LRCF0809, whereas LRCF0811 produced the lowest (20.2) number of pods
plant-1. The pod number plant-1 of LRCF0809 was statistically comparable to that of
LRCF0804, LRCF0805 and LRCF0821. The check variety Tristar was statistically
similar to those mutant lines that produced the lowest number of pods plant-1. Although
double pod number plant-1 varied among mutant lines the effect of mutant lines for
double pod number was not significant (Table 4.1).
108
Table 4.1. Mean square results of the ANOVA for plant height, pod number per plant, double pod number per plant,
seed weight per plant, dry biomass weight per plant and basal stalk number per plant of fenugreek selected lines.
Source of
variation
DF
Plant height
(cm)
Pod number
plant-1
Double pod
number plant-1
Seed weight (g)
Dry biomass
weight (g)
Basal stalk
number
Lines
15
27.915087**
389.97**
22.396667
6.115421**
10.822777**
3.899167**
Residual
64
3.962877
34.09375
16.525000
0.422916
0.704767
0.4125
3.13
9.17
193.9
11.45
3.52
16.21
Coefficient of
variation (%)
** Denotes significance at p ≤ 0.01.
109
Seed yield plant-1 among the mutant lines varied significantly with a range of
1.77g for LRCF0811 to 5.38g for LRCF0809 (Table 4.1, 4.2 and Figure 4.2). The
highest seed yielding line LRCF0809 was statistically comparable to that of LRCF0804
and LRCF0805 and these three produced significantly higher seed yield compared to
check cultivar Tristar. In fact, seed yield for Tristar was statistically similar to the lowest
seed yielding mutant LRCF0811.
Some selected lines showed early maturity relative to control Tristar. The
fenugreek mutant line LRCF0804, LRCF0809, LRCF0811 and LRCF0813 flowered 7 to
12 days earlier than Tristar, and also matured earlier than Tristar. The seed size and color
were also variable among the selected mutant lines (Figure 4.3). The seed size of Tristar
was considered large as most mutant lines produced smaller seed except for LRCF0806
and LRCF0815. The later two lines produced seeds as large as Tristar. Although the
mutant lines LRCF0805 and LRCF0816 produced high seed yield the seed was green in
color whereas the rest of the lines produced yellow seeds. The LRCF0813 produced a
mixture of yellow and green seeds.
The dry biomass yield plant-1 of the fenugreek mutant lines also varied
significantly (p ≤ 0.01) with a range of 9.81g for LRCF0814 to 15.09g for LRCF0811
(Table 4.1, 4.2 and Figure 4.1). The highest dry biomass yielding line LRCF0811 was
statistically comparable to that of LRCF0802, LRCF0806 and LRCF0809. The mean dry
110
Table 4.2. Main effect of selected lines on the mean performance of plant height, pod number per plant, double pod
number per plant, seed weight per plant, dry biomass weight per plant and basal stalk number per plant of fenugreek.
Lines
Height (cm)
Pod number
Double pod
number
Seed yield (g)
Dry biomass
weight (g)
Basal stalk
number
LRCF0802
46.93±1.41bc
30.80±1.85cde
0.0a
3.42±0.32cde
13.73±0.41abc
2.80±0.20abc
LRCF0803
45.66±1.14bc
28.80±2.35cde
1.20±1.20a
1.78±0.17g
11.40±0.34efg
1.20±0.20de
LRCF0804
51.51±1.44abc
41.80±2.69abc
6.80±3.82a
4.41±0.26abc
12.78±0.18bcde
2.20±0.480bcde
LRCF0805
44.45±0.71c
47.80±1.68a
0.0a
4.97±0.20ab
10.84±0.16fg
4.00±0.0a
LRCF0806
56.74±1.47a
32.20±4.72bcde
0.80±0.80a
2.87±0.54defg
13.41±0.59abcd
1.80±0.20cde
LRCF0808
49.12±1.87bc
29.00±2.21cde
4.00±2.60a
3.44±0.52cde
10.73±0.54fg
1.20±0.20de
LRCF0809
50.95±1.57abc
53.60±2.94a
4.80±3.20a
5.37±0.18a
14.33±0.33ab
3.40±0.40ab
LRCF0811
57.09±1.93a
20.20±2.72e
0.0a
1.77±0.39g
15.08±0.35a
2.20±0.58bcde
LRCF0813
46.73±1.29bc
28.20±2.10de
0.0a
2.60±0.21defg
10.87±0.43fg
2.00±0.31bcde
LRCF0814
46.22±0.55bc
27.60±2.42de
1.60±1.60a
2.21±0.22defg
9.80±0.37g
1.20±0.20de
LRCF0815
51.10±1.62abc
27.80±2.03de
0.0a
1.91±0.19fg
12.18±0.26cdef
1.00±0.00e
LRCF0816
52.42±1.54ab
28.40±2.80de
1.20±0.80a
3.15±0.27cdefg
11.40±0.36efg
1.00±0.0e
LRCF0819
52.57±1.47ab
33.20±1.31bcde
2.40±1.93a
3.25±0.20cdef
10.72±0.16fg
2.00±0.0bcde
LRCF0820
52.07±1.57ab
33.40±3.37bcd
0.0a
2.04±0.06efg
11.88±0.41cdef
1.40±0.24cde
LRCF0821
47.59±0.63bc
44.80±2.35ab
4.40±2.85a
3.65±0.20bcd
11.83±0.39def
2.60±0.40abcd
Tristar
52.47±1.29ab
29.60±2.40cde
2.00±2.00a
2.55±0.19defg
12.78±0.35bcde
1.40±0.22cde
Means that share similar superscripts within the same column under generation main effect and environment main effect are
not significantly different from each other (Tukey’s Honestly Significant Difference (HSD) at p < 0.05).
111
Figure 4.1. Mean plant height/plant, pod number/plant and dry biomass
weight/plant of selected mutant lines and Tristar fenugreek.
Means were based on data from 5 plants.
112
Figure 4.2. Mean seed weight/plant, double pod number/plant and basal stalk
number/plant of selected mutant lines and Tristar fenugreek.
Means were based on data from 5 plants.
113
Figure 4.3. Seeds of selected fenugreek lines and Tristar grown in the field of LRC
(Summer, 2010).
Here, A = LRCF0802, B = LRCF0803, C = LRCF0804, D = LRCF0805, E = LRCF0806,
F = LRCF0808, G = LRCF0809, H = LRCF0811, I = LRCF0813, J = LRCF0814, K
=LRCF0815, L = LRCF0816, M = LRCF0819, N = LRCF0820, and O = LRCF0821.
114
biomass yield plant-1 of LRCF0814 was statistically comparable to that of LRCF0803,
LRCF0805, LRCF0808, LRCF0813, LRCF0816 and LRCF0819, but was significantly
lower than that of LRCF0815, LRCF0820 and LRCF0821. The Tristar control was
positioned in the top second group for this trait, and produced statistically similar amount
of dry biomass plant-1 to that seen for the lines LRCF0804, LRCF0806 and LRCF0809.
Basal stalk number plant-1 for the fenugreek mutant lines tested varied
significantly (Table 4.1, 4.2 and Figure 4.2). The highest (4.0) number of basal stalks
plant-1 was obtained for the mutant line LRCF0805, whereas LRCF0815 and LRCF0816
produced the lowest (1.0) number of basal stalks plant-1. The basal stalk number plant-1 of
LRCF0805 was statistically comparable to that of LRCF0802, LRCF0809 and
LRCF0821. The control Tristar produced statistically similar number of basal stalk plant-1
to those mutant lines that produced the lowest number of basal stalk plant-1.
4.3.2 Tetraploid line
In the experiment using the tetraploid fenugreek line and Tristar grown in three
environments, the effect of the genotype was not significant for seed oil content and seed
yield (Table 4.3 and 4.4). Seed oil content among growing environments varied
significantly with a range of 7.8 (%) for Lethbridge irrigation 2008 to 6.7 (%) for Creston
2009. Genotype × Environment interaction was found to have significant effect on seed
oil content, and it contributed ~20% of the total variation observed. Seed yield among
growing environments varied significantly with a range of 570.3 kg ha-1 for Creston 2009
to 1208.0 kg ha-1 for Lethbridge rain-fed 2009. The growing environment Creston 2009
115
Table 4.3. Results of the Analysis of Variance (ANOVA) for seed oil content (%) and
seed yield (kg/ha) of tetraploid fenugreek line and Tristar fenugreek.
Seed oil content
Source of variation
DF
Mean Square
Generation
1
0.001470
Environment
2
3.081213**
Generation × Environment
2
0.756520**
Replication
4
0.058037
2.2
CV (%)
Seed yield
Source of variation
DF
Mean Square
Generation
1
105759
Environment
2
1097824**
Generation × Environment
2
289977
Replication
4
48726
25.01
CV (%)
** Denotes significance at p ≤ 0.01.
116
Figure 4.4. Seeds of tetraploid fenugreek line and Tristar.
117
Table 4.4. Main effect of environments and genotypes on the mean performance of
seed oil content (%) and seed yield (kg/ha) of tetraploid fenugreek line and Tristar
fenugreek.
Environment
Seed oil content (%)
Seed yield (kg/ha)
Creston 2009
6.673c
570.32b
Lethbridge
rain fed 2009
7.245b
1208.04a
Lethbridge
Irrigation 2008
7.783a
733.20b
Tetraploid line
7.24a
777.81a
Tristar
7.22a
896.56a
Genotype
Means that share similar superscripts within the same column under generation main
effect and environment main effect are not significantly different from each other
(Tukey’s Honestly Significant Difference (HSD) at p < 0.05).
118
produced the lowest seed yield, but it was statistically similar to the seed yield obtained at
Lethbridge irrigation 2008.
119
4.4 Discussion
A successful breeding of a crop species depends on the selection criteria used in
the breeding program along with realistic evaluation systems to meet the market demand
for the crop (Evans 1996). In the present study, different mutant generations (M 2 , M 3 ,
M 4 and M 5 ) were used to assess variability among mutant generations and for identifying
individual plants with high seed yield and quality. The mutant generations were advanced
by following bulk method plant breeding protocols in which the M 1 plants were grown
and their M 2 seeds were harvested together as one bulk population, and then a sample of
the M 2 seeds were planted to raise an M 2 generation from which the M 3 seeds were
harvested, bulked and eventually used to raise an M 3 generation. The same method was
used to produce the M 4 and M 5 generations. This scheme was suggested by Fehr (1987)
to maintain mutant populations and identify suitable mutant lines.
Mutation breeding is considered an effective tool to generate variability in the
existing adapted plant varieties (Pavadai et al. 2010; Khan and Goyal 2009). The mutant
lines used in this study was generated in an earlier mutation study where EMS was used
to induce mutations in Tristar fenugreek (Basu 2006). In the present study, sufficient
amount of variability was found within each mutant generation for all the quantitative
traits evaluated expect for double pod number plant-1. A number of lines were identified
that were superior for seed yield and yield attributing traits than the check variety Tristar.
The increase in mean values could be due to the alteration in genes involved in polygenic
system governing the traits by cumulative effects. Similar changes in mean values in
mutants over the base cultivar used for mutation has been reported in many legume crops
120
including mungbean (Kozgar et al. 2010; Tah 2006; Wani et al. 2005), urdbean (Kozgar
et al. 2010; Deepalakshmi and Kumar 2003) and lentil (Singh et al. 2006).
Reports on successful selection in mutant populations in fenugreek are not
available but, in another legume crop lentil improved lines were generated through
mutation breeding (Ali et al. 2010; Ali and Shaikh 2007; Singh et al. 2007). Among the
mutant lines evaluated in this study, four showed early maturity trait. Mutation breeding
was reported effective to generate early maturing lines in mungbean by Khan and Goyal
(2009). Fortunately, two of them (LRCF0809 and LRCF0804) were also the top most
high yielding lines (Table 4.2). Identification of these two lines may be useful to create
early maturing stable and high seed yielding fenugreek cultivar in western Canada where
the growing period is short. Another early maturing mutant line LRCF0811 was among
the top biomass yielding lines. This line may be also useful for forage type cultivar
development. For seed yield trait, the selected lines LRCF0809, LRCF0805, LRCF0804
and LRCF0821 were superior over others, since these lines ranked top for the traits seed
yield plant-1, pod number plant-1, basal stalk number plant-1 (Table 4.2). In the fenugreek
crop, it has been shown that pod number plant-1 and basal stalk number plant-1 are highly
heritable and have a direct positive effect on seed yield plant-1 (Yadav and Raje 2008;
Koli 2002; Arora and Lodhi 1993; Mehta et al. 1992; Sharma et al. 1990).
The mutant lines LRCF0811, LRCF0809 and LRCF0806 were found superior
over other lines for biomass production as these lines ranked at the top for the characters,
dry biomass yield plant-1 and plant height. Ahari et al. (2010) and Sharma et al. (1990)
reported that plant height is positively associated with biomass yield in fenugreek. These
lines may be utilized in development of forage type fenugreek genotypes. The lines that
121
were generated and evaluated in the present study showed potential for improvement of
different agronomic traits in fenugreek. For successful utilization of these lines, progenies
of these lines must be evaluated in multi-environment trails for stability and uniformity of
the characteristics desired. If the progeny shows that it expresses the desired phenotype
but is segregating for the character(s), individual plants may be selected and harvested
separately. Then the plants may be progeny tested in successive seasons and additional
selection among and within lines may be conducted in subsequent generations. Then the
performance of uniform lines may be evaluated again in multi-environment trails, and
desirable lines may be tested for release as fenugreek cultivars or for use as parents in
other fenugreek breeding studies.
Tetraploid fenugreek has been reported to produce larger seeds than its diploid
parent Tristar fenugreek (Basu 2006). Seeds harvested from these tetraploid plants grown
in three environments also showed that the seed size for the tetraploid line was larger
than Tristar (Figure 4.4). however, the seed yield for the tetraploid line was not
statistically different from that of Tristar. The seed yield for the tetraploid line was not
significantly higher than Tristar. This may have been due to the fact that in the tetraploid
line there was no change in gene level, only the chromosome number was doubled. The
seed yield of the tetraploid line may be increased by hybridizing with other tetraploid
fenugreek lines. Singh et al. (1990) obtained higher seed yield in F 6 than one of the high
yielding tetraploid parents. The effect of environment on seed yield was found to be
significant. Similar results have been reported in other studies of fenugreek conducted in
western Canada (Basu et al. 2009; Lee 2009). Surprisingly, the result for the seed oil
content of the tetraploid line was contrasting with the hypothesis made for the study.
122
Seeds of the tetraploid line were found to contain same amount of oil as Tristar. This is
may be due to the fact that the level of expression of the genes involving lipid production
in fenugreek seed was not changed though the chromosome number was increased by
two fold in tetraploid fenugreek. The environment effect was significant for seed oil
content in fenugreek. The seeds harvested from irrigated trial produced the highest
amount of seed oil. From the result it may be assumed that lipid production in seeds is
influenced by moisture availability during seed set. This is just one observation, further
studies including a number of different environments with different level of moisture
availability will be required to confirm this. Although seed oil content of the tetraploid
line was same as diploid, other seed constituents such as protein, diosgenin, isoleucine
and galactomannans might have changed along with the increase of seed size. Future
studies should be done to assess these components in seeds of this tetraploid fenugreek
line. The seeds of the tetraploid line were uniform in size and color and so it might be
more appealing for the spice market than the variable diploid seed.
123
Chapter Five: Screening Resistant Fenugreek Genotypes Against Cercospora Leaf
Spot Disease
5.1 Introduction
Fenugreek is affected by many pathogenic fungi. Among the fungal diseases of
fenugreek, Cercospora leaf spot disease caused by Cercospora traversiana is considered
one of the most serious, destructive and widespread diseases (Acharya et al. 2010a;
Petropoulos 2002; Ryley 1989). This disease is capable of causing considerable economic
loss (Ryley 1989; Zimmer 1984; Leppik 1960, 1959). The disease is prevalent in
countries where fenugreek is cultivated extensively (Singh et al. 2011; Elwakil and
Ghoneem 2002; Petropoulos 2002). It is also reported to infect fenugreek in countries
such as Hungary (Voros and Nagy 1972), Bulgaria (Bobev et al. 1999), Australia (Ryley
1989) and Canada (Zimmer 1984) where the crop was introduced and is not grown
widely. The pathogen Cercospora traversiana is a member of the Dothideomycetes,
which is a seed-borne fungus (Acharya et al. 2010a; Elwakil and Ghoneem 2002; Ryley
1989). Several researchers have suggested that Cercospora traversiana is the only
species of the Cercospora that can infect fenugreek (Ryley 1989; Cook 1978). Leppik
(1960, 1959) noted that the centre of origin of Cercospora traversiana is southern Asia,
where fenugreek is native. This author also stated that the occurrence of the pathogen in
other countries is due to transport of infected seeds.
Management of plant pathogenic diseases is based on use of chemicals, genetic
resistance or some combination of these approaches. Continuous use of chemicals to
control plant pathogens is not environmentally sound as these chemicals can create a
124
hazardous impact on the surrounding environment (Iqbal et al. 2011; Nariani 1960). Use
of disease resistant/tolerant crop cultivars is regarded as an economical and durable
method of controlling fungal disease (Tivoli et al. 2006). Measures to control foliar
diseases caused by fungus have relied on identification of resistant/tolerant germplasm
and development of resistant/tolerant cultivars through effective screening (Tivoli et al.
2006). Disease resistance is currently a primary objective of many plant breeding
programs. However, literature on Cercospora traversiana is scarce, and there is no
literature on screening of fenugreek germplasm to identify resistant/tolerant genotype
against the fungal pathogen. In this study, 73 fenugreek world accessions were screened
for Cercospora traversiana resistance/tolerance. To the best of our knowledge, it is the
first report on screening of fenugreek world accessions for tolerance to Cercospora leaf
spot disease. Although this disease is not a yield limiting factor in Canada, the disease
has been reported in Canada in a previous study (Zimmer 1984). Zimmer (1984) reported
that the disease occurred on fenugreek in Morden, Manitoba and other locations in prairie
provinces during 1983. The author also reported that the pathogen was able to reduce
yields up to 80% in that year. As fenugreek is gaining more recognition in Canada and
other countries where it has been introduced, the acreage of fenugreek will eventually
increase in these countries. With these increases in acreage the pathogen has increased
potential to become a problem in these areas. So, identification of tolerant genotypes may
be useful to develop resistant cultivars in the future. Moreover, the identified tolerant
genotypes have potential for use in countries where Cercospora leaf spot disease is
prevalent.
125
The objectives of this study ware:
i) To screen for resistance/tolerance against Cercospora traversiana among the
fenugreek world accessions,
ii) To re-characterize the disease as it presents itselfs in western Canada.
126
5.2 Materials and Methods
5.2.1 Plant genotypes
Screening of available varieties and available germplasm constitutes the basis of
identifying resistant sources to plant pathogenic diseases (Ashfaq et al. 2007; Tivoli et al.
2006; Buchwaldt et al. 2003). In this study, a total of 53 fenugreek world accessions
(Appendix I.) were evaluated for cercospora leaf spot development after artificial
inoculation with Cercospora traversiana spores in a growth chamber. Among the 53
germplasms examined, two were Canadian cultivars (Amber and Tristar), and three
genotypes (F70, F80 and F86) were selected at the Crop Diversification Centre South
(CDCS) Brooks, Alberta, Canada for adaptability and seed yield traits when grown in
Canadian conditions.
5.2.2 Culture of pathogenic fungi
A live pure culture of Cercospora traversiana on agar was obtained from CAB
International (CABI), United Kingdom. In the strain information sheet provided by
CABI, it was mentioned that the microorganism, Cercospora traversiana, was isolated
from Trigonella foenum-graecum L. The microorganism was sub-cultured on plates of
potato-dextrose agar (PDA) from a live pure culture obtained from CABI. PDA plates
containing the cultures were incubated at 25o±2oC in darkness for 30 days to promote
sporulation (Ryley 1989).
127
5.2.3 Growth chamber experiment
A screening experiment for resistant fenugreek was done in a growth chamber at
the Lethbridge Research Centre, Lethbridge, Alberta. The temperature in the growth
chamber was maintained at 23o±2oC with a 16/8 h day/night photoperiod cycle (Sillero et
al. 2006). To find an effective spore concentration for use in a spray solution, one Indian
origin and one Iranian origin fenugreek genotype were inoculated separately with 0.5×10⁴
spores/ml, 1×10⁴ spores/ml and 1.5×10⁴ spores/ml. The number of conidia in the spray
suspension was estimated using a hemocytometer (Reddy and Singh 1987). A conidial
concentration in the spray suspension of 1×10⁴ spores/ml was effective at producing
symptoms of infection in developing fenugreek plants.
A total of 53 fenugreek accessions were evaluated for cercospora leaf spot
development. Among the 53 genotypes, 5 genotypes showed very poor germination
ability repeatedly, and for this reason they were removed from the experiment. For each
genotype, four plants were inoculated with Cercospora traversiana and four plants were
kept as controls. The disease severity in each fenugreek genotype was measured by
comparing treated plants with control plants of the same genotype. Inoculations with the
microorganism, Cercospora traversiana, were done on seedlings to monitor symptom
development. The inoculation was done by spraying a conidial suspension on 21-day old
fenugreek seedlings. Inoculums were prepared from 30-day old fungal colonies growing
on PDA plates kept at 25o±2oC in darkness. Sterile distilled water (5 ml) was added to
each plate and conidia were removed by brushing the colony's surface with a fine camel
hair brush. The suspension was filtered through double layers of cheese cloth and then
adjusted to 1×10⁴ spores/ml (Ryley 1989).
128
Temperature and relative humidity were critical factors in controlled inoculations
(Tivoli et al. 2006). For cercospora leaf spot of fenugreek, it has been reported that high
temperature and a high level of relative humidity is critical for development of the
disease (Acharya et al. 2010a, Petropoulos 2002, Ryley 1989). To maintain a high
relative humidity for successful infection, a "mini-dome technique" developed by Chen
and Muehlbauer (2003) was applied. After inoculating 21-day old seedlings by spraying
with a conidia suspension until run-off from the sprayed plants was observed, the
seedlings were immediately covered with inverted translucent polythene bags to form
mini-domes. The plastic bags were removed after 5 days.
Disease development was evaluated after 10 days post inoculation with
Cercospora traversiana. Infection by Cercospora traversiana were scored in these
artificially infected trials as the % of affected leaves on the inoculated plants. Cercospora
traversiana infection is able to generate high levels of leaf infection on susceptible
fenugreek plants and so it is relatively easy to see. Objective scores based on % infected
leaves can be done rapidly and are reproducible (Sillero et al. 2006). The percentage of
leaves affected by cercospora leaf spot were assessed visually on a 0 (highly resistant) to
5 (highly susceptible) scale (Iqbal et al. 2011). The scale was 0 = 0% plant leaves
affected (highly resistant), 1 = 1-15% plant leaves affected (resistant), 2 = 16-40% plant
leaves affected (moderately resistant), 3 = 41-65% plant leaves affected (moderately
susceptible), 4 = 66-90% plant leaves affected (susceptible) and 5 = 91-100% plant
leaves affected (susceptible). Visual assessment of disease severity on a given plant can
be different depending on the evaluator, as each evaluator has a subjective perception of
the percent plant leaves affected by the disease. To overcome this, two persons
129
individually rated disease severity and the average of these two ratings were used as a
final disease score for use in the study. This 0-5 point scale has been used for evaluation
of mungbean germplasm against Mungbean yellow Mosaic Virus (Iqbal et al. 2011;
Khattak et al. 2008), chickpea genotypes against Ascochyta blight (Reddy et al. 1984),
resistance of pea genotypes against powdery mildew and downy mildew (Falloon et al.
1995), resistance of mulberry germplasm against powdery mildew (Chattopadhyay et al.
2010) and resistance of lentil germplasm against anthracnose (Buchwaldt et al. 2003).
The 12 top genotypes exhibiting cercospora leaf spot resistance and 3 susceptible
genotypes revealed by primary disease trials were taken for the final disease trials. The
five Canadian adapted genotypes (Amber, Tristar, F70, F80 and F86) were also added in
the final disease trials. However, variability in disease expression occurred from plant to
plant of the same genotype in the primary disease trials, even though great care was taken
to reproduce all procedures. Thus, in the final disease trial sufficient replication was used
to distinguish levels of resistance among genotypes. In the final trial, eight plants were
inoculated with Cercospora traversiana and eight plants were kept as controls for each
genotype. The inoculation and disease severity rating process were the same as those
used in the primary disease trial. Analysis of variance was performed on the disease
scores gathered from the eight treated plants from each genotype using PROC MIXED
(SAS Institute, Cary, NC). The data were subjected to Square Root Transformation
before ANOVA was done on the data. Treatment mean comparisons were made using
Tukey’s Honestly Significant Difference test.
The plants in both categories (treated and control) were allowed to grow and
mature after a disease severity rating was assigned and used to evaluate disease reaction
130
for selected agronomic traits. Data on plant height, number of pods/plant, seed
weight/plant and biomass weight/plant were observed from treated and control plants for
each genotype. These data were subjected to ANOVA using PROC MIXED (SAS
Institute, Cary, NC).
5.2.4 Evaluation of seed-borne nature of Cercospora traversiana
Fenugreek seeds from diseased pods of diseased plants were collected. The
disease affected seeds were taken to evaluate the seed-borne nature of the microorganism.
Five seeds were dipped separately in 95% ethanol for 40 seconds and then washed in two
changes of sterile distilled water (Ryley 1989). These seeds were then partly submerged
in separate PDA plates; the PDA plates were sealed with parafilm and kept at 25o±2oC in
darkness for 10 days. The same procedure was repeated three times during three
consecutive weeks.
5.2.5 Morphology of Cercospora traversiana
The pathogen Cercospora traversiana that grew on infected fenugreek leaves was
checked with a compound microscope. Then, the shape and structure of the
microorganism was evaluated under an electron microscope (HITACHI S-3400N).
Scanning Electron Microscopy (SEM) images were taken to measure the size of the
conidia, conidiophores and mycelia of Cercospora traversiana. Fifteen randomly
selected SEM images were used to measure these structures.
131
5.3 Results
Spraying of different fenugreek genotypes with a concentration of 1×10⁴
spores/ml of Cercospora traversiana was effective to develop disease symptoms of the
fungus on the fenugreek plants. To confirm that the microorganism extracted from
diseased fenugreek leaves were Cercospora traversiana, spores were cultured on PDA
plates, then used to inoculate healthy fenugreek plants, and the disease symptoms
developed on those plants were compared with the disease symptoms developed on plants
that the microorganism was extracted from previously. Disease symptoms were similar in
these two groups of plants, and the microorganism culture was also same as the
microorganism culture of Cercospora traversiana that was obtained from CAB
International (CABI), United Kingdom, confirming infection by Cercospora traversiana.
In general, disease symptoms appeared within 10 days on fenugreek plants
inoculated with conidial suspensions. Cercospora leaf lesions initially presented as
circular, sunken spots that were bleached in color, with narrow (1–2 mm) chlorotic halos
on the surface of the leaves. These lesions tended to elongate rapidly as the infection
progressed, producing gray necrotic areas on the leaves. The necrotic areas were sharply
defined, often surrounded by a characteristic yellowish halo. Lesion size was increased
significantly on mature leaves, where sporulations were frequently evident with the
appearance of a whitish, velvet-like layer. The development of more than one spot was
followed rapidly by yellowing and withering of the leaves. Severely infected plants were
found to have only a few leaves situated towards the apex of the plant, or no leaves at all.
Stem and seed pod infections were also observed. Sunken and bleached lesions were
observed on stems and petioles. In severely infected plants, the main stem became yellow
132
and secondary branches were found to dry up. Disease symptoms on pods included
discoloration of infected areas, and severely infected areas on pods were shrunken and
twisted.
Evaluation of the fenugreek accessions were done under controlled growth
chamber conditions using a 0 to 5 point scoring scale based on visual judgment of the
disease severity. Scoring scales based on visual judgment of disease severity have been
successfully used in many plant species including leguminous plants for evaluation of
resistance against many pathogenic organisms. The results of this study revealed that
there was great variation among genotypes. All of the genotypes were categorized into
six classes based upon disease severity. None of the genotypes tested was found to be
highly resistant against Cercospora traversiana. Among the fenugreek accessions
evaluated in this study, 4.16% genotypes were found to be resistant, 14.58% were
moderately resistant, 41.66% were moderately susceptible, 37.50% were susceptible, and
2.08% genotypes were highly susceptible to Cercospora traversiana (Appendix II.).
After primary screening, 20 genotypes from the 53 initial genotypes tested were
subjected to a final disease resistance screening against Cercospora traversiana in a
growth chamber. These 20 genotypes included the most resistant genotypes from the
priliminary disease screening test, a few susceptible genotypes from the priliminary
disease screening test, and a few locally adapted genotypes. The statistical analysis
showed that the genotypes differed significantly (at p ≤ 0.01) from each other for disease
severity to Cercospora traversiana. The final disease screening result showed that the
accessions L3717 and PI138687 were less affected by the pathogen and were categorized
as resistant among the accessions tested (Table 5.2). The accession L3721 (categorized as
133
highly susceptible) was found to be severely affected by Cercospora traversiana,
followed by the susceptible accessions L3699, L3704,L3312, L3697, L3700, and L3705
(Table 5.2). Among the locally adapted genotypes, F86 performed better against
Cercospora traversiana and was placed in a moderately resistant category with the
L3698 fenugreek accession.
134
Table 5.1. Results of the ANOVA for disease severity of twenty fenugreek accessions
used in final disease screening test.
Disease Severity
Source of variation
DF
Mean Square
Accession
19
6.018421**
Residual
140
0.405357
10.05
Coefficient of variation (%)
** Denotes significance at p ≤ 0.01.
135
Table 5.2. Mean disease severity of 20 fenugreek genotypes used in final disease
screening trial using Cercospora traversiana inoculum.
Accession
Disease severity
Resistant category
Amber
2.625def
Moderately susceptible
F70
2.625def
Moderately susceptible
F80
3.250bcdef
Moderately susceptible
F86
2.250fgh
Moderately resistant
L3312
3.875abc
Susceptible
L3693
3.250bcdef
Moderately susceptible
L3697
3.875abc
Susceptible
L3698
2.500efg
Moderately resistant
L3699
4.000ab
Susceptible
L3700
3.875abc
Susceptible
L3704
4.000ab
Susceptible
L3705
3.750abcd
Susceptible
L3707
3.250bcdef
Moderately susceptible
L3713
3.500abcde
Moderately susceptible
L3716
3.500abcde
Moderately susceptible
L3717
1.250h
Resistant
L3720
3.500abced
Moderately susceptible
L3721
4.500a
Highly susceptible
PI138687
1.375gh
Resistant
Tristar
2.750cdef
Moderately susceptible
Means sharing different superscripts are significantly different from each other (Tukey’s
Honestly Significant Difference (HSD) at p < 0.05).
136
To assess disease response for the plants, plant height, pod number per plant, seed
weight per plant, and dry biomass weight per plant was measured for the 20 fenugreek
accessions included in the second test. For the purpose each accession treated with
Cercospora traversiana and their non-infected counterparts were utilized to find out the
percent loss for the traits due to pathogenic infestation. Statistical analysis showed that
the accessions were significantly (p ≤ 0.01) different from each other (Table 5.3). The
effect of treatment with Cercospora traversiana was significantly (p ≤ 0.01) different
from the control. The interaction effect of accession and treatment was also found
statistically significant (at p ≤ 0.01).
137
Table 5.3. Effect of Cercospora traversiana treatment, accession and their interaction
on plant height, pod number per plant, seed weight per plant and dry biomass
weight per plant observed on 20 fenugreek genotypes as determined by ANOVA.
Source of variation
Mean Square
DF
Height (cm)
Pod number
Seed weight
(g)
Dry biomass
weight (g)
Accession
19
52.65**
445.42**
3.26**
31.33**
Treatment
1
3165.76**
33636.00**
338.62**
2328.14**
Accession×Treatment
19
37.78**
221.80**
1.62**
2.53**
Replication
7
5.18
35.62
0.62
1.85
7.49
15.51
19.25
10.72
CV (%)
** Denotes significance at p ≤ 0.01.
138
The results for the disease effects on plant height, pod number per plant, seed
weight per plant, and biomass weight per plant revealed that these agronomic traits were
influenced by Cercospora traversiana infestation. For plant height, a reduction of 0.8%
to 63.8% occured as a result of cercospora leaf spot disease (Table 5.4). The accessions
L3717 and PI138687 were found to be less affected by the pathogen for this trait,
whereas L3700 was found to be the most affected genotype followed by L3697 and
L3721. A range of 22.1% to 100.0% pod loss was observed among the fenugreek
accessions due to cercospora disease (Table 5.4). The accession L3717 and PI138687
performed well for this trait under disease pressure, followed by accession L3698. The
accessions L3697 and L3721 were affected most by the pathogen and produced no pods
at all. For seed weight per plant, a 30.3% to 100.0% loss was observed due to cercospora
leaf spot disease (Table 5.4). The accessions PI138687, L3698 and L3717 were found to
be the least affected genotypes, whereas L3697 and L3721 were most affected genotypes
followed by L3700. For biomass weight per plant, a 8.9% to 90.5% loss was observed
due to cercospora leaf spot disease (Table 4). The accessions PI138687 and L3717
performed well for this trait, whereas L3697 and L3700 were found to be the most
affected genotypes followed by L3721.
139
Table 5.4. Mean performance of 20 fenugreek genotypes used in the second disease
trial and percentage loss due to Cercospora traversiana treatment as compared to
untreated control for each genotype (in parenthesis).
Genotyp
Height (cm)
(73.9)
12.50bcd
F70
abcd
32.63
(73.9)
bc
14.88
F80
24.76def
(59.8)
F86
34.62abcd
L3312
29.94bcde
Amber
L3693
33.35abcd
Pod number
def
25.19
Seed yield (g)
(34.4)
5.13abcd
(64.3)
(52.6)
bcde
0.73
(23.3)
abcde
5.51
(64.4)
7.00cde
(22.1)
0.34cdef
(11.6)
3.39cdef
(40.7)
(73.6)
12.75bcd
(25.5)
0.81bcd
(29.3)
5.63abcd
(62.1)
(66.7)
1.50e
(5.5)
0.12f
(4.2)
1.74f
(17.9)
(55.6)
e
3.50
(19.6)
0.27
(10.4)
(44.1)
0.91bc
Biomass weight (g)
def
cdef
3.03
(32.8)
L3697
15.64f
(37.5)
0.0e
(0.0)
0.0f
(0.0)
0.79f
(9.5)
L3698
41.50abc
(87.4)
18.86ab
(70.9)
1.97a
(68.8)
8.18a
(65.4)
L3699
def
f
23.39
(51.8)
e
0.50
(1.0)
f
0.03
(0.8)
1.24
(12.4)
L3700
15.84f
(36.2)
0.88e
(3.4)
0.11f
(5.5)
0.90f
(9.5)
L3704
27.76def
(61.2)
2.50e
(8.5)
0.09f
(3.2)
2.53ef
(24.1)
L3705
28.80cde
(74.6)
4.13e
(16.0)
0.30def
(1.3)
3.23cdef
(36.4)
L3707
abcd
33.55
(65.7)
cde
7.13
(22.7)
cdef
(17.7)
bcde
4.99
(48.8)
L3713
26.06def
(57.4)
4.88de
(16.6)
0.23ef
(9.7)
3.41cdef
(34.7)
L3716
27.55def
(57.9)
1.34e
(6.1)
0.19ef
(8.2)
2.76def
(31.4)
ab
a
a
0.47
a
L3717
44.93
(99.2)
24.36
(77.9)
1.88
(68.1)
8.01
(85.7)
L3720
28.29def
(54.7)
3.63e
(11.4)
0.29def
(11.1)
3.12cdef
(31.9)
L3721
18.69ef
(40.6)
0.0e
(0.0)
0.0f
(0.0)
0.81f
(10.2)
PI138687
42.74ab
(96.0)
24.63a
(71.6)
1.83a
(69.7)
7.53ab
(91.1)
(71.1)
ab
(52.1)
b
(31.5)
a
(63.8)
Tristar
bcd
31.85
17.50
1.14
5.94
Means with different superscripts within the same column were significantly different
from each other (Tukey’s Honestly Significant Difference (HSD) at p < 0.05).
140
Fenugreek seeds collected from diseased plants were used to evaluate the seedborne nature of the microorganism. Cercospora traversiana colonies were recovered
from all contaminated seeds, confirming the seed-borne nature of the pathogen. In this
study, the Cercospora traversiana colonies were seen as cottony white and slightly raised
on the upper side of the colony, and the underside of the colonies was olivaceous black
with narrow sectors of pale olivaceous grey. The colonies were circular, 46±4 mm in
diameter, with irregular margins. The fungal growth on the diseased leaves is shown in
Figure 5.1. Conidiophores of Cercospora traversiana were dark, paler towards the tip,
unbranched, and rarely geniculate or septate. These conidiophores developed in fascicles
of 3 to 12 conidiophores per fascicle, with a length ranging from 17.6 to 28.8 µm and a
width ranging from 1.78 to 3.01 µm (Figure 5.2). The conidia were hyaline, acicular,
straight or slightly curved, with a rounded apex, a truncate base and multicellular, with a
length ranging from 2.3 to 2.8 µm and a width ranging from 1.2 to 1.9 µm.
141
A
B
Figure 5.1. Cercospora traversiana fungal structures on diseased fenugreek leaves (A
and B) under a compound microscope.
142
A
B
Figure 5.2. Scanning Electron Micrograph (SEM) of Cercospora traversiana fungal
structures on diseased fenugreek leaves showing conidiophores and conidia (A and
B) under an electron microscope (magnification at 1.3×10³x).
143
5.4 Discussion
Screening of fenugreek genotypes for Cercospora traversiana resistance was
carried out under controlled conditions in a growth chamber. The pathogen Cercospora
traversiana is considered as an exotic microorganism in Canada; consequently, the study
could not be carried out under field conditions. However, screening of plant genotypes
for disease resistance within controlled environment has certain advantages over
screening in the field. Screening within a controlled environment allowed effective
control of environmental conditions and let large scale screening, especially during
periods when environmental conditions in the field were not conducive for disease
development and during an early stage of breeding program (Sillero et al. 2006). Testing
under controlled conditions allowed epidemiological factors to be observed in a detailed
manner that may otherwise be affected by other biotic or abiotic stresses under field
conditions. Moreover, growth chamber experiments were more suitable than field
assessments to measure inherent resistance levels, that were highly correlated to genetic
resistance alleles, whereas field assessments measure these genetic effects along with
strong interactions of these effects with environmental conditions (Tivoli et al. 2006).
Disease symptoms were successfully produced on fenugreek plants by
contaminating the plants with Cercospora traversiana spore solutions. It was confirmed
that the disease symptoms were due to infection by only one pathogen, Cercospora
traversiana. Moreover, the disease symptoms that were observed on fenugreek plants in
this study were similar to the disease symptoms caused by Cercospora traversiana on
fenugreek reported in other studies (Acharya et al. 2010a; Bobev et al. 1999; Ryley 1989;
Zimmer 1984).
144
Screening of fenugreek genotypes for Cercospora traversiana resistance was
carried out under controlled conditions in a growth chamber. The pathogen Cercospora
traversiana is considered as an exotic microorganism in Canada; consequently, the study
could not be carried out under field conditions. However, screening of plant genotypes
for disease resistance within controlled environment has certain advantages over
screening in the field. Screening within a controlled environment allowed effective
control of environmental conditions and let large scale screening, especially during
periods when environmental conditions in the field were not conducive for disease
development and during an early stage of breeding program (Tivoli 2006). Screening of
fenugreek genotypes for Cercospora traversiana resistance was carried out under
controlled conditions in a growth chamber. The pathogen Cercospora traversiana is
considered as an exotic microorganism in Canada; consequently, the study could not be
carried out under field conditions. However, screening of plant genotypes for disease
resistance within controlled environment has certain advantages over screening in the
field. Screening within a controlled environment allowed effective control of
environmental conditions and let large scale screening, especially during periods when
environmental conditions in the field were not conducive for disease development and
during an early stage of breeding program (Parlevliet, 1979). In legume crops, partial
resistance rather than complete resistance against fungal disease is a common
phenomenon. In lentil and lupin only partial resistance to anthracnose was reported
(Tivoli et al. 2006; Yang et al. 2004; Buchwaldt et al. 2003; Bernier et al. 1992), whereas
in pea and chickpea partial resistance against ascochyta blight was reported (Tivoli et al.
2006; Yang et al. 2004; Buchwaldt et al. 2003; Bernier et al. 1992), whereas in pea and
145
chickpea only partial resistance against ascochyta blight have been reported (Kraft et al.
1998; Tivoli and Onfroy 1997; Malhotra et al. 1996; Knappe and Hoppe 1995).
Qualitative resistance is usually monogenic in nature, typically inherited in a simple
Mendelian fashion in the host plants, whereas quantitative resistance is based on the
assumption that there is multiple gene control that collectively confers divergent levels
of resistance (Chattopadhyay et al. 2010). The resistance levels found in the fenugreek
accessions were either due to a qualitative resistance response or due to a quantitative
resistance response, and is yet to be determined.
The results show that the fenugreek world accessions tested varied greatly in their
reaction to Cercospora traversiana for the agronomic traits tested. Both resistant and
susceptible genotypes to the pathogen were identified; the resistant genotypes were
affected at a minimal level. Among the locally adapted genotypes, some interesting
observations were made for Amber, F70 and Tristar. Although they showed moderate
susceptibility to Cercospora traversiana, in general, they overcame the disease stress
towards maturity, and performed relatively well in comparison to other genotypes as was
observed earlier (Ryley 1989).
This study confirmed the seed-borne nature of the Cercospora traversiana that
has been reported in other studies (Elwakil and Ghoneem 2002; Ryley 1989; Zimmer
1984). The morphology and shapes of different structures of the fungus reported in this
study also was found to be in agreement with former studies (Ryley 1989; Zimmer 1984;
Leppik 1960), although the size of the conidia and conidiophore differed from that
reported in the earlier studies. The size of these structures was variable among the
previous studies. Ryley (1989) suggested that the culture environment and nature of the
146
substrate used to grow the pathogen on might influence these characteristics. although the
size of the conidia and conidiophore differed from that reported in the earlier studies. The
size of these structures was variable among the previous studies.
This study was carried out to identify resistant fenugreek genotypes against
cercospora leaf spot disease. The study identified some resistant genotypes along with
some moderately resistant genotypes, which may be useful in breeding programs aiming
to develop Cercospora traversiana resistant cultivars. Management through chemicals
(pesticides) can reduce disease incidence to some extent, but continuous use of these
chemicals also can create a hazardous impact on the surrounding environment and on
animal health when grown as a forage crop. So, identification of plant genotypes having
disease resistance can serve as an economical and practical approach to reduce disease
severity and can take a prominent place in fenugreek improvement programs. In this
study, disease symptoms, disease effect on some important plant traits, and morphology
of the pathogen are characterized which may serve as a reference for future studies
regarding fenugreek and its reaction to Cercospora traversiana.
147
Chapter Six: Thesis Summary
Fenugreek (Trigonella foenum-graecum L.) is traditionally used as a spice and
forage crop in parts of Asia, Europe, Africa, North and South America and Australia.
This crop is now being cultivated as an annual forage legume crop and spice crop in
western Canada. Currently five fenugreek cultivars are being cultivated in Canada.
“Tristar”, developed by Agriculture and Agri-Food Canada, Lethbridge, is the most
recent cultivar developed among the five and, was the first fenugreek cultivar developed
for forage use. It is well adapted to semi-arid prairie regions of western Canada and can
produce a high biomass yield. However, the released cultivars and adapted fenugreek
germplasm are unable to support consistent high quality seed production in temperate
climate of this region. As a crop originating from tropical regions, fenugreek is reported
to mature in 130-140 days under tropical climate conditions. Although “Tristar” is a good
cultivar for its use as forage, it does not produce a high quality and quantity of seeds
every year due to an indeterminate growth habit and/or long maturity duration. “Tristar”
takes about 120 days to produce high quality mature seed in western Canada where only
about 100 frost free days are normally available for crop production. Extensive use of
fenugreek requires a solution to the seed production problem in this crop which we
believe can be achieved through development of early maturing cultivars. The germplasm
at hand does not have the necessary variability for selecting out early maturing types and
so creation of variability in the fenugreek population for seed yield and other seed yield
contributing traits including early maturity and a determinate growth habit has become
the primary objective of the fenugreek improvement program. Without enough variability
and successive judicial selection, development of suitable cultivar(s) with high seed yield
148
and quality under prairie conditions will not be possible.
For the present dissertation, research was conducted with the primary objective of
improving seed yield and quality of fenugreek grown in western Canada using a mutation
breeding approach that is known to work well with this diploid and self pollinated crop.
A summary of the experiments performed is described in following pages, along with
some suggestions for future research.
Mutation breeding using Tristar fenugreek was attempted in the past. The current
study used five western Canada adapted genotypes (Amber, F70, F80, F86 and Tristar) as
base populations which were treated with the mutagen, EMS to generate additional
variability. These mutant populations could then be used for selection of high seed yield
and quality fenugreek genotypes. The idea behind using more than one genotype was to
ensure development of a much more diverse group of mutant plants with a range of
genetic backgrounds. This approach should facilitate development of new fenugreek
cultivars faster than an approach using only a single genotype as the base population.
Mutant generations of the plants were advanced from an M 1 to an M 3 generation. The
present study indicates that mutagenesis using EMS was able to generate a large amount
of variability in each fenugreek group used as a base population and many mutant plants
showed important traits such as presence of an apical flower (determinate growth habit),
double pods and multiple basal stalks, that were rare among the original base populations.
Performance of M 2 plants was observed under field conditions so that poor performing
phenotypes or plants carrying deleterious alleles could be eliminated quickly. Use of
natural selection under field conditions in the M 2 generation produced the changes in
mean values observed for traits such as seed yield, biomass yield, plant height, number of
149
pods and number of double pods in every mutant group in the M 3 generation. The
selection process resulted in a decrease in the percentage of poor performing plants and
an increase in the percentage of better performing plants for traits observed in the M 3
generation. Positive changes in mean values for the traits evaluated, along with
advancement of generations indicated an increase in stability levels for these traits.
Although EMS treatment severely affected germinability of seed in the M 1 generation,
the germination percentages for each group increased gradually with the advancement of
the mutant generations. Therefore, mutation breeding was found to be an appropriate and
valuable method for fenugreek improvement.
The mutant population generated in this study, needs to be advanced and tested in
multi-location trials in coming years to determine its performance under a wide range of
growing conditions. Continued selection in successive generations for desirable
characters is expected to further stabilize the selected characters in later generations.
Further studies should be undertaken in the future to determine if there are any changes in
traits affecting chemical constitution and oil content of the treated plants due to
pleiotropic effects of the mutations.
In a previous mutation study using Tristar as the base population mutant
generations (M 3 to M 6 ) were evaluated. In the present study, a multi-environment trial
was done to observe seed yield and biomass yield on a whole plot basis and mutant
generation was advanced to an M 7 generation. The plots were harvested to get a general
idea about performance of the fenugreek mutant generations (M 3 to M 6 ) relative to
different environments. In the mutant generations M 3 to M 7 , randomly picked plants (an
150
unbiased sample) were observed for a number of agronomic traits (seed yield, biomass
yield, plant height, number of pods, number of double pods and number of basal stalks).
Analysis of whole plot harvest data indicated that the effect of environment was
significant for seed yield and biomass yield. Although the generation effect was not
significant for whole plot harvest, high estimated CV values for these traits indicated
presence of ample variation within the mutant generation for selection of seed yield and
biomass yield. Multi-environment trials conducted in southern Alberta and in interior
British Colombia indicated that seed yield of fenugreek favours rain-fed growing
conditions in western Canada, but that biomass production can be increased by
application of minimal irrigation in dry areas.
Significant differences were observed for seed and dry matter yield when data
from randomly sampled individual plants rather than whole plot harvest data were
considered. In this study, mutant generations were found to have a significant effect on
plant height, pod number, seed weight, dry biomass and basal stalk number when
observations were made on randomly picked individual plants. For all of the traits studied
except for double pods/plant and dry biomass/plant, different mutant generations
represented different mean groups from the base population Tristar. This suggests
presence of variability for the traits examined in the mutant generations and thus scope
for effective selection for these traits in each mutant generation.
A significant shift in mean values in a positive direction was observed for
quantitative traits such as pods/plant, seed weight/plant and basal stalks/plant. It was
interesting to note that the highest means for these traits were obtained in the most
151
advanced generations. This indicates that the advanced generations harboured plants with
desired traits in higher frequencies than earlier generations. The other important
observation is that the lowest mean differences between two successive mutant
generations for the traits examined were noticed among M 6 and M 7 plants, indicating an
increase in trait stability in the advanced generations.
Correlation coefficients calculated among select agronomic traits indicated a
strong significant positive correlation among seed yield, number of pods and number of
basal stalks. Plant height was positively correlated with biomass yield, but was negatively
correlated with seed yield and its components such as number of pods and number of
basal stalks. This negative correlation confirms our contention that reduction in plant
height (a measure of indeterminate growth habit) may have a positive impact on
fenugreek seed yield.
The mutant generations should be advanced in future years to further stabilize the
desired characters, and plants with desired traits should be selected simultaneously to
generate advanced lines. These lines should then be evaluated in multiple environments
to select suitable cultivars for western Canada. The data collected on individual plants in
this study will be helpful in selecting high and stable seed yielding plants from the mutant
population for evaluation in multiple environments, and for development of new cultivars
for this region or for use as potential germplasm in breeding programs.
In an earlier study where genetic improvement of fenugreek was attempted by
using Tristar as a base population and EMS as a mutagen, mutant generations were
advanced to an M 5 generation. In the present study, individual plants were selected from
152
M 2 to M 5 generations. Seed from these selected plants were tested again under field
conditions for a number of quantitative traits such as seed yield, biomass yield, plant
height, number of pods, number of double pods and number of basal stalks. From this a
number of lines were identified that were superior for the above agronomically important
traits over the check variety Tristar. For seed yield, the lines LRCF0809, LRCF0805,
LRCF0804 and LRCF0821 were superior relative to the other lines tested, and ranked top
for seed yield plant-1, pod number plant-1, and basal stalk number plant-1. The mutant
lines LRCF0811, LRCF0809 and LRCF0806 were found superior over other lines for
biomass production, and ranked top for the characters dry biomass yield plant-1 and plant
height. Among all of the mutant lines evaluated, four showed early maturity. Fortunately,
two of the four lines were also the top most seed yielding lines (LRCF0809 and
LRCF0804). Such identification of high yielding early maturing lines may be useful in
producing stable fenugreek cultivars for use in western Canada. Another early maturing
mutant line LRCF0811 was among the top biomass yielding lines that may also be useful
as a future forage type fenugreek cultivar for development.
For successful utilization of these lines, progenies of these lines must be evaluated
in multi-environment trails to determine their adaptation. Selection among and within the
lines should also be done to produce a uniform population with a desired level of trait
expression. Performance of lines and their uniformity may be evaluated again in multienvironment trails for eventual release of new fenugreek cultivars with shorter maturity
duration and improved seed yield without sacrificing total biomass yield.
A study was also carried out to evaluate seed oil content and seed yield of a
tetraploid fenugreek line in comparison to diploid Tristar fenugreek in a multi153
environment trail. The seeds harvested from tetraploid plants grown over three
environments showed that the seed size for the tetraploid line was larger (by 24%) than
Tristar although seed yield for the tetraploid line was not statistically different from the
diploid Tristar. Seed of the tetraploid line were expected to have a higher oil content than
the diploid Tristar, but the oil content was not statistically different. In this case the
environment effect was significant for seed oil content and seed yield.
In this study only seed oil content of the tetraploid and diploid Tristar was
observed. It is possible that the other important seed constituents like protein, diosgenin,
isoleucine, and galactomannans may have changed in the seed along with the increase in
seed size. Future studies should be done to assess these components in seeds of this
tetraploid fenugreek line.
Fenugreek crops can be affected by many pathogenic fungi. Among the fungal
diseases of fenugreek, Cercospora leaf spot disease caused by Cercospora traversiana is
considered one of the most serious, destructive and widespread diseases. Although this
disease is not a yield limiting factor in Canada, it has the potential to inflict yield loss of
up to 80% in a year. As fenugreek acreage increases in Canada and in other countries
where this crop is introduced in recent years, the adverse effect of this disease will be
noticed. So, identification of resistant genotypes was considered an worthwhile objective
for the fenugreek improvement program. For this purpose, 53 fenugreek accessions were
evaluated under controlled growth chamber conditions against a virulent isolate of
Cercospora traversiana. None of the 53 accessions exhibited total immunity or complete
resistance. In this study, plants with 1-15% leaf affected due to disease was considered
resistant whereas plants with 16-40% leaf affected categorized as moderately resistant. It
154
was encouraging to note that some accessions exhibited partial resistance against this
pathogen. Among the lines tested accessions L3717 and PI138687 were less affected by
the pathogen and were categorized as resistant. Among the locally adapted lines, only
F86 showed moderate resistance to Cercospora traversiana.
Disease reactions for plant height, pod number per plant, seed weight per plant,
and dry biomass weight per plant were measured for 20 fenugreek accessions. The results
of the disease on these agronomic traits revealed that the traits were influenced by
Cercospora traversiana infestation. Although both resistant and susceptible genotypes
were affected by the pathogen the resistant genotypes were affected at a much lower level
compared to those considered susceptible. This study also confirmed the seed-borne
nature of Cercospora traversiana reported in other studies by culturing the pathogen
from surface sterilized infected seeds on PDA plates. This study has identified some
resistant genotypes along with some moderately resistant genotypes, which may be useful
in breeding programs aiming to develop Cercospora traversiana resistant cultivars.
In the future, more studies should be done to identify resistant fenugreek
genotypes among other world accessions. The nature of resistance and the number of
gene(s) conferring the resistance against Cercospora traversiana are yet to be identified
and so future studies should aim at providing answers to these questions.
Fenugreek is a new crop to North America that is being recognized in western
Canada as having positive commercial, agricultural and environmental potential. It has
been commercially grown in Canada for only 19 years with the release of the first
fenugreek cultivar "Amber". Fenugreek is mainly grown for its forage and spice use in
155
western Canada. It can benefit the producer in a number of ways. As a legume crop it can
improve soil nutrient status by fixing atmospheric nitrogen and thus reduce the need for
expensive nitrogen fertilizers, consequently reducing cost of production for this crop and
the crop planted after this. This property and its annual nature makes fenugreek a useful
legume crop for incorporation into short term rotations. As a dry land adapted crop, its
water requirements are low; use of fenugreek will allow water saving which can be used
for other crops or for increasing the area under irrigation with the same volume of water.
Moreover, there is growing interest in marketing fenugreek as a natural health product
and functional food product in Canada. With accumulation of more experimental
evidence in support of the nutraceutical properties of fenugreek this can be achieved.
New fenugreek cultivars with stable seed yield and an early maturity trait adapted
to the western Canadian climate could prove to be a big boost to forage, spice and
functional food markets in Canada and elsewhere. New cultivars of fenugreek with
improved seed yield and enhanced levels of chemical constituents can be developed for
improving efficiency of its use both for cattle and humans. The variability that was
produced in fenugreek through mutation breeding in this study and in earlier studies from
this program may be used for production of new and improved cultivars or as a good
germplasm source for improvement of fenugreek with desired trait(s) in Canada and other
parts of the world.
156
References
Abdelgani, M.E., Elsheikh, E.A.E. and Mukhtar, N.O. 1999. The effect of Rhizobium
inoculation and chemical fertilization on seed quality of fenugreek. Food Chem.
64(3): 289-293.
Abdelmoumen, H. and Idrissi, M. M. E. 2009. Germination, growth and nodulation of
Trigonella foenum graecum (Fenu Greek) under salt stress. African. J. Biotechnol.
8 (11): 2489-2496.
Acharya S, Srichamroen A, Basu S, Ooraikul B, Basu, T. 2006. Improvement in the
nutraceutical properties of fenugreek (Trigonella foenum-graecum L.). Songk. J.
Sci. Tech. 28(1): 1-9.
Acharya, S. N., Thomas, J. E., Prasad, R. and Basu, S. K. 2010a. Diseases of fenugreek
(Trigonella foenum-graecum L.) and control measures with special emphasis on
fungal diseases. In Arya, A. P. and Perelló, A. E. (edited) Management of fungal
pathogens: Current trends and progress. CABI, Nosworthy Way, Wallingford,
Oxon, UK. Chapter 19. pp. 245-262.
Acharya, S.N. and Thomas, J.E. 2007. Advances in medical plant research (edited).
Research Signpost, Kerala, India. pp. 1-513.
Acharya, S.N., Basu, S.K. Acharya, K., Paul, S., Datta Banik, S. and Prasad, R. 2011.
Fenugreek: A spice, forage and nutraceutical crop. In De. A. K. (edited) Spices:
The elixir of life. Originals, New Delhi, India. Chapter 7. pp. 129-150.
Acharya, S.N., Basu, S.K. and Thomas, J.E. 2007. Medicinal properties of fenugreek
(Trigonella foenum-graecum L.): a review of the evidence based information. In
Acharya, S.N. and Thomas, J.E. (edited) Advances in Medical Plant Research,
Research Signpost, Kerala, India. pp. 81-122.
Acharya, S.N., Basu, S.K., Datta Banik, S. and Prasad, R. 2010b. Genotype X
environment interactions and its impact on use of medicinal plants. The Open
Nutra. J. 3: 47-54.
Acharya, S.N., Thomas, J.E., and Basu, S.K. 2004. Fenugreek: An annual forage legume
and its role in preservation of water quality and conservation of water. In Proc.
Ann. Workshop for the Oldman River Basin Water Quality Initiative, 7th, 2 Mar.
2004. Lethbridge, AB, Canada.
157
Acharya, S.N., Thomas, J.E., and Basu, S.K. 2008. Fenugreek, an alternative crop for
semiarid regions of North America. Crop Sci. 48(3): 841-853.
Adekola, O.F. and Oluleye, F. 2007. Influence of mutation induction on the chemical
composition of cowpea Vigna unguiculata (L.) Walp. African J. Biotechnol.
6(18): 2143-2146.
Ahmed, M.A., Hussein, M.S., and El-Sherebeny, S. 1989. Yield analysis of fenugreek
plants. African J. Agri. Sci. 16: 163-171.
Alberta Agriculture, Food and Rural Development (AAFRD). 1998. Fenugreek. agri~fax.
Agdex. 147/20-5.
Alemu, A.W. and Doepel, L. 2011. Fenugreek (Trigonella foenum-graecum L.) as an
alternative forage for dairy cows. Animal. 5: 1370-1381.
Al-Habori, M. and Raman, A. 2002. Pharmacological properties in Fenugreek. In
Petropoulos, G.A. (edited) Fenugreek –The genus Trigonella. Taylor and Francis,
London and New York. pp 163-182.
Ali F.J.A., Arain, M.A. and Shaikh, N.A. 2010. Genetic manipulation of lentil through
induced mutations. Pak . J. Bot. 42(5): 3449-3455.
Ali, F.J.A. and Shaikh, N.A. 2007. Genetic exploitation of lentil through induced
mutations. Pak .J. Bot. 39(7):2379-2388.
Amin, A., Alkaabi, A., Al-Falasi, S. and Daoud, S.A. 2005. Chemopreventive activities
of Trigonella foenum-graecum (Fenugreek) against breast cancer. Cell Biol. Int.
29: 687–694.
Andersson, M.S., Peters, M., Schultze-Kraft, R., Franco, L.H. and Lascano, C.E. 2006.
Phenological, agronomic and forage quality diversity among germplasm
accessions of the tropical legume shrub Cratylia argentea. J. Agril. Sci. 144(3):
237-248.
Arora, R. N. and Lodhi, G. P. 1993. Genetic variability and heritability for grain yield
and its components of fenugreek. Ind. Cocoa Arecanut. Spi. J. 17: 6–8.
Arshad, M., Bakhsh, A., Zubair, M. and Ghafoor, A. 2003. Genetic variability and
correlation studies in chickpea (Cicer atietinum L.). Pak. J. Bot. 35(4): 605-611.
Ashfaq, M., Khan, M.A., Mughal, S.M., Javed, N., Mukhtar, T. and Bashir, M. 2007.
Evaluation of urdbean germplasm for resistance against urdbean leaf crinkle
158
virus. Pak. J. Bot. 39(6): 2103-2111.
Baricevic, D. and Zupancic, A. 2002. The impact of drought stress and/or nitrogen
fertilization in some medicinal plants. J. Herbs Spi. Med. Plants. 9: 53-64.
Basch, E., Ulbricht, C., Kuo, G., Szapary, P. and Smith, M. 2003.Therapeutic
applications of fenugreek. Alt. Med. Rev. 8:20-27.
Basu, S.K. 2006. Seed production technology for fenugreek (Trigonella foenumgraecum
L.) in the Canadian prairies. MSc, University of Lethbridge, Lethbridge, Alberta,
Canada.
Basu, S.K., Acharya, S.N., and Thomas, J.E. 2008. Genetic improvement of fenugreek
(Trigonella foenum-graecum L.) through EMS induced mutation breeding for
higher seed yield under western Canada prairie conditions. Euphytica 160: 249258.
Basu, S.K., Acharya, S.N., Bandara, M.S., Friebel, D.R., and Thomas, J.E. 2009. Effects
of genotype and environment on seed and forage yield in fenugreek (Trigonella
foenum-graecum L.) grown in western Canada. Aus. J. Crop S. 3: 305-314.
Baswana, K.S. and Pandita, M.L. 1989. Effect of Time of Sowing and Row Spacing on
Seed Yield of Fenugreek. Seed Res. 17:109-112.
Bawadi, H.A., Maghaydah, S.N. and Tayyem, R.F. 2009. The postprandial hypoglycemic
activity of fenugreek seed and seeds extract in type 2 diabetics: A plot study.
Pharmacogn. Mag., 4(18): 134-138.
Begum, T. and Dasgupta, T. 2010. A comparison of the effects of physical and chemical
mutagens in sesame (Sesamum indicum L.). Genet. Mol. Biol. 33(4): 761-766.
Berger, J.D., Turner, N.C., et al. 2004. Genotype by environment studies across Australia
reveal the importance of phenology for chickpea (Cicer arietinum L.)
improvement. Australian J. Agril. Res. 55: 1071-1084.
Bernier, C.C., Buchwaldt, L. and Morrall, R.A.A. 1992. Screening for resistance to
anthracnose in lentil (Lens culinaris). In: Proceedings of the 1st European
Conference on Grain Legumes, 1–3 June, Angers, France, pp. 37–38.
Berti, M.T., Schneiter, A.A. and Johnson, B.L. 1993.Agronomic evaluation of new crops
for North Dakota. In alternative crop production research report. North Dakota
State University, Fargo, ND.
159
Bhargava, L.P., Handa, D.K. and Mathur, B.N. 1976. Occurrence of Orobanche indica
on Trigonella foenum- graecum and Physalis minima. Plant Dis. Rep. 60: 871872.
Bhaskar, R.B.L. and Summanwar, A.S. 1982. Physical properties and host range of math
mosaic virus. Indian Phytopathol. 35: 688–689.
Bhatti, M.A., Khan, M.T.J., Ahmed, B., Jamshaid, M. and Ammad, W. 1996.
Antibacterial activity of Trigonella foenum-graecum seeds. Fitopterapia.
LXVII:372-374.
Bobev, S.G. Margina, A.F. and Gruytor, de J. 1999. First report of Cercospora
traversiana on Trigonella caerulea in Bulgaria. Plant Dis. 83: 783.
Bordia, A., Verma, S.K. and Srivastava, K.C. 1997. Effect of ginger (Zingiber officinale
Rosc.) and fenugreek (Trigonella foenumgraecum L.) on blood lipids, blood sugar
and platelet aggregation in patients with coronary artery disease. Prostaglandins
Leukot Essent Fatty Acids. 56, 379-384.
Bretag, T.W. and Cunnington, J.H. 2005. First report of black stem and leaf spot in
fenugreek (Trigonella foenum-graecum) caused by Phoma pinodella in Australia.
Australasian Plant Pathol. 34; 619–620.
Bretag, T.W. and Cunnington, J.H. 2005. First report of black stem and leaf spot in
fenugreek (Trigonella foenum-graecum) caused by Phoma pinodella in Australia.
Australasian Plant Pathol. 34; 619–620.
Broca, C., Manteghetti, M., Gross, R., Baissac, Y., Jacob, M., Petit, P., Sauvaire, Y. and
Ribes, G. 2000. 4-Hydroxyisoleucine: effects of synthetic and natural analogues
on insulin secretion. Eur. J. Pharmacol. 390: 339-345.
Brock, R.D. 1971. The role of induced mutations in plant improvement. Radiat. Bot. 11:
181-196.
Buchwaldt, L., Morrall, R.A.A., Chongo, G. and Bernier, C.C. 1996. Windborne
dispersal of Colletotrichum truncatum and survival in infested lentil debris.
Phytopathol. 86: 1193–1198.
Busbice, T.H., Hill, R.R.Jr. and Carnahan, H.L. (1975) Genetics and breeding
procedures. In C.H. Hanson (edited) Alfalfa Science and Technology. Amer. Soc.
Agron. Inc. Publ., Madison., Wi., USA. pp. 283–319.
160
Chandra, K., Sastry, E.V.D. and Singh, D. 2000. Genetic variation and character
association of seed yield and its component characters in fenugreek. Agril. Sci.
Digest. 20(2): 72-74.
Chatterjee, A., Shukla, S., Mishra, B.K., Rastogi, A. and Singh, S.P. 2011. induction of
variability through mutagenesis in opium poppy (Papaver somniferum L.). Turk.
J.Agric. For. 35: 1-11.
Chattopadhyay, S., Ali, K.A., et al. 2010 Evaluation of mulberry germplasm for
resistance to powdery mildew in the field and greenhouse. J. General Plant Pathol.
76:87-93.
Chen, W. and Muehlbauer, F.J. 2003. An improved technique for virulence assay of
Ascochyta rabiei on chickpea. Int Chickpea Pigeonpea Newslett. 10: 31–33.
Chopra, V.L. 2005. Mutagenesis: Investigating the process and processing the outcome
for crop improvement. Curr. Sci, 89: 353–359.
Ciftci, O.N. Przybylski, R., Rudzinska, M. and Acharya S. 2011. Characterization of
Fenugreek (Trigonella foenum-graecum) Seed Lipids. J. Am. Oil Chem. Soc.
88:1603–1610.
Cook, A.A. 1 978. Diseases of Tropical and Subtropical Vegetables and Other Plants.
Hafner Press: New York.
Cornish, M.A., Hardman, R. and Sadler, R.M. 1983. Hybridisation for genetic
improvement in the yield of diosgenin for fenugreek seeds. Planta Medica. 48:
149-152.
Dangi, R.S., Lagu, M.D., Choudhary, L.B., Ranjekar, P.K. and Gupta, V.S. 2004.
Assessment of genetic diversity in Trigonella foenum-graecum and Trigonella
caerulea using ISSR and RAPD markers. BMC Plant Biol. 4:13.
nd
Darlington, C.D. and Wylie, A.P. 1961. Chromosome Atlas of Flowering Plants. 2
Impression. George Allen and Unwin LTD., London, England.
De Candolle, A. 1964. Origin of cultivated plants. Hafner, New York.
Deepalakshmi, A.J. and Kuamr C.R.A. 2003. Efficiency and effectivness of physical and
chemichal mutagens in urdbean (Vigna mungo L. Happer). Madras. Agric. J. 90:
218-228.
Del’Gaudio, S. 1953. Ricerche sui consume idrici e indugini sull’ autofertilita del fieno g.
reco. Ann. Sper. Agr. 7:1273-1287.
161
Deora, N.S., Singh, J. and Reager, M.L. 2009. Studies on nutrient management and seed
rate on growth and herbage yield of fenugreek (Trigonella corniculata L.) cv.
Kasuri in Rajasthan. J. Spices Arom. Crops. 18(1): 19–21.
Detoroja, H.J., Sukhadia N.M. and Malavia, D.D.1995. Yield and nutrient uptake by
fenugreek (Trigonella foenum-graecum). Indian J. Agron. 40(1): 160-161.
Duke, J.A. 1981. Trigonella foenum-graecum L. In Handbook of legumes of world
economic importance. Plenum Press, New York. pp. 268-271.
Edison, S. 1995. Spices-Research support to productivity. In N. Ravi (ed.) The Hindu
survey of Indian agriculture, Kasturi and Sons Ltd., National Press, Madras.
pp.101-105.
Elwakil, M.A. and Ghoneem, K.M. 2002. An improved method of seed health testing for
detecting the lurked seed-borne fungi of Fenugreek. Pakistan J. Plant Pathol. 1:
11-13.
Evans, L.T. 1996. Crop Evolution, Adaptation and Yield. Cambridge University Press,
Cambridge. pp 1-486.
Evidente, A., Fernandez-Aparicio, M., Andolfi, A., Rubiales, D. and Motta, A. 2007.
Trigoxazonane, a monosubstituted trioxazonane by Trigonella foenumgraecum
root exudate, inhibiting agent of Orobanche crenata seed germination.
Phytochem. 68: 2487–2492.
Falloon, R.E., Viljanen-Rollinson, S.L.H., Coles, G.D. and Poff, J.D. 1995. Disease
severity keys for powdery and downy mildews of peas and powdery scab of
potatoes. New Zea. J. Crop Hort. Sci. 23: 31-37.
Fazli, F.R.Y. 1967. Studies in The Steroid Yielding Plant of The genus Trigonella PhD diss.,
University of Nottingham, UK.
Fazli, F.R.Y. 1967. Studies in The Steroid Yielding Plant of The genus Trigonella PhD diss.,
University of Nottingham, UK.
Fazli, F.R.Y. and Hardman, R. 1968. The spice fenugreek (Trigonella foenum-graecum
L.). Its commercial varieties of seed as a source of diosgenin. Trop. Sci. 10:66-78.
Fehr, W.R. 1987. Principles of Cultivar Development: Theory and Technique. Vol. I.
Macmillan Publishing Company, USA.
Fehr, W.R. 1993. Principles of Cultivar Development: Theory and Technique. Vol. II.
162
Macmillan Publishing Company, USA.
Fogg, M.L., Kobayashi D.Y., Johnston S.A. and Kline, W.L. 2000. Bacterial leaf spot of
fenugreek: A new disease in New Jersey caused by Pseudomonas syringae pv.
syringae. Publication No. P-2001-0012-NEA. In Northeastern Division Meeting
Abstracts, 1-3 Nov. 2000. Cape Cod, North Falmouth, MA, USA.
Fotopoulos C. 2002. Marketing. In Petropoulos, G.A. (edited) Fenugreek –The genus
Trigonella. Taylor and Francis, London and New York. pp. 183-195.
Furry, A. 1950. Les Cahiers de la Recherche Agronomique. 3: 25-317.
Ganapathy, S., Nirmalakumari, A., Senthil, N., Souframanie, J. and Raveendran, T.S.
2008. Isolation of macro mutations and Mutagenic effectiveness and efficiency in
little Millet Varieties. World. J. Agri. Sci. 4(4): 483-486.
Gangopadhyay, K.K., Yadav, S.K., Kumar, G., Meena, B.L., Mahajan, R.K. 2009.
Correlation, path-coefficient and genetic diversity pattern in fenugreek
(Trigonella foenum-graecum L.). Indian J. Agril. Sci. 79(7): 521-526.
Gaul, H. and Aastveit, K. 1966. Induced variability of culm length in different genotypes
of hexaploid wheat following X-irradiation and EMS treatment. Savrem. Poljopr.
11: 263-276.
Gill, B.S., Randhawa, G.S., and Saini, S.S. 2001. Effect of sowing date and herb-cutting
management on growth and yield of fenugreek (Trigonella foenum-graecum).
Indian J. Agron. 46(2):364-377.
Girija, M. and Dhanavel, D. 2009. Mutagenic effectiveness and efficiency of gamma
rays, ethyl methane sulphonate and their combined treatments in cowpea (Vigna
unguiculata L. Walp). Global J. Mol. Sci. 4: 68-75.
Goel, G., Makkar, H.P.S. and Becker, K. 2007. Effects of Sesbania sesban and Carduus
pycnocephalus leaves and Fenugreek (Trigonella foenum-graecum L.) seeds and
their extracts on partitioning of nutrients from roughage- and concentrate-based
feeds to methane. Animal Feed Sci. Technol. 147: 72-89.
Green, J.M., Sharma, D., Reddy, L.J., Saxena, K.B., Gupta, S.C., Jain, K.C., Reddy,
B.V.S. and Rao, M.R. 1981. Methodology and progress in the I.C.R.I.S.A.T.,
Pigeonpea Breeding Program. In Proceeding International Workshop on
163
Pigeonpeas, Patancheru, Dec., 1980.
Hagedorn, D.J. and Walker, J.C. 1949. Wisconsin pea streak. Phytopathol. 39:837–847.
Handa, T., K. Yamaguchi, Y. Sono and K. Yazawa, 2005. Effects of fenugreek seed
extract in obese mice fed a high fat diet. Biosci. Biotechnol. Biochem. Jun. 69:
1186-8.
Hardman, R. 1969. Pharmaceutical products from plant steroids. Trop. Sci. 11:196-222.
Harsh, J.H. 1985. The Canadian Encyclopedia. Hurtig Publishers, Edmonton. Vol. 1: 231
& 440 and Vol. 2: 999.
Hegger, E.F. 1989. Handbuch des Arznei- und gewiirzpflanzenbaues, 2. Repr., harri
Deutsch Verlag, Frankfurt/M.
Henikoff, S. and Comai, L. 2003. Single-nucleotide mutations for plant functional
genomics. Annu. Rev. Plant Physiol. Plant Mol. Biol. 54: 375–401.
Heywood, V.H. 1967. Plant Taxonomy – Studies in Biology No. 5. Edward Arnold Ltd.
Hibasami, H., Moteki, H., Ishikawa, K. et al. 2003. Protodioscin isolated from fenugreek
(Trigonella foenum graecum L.) induces cell death and morphological change
indicative of apoptosis in leukemic cell line H-60, but not in gastric cancer cell
line KATO III. Int. J. Mol. Med. 11: 23-6.
Hidvegi, M., El-Kady, A., Lasztity, R., Bekes, F. and Simon-Sarkadi, L. 1984.
Contribution to the nutritional characterization of fenugreek (Trigonella foenum
graecum L.). Acta. Alim. 13: 315-324.
Hu, S. 2005. Food plant of China. The Chinese University Press, Hong Kong. pp. 147151.
Huang, W.Z., and Liang, X. 2000. Determination of two flavone glycosides in the seeds
of Trigonella foenum-graecum L. from various production localities, J. of Plant
Res. and Environ. 9(4): 53-54.
Hutchinson, J. 1964 The genera of flowering plants, Vol. I. Clarendon Press, Oxford.
IAEA. 1977. Manual on mutation breeding. Second Edition. IAEA, Vienna. p. 288.
IAEA. 1991. Mutant varieties-data bank, IAEA database. MBNL 38: 16–21.
164
Inderjit-Dakshini, K.M.M. 1991. Investigations on some aspects of chemical ecology of
cogongrass, Imperata cylindrica (L.) Beauv. J. Chem. Ecol. 17: 343 – 352.
Iqbal, U. Iqbal, M.S. et al. 2011. Screening of mungbean germplasm against mungbean
yellow mosaic virus (mymv) under field conditions. Pak. J. Phytopathol.
23(1):48-51.
Jongebloed, M. 2004. Coriander and Fenugreek. p. 229-235. In S. Salvin et al. (edited)
The new crop industries handbook. Rural Industries Research and Development
Corporation (RIRDC), Australian Government, Australia.
Joshi, S. and Raghuvanshi, S.S. 1968. B-chromosomes, pollen germination in situ and
connected grains in Trigonella foenum-graecum. Beitr. Biol. Pf. I. 44(1):161-166.
Kakani, R. K., Singh, S.K., Pancholy, A., Meena, R.S., Pathak, R. and Raturi, A.
2010. Assessment of genetic diversity in Trigonella foenum-graecum based
on nuclear ribosomal DNA, internal transcribed spacer and RAPD analysis.
Plant Mol. Biol. Rep. [DOI 10.1007/s11105-010-0233-x]232
Khan, S. and Goyal, S. 2009. Improvement of mungbean varieties through induced
mutations. Afr. J. Plant Sci. 3: 174-180.
Khan, S. and Wani, M.R. 2005. Genetic variability and correlations studies in chickpea
mutants. J. Cytol. Genet. 6(2): 155-160.
Khattak, G.S.S., Iqbal, M. and Shaw A.S. 2008. Breeding high yielding and disease
resistant mungbean (Vigna radiata (l.) wilczek) genotypes. Pak. J. Bot., 40(4):
1411-1417.
Khiriya, K.D., and Singh, B.P. 2003. Effect of phosphorus and farmyard manure on yield,
yield attributes and nitrogen, phosphorus and potassium uptake of fenugreek
(Trigonella foenum-graecum). Indian J. Agron. 48(1):62-65.
Knappe, B. and Hoppe, H.H. 1995. Investigations on the resistance of peas (P. sativum
L.) towards Ascochyta pinodes and Phoma medicaginis var. pinodella. In: AEP
(Ed.), Proceedings of the 2nd European Conference on Grain Legumes, 9–13 July
1995, Copenhagen, Denmark, pp. 86–87.
Koli, N.R. 2002. estimation of genetic parameters in M 2 generation of fenugreek
(Trigonella foenum-graecum L.). 18(2): 211-212.
Korla, B.N., and Saini, A. 2003. Effect of dates of showing and cutting on seed yield of
fenugreek. Haryana J. Hort. Sci. 32(1-2):120-122.
Kozgar, M.I., Goyal, S. and Khan, S. 2010. EMS induced mutational variability in Vigna
165
radiate and Vigna mungo. Res. J. Bot. 3: 1-7.
Kraft, J.M., Dunne, B. and Armstrong, S. 1998. A search for resistance in peas to
Mycosphaerella pinodes. Plant Dis. 82: 251–253.
Krishnaswamy, K. 2008. Traditional Indian spices and their health significance. Asia Pac.
J Clin. Nutr. 17: 265-268.
Lakra, B.S. 2002. Role of temperature and humidity in oospore formation of
Peronospora trigonella causing downy mildew of fenugreek. Plant Disease
Reporter. 17(2): 339–340.
Lakra, B.S. 2003. Effect of date of sowing and crop geometry on downy mildew
incidence and seed yield of fenugreek. Forage Res. 29(2): 65–67.
Langmead, L., Dawson, C., Hawkins, C., Banna, N., Loo, S. and Rampton, D. 2002.
Antioxidant effects of herbal therapies used by patients with inflammatory bowel
disease: An in vitro study. Aliment. Pharmacol. Ther.16: 197-205.
Lascano, C.E., Rincón, A., Plazas, C., Ávila, P., Bueno, G. and Argel, P.J. 2002. Cultivar
Veranera (Cratylia argentea (Desvaux) O. Kuntze): leguminosa arbustiva de usos
múltiples para zonas con períodos prolongados de sequía en Colombia. Cali,
Colombia, Corporación Colombiana de Investigación Agropecuaria
(CORPOICA), International Center for Tropical Agriculture (CIAT). p. 28.
Laxmi, V., and Datta, S.K. 1987. Chemical and physical mutagenesis in fenugreek. Biol.
Mem. 13(1): 64-68.
Laxmi, V., Gupta, M.N., Dixit, B.S., and Srivastava, S.N. 1980. Effects of chemical and
physical mutagens on fenugreek oil. Indian Drugs.18(2): 62-65.
Lee, L.E. 2009. Genotype X environment impact on selected bioactive compound content
of fenugreek (Trigonella foenum-graecum L.). MSc, University of Lethbridge,
Lethbridge, Alberta, Canada.
Leela, D. 1981. Allelopathy in Argemone mexicana L. Proceedings of the 8th AsianPacific Weed Science SocietyConference, pp. 401–404.
Leela, N.K. and Shafeekh, K.M. 2008. Fenugreek. In Parthasarathy, V.A., Chempakam,
B. and Zachariah, T.J. (edited) Chemistry of Spices. Biddles Ltd, King’s Lynn,
UK, CAB International, pp. 242–59.
166
Leppik, E.E. 1959. World distribution of Cercospora traversiana. FAO Plant Protection
Bulletin 8:19–21.
Liagre, B., Vergne-Salle, P., Corbiere, C., Charissoux, J.L. and Beneytout, J.L. 2004.
Arthritis Res. Ther. 6: 373–383.
Lins, C.S. and Binns, M.R. 1991. Assessment of a method for cultivar selection based on
regional trial data. Theor. Appl. Genet. 82: 379-388.
Lucy, M. 2004. Fenugreek. (www.dpi.qld.gov.au/fi eldcrops/9050.html, accessed 12
September 2011).
Lust, J.B. 1986. The herb book. Bantam Books Inc. New York. Pp. 1-55.
Malhotra, R.S., Singh, K.B., van Rheenen H.A. and Pala, M. 1996. Genetic improvement
and agronomic of chickpea with emphasis on the Mediterranean region. In: N.P.
Saxena, M.C. Saxena, C. Johansen, S.M. Virmani&H. Harris (Eds.), Adaptation
of Chickpea in the West Asia and North Africa, ICRISAT/ICARDA, pp.217–232.
Maliwal, P.L. and Gupta, O.P. 1989. Study of the effect of four herbicides with and
without applied phosphorous on weed control and seed yield of fenugreek
(Trigonella foenum-graecum L.). Trop. Pest Manage. 35: 307-310.
Mandam, A.R. and Maiti, R.G. 1994. Efficacy of different herbicides for weed control in
fenugreek (Trigonella foenum-graecum L.). Environ. Ecol. 12: 138-142.
Manha, S.K., Raisinghani, G., and Jain, S.C. 1994. Diosgenin production induced
mutants of Trigonella corniculata. Fitopterapia. 65(6): 515-516.
Marques de Armeida, J. (1940) Study of improvement of fenugreek (Trigonella foenum
graecum). Agronomia Lusitana. 2: 307–35.
Mary, J. 2009. Fenugreek Seed Benefits the Digestive System and Lowers Blood
Pressure. Available online at http://EzineArticles.com/?expert=Joy_Mary.
(Accessed on April, 2009)
Mathé, I. 1975. A Fenugreek (Trigonella foenum-graecum L) Magyarorzag III/2
Kulturflora 39, Akademiai Kiado, Budapest.
Max, B. 1992. This and That. The essential pharmacology of herbs and spices. Tr.
Pharmacolo. Sci. 13: 15-20.
McAnuff, M.A., Omoruyi, F.O., Morrison, E.Y.S.A., and Asemota, H.N. 2002. Plasma
167
and liver lipid distributions in streptozotocin-induced rats fed sapogenin extract of
the Jamaican bitter yam (Dioscorea polygonoides). Nutr. Res. 22: 1427-1434.
McCormick, K., Norton, R. and Eagles, H.A. 2006.Fenugreek has a role in south-eastern
Australian farming system. In Proceedings of the Australian Agronomy
Conference, Australian Society of Agronomy.
McCormick, K.M. and Hollaway, G.J. 1999. First report of bacterial blight in fenugreek
(Trigonella foenumgraecum) caused by Pseudomonas syringae pv. Syringae.
Australasian Plant Pathol. 28: 338.
McCormick, K.M., Norton, R.M. and Eagles H.A. 2009. Phenotypic variation within a
fenugreek (Trigonella foenum-graecum L.) germplasm collection. II. Cultivar
selection based on traits associated with seed yield. Genet. Resour. Crop Evol.
56:651–661.
McCormick, K.M., Norton, R.M., and Eagles, H.A. 1998. Evaluation of a germplasm
collection of fenugreek (Trigonella foenum-graecum). In Proc. Aust. Agro. Conf.,
9th, 1998. Wagga wagga, Australia.
McCue, P. and Shetty, K. 2003. Role of carbohydrate-cleaving enzymes in phenolic
antioxidant mobilization from whole soybean fermented with Rhizopus
oligosporus. Food Biotechnol. 17:27–37.
Mehta, K. G., Patel, R. H. and Kachhadia, B. T. 1992. Genetic variability and path
analysis in fenugreek. Ind. Cocoa Arecanut. Spi. J. 15: 114–117.
Mehta, R.S., Patel, B.S., Singh, R.K. Meena, S.S. and Malhotra, S.K. 2010. Growth and
yield of fenugreek (Trigonella foenum-graecum L.) as influenced by irrigation
levels and weed management practices. J. Spices Arom. Crops. 19: 14–22.
Micke, A. and Donini, B. 1993. Induced mutations. In Hayward, M.D., Bosemark, N.O.
and Romagosa, I. (edited) Plant breeding principles and prospects. Chapman and
Hall, London. pp. 52-62.
Mir, P.S., Mir, Z., and Townley-Smith, L. 1993.Comparison of the nutrient and in situ
degradability of fenugreek (Trigonella foenum-graecum) and alfalfa hays. Can. J.
Anim. Sci. 73: 993-996.
Mir, Z., Mir, P.S., Acharya, S.N., Zaman, M.S., Taylor, W.G., Mears, G.J., and
Goonewardene, L.A. 1998. Comparison of alfalfa and fenugreek silages
168
supplemented with barley grain on performance of growing steers. Can. J. Anim.
Sci. 78:343-349.
Mir, Z., Mir, P.S., Acharya, S.N., Zaman, M.S., Taylor, W.G., Mears, G.J., and
Goonewardene, L.A. 1998. Comparison of alfalfa and fenugreek silages
supplemented with barley grain on performance of growing steers. Can. J. Anim.
Sci. 78: 343-349.
Montgomery, J.E., King, J.R., et al. 2008. Fenugreek as forage for dairy cattle. In
Proceeding WCDS Advances in Dairy Technology. 20: 356.
Moschini, E. 1958. Charatteristiche biologiche e diversa provenienza colturali di
Trigonella foenum-graecum L. e di Vicia sativa L. di. Esperienze e Ricerche,
Pisa. pp. 10-11.
Moyer, J.R., Acharya, S.N., Mir, Z. and Doram, R.C. 2003.Weeed management in
irrigated fenugreek grown for forage in rotation with other annual crops. Can. J.
Plant Sci. 83:181-188.
Nariani, T.K. 1960. Yellow mosaic of mungbean. Ind. Phytopathol. 13: 24-29.
Njunie, M.N., Reynolds, L., Mureithi, J.G. and Thrope, W. 1996. Evaluation of
herbaceous legume germplasm for coastal lowland East Africa. In Ndikumana, J.
and Leeuw, P. de (edited) sustainable feed production and utilisation for
smallholder livestock enterprises in sub-Saharan Africa. Nairobi, Kenya. pp. 1118.
Onfroy, C., Tivoli, B., Corbiere, R. and Bouznad, Z. 1999. Cultural, molecular and
pathogenic variability of Mycosphaerella pinodes and Phoma medicaginis var.
pinodella isolates from dried pea in France. Plant Pathol. 48: 218–229.
Pandian, R. Suja., Anuradha, V.V. and Viswanathan, P. 2002. Gastroprotective effect of
fenugreek seeds (Trigonella foenumgraecum) on experimental gastric ulcer in
rats. J. Ethnopharmacol. 81: 393–397.
Pavadai, P., Girija, M. and Dhanavel, D. 2010. effect of gamma rays on some yield
parameters and protein content of soybean in M 2 , M 3 and M 4 generation. J. Exp.
Sci. 1(6): 8-11.
Petropoulos, G. A. 2002. Fenugreek –The genus Trigonella. Taylor and Francis, London
and New York. pp. 1-127.
169
Petropoulos, G.A. 1973. Agronomic, genetic and chemical studies of Trigonella foenumgraecum L. PhD. Diss. Bath University, England.
Picci, G. 1959. Microbiological determinations of some vitamins and amino acids
liberated during germination of the seeds. Ann. Fac. Agrar. Univ. Pisa. 20: 51–60.
Prakash, S., and Sharma G.S. 2000. Conidial germination of Erysiphe polygoni causing
powdery mildew of fenugreek. Indian Phytopathol. 53(3):318-320.
Puri, D., Prabhu, K.M., and Murthy, P.S. 2002. Mechanism of action of a hypoglycemic
principle isolated from fenugreek seeds. Indian J. Physiol. Pharmacol. 46(4): 457462.
Raghuram, T.C., Sharma, R.D., and Sivakumar, B. 1994. Effect of fenugreek seeds on
intravenous glucose disposition in non-insulin dependent diabetic patients.
Phytother. Res. 8: 83-86.
Raju, J. and Bird, R.P. 2006. Alleviation of hepatic steatosis accompanied by modulation
of plasma and liver TNF-alpha levels by Trigonella foenum graecum (fenugreek)
seeds in Zucker obese (fa/fa) rats. Int. J. Obes. 30: 1298–1307.
Raju, J., Patlolla, J.M.R., Swamy, M.V. and Rao, C.V. 2004. Diosgenin, a steroid saponin
of Trigonella foenum graecum (Fenugreek), inhibits azoxymethane-induced
aberrant crypt foci formation in F344 rats and induces apoptosis in HT-29 human
colon cancer cells. Biomarkers Prev. 13(8): 1392–1398.
Raju, J., Patlolla, J.M.R., Swamy, M.V. and Rao, C.V. 2004. Diosgenin, a steroid saponin
of Trigonella foenum graecum (Fenugreek), inhibits azoxymethane-induced
aberrant crypt foci formation in F344 rats and induces apoptosis in HT-29 human
colon cancer cells. Biomarkers Prev. 13(8): 1392–1398.
Reddy, K.S., Pawar, S.E. and Bahtia C.R. 1987. Screening for powdery mildew
(Erysiphae polygoni DC.) resistance in mungbean (VŸ radiata (L.) Wilczek)
using excised leaves. Proc. lndian Acad. Sci. (Plant Sci.) 97: 365-369.
Reddy, M.V. and Singh, K.B. 1984. Evaluation of a world collection of chickpea
germplasm accessions for resistance to ascochyta blight. Plant Dis 68: 900–901.
Rguibi, M. and Belahsen, R. 2006. Prevalence and associated risk factors of undiagnosed
diabetes among adult Moroccan Sahraoui women. Public Health Nutr. 9: 722-727.
Richardson, W.G. 1979. The tolerance of fenugreek (Trigonella foenum-graecum L.) to
170
various herbicides. Technical Report, No. 58, Agricultural Research Council,
WRO, p. 31.
Robinson, K., Bell, L.W., Bennett, R.G., Henry, D.A., Tibbett, M. and Ryan, M.H. 2007.
Perennial legumes native to Australia: a preliminary investigation of nutritive
value and response to cutting. Australian J. Exp. Agril. 47: 170–176.
Rosengarten, F. 1969. The Book of Spices. Livingstone, Wynnewood, Pennsylvania,
USA.
Rouk, H.F. and Mangesha, H. 1963. Fenugreek (Trigonella foenum-graecum L.). Its
relationship, geography and economic importance. Exp. Stat. Bull. No. 20. Imper.
Ethiop. College of Agric. and Mech. Arts.
Roy, R.P. and Singh, A. 1968. Cytomorphological studies of the colchicine-induced
tetraploids Trigonella foenum-graecum. Genet. Iber. 20(1-2):37-54.
Roy, R.P. and Singh, A. 1968. Cytomorphological studies of the colchicine-induced
tetraploids Trigonella foenum-graecum. Genet. Iber. 20(1-2):37-54.
Ruby, B.C., Gaskill, S.E., Slivka, D. and Harger, S.G. 2005. The addition of fenugreek
extract (Trigonella foenum-graecum) to glucose feeding increases muscle
glycogen resynthesis after exercise. Amino Acids. 28: 71-76.
Ryley, M.J. 1989. Cercospora traversiana on fenugreek (Trigonella foenum-graecum) in
Queensland. Aust. Plant Pathol. 18(3): 60–63.
Sadeghzadeh-Ahari, D., Hassandokht, M.R., Kashi, A.K., Amri, A. and Alizadeh
K.H. 2010. Genetic variability of some agronomic traits in the Iranian
Fenugreek landraces under drought stress and non-stress conditions. African
J. Plant Sci. 4(2): 12 – 20.
Sadeghzadeh-Ahari, D., Kashi, A.K Hassandokht, M.R., Amri, A. and Alizadeh, K.H.
2009. Assessment of drought tolerance in Iranian fenugreek landraces. J. Food
Agri. Environ. 7: 414 - 419.
Saini, R.G., Minocha, J.L. and Singh, A. 1974. Sterile mutants of Phaseolus aureus. Sci.
Cult. 40: 37-38.
Saleh, N.A. 1996. Breeding and cultural practices for fenugreek in Egypt. National
Research Center, Cairo, Egypt.
Sarker, A. and Sharma, B. 1989. Frequency and spectrum of chlorophyll mutations in
171
lentil (Lens culinaris Medik.). Thai J. Agril. Sci. 22: 107–111.
Sauvaire, Y., Baissac, Y., Leconte, O., Petit, P. and Ribes, G. 1996. Steroid saponins
from fenugreek and some of their biological properties In Waller and Yamasaki
(ed.) Saponins used in food and agriculture. Plenum Press, New York. Pp. 37-46.
Saxena, A. and Vikram, N.K. 2004. Role of selected Indian plants in management of type
2 diabetes: A review. J. Alter. Complement Med. 10: 369-378.
Serpukhova, V.I. 1934. Trudy, Prikl. Bot. Genet. 7(1): 69-106.
Sharma, K.C., Sharma, M.M. and Sharma, R.K. 1990. nature of variability and
associations in fenugreek. Indian J. Genet. 50(3): 260-262.
Siddiqui, S., Meghvansi, M.K. and Hasan, Z. 2007. Cytogenetic changes induced by
sodium azide (NaN 3 ) on Trigonella foenum-graecum L. seeds. S. African. J. Bot.
73: 632-635.
Sigurbjornsson, B. 1983. Induced mutations. In D.R. Wood (edited) Crop Breeding.
Amer. Soc. Agron. Madison, Wis, USA. pp. 153-176.
Sigurbjornsson, B. 1983. Induced mutations. In D.R. Wood (edited) Crop Breeding.
Amer. Soc. Agron. Madison, Wis, USA. pp. 153-176.
Sigurbjornsson, B. and Micke, A. 1974. Philosophy and accomplishments of mutation
breeding. In Polyploidy and induced mutations in plant breeding. Proc. of
meeting, International Atomic Energy Agency (IAEA), Vienna, 1972. Bari, Italy.
pp. 303-343.
Sillero, J.C., Fondevilla, S., Davidson, J., Vaz Patto, M.C., Warkentin, T.D., Thomas J.
and Rubiales, D. 2006. Screening techniques and sources of resistance to rusts
and mildews in grain legumes. Euphytica 147(1-2): 255-272.
Singh, B., Kaur, R. and Singh, K. 2008. Characterization of Rhizobium strain isolated
from the roots of Trigonella foenumgraecum (fenugreek). African. J. Biotechnol.
7(20): 3671-3676.
Singh, B.D. 2005. Mutations in crop improvement. In Singh, B.D. (edited) Plant
Breeding, Principles and Methods. Kalyani Publishers, Ludhiana, India. pp. 698731.
Singh, C.P., Mishra, U.S. and Mishra, N. 2011. Efficacy of Some Selected Fungicides,
172
Antibiotics and Sulphadrugs on the Radial Growth of Cercospora traversiana
Sacc. Causing Leaf Spot/blight of Fenugreek (Trigonella foenum graecum linn.).
J. Phytol. 3(8):5-7.
Singh, D., and Singh, A. 1974. A green tilling mutant of Trigonella foenum-graecum L.
(Methi).Crop Improv. 1(1-2): 98-100.
Singh, D., and Singh, A. 1976. Double trisomics in Trigonella foenum-graecum L.
Crop Improv. 3(1-2):125-127.
Singh, J. Raghuvanshi, S. and Singh, A.K. 1991. Performance studies in F 6 lines of
autotetraploid fenugreek. Plant Breed. 107: 251-253.
Singh, R.J., Chung, G.H. and Nelson, R.L. 2007. Landmark research in legumes.
Genome 50: 525-537.
Singh, R.P. 1969. Natural infection of fenugreek by two legume viruses. Plant Disease
Reporter 53: 297–304.
Singh, R.R., and Raghuvanshi, S.S. 1980. Effects of DES in combination with DMSO
on 2X and 4X Trigonella foenum-graecum L. Indian J. Hort. 37(3):310-313.
Singh, S.P. and Pramila. 2009. Genetic variability, heritability and genetic advance for
quantitative characters in fenugreek (Trigonella foenum-graecum Linn). Asian. J.
Hort. 4(1): 167-169.
Singh, S.P., Singh, R.P., Prasad, J.P., Agrawal, R.K.,and Shahi J.P. 2006. Induced
genetic variability for protein content, yield and yield components in
microsperma lentil (Lens culinaris Medik). Madras Agric. J. 93: 155-159.
Sinskaya, E. 1961. Flora of the cultivated plants of the U.S.S.R. XIII. In Perennial
Leguminous Plants. Part I: Medicago, Sweet clover, Fenugreek. Israel Programme
for Scientific Translations, Jerusalem.
Sjodin, J. 1971. Induced morphological variation in Vicia faba L. Hereditas. 67: 155.
Skaltsa, H. 2002. Chemical constituents. In Petropoulos, G.A. (edited) Fenugreek –The
genus Trigonella. Taylor and Francis, London and New York. pp. 132-163.
Slinkard, A.E, McVicar, R., Brenzil, C., Pearse, P., Panchuk K. and Hartley, S. 2006.
Fenugreek in Saskatchewan, Saskatchewan agricultural and Food.
Smith, A. 1982. Selected markets for turmeric, coriander, cumin and fenugreek seed and
curry powder. Pub. No. G165 .Tropical Product Institute, London.
173
Solanki, I.S. 2005 Isolation of macromutations and mutagenic effectiveness and
efficiency in lentil (Lens culinaris Medik). Indian J. Genet. 65: 264-268.
Srichamroen, A., Thomson, A.B., Field, C.J. and Basu, T.K. 2009. In vitro intestinal
glucose uptake is inhibited by galactomannan from Canadian fenugreek seed
(Trigonella foenum graecum L) in genetically lean and obese rats. Nutr. Res. 29:
49-54.
Srinivasan, K. 2006. Food Rev. Int. 22, 203-224.
Sur, P., Das, M., Gomes, A. et al. 2001. Trigonella foenum graecum (fenugreek) seed
extract as an antineoplastic agent. Phytother. Res. 15:257-9.
Tah, P.R. 2006. Induced macromutation in mungbean (Vigna radiate L Wilczek). Int. J.
Bot. 2:219-228.
Thomas, J. E., Basu, S. K. and Acharya, S. N. 2006. Identification of Trigonella
accessions which lack antimicrobial activity and are suitable for forage
development. Can. J. Plant Sci. 86: 727-732.
Tiran, D. 2003. The use of fenugreek for breast feeding woman. Comp. Ther. Nurs.
Midwifery. 9(3):155-156.
Tivoli, B., Barange, A., Sivasithamparam, K. and Barbetti, J. 2006. Annual Medicago:
from a model crop challenged by a spectrum of necrotrophic pathogens to a
model plant to explore the nature of disease resistance. Ann. Bot. 98: 1117–1128.
Tiwari, R.C., Bairwa, R.C., Sharma, P.K. and Khandelwal, S.K. 2006. Effect of
phosphorus and weed control on fenugreek (Trigonella foenum-graecum L).
Legume Res. 29(4): 14-18.
Toker, C., Yadav, S.S. and Solanki, I.S. 2007. Mutation breeding. In Yadav, S.S.,
McNeil, D. and Stevenson P.C. (edited) Lentil: an ancient crop for modern times.
Springer, Dordrecht, The Netherland. pp. 209–224.
Tripathi, S.S. and Govindra, S. 1993. Crop-weed competition studies in fenugreek
(Trigonella foenum- graecum L.). Proceedings of the Indian Society Weed
Science, International Symposium, Hisar (India), 18–20Nov. 1993. Vol. II, pp.
41–3.
Tutin, T.G. and Heywood, V.H. 1964. Flora Europaea, Vol. I and II. Cambridge
University Press, Cambridge.
174
Vasil’chenko, I..T. 1953. Bericht uber die arten der Gattung. Trigonella Trudy Bot. Inst.
Akad. Nauk. SSSR.1:10.
Vats, V., Grover, J.K. and Rathi, S.S. 2002. Evaluation of anti-hyperglycemic and
hypoglycemic effect of Trigonella foenum-graecum Linn, Ocimum sanctum L.
and Pterocarpus marsupium L. in normal and alloxanized diabetic rats. J.
Ethnopharmacol. 72: 95-100.
Vats, V., Yadav, S.P. and Grover, J.K. 2003. Effect of Trigonella foenum-graecum on
glycogen content of tissues and the key enzymes of carbohydrate metabolism. J.
Ethanopharmocol. 28(53):1-6.
Vavilov, N.I. 1926. Studies in the origin of cultivated plants. Inst. Appl. Bot. Plant Breed.
Leningrad.
Vavilov, N.I. 1951. The origin, variation, immunity and breeding of cultivated plants.
Chronica Botanica.1:6.
Voros, J. and Nagy, F. 1972. Cercospora traversiana Sacc., a new destructive pathogen
of fenugreek in Hungary. Acta Phytopathol. Acad. Sci. Hungari. 7: 71 -76.
Wani, M.R. and Khan, S. 2006. Estimates of genetic variability in mutated populations
and the scope of selection for yield attributes in Vigna radiata (L.) Wilczek.
Egyptian J. Biol. 8: 1-6.
Wani, M.R. Khan, S. and Parveen, K. 2005. Induced variation for quantitative traits in
mungbean. Ind. J. Appl. Pure Biol. 20: 55-58.
Weiss, E.A. 2002. Spice crops. CAB International, New York, USA. pp. 1-399.
Wittneben, U. and Sprout, P.N. 1971. Soil survey of the Creston area. Interim report of
the Creston valley soil survey. British Columbia Department of Agriculture,
Kelowna, BC. pp. 4-98.
Wyatt, F.A., Bowser, W.E. and Odynsky, W. 1939. Soil survey of Lethbridge and
Pincher Creek sheets. University of Alberta, Edmonton. 32: 4-112.
Yadav, G.L. and Kumawat, P.D. 2003. Effect of organic inorganic, fertilizer and
Rhizobium inoculation of yield and yield attributes of fenugreek (Trigonella
foenum-graecum L). Haryana J. Hort. Sci. 32(1-2):147-148.
Yadav, M.K. and Raje, R.S. 2008. Response to selection in early segregating generation
175
in fenugreek (Trigonella foenum-graecum L.). Ind. J. Genet. Plant Breed.
68:414-418.
Yadav, S.S., McNeil, D. and Stevenson P.C. 2007. Lentil: an ancient crop for modern
times (edited). Springer, Dordrecht, The Netherland. pp. 1-450.
Yan, W. and Hunt, L.A. 2003. Biplot analysis of multi-environment trial data. In M. S.
Kang ( edited) Quantitative Genetics, Genomics, and Plant Breeding. CAB
International, Wallingford, Oxon, UK. pp.289-303.
Yang, H.A., Boersma, J.G., You, M., Buirchell, B.J. and Sweetingham, M.W. 2004.
Development and implementation of a sequence specific PCR marker linked to a
gene conferring resistance to anthracnose disease in narrow-leafed lupin (Lupinus
angustifolius L.). Mol. Breed. 14: 145–151.
Yoshikawa, M., Murakami, T., Komatsu, H., Murakami, N., Yamahara, J. and Matsuda,
H. 1997. Medicinal foodstuffs. IV. Fenugreek seed (1): structures of trigoneosides
Ia, Ib, IIa, IIb, IIIa, and IIIb, new furostanol saponins from the seeds of Indian
Trigonella foenum graecum L. Chem. Pharm. Bull. (Tokyo). 45: 81-7.
Zia, T., Siddiqui, I.A. and Nazrul-Hasnain. 2001. Evaluation of the oral hypoglycemic
effect of Trigonella foenum-graecum L. (Methi) in normal mice. J.
Ethnopharmacol., 75: 191-195.
Zimmer, R.C. 1984. Cercospora leaf spot and powdery mildew of fenugreek, a potential
new crop in Canada. Canadian Plant Disease Survey. 64(2): 33–35.
176
Appendices
Appendix I: The fenugreek world accessions, their corresponding sources, and origin.
Accessions
Source
Origin
AMBER
Tristar
F70
F80
F86
L3068
L3172
L3177
L3308
L3312
L3375
L3690
L3691
L3692
L3693
L3694
L3695
L3696
L3697
L3698
L3699
L3700
L3701
L3702
L3703
L3704
L3705
L3706
L3707
L3708
L3709
L3710
L3711
L3712
L3713
L3714
L3715
L3716
L3717
AAFC, Lethbridge
AAFC, Lethbridge
CDC South, Canada
CDC South, Canada
CDC South, Canada
AAFC, Lethbridge
India
India
Alberta Province
Alberta Province
China
Gujrat
Hyderabad
Chennai
Rajasthan
Lucknow
New Deli
Guwahati
Amritsar
Madhya Pradesh
Bangalore
Kidderpore
Mumbai
Bhubaneshwar
Rajasthan
Amritsar
New Deli
Kulkata
Gujarat
Hyderabad
Mumbai
Varanasi
Lucknow
Pushkar
Bhopal
Chennai
Imphal
Gauhati
Bangalore
Morden, Manitoba
Canada
Turkey
India
Afghanistan
India
India
India
Unknown
Unknown
China
India
India
India
India
India
India
India
India
India
India
India
India
India
India
India
India
India
India
India
India
India
India
India
India
India
India
India
India
177
L3718
L3719
L3720
L3721
NGC 2001
PI138687
PI143504
PI195691
PI199264
PI211636
PI269994
PI577711
PI577713
PI229626
QUATRO
X92-23-3
ZT-5
Bhubaneshwar
Srinagar
Rajasthan
Rajasthan
Grocery store,
Edmonton, Canada
PGRC, Canada
PGRC, Canada
PGRC, Canada
PGRC, Canada
PGRC, Canada
PGRC, Canada
PGRC, Canada
PGRC, Canada
CDC – North, Canada
PGRC, Canada
PGRC, Canada
PGRC, Canada
India
India
India
India
Unknown
Shiraz, Iran
Hamadan, Iran
Ethiopia
Greece
Afghanistan
Pakistan
Meknes, Morocco
Madrid, Spain
Unknown
CDC Saskatchewan
CDC Saskatchewan
CDC Saskatchewan
178
Appendix II: Distribution of fenugreek world accessions in various disease severity
categories of cercospora leaf spot according to primary and final disease screening.
Resistant category
Disease severity
Highly resistant
0
Resistant
Moderately resistant
Moderately susceptible
Genotypes number
Accessions
1
2
L3717, PI138687,
2
7
L3690, L3696, L3698,
L3701, L3715,
PI269994, F86
20
L3172, L3177, L3691,
L3693, L3694, L3695,
L3706, L3707, L3708,
L3709, L3713, L3714,
L3720, PI195691,
PI577711, PI57713,
Amber, F70, F80,
Tristar
3
Susceptible
4
18
L3308, L3312, L3697,
L3699, L3700, L3703,
L3704, L3705, L3711,
L3716, L3718, L3719,
NGC2001, PI199264,
PI211636, Quatro, ZT5, X92-23-3
Highly susceptible
5
1
L3721
179
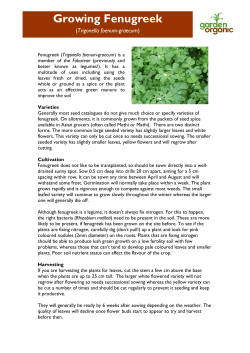


© Copyright 2026