
Forager Mar 15 Qtr Report
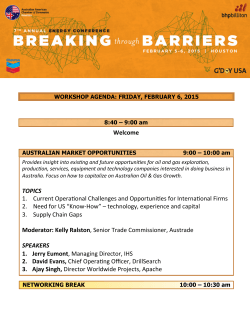
31 March 2015
ROBUST AGAINST RECESSION
TECH STOCKS DELIVER
COLLECTING TOLLS IN VIENNA
GOOGLE GETS PUNTED
China’s slowdown is hitting
home for Australia. A defensive
stance is still warranted.
GBST and Hansen have been
delivering stellar results for the
Australian Fund.
What’s better than owning a toll
road? Owning the technology
that collects the tolls.
Google’s business is humming
along nicely. How it spends the
profits has us very concerned.
MARCH 2015
QUARTERLY
REPORT
CONTENTS
RBA SENDS 2015 OFF WITH A BANG
3
Iron Ore: How Low Can it Go?
3
What next for Australia?
3
Fessing up about our mistakes
4
INTERNATIONAL FUND PERFORMANCE
7
Kapsch: Not just a proverbial toll collector
8
Google heads for the dark side of the moon
9
Betfair gallops ahead
9
Hornbach builds market share
9
AUSTRALIAN FUND PERFORMANCE
11
Software Superb
12
Hughes Making the Hard Yards
12
Service Stream’s One Solid Performance
13
WARNING The information given by Forager Funds Management is general information only and is not intended to be advice. You should
therefore consider whether the information is appropriate to your needs before acting on it, seeking advice from a financial adviser or
stockbroker as necessary. DISCLAIMER Forager Funds Management Pty Ltd operates under AFSL No: 459312. Fundhost Limited (ABN 69
092 517 087, AFSL No: 233 045) as the Responsible Entity is the issuer of the Forager International Shares Fund (ARSN No: 161 843
778) and the Forager Australian Shares Fund (ARSN 139 641 491). You should obtain and consider a copy of the product disclosure statement
relating to the Forager International Shares Fund and the Forager Australian Shares Fund before acquiring the financial product. You may
obtain a product disclosure statement from Fundhost or download a copy at www.foragerfunds.com. To the extent permitted by law, Fundhost
Limited and Forager Funds Management Pty Limited, its employees, consultants, advisers, officers and authorised representatives are not liable
for any loss or damage arising as a result of reliance placed on the contents of this document.
Forager Funds Management
#3 – Quarterly Report March 2015
RBA SENDS 2015 OFF WITH A BANG
An interest rate cut and the prospect of more to come put a rocket under
the Australian market in the first three months of the year. Steve Johnson
explains that it’s the economy you need to be worried about.
Dear Investor,
The first quarter of 2015 was kind to global sharemarkets and
both of Forager’s funds. Domestically, the Reserve Bank of
Australia has been late to the global low-interest rate party but
a cut in February had the same impact as similar actions by
central banks around the world in recent years: prices for property
and shares headed sharply higher and the local currency fell
against the US dollar.
Performance
1 Quarter 1 Year
3 Year
Since
(p.a.)
Inception (p.a.)
Australian
Shares Fund
9.43%11.59% 22.15% 13.59%
ASX All Ordinaries
Accum 10.21%13.25% 14.72% 8.96%
Demand is unlikely to increase rapidly enough to fix the
problem. In fact, while most observers have finally woken up
to the fact that China’s construction boom is unsustainable,
analysts are still forecasting somewhere between slow and no
growth for Chinese iron ore demand.
Even to maintain the same level of demand – that’s zero growth –
China would have to build the same number of roads, railways and
airports as last year, adding significantly more infrastructure
and debt to an economy that is plagued by too much of both.
It seems perfectly reasonable to expect the demand for iron ore to
fall. Perhaps dramatically.
Chart 1: 10 year iron ore price (USD)
$200
$150
$100
International
Shares Fund
6.51%11.88%
–
20.84%
$50
MSCI ACWI
IMI
9.88%27.54%
–
27.89%
$0
I
Mar 07
I
Mar 09
I
Mar11
I
Mar 13
I
Mar 15
Source: S&P Capital IQ
There are more rate cuts to come for Australia and that could
mean even higher prices for stocks, particularly those paying high
dividends. It seems simple – just buy a stock with a reasonable
yield and watch it rise – but thoughtless investing is always risky.
I’m unsure whether this global monetary experiment ends in
inflation, deflation or the world sails through just fine. But I know
that equities are not bank deposits.
Regardless of how reliable an historical dividend has been, shares
are not low-risk investments and should not be bought on the basis
of yield alone. Australian dividend payout ratios are high – far
too high in my opinion – and the underlying profitability of any
business can change dramatically.
The good news is that Australian investors’ obsession with yield
is also creating opportunity. There’s very little interest in those
stocks not paying dividends and not perceived as ‘reliable’.
That’s led to some cheap investments for the Australian Fund.
Despite plenty of nervousness about the domestic economy (see
below), we’re optimistic about the prospects for this portfolio.
IRON ORE: HOW LOW CAN IT GO?
In the first few days of April this year, the benchmark iron ore
price slipped below US$50 a tonne. That’s down 50% in the
past year alone and more than two thirds from its peak in 2011.
How much further can it fall?
No one has any idea. Particularly in the short-term. But the
question is irrelevant in any case.
Prices for iron ore are falling because the market is dramatically
oversupplied.
Meanwhile, BHP Billiton plans on increasing its iron ore
production by 65 million tonnes per annum (mtpa) over the
next few years. Rio Tinto’s plans include an additional 50mtpa.
And Gina Rinehart’s new Roy Hill mine will add 55mpta to the
market in 2016. Combined, these three players plan on adding
roughly 20% to the supply of internationally traded iron ore.
If demand is, at best, growing only slowly, it’s clear that supply
needs to be removed from the market somewhere. Iron ore
mines need to close.
Many directors are sitting around boardroom tables wasting
their time pontificating about where the iron ore price will
bottom out. The simple fact is that if your mine is in the least
efficient quintile of global production, the price is going to fall
to a level that puts you out of businesses.
Australia’s high cost operators like BC Iron, Atlas Iron and
Mineral Resources’s Minara mine will close first. But they’re only
small players. It’s going to take something significant, either
Fortescue Metals going under or Rio or BHP Billiton
curtailing expansion plans before the market is going to be
anything like balanced.
However painful, and however low the iron price needs to fall to
make it happen, this is the only way the market can return to
balance.
WHAT NEXT FOR AUSTRALIA?
We’re what the asset consultants would describe as ‘bottom up’
investors. That is, we value companies and we buy them when
we think they’re cheap. Macro, or ‘top down’ investors look at the
Forager Funds Management
#4 – Quarterly Report March 2015
“REGARDLESS OF HOW RELIABLE AN
HISTORICAL DIVIDEND HAS BEEN, SHARES
ARE NOT LOW-RISK INVESTMENTS AND
SHOULD NOT BE BOUGHT ON THE BASIS
OF YIELD ALONE”
big picture first. Armed with a theme, they then find stocks that
will help them profit if the world plays out the way they expect.
Obviously a top down investor still puts a lot of work into the
individual stocks they end up buying. And a bottom up investor
should – indeed must – put a lot of time and effort into understanding
the macro environment a company operates in and how that
environment is expected to impact a company’s future profitability.
Hence, while picking individual stocks for the past five years, our
concerns about a China slowdown have influenced our portfolio
allocation in three distinct ways. One, we obviously don’t want
to own resources stocks. Two, we prefer exposure to foreign
currencies. Three, we are wary of exposure to discretionary
spending and the domestic Australian economy. Indeed these
concerns were some of the main reasons for starting the
International Fund in early 2013.
China’s growth has slowed dramatically and the first two pennies
have dropped. Mining stocks have been smashed and the Aussie
dollar has fallen. Yet the third concern – the flow-on effect of a
commodities meltdown on the wider Australian economy – is yet
to be reflected in stock prices. Sure, the unemployment rate has
crept up, but bank share prices are hitting all-time highs.
Obviously the more iterations between China’s economic growth
and the company you are looking at, the less direct the impact
will be. It’s hard to imagine how China’s economic growth slows
dramatically without impacting commodity prices. It’s less certain,
but still likely, that this will cause the Aussie dollar to fall.
When it comes to the wider Australian economy, there are a lot
of other factors at play.
We are more likely to be wrong the further we extrapolate from
the epicentre. But it is fairly clear that the Australian economy
is about to go through a very difficult adjustment period as the
commodities boom ends.
So we demand an even greater margin of safety when looking
at discretionary retail stocks, as well as Australian financials,
housing and anything else dependent on Australian consumers.
We will buy them, if they are cheap enough, but we require a
higher-than-usual expected return, because we think the risk is
higher than usual at the moment.
Take retailer Myer Group for example. There’s a pretty straight
forward case for this stock being cheap. It trades at roughly 10
times downgraded earnings, yields 9.3% on last year’s dividends
and, in our opinion, is probably making less profit than it should.
The margins, at 2.4%, are very low relative to the competition
and its own historical averages.
There are plenty of things to worry about. The internet and foreign
retailers are encroaching on Myer’s space. The stores look tired.
And Westfield is stealing the profit (almost all of the margin
deterioration in recent years has been due to increasing rents).
None of these issues are easily fixed.
In a normal economic environment, however, I’d say the
potential rewards outweigh the risks at this price. The time to
buy retailers is when the margins are low. And at these prices a
private equity bid is surely on the cards. The same case could be
made for Kathmandu (see the Chart 2).
But is now the time to be wading into the consumer discretionary
sector?
Chart 2: KMD and MYR chart
$4.00
$3.50
$3.00
$2.50
$2.00
$1.50
$1.00
I
Dec 13
I
Mar 14
I
Jun 14
I
Sep 14
I
Dec 14
I
Mar 15
Myer
Kathmandu
Source: S&P Capital IQ
Not unless the stock is cheap enough to sail through a recession
and still look cheap. And neither of these stocks meet that criteria.
FESSING UP ABOUT OUR MISTAKES
December’s quarterly report caused concern to some of our newer
investors. The discussion of 2014’s mistakes made some people,
understandably, question why they’d invested with a fund
manager who keeps stuffing up.
Yet it was nothing new to investors who’ve been with us for years.
We regularly discuss our mistakes and there wasn’t anything
special about 2014. We aim to get fewer wrong each year but
there will always be errors.
That’s not only true of us, because all fund managers make
mistakes. The difference is that we are open about them with
you, our investors. And for good reason.
As a result of our confessionals and general transparency, most
of our investors understand that we are human, that we get things
wrong from time to time and that our returns are likely to be
lumpy and often differ markedly from the index.
That understanding and the long-term nature of the
investments our clients place with us as a result, are our main
advantage over the competition. In the short-term, we probably
attract less money. In the long-term, we have a sustainable
business and our investors receive, we hope, superior returns.
So come the end of this year, you’ll be reading about the things
that we got wrong in 2015.
Yours sincerely,
STEVEN JOHNSON
Chief Investment Officer
“IN THE SHORT-TERM,
WE PROBABLY ATTRACT
LESS MONEY. IN THE
LONG-TERM, WE HAVE A
MUCH MORE SUSTAINABLE
BUSINESS AND OUR
INVESTORS RECEIVE,
WE HOPE, SUPERIOR
RETURNS.”
INTERNATIONAL
SHARES FUND
FACTS
Fund commenced
8 Feb 2013
Minimum investment$20,000
Monthly Investment
Min. $200/mth
Income distribution
Annual, 30 June
Applications/RedemptionWeekly
UNIT PRICE SUMMARY
Date
31 March 2015
Buy Price $1.4307
Redemption Price$1.4193
Mid Price$1.4250
Portfolio value$74.9m
Forager Funds Management
#7 – Quarterly Report March 2015
INTERNATIONAL FUND PERFORMANCE
The Forager International Shares Fund lagged the index again this quarter. But
a few new opportunities were added to the portfolio that hold potential to pay off
over the long term. We continue hunting for more.
Over the month to 31 March 2015, the Forager International
Shares Fund rose 1.5%, slightly outperforming +1.1% from
the benchmark index. But it trails over the past three months,
+6.5% against +9.9% from the index.
to better understand its position on our wish list – has almost
doubled since (unfortunately, we don’t own it). As we lamented on
Facebook last month, ‘every stock we’ve bought in Europe recently
has gone up. So has every stock we haven’t bought in Europe.’
Table 1: Summary of returns as at 31 March 2015
Chart 2: US Dollar Strength
35%
International Shares Fund MSCI ACWI IMI
1 month return
1.46%
1.11%
25%
3 month return 6.51%
9.88%
15%
6 month return
9.74%
18.20%
5%
1 year return
11.88%
27.54%
–5% I
Mar 14
2 year return (p.a.)
22.99%
29.61%
AUD/USD
GBP/USD
Source: S&P Capital IQ
Since inception* (p.a.)
20.84%
27.89%
*Inception 8 Feb 2013
Chart 1: Performance of $10,000 invested in the
International Shares Fund vs MSCI ACWI IMI
$18,000
$16,000
$14,000
$12,000
$10,000
$8,000
I
Mar 13
International Shares Fund
Source: S&P Capital IQ
I
Sep 13
I
Mar 14
I
Sep 14
I
Mar 15
MSCI ACWI IMI
If you read mainly local financial media, you might think the
Australian dollar is the most rapidly depreciating currency in the
developed world. You’d be wrong.
While the little Aussie battler has fallen 18% against the US dollar
over the past 12 months, the Euro has fallen 22% versus the
greenback. Much of that happened in the past three months.
Various European policies, such as quantitative easing, are broadly
achieving their intended debasing … err … stimulative goals.
The effect on stocks has been pronounced. Since the New Year’s
fireworks, the German bellwether DAX index is up 22% and the
French CAC 40 up 19%. Export-focused companies have generally
done even better – Volkswagen, BMW, BASF and many more are
up more than 30% since 1 January. Nemetschek AG, an architectural
software company Gareth visited in Bavaria barely 6 months ago – I
Jun 14
I
I
Sep 14
EUR/USD
Dec 14
I
Mar 15
JPY/USD
But as John Hempton pointed out in his February letter to Bronte
Capital investors, it would be wrong to make the unthinking
assumption that stocks, particularly of exporting companies, are
now expensive just because they’ve gone up. Hempton made the
point with one of his European stocks (MTU Aero Engines), we’ll
make it with one of ours.
B&C Speakers S.p.A. (BIT:BEC) is up 28% since 1 January. But
half of its revenue is sourced from outside the Eurozone, and much
of the rest is sold to European speaker companies that ultimately
export it elsewhere. Those European clients are themselves
receiving a competitive boost from the falling Euro versus their
main competitor, US-based giant JBL Speakers (which doesn’t buy
components from B&C).
Granted, the currency benefit isn’t one way. Much of the company’s
raw materials costs (such as neodymium, the powerful magnet)
are priced in US dollars. But that’s the same for all participants
regardless of their geographical location, and will prove a ‘wash
through’ in the longer term. Labour, another crucial input, is
different. The recently cheapened Euro gives the company and
some of its key customers a clear cost advantage versus competitors
based outside of Europe.
To internationalise the recent stock price move, in US dollar terms
the B&C’s share price is up ‘only’ 14% since 1 January. That may
well short change the positive effects of recent Euro depreciation
for the company. To pinch a phrase from Hempton, the cheaper
Euro is ‘wildly good’ for B&C’s competitive position.
Rising share prices can be disheartening for those seeking to
acquire value investments. But we’re doing our best to fight lazy
assumptions and continue seeking value in Europe, as elsewhere.
On that front, a few new investments were made over the past
three months, the largest of which is now outlined.
Forager Funds Management
#8 – Quarterly Report March 2015
“THE RECENTLY CHEAPENED EURO GIVES THE
COMPANY AND SOME OF ITS KEY CUSTOMERS
A CLEAR LABOUR COST ADVANTAGE VERSUS
COMPETITORS BASED OUTSIDE OF EUROPE”
KAPSCH: NOT JUST A PROVERBIAL TOLL COLLECTOR
It can be an expensive experience driving around Sydney or
Melbourne. For those looking to get some bills back via the
stockmarket, it might pay to look on the other side of the world.
Austrian company Kapsch TrafficCom AG (WBAG:KTCG) is a
global leader in free flowing electronic toll collection systems. It
has two main divisions. Road Solution Projects (RSP) is focused
on new road builds. It makes all the on-road equipment that hangs
from gantries over motorways and allows for high speed, cashless
toll collection – transceivers, readers, automatic number plate
recognition, smart cameras – and the systems that sit behind the
hardware. In some markets, like Australia, it mainly sells its product
to the road builder. All tollways in Sydney except the Harbour Bridge,
and a large percentage of Melbourne and Brisbane toll roads, use
Kapsch equipment. In other markets, it offers full turnkey
installation and system integration.
Chart 3: Kapsch TrafficCom share price
€80
€60
€40
€20
€0
I
Mar 09
I
Mar 11
I
Mar 13
I
Mar 15
Source: S&P Capital IQ
Services, System Extensions & Component Sales (SEC) is the
recurring revenue business that sometimes flows from past RSP
sales. The most important part of this segment is the full operation
of specialty truck tolling systems that the company previously
installed in Poland, Austria, Czech Republic and Belarus, on
multi-year contracts.
Also important to SEC is the sale of on-board units. Kapsch is
easily the largest manufacturer of toll tags globally, selling more
than 9 million of them last year. On board unit sales are recurring
in nature. That’s especially true in the important E-Z Pass system
which spans the 13 most north easterly states of the United
States, an extremely populous area where Kapsch has a contracted
monopoly at least until 2021. SEC generates dependable revenues
and high margins.
Life since listing in 2007 fits into two stark halves. From 2007
to 2011, revenues in both RSP and SEC grew very rapidly. When
it came to profit, RSP would make a little or lose a little each
year. But that was ok because it was winning a lot of business that
generated future recurring revenue for the SEC business, where the
real money is made.
Over the past three years, RSP has run into numerous obstacles.
Most importantly new, large scale European truck tolling systems
have all but dried up. A national system approved for Slovenia
and awarded to Kapsch was cancelled. Another in Hungary was
given to local players in a last minute about face by a nationalistic
government. A long-discussed system in Russia was abandoned.
France and Denmark delayed projects. Belgium, one of the few
projects to get off the ground, was won by a competing consortium.
As a result, RSP revenues have fallen and the division has been
losing a lot of money – enough to mask the significant profitability
of the SEC segment. Since peaking in 2011 Kapsch TrafficCom’s
share price has halved, then nearly halved again. We think it’s
fallen too far.
Seth Klarman once opined that every investment firm has copious
information, accurate databases, powerful computers and welltrained analytical talent. These alone will no longer provide a
competitive edge. ‘To add value you must stand apart from the crowd’.
Valuing the SEC segment is uncontroversial. It generates €60–70m
of earnings before interest and tax (EBIT) and does so with low
capital requirements – many of the assets it utilises are owned by
the road operator or national government. Some of the operating
contracts are long term in nature, others have only a few years to
run but a strong likelihood of being extended. Even if the company
never won another new operating contract, it’s hard to come up
with a value for this division alone that is less than the entire
enterprise value of Kapsch – about €350m – and easy to envisage a
substantially higher number.
Where we’ve stood apart from the crowd is in dealing with the RSP
losses, which have been running at €35–50m the past three fiscal
years. The market seems to be assuming that losses in RSP will
continue indefinitely, while failing to win any new large operating
contracts that would ultimately add value to the SEC business.
Thus their valuation for the RSP business is a big number, with a
minus in front of it.
We disagree. The evidence suggests that recent losses in RSP stem
not from the contracts it won but from the contracts that it didn’t win.
Kapsch expanded its cost base expecting growth, a continuation of
the 2007–2012 experience, and then the world changed. That’s a
solvable problem.
Management is incentivised to act sensibly – the company is run by
Georg Kapsch, whose family control 63% of the stock. While it’s
possible that the company wins operatorship of a few new European
truck tolling systems, Kapsch is focused on reducing the cost base in
case they don’t. For starters, it can slash some of the €15m incurred
annually setting up in new markets for new bids, and some of the
€20–25m in generic technological research and development that
is all expensed to the RSP division.
Over the past nine months, the company has restructured and
claimed the heavy lifting would be done by the end of its 2015 fiscal
year, which ended on 31 March. They’ve consistently telegraphed
that they expect company-wide EBIT margins of around 10% for
the 2016 year just started, a vast improvement on the recent past.
We think that’s achievable. Dividends, cancelled a few years ago,
are to be reinstated in a few months’ time – an important sign
of confidence.
The Fund acquired stock in Kapsch TrafficCom in January at prices
around €21.70. If management hits its 2016 targets, those shares
were acquired on a forecast EBIT multiple of around 7.0–7.5 times,
Forager Funds Management
#9 – Quarterly Report March 2015
“BETFAIR HAS COMPETITIVE ADVANTAGES
THAT ARE VERY DIFFICULT TO REPLICATE
AND, LONG DISGUISED BY POOR MANAGEMENT,
THESE ADVANTAGES ARE NOW SHOWING UP IN
THE FINANCIAL STATEMENTS”
too cheap for a business with highly recurring revenues and remaining
growth options. The portfolio weighting is 4.0%. We’ve stood apart
from the crowd, time will tell if profitably.
GOOGLE HEADS FOR THE DARK SIDE OF THE MOON
When the Fund made its original investment in Google Inc.
(NASDAQ:GOOGL) back in 2013, the rationale was straight
forward. The company had a quasi-monopoly position in a
tremendously profitable business (search); it had other exciting
businesses that were just hitting their stride (Android and YouTube),
and it was using the cash flow from these efforts to innovate and
maintain its place at the leading edge of technology. Importantly
for us, its stock was trading at a relatively economical valuation.
Google was always an “ad tech” company, so pursuing opportunities
both within and adjacent to the digital advertising space seemed the
most promising. The evolution of Adwords, Adsense, Doubleclick,
Android, and YouTube – Google’s most valuable assets – provided
such a legacy. Indeed, the price we were paying at the time was
attractive only assuming future endeavours bore returns consistent
with the company’s historical performance. This was a key aspect
of our investment thesis.
But as we have all heard countless times, past performance is not
indicative of future results. From 2001 through 2011, Google spent
USD$24bn on capital investment and M&A, building a business
that increased pre-tax profit by USD$12bn. Pardon the admittedly
simplistic analysis, but the rough math suggests a 50% return on
that investment. Since then, in the past three years alone, the
company has spent USD$38.5bn and managed to increase profit
by only USD$4.6bn, a 12% return. Something has gone awry.
Chart 4: Google 10 year Return on Capital
25%
20%
15%
10%
5%
0%
I
FY2006
I
FY2008
I
FY2010
I
FY2012
I
FY2014
Source: S&P Capital IQ
It is impossible to invest in Google without investing in Larry Page.
Together with co-founder Sergey Brin, he controls both the company
and the purse strings. He is young and rich. It is not surprising
that someone who has achieved that level of success brims with
optimism, but it is his idealism that gives us concern. He believes
in the power of technology to cure all of society’s ills, and that
Google is best positioned to take that challenge. As shareholders,
we can think of a few alternative paths to chart, most of which
would delegate the role of altruist to a non-publicly traded entity.
Google likes to refer to these ambitious, long-term projects as
moonshots. We admire Larry’s desire to avoid the stagnation trap
in which most mature tech companies eventually find themselves.
But a glance through Google’s latest ventures suggests that the
company has entered some sort of capex death spiral. High-speed
consumer broadband, self-driving cars (an idea we actually like),
biotech, consumer wireless, consumer electronics, and low earth
orbiting satellites – these are Google’s moonshots. Most of these
businesses require significant upfront investment, and many
of them are in markets that lack appealing economics and are
increasingly competitive. Perhaps more telling? None of them have
much to do with Google’s existing business.
Has the honeymoon come to an end? In January, we had gnawing
concerns over the future of Google’s traditional search business, and
Europe was continuing to ratchet up regulatory pressure. Factoring
these risks together with our concern over the unfettered spending,
we could no longer make a compelling case to own the stock.
Reluctantly, the Fund liquidated its stake earning a 32% return on
our initial purchase.
BETFAIR GALLOPS AHEAD
UK-listed Betfair (LSE:BET) continued its stellar run. The share
price rose 28% during March and 42% for the quarter. The betting
exchange announced the acquisition of another US horse race
broadcasting business, HRTV, in February but it was the quarterly
results that set the share price racing. Revenue increased 20%
for the quarter and earnings before interest, tax, depreciation and
amortisation increased 17%. Except for the introduction of a new
UK tax, the increase would have been 51%.
Betfair has competitive advantages that are very difficult to replicate
and, long disguised by poor management, these advantages are now
showing up in the financial statements. The share price has more
than doubled since our purchase less than 12 months ago but the
business is surpassing our most optimistic expectations. It remains
an important holding for the Fund.
HORNBACH BUILDS MARKET SHARE
German DIY retailer Hornbach Baumarkt (DB:HBM) and its
property-rich parent Hornbach Holdings (DB: HBH3), which you
should view as one holding, is a sleeper in the portfolio. Unlike the
European exporters outlined earlier, the group is reliant on the health
of European consumers. Unsurprisingly then, it hasn’t shot to the
moon like much else on the continent – Hornbach Baumarkt stock
is up ‘only’ 15% over the quarter.
The full year result showed impressive 4.4% same-store sales growth.
But this was flattered by an unusual weather pattern in the first
quarter last year. The 4th quarter same-store growth of 2.4% is
perhaps a better indicator of conditions, with the non-German stores
finally pulling their weight. The number of stores increased by 8 to
146 (mostly through acquiring sites from a bankrupt competitor).
Hornbach’s German market share now sits at 11.0%, up from
10.0% last year and 9.2% in the 2011/12 year, and higher in the
megastore category. Hornbach is now the clear number three player.
The stock looks cheap on an earnings and assets basis, and will look
even cheaper if continued consolidation of the German DIY market
encourages profit margins to rise from pitiful to merely slim.
AUSTRALIAN
SHARES FUND
FACTS
Fund commenced
31 Oct 2009
Minimum investment$10,000
Monthly Investment
Min. $100/mth
Income distribution
Annual, 30 June
Applications/RedemptionWeekly
UNIT PRICE SUMMARY
Date
31 March 2015
Buy Price 1.5549
Redemption Price1.5425
Mid Price1.5487
Portfolio value$63.5m
Forager Funds Management
#11 – Quarterly Report March 2015
AUSTRALIAN FUND PERFORMANCE
A strong contribution from the Australian Fund’s software businesses made for a
good start to the year, but not quite enough to beat the benchmark. High prices
make the search for value harder but there are opportunities around.
The benchmark ASX All Ordinaries Accumulation Index
returned a booming 10% in the March quarter. Surging share
prices for software companies GBST Holdings (GBT) and
Hansen Technologies (HSN) helped the Australian Fund
produce a 9% return for the same period.
Table 1: Summary of returns as at 31 March 2015
major gas liquefaction plants. The iron ore price has tumbled,
weakening a key revenue earner for the country. If the country’s
other key export, coal, is any guide, iron ore has a long period
of structural adjustment ahead. It could be a deep depression of
endless cost-cutting and oversupply.
Australian Fund
8%
60,000
6%
50,000
4%
40,000
2%
30,000
Chart 2: RBA cash rate versus All Ordinaries
ASX All Ords
Accum. Index
1 month return
4.87%
–0.03%
3 month return 9.43%
10.21%
6 month return
5.72%
13.04%
1 year return
11.59%
13.25%
2 year return (pa)
17.94%
13.22%
3 year return (pa)
22.15%
14.72%
Since inception* (pa)
13.59%
8.96%
0%
Chart 1: Comparison of $10,000 invested in Australian Shares
Fund vs ASX All Ordinaries Accum Index
$20,000
$15,000
$10,000
I
Mar 10
Australian Shares Fund
Source: S&P Capital IQ
I
Mar 11
I
Mar 12
I
Mar 13
I
Mar 14
I
Mar 15
ASX All Ords. Index
The rising market is being fueled by increased conviction that
interest rates in this country will be low for a long time, and
that’s emboldening investors to bid up the price of blue-chip
shares as well as bonds, property and anything else that
generates reliable (or sort-of-reliable) cash flow. Since the global
financial crisis the Australian market has rallied from 11 to 17
times earnings, and it’s starting to look overstimulated.
Low interest rates certainly increase the present value of fixedinterest investments like bonds, but the relationship between
interest rates and the value of shares is not clear cut – low
interest rates often signal a poor environment for corporate
earnings. The Reserve Bank has not, of course, sent interest
rates to emergency lows without reason, it is concerned the
Australian economy is in a frail state.
Investors should take heed too. A huge cycle of investment
in resources is coming to an end with the completion of the
I
Mar 09
I
Mar 11
I
Mar 13
I
Mar 15
20,000
Cash Rate
All Ords Accum. Index
Source: S&P Capital IQ, Reserve Bank of Australia
*Inception 31 Oct 2009
$5,000
I
Mar 07
A lower Australian dollar should rekindle demand for our
non-resource exports but can cushion the blow only a little.
Ideally investment in infrastructure would pick up some of the
slack, but as portfolio holdings Coffey International (COF)
and Infigen Energy (IFN) can attest, political uncertainty has
gridlocked decision making. With important projects being delayed
and cancelled, the expected help could be too little, too late.
For now the impact seems contained to the energy and mining
sectors, but second and third order effects will surely flow to
other sectors. As tax receipts and employment fall in the resource
states of Queensland and Western Australia, spending must be
trimmed elsewhere too. This impacts demand, which hurts not
only discretionary consumer sectors like retail, but also housing,
finance and white-collar services. The logical outcome should be
weak revenues and earnings across the economy, which could be
a nasty spectacle with the sharemarket so highly priced.
Balanced against this, low interest rates could drive the market
higher still in the interim. So how should investors respond to
these circumstances? We’re not willing to speculate on evertightening dividend yields and intend, as we have always done,
to steer clear of the high-priced blue chips. This might make the
market hard to outperform in the short-term.
That’s actually how it should be. Our job is to find long-term
value which means we must steer clear of today’s glamour stocks
and focus on what is disliked, overlooked or misunderstood.
Misunderstood might be the key term, because where something
is disliked but well understood then it is no bargain. Indeed
there are resource companies whose shares have fallen 90% that
are much better understood now than they were previously.
Where things are both disliked and misunderstood there is
great opportunity but the market only affords us this severe
pessimism occasionally. Pockets of mining services today or in
infrastructure five years ago, for example.
Forager Funds Management
#12 – Quarterly Report September 2014
“IN THE UK, GBST HAD THE SUPER-CHARGED
COMBINATION OF HIGH SWITCHING COSTS AND AN
OVERWHELMING DRIVER FOR CHANGE”
But when the sharemarket is high, like today, there aren’t that
many disliked things just lying around. So it’s not easy to buy
super cheap. To generate returns through a bull cycle, we need
to identify things that aren’t obviously cheap so much as
misunderstood, their true value not apparent straight away.
These opportunities occur in all markets rather than just
depressed ones.
SOFTWARE SUPERB
Examples of these misunderstood opportunities can be found in
GBST and Hansen, by far the best performers in the Australian
Fund over the last year, where the value on offer was far greater
than it appeared on the surface. In the case of GBST it was
much greater than we originally understood also.
When we first came across GBST, a provider of software to the
finance industry, it traded at 26 times statutory earnings and had
a bit of a scruffy history. Its Australian operations were profitable
and stable, but it had acquired an international capital markets
business called Syn which was a disaster and was losing money.
Offsetting this, the expansion of GBST’s wealth management
platform Composer into the UK looked to have some potential.
Chart 3: GBST International wealth management revenue
$25m
$20m
$15m
$10m
$5m
$0m
FH1 13
FH2 13
FH1 14
FH2 14
FH1 15
Source: GBST
Like Hansen does in billing and invoicing, GBST runs a business
where customers encounter very high costs to switch providers.
This means revenue is rather ‘sticky’ – when customers join
they often stick around for decades. That permits healthy profit
margins. In the UK, GBST had the super-charged combination
of high switching costs and an overwhelming driver for change.
That pointed to a dramatic and permanent expansion in
activities and huge value creation. Customers were forced to
upgrade to remain in business and each one who signed-up
potentially generates revenue for 20 years.
Along with rival Bravura, GBST had stepped on the proverbial
gold mine. You can see the results to date in Chart 3. That’s
growth every six months, not annualised, and will continue for
years yet.
In early 2013, GBST was a bargain at twice the price. You had
something like the opportunity that the market sees in front of
accounting software provider Xero (XRO): enormous scale growth
from which defensive revenues and high margins will flourish
long-term. But unlike Xero, the market hadn’t understood the
opportunity well, and GBST didn’t trade at 30 times revenue.
Value investors must always demand a discount to fair value,
but it’s important to be aware that for some businesses fair
value can be a high multiple of today’s earnings (conversely
for others it can be a very low one). The business model of a
software company is nothing at all like a supermarket or an
asset intensive property trust where the capital gains on offer
are either capped or incremental. Dramatic growth potential at
high margin has a lot of value, as is becoming apparent. GBST
shares finished the quarter 58% higher at $5.98. Hansen shares
were 27% higher at $2.32.
The lesson is to watch closely and be alert for hidden earnings
power. A business trading at 15 times earnings can offer as
much value as another trading at half tangible assets. These
misunderstood opportunities are out there today.
We deduced that underlying profitability was being hidden by
the loss making Syn, and by amortization charges being made in
addition to heavy research and development expenses. Stripping
those negative amounts out, and GBST traded around 6 times
pre-tax earnings, a cheap price we thought for a business with
fairly stable customers and revenue, certainly much cheaper
than peers like Iress (IRE). Potentially the Australian business
was also suffering from low trading volumes in capital markets
which could recover, boosting earnings.
HUGHES MAKING THE HARD YARDS
Moving back to the ‘disliked’ part of our investing activities,
mining service providers have been rudely dropped from most
investor portfolios as gloom envelops commodity markets. To
an extent the pessimism is justified, mining services companies
tend to feature a nasty dual-combination of flakey business
models and cyclical industry exposure. We’ve argued there’s
value in the sector but so far are poorer for the experience.
That analysis was fair enough, but the true value of the UK
business wasn’t completely apparent to us. It was set to be
immense. Changes to regulations were forcing the retirement
industry, which traditionally had offered annuity-type pension
products, to offer a far greater range of investment options, more
like the superannuation system in Australia. The incumbents of
the UK retirement industry had legacy software platforms unable to
offer multiple investment products and were compelled to upgrade.
Good companies have an uncanny way of making hard yards
through tough times however, setting themselves up for brighter
results when conditions eventually turn. That seems to be the
case with Hughes Drilling (HDX), which reported an impressive
interim result against the general tide. The company provides – you
guessed it – drilling services to the mining sector and reported
a big jump in profit from its west coast operations. That led to
overall underlying profit 38% higher than the six months prior.
Forager Funds Management
#13 – Quarterly Report March 2015
“GOOD COMPANIES HAVE AN UNCANNY WAY
OF MAKING HARD YARDS THROUGH TOUGH
TIMES HOWEVER, SETTING THEMSELVES UP
FOR BRIGHTER RESULTS WHEN CONDITIONS
EVENTUALLY TURN”
Margins on the east coast, the historic profit engine of the
business, remain suppressed due to the dire state of the coal
market, but Hughes continues to gain new contracts nonetheless.
It seems to be through the worst of it now. Utilisation should
improve and full year profit is likely to be stronger than the
first half.
Hughes shares can be purchased today at half book value,
despite having rallied 52% to $0.16 in the March quarter,
which makes it interesting but far from the cheapest thing in
the sector. In the table below we’ve lined Hughes up against
equipment hire business Emeco Holdings (EHL). You can see
that Emeco trades at a much bigger discount to its book value.
EmecoHughes
Price / tangible book value
0.2 x
0.5 x
Return on equity
(6%)
19%
Debt / EBITDA
4.5 x
1.7 x
But you can also see why Hughes might be the better
investment idea. Emeco is losing money and has too much
debt, which puts shareholders in a precarious situation unless
conditions improve quickly. If losses were to continue like this
for another 3 years before heading back to a more ‘normal’
return on equity, investors today need to demand something
like a 40% discount to book value to make a reasonable return,
factoring nothing in for the cost of distress.
The market discount is bigger than that and Emeco may
prove a decent investment for the brave. But Hughes, with a
more workable debt load and an excellent return on equity, is
plausibly worth twice book value if it can just maintain current
revenue and margins.
It’s likely to do better on both counts. The company is run
by a passionate owner manager in Bob Hughes, who possesses
a wealth of drilling experience and knows how to run a lean
ship. Hughes also has its own in-house drill manufacturing
capabilities through Reichdrill which is delivering new
equipment cheaper and quicker than competitors can manage.
That has afforded Hughes a big cost advantage in a price
sensitive market.
Hughes sells for the princely sum of 3 times earnings (astute
readers might have noticed the nice combination of a big discount
to book value and high return on equity) and, as you’d expect
for a company so cheap, it’s not all roses and petals. The
industry is volatile and the debt, though not as high as Emeco’s,
is higher than we would like. Hughes has only recently become
public and is still a maturing business, the corporate team is slim
and the business is basically being run in the Managing Director’s
head. There is plenty of key man risk and it’s plausible the cost
advantage is lost if competitors step-up their game.
But the cheap price compensates us well for these risks and
Hughes is a very interesting investment proposition.
Mid-tier construction group Watpac (WTP) also has a mining
services division, which, just like Macmahon (MAH), is watching
revenue evaporate. BC Iron (BCI) recently announced the early
termination of Watpac’s services at the Nullagine Joint Venture
mine in Western Australia’s Pilbara region. That contract
accounted for around $100m per year in revenue and will be
hard to replace.
There’s still value in that mining segment however, and with
a strong balance sheet and conditions improving in Watpac’s
east coast construction market, the company has plenty of
flexibility as to how to manage these difficulties. On top of this
management has begun to make noises about using its excess
cash for capital management purposes (usually this means a
share buyback or capital return).
Today’s share price of $0.80 doesn’t reflect the value of the
excess capital on top of the construction and mining segments,
and we added a few more shares to our investment in the
Australian Fund in March.
SERVICE STREAM’S ONE SOLID PERFORMANCE
Chairman Peter Dempsey announced ‘another solid
performance’ from Service Stream (SSM), a significant
Australian Fund investment.
In all the recent turmoil we must have missed the other ‘solid’
performances from this telecommunication services business
over the past few years.
Nevertheless, the half year results were pleasing. The Fixed
Communication segment, the cause of all yesterday’s headaches,
continues its regeneration, reporting a 29% growth in revenue
and 23% higher earnings before interest, tax, depreciation and
amortisation than six months ago.
The National Broadband Network rollout is yet to ramp-up in
earnest. But it is already an important revenue contributor for
Service Stream and can be a major source of value for the next
10 years, assuming the management team can avoid some of the
execution disasters of the past.
While the first half results suggest that’s looking more likely, the
market hasn’t changed its view. Service Stream shares finished
the quarter 16% higher at $0.22 but were basically unchanged
after the results were announced.
The dividend was reinstated with a 0.5c interim payment. At a
market capitalisation of $80m, Service Stream trades at around
10 times earnings based on the half year results. That’s on thin
margins – the multiple of revenue is only 0.2 times – and we
expect revenue can grow too. Debt is now under control and
the associated risk has dropped a long way since we initially
ventured in to this. Let’s hope for more solid results to come.
Forager Funds Management
Suite 302, 66 King Street
Sydney NSW 2000
P +61 (0) 2 8305 6050
Wforagerfunds.com


© Copyright 2026