
Complete Genomes Reveal Signatures of Demographic and
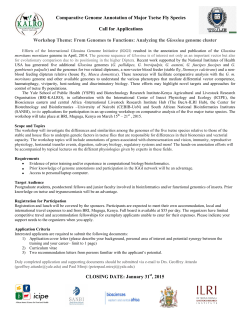
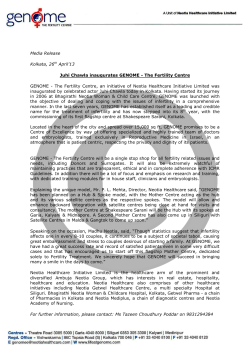
Report
Complete Genomes Reveal Signatures of Demographic
and Genetic Declines in the Woolly Mammoth
Highlights
d
Complete high-quality genomes from two woolly mammoths
were sequenced and analyzed
d
40,000-year time difference between samples enabled
calibration of molecular clock
Authors
Eleftheria Palkopoulou,
Swapan Mallick, ..., David Reich,
Love Dale´n
Correspondence
d
Demographic inference identified two severe bottlenecks in
the species’ history
[email protected] (E.P.),
[email protected] (L.D.)
d
One of the last surviving mammoths had low heterozygosity
and signs of inbreeding
In Brief
Palkopoulou et al., 2015, Current Biology 25, 1–6
May 18, 2015 ª2015 Elsevier Ltd All rights reserved
http://dx.doi.org/10.1016/j.cub.2015.04.007
Palkopoulou et al. sequenced complete
genomes from two woolly mammoths,
including one dated to just before the
species’ extinction. Demographic
inference indicates an ancient bottleneck
and a decline at the start of the Holocene.
Comparative analyses show that the
woolly mammoth was subject to reduced
genetic variation prior to its extinction.
Please cite this article in press as: Palkopoulou et al., Complete Genomes Reveal Signatures of Demographic and Genetic Declines in the Woolly
Mammoth, Current Biology (2015), http://dx.doi.org/10.1016/j.cub.2015.04.007
Current Biology
Report
Complete Genomes Reveal Signatures of Demographic
and Genetic Declines in the Woolly Mammoth
Eleftheria Palkopoulou,1,2,* Swapan Mallick,3,4,5 Pontus Skoglund,3,4,6 Jacob Enk,7,8 Nadin Rohland,3,4 Heng Li,3,4
Ayc¸a Omrak,6 Sergey Vartanyan,9 Hendrik Poinar,7 Anders Go¨therstro¨m,6 David Reich,3,4,5 and Love Dale´n1,*
1Department
of Bioinformatics and Genetics, Swedish Museum of Natural History, 10405 Stockholm, Sweden
of Zoology, Stockholm University, 10691 Stockholm, Sweden
3Department of Genetics, Harvard Medical School, Boston, MA 02115, USA
4Broad Institute of MIT and Harvard, Cambridge, MA 02142, USA
5Howard Hughes Medical Institute, Harvard Medical School, Boston, MA 02115, USA
6Department of Archaeology and Classical Studies, Stockholm University, 10691 Stockholm, Sweden
7McMaster Ancient DNA Centre, Departments of Anthropology and Biology, and the Michael G. DeGroote Institute for Infectious Disease
Research, McMaster University, 1280 Main Street West, Hamilton, ON L8S 4L9, Canada
8MYcroarray, 5692 Plymouth Road, Ann Arbor, MI 48105, USA
9N.A. Shilo North-East Interdisciplinary Scientific Research Institute, Far East Branch, Russian Academy of Sciences (NEISRI FEB RAS),
Magadan 685000, Russia
*Correspondence: [email protected] (E.P.), [email protected] (L.D.)
http://dx.doi.org/10.1016/j.cub.2015.04.007
2Department
SUMMARY
RESULTS AND DISCUSSION
The processes leading up to species extinctions
are typically characterized by prolonged declines
in population size and geographic distribution, followed by a phase in which populations are very small
and may be subject to intrinsic threats, including loss
of genetic diversity and inbreeding [1]. However,
whether such genetic factors have had an impact on
species prior to their extinction is unclear [2, 3]; examining this would require a detailed reconstruction of a
species’ demographic history as well as changes in
genome-wide diversity leading up to its extinction.
Here, we present high-quality complete genome sequences from two woolly mammoths (Mammuthus
primigenius). The first mammoth was sequenced at
17.1-fold coverage and dates to !4,300 years before
present, representing one of the last surviving individuals on Wrangel Island. The second mammoth,
sequenced at 11.2-fold coverage, was obtained
from an !44,800-year-old specimen from the Late
Pleistocene population in northeastern Siberia. The
demographic trajectories inferred from the two genomes are qualitatively similar and reveal a population bottleneck during the Middle or Early Pleistocene, and a more recent severe decline in the
ancestors of the Wrangel mammoth at the end of
the last glaciation. A comparison of the two genomes
shows that the Wrangel mammoth has a 20% reduction in heterozygosity as well as a 28-fold increase in
the fraction of the genome that comprises runs of
homozygosity. We conclude that the population on
Wrangel Island, which was the last surviving woolly
mammoth population, was subject to reduced genetic diversity shortly before it became extinct.
The woolly mammoth is considered to have been one of the
most abundant megafaunal species during the Middle to Late
Pleistocene, yet along with !70 other species of large mammals, it became extinct throughout most of its range at the
Pleistocene/Holocene transition !11,000 years ago [4]. A few
small, isolated populations persisted into the Holocene on
islands off the coasts of Siberia and Alaska that had become
isolated from the mainland by rising sea levels [5, 6]. The last
known population inhabited Wrangel Island until !4,000 years
ago [7].
We extracted DNA from the remains of ten woolly mammoths
from Wrangel Island (Figure 1A) and used shotgun sequencing
on a pool of indexed libraries to assess their levels of preservation
(see Supplemental Experimental Procedures for full details). This
allowed us to identify a molar tooth that contained a high proportion of mammoth DNA (!80%; Table S1). With a direct calibrated
radiocarbon age of !4,300 calendar years (Figure 1B; Table S1),
this represents one of the most recently dated specimens that has
been discovered on the island [7].
We also extracted DNA from a soft tissue sample obtained
from a juvenile Siberian mammoth found in the Oimyakon District
of Yakutia in northeastern Siberia (Figure 1A) and dated to
!44,800 calendar years ago [8] (Figure 1B). This individual,
henceforth referred to as Oimyakon, was a member of the widespread woolly mammoth population that inhabited continental
Eurasia during the Late Pleistocene.
We generated double-stranded DNA libraries from extracts
of both specimens using uracil-DNA glycosylase treatment to
excise uracils, following established protocols [9, 10]. As a reference, we used the genome of the African savanna elephant
(Loxodonta africana) generated from a 6.8-fold coverage assembly at the Broad Institute (LoxAfr4). This assembly was based
on paired-end long Sanger sequencing reads with a range of
insert sizes, and optical mapping, allowing the construction of
chromosome-length supercontigs. Approximately 76% of the
sequences from the Wrangel individual aligned to the reference
Current Biology 25, 1–6, May 18, 2015 ª2015 Elsevier Ltd All rights reserved 1
Please cite this article in press as: Palkopoulou et al., Complete Genomes Reveal Signatures of Demographic and Genetic Declines in the Woolly
Mammoth, Current Biology (2015), http://dx.doi.org/10.1016/j.cub.2015.04.007
A
B
Sample
C date
± error
(years)
Median
calibrated
date
(years)
# raw
reads
6
(×10 )
Average
coverage
Average
read
length
(bp)
Wrangel
3,905
± 47
4,336
1,262
17.1
69
Oimyakon
41,300
± 900
44,828
1,401
11.2
55
14
Population size (scaled in units of 4µNe × 103)
C
Eemian Interglacial
Pleistocene/Holocene transition
4ky
40ky
400ky
(2.7-24ky)
(27-240ky)
(0.27-2.4My)
3.5
4My
(2.7-24My)
Oimyakon
Wrangel
Oimyakon-Wrangel chrX
3
2.5
2
1.5
1
0.5
0
-5
10
-4
10
10
Time (scaled in units of 2µT)
-3
-2
10
Figure 1. Geographic Location and Dating of Samples, Mapping Statistics of the Two Genomic Libraries, and Inference of Population Size
Changes through Time
(A) Map indicating the sites where the mammoth samples were collected. The dashed red line indicates the approximate extent of the Beringia coastline during
the last glacial maximum.
(B) Sample dating information and mapping statistics of the two libraries. 14C date ± error refers to the radiocarbon age of each specimen and associated
standard error. Median calibrated date refers to the median estimate of the calibrated radiocarbon date. Average read length (bp) refers to aligned sequences
only.
(C) Population size history inferred using the PSMC method. Time is given in units of divergence per base pair on the lower x axis and in years before present on
the upper x axis. The latter assumes the substitution rate estimated in this study based on the age difference between the two samples. (The range given in
parentheses takes into account the uncertainty of the rate estimate as well the range of rate estimates obtained from paleontological calibration; see Table 1.) The
PSMC curves of the Oimyakon genome and the pseudo-diploid chromosome X are empirically corrected for missing heterozygotes (false negatives = 30%) and
are shifted along the x axis so that the former is aligned to the curve of the Wrangel genome and the latter ends at !24,500 years ago, the average age of the two
individuals (which was converted in units of divergence based on the mean substitution rate estimated in this study). The Ne of the PSMC curve of the pseudodiploid chromosome X was scaled by 0.75. The Eemian interglacial period and the Pleistocene/Holocene transition are indicated by gray vertical bars assuming
the mean substitution rate estimated in this study. See also Table S1 and Figure S1.
genome with an average length of 69 bp, yielding 17.1-fold
average coverage. For the Oimyakon individual, 64% of sequences aligned and had average lengths of 55 bp, yielding
11.2-fold coverage (Figure 1B). We did not detect an excess of
nucleotide misincorporations at the terminal positions of the sequences. Such misincorporations typically derive from cytosine
deamination outside of CpG dinucleotides; their absence indicates that uracil excision was effective in both libraries (Figure S1). Phylogenetic analysis of the complete mitochondrial
(mt) genomes from both individuals together with previously
published woolly mammoth mitochondrial genomes [11] placed
the Wrangel individual within mtDNA clade I [12] and the Oimyakon individual within mtDNA clade II [12] (Figure S2). These two
mitochondrial clades have been proposed to represent two
highly divergent populations or species [11, 13].
We inferred the history of population size changes in the
ancestors of the two individuals using the pairwise sequentially
Markovian coalescent (PSMC) method [14]. This approach uses
the density of heterozygous sites across the diploid genome of
a single individual to infer the distribution of the time to the
most recent common ancestor (TMRCA) between the two alleles
across all chromosomes. This in turn can be used to infer effective
population size (Ne) changes over time since effective population
size is inversely proportional to coalescent rate. The estimated
population size histories were qualitatively similar for Wrangel
and Oimyakon but were offset by a fixed amount (Figure S3A),
as might be expected since Oimyakon was around DT =
44,828 " 4,336 = 40,492 years older than Wrangel. We inferred
the number of missing substitutions per base pair in the Oimyakon genome that would be needed in order for the two populations to have the most concordant curves to be d = 0.0001
(range = 0.00004–0.00015) per base pair (Figure S3C). We then
used this estimate to infer a substitution rate per base pair
since we know that the rate of accumulation of divergent sites between samples is fully determined by two times the product of
the substitution rate and time: d = 2m(DT) [15]. The estimated substitution rate is m = 1.23 3 10"9 (range = 0.49 3 10"9–1.85 3 10"9)
per base pair per year, which is equivalent to 3.83 3 10"8
2 Current Biology 25, 1–6, May 18, 2015 ª2015 Elsevier Ltd All rights reserved
Please cite this article in press as: Palkopoulou et al., Complete Genomes Reveal Signatures of Demographic and Genetic Declines in the Woolly
Mammoth, Current Biology (2015), http://dx.doi.org/10.1016/j.cub.2015.04.007
Table 1. Dating of Different Events in Years and Ne Estimation Using Alternative Substitution Rate Calibrations
Mean (m)f
Substitution Rate (m)
Recent Bottlenecka
Earlier Bottleneckb
Wrangel-Oimyakon
Splitc
Wrangel-Oimyakon
Splitd
Wrangel
Bottleneck Nee
1.23 3 10"9
12,195
284,553
49,877
53,000–64,000
f
1.85 3 10"9
8,108
189,189
41,400
50,000–57,000
218
Lower limit (m)f
0.49 3 10"9
30,612
714,286
88,077
65,000–93,000
823
Upper limit (m)g
0.6 3 10"9
25,135
586,486
76,717
61,000–84,000
g
0.21 3 10"9
70,541
1,645,946
170,896
91,000–155,000
Upper limit (m)
Lower limit (m)
328
676
1,896
a
Estimated time for the recent decline in Ne observed in the PSMC curve of the Wrangel genome.
Estimated time for the earlier decline in Ne observed in the PSMC curves of both mammoth genomes.
c
Split time between the Wrangel and Oimyakon individuals inferred from the PSMC analysis of the pseudo-diploid chromosome X.
d
Split time between the Wrangel and Oimyakon individuals inferred from the F(AjB) analysis using autosomal data.
e
Ne for the Wrangel population following the recent bottleneck inferred by the PSMC analysis.
f
Mean, lower, and upper limit of the range of substitution rates (per bp per year) estimated in this study by lining up the two PSMC curves.
g
Upper and lower limit of the substitution rates (per bp per year) obtained from paleontological calibration, assuming 6.2–17.4 million years for the
genetic divergence time between African and Eurasian elephants (see Supplemental Experimental Procedures for details).
b
(range = 1.53 3 10"8–5.73 3 10"8) per base pair per generation
assuming a generation time of 31 years [16]. Our inference that
the substitution rate in mammoths is twice as high as the substitution rate recently estimated in humans using the same method
(m = 0.43 3 10"9 per base pair per year) [15] may initially seem
surprising since earlier studies have suggested that substitution
rates in elephants may have been half that between humans
and chimpanzees (an apparent factor of four difference)
[13, 17]. However, there is substantial statistical uncertainty in
all of these estimates, and part of the apparent discrepancy
may have nothing to do with the accuracy of our rate estimate
in mammoths and instead may reflect a major slowdown in the
substitution rate in the hominin lineage [18]. In all of the analyses
that follow, we use the PSMC-based point estimate of the substitution rate, which we view as the most accurate available, as this
is the most direct estimate of the rate of substitutions that is
available over the last tens of thousands of years of mammoth
history, which are the main focus of this study. However, to be
conservative, we also always quote a range of uncertainty of
0.21 3 10"9–1.85 3 10"9 per base pair per year, which is a union
of the range of statistical uncertainty around the point estimate
(0.49 3 10"9–1.85 3 10"9 per base pair per year) as well as an independent estimate of the substitution rate of 0.21 3 10"9–0.6 3
10"9 per base pair per year that we obtained based on a
more traditional calibration to the paleontological record. Specifically, we assume a genome-wide average genetic divergence
time Tdiv(African-Eurasian) = 6.2–17.4 million years for African and
Eurasian elephants and note that the divergence per base pair
between the African savanna elephant genome and Wrangel
is DAfrican-Eurasian = 0.0074 per base pair, which gives the substitution rate estimate range via the formula m = DAfrican-Eurasian/
2Tdiv(African-Eurasian) (see Supplemental Experimental Procedures
for full details).
The Wrangel and Oimyakon individuals appear to have nearly
identical demographic trajectories, once we line up the curves to
account for the difference in the ages of the two samples (Figure 1C). In both genomes, we infer a dramatic reduction in Ne
during the Middle or Early Pleistocene with a point estimate of
285,000 years ago (range of 189,000–1,646,000 years ago)
(Table 1). A similar population bottleneck followed by population
expansion has previously been suggested based on mtDNA data
[19]; however, the estimated time of this event was associated
with the penultimate interglacial period (the Eemian [20],
116,000–130,000 years ago). The timing of the decline in Ne inferred using PSMC analyses of both genomes, across the entire
range of dates obtained by our substitution rate estimates
(Table 1), definitively predates the Eemian and thus does not
seem to reflect this particular climatic event. Interestingly,
ancient horses from Taymyr in Russia exhibit a reverse demographic pattern compared to woolly mammoths, with a demographic expansion at !280,000 years ago and a decline during
the Eemian as inferred using the PSMC analysis [21]. Following
the population size recovery, Ne in woolly mammoths appears
to have remained comparatively stable until a drastic reduction
at !12,000 years ago in the history of the Wrangel mammoth’s
genome (8,000–71,000 years; Table 1). Our best estimate
for the timing of this steep decline in Ne coincides with the
Pleistocene/Holocene transition and the subsequent isolation
of Wrangel Island due to rising sea levels [7] and simultaneous
disappearance of mammoths from mainland Eurasia [4]. We
note that the upper limit of our range of uncertainty for this
estimate (up to 71,000 years) is incompatible with the population
history of the two woolly mammoths since the most recent
decline, inferred in the Wrangel mammoth’s genome, appears
to have occurred after the death of the Oimyakon individual.
To test the hypothesis that woolly mammoths carrying clade
I and II mtDNA haplotypes represented highly divergent populations, we estimated the divergence time of the ancestral populations of the Wrangel and Oimyakon individuals using two independent methods. First, the proportion of sequences mapping
to chromosome X suggests that both individuals were males,
which allowed us to construct a pseudo-diploid genome by
combining their X chromosomes and estimate rates of coalescence between their ancestral populations [14]. The coalescence rate for the pseudo-diploid X chromosome is inferred to
have changed over time in a similar manner as for the Wrangel
and Oimyakon autosomes until the split of the two populations.
The estimated split time dates to just before the death of the
Oimyakon individual; after this period the PSMC estimates a
sharp increase in Ne to an unmeasurably large size, reflecting
Current Biology 25, 1–6, May 18, 2015 ª2015 Elsevier Ltd All rights reserved 3
30.5 31.0 31.5 32.0 32.5 33.0 33.5 34.0
F(A|B) (%)
Please cite this article in press as: Palkopoulou et al., Complete Genomes Reveal Signatures of Demographic and Genetic Declines in the Woolly
Mammoth, Current Biology (2015), http://dx.doi.org/10.1016/j.cub.2015.04.007
Observed F(Wrangel | Oimyakon)
95% CI for F(Wrangel | Oimyakon)
Calibrated F(A | B) as a function of split time
0.00
0.05
0.10
0.15
0.20
Population split time before the death of Oimyakon
(scaled in units of Ne × generations)
Figure 2. Population Split Time Estimate between the Wrangel and
Oimyakon Populations
The probability F(AjB) of observing a derived allele in population A (Wrangel) at
a heterozygous site in population B (Oimyakon) is obtained by simulating the
history of population B (Oimyakon) as inferred using the PSMC method. Polarization of the alleles was based on the African savanna elephant, which was
assumed to carry the ancestral state. The vertical dotted lines indicate the split
times between the Wrangel and Oimyakon populations that encompass the
confidence interval of the observed F(WrangeljOimyakon). Time on the x axis
represents the population split time before the death of the Oimyakon individual and is scaled by Ne and generation time, where Ne indicates the terminal
effective population size of the Oimyakon individual as inferred using the
PSMC analysis. See also Figure S2.
an absence of detected coalescent events as would be expected if the populations were separated (Figures 1C and
S3B). Similarly, the split time (T) between the populations represented by the Oimyakon and Wrangel genomes was estimated
at !50,000 years ago (range 41,000–171,000 years ago; Table 1),
indicating that the Wrangel and Oimyakon populations shared
ancestry until shortly before the death of the Oimyakon individual. To further investigate the split time of the ancestral populations, we used an independent approach for estimating population split times that uses the probability of a SNP across the
diploid genome that is heterozygous in one population (Oimyakon) being derived in a second population (Wrangel) as a function of population split time [22, 23]. Based on this method, the
Wrangel and Oimyakon populations were estimated to have
split from each other 53,000–64,000 years ago (range 50,000–
155,000 years ago) (Table 1; Figure 2). Overall, these results
contrast sharply with those from a previous genomic study
based on two low-coverage autosomal genomes. The previous
study suggested coalescent times of !1–2 million years between individuals that carried clade I and II mtDNA haplotypes
and proposed that these individuals may have represented
different species or highly divergent populations [13]. Based on
the findings from the two autosomal genomes presented here,
we conclude that there are multiple lines of strong evidence
against this hypothesis. The observed discordance between
nuclear and mtDNA estimates of divergence is not surprising if
we consider the biology and natural history of the Elephantidae.
Females are largely non-dispersing, and this tends to produce
deeper coalescent times for mtDNA lineages compared to nuclear coalescent dates [24]. Conflicting genetic patterns between nuclear and mtDNA have been observed in modern
elephants [25]. Indeed, all extant elephant species exhibit
mtDNA coalescent dates that are about as old as the divergence
date between mtDNA clades I and II in woolly mammoths [26].
Average autosomal heterozygosity in the Wrangel individual
was 1.00 heterozygous site per 1,000 bp (confidence interval
[CI] 0.99–1.02), which is 20% lower than the heterozygosity
observed in the Oimyakon individual (CI 1.23–1.27 per
1,000 bp; Table S2). This is consistent with results from previous
genetic studies [27, 28] indicating a loss of genetic diversity as
mammoths became isolated on Wrangel Island and is likely a
consequence of a reduced Ne due to the island’s small size
and estimated low carrying capacity [27]. When compared to
genome-wide diversity levels in extant organisms (Figure 3A),
we find that heterozygosity in the Wrangel individual was low,
but not exceptionally so. Diversity in the Wrangel genome falls
close to that observed in humans, bonobos, eastern lowland gorillas, and western chimpanzees, which have also experienced
dramatic declines in population size during their history as inferred from PSMC analyses [29]. On the other hand, the Wrangel
individual harbored higher genomic diversity than that observed
in several other endangered taxa such as lions, tigers, Tasmanian devils, snow leopards [30], and polar bears [31], most of
which have experienced recent declines in population size. We
speculate that the particularly low heterozygosity in these latter
taxa may be partly due to these species all being predators,
which typically occur at low population densities and thus have
had comparatively small effective population sizes throughout
their history.
To examine the genomes for runs of homozygosity (ROHs), we
estimated the inferred TMRCA at every position across the
genome of each individual using the PSMC method. An extreme
excess of ROHs was detected in the Wrangel genome (23.3% of
the genome constituted ROHs) compared to the Oimyakon
genome (0.83% of the genome constituted ROHs), providing evidence of a small Ne in the recent history of the Wrangel individual
(Figures 3B and 3C), consistent with the PSMC results. Most of
these regions of low heterozygosity were found to span a few
million base pairs and were distributed across all autosomes
(Figure S4). ROHs of such length typically occur from background relatedness associated with limited population size in
the last dozens of generations rather than due to recent mating
of closely related individuals, which would be expected to produce much longer stretches [32]. Thus, we find no evidence of
inbreeding in the sense that the parents of the Wrangel individual
were particularly close relatives. Instead, it seems likely that the
large proportion of ROHs in the Wrangel genome is due to a cumulative effect of recurrent breeding among distant relatives,
which is consistent with a small Holocene effective population
size on Wrangel Island. Further genomic analyses on additional
specimens from Wrangel [7] should be able to resolve this
issue and enable detailed reconstruction of population size
changes over the Holocene period when Wrangel Island became
separated from the mainland. Additional analyses on mammoths
representing the last remaining mainland populations in Eurasia
and North America would also be valuable in order to shed light
4 Current Biology 25, 1–6, May 18, 2015 ª2015 Elsevier Ltd All rights reserved
Please cite this article in press as: Palkopoulou et al., Complete Genomes Reveal Signatures of Demographic and Genetic Declines in the Woolly
Mammoth, Current Biology (2015), http://dx.doi.org/10.1016/j.cub.2015.04.007
Sumatran orangutan
Western lowland gorilla
Bornean orangutan
Central chimpanzee
Brown bear
Eastern chimpanzee
Nigeria/Cameroon chimp.
Giant panda
Cross River gorilla
Oimyakon woolly mammoth
Wrangel woolly mammoth
Eastern lowland gorilla
Western chimpanzee
Bonobo
White Bengal tiger
Sub-saharan African lion
Amur tiger
Polar bear
Tasmanian devil
Snow leopard
0
0.001
0.002
Figure 3. Estimates of Genome-Wide Heterozygosity and Runs of Homozygosity
B
20
0
10
1500
1000
0
2
4
6
8
10
12
14
500
Frequency
2000
Wrangel
Oimyakon
0
A
0.003
0
Heterozygosity
2
4
6
8
ROH length in Mb
10
12
14
(A) Comparison of genome-wide heterozygosity estimates in different taxa/populations [29–31] and the
two woolly mammoths. See also Table S2.
(B) Histogram of the lengths (in Mb) of runs of homozygosity (ROHs) longer than 0.5 Mb within the
Wrangel (blue) and Oimyakon (purple) genomes. The
inset shows a magnification with a different y axis
scale.
(C) Inferred time to the most recent common ancestor
(TMRCA) for the two alleles of a single individual
along 106 Mb of chromosome 1 and chromosome 3,
with Wrangel on top and Oimyakon at the bottom.
The y axis shows the TMRCA, and the x axis shows
positions along the chromosome. Gray bars indicate
regions longer than 1 Mb that are inferred by the
PSMC method to have coalesced recently and
represent ROHs. See also Figure S4.
C
Wrangel
Oimyakon
Chromosome 1
Wrangel
Oimyakon
Chromosome 3
on whether these populations were also subject to reduced
genetic variation prior to their extinction at the end of the last
glaciation.
Interestingly, the lower heterozygosity in the Wrangel genome
can largely be explained by its higher proportion of ROHs. This
implies that heterozygosity is similar between regions of the
Wrangel genome that are not in ROHs and the Oimyakon
genome as a whole, which may seem odd given the high likelihood of genetic drift in the Holocene Wrangel population. We
suggest two possible hypotheses that might explain this observation. First, it is possible that positions in the Wrangel genome
that are not in ROHs are places where the TMRCA between the
Wrangel individual’s chromosomes extends all the way back to
the time when Wrangel was a part of the mainland (i.e., Beringia). If this is the case, then non-ROH regions should reflect
the genetic diversity that existed at the time before Ne declined
(as a consequence of the isolation on Wrangel). Alternatively,
the observed similarity in diversity may be an effect of the
Wrangel genome being of higher quality and/or coverage than
the Oimyakon genome, which could have allowed more heterozygous positions to be called in the analyses (due to lower
false-negative rates). If this is the explanation, the estimated
20% reduction in the Wrangel genome’s diversity may be an
underestimate.
In conclusion, our finding of an overall reduced genome-wide
diversity in one of the last surviving mammoths constitutes the
first direct observation of genetic stochasticity in a species
shortly before its extinction. Given that small population sizes
in wild animals often lead to reduced individual fitness [33], it
seems plausible that the low genetic variation detected in this study may have had a
negative impact on the fitness of the Wrangel Island population and thus may have
contributed to its subsequent extinction.
The results presented here also highlight
the value of sequencing ancient genomes
from specimens that predate population
declines to establish baseline levels of
genome-wide diversity. In conservation
biology, this approach can be used to directly quantify the
amount of diversity lost in threatened species.
ACCESSION NUMBERS
All sequence data described herein have been submitted to the European
Nucleotide Archive (http://www.ebi.ac.uk/ena) and are available under the
accession number ENA: ERP008929.
SUPPLEMENTAL INFORMATION
Supplemental Information includes four figures, two tables, and Supplemental
Experimental Procedures and can be found with this article online at http://dx.
doi.org/10.1016/j.cub.2015.04.007.
AUTHOR CONTRIBUTIONS
E.P., A.G., and L.D. conceived and designed the study. H.P., A.G., D.R., and
L.D. supervised the study. E.P., J.E., N.R., and A.O. performed the experiments. E.P., S.M., and P.S. processed and analyzed the genetic data with
input from H.L., D.R., and L.D. S.V., H.P., A.G., D.R., and L.D. provided samples and reagents. E.P. and L.D. wrote the manuscript with input from all
authors.
ACKNOWLEDGMENTS
The authors would like to thank Bernard Buiges and CERPOLEX, Alexei Tikhonov, Dan Fisher, and Ross MacPhee for providing access to material from Oimyakon and Regis Debruyne for assistance in the preparation of the Oimyakon
sample. E.P. and S.M. would like to thank Pier Francesco Palamara for advice
on the ROH analysis. L.D. acknowledges funding from the Swedish Research
Council (VR grant 2012-3869). E.P., A.G., and L.D. acknowledge support from
Science for Life Laboratory, the National Genomics Infrastructure (NGI), and
Current Biology 25, 1–6, May 18, 2015 ª2015 Elsevier Ltd All rights reserved 5
Please cite this article in press as: Palkopoulou et al., Complete Genomes Reveal Signatures of Demographic and Genetic Declines in the Woolly
Mammoth, Current Biology (2015), http://dx.doi.org/10.1016/j.cub.2015.04.007
UPPMAX for providing assistance in massive parallel sequencing and computational infrastructure. E.P. acknowledges funding from the project ‘‘IKY
Scholarships’’ financed by the operational program ‘‘Education and Lifelong
Learning’’ of the European Social Fund (ESF) and the NSRF 2007–2013. P.S.
was supported by the Wenner-Gren Foundations and the Swedish Research
Council (VR grant 2014-453). D.R. was supported by NIH grant GM100233
and is an investigator of the Howard Hughes Medical Institute. H.P. thanks
all members of the McMaster Ancient DNA Centre and was supported by an
NSERC Discovery Grant, the Canada Research Chairs Program (NSERC),
and McMaster University.
Received: February 18, 2015
Revised: March 12, 2015
Accepted: April 3, 2015
Published: April 23, 2015
REFERENCES
1. Caughley, G. (1994). Directions in conservation biology. J. Anim. Ecol. 63,
215–244.
2. Spielman, D., Brook, B.W., and Frankham, R. (2004). Most species are not
driven to extinction before genetic factors impact them. Proc. Natl. Acad.
Sci. USA 101, 15261–15264.
3. Jamieson, I.G., and Allendorf, F.W. (2012). How does the 50/500 rule apply
to MVPs? Trends Ecol. Evol. 27, 578–584.
4. Stuart, A.J., Kosintsev, P.A., Higham, T.F.G., and Lister, A.M. (2004).
Pleistocene to Holocene extinction dynamics in giant deer and woolly
mammoth. Nature 431, 684–689.
5. Vartanyan, S.L., Garutt, V.E., and Sher, A.V. (1993). Holocene dwarf mammoths from Wrangel Island in the Siberian Arctic. Nature 362, 337–340.
6. Veltre, D.W., Yesner, D.R., Crossen, K.J., Graham, R.W., and Coltrain, J.B.
(2008). Patterns of faunal extinction and paleoclimatic change from midHolocene mammoth and polar bear remains, Pribilof Islands, Alaska.
Quat. Res. 70, 40–50.
7. Vartanyan, S.L., Arslanov, K.A., Karhu, J.A., Possnert, G., and
Sulerzhitsky, L.D. (2008). Collection of radiocarbon dates on the mammoths (Mammuthus primigenius) and other genera of Wrangel Island,
northeast Siberia, Russia. Quat. Res. 70, 51.
8. Maschenko, E.N., Boeskorov, G.G., and Baranov, V.A. (2013).
Morphology of a mammoth calf (Mammuthus primigenius) from Ol’chan
(Oimiakon, Yakutia). Paleontol. J. 47, 425–438.
9. Meyer, M., and Kircher, M. (2010). Illumina sequencing library preparation
for highly multiplexed target capture and sequencing. Cold Spring Harb
Protoc 2010, t5448.
16. Rohland, N., Reich, D., Mallick, S., Meyer, M., Green, R.E., Georgiadis,
N.J., Roca, A.L., and Hofreiter, M. (2010). Genomic DNA sequences
from mastodon and woolly mammoth reveal deep speciation of forest
and savanna elephants. PLoS Biol. 8, e1000564.
17. Rohland, N., Malaspinas, A.-S., Pollack, J.L., Slatkin, M., Matheus, P., and
Hofreiter, M. (2007). Proboscidean mitogenomics: chronology and mode
of elephant evolution using mastodon as outgroup. PLoS Biol. 5, e207.
18. Scally, A., Dutheil, J.Y., Hillier, L.W., Jordan, G.E., Goodhead, I., Herrero,
J., Hobolth, A., Lappalainen, T., Mailund, T., Marques-Bonet, T., et al.
(2012). Insights into hominid evolution from the gorilla genome sequence.
Nature 483, 169–175.
19. Palkopoulou, E., Dale´n, L., Lister, A.M., Vartanyan, S., Sablin, M., Sher, A.,
Edmark, V.N., Brandstro¨m, M.D., Germonpre´, M., Barnes, I., and Thomas,
J.A. (2013). Holarctic genetic structure and range dynamics in the woolly
mammoth. Proc. Biol. Sci. 280, 20131910.
20. Kukla, G.J., Bender, M.L., de Beaulieu, J.L., Bond, G., Broecker, W.S.,
Cleveringa, P., Gavin, J.E., Herbert, T.D., Imbrie, J., Jouzel, J., et al.
(2002). Last interglacial climates. Quat. Res. 58, 2–13.
21. Schubert, M., Jo´nsson, H., Chang, D., Der Sarkissian, C., Ermini, L.,
Ginolhac, A., Albrechtsen, A., Dupanloup, I., Foucal, A., Petersen, B.,
et al. (2014). Prehistoric genomes reveal the genetic foundation and cost
of horse domestication. Proc. Natl. Acad. Sci. USA 111, E5661–E5669.
22. Green, R.E., Krause, J., Briggs, A.W., Maricic, T., Stenzel, U., Kircher, M.,
Patterson, N., Li, H., Zhai, W., Fritz, M.H.Y., et al. (2010). A draft sequence
of the Neandertal genome. Science 328, 710–722.
23. Pru¨fer, K., Racimo, F., Patterson, N., Jay, F., Sankararaman, S., Sawyer,
S., Heinze, A., Renaud, G., Sudmant, P.H., de Filippo, C., et al. (2014).
The complete genome sequence of a Neanderthal from the Altai
Mountains. Nature 505, 43–49.
24. Roca, A.L., Ishida, Y., Brandt, A.L., Benjamin, N.R., Zhao, K., and
Georgiadis, N.J. (2015). Elephant natural history: a genomic perspective.
Annu. Rev. Anim. Biosci. 3, 139–167.
25. Ishida, Y., Oleksyk, T.K., Georgiadis, N.J., David, V.A., Zhao, K., Stephens,
R.M., Kolokotronis, S.-O., and Roca, A.L. (2011). Reconciling apparent
conflicts between mitochondrial and nuclear phylogenies in African elephants. PLoS ONE 6, e20642.
26. Brandt, A.L., Ishida, Y., Georgiadis, N.J., and Roca, A.L. (2012). Forest
elephant mitochondrial genomes reveal that elephantid diversification in
Africa tracked climate transitions. Mol. Ecol. 21, 1175–1189.
27. Nystro¨m, V., Dale´n, L., Vartanyan, S., Lide´n, K., Ryman, N., and
Angerbjo¨rn, A. (2010). Temporal genetic change in the last remaining population of woolly mammoth. Proc. Biol. Sci. 277, 2331–2337.
10. Kircher, M., Sawyer, S., and Meyer, M. (2012). Double indexing overcomes
inaccuracies in multiplex sequencing on the Illumina platform. Nucleic
Acids Res. 40, e3.
28. Nystro¨m, V., Humphrey, J., Skoglund, P., McKeown, N.J., Vartanyan, S.,
Shaw, P.W., Lide´n, K., Jakobsson, M., Barnes, I., Angerbjo¨rn, A., et al.
(2012). Microsatellite genotyping reveals end-Pleistocene decline in
mammoth autosomal genetic variation. Mol. Ecol. 21, 3391–3402.
11. Gilbert, M.T.P., Drautz, D.I., Lesk, A.M., Ho, S.Y.W., Qi, J., Ratan, A., Hsu,
C.H., Sher, A., Dale´n, L., Go¨therstro¨m, A., et al. (2008). Intraspecific phylogenetic analysis of Siberian woolly mammoths using complete mitochondrial genomes. Proc. Natl. Acad. Sci. USA 105, 8327–8332.
29. Prado-Martinez, J., Sudmant, P.H., Kidd, J.M., Li, H., Kelley, J.L., LorenteGaldos, B., Veeramah, K.R., Woerner, A.E., O’Connor, T.D., Santpere, G.,
et al. (2013). Great ape genetic diversity and population history. Nature
499, 471–475.
12. Barnes, I., Shapiro, B., Lister, A., Kuznetsova, T., Sher, A., Guthrie, D., and
Thomas, M.G. (2007). Genetic structure and extinction of the woolly
mammoth, Mammuthus primigenius. Curr. Biol. 17, 1072–1075.
30. Cho, Y.S., Hu, L., Hou, H., Lee, H., Xu, J., Kwon, S., Oh, S., Kim, H.-M.,
Jho, S., Kim, S., et al. (2013). The tiger genome and comparative analysis
with lion and snow leopard genomes. Nat. Commun. 4, 2433.
13. Miller, W., Drautz, D.I., Ratan, A., Pusey, B., Qi, J., Lesk, A.M., Tomsho,
L.P., Packard, M.D., Zhao, F., Sher, A., et al. (2008). Sequencing the nuclear genome of the extinct woolly mammoth. Nature 456, 387–390.
31. Cahill, J.A., Green, R.E., Fulton, T.L., Stiller, M., Jay, F., Ovsyanikov, N.,
Salamzade, R., St John, J., Stirling, I., Slatkin, M., and Shapiro, B.
(2013). Genomic evidence for island population conversion resolves conflicting theories of polar bear evolution. PLoS Genet. 9, e1003345.
14. Li, H., and Durbin, R. (2011). Inference of human population history from
individual whole-genome sequences. Nature 475, 493–496.
15. Fu, Q., Li, H., Moorjani, P., Jay, F., Slepchenko, S.M., Bondarev, A.A.,
Johnson, P.L.F., Aximu-Petri, A., Pru¨fer, K., de Filippo, C., et al. (2014).
Genome sequence of a 45,000-year-old modern human from western
Siberia. Nature 514, 445–449.
32. Pemberton, T.J., Absher, D., Feldman, M.W., Myers, R.M., Rosenberg,
N.A., and Li, J.Z. (2012). Genomic patterns of homozygosity in worldwide
human populations. Am. J. Hum. Genet. 91, 275–292.
33. Keller, L.F., and Waller, D.M. (2002). Inbreeding effects in wild populations.
Trends Ecol. Evol. 17, 230–241.
6 Current Biology 25, 1–6, May 18, 2015 ª2015 Elsevier Ltd All rights reserved


© Copyright 2026