
PLASTIC BAG POLICIES IN THE SAN FRANCISCO BAY AREA: A
PLASTIC BAG POLICIES IN THE SAN FRANCISCO BAY AREA:
A DIFFUSION OF INNOVATION STUDY
A thesis submitted to the faculty of
San Francisco State University
In partial fulfillment of
the requirements for
the Degree
Master of Arts
In
Geography & Environment: Resource Management and Environmental Planning
by
Hilary Clo Finck
San Francisco, California
May 2015
Copyright by
Hilary Clo Finck
2015
CERTIFICATION OF APPROVAL
I certify that I have read Plastic Bag Policies in the San Francisco Bay Area: A Diffusion
of Innovation Study by Hilary Clo Finck, and that in my opinion this work meets the
criteria for approving a thesis submitted in partial fulfillment of the requirement for the
degree Master of Arts in Geography & Environment: Resource Management and
Environmental Planning at San Francisco State University.
Nancy Lee Wilkinson, Ph.D.
Professor
Jason Henderson, Ph.D.
Professor
Plastic Bag Policies in the San Francisco Bay Area:
A Diffusion of Innovation Study
Hilary Clo Finck
San Francisco, California
2015
In 2007, San Francisco adopted the first plastic bag ban in the United States. Since then
55 jurisdictions in the San Francisco Bay Area have adopted similar ordinances. Using
diffusion of innovation theory, this study examines the determinants of plastic bag policy
adoption in the nine-county Bay Area region. The diffusion of Bay Area plastic bag
policies was mainly determined by the plastic bag industry’s legal challenges, subsequent
judicial decisions, and the sharing of financial and informational resources between
higher-level jurisdictions and their participating agencies. Ancillary drivers of policy
adoption were the support from an advocacy organization and the need for jurisdictions
to comply with overarching environmental policies. Demographic analysis showed that a
jurisdiction’s political party preference and population size had a significant relationship
with the timing of adoption.
I certify that the abstract is a correct representation of the content of this thesis.
Chair, Thesis Committee
Date
ACKNOWLEDGEMENTS
I would like to thank Nancy Wilkinson for her assistance in the development and
execution of this thesis and for her continuous support throughout my graduate school
experience. I am finishing in no small part to her encouragement over the years. I also
would like to extend gratitude to Jason Henderson for his critical editing eye when this
thesis was still an idea I was working out in his graduate seminar. His comments
challenged me to think more deeply about this subject. And, thank you to Nathaniel
Kelso for helping with the construction of my map and for championing my efforts
throughout graduate school.
v
TABLE OF CONTENTS
List of Tables .................................................................................................................... vii
List of Figures .................................................................................................................. viii
Introduction ..........................................................................................................................1
Literature Review.................................................................................................................3
Study Area ...........................................................................................................................6
Methodology ......................................................................................................................14
Results ................................................................................................................................17
Discussion ..........................................................................................................................42
Conclusion .........................................................................................................................49
References ..........................................................................................................................51
vi
LIST OF TABLES
Table
Page
1. Innovation Scores (IS) for the Entire Set (In Order of Adoption) ...……..… 18
2. Innovation Scores between Municipalities of the same County …………… 20
3. Innovation Scores between Counties ………………………………………. 22
4. Correlation Coefficients between Innovation Score and Demographic Data 24
5. Timeline of Plastic Bag Ordinances Adoption, Legal Challenges, Court
Decisions, and Types of CEQA employed by Jurisdictions ……………….. 34
6. Overarching Environmental Policies and their Justification in Plastic Bag
Policy Adoption ……………………………………………………………. 37
7. MEA Use in CEQA Documents …………………………………………… 40
8. Municipalities That Adopted Independently ………………………………. 43
9. Correlation Coefficients between Innovation Scores of Municipalities that
Adopted Independently and Demographic Data …………………………… 43
10. Average Demographic Values of Adopters Versus Non-adopters ………… 44
vii
LIST OF FIGURES
Figures
Page
1. Plastic bag policies in the San Francisco Bay Area …………………………. 2
viii
LIST OF APPENDICES
Appendix
Page
1. Title of appendix ..................................................................................................41
2. Title of appendix ..................................................................................................42
3. Title of appendix ..................................................................................................47
4. Title of appendix ..................................................................................................50
5. Title of appendix ..................................................................................................52
ix
1
Introduction
On March third, 2007, San Francisco became the first jurisdiction in the United
States to adopt legislation that banned certain retail establishments from distributing
single-use plastic carryout bags. Since this policy was enacted, 55 jurisdictions in the San
Francisco Bay Area, including municipalities, unincorporated areas, and entire counties
have adopted similar ordinances. Nearly 80 percent of the Bay Area population now
resides in a jurisdiction that has adopted a policy restricting the distribution of plastic
bags (Figure 1).
This paper seeks to reveal some of the drivers behind this environmental policy
diffusion by exploring several policy determinants that help explain why and how plastic
bag policies spread so rapidly in the Bay Area. First, demographic characteristics such as
a jurisdiction’s population size, per capita income, and political party preference are
correlated with the order of adoption to see if there is evidence that demographics relate
to policy passage. Second, this study examines the obstacles posed by the plastic bag
industry as they sued cities and counties for “insufficient environmental review” under
the California Environmental Quality Act (CEQA), the judicial decisions, and the
resultant policy processes. Third, this study investigates whether the need to comply with
overarching environmental policies, such as solid waste diversion programs or
federal/state stormwater regulations, motivated jurisdictions to adopt plastic bag policies.
Finally, this study looks at how resources were shared between jurisdictions and by a
political advocacy organization.
2
Understanding the mechanisms that influence environmental policy adoption on a
regional basis can help policy professionals and advocates decide how to allocate
resources when trying to implement new laws in the face of industry opposition and the
methods used by local governments and advocacy organizations to promote the passage
of plastic bag policies can be replicated by authorities when faced with similar
challenges.
Figure 1. Plastic bag policies in the San Francisco Bay Area
(Map Credit Nathaniel Kelso)
Sonoma
Napa
Solano
Marin
Contra Costa
San Francisco
Alameda
San Mateo
Santa Clara
Incorporated areas with a policy
Incorporated areas without a policy
Unincorporated areas with a policy
Unincorporated areas without a policy
0
5
10
20 miles
3
Literature Review
Policy diffusion is commonplace. For decades scholars have decoded the
phenomenon using diffusion of innovation theory. Quite simply, an innovation is a policy
or program that is new to the adopters (Walker, 1969; Rogers, 2003). Diffusion is defined
as the spread of an innovation across a region or neighborhood through channels over
time among members of a social system (Rogers, 2003). The theory has mostly been used
to explain the factors for policy adoption among American states (Berry & Berry, 1990;
Grattet, Jenness, & Curry, 1998; Gray, 1973; Lutz, 1986; Matisoff, 2008; Mooney, 2001;
Walker, 1969), with fewer studies looking at cities (Shipan & Volden, 2006; 2008). The
theory has also been developed to explain policy adoption in public agencies and
organizations (Mohr, 1969). Diffusion studies have focused on welfare, education, and
civil rights policies (Gray, 1973), licensing policies (Lutz, 1986), lottery adoptions (Berry
& Berry, 1990), hate crime laws (Grattet, et al., 1998), health care policies (Balla, 2001;
Stream, 1999), anti-smoking regulations (Shipan & Volden, 2006; 2008), and climate
change policies (Matisoff, 2008). What is missing from the literature is a study that
applies the tenets of diffusion of innovation theory on a regional basis among local
jurisdictions using an environmental policy as the topic, which is this study’s main
intention.
Consistently, research shows that policy adoption is influenced by internal and
external determinants. In studying three decades of political science research, Ringquist
and Garand (1999) found that a state’s level of wealth and political ideology were
4
consistently the most important internal factors for adoption, with conservative states
being less likely to be leaders in the passage of environmental laws. Diffusion studies
have looked at demographic characteristics such as population size (Walker, 1969), per
capita income (Gray, 1973; Matisoff, 2008; Walker, 1969), and the political leaning of an
electorate (Matisoff, 2008). Grossback, Lawrence and Nicholson-Crotty (2004) found
that states are more likely to adopt a policy if other states with similar ideology have
passed the policy because it provides confidence that the policy lies close to its own
lawmakers’ and citizens’ preferences. In addition, the costs associated with implementing
the policy can impact the rate of adoption (Rogers, 2003). In analyzing the external
determinants of policy adoption, other studies have identified impacts from obstacles
presented by industry opposition to a new policy (Matisoff, 2008), information acquired
from conferences and professional associations (Balla, 2001; Walker, 1969), the
involvement of policy advocates (Mintrom, 1997), and the need to comply with
overarching policies (Mohr, 1969). However, it is important to note that Downs and
Mohr (1976) rejected a unifying diffusion of innovation theory since determinants in
some studies have not been found to be important in others; overall, they conclude that
different policies have different variables. Even so, determinants discussed in the
literature provide guidance for new studies that seek to reveal the drivers of innovative
policies.
Many diffusion studies have demonstrated a regional effect in which policy
makers learn from the actions of their neighbors through an increase in information,
5
which helps overcome uncertainty. In turn, the number of adoptions increases which
furthers the amount of available information (Berry & Berry, 1990; Mooney, 2001;
Stream, 1999; Walker, 1969). Alternatively, if the policy produces negative effects, then
it can mobilize the opposition and reduce support among neighbors (Mooney, 2001).
Despite these regional influences, Berry & Berry (1990) concluded that it is unrealistic to
think that policy makers emulate their neighbors without fully considering the political
and economic environment of their own jurisdiction, therefore they called for a model
that combines both internal and external determinants, using Mohr’s theory of
organizational innovation (1969). This theory proposes that innovation is a function of an
organization’s motivation, the strength of the obstacles against the innovation, and the
availability of resources (information or financial) to overcome deterrents. For example,
industrial opposition may create obstacles that hinder adoption if there is not sufficient
motivation to pass the policy or enough resources to fund or support it. Likewise, a
jurisdiction can overcome obstacles if there is motivation to adopt a policy that provides
benefits to a higher-level policy or program. Furthermore, leaders can overcome
obstacles if there are enough informational or financial resources to support passage.
Following Berry and Berry, Matisoff (2008) applied Mohr’s theory of organizational
innovation to state climate change policies and found that states with carbon intensive
industries created obstacles to adoption, citizen demands about environmental concerns
were motivational factors, and liberal states were more likely to support government
interaction with environmental programs. In addition, neighbors that shared similar
6
geographic, economic, and political characteristics were more likely to emulate their
policies (Matisoff, 2008).
The diffusion of innovation literature has shaped the framework for this analysis
of Bay Area plastic bag policy adoption. Using Mohr’s theory of organizational
innovation helps explain the relationship among the obstacles, motivating factors, and
available resources in this policy phenomenon. In addition, correlating demographic
information with the order of adoption may reveal patterns that cannot be explained using
Mohr’s theory. The goal is that these combined methods will provide a fuller picture of
what has occurred with the diffusion of plastic bag policies in the Bay Area.
Study Area
This study focuses on the San Francisco Bay Area region (hereafter referred to as
Bay Area) which comprises 101 cities within nine counties: San Francisco, San Mateo,
Santa Clara, Alameda, Contra Costa, Solano, Napa, Sonoma, and Marin. This region
shares a defining geographical feature, the San Francisco Bay (Bay), which is a large
estuary consisting of several interconnected bays. Portions of each Bay Area county
make up the immediate watershed that feeds the Bay, thus the counties’ waste and litter
risk finding their way to the Bay. Although plastic bag policies have been adopted in
other municipalities and counties in California, a diffusion study that rises to the
statewide scale is beyond the design of this study.
7
Plastic bag laws
Technically, not all plastic bag laws are created equal. The first version of San
Francisco’s plastic bag ordinance banned plastic bags at commercial checkout and placed
no fee on paper bags. Other iterations have included banning the thinnest plastic bags,
while charging a nominal fee for paper bags and thick “reusable” plastic bags. Some
policies cover more types of retail establishments than others, and some jurisdictions
have adopted second versions of the ordinance to expand the scope of the program by
including more stores and restaurants. For the purposes of this study, I am only using
information regarding the first version of the policy that restricted the distribution of
plastic bags at checkout via a total ban or fee. Since there are different levels of
governance in the Bay Area, this study includes plastic bag laws created by cities,
counties, and joint powers authorities (JPA), which have the same powers to pass policies
as their participating agencies.
Variables Thought To Influence Diffusion Of Plastic Bag Bans
Demographics.
In part, this study is concerned with the demographic distinctions among Bay
Area jurisdictions that may have influenced policy outcomes. Demographically speaking,
the Bay Area’s 7 million plus residents are an affluent group, with an average per capita
income of $39,418 compared to the national average of $28,155 (U.S Census Bureau,
2015). Only fourteen of its 101 cities have a per capita income below the national
average. In terms of political party preference, the region leans more Democratic than the
8
rest of the country; 70.43 percent of Bay Area electorate voted for the Democratic
presidential candidate, Barack Obama, in the 2012 election compared with 51.01 percent
of the United States electorate (Leip, 2012). Only five out of 101 Bay Area cities had
Democratic margins below the national election results. Still, the Bay Area is not
homogenous from one jurisdiction to the next.
The literature suggests that a jurisdiction’s population size may influence policy
outcomes, since larger cities and counties would have more resources available in the
form of skilled staff or wealth (Walker, 1969). Therefore this study also takes population
size into account when examining the order of adoption.
The plastic bag industry response.
Upon passage of earlier plastic bag ordinances, plastic bag manufacturers and
distributors based in California and beyond formed a legal coalition (Coalition) that sued
several Bay Area and California jurisdictions that had done, in the Coalition’s opinion,
insufficient environmental review under the CEQA. The Coalition argued that by banning
plastic bags without putting a sufficient fee on paper bags, consumers would simply
switch to paper bags, which the Coalition claimed had an even more adverse impact on
the environment (Coalition v. City of Oakland, 2007; Coalition v. Town of Fairfax, 2007;
Coalition v. County of Marin, 2011a).
CEQA states that projects carried out by public agencies are subject to
environmental review to determine whether there will be significant impacts on the
environment, and to reveal what kinds of resources the project would impact (California
9
Environmental Quality Act of 1970). There are several types of environmental review
allowed under CEQA. An environmental impact report (EIR) is prepared when an initial
study finds substantial evidence that a project will have a significant impact on the
environment (ibid.). It is often a lengthy document and must analyze the significant
environmental effects of a proposed project, identify alternatives, and disclose ways to
reduce the environmental damage (ibid.). Alternatively, a negative declaration is prepared
when an initial study finds that there is no substantial evidence that a project will have a
significant effect on the environment, making an EIR unnecessary (ibid.). Finally, a
categorical exemption is simply an exemption from the CEQA process because a public
agency has outright decided, without an initial study, that the project has no significant
effect on the environment (ibid.). Jurisdictions in the Bay Area used all of these CEQA
tactics in the passage of their plastic bag bans. What is at question is whether the
Coalition’s legal threats impacted the way jurisdictions employed CEQA and whether
such obstacles influenced the adoption process and timeline.
Overarching environmental policies.
Stormwater permits.
Urban stormwater runoff can contain pollutants such as heavy metals, pesticides,
and trash, which can impair receiving water bodies. Plastic trash in particular is a
nuisance—it can persist in the environment for hundreds of years and poses a threat to
aquatic life through ingestion, entrapment, and entanglement (San Francisco Bay
Regional Water Quality Control Board, 2009). At the International Coastal Cleanup Day
10
in 2009, plastic bags were the second most common litter item collected along streams
and beaches (Alameda County Waste Management Authority, 2011).
Section 303(d) of the Clean Water Act (CWA) requires States to identify waters
that do not attain water quality standards (San Francisco Bay Regional Water Quality
Control Board, 2009). In 2009 The San Francisco Bay Regional Water Quality Control
Board (SFRWB), a division of the California State Water Resources Control Board,
proposed adding 26 Bay Area waterways, including the central and lower Bays, to the
303(d) list for trash impairment (ibid.) As a result, the SFRWB issued a new semiregional stormwater permit, under the CWA’s National Pollution Discharge Elimination
System (NPDES) stormwater program. The 2009 San Francisco Bay Region Municipal
Regional Stormwater NPDES Permit (MRP), still in effect today, covers 66
municipalities and four county jurisdictions within Alameda, Contra Costa, San Mateo,
Santa Clara, and Solano counties (San Francisco Bay Regional Water Quality Control
Board, 2011). As part of its receiving water limitations, the permit forbids discharges that
adversely affect the beneficial uses of the waters of the State, including trash or litter
visible to the naked eye (ibid.). Therefore, Section C.10 of the MRP directly mandates
that permittees reduce trash loads transmitted by their municipal separate stormwater
sewers (MS4s) to receiving waters by 40 percent by 2014, 70 percent by 2017, and 100
percent by 2022 (ibid.).
Contra Costa County consists of two watersheds. The western watershed is
managed by the SFRWB and the Central Valley Region Water Quality Control Board
11
(CVRWB) manages the eastern watershed (Central Valley Regional Water Quality
Control Board, 2010). The CVRWB issued a similar permit for trash load reductions, of
40 percent by 2015, 70 percent by 2018, and 100 percent reductions by 2023 (ibid).
Therefore, all of Contra Costa County is covered by a zero trash NPDES permit.
These are the only zero trash stormwater permits in the Bay Area. Permittees of
both stormwater permits are required to submit annual reports spelling out planned and
implemented actions to achieve trash reductions. In return, both water boards allow a
range of trash reduction credits for jurisdictions that adopted a plastic bag ban, depending
upon the scope of the policy (City of San Mateo, 2012). Therefore, this study intends to
discover whether a jurisdiction’s need to comply with the NPDES permit was a
motivating force for the adoption of plastic bag bans.
Solid waste diversion policies.
The adoption of local solid waste diversion policies, resolutions, and goals
became popular in the Bay Area around the same time plastic bag bans were diffusing.
Waste diversion policies are generally characterized by a timeline of landfill diversion
goals that usually, but not always, helps reach zero waste by a certain date. For example,
San Francisco’s resolution called for 75 percent landfill diversion by 2010 and zero waste
by 2020 (City and County of San Francisco, 2002). According to the San Francisco
Department of Environment, zero waste means sending nothing to the landfill or
incinerator (San Francisco Department of Environment, n.d.). Waste diversion goals can
12
be reached though source reduction, extended producer responsibility, recycling, reuse,
and composting (San Francisco Department of Environment, 2003).
Besides local policies, California Integrated Waste Management Act of 1989,
Assembly Bill 939, required each city and county to achieve a landfill diversion rate of
25 percent by 1995 and 50 percent by 2000 (California Department of Resources
Recycling and Recovery, 1997). This policy was updated in 2011 with AB 341, which
established a statewide policy goal of 75 percent waste diversion by 2020 (Solid Waste:
Diversion, 2011).
Waste characterization studies in California have documented the amount of
space plastic bags take up in landfills. The California Integrated Waste Management
Board’s and Alameda County’s waste characterization studies estimate that plastic bags
comprise 0.3 percent and 0.8 percent of landfill waste, respectively (Cascadia Consulting
Group, 2009; R.W. Beck, 2009). Although these totals are a small portion of a landfill’s
waste stream, one would assume that any measurable reduction in waste would be
attractive to a jurisdiction that has adopted such stringent waste diversion goals. Since
State policies are consistent throughout the Bay Area, this paper examines whether local
waste diversion policies that were more stringent than State standards motivated Bay
Area jurisdictions to adopt plastic bag bans.
13
Policy advocates.
Green Cities California.
Policy advocacy involves intentional activity initiated by the public or an
organization to affect the policy process (Gen & Wright, 2013). Advocacy organizations
work to achieve positive policy outcomes and social change that align with their own
specific preferences through engagement and information sharing that increases
awareness and support with other advocates, decision makers, and the public (ibid.).
Green Cities California (GCC) is a coalition of twelve environmentally
progressive local governments in California whose mission is to assist the
implementation of environmentally sustainable policies and programs (Green Cities
California, 2013). Following the plastic bag coalition’s lawsuits, in 2010 the GCC
prepared a Master Environmental Assessment (MEA) on single-use bags that
jurisdictions could use, free of charge, to facilitate the adoption of local ordinances
(ibid.). CEQA guidelines Sec. 15169 allow the use of MEAs to provide information that
can be used in EIRs and initial studies. The MEA is not meant to replace an EIR or initial
study because it does not reach conclusions about local environmental impacts and does
not propose mitigation measures or alternatives (ICF International, 2010). However, the
MEA on Single-Use and Reusable Bags provides valuable information regarding the
impacts of restricting the use of single-use grocery bags, including existing regulations,
life-cycle analysis, potential impacts on the environment, and the use of fees to encourage
consumers to reuse bags (ibid.).
14
Methodology
Ordinance Collection and Organization
Copies of plastic bag ordinances were located via the Californians Against Waste
webpage that provides links to local ordinances (Californians Against Waste, 2014).
Additional ordinance information was found by contacting city clerks or visiting
government webpages. A Microsoft Excel spreadsheet was used to organize the
information by date of adoption. All Bay Area municipalities and counties were included
in the spreadsheet, regardless of whether they had adopted a plastic bag ordinance.
Innovation Score
Since this study is concerned, in part, with the correlation of demographic
variables to the order of policy adoption, an innovation score (Walker, 1969) is calculated
for each jurisdiction in the Bay Area according to its time of adoption compared to other
jurisdictions. Jurisdictions that were forced to rescind their ordinances due to lost legal
cases are not included in the innovation score calculations—only jurisdictions with
standing ordinances are used.
The innovation score is calculated for three different sets: the whole set, including
all counties and municipalities; a counties only set; and for municipalities within the
same county. This breakdown allows for an exploration of demographic variables at
different scales, since policies were adopted at different scales.
The innovation score is calculated as follows:
A = the number of days between the first and last adoption
15
B = the time between the first adoption and each subsequent adoption
Innovation score = 1-B/A
The first jurisdiction to adopt has an innovation score of 1.0, the last to adopt is 0,
and those that have not yet passed plastic bag policies get a score of -0.01.
Demographic Correlation
For all municipalities and counties in the Bay Area, population data are from the
2010 United States Census, and per capita income figures are from the 2009-2013
American Community Survey 5-Year Estimates. Both can be found using the US Census
Bureau’s American Fact Finder webpage. Per capita income data were gathered on
January 26, 2015. To see if a jurisdiction’s political party preference correlates with its
order of adoption, this study looks at each jurisdiction’s percentage of ballots cast for the
Democratic candidate in the 2008 and 2012 United States Presidential contests, and the
2010 California Gubernatorial contest. These elections were selected because they
occurred in all jurisdictions and fall within the range of plastic bag ban adoption dates.
Election data were found via each county’s Statement of the Vote document located on
the Registrar of Voters webpages. Additional information was requested via email with
county clerks. Demographic data on the county level is for the entire county.
Demographic data were correlated to the innovation scores of each set using the
correlation function in Microsoft Excel. The strength of the relationship between the
variables and the innovation score are analyzed using the Pearson product-moment
correlation coefficient, or Pearson’s r, which is as follows:
16
If r = +.70 to 1.0: very strong positive
+.40 to +.69: strong positive
+.30 to +.39: moderate positive
+.20 to +.29: weak positive
+.01 to +.19: no or negligible
-.01 to -.19: no or negligible
-.20 to -.29: weak negative
-.30 to -.39: moderate negative
-.40 to -.69: strong negative
-.70 to -1.0: very strong negative
External Variables: Lawsuits, Environmental Policies, and Policy Advocates
There are several questions regarding the diffusion of plastic bag policies in the
Bay Area. First, how did the Coalition’s lawsuits and subsequent legal outcomes impact
the timing of adoption and the types of CEQA review each jurisdiction undertook?
Second, what were the factors that motivated jurisdictions to adopt plastic bag laws in the
face of industry opposition? Third, did jurisdictions share resources, such as information
or funding, to overcome legal and CEQA-related obstacles?
To answer these questions this study examines the content of legal documents,
judicial decisions, ordinances, CEQA documents, NPDES stormwater permits, waste
diversion policies, agency memos, staff reports, and governmental meeting agendas and
minutes. Legal documents and decisions were located via the plasticbaglaws.org website
17
or by doing internet searches such as, “Save the Plastic Bag Coalition v. Marin County”.
CEQA documents were found by doing internet searches such as, “San Jose plastic bag
EIR” and by searching government websites. Meeting agendas and minutes were found
by searching archival information on government websites using the date of ordinance
adoption as reference. City and county clerks and other government staff were contacted
via email and phone for further information.
Interviews with governmental personnel were conducted via email or in person.
In-person interviews were open-ended and recorded. Interviewees were identified by
snowball sampling, with the first interviewee being a member of San Francisco’s
Environment Commission.
Data are organized qualitatively through textual discussion and through timelines
and tables that reveal the relationships of the external variables to the diffusion of plastic
bag policies. Simple quantitative analysis, such as figuring percentages, is used to
determine the influence of compliance with overarching policies and the impact of the
MEA to adoption processes.
Results
Innovation Score
Table 1 lists the entire set of Bay Area jurisdictions (adopters and non-adopters)
in order of adoption, and their innovation scores. The innovation score reflects the
“innovativeness” between the first adopter and each subsequent adopter, as explained
earlier. It also reflects the time elapsed between adoptions. For example, there are several
18
places with a substantial gap from one innovation score to the next, which indicates a
lapse in adoption. San Francisco, the first adopter, has an innovation score of 1.0, while
the next adopter, Fairfax has an innovation score of 0.80. Palo Alto’s innovation score is
0.74 and the next adopter, San Jose has a score of 0.51. Millbrae has a score of 0.37,
while the next adopter, Unincorporated San Mateo County, has an innovation score of
0.27. From that point onward, there are no major gaps in the innovation score. The
adoptions continue in a consistent sequence.
Since the entire set consists of different jurisdictional types—municipalities and
counties—demographic data were not correlated with the entire set. Instead, the entire set
can be broken down into “like” sets. Table 2 shows the innovation scores between
municipalities of the same county. It does not include counties where all jurisdictions
adopted simultaneously. Table 3 displays the innovation scores between counties only.
Table 1. Innovation Scores (IS) for the Entire Set (In Order of Adoption)
#
County
Jurisdiction
1
2
3
4
5
6
7
8
9
10
11
12
San Francisco
Marin
Santa Clara
Santa Clara
Marin
Santa Clara
Santa Clara
Alameda
San Mateo
San Mateo
San Mateo
Santa Clara
San Francisco
Fairfax
Palo Alto
San Jose
Unincorporated Marin County
Unincorporated Santa Clara County
Sunnyvale
Entire Alameda County
Millbrae
Unincorporated San Mateo County
Pacifica
Mountain View
Date Adopted
4/10/07
11/4/08
3/30/09
1/11/11
1/25/11
4/26/11
12/13/11
1/25/12
2/14/12
11/6/12
12/10/12
12/11/12
IS
1.00
0.80
0.74
0.51
0.51
0.47
0.39
0.38
0.37
0.27
0.26
0.26
19
13
14
15
16
17
18
19
20
21
22
23
24
25
26
27
28
29
30
31
32
33
34
35
36
37
38
39
40
41
42
43
44
45
46
San Mateo
San Mateo
San Mateo
San Mateo
San Mateo
San Mateo
San Mateo
San Mateo
San Mateo
Santa Clara
San Mateo
Santa Clara
San Mateo
San Mateo
San Mateo
San Mateo
San Mateo
Contra Costa
Santa Clara
Santa Clara
Contra Costa
Contra Costa
Contra Costa
Marin
Santa Clara
Sonoma
Marin
Marin
Contra Costa
Marin
Marin
Marin
Marin
Contra Costa
South San Francisco
Foster City
Belmont
Colma
San Bruno
Daly City
Menlo Park
Portola Valley
Half Moon Bay
Cupertino
San Carlos
Los Altos
Brisbane
Burlingame
Redwood City
East Palo Alto
City of San Mateo
Richmond
Campbell
Los Gatos
El Cerrito
San Pablo
Pittsburg
Mill Valley
Morgan Hill
Entire Sonoma County
San Rafael
Novato
Walnut Creek
Sausalito
Larkspur
San Anselmo
Belvedere
Martinez
12/12/12
1/7/13
1/8/13
1/9/13
1/13/13
1/14/13
1/22/13
1/23/13
3/5/13
3/5/13
3/11/13
3/12/13
3/18/13
3/18/13
3/25/13
4/2/13
5/6/13
7/16/13
7/16/13
9/3/13
9/17/13
10/8/13
10/21/13
10/21/13
11/6/13
2/19/14
3/3/14
3/6/14
3/18/14
3/18/14
5/7/14
5/27/14
6/9/14
6/18/14
0.26
0.25
0.25
0.25
0.25
0.25
0.25
0.25
0.23
0.23
0.23
0.23
0.23
0.23
0.22
0.22
0.21
0.18
0.18
0.17
0.16
0.15
0.15
0.15
0.14
0.11
0.10
0.10
0.10
0.10
0.08
0.07
0.07
0.06
20
47
48
49
50
51
52
53
54
55
56
57
58
59
60
61
62
63
64
65
66
67
68
69
70
71
72
73
74
75
76
77
78
79
80
Napa
Contra Costa
Napa
Napa
Santa Clara
Contra Costa
Marin
Marin
Contra Costa
Contra Costa
Contra Costa
Contra Costa
Contra Costa
Contra Costa
Contra Costa
Contra Costa
Contra Costa
Contra Costa
Contra Costa
Contra Costa
Marin
San Mateo
San Mateo
San Mateo
Santa Clara
Santa Clara
Santa Clara
Santa Clara
Santa Clara
Solano
Solano
Solano
Solano
Solano
Calistoga
Pleasant Hill
City of Napa
St. Helena
City of Santa Clara
Hercules
Tiburon
Ross
Lafayette
Danville
Contra Costa County
Antioch
Brentwood
Clayton
Concord
Moraga
Oakley
Orinda
Pinole
San Ramon
Corte Madera
Atherton
Hillsborough
Woodside
Gilroy
Los Altos Hills
Milpitas
Monte Sereno
Saratoga
Unincorporated Solano County
Benicia
Dixon
Fairfield
Rio Vista
7/15/14
8/4/14
8/5/14
8/12/14
8/19/14
9/9/14
10/3/14
10/11/14
12/8/14
12/16/14
n/a
n/a
n/a
n/a
n/a
n/a
n/a
n/a
n/a
n/a
n/a
n/a
n/a
n/a
n/a
n/a
n/a
n/a
n/a
n/a
n/a
n/a
n/a
n/a
0.05
0.05
0.05
0.04
0.04
0.03
0.03
0.02
0.00
0.00
-0.01
-0.01
-0.01
-0.01
-0.01
-0.01
-0.01
-0.01
-0.01
-0.01
-0.01
-0.01
-0.01
-0.01
-0.01
-0.01
-0.01
-0.01
-0.01
-0.01
-0.01
-0.01
-0.01
-0.01
21
81
82
83
84
85
86
Solano
Solano
Solano
Napa
Napa
Napa
Suisun City
Vacaville
Vallejo
Unincorporated Napa County
American Canyon
Yountville
n/a
n/a
n/a
n/a
n/a
n/a
-0.01
-0.01
-0.01
-0.01
-0.01
-0.01
Table 2. Innovation Scores between Municipalities of the same County
County
San Mateo
San Mateo
San Mateo
San Mateo
San Mateo
San Mateo
San Mateo
San Mateo
San Mateo
San Mateo
San Mateo
San Mateo
San Mateo
San Mateo
San Mateo
San Mateo
San Mateo
San Mateo
San Mateo
San Mateo
Municipality
Millbrae
Pacifica
South San Francisco
Foster City
Belmont
Colma
San Bruno
Daly City
Menlo Park
Portola Valley
Half Moon Bay
San Carlos
Brisbane
Burlingame
Redwood City
East Palo Alto
San Mateo City
Atherton
Hillsborough
Woodside
Santa Clara
Santa Clara
Santa Clara
Santa Clara
Palo Alto
San Jose
Sunnyvale
Mountain View
Date Adopted
2/14/12
12/10/12
12/12/12
1/7/13
1/8/13
1/9/13
1/13/13
1/14/13
1/22/13
1/23/13
3/5/13
3/11/13
3/18/13
3/18/13
3/25/13
4/2/13
5/6/13
n/a
n/a
n/a
IS
1.00
0.33
0.32
0.27
0.26
0.26
0.25
0.25
0.23
0.23
0.14
0.13
0.11
0.11
0.09
0.08
0.00
-0.01
-0.01
-0.01
3/30/09
1/11/11
12/13/11
12/11/12
1.00
0.67
0.50
0.31
22
Santa Clara
Santa Clara
Santa Clara
Santa Clara
Santa Clara
Santa Clara
Santa Clara
Cupertino
Los Altos
Campbell
Los Gatos
Morgan Hill
City of Santa Clara
Gilroy
Santa Clara
Santa Clara
Santa Clara
Santa Clara
Los Altos Hills
Milpitas
Monte Sereno
Saratoga
Contra Costa
Contra Costa
Contra Costa
Contra Costa
Contra Costa
Contra Costa
Contra Costa
Contra Costa
Contra Costa
Contra Costa
Contra Costa
Contra Costa
Contra Costa
Contra Costa
Contra Costa
Contra Costa
Contra Costa
Contra Costa
Contra Costa
Richmond
El Cerrito
San Pablo
Pittsburg
Walnut Creek
Martinez
Pleasant Hill
Hercules
Lafayette
Danville
Antioch
Brentwood
Clayton
Concord
Moraga
Oakley
Orinda
Pinole
San Ramon
Napa
Napa
Calistoga
Napa City
3/5/13
3/12/13
7/16/13
9/3/13
11/6/13
8/19/14
n/a
0.27
0.27
0.20
0.18
0.15
0.00
-0.01
n/a
n/a
n/a
n/a
-0.01
-0.01
-0.01
-0.01
7/16/13
9/17/13
10/8/13
10/21/13
3/18/14
6/18/14
8/4/14
9/9/14
12/8/14
12/16/14
n/a
n/a
n/a
n/a
n/a
n/a
n/a
n/a
n/a
1.00
0.88
0.84
0.81
0.53
0.35
0.26
0.19
0.02
0.00
-0.01
-0.01
-0.01
-0.01
-0.01
-0.01
-0.01
-0.01
-0.01
7/15/14
8/5/14
1.00
0.25
23
Napa
Napa
Napa
St. Helena
American Canyon
Yountville
Marin
Marin
Marin
Marin
Marin
Marin
Marin
Marin
Marin
Marin
Marin
Fairfax
Mill Valley
San Rafael
Novato
Sausalito
Larkspur
San Anselmo
Belvedere
Tiburon
Ross
Corte Madera
8/12/14
n/a
n/a
0.00
-0.01
-0.01
11/4/08
10/21/13
3/3/14
3/6/14
3/18/14
5/7/14
5/27/14
6/9/14
10/3/14
10/11/14
n/a
1.00
0.16
0.10
0.10
0.10
0.07
0.06
0.06
0.00
0.00
-0.01
Table 3. Innovation Scores between Counties
County
City and County of San Francisco
Marin County
Santa Clara County
Alameda County
San Mateo County
Sonoma County
Contra Costa County
Solano County
Napa County
Date Adopted
4/10/07
1/25/11
4/26/11
1/25/12
11/6/12
2/19/14
n/a
n/a
n/a
IS
1.00
0.45
0.41
0.30
0.19
0.00
-0.01
-0.01
-0.01
24
Demographic Correlation
Per Capita Income.
Table 4 shows the correlation coefficients between demographic data with the
innovation scores from Tables 2 and 3. Per capita income had a very strong positive
correlation with the counties’ innovation scores, a 0.75 correlation coefficient, signifying
that counties with a higher per capita income were not only more likely to adopt than
counties with lower per capita income, but also tended to be earlier adopters. Although
values were low, the municipalities’ innovation scores had an overall negative
relationship with per capita income, signifying a minor relationship within each county
whereby jurisdictions with lower per capita incomes were somewhat more likely to adopt
plastic bag policies earlier than jurisdictions with higher per capita incomes.
Electoral Data.
The correlations between electoral data and innovation scores are stronger and
overall positive. The most significant values occur with the Counties’ set, which shows
very strong positive relationships with the percentage of Democratic ballots cast in each
election. This suggests that counties that lean Democratic were likely to be earlier
adopters compared to counties with a smaller proportion of Democratic voters. Likewise,
in the municipalities set, the order of adoption between Contra Costa County cities had
on average a very strong positive relationship with the percentage of Democratic ballots
cast in each election, signifying that the most heavily Democratic municipalities were
earlier adopters. The order of adoption between municipalities in Marin, Napa, and Santa
25
Clara Counties exhibited on average a strong positive relationship with the percentage of
Democratic ballots cast in each election, while the adoption order of San Mateo County
cities had a negligible relationship with Democratic voting.
Table 4. Correlation Coefficients between Innovation Score and Demographic Data
2010
Per
2008
2012
California
Capita Presidential Presidential Gubernatorial
Set Type
Population Income
Election
Election
Election
Counties
0.25
Municipalities of the same County
Contra Costa
County
0.15
Marin County
-0.08
Napa County
-0.05
San Mateo County
-0.01
Santa Clara County
0.45
0.75
0.80
0.80
0.81
-0.43
-0.30
-0.38
-0.33
-0.11
0.66
0.53
0.72
0.06
0.73
0.79
0.48
0.50
0.23
0.63
0.81
0.57
0.34
0.21
0.69
Legal Challenges, Court Decisions, and Impacts on CEQA Determination
The timeline in Table 5 shows how the Coalition’s legal challenges and their
subsequent court decisions influenced the timing and character of plastic bag policies and
the types of CEQA jurisdictions employed. San Francisco’s ordinance banned the
distribution of plastic checkout bags from certain stores but allowed the distribution of
paper, compostable, or reusable bags free of charge at checkout (City and County of San
Francisco, 2007). The City filed a categorical exemption under CEQA Guidelines Sec.
15060(c)(3), which says that a project does not have the potential to result in a direct or
indirect physical change in the environment (J. Poling, personal communication, March
13, 2014). San Francisco’s ordinance went unchallenged by the plastic bag industry.
26
Several months later the cities of Oakland and Fairfax passed ordinances similar
to San Francisco’s, both with the following categorical exemptions: Sec. 15061(b)(3),
which finds the project to have positive environmental effects and no possibility of
significant adverse effects; Sec. 15183 which declares the project to be consistent with
general plan elements; and Sec. 15308 and 15307 in which the project is designed to
protect the environment and natural resources, respectively (Coalition v. City of Oakland,
2007; City of Oakland, 2007; Town of Fairfax, 2007). This time the Coalition filed
lawsuits against Oakland and Fairfax for not conducting a proper environmental review
under CEQA (Coalition v. City of Oakland, 2007; Coalition v. Town of Fairfax, 2007).
Since consumers could easily switch to paper bags, the Coalition claimed that there was
no substantial evidence to support the municipalities’ conclusions that the ordinances
would not have a significant impact on the environment (ibid.). According to the
Coalition, paper bags generate more greenhouse gas emissions and water pollutants
during manufacturing, require more energy to recycle, and often end up in landfills where
they release methane gas in the decomposition process (ibid.).
To avoid a potentially costly legal battle, Fairfax rescinded its ordinance and
instead made it voluntary. A year later, Fairfax passed a plastic bag ban by voter
initiative, which was exempt from CEQA since it was not sponsored by a public agency.
Oakland, however, continued with the suit, unsuccessfully. In April 2008, the Alameda
County Superior Court ordered Oakland to vacate its ordinance and to not reenact it
without complying with CEQA (Coalition v. City of Oakland, 2008b). The judge ruled
27
that without a fee on paper bags, consumers would shift from one environmentally
damaging product to another (Coalition v. City of Oakland, 2008a). Oakland did not
appeal the decision and rescinded its ordinance.
Three months after the Oakland ruling, the City of Manhattan Beach, in southern
California, passed a plastic bag ordinance similar in nature to San Francisco’s. The City
filed a negative declaration after an initial study found the policy could not have a
significant effect on the environment (City of Manhattan Beach, 2008). Using the same
argument from the Oakland and Fairfax cases, the Coalition sued the City for violating
CEQA by not conducting an EIR (Coalition v. City of Manhattan Beach, 2008). In
February 2009, the Los Angeles County Superior Court judge ruled in favor of the
Coalition, citing the need for Manhattan Beach to conduct an EIR (Coalition v. City of
Manhattan Beach, 2009). The City appealed the ruling.
In March 2009, the City of Palo Alto adopted a plastic bag ordinance similar to
San Francisco’s after an initial study found that although the policy could have
significant effect on the environment, education and outreach campaigns regarding
reusable bags would avoid or reduce impacts to a point where no significant impacts
could occur (Palo Alto City Manager, 2009). Therefore, the City adopted a mitigated
negative declaration. Again, the Coalition sued Palo Alto for not doing an EIR, but this
time the case did not go to court. Palo Alto and the Coalition agreed to a settlement
whereby the ordinance was able to remain, but the City would have to complete an EIR if
28
it decided to amend or expand its ordinance in the future (Coalition v. City of Palo Alto,
2009).
In January 2010, the Court of Appeal affirmed the Superior Court’s decision in
the Manhattan Beach case and the City appealed to the California Supreme Court. A year
passed before the next ordinance was adopted in the Bay Area. In January 2011, San
Jose adopted a plastic bag ordinance that was unique in two ways—it was the first
ordinance to undergo the scrutiny of an EIR, and it banned single-use plastic bags while
charging a $0.10 fee for each recycled paper bag distributed at checkout (City of San
Jose, 2011). Overall, the EIR concluded that the fee on paper bags would promote a
“bring your own bag” culture which would reduce the use of nonrenewable resources,
would not cause irreversible or unavoidable environmental changes, and would have a
less than significant impact on the environment (City of San Jose, 2010). The Coalition
did not challenge San Jose’s ordinance or EIR and this ordinance became a model for
other Bay Area jurisdictions.
Several days after San Jose’s ordinance was adopted, Marin County passed a
similar ban for its unincorporated areas. The ordinance called for a $0.05 fee on recycled
paper bags and reusable bags, but instead of adopting an EIR, they filed a categorical
exemption under CEQA guidelines Sec. 15308 since the project assured maintenance,
restoration, enhancement, or protection of the environment (Coalition v. County of
Marin, 2011b; County of Marin, 2011). Again, the Coalition sued the County for not
conducting an EIR, claiming there was no certainty that a $0.05 fee on paper bags was
29
sufficient enough to prevent negative environmental effects (Coalition v. County of
Marin, 2011a).
Before the Marin County Superior Court ruling took place, Santa Clara County
adopted an ordinance similar to San Jose’s for its unincorporated areas after conducting
an initial study and adopting a negative declaration (County of Santa Clara, 2011). The
ordinance went unchallenged. Also previous to the Marin County decision, in July 2011
the California Supreme Court struck down the Appeals Court decision in the Manhattan
Beach case. The Court ruled that due to Manhattan Beach’s small size and population, no
significant environmental impacts could occur from their plastic bag ban (Coalition v.
City of Manhattan Beach, 2011). However, in a slight victory for the Coalition, the Court
ruled that larger jurisdictions might need to prepare EIRs since cumulative impacts of
increased paper bag consumption could have a significant impact on the environment
(ibid.).
Two months after the Manhattan Beach Supreme Court decision, the Marin
County Superior Court ruled in favor of Marin County. The judge found that the County
acted reasonably by relying on a categorical exemption since the ordinance was designed
to protect natural resources and the environment (Coalition v. County of Marin, 2011c).
The Coalition appealed, but in June 2013 the Court of Appeal upheld the Superior
Court’s decision, siting the Manhattan Beach Supreme Court decision as basis for its
ruling since the population size of the Marin’s unincorporated area and the number of
stores affected by the ban was less than Manhattan Beach’s (Coalition v. County of
30
Marin, 2013). The Coalition did not appeal the Marin case further, and no lawsuits were
filed against Bay Area jurisdictions from this point onward.
Before the Marin County Appeals Court decision, Bay Area jurisdictions
continued to adopt plastic bag ordinances based upon San Jose’s success and the
Supreme Court’s Manhattan Beach decision. Sunnyvale was the only other municipality
in the Bay Area to undertake an EIR for its ordinance, even though its population size of
140,000 might not have warranted an EIR under the Manhattan Beach decision.
Countywide Efforts.
As Table 5 shows, many late adopting smaller cities used categorical exemptions
or negative declarations, while the cumulative effects portion of the Manhattan Beach
decision differently impacted the way counties and waste management JPAs conducted
CEQA. The Alameda County Waste Management Authority and Source Reduction and
Recycling Board (StopWaste.org), San Mateo County, the West Contra Costa Waste
Management Authority (RecycleMore), the Sonoma County Waste Management
Authority (SCWMA), and the Marin County Hazardous and Solid Waste Management
Joint Powers Authority (Marin JPA) acted as lead agencies for ordinance creation and
EIR preparation for their smaller participating agencies to ensure cohesive policies across
jurisdictions, to ameliorate the costs of preparing individual ordinances and EIRs, and to
support existing overarching policies.
Stopwaste.org has the power to enact countywide policies that implement the
Alameda County Integrated Waste Management Plan, which is designed to reduce waste
31
disposed at landfills in Alameda County by 75 percent by 2010 and beyond (Alameda
County Waste Management Authority, 2011; Alameda County Waste Management
Authority, 2012; Alameda County Waste Reduction and Recycling Act of 1990). The
JPA consists of 17 board members: one representative from each of the fourteen city
councils, one from the County Board of Supervisors, and one from each of the two
sanitary district boards (Alameda County Waste Management Authority, 2011). To
address plastic bag waste in Alameda County, StopWaste.org proposed an ordinance
similar to San Jose’s and prepared an EIR to address the cumulative environmental
impacts of a countywide ordinance. A unanimous vote by StopWaste.org’s board
members ensured a cohesive policy across the entire county.
Since San Mateo County does not have a waste management authority to pass a
plastic bag ban for its entire jurisdiction, the San Mateo County Board of Supervisors
approached the San Mateo Department of Environmental Health (DEH) about
spearheading efforts for an ordinance for its unincorporated areas (D. Peterson, personal
communication, March 5, 2015). Citing the need for a cohesive ordinance rather than
piecemeal legislation throughout the South Bay Area, the DEH advocated for a regional
approach in which cities in San Mateo and Santa Clara Counties could adopt identical
ordinances and be participating agencies in an EIR (ibid.). Acting as the lead agency, the
DEH enlisted cities, researched past lawsuits and successful ordinances, and along with
the San Mateo County Board of Supervisors designed a model regional ordinance clear of
any legal complications that individual jurisdictions could adopt (ibid.). San Mateo
32
County paid for all costs related to the model ordinance creation and EIR preparation and
the DEH agreed to provide compliance support and enforcement (ibid.). The following
jurisdictions agreed to be participating agencies: unincorporated San Mateo County,
Belmont, Brisbane, Burlingame, Colma, Daly City, East Palo Alto, Foster City, Half
Moon Bay, Menlo Park, Millbrae, Pacifica, Portola Valley, Redwood City, San Bruno,
San Carlos, San Mateo, South San Francisco, Woodside, Milpitas, Cupertino, Los Gatos,
Los Altos, Campbell, and Mountain View (Rincon Consultants Inc., 2012). The most
effective argument to get cities on board was the need to comply with the MRP’s
regulations, since the State Water Board was allowing six to twelve percent trash load
reductions to jurisdictions that adopted plastic bag policies (D. Peterson, personal
communication, March 5, 2015; City of San Mateo, 2012). Because Gilroy and Morgan
Hill, (both located in southern Santa Clara County), are in a different watershed than the
rest of San Mateo and Santa Clara Counties, and are not regulated by the MRP, they were
not included as participating agencies (D. Peterson, personal communication, March 5,
2015). Atherton, Monte Sereno, and Hillsborough had no retail stores therefore they were
not interested in being part of the effort (ibid.). Millbrae adopted its own ordinance with a
Negative Declaration before the model ordinance and EIR process were complete. To
date, all participating agencies have adopted the model ordinance except Woodside and
Milpitas. Woodside only had two applicable stores and did not have the political will to
pass the ordinance, while Milpitas had one city council member who strongly opposed
the ordinance and blocked the effort (ibid.).
33
In July 2011, RecycleMore conducted a feasibility study for a plastic bag
ordinance that could be adopted by its member agencies of El Cerrito, Hercules, Pinole,
Richmond, and San Pablo. The study discussed current legal challenges, court decisions
and their impacts on CEQA compliance; how the ordinance enables compliance with the
MRP; and alternative approaches and cost-sharing options among jurisdictions (West
Contra Costa Integrated Waste Management Authority, 2011). Responding to pressure
from its member agencies, RecycleMore went forward with the model ordinance and
conducted an initial study that concluded that the proposed policy would not result in
“cumulatively considerable contributions to cumulatively significant environmental
impacts”, therefore the agency drafted a negative declaration (West Contra Costa
Integrated Waste Management Authority, 2012; West Contra Costa Integrated Waste
Management Authority, 2013). Responding to threats from the Coalition regarding its
initial study, RecycleMore protected itself from litigation by preparing an EIR in August
2012 that could be used by member agencies for the adoption of its model ordinance
(West Contra Costa Integrated Waste Management Authority, 2013). Although Contra
Costa County is not an official member agency of RecycleMore, parts of the County’s
unincorporated areas are within RecycleMore’s service area (ibid.). Therefore, the
County was included as a participating agency that could use the EIR for ordinance
adoption in those communities (ibid.). In the end, Contra Costa County, Pinole, and
Hercules did not adopt the RecycleMore model ordinance. Hercules adopted an ordinance
on its own in 2014, and it is unclear what CEQA determination was used.
34
The SCWMA was next to employ a countywide effort similar to Alameda
County’s. The Authority is a ten-member joint powers agency, consisting of a
representative from each municipality in Sonoma County and the unincorporated areas.
The SCWMA is able to pass policies that promote waste reduction within the County
(Sonoma County Waste Management Agency, 2014). For years the SCWMA debated
alternative approaches for plastic bag policies in the County: a SCWMA countywide
ordinance and EIR with the SCWMA providing enforcement; a SCWMA model
ordinance and EIR for participating agencies to adopt with each jurisdiction providing
enforcement; and completely individual jurisdiction efforts (Sonoma County Waste
Management Agency, 2011). The first approach, the countywide effort, was estimated to
cost the most—$135,000 to $193,000 for CEQA contractor costs, legal costs, and staff
time, and a minimum of $137,000 per year for enforcement costs (ibid.). However, this
route was the least cost for each individual jurisdiction and the least cost for all
jurisdictions combined (ibid). In the end, the SCWMA and its member agencies decided
upon the countywide ordinance and EIR since it would ensure consistency across the
county, cost the least overall for the entire county, and involve the least legal risk to each
jurisdiction (Sonoma County Waste Management Agency, 2011; Sonoma County Waste
Management Agency, 2012). It was passed unanimously by all member agencies in
February 2014 therefore Sonoma County in its entirety is covered by the plastic bag
ordinance.
35
To date, the last countywide effort was in Marin County. The Marin JPA consists
of one representative from each Marin County municipality, plus one from the County
itself. To further the County’s zero waste goal and facilitate the extension of plastic bag
ordinances throughout the County, the JPA acted as lead agency in the preparation of an
EIR and creation of a model ordinance for its member agencies to certify and adopt
individually (Rincon Consulting Inc., 2013; Marin County Hazardous and Solid Waste
Management JPA, 2015; Marin County Hazardous and Solid Waste Management JPA,
2013). Between March and October 2014, eight out of ten of the JPA’s member agencies
adopted the model ordinance. The exceptions were Mill Valley, which previously
adopted its own ordinance using a categorical exemption, and Corte Madera, which has
not adopted at all.
Table 5. Timeline of Plastic Bag Ordinances Adoption, Legal Challenges, Court
Decisions, and Types of CEQA employed by Jurisdictions
Date
Event
CEQA
Legal Information
3/27/07 San Francisco Ordinance
Categorical Exemption
7/17/07 Oakland Ordinance
Categorical Exemption
8/1/07 Fairfax Ordinance
Fairfax makes ordinance
11/7/07 voluntary
Oakland Superior Court
4/17/08 ruling
Manhattan Beach
7/14/08 Ordinance
Fairfax plastic bag
11/4/08 initiative passes
Manhattan Beach
2/20/09 Superior Court Ruling
Categorical Exemption
No legal challenge
Coalition lawsuit
filed 8/3/07
Coalition lawsuit
filed 8/24/07
Negative Declaration
No CEQA necessary
-
In favor of
Coalition
Coalition lawsuit
filed 8/12/08
In favor of
Coalition
36
3/30/09 Palo Alto Ordinance
Negative Declaration
7/27/09 Palo Alto Settlement
Manhattan Beach
1/27/10 Appeal Court Ruling
1/11/11 San Jose Ordinance
Unincorporated Marin
1/25/11 County Ordinance
Unincorporated Santa
4/26/11 Clara County Ordinance
EIR
Categorical Exemption
Negative Declaration
Manhattan Beach
7/14/11 Supreme Court Ruling
Marin County
9/14/11 Superior Court Ruling
12/13/11 Sunnyvale Ordinance
-
Coalition lawsuit
filed 4/20/09
Superior Court
decision upheld
No legal challenge
Coalition lawsuit
filed 2/21/11
No legal challenge
Appeal Court
decision struck
down
In favor of Marin
County
EIR
-
1/25/12 Entire Alameda County
EIR
-
2/14/12 Millbrae
Unincorporated
11/6/12 San Mateo County
Negative Declaration
-
Bi-County EIR
-
12/10/12 Pacifica
Bi-County EIR
-
12/11/12 Mountain View
Bi-County EIR
-
12/12/12 South San Francisco
Bi-County EIR
-
1/7/13 Foster City
Bi-County EIR
-
1/8/13 Belmont
Bi-County EIR
-
1/9/13 Colma
Bi-County EIR
-
1/13/13 San Bruno
Bi-County EIR
-
1/14/13 Daly City
Bi-County EIR
-
1/22/13 Menlo Park
Bi-County EIR
-
1/23/13 Portola Valley
Bi-County EIR
-
3/5/13 Half Moon Bay
Bi-County EIR
-
3/5/13 Cupertino
Bi-County EIR
-
3/11/13 San Carlos
Bi-County EIR
-
3/12/13 Los Altos
Bi-County EIR
-
3/18/13 Burlingame
Bi-County EIR
-
37
3/18/13 Brisbane
Bi-County EIR
-
3/25/13 Redwood City
Bi-County EIR
-
4/2/13 East Palo Alto
Bi-County EIR
-
5/6/13 City of San Mateo
Marin County
6/25/13 Appeal Court Ruling
Bi-County EIR
7/16/13 Richmond
RecycleMore EIR
-
7/16/13 Campbell
Bi-County EIR
-
9/3/13 Los Gatos
Bi-County EIR
-
9/17/13 El Cerrito
RecycleMore EIR
-
10/8/13 San Pablo
RecycleMore EIR
-
10/21/13 Pittsburg
Negative Declaration
-
10/21/13 Mill Valley
Categorical Exemption
-
11/2/13 Morgan Hill
Categorical Exemption
-
2/19/14 Entire Sonoma County
SCWMA EIR
-
3/3/14 San Rafael
Marin JPA EIR
-
3/6/14 Novato
Marin JPA EIR
-
3/18/14 Walnut Creek
Categorical Exemption
-
3/18/14 Sausalito
Marin JPA EIR
-
5/7/14 Larkspur
Marin JPA EIR
-
Marin JPA EIR
-
Marin JPA EIR
-
6/18/14 Martinez
Categorical Exemption
-
7/15/14 Calistoga
Categorical Exemption
-
8/4/14 Pleasant Hill
Categorical Exemption
-
8/5/14 City of Napa
Categorical Exemption
-
8/12/14 St. Helena
Categorical Exemption
-
8/19/14 City of Santa Clara
Negative Declaration
-
Unknown
-
Marin JPA EIR
-
Marin JPA EIR
-
Categorical Exemption
-
5/27/14 San Anselmo
6/9/14 Belvedere
9/9/14 Hercules
10/3/14 Tiburon
10/11/14 Ross
12/8/14 Lafayette
-
Superior Court
decision upheld
38
12/16/14 Danville
Categorical Exemption
-
Overarching Environmental Policies
As previously mentioned, jurisdictions in Contra Costa, Alameda, Santa Clara,
and San Mateo Counties are required to comply with zero trash NPDES stormwater
permits. In addition, many jurisdictions have passed zero waste policies or waste
diversion resolutions that are more stringent than State standards. Was compliance with
these overarching environmental policies a motivating factor for jurisdictions to adopt
plastic bag policies?
Table 6 lists all adopting and non-adopting jurisdictions in the Bay Area, whether
they were included in a zero trash NPDES stormwater permit at the time of adoption,
whether they had passed stringent waste diversion goals at the time of adoption, and
whether they used these policies as justification in the passage of plastic bag policies. If a
jurisdiction mentioned the NPDES permit or its waste diversion policy in its ordinance,
legal responses, CEQA documents, City Council or Agency meeting notes pertaining to a
plastic bag ban, or plastic bag study session documents, this was considered to be
justification.
The results show that 70 percent of adopters were regulated under the zero trash
NPDES permit at the time of adoption and 77 percent used compliance as justification for
plastic bag policy adoption. However, 67 percent of non-adopters are regulated under a
NPDES permit, as well. Thirty-six percent of adopters had stringent waste diversion
policies at the time of adoption and 100 percent used the waste diversion policies as
39
justification for plastic bag policy adoption. Only three percent (one jurisdiction) of nonadopters had a waste diversion policy more stringent than State standards.
Six adopters were regulated by both policies at the time of adoption, with four
being one of the first 12 adopters. All of the first ten adopters were regulated by at least
one overarching environmental policy, and 90 percent used compliance as justification
for adoption. Fifty-two out of 56 adopters were regulated by either a NPDES permit or a
waste diversion policy, and 46 used compliance as justification for adoption. Each of the
first 36 adopters was covered by one policy or the other, and 35 used compliance with the
policy as justification.
Table 6. Overarching Environmental Policies and their Justification in Plastic Bag Policy
Adoption
Justification
for
adoption?
-
Waste
diversion
policy?
Yes
Yes
Justification
for
adoption?
Yes
Yes
-
Yes
Yes
Yes
Yes
Yes
County
San Francisco
Marin
Jurisdiction
San Francisco
Fairfax
Santa Clara
Palo Alto
3/30/09
Santa Clara
San Jose
Unincorporated
Marin County
Unincorporated
Santa Clara County
Sunnyvale
Entire
Alameda County
Millbrae
San Mateo County
Pacifica
Mountain View
South San Francisco
Foster City
Belmont
Colma
1/11/11
NPDES
permit?
No
No
No
(pre-MRP)
Yes
1/25/11
No
-
Yes
Yes
4/26/11
Yes
No
No
-
12/13/11
Yes
Yes
Yes
Yes
1/25/12
Yes
Yes
Yes
Yes
2/14/12
11/6/12
12/10/12
12/11/12
12/12/12
1/7/13
1/8/13
1/9/13
Yes
Yes
Yes
Yes
Yes
Yes
Yes
Yes
Yes
Yes
Yes
Yes
Yes
Yes
Yes
Yes
No
No
No
Yes
No
No
No
No
Yes
-
Marin
Santa Clara
Santa Clara
Alameda
San Mateo
San Mateo
San Mateo
Santa Clara
San Mateo
San Mateo
San Mateo
San Mateo
Date
Adopted
4/10/07
11/4/08
40
San Mateo
San Mateo
San Mateo
San Mateo
San Mateo
Santa Clara
San Mateo
Santa Clara
San Mateo
San Mateo
San Mateo
San Mateo
San Mateo
Contra Costa
Santa Clara
Santa Clara
Contra Costa
Contra Costa
Contra Costa
Marin
Santa Clara
Sonoma
Marin
Marin
Contra Costa
Marin
Marin
Marin
Marin
Contra Costa
Napa
Contra Costa
Napa
Napa
Santa Clara
Contra Costa
Marin
Marin
Contra Costa
Contra Costa
San Bruno
Daly City
Menlo Park
Portola Valley
Half Moon Bay
Cupertino
San Carlos
Los Altos
Brisbane
Burlingame
Redwood City
East Palo Alto
San Mateo City
Richmond
Campbell
Los Gatos
El Cerrito
San Pablo
Pittsburg
Mill Valley
Morgan Hill
Entire
Sonoma County
San Rafael
Novato
Walnut Creek
Sausalito
Larkspur
San Anselmo
Belvedere
Martinez
Calistoga
Pleasant Hill
Napa City
St. Helena
City of Santa Clara
Hercules
Tiburon
Ross
Lafayette
Danville
1/13/13
1/14/13
1/22/13
1/23/13
3/5/13
3/5/13
3/11/13
3/12/13
3/18/13
3/18/13
3/25/13
4/2/13
5/6/13
7/16/13
7/16/13
9/3/13
9/17/13
10/8/13
10/21/13
10/21/13
11/6/13
Yes
Yes
Yes
Yes
Yes
Yes
Yes
Yes
Yes
Yes
Yes
Yes
Yes
Yes
Yes
Yes
Yes
Yes
Yes
No
No
Yes
Yes
Yes
Yes
Yes
Yes
Yes
Yes
Yes
Yes
Yes
Yes
Yes
Yes
Yes
Yes
Yes
Yes
Yes
-
No
No
No
No
No
No
No
No
No
No
No
No
No
Yes
No
No
No
No
No
Yes
No
Yes
Yes
-
2/19/14
No
-
-
-
3/3/14
3/6/14
3/18/14
3/18/14
5/7/14
5/27/14
6/9/14
6/18/14
7/15/14
8/4/14
8/5/14
8/12/14
8/19/14
9/9/14
10/3/14
10/11/14
12/8/14
12/16/14
No
No
Yes
No
No
No
No
Yes
No
Yes
No
No
Yes
Yes
No
No
Yes
Yes
No
No
No
Yes
No
No
No
Yes
Yes
No
Yes
Yes
Yes
Yes
No
No
No
Yes
No
No
No
Yes
Yes
Yes
No
Yes
Yes
Yes
Yes
Yes
Yes
Yes
Yes
Yes
Yes
-
41
Contra Costa
Contra Costa
Contra Costa
Contra Costa
Contra Costa
Contra Costa
Contra Costa
Contra Costa
Contra Costa
Contra Costa
Marin
San Mateo
San Mateo
San Mateo
Santa Clara
Santa Clara
Santa Clara
Santa Clara
Santa Clara
Solano
Solano
Solano
Solano
Solano
Solano
Solano
Solano
Napa
Napa
Napa
Unincorporated
Contra Costa
County
Antioch
Brentwood
Clayton
Concord
Moraga
Oakley
Orinda
Pinole
San Ramon
Corte Madera
Atherton
Hillsborough
Woodside
Gilroy
Los Altos Hills
Milpitas
Monte Sereno
Saratoga
Unincorporated
Solano County
Benicia
Dixon
Fairfield
Rio Vista
Suisun City
Vacaville
Vallejo
Unincorporated
Napa County
American Canyon
Yountville
n/a
Yes
-
No
-
n/a
n/a
n/a
n/a
n/a
n/a
n/a
n/a
n/a
n/a
n/a
n/a
n/a
n/a
n/a
n/a
n/a
n/a
Yes
Yes
Yes
Yes
Yes
Yes
Yes
Yes
Yes
No
Yes
Yes
Yes
No
Yes
Yes
Yes
Yes
-
No
No
No
No
No
No
No
No
No
Yes
No
No
No
No
No
No
No
No
-
n/a
No
-
No
-
n/a
n/a
n/a
n/a
n/a
n/a
n/a
No
No
Yes
No
Yes
No
Yes
-
No
No
No
No
No
No
No
-
n/a
No
-
No
-
n/a
n/a
No
No
-
No
No
-
Master Environmental Assessment
As discussed previously, the Green Cities California’s 2010 MEA on Single-Use
and Reusable Bags was created to assist local jurisdictions in the adoption of plastic bag
42
policies by providing informational resources to be used in CEQA documents. Table 7
shows that nine out of eleven EIRs or initial studies cited the MEAs findings, with two
EIRs citing the MEA over 30 times.
Table 7. MEA Use in CEQA Documents
MEA used as
CEQA Document
reference?
San Jose EIR
Unincorporated
Santa Clara County Initial Study
Sunnyvale EIR
Alameda County EIR
Millbrae Initial Study
San Mateo Bi-County EIR
RecycleMore EIR
Pittsburg Initial Study
Sonoma County EIR
Marin JPA EIR
City of Santa Clara Initial Study
Number of
times cited
No
-
Yes
Yes
Yes
Yes
Yes
Yes
No
Yes
Yes
Yes
5
22
1
1
25
5
32
31
8
Discussion
Demographics, the Coalition’s Obstacles, and Resource Sharing
The obstacles presented by the Coalition and the subsequent court decisions
created a blueprint for how jurisdictions used CEQA to adopt policies. To comply with
overarching environmental policies and to have cohesive countywide policies, some
higher-level institutions like county governments and waste management authorities
assisted the adoption process by paying for EIRs and creating model ordinances that
individual city councils could adopt. In Alameda and Sonoma Counties, the waste
43
management JPA financed an EIR, created an ordinance, and adopted a countywide
policy. Because of these multi-scalar intricacies, the previous demographic correlation
results may not be the most meaningful analytical method for this data set.
Correlating demographic data with innovation scores in the “Municipalities of the
Same County” set is misleading because while some cities adopted plastic bag bans using
their own resources, other municipalities adopted bans using model ordinances and EIRs
financed by larger governing institutions. This issue was exposed in Gray’s (1973)
critique of Walker’s (1969) study, whereby Walker found that a state’s wealth impacted
policy innovation but as Gray pointed out, Walker did not differentiate between policies
that were federally funded and those funded solely by the state. In San Mateo County,
Millbrae adopted its own ordinance before other cities in the County. It is unclear
whether the cities that used the San Mateo County model ordinance and EIR would ever
have adopted independently. Likewise in Contra Costa County, RecycleMore’s member
agencies were able to adopt plastic bag policies by using the model ordinance and EIR
financed by the waste management authority, which made adoption much easier than in
other Contra Costa County cities at that time. These examples invalidate any significant
correlation between innovation scores and demographic data, since higher-level
institutions funded some municipalities’ policies. Jurisdictions that used model
ordinances and EIRs for passage ultimately undertook the same low-risk, low-expense
process as those of late adopting, self-financed jurisdictions since late adopters had more
time to learn from the diffusion process.
44
Correlating demographic data to a purely “Counties” set is also problematic
because of jurisdictional variation. Waste Management Districts in Alameda and Sonoma
Counties passed plastic bag bans for entire counties, while Marin and Santa Clara
Counties passed ordinances for unincorporated areas only. San Mateo County passed an
ordinance for its unincorporated areas, but only after going through the model ordinance
and EIR process with the DEH. Therefore, there is conflict about which demographic
data should be used: countywide data or only data for unincorporated areas. It is invalid
to correlate values from different scales and get meaningful results, but to use one type of
value for the “Counties” set would be misleading. In addition, counties are not solely
funded by their unincorporated areas and officials are elected by the entire county, so
using only unincorporated demographic values for counties that passed ordinances for
their unincorporated areas misrepresents the true character of a county.
Overall, analysis of policy diffusion at the local or regional level is most
meaningful when jurisdictions are truly separated into comparable sets. Table 8 accounts
for the nuanced policy details discussed previously by listing the municipalities in the
Bay Area that adopted independently, without financial assistance from a higher-level
governing authority. Table 9 lists the correlation coefficients between the jurisdiction’s
innovation scores in Table 8 and their demographic data. This new set has strong positive
relationships with population size and with the percentage of Democratic ballots cast in
each election. Larger, more heavily Democratic municipalities were likely to
45
independently adopt plastic bag policies before smaller, less heavily Democratic
municipalities did so.
Table 8. Municipalities That Adopted Independently
County
Jurisdiction
San Francisco
Marin
Santa Clara
Santa Clara
Santa Clara
San Mateo
Contra Costa
Marin
Santa Clara
Contra Costa
Contra Costa
Napa
Contra Costa
Napa
Napa
Santa Clara
Contra Costa
Contra Costa
Contra Costa
San Francisco
Fairfax
Palo Alto
San Jose
Sunnyvale
Millbrae
Pittsburg
Mill Valley
Morgan Hill
Walnut Creek
Martinez
Calistoga
Pleasant Hill
City of Napa
St. Helena
City of Santa Clara
Hercules
Lafayette
Danville
Date Adopted
4/10/07
11/4/08
3/30/09
1/11/11
12/13/11
2/14/12
10/21/13
10/21/13
11/6/13
3/18/14
6/18/14
7/15/14
8/4/14
8/5/14
8/12/14
8/19/14
9/9/14
12/8/14
12/16/14
IS
1.00
0.80
0.74
0.51
0.39
0.37
0.15
0.15
0.14
0.10
0.06
0.05
0.05
0.05
0.04
0.04
0.03
0.00
0.00
Table 9. Correlation Coefficients between Innovation Scores of Municipalities that
Adopted Independently and Demographic Data
2010
Per
2008
2012
California
Capita
Presidential Presidential Gubernatorial
Set Type
Population Income
Election
Election
Election
Municipalities
that Adopted
Independently
0.56
0.18
0.59
0.61
0.59
46
Another way to analyze the data is to compare the average demographic values of
all adopters versus the non-adopters (Table 10). To avoid double counting, in instances
where a county adopted a policy for its unincorporated areas separately from other
municipalities, the unincorporated area’s demographic values are used. As Table 10
shows, adopters tended to be larger jurisdictions with a more heavily Democratic
electorate. Per capita income averages for adopters and non-adopters are similar. The
sharing of financial resources between higher-level institutions and their participating
agencies appears to have leveled the playing field for less-wealthy jurisdictions.
Table 10. Average Demographic Values of Adopters Versus Non-adopters
Set Type
Adopters
Non-adopters
2008
Presidential
Election
2012
Presidential
Election
2010 California
Gubernatorial
Election
Population
Per
Capita
Income
73.33
62.65
71.35
59.67
65.48
53.73
105,241
41,908
$51,505
$53,258
These revelations do not suggest that cities and counties adopted plastic bag bans
in a vacuum. Policy adopters clearly learned from other adopters. When one jurisdiction
adopted an ordinance, its process and results acted as a form of information that other
places used in their own policy process. When a jurisdiction was sued over its policy,
most jurisdictions waited for judicial decisions to provide the ground rules for subsequent
adoptions. This is where the innovation score is valuable. The lapse in the innovation
score between San Francisco and Fairfax is a result of the Coalition’s lawsuits against
Fairfax and Oakland’s first plastic bag ordinances. The gap in the innovation score
47
between Palo Alto and San Jose reflects San Jose’s effort to create a legally sound
ordinance and prepare the first EIR that was in accordance with the Oakland and
Manhattan Beach decisions. Finally, the time elapsed between Millbrae and
unincorporated San Mateo County adoptions was most likely the result of the arduous
process undertaken by the DEH of persuading 25 jurisdictions in the bi-county area to be
participating agencies in its EIR and model ordinance. This effort spurred the passage of
22 plastic bag bans in the Bay Area in less than one year, whereas the time between the
first adoption in San Francisco and the 10th adoption in San Mateo County was over five
and a half years. Clearly, the Coalition’s efforts to pose legal obstacles hindered early
adoption of plastic bag bans in the Bay Area, but the legal outcomes facilitated
widespread adoption in the end.
In addition to cross-jurisdictional learning, cities, counties and waste management
authorities gained valuable informational resources from the Green Cities California
MEA, which decreased the costs associated with CEQA compliance since it enabled
governments and environmental consultants to spend less staff time preparing EIRs and
initial studies (ICF International, 2010).
Overarching Environmental Policies
The results of Table 6 are significant. At the time of adoption, 92.8 percent of
plastic bag policy adopters were regulated either by a NPDES stormwater permit or a
stringent waste diversion policy, and 88.5 percent used compliance with the policy as
justification for adoption. It is apparent that overarching environmental policies were a
48
motivational force in the adoption of plastic bag policies in the Bay Area. These results
are further bolstered by interviews with government staff, which revealed that the
NPDES stormwater permit (D. Peterson, personal communication, March 5, 2015) and
zero waste policies (S. Chiv, personal communication, November 1, 2013) were effective
arguments for the passage of plastic bag bans. This is not to say that these two
overarching environmental policies were the only reasons for adopting the bans. Most
jurisdictions also cited the high costs of storm drain clean-out, the desire to change
consumer behavior, the reduction of greenhouse gas emissions, and the general negative
impact that plastic bags have on the environment. However, the NPDES permit and
stringent waste diversion goals represent two policies with which compliance can be
reached via incremental measures, therefore compliance with these policies is more
relevant as a motivating factor in this study.
Areas For Further Research
The drivers of policy adoption are innumerable and attempting to examine every
possible reason that plastic bag ban diffusion occurred is beyond the scope of this study.
During research, other variables were revealed that could become the basis for further
study. For example, a lack of retail stores impacted some municipalities’ decisions in San
Mateo County, therefore an analysis of the number of retail stores per jurisdiction could
provide important clues to understanding adoption patterns. Also, from 2006 through
2014 a spate of proposed statewide policies involving plastic bag recycling, plastic bag
bans, and fees on plastic bags either passed or failed in the California State Legislature.
49
These legislative results may have impacted Bay Area jurisdictional decisions. It is also
possible that the popularity of local plastic bag bans impacted State decisions. A fullscale investigation of the top down and/or bottom up effects of these policies would be an
important contribution to this subject.
Conclusion
The results of this study demonstrate that Mohr’s theory of organizational
innovation is alive and well. The Coalition’s lawsuits created obstacles to the adoption of
plastic bag policies, however jurisdictions were motivated to adopt because the policies
helped them comply with overarching environmental programs. The sharing of financial
and informational resources also bolstered the adoption process by reducing uncertainty.
In fact, in the Bay Area, the Coalition’s obstacles ended up enabling widespread adoption
once the legal blueprint had been established.
This study also shows how overarching policies can help drive the passage of
smaller, related polices. While this study does not contend that plastic bag policies would
not have been adopted if the NPDES permits or zero waste policies were not in place, it is
clear that the incremental benefits of plastic bag bans to the larger policies played well in
the policy adoption setting. This serves as a message to policymakers that it is important
to pass overarching policies to establish long-range goals, since these policies can in turn
facilitate the passage of smaller, more specific policies.
This study demonstrates the need for nuanced analysis of political processes and
results in demographic analysis. The diffusion of innovation literature had only analyzed
50
demographic data at the state level, which has a more consistent application than at the
county or local level. It is important to understand the qualitative nature of policy
diffusion. However, when the jurisdictions were grouped according to comparable sets,
the demographic analysis in this study revealed the large jurisdictions with more heavily
Democratic electorates were more inclined to adopt these environmental policies than
smaller, less heavily Democratic jurisdictions (if they adopted at all). This finding
supports the literature and also adds to it by extending its application to the local level.
By examining qualitative and quantitative data, this study shows that the
widespread and rapid diffusion of plastic bag policies in the Bay Area was determined
mainly by two things: the impact of the Coalition’s legal challenges, and the sharing of
financial and informational resources between higher-level jurisdictions and their
participating agencies. Other determinants appear to have provided ancillary support.
Green Cities California’s MEA was a valuable informational resource that helped
jurisdictions save money related to CEQA compliance, but since San Jose conducted its
EIR without the MEA’s assistance, it is unclear whether other jurisdictions would have
simply used San Jose’s EIR as a model if the MEA had not been created. In addition,
some jurisdictions were clearly motivated to pass plastic bag policies to help them
achieve overarching environmental policies, but not all. Many jurisdictions cited other
reasons besides waste diversion and water quality as justification for adoption. Finally,
the demographic analysis revealed a significant relationship between population size and
political party preference, but these results are not an absolute determinant of diffusion.
51
Instead, knowing this information will help policy professionals understand that shared
resources may assist the adoption of environmental policies in smaller, less
Democratically leaning jurisdictions, especially if there is a need to comply with
overarching environmental policies.
References
Alameda County Waste Management Authority. (2011). Draft Environmental Impact
Report: Mandatory Recycling and Single Use Bag Reduction Ordinances.
Oakland, CA.
Alameda County Waste Management Authority. (2012). Ordinance No. 2012-2.
Retrieved from
http://www.cawrecycles.org/files/Stopwaste_ordinance_bag_executed.pdf
Alameda County Waste Reduction and Recycling Act. Section 64: Waste Reduction and
Recycling. (1990).
Balla, S. J. (2001). Interstate Professional Associations and the Diffusion of Policy
Innovations. American Politics Research, 29(3), 221-245.
Berry, F. S., & Berry, W. D. (1990). State Lottery Adoptions as Policy Innovations: An
Event History Analysis. The American Political Science Review, 395-415.
California Department of Resources Recycling and Recovery. (1997). History of
California Solid Waste Law, 1985-1989. Retrieved from
http://www.calrecycle.ca.gov/Laws/Legislation/CalHist/1985to1989.htm.
California Environmental Quality Act. Cal. Public Resources Code Section 21000 et seq.
(1970).
Californians Against Waste. (2014). Plastic Bags: Local Ordinances. Retrieved from
http://www.cawrecycles.org/issues/plastic_campaign/plastic_bags/local.
Cascadia Consulting Group. (2009). California 2008 Statewide Waste Characterization
Study. Retrieved from
http://www.calrecycle.ca.gov/Publications/Documents/General/2009023.pdf.
Central Valley Regional Water Quality Control Board. (2010). East Contra Costa County
Municipal NPDES Permit. NPDES Permit No. CAS083313. Retrieved from
http://www.waterboards.ca.gov/centralvalley/board_decisions/adopted_orders/con
tra_costa/r5-2010-0102_npdes.pdf.
City and County of San Francisco. (2002). Resolution for 75% Waste Diversion Goal.
Resolution No. 679-02. Retrieved from
http://www.sfbos.org/ftp/uploadedfiles/bdsupvrs/resolutions02/r0679-02.pdf.
City and County of San Francisco. (2007). Ordinance No. 81-01. Plastic Bag Reduction
Ordinance. Retrieved from
http://www.sfbos.org/ftp/uploadedfiles/bdsupvrs/ordinances07/o0081-07.pdf.
City of Manhattan Beach. (2008). Initial Study/Environmental Checklist for the
52
Manhattan Beach Municipal Code Amendment to Prohibit Single-Use Plastic
Carry-Out Bags at Commercial Establishments. Retrieved from
http://www.ci.manhattan-beach.ca.us/home/showdocument?id=5344.
City of Oakland. (2007). Ordinance No. 12818. Retrieved from
http://www.oaklandcityattorney.org/PDFS/PLASTIC%20BAG%20ORD%20(F).
pdf.
City of San Jose. (2010). Draft Environmental Impact Report Single-Use Carryout Bag
Ordinance. San Jose, California.
City of San Jose. (2011). Ordinance No. 28877. Retrieved from
http://www.ci.milpitas.ca.gov/_pdfs/commissions/rsrac/2011/042611/item_f.pdf.
City of San Mateo. (2012). Administrative Report. Study Session: Countywide Ban on
Single-Use Plastic Carryout Bags. Retrieved from
http://www.cityofsanmateo.org/DocumentCenter/Home/View/10193.
Coalition to Support Plastic Bag Recycling v. City of Oakland. (2007). Verified Petition
for Writ of Mandate Under the California Environmental Quality Act (“CEQA”).
No. RG07339097. Superior Court of Alameda County. August 3, 2007
Coalition to Support Plastic Bag Recycling v. City of Oakland. (2008a). Tentative
Decision Granting Petition for Writ of Mandate. No. RG07339097. Superior
Court of Alameda County. April 17, 2008.
Coalition to Support Plastic Bag Recycling v. City of Oakland. (2008b). Judgment
Granting Peremptory Writ of Mandate. No. RG07339097. Superior Court of
Alameda County. May 16, 2008.
County of Marin. (2011). Ordinance No. 3553. Retrieved from
http://www.cawrecycles.org/files/ORD-3553.pdf.
County of Santa Clara. (2011). Ordinance No. NS – 517.77. Retrieved from
http://www.cawrecycles.org/files/SCC%20Ordinance.pdf.
Downs Jr., G. W., & Mohr, L. B. (1976). Conceptual issues in the study of innovation.
Administrative Science Quarterly, 700-714.
Gen. S., & Wright, A.C. (2013). Policy Advocacy Organizations: A Framework Linking
Theory and Practice. Journal of Policy Practice, 12, 163-193.
Grattet, R., Jenness, V., & Curry, T. R. (1998). The Homogenization and Differentiation
of Hate Crime Law in The United States, 1978 to 1995: Innovation and Diffusion
in the Criminalization of Bigotry. American Sociological Review, 286-307.
Gray, V. (1973). Innovation in the States: A Diffusion Study. The American Political
Science Review, 1174-1185.
Green Cities California. (2013). About Us. Retrieved from
http://greencitiescalifornia.org/pages/about.html.
Grossback, L., Nicholson-Crotty, S., & Peterson, D. (2004). Ideology and Learning in
Policy Diffusion. American Politics Research 32(5): 521–45.
ICF International. (2010). Master Environmental Assessment on Single-Use and
Reusable Bags. Retrieved from http://plasticbaglaws.org/wordpress/wpcontent/uploads/2010/04/MEA_green-cities-CA.pdf.
53
Leip, D. (2012). 2012 Presidential General Election Results. Retrieved from
http://uselectionatlas.org/RESULTS/national.php.
Lutz, J. M. (1986). The Spatial and Temporal Diffusion of Selected Licensing Laws in
the United States. Political Geography Quarterly, 5(2), 141-159.
Marin County Hazardous and Solid Waste Management JPA. (2013). Response to Grand
Jury Report Form. Retrieved from
http://www.marincounty.org/~/media/files/departments/gj/reportsresponses/2012/responses/haz_bag.pdf.
Marin County Hazardous and Solid Waste Management JPA. (2015). Who’s the Marin
JPA? Retrieved from http://zerowastemarin.org/who-we-are/about-the-jpa/.
Matisoff, D. C. (2008). The Adoption of State Climate Change Policies and Renewable
Portfolio Standards: Regional Diffusion or Internal Determinants? Review Of
Policy Research, 25(6), 527-546.
Mintrom, M. (1997). Policy Entrepreneurs and the Diffusion Of Innovation. American
Journal Of Political Science, 738-770.
Mohr, L. B. (1969). Determinants of Innovation in Organizations. The American Political
Science Review, 111-126.
Mooney, C. Z. (2001). Modeling Regional Effects on State Policy Diffusion. Political
Research Quarterly, 54(1), 103-124.
North Bay Coalition to Support Plastic Bag Recycling v. Town of Fairfax. (2007).
Verified Petition for Writ of Mandate Under the California Environmental Quality
Act (“CEQA”). No. CV074051. Superior Court of Marin County. Aug 25, 2007.
Palo Alto City Manager. (2009). Approval of a Mitigated Negative Declaration and
Adoption of an Ordinance Amending Chapter 5.35 of Title 5 of the Palo Also
Municipal Code to Place a Limited Prohibition on Single Use Plastic Checkout
Bags. Retrieved from
http://www.cityofpaloalto.org/civicax/filebank/documents/15090.
Rincon Consultants Inc. (2012). County of San Mateo Single Use Bag Ban Ordinance
Draft Program Environmental Impact Report. Retrieved from
http://smchealth.org/sites/default/files/docs/EHS/SanMateoCountySingleUseBag
BanOrdinance_DEIR%5B1%5D.pdf.
Rincon Consulting Inc. (2013). Marin County Hazardous and Solid Waste Management
JPA Single Use Carryout Bag Reduction Ordinance for Marin County Cities and
Towns Draft Environmental Impact Report. Retrieved from
http://zerowastemarin.org/assets/PDFs/Marin-County-JPA-Carryout-BagReduction-Ordinance-DEIR.pdf.
Ringquist, E. J., & Garand, J. C. (1999). Policy change in the American States. In R. E.
Weber & P. Brace (Eds.), American state and local politics (pp. 268–299). New
York: Chatham House Publishing.
Rogers, E. M. (2003, First ed. 1969). Diffusion of Innovations. Free Press: New York,
NY.
R.W. Beck. (2009). 2008 Alameda County Waste Characterization Study. Retrieved from
54
http://38.106.4.125/docs/acwcs-2008r.pdf.
San Francisco Bay Regional Water Quality Control Board. (2009). Staff Report:
Evaluation of Water Quality Conditions for the San Francisco Bay Region.
Proposed Revisions to Section 303(d) List. Retrieved from
http://www.waterboards.ca.gov/sanfranciscobay/board_decisions/adopted_orders/
2009/R2-2009-0008.pdf
San Francisco Bay Regional Water Quality Control Board. (2011). Municipal Regional
Stormwater NPDES Permit. NPDES Permit No. CAS612008. Retrieved from
http://www.swrcb.ca.gov/rwqcb2/board_decisions/adopted_orders/2009/R2-20090074.pdf.
San Francisco Department of Environment. (2003). Resolution Setting Zero Waste Date.
Resolution No. 002-03-COE. Retrieved from
http://www.sfenvironment.org/sites/default/files/editoruploads/zero_waste/pdf/resolutionzerowastedate.pdf.
San Francisco Department of Environment. (n.d.). Zero Waste: Sending Nothing to the
Landfill is a Foreseeable Future. Retrieved from
http://www.sfenvironment.org/zero-waste.
Save the Plastic Bag Coalition v. City of Manhattan Beach. (2008). Verified Petition for
Writ of Mandate Under the California Environmental Quality Act and Request for
Declaratory Relief. No. BS116362. Superior Court of Los Angeles County
Central District. August 17, 2008.
Save the Plastic Bag Coalition v. City of Manhattan Beach. (2009). Hearing on Petition
for Writ of Mandate. No. BS116362. Superior Court of Los Angeles County
Central District. February 20, 2009.
Save the Plastic Bag Coalition v. City of Manhattan Beach. (2011). S180720 (Cal. S.
2011).
Save the Plastic Bag Coalition v. City of Palo Alto. (2009). Settlement Agreement and
Mutual Releases. Retrieved from http://plasticbaglaws.org/wordpress/wpcontent/uploads/2010/05/lit_Palo-Alto_settlement-agreement-with-SPBC.pdf.
Save the Plastic Bag Coalition v. County of Marin. (2011a). Verified Petition for Writ of
Mandate Under the California Environmental Quality Act; Request for
Preliminary Injunction; Request for Declaratory Relief. No. CIV1100996.
Superior Court of Marin County. February 21, 2011.
Save the Plastic Bag Coalition v. County of Marin. (2011b). Memorandum of Points and
Authorities in Opposition to Petition for Writ of Mandate and Complaint for
Declaratory Relief. No. CIV1100996. Superior Court of Marin County.
September 13, 2011.
Save the Plastic Bag Coalition v. County of Marin. (2011c). Order on Submitted Matter.
No. 1100996. Superior Court of Marin County. September 14, 2011.
Save the Plastic Bag Coalition v. County of Marin. (2013). Cal. app. A133868. July 25,
2013.
55
Shipan, C. R., & Volden, C. (2006). Bottom‐Up Federalism: The Diffusion of
Antismoking Policies from US Cities to States. American journal of political
science, 50(4), 825-843.
Shipan, C. R., & Volden, C. (2008). The Mechanisms of Policy Diffusion. American
Journal Of Political Science, 52(4), 840-857.
Solid Waste: Diversion, Cal Assembl. B. 341 (2010-2011), Chapter 476 (Cal. Stat. 2011).
Sonoma County Waste Management Agency. (2011). Special Meeting. Retrieved from
http://www.recyclenow.org/pdf/agenda_packets/2011/agenda_only_20110518.pdf
Sonoma County Waste Management Agency. (2014). Ordinance No. 2014-02.
http://www.cawrecycles.org/files/Ordinance_201402_Waste_Reduction_Program_for_Carryout_Bags.pdf
Stream, C. (1999). Health Reform in the States: A Model of State Small Group Health
Insurance Market Reforms. Political Research Quarterly, 52 (3), 499-525.
Town of Fairfax. (2007). Ordinance No. 722. Retrieved from
http://www.stopwaste.org/docs/fairfax_plastic_bag_ordinance.pdf.
United States Census Bureau. (2015). American Fact Finder. Retrieved from
http://factfinder.census.gov.
Walker, J. (1969). The Diffusion of Innovation among the American States. The
American Political Science Review, 63(3), 880-899.
West Contra Costa Integrated Waste Management Authority. (2011). Single-Use Bag
Ban Feasibility Study. Retrieved from http://richmondconfidential.org/wpcontent/uploads/2011/06/bagreport.pdf.
West Contra Costa Integrated Waste Management Authority. (2012). Initial Study West
Contra Costa County Single-Use Carryout Bag Reduction Ordinance. Retrieved
from http://www.recyclemore.com/sites/default/files/RecycleMore%20%20SingleUse%20Carryout%20Bag%20Reduction%20Ordinance%20Initial%20Study.pdf.
West Contra Costa Integrated Waste Management Authority. (2013). Draft and Final
Environmental Impact Report West Contra Costa County Single-Use Carryout
Bag Reduction Ordinance. Retrieved from
http://www.recyclemore.com/sites/default/files/Draft%20and%20Final%20EIR%
20-%20RecycleMore%20Carryout%20Bag%20Ordinance.pdf.
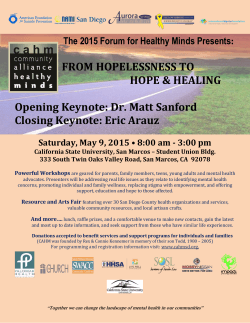


© Copyright 2026