
DALHOUSIE UNIVERSITY - Geological Sciences
LATE CENOZOIC UPPER-CRUSTAL COOLING HISTORY OF THE SHUSWAP METAMORPHIC COMPLEX, SOUTHERN CANADIAN CORDILLERA, BRITISH COLUMBIA: NEW INSIGHTS FROM LOW-TEMPERATURE MULTITHERMOCHRONOMETRY AND INVERSE THERMAL MODELING by Bertha Louis Submitted in partial fulfilment of the requirements for the degree of Master of Science at Dalhousie University Halifax, Nova Scotia April 2015 © Copyright by Bertha Louis, 2015 i TABLE OF CONTENTS LIST OF TABLES ................................................................................................................................. v LIST OF FIGURES .............................................................................................................................. vi ABSTRACT........................................................................................................................................ ix LIST OF ABBREVIATIONS USED ......................................................................................................... x ACKNOWLEDGEMENTS ................................................................................................................... xi CHAPTER 1 INTRODUCTION ............................................................................................................. 1 1.1 Overview .......................................................................................................................... 1 1.1.1 Metamorphic core complexes ..................................................................................... 1 1.1.2 Geological setting of the study area ............................................................................ 3 1.1.3 Low-angle normal faults .............................................................................................. 5 1.1.4 Regional geology .......................................................................................................... 7 1.1.5 Regional extension models .......................................................................................... 8 1.2 Thesis goals / Study objectives ...................................................................................... 16 1.3 Tools ............................................................................................................................... 16 1.4 Thesis structure.............................................................................................................. 17 CHAPTER 2: REGIONAL GEOLOGY .................................................................................................. 18 2.1 Tectonic setting and geological history of the southern Canadian Cordillera ............... 18 2.1.1 Introduction ................................................................................................................... 18 2.1.2 Summary of compressional events................................................................................ 20 2.1.3 Southern Cordilleran extension ..................................................................................... 21 2.2 Geology of the Southern Omineca belt ......................................................................... 25 2.2.1 Introduction ................................................................................................................... 25 2.2.2 The Study Region ........................................................................................................... 27 CHAPTER 3: THERMOCHRONOLOGY - THEORY AND RESULTS ...................................................... 43 3.1 Low temperature thermochronology ............................................................................ 43 3.1.1 Introduction ............................................................................................................... 43 3.1.2 Principles of low temperature thermochronology .................................................... 43 3.2 Apatite fission-track thermochronology (AFT) .............................................................. 48 3.2.1 What is AFT? .............................................................................................................. 48 3.2.2 Fission tracks .............................................................................................................. 48 3.2.3 Fission track annealing, closure temperature and partial annealing zone ................ 50 ii 3.2.4 Age equation .............................................................................................................. 53 3.2.5 External Detector Method (EDM) .............................................................................. 54 3.2.6 Track lengths distribution .......................................................................................... 56 3.3 3.3.1 (U-Th)/He Thermochronology ....................................................................................... 59 What is (U-Th)/He? .................................................................................................... 59 3.3.2. Uranium and Thorium isotopes .................................................................................... 59 3.3.3 4 3.3.4 4 3.3.5 Alpha stopping distances ........................................................................................... 65 3.3.6 Radiation damage ...................................................................................................... 66 3.3.7 Helium Partial Retention Zone (HePRZ) ..................................................................... 68 3.3.8 Correcting for 4He loss ............................................................................................... 70 3.4 He ingrowth .............................................................................................................. 60 He diffusivity behaviour ............................................................................................ 61 Thermochronological results ......................................................................................... 74 3.4.1. Sample location and description .................................................................................. 74 3.4.2 Description of thermochronological ages .................................................................. 77 3.4.3 Trends in thermochronological ages.......................................................................... 87 CHAPTER 4: INVERSE THERMAL MODELING WITH HeFTy ............................................................. 90 4.1. Introduction ................................................................................................................... 90 4.2 HeFTy ............................................................................................................................. 91 4.2.1 Input data, assumptions, and constraints.................................................................. 92 4.2.2 Theoretical annealing models .................................................................................... 93 4.2.3 Searching through candidate thermal histories ........................................................ 93 4.2.4 Statistical comparisons .............................................................................................. 94 4.2.5 Model parameters used for this study ...................................................................... 95 4.3 Modeling description and results .................................................................................. 97 4.3.1 Model 1: Hanging wall of the Columbia River fault ................................................... 97 4.3.2 Models 2 and 3: Monashee complex, located between the Columbia River fault and the Monashee décollement ................................................................................................... 99 4.3.3 Models 4 to 8: Shuswap Metamorphic complex (SMC), located between the Monashee décollement and Okanagan Valley shear zone .................................................. 102 4.3.4 4.4 Models 9 and 10: Okanagan Valley shear zone (OVsz) ............................................ 110 Modeling summary and trends .................................................................................... 113 iii CHAPTER 5: DISCUSSION AND CONCLUSION ............................................................................... 118 5.1 Thermal history of the Shuswap Metamorphic Complex (SMC) ................................. 118 5.1.1 Inverse thermal modeling ........................................................................................ 118 5.1.2 Cooling stage one – high temperature data ............................................................ 123 5.1.3 Cooling stage two –Low temperature thermochronology ...................................... 126 5.1.4 Published thermal models ....................................................................................... 129 5.2 Geographical distribution of cooling ages ................................................................... 132 5.2.1 Age-depth/distance distribution.............................................................................. 132 5.2.2 Advection of isotherms ............................................................................................ 136 5.3 Integration of thermochronological data with the geology of the OVsz and the SMC 141 5.3.1 Composite cooling of the OVsz ................................................................................ 141 5.3.2 Structures influencing SMC cooling ages ................................................................. 142 5.4 Regional models leading to cooling trends in the SMC ............................................... 143 5.5 Conclusions .................................................................................................................. 144 BIBLIOGRAPHY ............................................................................................................................. 146 APPENDIX 1: Analytical procedures for apatite and zircon mineral separation .......................... 172 APPENDIX 2: Analytical procedures for apatite and zircon (U-Th)/He ........................................ 173 APPENDIX 3: Analytical procedure for apatite fission track thermochronology ......................... 175 APPENDIX 4: Full ZHe dataset ...................................................................................................... 176 APPENDIX 5: AFT counting data ................................................................................................... 179 APPENDIX 6: HeFTy model screen shots: full............................................................................... 193 APPENDIX 7: HeFTy model screen shots: < 200°C ....................................................................... 204 APPENDIX 8: Compilation of previous geochronological & thermochronolical data .................. 214 iv LIST OF TABLES Table 2.1: Samples collected from the hanging wall of the Columbia River fault ......................... 31 Table 2.2: Samples collected from the Monashee Complex . ....................................................... 33 Table 2.3: Six samples collected from the SMC ............................................................................. 37 Table 2.4: Six samples collected from the OVsz ............................................................................ 39 Table 2.5: Two samples taken from the OVsz hanging wall .......................................................... 41 Table 3.1: Abundances, half-lives and decay constants of naturally occurring U isotopes . ......... 48 Table 3.2: Geometry and mineral-specific fit parameters for FT calculation. ................................ 71 Table 3.3 Sample location and description .................................................................................... 74 Table 3.4: Apatite (U-Th)/He results .............................................................................................. 79 Table 3.5: Apatite fission-track results .......................................................................................... 84 Table 3.6: ZHe results..................................................................................................................... 86 Table 4.1: Summary of calculated measured and modeled ages by HeFTy for Model 1 .............. 98 Table 4.2: Summary of calculated measured and modeled ages by HeFTy for Model 2 ............ 100 Table 4.3 Summary of calculated measured and modeled ages by HeFTy for Model 3 ............. 102 Table 4.4: Summary of calculated measured and mo deled ages by HeFTy for Model 4 ........... 104 Table 4.5: Summary of calculated measured and modeled ages by HeFTy for Model 5 ............ 105 Table 4.6: Summary of calculated measured and modeled ages by HeFTy for Model 6 ............ 106 Table 4.7: Summary of calculated measured and modeled ages by HeFTy for Model 7 ............ 108 Table 4.8: Summary of calculated measured and modeled ages by HeFTy for Model 8 ............ 110 Table 4.9: Summary of calculated measured and modeled ages by HeFTy for Model 9 ............ 111 Table 4.10: Summary of calculated measured and modeled ages by HeFTy for Model 10 ........ 112 Table 4.11: Modeling results ....................................................................................................... 115 v LIST OF FIGURES Figure 1.1: Map of the world showing the locations of some Phanerozoic core complexes in the continents and oceans.. ................................................................................................................... 2 Figure 1.2: Location and geology of the study area......................................................................... 4 Figure 1.3: Typical components of a low angle normal fault (LANF) that bounds a metamorphic core complex in a continental setting.............................................................................................. 6 Figure 1.4: Illustration of divergent gravitational collapse affecting a thick continental crust. ...... 9 Figure 1.5: Modes of development of continental core complexes in warm, hot, and hottest crust.. ............................................................................................................................................. 11 Figure 1.6. Generalized cross-sections demonstrating (a) Late Jurassic configuration of the evolving orogen above an easterly dipping subduction zone.. ..................................................... 13 Figure 1.7: Model for evolution of the Cordilleran back-arc orogenic plateau ............................. 14 Figure 2.1: The five morphogeological belts of the Canadian Cordillera ...................................... 18 Figure 2.2: Plate geometries proposed for latest Cretaceous to early Tertiary near-trench magmatic record of western North America at 56 Ma.................................................................. 23 Figure 2.3: Location and geology of the study area....................................................................... 26 Figure 2.4: Generalized regional cross-section of the Selkirk fan within the eastern flank of the Selkirk allochthon and hanging wall of the Columbia River fault. ................................................. 29 Figure 2.5: Two principal tectonic models for the formation of the Selkirk fan............................ 30 Figure 2.6: The Cordilleran metamorphic core complexes ............................................................ 35 Figure 2.7: Three vertically gradational lithodemic domains typically make up the OVsz. ........... 38 Figure 3.1: Definition of closure temperature. .............................................................................. 44 Figure 3.2: Closure temperatures of various thermochronometers.. ........................................... 46 Figure 3.3: Ion Spike Explosion model. .......................................................................................... 49 Figure 3.4: Fission tracks ................................................................................................................ 50 Figure 3.5: Long-term natural annealing of fission tracks in apatite ............................................. 51 Figure 3.6: Annealing characteristics for AFT . .............................................................................. 52 Figure 3.7: The external detector method (EDM).......................................................................... 56 Figure 3.8: Crustal section through which a bedrock sample experiences contrasted cooling histories.......................................................................................................................................... 58 Figure 3.9: Arrhenius plot for helium diffusion in apatite.. ........................................................... 63 Figure 3.10: Arrhenius plot for helium diffusion in zircon. ............................................................ 64 vi Figure 3.11: Effects of alpha stopping distances on 4He retention ............................................... 66 Figure 3.12: Helium partial retention zone ................................................................................... 69 Figure 3.13: Geometry of the idiomorphic zircon crystal model. .................................................. 73 Figure 3.14: Location and geology of the study area . ................................................................... 75 Figure 3.15: Horizontal distance of sample from OVsz plotted against elevation. ....................... 76 Figure 3.16: Apparent cooling ages plotted against horizontal distance, relative to their position from the OVsz, the Monashee Decollement (MD) and the Colombia River Fault (CRF). .............. 88 Figure 4.1: Example of time-temperature constraints from HeFTy............................................... 93 Figure 4.2: Model 1 representing the cooling paths calculated for two samples from the hanging wall of the Columbia River fault, RS1201 and RS1202................................................................... 98 Figure 4.3: Model 2 represents the cooling history of RS1203 in the Monashee Complex ........ 100 Figure 4.4: Model 3 shows the combined cooling history for samples RS1204 and RS1205 ...... 102 Figure 4.5: Model 4 represents the cooling path for sample RS1206, located in the SMC ......... 103 Figure 4.6: Model 5 represents the combined cooling history for samples RS1207and RS1208 105 Figure 4.7: Model 6 represents the cooling history for sample RS1209, located in the SMC ..... 106 Figure 4.8: Model 7 represents the cooling history of sample RS1210, located in the SMC....... 108 Figure 4.9: Model 8 represents the cooling history of sample BV1229, located in the SMC ...... 109 Figure 4.10: Model 9 represents the cooling history of sample BV1228, located in the OVsz ... 111 Figure 4.11: Model 10 represents the combined cooling history of BV1217 and BV1218, located in the OVsz ................................................................................................................................... 112 Figure 4.12: Summary of HeFTy models along the study transect. ............................................. 117 Figure 5.1: Summary of HeFTy models (from Chap. 4) . .............................................................. 118 Figure 5.2: Summary of parameters obtained from HeFTy models ............................................ 120 Figure 5.3 Summary of HeFTy models (from Chap. 4) highlighting the low temperature cooling history (< 200°C) for the OVsz and SMC. .................................................................................... 121 Figure 5.4: Compilation of published and new data for the SMC................................................ 124 Figure 5.5: Thermal modeling for a sample within the SMC ....................................................... 129 Figure 5.6: Thermal modeling for the hanging wall sample of the OVsz..................................... 130 Figure 5.7: Summary HeFTy models for the eastern region of the SMC ..................................... 131 Figure 5.8: Conceptual model illustrating the structural evolution and exhumation of footwall rocks from beneath a low angle normal fault after extension, including a theoretical cooling age distribution as shown on a cooling age versus horizontal distance plot. .................................... 133 vii Figure 5.9: Apparent cooling age from this study against horizontal distance from OVsz ......... 134 Figure 5.10: Apparent cooling age from this study against structural distance to the OVsz . .... 135 Figure 5.11: Distribution of zircon and apatite fission-track ages in the metamorphic core projected onto a line 025° from the Naxos Island, southern Aegean Sea. . ............................... 137 Figure 5.12: Numerical thermal model results for a 15° dipping low angle normal fault with erosion in the footwall. ................................................................................................................ 138 Figure 5.13: Conceptual model illustrating the potential effects of erosion on the structural evolution and exhumation of footwall rocks from beneath a low angle normal fault after extension, including a theoretical cooling age distribution as shown on a cooling age versus horizontal distance plot. .............................................................................................................. 139 Figure 5.14: Age‐distance diagram given for six thermochronometers: AFT, ZFT, biotite Rb‐Sr, biotite 40Ar/39Ar and K/Ar, white mica 40Ar/39Ar and K/Ar, white mica Rb‐Sr ............................. 140 Figure 5.15: Three vertically gradational lithodemic domains typically make up the OVsz ........ 142 viii ABSTRACT The Shuswap Metamorphic Complex (SMC), located in the southern Canadian Cordillera, transitioned from a contractional orogen in the Early Jurassic to Late Cretaceous to an extensional tectonic province in the Eocene. Normal faulting of the brittle upper crust and ductile thinning of the mid- to lower crust accommodated crustal extension and led to the development of metamorphic core complexes, such as the SMC, along the length of the Cordillera. Several models have been proposed to explain the onset of Eocene extensional deformation, including post-orogenic collapse, delamination of the lithospheric mantle, and channel flow. Determining the timing of activity of the main extensional shear zones bounding the metamorphic core complexes is a first step to discriminate between these different geodynamic models. The study area encompasses the SMC, which includes some of the most deeply exhumed rocks of the southern Canadian Cordillera, and the underlying Monashee complex, where North American basement gneisses are exposed. At the latitude of this study, the SMC is bounded to the west by a low angle normal fault, the Eocene WNW-dipping Okanagan Valley shear zone (OVsz), and to the east by the Columbia River fault, a brittle-to-ductile Eocene east-dipping extensional fault zone. Twenty bedrock samples were strategically collected along a 50 km-long transect across the SMC in order to characterize the upper-crustal cooling history of the SMC and constrain the timing of activity of its bounding structures, including the OVsz and the Columbia River fault, using low-temperature multi-thermochronology combined with inverse thermal modeling. We present a new dataset consisting of 12 apatite and five zircon (U-Th)/He (AHe and ZHe, respectively) and 15 apatite fission track (AFT) cooling ages. Inversion of this dataset using HeFty software suggest that along the OVsz and across the SMC, rapid cooling at rate of 15-30°C/Ma lasted from ~60 Ma until the Late Eocene (~37 Ma) and slowed down at rates of 2-5°C between ~37 and ~10-5 Ma. The structural distribution of AFT and AHe cooling ages suggest that displacement on the OVsz continued until 10-5 Ma, which is much younger than the 45 Ma ages previously proposed in the literature. This long protracted cooling of the SMC and sustained displacement on the OVsz can support a model of post-orogenic extensional collapse of the Canadian Cordillera. ix LIST OF ABBREVIATIONS USED SMC – Shuswap Metamorphic Complex OVsz – Okanagan Valley shear zone AFT – apatite fission-track AHe – apatite (U-Th)/Helium ZHe – zircon (U-Th)/Helium ZFT –zircon fission track 40 Ar-39Ar – argon thermochronometry LANF – low angle normal fault PAZ – partial annealing zone APAZ – apatite partial annealing zone PRZ – partial retention zone HePRZ – (U-Th)/He partial annealing zone RDAAM - Radiation Damage Accumulation and Annealing Model eU – effective uranium concentration GOF – goodness of fit K-S – Kolmogorov-Smirnov test MTL – meant track length Dpar – mean fission track etch pit diameter rmr - reduced lengths of the apatites that are more resistant to annealing x ACKNOWLEDGEMENTS I would like to acknowledge and thank my supervisor, Isabelle Coutand, for providing the opportunity, scientific guidance, and mentorship throughout the duration of this project. I am also extremely grateful to Dan Gibson (Simon Fraser University) and Laurent Godin (Queens University) for co-supervising this project and providing an immense amount of support, discussion, and feedback on my work. I would also like to thank Djordje Grujic and Richard Cox for putting time and effort in being part of my thesis committee. I would also like to acknowledge and thank Dalhousie Earth Sciences department for providing facilities, funding, opportunities for learning and enjoyment, and for always having answers; mineral processing and fission track dating was carried out in the Dalhousie Fission Track Laboratory and the Dalhousie Geochronology Centre. I would also like to acknowledge the University of California Santa Cruz, Earth & Planetary Sciences University of California Santa Cruz Earth & Planetary Sciences (Jeremy Hourigan) for the opportunity to work in their labs and complete (U-Th)/He dating on apatite and zircon. xi CHAPTER 1 INTRODUCTION 1.1 Overview 1.1.1 Metamorphic core complexes Metamorphic core complexes are important geological structures that can help in the understanding of crustal evoluton in the extending lithosphere (Whitney et al. 2013) by providing information about the magnitude, rate, and mechanisms of advection of heat and material from the deep to shallow levels, as well as detachment fault dynamics (Whitney et al. 2013). A metamorphic core complex is a domal or arched geologic structure composed of ductilely deformed rocks that have been exhumed along a low-angle ductile-to-brittle high-strain zone that has experienced tens of kilometres of normal-sense displacement (e.g. Fayon et al. 2000; Whitney et al. 2014). Metamorphic core complexes are found in both the continental and oceanic lithosphere, and are referred to as continental core complexes and oceanic core complexes, respectively (Fig. 1.1)(Fayon et al. 2000; Whitney et al. 2014). Most core complexes around the globe form in regions of extension in collapsed orogens and at relatively slowspreading mid-ocean-ridge systems (Fig. 1.1)(Whitney et al. 2013). The North American Cordillera comprises more than 25 individual metamorphic core complexes that form a discontinuous belt of high grade metamorphic rocks extending from Canada to Mexico (Fig. 1.1)(Coney 1980; Crittenden et al. 1980). The Shuswap Metamorphic Complex (SMC) (Fig. 1.1) is the largest metamorphic core complex in the North American Cordillera (Coney 1980; Armstrong 1982; Johnson 1994) and is exposed over an area greater than 40 000 km2 (Parrish et al. 1998). 1 Figure 1.1: Map of the world showing the locations of some Phanerozoic core complexes in the continents and oceans. Key to abbreviations: AA—Alpi Apuane (Italy); AB—Atlantis Bank (SW Indian Ridge); AD—Ama Drime (Nepal); AMOR—Arctic segment of Mid-Atlantic Ridge; At—Atlantis Massif (MidAtlantic Ridge); Ba—Baja (Mexico); BB—Bay of Biscay; Ch—Chapedony (Iran); Da—Dayman (Papua New Guinea); DI—Doi Inthanon (Thailand); DNCV—Day Nui Con Voi (Vietnam); Ed—Edough (Algeria); GK—Grand Kabilye (Algeria); GM—Gurla Mandhata (Pamirs); Go—Godzilla; Ha—Harkin (China/Mongolia); Hh—Hohhot (China); Ho—Hongzhen (China); Ka—Kane (Mid-Atlantic Ridge); KS— Kongur Shan (Pamirs); La—Laojunshan (China); Lf—Lofoten (Norway); Li—Liaodong Peninsula (China); Ma—Malino (Indonesia); Lo—Louzidian (China); LR—Lora del Rio (Spain); M-Ca—MidCayman spreading center; MC-Pyr—Massif Central (France–Pyrenees, France, Spain; includes MontagneNoire); Nb—Normanby Island (Papua New Guinea); Ni—Niğde (Turkey); No—Norway rifted continental margin; Nx—Naxos (Greece); Pa—Paparoa (New Zealand); PL—Payer Land (Greenland); Po—Pohorje Mountains (Slovenia); Re—Rechnitz (Austria); Rh—Rhodope (Greece, Bulgaria); SB—southern Brittany (France); SC—Song Chay (China); Sh—Shaerdelan (China); SE—Sierra de las Estancias (Spain); To— Tormes (Spain); Ve—Veporic (Slovenia); Xi—Xiaoqinling (China); YOH—Yagan-Onch-Hayrhan (China/Mongolia) (modified from Whitney et al. 2013). Lithospheric extension is defined as the direct driving force for core complex development although they commonly form in orogenic settings where plate convergence was the initial driving force (e.g., Burchfiel et al. 1992; Baldwin et al. 1993; Hetzel et al. 1995; John and Howard 1995; Fayon et al. 2000; Whitney et al. 2013). Extension triggers faulting and displacement of the shallow, cool and brittle upper crust and the exhumation of ductile material from the hot, ductile, deeper levels of the lithosphere to the footwall of the detachment fault (Whitney et al. 2013). 2 1.1.2 Geological setting of the study area For the purpose of this study, the SMC is defined to encompass both the Shuswap Complex and the underlying Monashee Complex (Fig. 1.2), in which North American basement gneisses are exposed (Brown 1981; Brown and Read 1983; Armstrong et al. 1991; Crowley 1997). It is located in the southern Omineca belt of the Canadian Cordillera, and at the latitude of this study (~51°N), it is bounded to the west by the Eocene WNW-dipping Okanagan Valley extensional shear zone (OVsz) (Fig. 1.2)(Tempelman-Kluit and Parkinson 1986; Johnson and Brown 1996; Bardoux and Mareschal 1994; Brown et al. 2012) and to the east by the Columbia River fault, a brittle-to-ductile Eocene east-dipping extensional fault zone (Lane 1984). Between these two structures, high-grade gneisses and schists of the Shuswap Complex (Carr 1991) are separated from ortho- and paragneisses of the Monashee complex (Carr 1991) to the east by the shallowly-dipping Monashee décollement, a northeast- directed, crustal-scale compressional shear zone (Brown et al. 1992) (Fig.1.2) 3 4 Figure 1.2: Location and geology of the study area (modified after Johnson 2006). Simplified geological map of the Shuswap region with inset map showing the five morphogeological belts of the Canadian Cordillera and the location of the Shuswap metamorphic complex (in green) within the southern Omineca belt. Black dots indicate sample locations. 4 1.1.3 Low-angle normal faults The Eocene Okanagan Valley shear zone (OVsz) forms the western boundary of the SMC (Fig. 1.2). The SMC is in the footwall of the OVsz and is reported to have been tectonically exhumed from midcrustal levels during the early Eocene extension in the southern Omineca belt (e.g., Price and Carmichael 1986; Parrish et al. 1988; Johnson and Brown 1996). The OVsz is a shallow west-northwest-dipping, crustal-scale, ductile-brittle shear zone with dominantly westnorthwest directed shear sense (Tempelman-Kluit and Parkinson 1986; Bardoux and Mareschal 1994; Johnson and Brown 1996; Brown et al. 2012). As opposed to having initiated as a high angle normal fault, the original shear zone angle of the OVsz is estimated to have been shallow, similar to its present mean dip angle of 15° (Brown et al. 2012). Thus, the OVsz is categorized as a low angle dtachment fault. Low angle normal faults (LANFs) or detachment faults are commonly associated with the development of metamorphic core complexes (e.g., Crittenden et al. 1980) and passive continental margins (e.g., Froitzheim and Eberli, 1990; Manatschal, 2004; Campani et al. 2010b). LANFs are gently dipping (≤ 30°), subregional to regional-scale extensional faults found in both orogenic and post-orogenic tectonic environments (Wernicke 1981; Brun and Choukroune 1983; Davis and Lister 1988; Burchfiel et al. 1992; Axen 2004; Axen 2007; Campani et al. 2010a,b; Kellet and Grujic 2012). LANFs typically involve large-magnitude slip (several tens of kilometres), accommodating lithospheric-scale extension (Davis and Lister 1988; Axen 2004; Kellet and Grujic 2012). They commonly initiate in the lower upper-crust or mid-crustal level during extension; they can terminate directly at the surface or at shallow structural levels where they splay into a complex of closely spaced normal faults (Davis and Lister 1988). LANFs juxtapose structurally higher rocks from the brittle upper crust in the hanging wall against structurally deeper rocks exhumed from middle or lower crust in the footwall (Fig. 1.3)(Davis and Lister 1988; Campani et al. 2010a; Kellet and Grujic 2012). Hanging wall rocks from the upper plate are typically unmetamorphosed or of low metamorphic grade while lower plate rocks are typically crystalline and of higher metamorphic grade, commonly mylonitic gneisses (Davis and Lister 1988). LANFs with at least ~15-20 km of net slip commonly expose a ductile low-angle shear zone (~0.1-3km thick) in the footwall that eventually crosses the brittle-ductile field to evolve into brittle 5 overprinting (Axen 2004; Axen 2007; Campani et al. 2010b). All of these features are congruent with those that characterize the OVsz. Figure 1.3: Typical components of a low angle normal fault (LANF) that bounds a metamorphic core complex in a continental setting; the LANF (OVsz for this study) is bound by a brittle hanging wall and a ductile footwall and typically contains mylonites; fluid flow is an important contributor to processes occurring within the LANF (Modified from Whitney et al. 2013). The movement of hot, ductile material to the surface during low angle normal faulting drives vigorous fluid flow in the shear zone (Fig. 1.3). Hydrous materials such as chlorite and white mica have been identified within shear zones igniting the debate as to whether these weak minerals form after the fault is initiated due to hydrothermal activity or whether they are a prerequisite for slip along the shear zone (e.g., Whitney et al. 2013). There has been much debate regarding the evolution of LANFs in the natural environment. The main question has been whether they can initiate as a LANF or whether they rotated to a shallower angle post-slip (Wernicke 1995; Axen 2004). This doubt was cast largely because conventional fault mechanics predict that normal faults cannot form at slip angles shallower that 30° (Anderson 1942; Wernicke 1995, 2009; Axen 2004; Axen 2007; Collettini 2011). However, abundant evidence from geologic reconstructions, thermochronology, paleomagnetism, and seismic reflection profiling confirm that LANFs can initiate and slip at low dips (3-30°) at 0-10 km depths and they do exist in the geological record (Wernicke 1995; Axen 2004). 6 1.1.4 Regional geology The Canadian Cordillera developed along the western edge of the ancestral North American craton starting in the Mesozoic. Cordilleran tectonic evolution was marked by two key tectonic events/stages, which are crustal thickening followed by crustal extension. Crustal thickening began in the Early Jurassic (Monger 1977; Monger and Irving 1979; Okulitch 1984; Monger and Price 2002) and resulted in approximately 200-350 km of NE-SW horizontal shortening (Brown et al. 1993; Johnson and Brown 1996) by the Cenozoic. The southern Omineca belt has been estimated to have reached a total crustal thickness of approximately 50-60 km (Price and Mountjoy 1970; Brown et al. 1986; Bardoux and Mareschal 1994; Brown and Gibson 2006; Gibson et al. 2008) during compression. Major crustal thickening events ended by Late Paleocene (58 Ma) (Brown et al. 1986; Brown and Carr 1990; Carr 1991, 1992; Bardoux and Mareschal 1994), followed immediately by post-orogenic extensional collapse. Previous geochronological and structural work in the study area have shown that regional extension begun as early as ~59-58 Ma (Parrish 1995) coeval with the waning phases of compression and activity of the Monashee décollement within ~58-50 Ma (Carr 1991; Crowley et al. 2001). Crustal extension was accommodated by normal faulting within the brittle upper crust and ductile thinning of the mid- to lower crust (Vanderhaeghe et al. 1997), which led to extensional exhumation of high grade metamorphic rocks, and development of metamorphic core complexes along the length of the Cordillera (Coney 1980; Coney and Harms 1984; Crittenden et al. 1980; Armstrong 1982; Parrish et al. 1988; Vanderhaeghe et al. 2003; Haeussler et al. 2003). Published geochronologic data suggest that the early stages of Eocene extensional exhumation was associated with rapid cooling from metamorphic temperatures in excess of 500 °C (Johnson 1994; Brown et al. 2012), with average cooling rates ranging from 15 °C/Ma to more than 30°C/Ma in some areas (Johnson 1994). Rapid cooling associated with early stages of extensional exhumation during the early Eocene has been shown to largely coincide in time with high-grade metamorphism, anatectic melting and migmatization of the footwall gneisses of the OVsz (e.g., Bardoux 1993; Vanderhaeghe et al. 2003; Brown et al. 2012). Low temperature thermochronology studies by Lorencak et al. (2001) and Toraman et al. (2014) suggest that rapid cooling contnued until around ~40 Ma. 7 1.1.5 Regional extension models Crustal extension, synchronous with or following orogenesis, is common in many modern and ancient orogens (e.g., Dewey 1988; Thomson and Ring 2006). Key geodynamic models for active orogens that exhibit synorogenic extension (e.g., Carmignani and Kligfield 1990; Lister et al. 1984; Fassoulas et al. 1994; Burchfiel and Royden 1985) include, (1) back-arc extension related to slab pull or mantle corner flow (e.g., Mantovani et al. 2001), (2) buoyant escape following crust-lithosphere detachment (Chemenda et al. 1995; Thomson et al. 1999), or (3) extensional thinning of an over-thickened critical orogenic wedge (e.g., Platt 1986). Many researchers propose that the SMC was exhumed during the early Cenozoic extensional late-orogenic collapse of the southern Canadian Cordillera (Monger at al. 1972; Ewing 1980; Parrish et al. 1988; Johnson and Brown, 1996; Monger and Price 2002), which was accommodated by brittle extension of the upper crust and ductile thinning of the lower crust (e.g., Vanderhaeghe and Teyssier 2001). Most geodynamic models for late and postorogenic extension of modern and ancient orogens (e.g., Sonder and Jones, 1999; Platt and Vissers, 1989; Malavieille, 1993; Fossen, 1999) involve (1) extensional collapse driven by gravity and/or thermal instability (e.g., Liu 2001; Rey et al. 2001), and/or (2) removal of a lithospheric root, by delamination, convection, or slab break off (e.g., England and Houseman 1989; Platt et al. 2003). Orogenic collapse may occur at either fixed or free boundary conditions in the lithosphere (Rey et al. 2001). Collapse associated with fixed boundary conditions occurs when the lithosphere is in a fixed position and cannot move laterally, leading to the spread of thick, weak crust and the overall lateral growth of the orogen (Rey et al. 2001). Under free boundary conditions, orogenic collapse occurs when the surrounding lithosphere is free to move, displacing surrounding regions without thickening them, such as in the case of slab rollback and/or retreat at convergent margins, changes in plate motion, and the opening of a backarc basin (Rey et al. 2001; Whitney et al. 2013). Free boundary collapse results in upper crustal extension, lower crustal flow and a net extension of the crust (Fig. 1.4). In continental-ocean plate margin settings, the state of stress in the upper plate can rapidly change from contraction to extension because of an interplay between driving forces, such as trench normal velocity and gravitational forces, and resisting forces, such as friction along the subduction surface and traction at the base of the eroding plate (Whitney et al. 2013). 8 Figure 1.4: Illustration of divergent gravitational collapse affecting a thick continental crust (modified from Rey et al. 2001). The Canadian Cordillera transitioned from orogeny and crustal thickening related to transpressional plate convergence in Early Jurassic to Paleocene time to transtensional orogenic collapse in the Eocene (Ewing, 1980; Price and Carmichael, 1986; Parrish et al., 1988; Bardoux and Mareschal, 1994; Gibson et al., 2008). The loss of compressive forces at the margins of the Cordillera due to plate reorganization has been described as a fundamental contributing factor to extensional collapse (Armstrong 1982; Coney and Harms 1984; Parrish et al. 1988, Molnar et al. 1993). Without the compressive forces, the weak and over-thickened continental lithosphere became “heavy” and unstable and eventually collapsed through extension (Parrish et al. 1988). The onset of late orogenic collapse of the Canadian Cordillera has also been attributed to the thermal maturation of the overthickened crust during convergence, leading to partial melting of the fertile middle crust, the creation of layer(s) of magma, and a large decrease in crustal viscosity (Parrish et al., 1988; Carr, 1992; Bardoux and Mareschal, 1994; Vanderhaeghe and Teyssier, 2001a). As a result, the thickened crust was mechanically weak and collapsed rapidly under its own weight at about 55 Ma when it could no longer support the weight of the mountain belt. The brittle upper crust became dominated by normal faults including the development of low angle normal faults. The lower part of the crust was affected by large-scale boudinage and the formation of domes from the ascent of low-viscosity magmatic layers (Vanderhaeghe and Teyssier, 2001a). Building on previous work of Ewing (1980), Price and Carmichael (1986) and Parrish et al. (1988), Vanderhaeghe and Teyssier (2001b) also proposed 9 that a free slab boundary condition could have been created along the western margin of the Canadian Cordillera from the subduction and obduction of Pacific-related terranes and/or their further removal by strike-slip displacement. These conditions would have favoured the transition from crustal thickening to gravitational collapse resulting in rapid exhumation by crustal flow of the low viscosity layers in the lower crust coeval with brittle upper crustal extension to create metamorphic core complexes. Thermal stability of the geotherm is strongly linked to the evolution of the metamorphic core complexes because it controls lower crust viscosity (Whitney et al. 2013). A cold to normal geothermal gradient results in a lower crust that is mechanically coupled to the upper crust and upper mantle (Whitney et al. 2013). In a warm crust (Fig. 1.5A), there is strong coupling between the deep and upper crust resulting in multiple upper crustal faults and flow in the deep crust. In a hot crust (Fig. 1.5B), a single large arching detachment exhumes low viscosity material from the deep crust, forming a core complex in the footwall. In the hottest crust (Fig. 1.5C), upper crustal extension results in the exhumation of partial molten and deformed material from the deep crust; the lower crust viscosity is significantly reduced due to partial melting (Whitney et al. 2013). 10 Figure 1.5: Modes of development of continental core complexes in warm, hot, and hottest crust. (A) Warm crust exhumes continental core complexes in footwall of normal faults that are distributed in upper crust; for example, exhumation by domino-style rotation of upper-crust blocks. (B) Hot crust focuses faulting in upper crust, leading to large-offset fault and exhumation of lower crust by development of rolling-hinge detachment (after Brun and van den Driessche 1994). (C1) Hottest crust has significant partial melt; the low-viscosity lower crust flows in channels attracted by focused zone of upper-crust extension; channels collide and move upward to fill the gap created by upper-crust extension; deep crustal rocks record significant decompression and deformation from contraction to extension as they are exhumed (after Rey et al. 2011). (C2) At the edge of an orogenic plateau, partially molten crust flows owing to lateral gradients in gravitational potential energy; note expected reversal of sense of shear (kinematic hinge) between “channel” and “rolling-hinge” detachments (after Teyssier et al. 2005)(from Whitney et al. 2013). The channel flow model of mid-crustal deformation has also been proposed to explain the exhumation of the SMC (e.g., Brown and Gibson 2006). In the Late Cretaceous to Paleocene (Fig. 1.6a), the southern Canadian Cordilleran hinterland was an elevated plateau region with a crustal thickness > 55 km and high heat flow (Bardoux and Mareschal, 1994; Whitney et al. 2004; Brown and Gibson, 2006; Gibson et al. 2008). Beneath the plateau, a hot and low strength middle crust developed from the Early Jurassic - Cretaceous crustal thickening of the region 11 (Johnson and Brown 1996) until its exhumation in the Late Cretaceous to Paleogene (Fig. 1.6b). Ductile flow was active in this channel defined by the Monashee decollement (and Purcell Thrust) at the lower boundary and the OVsz (including the Selkirk Detachment Fault) at the upper boundary (Brown and Gibson 2006; Fig.1.6c). Flow in the channel initially resulted in the upper crust being passively carried northeast above the ductile thrust sheet until the upper crust began to lag behind, forming the incipient OVsz. According to the channel flow model of Brown and Gibson (2006), doming of the midcrustal channel was initiated in the Late Cretaceous to Paleocene (Brown and Journeay 1987; Scammell 1993; Johnson and Brown 1996) probably as a result of thinning of the overlying channel. In the final stages of mid-crustal flow, the Precambrian basement gneisses at the base of the channel became domed and exhumed to upper crustal levels (1.6c). After mid-crustal flow ended, the boundaries of the channel were reactivated in the upper crust in response to the rapid exhumation of the domes, forming Eocene ductile-brittle extensional faults such as the OVsz (Parrish et al. 1988; Parrish 1995). 12 Figure 1.6. Generalized cross-sections demonstrating (a) Late Jurassic configuration of the evolving orogen above an easterly dipping subduction zone. The pro-wedge illustrates obducted and accreted terrane at the highest structural level with underlying rocks of North American affinity. The dark grey layer schematically illustrates development of the mid-crustal channel above attenuated basement rocks of the North American plate; (b) Late Cretaceous–Palaeocene configuration of middle crustal channel prior to extensional faulting; (c) Present-day geometry across Frenchman Cap Dome (geometry of the Moho is constrained by Lithoprobe seismic reflection profile of Cook et al. (1992). The middle-crustal layer is interpreted to have been a zone of channel flow in the Late Cretaceous. Formation of Frenchman Cap Dome and displacement on Columbia River Fault (CRF) post-date the proposed channel flow. MC, Monashee Complex; MD, Monashee Décollement; OFS, Okanagan Fault System; PT, Purcell Thrust Fault; SDF, Selkirk Detachment Fault; SFA,Selkirk Fan Axis. See text for additional explanation and references. These diagrams are modified from Gibson 2003 (Brown and Gibson 2006). The transition from crustal thickening to orogenic collapse can also be triggered by an increase in gravitational potential energy of the overthickened crust due to the removal of the mantle root and subsequent asthenospheric upwelling (e.g., England and Houseman 1988; Molnar et al. 1993). Another competing model for the evolution of the Canadian Cordillera suggests that the Canadian Cordillera is an exhumed ancient high plateau that formed as a result of, or was acentuated by, the delamination of the entire lithospheric mantle beneath it (Ranalli et al., 1989; Bardoux and Mareschal, 1994; Bao et al 2014). Delamination of the lithospheric mantle is reported to have occurred at ~55 Ma as a result of asthenospheric mantle upwelling (Fig. 1.7a) that caused rapid uplift, voluminous magmatism, a transition from compressional to extensional tectonics, and removal of the mafic lower crust (Fig. 1.7b and c). The model is supported by evidence for rapid uplift and extension of the Cordillera, west of the Rocky Mountain trench during the Eocene (~56-34 Ma) at ~10-20°C/Ma from ~500-100 °C; further Eocene cooling was dominated by erosion associated with large-scale plateau uplift (Bao et al. 2014). 13 Figure 1.7: Model for evolution of the Cordilleran back-arc orogenic plateau (Bao et al. 2014); a) before 55 Ma, edgedriven convection is influenced by a proto-step in the lithospheric keel above the Juan de Fuca (JdF) subducting slab; b) mantle delamination is accompanied by a transition from lithospheric contraction to extension, incursion of asthenosphere to shallow depths, heating, uplift and erosion of a newly formed orogenic plateau; c) mature present-day back-arc, with deeply incised fossil orogenic plateau. Delaminated lithosphere was located above the JdF. 14 Discriminating between models that triggered extension in the Canadian Cordillera is a first order question that still needs to be solved. The preceeding discusion (Section 1.1.5) has highlighted several models that have been proposed to explain the initiation of late-orogenic collapse of the Canadian Cordillera, including plate re-organization , gravitational collapse of a thermally weakened crust, delamination of the lithospheric mantle, and channel flow. One fundamental difference between the models described above is that of timing. The ideal model would allow for sufficient time for large-scale displacement along a LANF, such as the OVsz, to facilitate the exhumation of the mid- and lower crustal rocks of the SMC. Gravitational collapse of a thermally weakened crust may involve normal sense displacement on the normal-sense structures bounding the metamorphic core complexes long after extension was initiated while delamination of the lithospheric mantle implies short-lived extensional deformation related to immediate surface uplift induced by isostatic rebound. A key limitation of the channel flow model is the ordering of proposed events: doming of the channel and basement gneisses postdate channel flow and is followed by Eocene faulting. Brown and Gibson (2006) suggested that this could be explained by an earlier necking of the channel that would have occurred before Eocene faulting. Consequently, constraining the timing of activity of major LANFs in the Canadian Cordillera is an important step to help discriminate and potentially revise these endmember models. 15 1.2 Thesis goals / Study objectives The goal of this study is to use low-temperature multi-thermochronology combined with inverse thermal modeling to characterize the late-stage upper-crustal cooling history of the Shuswap Metamorphic Complex (SMC) located in the southern Canadian Cordillera between Sicamous and Revelstoke, British Columbia; this will help to constrain the timing of activity of the OVsz, a key LANF bounding the western flank of the SMC. The key questions to be addressed in this thesis are: (1) Is cooling in the footwall of the OVsz primarily due to normal-sense displacement along this shear zone (tectonic exhumation)? (2) If so, when did displacement occur on this structure? (3) Did crustal cooling occur after cessation of activity on the OVsz through regional-scale erosional processes? 1.3 Tools Low temperature thermochronology will be used on a suite of 20 samples distributed across the SMC, from the hanging wall of the Columbia River Fault in the east, to the hanging wall of the OVsz in the west. The samples were collected from exposed outcrops along the Trans Canada Highway between Revelstoke and Sicamous (Fig.1.2). Samples were collected perpendicular to major faults that separate sections of the metamorphic core complex (Fig. 1.2) and along the path of tectonic exhumation associated with extension. Low temperature thermochronometers (Tc < 300 °C) provide thermal histories for the upper and middle crust, assuming an approximate thermal gradient of 25°C/km (Stockli 2005). This study will use the following low temperature thermochronometers: zircon (U-Th)/He (ZHe), with a closure temperature of 170 ± 20°C (e.g., Reiners et al. 2004; Reiners 2005), apatite fission track (AFT), with closure temperature 120 ± 20°C (e.g., Green 1985; Ketcham et al. 1999; Donelick et al. 2005), and apatite (U-Th)/He (AHe), with closure temperature 60 ± 10°C (e.g., Farley 2002; Shuster et al. 2006; Reiners et al. 2006). Ideally, rocks should be exhumed from temperatures greater than the closure temperature of the mineral phase being dated to ensure that the sample is reset and there are no pre-existing daughter products present in the system. Once the cooling age is calculated, inverse modeling is used to reconstruct thermal histories including information on timing, rate, and magnitude of cooling of rock samples. 16 1.4 Thesis structure This thesis is presented in five chapters. Chapter 1 is an introduction to the background and goals of this research project. Chapter 2 describes the tectonic setting and geological history of the southern Canadian Cordillera and introduces the geology of the Southern Omineca belt. Chapter 3 explains the theoretical aspects of the low temperature thermochronogical techniques used and reports the results obtained for each thermochronometer. Chapter 4 introduces the principles of inverse thermal modeling with the software HeFTy and describes the results obtained. In Chapter 5 the results are discussed and conclusions provided. 17 CHAPTER 2: REGIONAL GEOLOGY 2.1 Tectonic setting and geological history of the southern Canadian Cordillera 2.1.1 Introduction The Canadian Cordillera developed along the western edge of the ancestral North American craton during the Mesozoic and Cenozoic. It has evolved into a tectonically and stratigraphically composite region (Coney 1980) that is divided into five, orogen-parallel, roughly linear morphogeological belts (Monger et al. 1972; Gabrielse et al. 1991), which are, from east to west, the Foreland, Omineca, Intermontane, Coast and Insular belts (Fig. 2.1). Figure 2.1: The five morphogeological belts of the Canadian Cordillera (Courtesy of H.D. Gibson, modified from Gabrielse et al. 1991) The Foreland belt comprises Proterozoic to Jurassic sedimentary rocks representing the rift to drift sequence that evolved on the western continental margin of ancestral North America. The Foreland belt also includes synorogenic sedimentary rocks representing the erosional remnants of the emerging Omineca and Foreland belts as rocks were folded and thrusted northeastward over the craton margin in the Late Jurassic to Paleogene (Monger et al. 1972; Monger and Price 2002). 18 The Omineca belt is the uplifted region located between the ancient cratonic margin to the east and the accreted terranes to the west (Monger et al. 1982; Gabrielse and Yorath 1991). It contains strata similar to the Foreland belt in addition to rocks from Paleozoic pericratonic terranes, late Paleozoic to Early Jurassic remnants of island arc and marginal basins, early Cenozoic volcanic and sedimentary rocks, as well as Paleozoic to early Cenozoic plutonic rocks (Gabrielse and Yorath 1991; Monger and Price 2002). The Omineca belt rocks were typically metamorphosed to high grade primarily during the Middle Jurassic to early Cenozoic compressional events and associated crustal thickening (Monger et al. 1982; Brown et al., 1986; Monger and Price 2002; Gibson et al. 2008). These rocks were subsequently exhumed during the early Cenozoic extensional collapse of the southern Canadian Cordillera (Monger at al. 1972; Ewing 1980; Parrish et al. 1988; Johnson and Brown, 1996; Monger and Price 2002). The Intermontane belt contains remnants of Devonian to Early Jurassic island arcs and accretionary complexes, Middle Jurassic to early Cenozoic volcanic rocks from continental arcs, material eroded from the emerging Omineca belt, and Devonian to Cenozoic plutonic rocks (Monger and Price 2002). The Intermontane terranes were accreted to the western margin of North America by Late Permian to Jurassic (Johnson 1994; Monger et al. 1982; Monger and Price 2002; Beranek and Mortensen, 2011). In Early to Middle Jurassic, accretion led to large-scale northeast-directed thrusting and obduction of the easternmost Intermontane terranes over the continental margin (Monger et al. 1982; Brown et al. 1993; Johnson and Brown 1996; Gibson et al. 2008). Further convergence in Late Jurassic to early Tertiary led to significant crustal thickening, highgrade metamorphism and anatectic melting in the lower and middle crust of the Omineca belt, as well as thin-skinned thrusting and folding in the Foreland belt (Price and Mountjoy 1970; Price 1981; Brown et al. 1992; Gibson et al. 2008). Further deformation of rocks occurred during early Cenozoic extension-transtension episode (Monger and Price 2002). The Coast belt contains latest Proterozoic and Paleozoic to Holocene rocks from magmatic arcs, accretionary complexes, as well as Jurassic to Cenozoic volcanic and sedimentary rocks and a plethora of Mesozoic plutons that comprise the Coast Plutonic Complex. Rocks in this region are 19 metamorphosed to high grades and were deformed during the Early Cretaceous to early Cenozoic (Monger and Price 2002). The Insular belt contains latest Proterozoic to mid-Cretaceous volcanic and sedimentary rocks from island arc and ocean plateau settings, mid-Cretaceous and younger clastic rocks eroded from the Coast belt, Paleozoic to Tertiary granitic intrusions, and Late Jurassic to Holocene accretionary complexes. Structures in this belt are associated with its eastward underthrusting below the Coast belt during mid-Cretaceous through to early Cenozoic, and the subduction of the Pacific/paleo-Pacific ocean floor beneath the North American plate from Cretaceous through Holocene time (Monger and Price 2002). In addition, the Cretaceous accretion of the southern Insular terranes was accompanied by widespread compression in the southern Canadian Cordillera (Monger et al. 1982; Monger and Journeay 1994; Gibson et al. 2008). 2.1.2 Summary of compressional events Crustal thickening in the Canadian Cordillera has been attributed to the westward movement of the North American craton starting in Early Jurassic (Monger 1977; Monger and Irving 1979; Okulitch 1984; Monger and Price 2002), causing it to encroach on its convergent western boundary with the Pacific/paleo-Pacific basin at that time. Terranes in the form of pericratonic assemblages, magmatic arc systems, microcontinents, and ocean basins (Price and Mountjoy 1970; Monger et al. 1982; Colpron et al. 2007; Brown et al. 1986) were thrusted northeast onto the North American continental margin (Brown et al. 1993; Gibson et al. 2008) as the craton gradually overrode the trench along its western margin and collided with the subducting Pacific/paleo-Pacific oceanic plate (Atwater 1970; Engebretson et al. 1984; Stock and Molnar 1988; Sonder and Jones 1999). Early Jurassic compression resulted in the collision of the Intermontane terrane with the paleocontinental margin of western North America and deformation in the southern Omineca belt (Monger et al. 1982; Brown et al. 1986, 1992; Bardoux and Mareschal 1994). By Cretaceous and Paleocene, a second pulse of compression occurred when the southern Insular terrane of Wrangellia collided with the western edge of the previously accreted Intermontane terranes causing further crustal thickening in the Coast belt and in the southern Omineca belt (Brown et 20 al. 1986; Journeay, 1986; Bardoux and Mareschal 1994; Gibson et al. 2008). Compression in the southern Canadian Cordillera was accompanied at different times by sinistral and dextral transpression (Monger and Price 2002). Eventually the accreted terranes overrode the subduction zone, and were folded and thrusted over it. This led to the separation of upper crustal arc rocks from their lower crustal and mantle roots as the accreting terranes were delaminated from their underlying lithosphere when they collided with and obducted onto the western paleomargin of North America (Monger and Price 2002). By early Cenozoic, approximately 200-350 km of NE-SW horizontal shortening had occurred (Brown et al. 1993; Johnson and Brown 1996). Major crustal thickening events ended by Late Paleocene to Early Eocene (Brown et al. 1986; Brown and Carr 1990; Carr 1991, 1992; Bardoux and Mareschal 1994; Crowley et al. 2001) followed immediately by extensional collapse. The southern Omineca belt has been estimated to have reached a total crustal thickness of approximately 50-60 km (Price and Mountjoy 1970; Brown et al. 1986; Bardoux and Mareschal 1994; Brown and Gibson 2006; Gibson et al. 2008) during compression compared to its current crustal thickness of 32 km (Cook et al. 1992; Brown et al. 1992; Bardoux and Mareschal 1994). This reduction in thickness has been attributed to (~40-80%) extension and the rest to erosion of the pre-extensional crust (Bardoux and Mareschal 1994). 2.1.3 Southern Cordilleran extension The Canadian Cordillera began a period of dextral transtension that coincided with late-orogenic extensional collapse during the Late Paleocene to Eocene (Ewing 1980; Okulitch 1984; Price and Carmichael 1986; Molnar et al. 1993). The loss of compressive forces at the margins of the Cordillera was a fundamental contributing factor to extensional collapse (Armstrong 1982; Coney and Harms 1984; Parrish et al. 1988, Molnar et al. 1993). Without the compressive forces, the weak and over-thickened continental lithosphere became “heavy” and unstable and eventually collapsed through extension (Parrish et al. 1988). Slab window development (Fig. 2.2) is suggested to have initiated a transform margin on the western margin of ancestral North America around 50 Ma leading to orogenic collapse of the region (Haeussler et al. 2003). Before that time, during Middle Jurassic to mid-Cretaceous, the 21 Farallon plate had been subducting under the western margin of the North American craton (Engebretson et al. 1985). By the Late Cretaceous, the Pacific and Farallon plates rifted to form the Kula plate (Woods and Davies 1982; Thorkelson and Taylor 1989), which resulted in the development of a ridge-trench margin and the subsequent gradual subduction of the KulaFarallon mid-ocean ridge under the North American craton (Madsen et al. 2006). Mid-ocean ridge subduction has been associated with the creation and opening of slab windows and the accompanied upwelling of anhydrous asthenosphere (Thorkelson et al. 2011). The development of slab windows is also associated with a change from arc magmatism to intraplate volcanism, thinning of the overriding lithosphere, high heat flow, rapid uplift, and voluminous primitive mafic magmatism (Thorkelson and Taylor 1989; Smith and Thorkelson 2002; Haeussler et al. 2003; Dostal et al. 2003; Thorkelson et al. 2011). Along the western margin of North America, geological records suggest a coeval development of middle Eocene near-trench magmatism characteristic of slab window magmatism in two separate locations: Southern Alaska, and approximately 4000 km to the south at the Cascadia margin (Fig. 2.2) (Haeussler et al. 2003). Some authors suggest that the Kula-Farallon ridge would have intersected the subduction zone either at the Cascadia margin of the Washington and Oregon coastal ranges (Fig. 2.2A) (e.g. Simpson and Cox 1977; Duncan 1982; Wells et al. 1984; Engebretson et al. 1985; Davis and Plafker 1986; Thorkelson and Taylor 1989; Babcocket al. 1992) or the southern Alaska margin (Fig. 2.2B) (Marshak and Karig 1977; Helwig and Emmett 1981; Sisson et al. 1989; Bol et al. 1992; Bradley et al. 1993; Sisson and Pavlis 1993; Haeussler et al. 1995; Pavlis and Sisson 1995). For either argument (Fig. 2.2A or B), sufficient slab windowtype magmatism would have been needed to produce magmatic effects in both regions (Haeussler et al. 2003). 22 Figure 2.2: Plate geometries proposed for latest Cretaceous to early Tertiary near-trench magmatic record of western North America at 56 Ma. Grey spreading ridges indicate that the orientation and geometry are speculative. (A) Location of the Kula-Farallon TRT triple junction along the Cascadia margin would explain near-trench magmatism in this location, but not in southern Alaska. (B) Location of the KulaFarallon TRT triple junction near southern Alaska would explain near-trench magmatism in this location, but not along the Cascadia margin. (C) Two coeval TRT triple junctions, one in southern Alaska and another along the Cascadia margin (and the presence of the Resurrection plate) can explain near-trench magmatism in both locations (Hauessler et al. 2005). Haeussler et al. (2003) introduced the subducting Resurrection plate hypothesis to help reconstruct the early Cenozoic history of the Pacific basin. Before 50 Ma, the Resurrection plate, located off the coast of present-day British Columbia, was bordered to the north and west by the Kula plate and to the south and east by the Farallon plate (Fig. 2.2C). The young buoyant oceanic crust of the Resurrection plate was subducting under the western margin of North America and producing rapid uplift and voluminous arc magmatism (Haeussler et al. 2003). By 50 Ma, the last of the Resurrection plate was subducted and a slab window was created; this was coeval with cessation of widespread arc magmatism (Haeussler et al. 2003). By 47 Ma, primitive mafic magmatism was dominant in the Coast Mountains and Cascade Range (Ickert et al. 2009; Haeussler et al. 2003) The subduction of the Kula-Resurrection spreading centre resulted in the emplacement of zeroage oceanic crust (of the Kula plate) paralleling approximately 2000 km of the continental margin (Haeussler et al. 2003). The very young and buoyant crust resisted subduction (Cloos 1993) and induced a transform motion along the margin (Haeussler et al 2003), initiating the Queen Charlotte-Fairweather transform fault system from southeast Alaska to Washington. In addition, the subduction of the spreading ridge between the Farallon and Resurrection plates 23 (Haeussler et al. 2000; Haeussler et al. 2003) contributed to oblique convergence and elevated heat flow and magmatism in the southern Omineca belt (Breitsprecher et al. 2003; Madson et al. 2006). This motion was perpetuated when the remaining plates fused to the Pacific plate and moved as part of the Pacific plate (Engebretson er al. 1985; Lonsdale 1988) in a general northward direction. As they moved northward, they maintained the transform activity along the southeast Alaska to Washington margin, subducting further north instead beneath the Aleutian trench. In addition, the Pacific plate is thought to have migrated northwesterly in the mid-Eocene, away from the western margin of North America (Engebretson et al. 1985; Parrish et al. 1988). The transition from an initial highly oblique subduction into transform-style movement along the Queen Charlotte fault led to initiation of extension in the Queen Charlotte basin, which was coeval with pluton emplacement, formation of dyke swarms and volcanic activity, and slab window formation (Madsen et al. 2006, Hyndman and Hamilton 1993). Crustal extension was accommodated by normal faulting of the brittle upper crust and ductile thinning of the mid- to lower crust (Vanderhaegue et al. 1997), which led to extensional exhumation of high grade metamorphic rocks, and development of metamorphic core complexes along the length of the Cordillera (Coney 1980; Coney and Harms 1984; Crittenden et al. 1980; Armstrong 1982; Parrish et al. 1988; Vanderhaeghe 2003; Haeussler et al. 2003). Major Eocene normal faults that accommodated extension in the southern Canadian Cordillera include the Okanagan Valley shear zone and the Columbia River fault. In the region of the Omineca belt, extension was accompanied by partial melting (Carr 1992; Vanderhaegue et al. 1997). The result is the exhumation of the Shuswap Metamorphic Complex and the Monashee complex, exposing metamorphic rocks from depths of more than 25 km (Tempelman-Kluit and Parkinson 1986; Parrish et al. 1988; Johnson and Brown 1996). The foregoing discussion shows that extensional collapse may have been aided by high heat flow and uplift above slab windows, an idea that is still debated today. The eventual shift to transform faulting provided the reduction in compressive forces needed to initiate extensional collapse of the southern Canadian Cordillera. 24 2.2 Geology of the Southern Omineca belt 2.2.1 Introduction The southern Omineca belt (Fig. 2.3A) is the exhumed metamorphic and plutonic hinterland of the southern Canadian foreland fold and thrust belt (Monger et al. 1982). It is an uplifted region that extends across the boundary between the ancient North American craton margin and the accreted terranes (Gabrielse and Yorath 1991). It is a wide zone of high-grade metamorphic rocks with plutonic, volcanic, and sedimentary parentage, and is dissected by numerous Eocene crustal-scale normal faults (Parrish 1995). 25 Figure 2.3: Location and geology of the study area (modified after Johnson 2006). A) Simplified geological map of the Shuswap region with inset map showing the five morphogeological belts of the Canadian Cordillera and the location of the Shuswap Metamorphic Complex (in green) within the southern Omineca belt; B) Cross-sectional view. MD, Monashee decollement; CRF, Columbia River fault. Black dots indicate sample locations. Black stippling pattern represents the aproximate width of the shear zone for the OVsz and MD. 26 The eastern region of the southern Omineca belt contains stacked and folded thrust sheets of variably metamorphosed rocks correlated with Proterozoic to Paleozoic continental margin strata of ancestral North America (Johnson and Brown 1996; Johnston et al. 2000). The highest structural levels can be found on the east side, and include thrust sheets and fold nappes of accreted terranes; this region contains predominantly Paleozoic rocks of the pericratonic Kootenay terrane (Monger and Berg 1984; Wheeler et al. 1991; Johnston et al. 2000). The western region contains basement-cored culminations of high-grade metamorphic rocks. 2.2.2 The Study Region This study area transects the central Shuswap Metamorphic Complex (SMC) (Fig. 2.3), which includes some of the most deeply exhumed rocks of the southern Canadian Cordillera, and the underlying Monashee complex, where North American basement gneisses are exposed (Brown 1981; Brown and Read 1983; Armstrong et al. 1991; Crowley 1997). The SMC is bound to the west by the Eocene WNW-dipping Okanagan Valley fault system (Tempelman-Kluit and Parkinson 1986; Johnson and Brown 1996; Bardoux and Mareschal; Johnson 2006; Brown et al. 2012). The east dipping Columbia River fault, a brittle-to-ductile Eocene extensional fault zone (Lane 1984), marks the eastern limit of the Monashee complex. Between these two faults, the high-grade gneisses and schists of the SMC that belong to the “Middle Crustal Zone” of Carr (1991) are separated from the ortho- and paragneisses of the Monashee complex (Carr 1991) to the east by the shallow-dipping Monashee décollement, a northeast- directed, crustal-scale compressional shear zone (Brown et al. 1986; Brown et al. 1992). Sample locations are marked by black dots on Figure 2.3. The study region can be divided into seven zones. From east to west, these regions are described below, and include: - Zone 1: Hanging wall of the Columbia River fault, region east of the Columbia River fault - Zone 2: Columbia River fault - Zone 3: Monashee complex, located between the Columbia River fault and Monashee décollement - Zone 4: Monashee décollement 27 - Zone 5: Shuswap Metamorphic complex (SMC), located between the Monashee décollement and Okanagan Valley shear zone - Zone 6: Okanagan Valley shear zone (OVsz) - Zone 7: Hanging wall of the OVsz, region west of the OVsz 2.2.2.1 Zone 1: The hanging wall east of the Columbia River fault In the study area, the hanging wall of the Columbia River fault consists of the eastern flank of the Selkirk allochthon (Read and Brown 1981) including a segment of the Selkirk fan (Fig. 2.4; Brown and Tippett 1978; Price 1986; Colpron et al. 1998; Gibson et al. 2008), a regional-scale, composite Middle Jurassic to Late Cretaceous–early Cenozoic tectonic structure (Gibson et al. 2008). The Selkirk fan contains greenschist to upper amphibolite facies rocks that trend SE–NW for over 120 km with at least three generations of superposed deformation (Gibson et al. 2008). The Selkirk fan is predominantly underlain by clastic metasediments of Proterozoic to Jurassic age (Brown et al. 1978; Read and Wheeler 1976; Lane 1984) originally deposited along the rifted western margin of the ancient North American craton (Gabrielse and Campbell 1991; Gibson et al. 2008) 28 Figure 2.4: Generalized regional cross-section of the Selkirk fan within the eastern flank of the Selkirk allochthon and hanging wall of the Columbia River fault (CRF). MD, Monashee décollement; MSL, mean sea level; PT, Purcell thrust. The lowest structural layer represents the Paleoproterozoic to Paleozoic(?) Monashee complex cover sequence; above that in grey is the Windmere Supergroup which contains a Middle Marble Unit; the dotted unit is the Neoproterozoic - Lower Cambrian Hamill and Gog Groups, with the Lower Cambrian Badshot Formation lying conformably on top of them; the horizontal dashed lines represent the Neoproterozoic - Paleozoic Eagle Bay Assemblage and Lardeau Groups (Gibson et al. 2008, modified after Brown et al. 1993). Two models describe the formation of the Selkirk fan (Fig. 2.5): formation above a subduction zone (Fig.2.5A) or tectonic wedging (Figure 2.5B). In both cases, the Selkirk allochthon was shortened and displaced approximately 300 km northeastward (Brown et al. 1993; Parrish 1995; Gibson et al. 2008) during Middle Jurassic to Paleocene orogenesis (Gibson et al. 2008). During this period, internal deformation and metamorphism (Parrish 1995) of the allochthon resulted in metamorphic grades varying from greenschist to upper amphibolite (Lane 1984; Gibson et al. 2008). During the early Cenozoic extensional period and associated exhumation, all levels of the allochthon were exposed (e.g., Read and Brown 1981; Parrish et al. 1988; Tempelman-Kluit and Parkinson 1986; Johnson and Brown 1996), as well as the underlying cratonic basement within the Monashee complex (Armstrong et al. 1991; Parkinson1991; Crowley 1999). 29 Figure 2.5: Two principal tectonic models for the formation of the Selkirk fan. (a) Fan formation was concentrated above a singularity (S) representing the point of detachment and subduction of oceanic or marginal basin lithosphere beneath continental lithosphere. (b) An orogenic wedge was produced due to thrust stacking of distal North American strata which became inserted between more proximal strata and the underthrusting North American cratonic basement resulting in faulting and folding back over the wedge tip (See Gibson el al. 2008 for a more complete description). Of note, the hanging wall of the Columbia River fault contains exposures of the early Paleozoic Lardeau Group (Schiarizza and Preto 1987; Johnson 1990; Johnson 2006) (Fig. 2.3). Prior to extension the Lardeau Group is thought to have been contiguous with the Eagle Bay Assemblage, which is now located in the hanging wall of the Okanagan Valley fault system (Johnson and Brown 1996). Both assemblages have a similar stratigraphy and host distinctive Devono-Mississippian orthogneiss. The correlation of these stratigraphic packages aided Johnson and Brown (1996) in the palinspastic restoration and estimate of extension accommodated by the Columbia River fault and the Okanagan Valley fault system, which resulted in the exhumation of the SMC at the latitude of this study. Three samples were collected from the hanging wall of the Columbia River fault near Revelstoke, BC where it is underlain by migmatitic paragneiss, amphibolite, calcsilicate gneiss, marble, quartz dioritic gneiss, and pegmatite (Norlander et al., 2002): RS1202, RS1201, and RS1203 (Table 2.1). 30 Table 2.1: Samples collected from the hanging wall of the Columbia River fault (Coutand 2012; Brown 2013) Sample number Sample composition RS1201 Pegmatite RS1202 dioritic gneiss RS1203 garnet-sillimanite quartzofeldspathic paragneiss 2.2.2.2 Region 2: Columbia River fault The Columbia River fault is approximately 200 km in length and forms the northeastern boundary of the SMC where it extends north and south of the Monashee complex (Fig. 2.3) (Lane 1984; Johnson 1994; Parrish 1995; Johnson and Brown 1996). Along much of its length, the Columbia River fault coincides with the Monashee décollement (Lane 1984; Parrish 1995), particularly along the northeastern margin of the Monashee complex (Read and Brown 1981; Johnson and Brown 1996). In the study region, the Columbia River fault forms the eastern boundary of the Monashee complex, which is located to the east of the SMC (Fig. 2.3). The Columbia River fault is a roughly north-striking, east-dipping, Eocene brittle-ductile extensional shear zone that is 100s of metres thick, with a shallow eastward dip of approximately 20-30° at the surface (Lane 1984; Read and Brown 1981; Johnson and Brown 1996). In addition, the fault is inferred to have been steeper above the present erosion surface, becoming listric into the middle or lower crust (Cook 1986; Johnson and Brown 1996). The Eocene brittle fracturing and displacement are broadly parallel with, but cut and disrupt the latest Cretaceous to Paleocene ductile mylonite zone (Lane, 1984) of the Monashee décollement. The mylonitic foliation is east-dipping with asymmetrical shear fabrics that indicate east-directed shear sense (Brown and Murphy 1982; Lane 1984; Lane et al. 1989; Parkinson 1992; Johnson and Brown 1996). The discrete brittle shears contain slickenfiber lineations that suggest east-side-down normal sense slip and minor dextral-slip reactivation (Lane 1984). Because the Columbia River fault and Monashee décollement coincide at the surface, the amount of ductile strain attributed to the (later) Columbia River fault or (earlier) 31 Monashee décollement is hard to discern: older annealed mylonites have been attributed to the earlier thrusting of the décollement (Lane et al,. 1989) while younger non-annealed fabrics are attributed to normal-sense displacement of the Columbia River fault (Parrish et al. 1988, Carr 1992; Johnson 1994). 2.2.2.3 Region 3: Monashee complex The Monashee complex (Fig.2.3) is a tectonic window of North American basement and cover rocks within the southern Omineca belt of the Canadian Cordillera (Wanless and Reesor 1975; McMillan, 1970; Read and Brown 1981). It contains mostly Precambrian igneous and metasedimentary rocks that are the deepest exposed structural level of the southern Omineca belt (Read and Brown 1981; Armstrong et al. 1991; Carr 1991; Parrish 1995; Crowley 1997). While Late Cretaceous to early Cenozoic crustal thickening resulted in the transport of the Selkirk allochthon eastwards along the northeast-directed Monashee décollement (Read and Brown 1981; Brown and Read 1983; Brown et al. 1992), the Monashee complex was being underthrust westward beneath the hot Selkirk allochthon, undergoing rapid tectonic burial and tectonic loading (Parrish 1995). Significant but short-lived metamorphism and deformation occurred in the Monashee complex in Paleogene time (Parrish 1995; Gibson et al. 1999; Crowley et al. 2001), followed by Early Eocene ductile and brittle extensional deformation (Parrish et al. 1988; Parrish 1995; Johnson and Brown 1996; Johnston et al. 2000) leading to extensional denudation of the Monashee complex. The current structure of the Monashee complex comprises two antiformal culminations, the northern Frenchman Cap dome and the southern Thor-Odin dome, separated by a synformal depression (Fig. 2.3) (Brown and Read, 1983; Johnston et al. 2000). The core of these culminations contain Paleoproterozoic North American crystalline basement (Armstrong et al. 1991 and references therein; Parkinson, 1991; Parrish 1995; Crowley 1997; Johnston et al. 2000), which is composed of orthogneiss and layered quartzofeldspathic paragneiss. The overlying layer, referred to as the cover sequence, contains unconformable Paleoproterozoic to Paleozoic metasedimentary rocks consisting of quartzite- and marble-bearing continental margin sequences (McMillan, 1973; Brown, 1980; Read, 1980; Scammell and Brown, 1990; Parrish, 1995; Johnston et al 2000). No Paleozoic to Cenozoic granitic plutons are found in the 32 Monashee complex, although they are found in the rest of the Omineca belt)(Parish et al. 1988; Johnston et al 2000). Two samples were collected from the Monashee complex: RS1204 and RS1205 (Table 2.2). Table 2.2: Samples collected from the Monashee Complex (Coutand 2012; Brown 2013). Sample number Sample composition RS1204 Sillimanite gneiss with pegmatite RS1205 Feldspar-biotite quartzite; sillimanite-biotite granite gneiss 2.2.2.4 Region 4: Monashee décollement The Monashee décollement is a shallow dipping, northeast-directed, crustal-scale ductile compressional shear zone (Brown et al. 1992; Johnston et al. 2000) that forms an approximately 1-2 km thick zone of intense ductile deformation (Read and Brown 1981; Brown and Read 1983; Journeay and Brown 1986; Brown et al. 1992; Johnson 1994) separating the Monashee complex from the SMC (Fig. 2.3). On the NW margin of the Monashee complex, the Monashee décollement is an approximately 1-2 km thick zone of intense ductile strain (Journeay and Brown 1986; Brown et al. 1992; Cook et al. 1992; Johnston et al. 2000), while at the SW margin of Monashee Complex, the Monashee décollement is an approximately 2 km thick sheared zone with isoclinal folds and imbricate thrust slices (McNicoll and Brown 1995; Johnston et al. 2000). In the study area, the western margin of the Monashee complex contains annealed mylonites with top-to-the-east shear sense (Journeay and Brown 1986; Lane et al. 1989; Johnston et al. 2000). The Monashee décollement is rooted to the west in the middle (and lower) crust beneath the Intermontane terranes (Brown et al. 1992). It extends eastward to the Rocky Mountain trench beneath the Selkirk allochthon and has been described as the westward continuation of the sole thrust beneath the southern Rocky Mountains foreland belt (Brown et al. 1992; Parrish 1995). As described above, the Monashee décollement is responsible for the displacement of the 33 Selkirk allochthon (Kootenay terrane) over the Monashee complex (Read and Brown 1981; Brown and Read 1983; Journeay and Brown 1986; Brown et al. 1992; Johnson 1994). Most of the east-directed ductile displacement of the Monashee décollement has been constrained to have occurred during the Late Cretaceous to Paleocene (Carr 1991; Parrish 1995; Gibson et al. 1999; Crowley et al. 2001) until the onset of post-orogenic extension beginning in the Late Paleocene (Parrish 1995). The younger Columbia River fault is broadly parallel with the Monashee décollement but disrupts it in several locations. The Eocene and younger brittle fracturing and displacement along the Columbia River fault was responsible for reactivating the mylonite zone of the Monashee décollement over most of its length and then continued northward into nonmylonitic rocks of the Selkirk allochthon near Birch Creek, where the Columbia River fault eventually terminates (Lane 1984). 2.2.2.5 Region 5: Shuswap Metamorphic Complex (SMC) The SMC is the structural region located between the Monashee décollement and the Okanagan Valley shear zone (Fig. 2.3). It is a region of thinned mid-crustal rocks that were tectonically exhumed when late-orogenic extensional collapse of the southern Omineca belt was accommodated by moderate- to low-angle Eocene faults (Ewing 1980; Price and Carmichael 1986; Parrish et al. 1988; Johnson and Brown 1996) of the brittle upper crust and ductile thinning of the mid- to lower crust (Vanderhaeghe et al. 1997). It is the largest metamorphic core complex in the North American Cordillera (Fig. 2.6) (Coney 1980; Armstrong 1982; Johnson 1994) and is exposed over an area greater than 40 000 km2 (Parrish et al. 1998). 34 Figure 2.6: The Cordilleran metamorphic core complexes (from Vanderhaeghe et al. 1997, after Crittenden et al. 1980; Armstrong 1982); the SMC is the largest metamorphic complex in North America. The SMC exposes high-grade crystalline rocks exhumed from mid-crustal levels (Brown and Journeay 1987; Carr 1991; Parrish et al, 1988). It consists largely of migmatitic gneisses and pegmatite that were thrust northeastward over the Monashee Complex (Read and Brown 1981; Brown and Read 1983; Journeay and Brown 1986; Brown et al. 1992). This structural level has been referred to as the “middle crustal zone” (Brown and Carr 1990; Carr 1991, 1992) because the SMC was buried, metamorphosed, and deformed at mid-crustal levels during Mesozoic orogenesis (e.g. Okulitch 1984; Parrish et al. 1988; Parrish 1995; Glombick 2006). The SMC contains structural evidence for both northeast-directed compression throughout the eastern portion of the complex and west-directed extensional shearing nearer its western margin (Johnson 1994; Johnson and Brown 1996). SMC rocks are sillimanite-bearing, amphibolite- and granulite-facies gneisses and schists, that host intermediate and felsic intrusions that are exposed in a series of gneiss domes (Okulitch 1984; Brown et al 2012). 35 In the region south of 50°N (south of the current study area), Devonian to Early Jurassic metasedimentary to metavolcanic rocks of oceanic and oceanic arc affinity assigned to the Quesnel terrane were intruded by pre-Triassic, Jurassic, Cretaceous, and mid-Eocene granitoids (Glombick 2006; Brown et al. 2012). Also, voluminous leucogranite and pegmatite bodies were emplaced during the transition between compressional orogeny and extensional collapse of the southern Omineca belt (Carr 1992; Scammell 1993; Johnson 1994). The mid-crustal rocks of the SMC contain up to 50 percent by volume Paleocene to middle Eocene granitic rocks; this suggests that the middle crust was very weak and partially molten at the time (Glombick 2006). Two main assemblages have been mappe in the study area, the Three Valley Assemblage and Hunters Range Assemblage. Three Valley Assemblage The Three Valley assemblage is the structurally lower unit of the SMC. It is characterized by migmatitic, semipelitic to psammitic paragneiss with large boudins of gneissic clinopyroxeneand garnet-bearing amphibolite and less abundant pelitic schist and calcareous psammite (Johnson and Brown 1996). Rocks within the assemblage are highly strained (Johnson 1994). The top boundary is difficult to define where it transitions into the Hunters Range assemblage (Johnson 1994). Hunters Range Assemblage Hunters Range Assemblage structurally overlies the Three Valley Assemblage. It is lithologicaly similar in that it is dominated by semipelitic paragneiss, but amphibolite seldom forms in large boudins (Johnson 1994). It is a succession of migmatitic garnet-sillimanite-biotite schist, quatzofeldspathic paragneiss, amphibolite, marble, calcsilicate gneiss, and biotite-hornblende granodioritic to dioritic gneiss (Johnson and Brown 1996). Six samples spanning the width of the SMC were collected: RS1206, RS1207, RS1208, RS1209, RS1210 and BV1229 (Table 2.3). 36 Table 2.3: Six samples collected from the SMC (Coutand 2012) Sample number Sample composition RS1206 Sillimanite gneiss RS1207 Quartz-plagioclase-biotitesillimanite paragneiss RS1208 Pegmatitic gneiss RS1209 Quartzitic gneiss RS1210 Amphibolitic gneiss BV1229 hornblende-plagioclase-biotitediorite 2.2.2.6 Region 6: Okanagan Valley shear zone (OVsz) The SMC is bound to the west by the Eocene Okanagan Valley shear zone, which is a shallow west-northwest-dipping, crustal-scale, ductile-brittle extensional detachment with dominantly west-northwest directed shear sense (Fig. 2.3) (Tempelman-Kluit and Parkinson 1986; Bardoux and Mareschal 1994; Johnson and Brown 1996; Brown et al. 2012). The OVsz has a mean dip angle of ~15°C (Brown et al. 2012); the shear zone angle was originally thought to have range between 10°-30° (Tempelman-Kluit and Parkinson 1986; Brown et al. 2012). The OVsz is ~1.5 km thick, which separates allochthonous metasedimentary and metavolcanic rocks of the Intermontane terranes from amphibolite to granulite parautochthonous gneisses of the Omineca belt (Cook et al. 1992). The shear zone is typically over 1 km thick and contains pervasive ductile and brittle shear fabrics that developed during Eocene extension (Brown et al. 2012). It transitions structurally upward from mylonitic amphibolite facies gneisses to cataclasite where the shear zone is bounded by an upper brittle detachment surface (Brown et al. 2012). Three lithodemic domains have been identified by Brown et al. (2012) that typically characterize the OVsz (Fig. 2.7). For example, to the south in the region of Skaha Lake (Fig. 2.7, red dot), the structurally lowest layer is gradational with the footwall rocks and contains weakly to moderately foliated felsic plutonic rocks. The middle layer is a mylonitized, moderately to intensely deformed orthogneiss and 37 paragneiss intruded by felsic sheets. The upper-most layer contains hydrothermally-altered ultramylonite, cataclasite, and breccia (Brown et al. 2012). Further north, near Kelowna (Fig. 2.7, black dot), a similar pattern is observed. The structurally lower levels of the OVsz consist of coarse-grained crystalline amphibolite facies granodiorite gneiss that grades progressively to fine-grained mylonitic gneiss, augen gneiss and mylonite that transition to microbreccia in the structurally highest regions (Tempelman-Kluit and Parkinson 1986; Bardoux 1993; Twomey 2014). The microbreccias most likely represent shattered and hydrothermally altered mylonite and were probably formed at around 10 km depth and ~250°C (Tempelman-Kluit and Parkinson 1986). Overall, the OVsz demonstrates a decrease in metamorphic grade, recrystallization textures, and grain size, and an increase in ductile strain fabrics at the structurally shallowest levels (Tempelman-Kluit and Parkinson 1986). Figure 2.7: Three vertically gradational lithodemic domains typically make up the OVsz (modified from Brown et al. 2012). The hanging wall is located in the region west of the OVsz and the footwall is located to the east. Map shows the location of the Lake Skaha region (red dot) and Kelowna (black dot) with respect to the Shuawap Complex (green area) and the study are (blue dot). 38 Seven samples were collected from the OVsz: RS1206, RS1207, RS1208, RS1209, RS1210 and BV1229 (Table 2.4). Table 2.4: Six samples collected from the OVsz (Coutand 2012) Sample number Sample composition BV1217 dioritic gneiss BV1218 quartzite + quartzitic gneiss BV1221 Quartzite BV1224 Mylotinized meta-gneiss BV1226 mylonitic gneiss BV1228 Biotite-garnet gneiss 2.2.2.7 Region 7: OVsz Hanging wall, west of the OVsz The hanging wall of the Ovsz typically consists of low metamorphic grade zeolite to lower greenschist facies rocks consisting predominantly of phyllite, schist and felsic plutons (Bostock 1941; Okulitch 1973; Tempelman-Kluit and Parkinson, 1986; Johnson and Brown, 1996; Brown et al. 2012). The assemblages in the OVsz hanging wall are predominantly Paleozoic to Early Jurassic metasedimentary and metavolcanic rocks from oceanic and juvenile oceanic sources assigned to the Quesnel terrane that were accreted to the western margin of North America in early Mesozoic (Fig. 2.3). These rocks were intruded multiple times by pre-Triassic to middle Eocene plutons. Mesozoic hanging-wall rocks are overlain by Eocene non-metamorphosed sedimentary, volcanic, and volcaniclastic rocks (Church 1973; McClaughry and Gaylord 2005; Johnson 2006; Brown et al. 2012). Within the study area, the hanging wall consists of the Eagle Bay Assemblage, a packet of rocks thought to be contiguous with the Lardeau Group (Fig. 2.3; east of the Columbia River fault) prior to extension and subsequent exhumation of the SMC (Johnson and Brown 1996). Four main groups of rocks are found within the hanging wall of the OVsz: Silver Creek assemblage, Tsalkom Formation, Eagle Bay assemblage, and the Mount Fowler suite (part of the Devonian-Mississipian granodiorite group of rocks) (Fig. 2.3). 39 Silver Creek Assemblage The Silver Creek assemblage contains garnet-mica schist, impure quartzite, and minor carbonate and mafic schist; they represent the Neoproterozoic or Lower Paleozoic strata of the Windermere Supergroup, Hamill or Lardeau Goup (Okulitch 1979; Johnson 1989, 1990; Johnson 1994) Tsalkom Formation Structurally above the Silver Creek assemblage is the Tsalkom Formation, which contains discontinuous metabasites and components of the Sicamous Formation, which is a thick succession of phyllitic marble and calcareous phyllite. These units could be part of the pericratonic Kootenay terrane (Lardeau/Eagle Bay) or the Slide Mountain terrane (Slocan Group) on the inboard edge of the Intermontane superterrane (Johnson 1994). Eagle Bay Assemblage The Eagle Bay assemblage is observed in the study region within the hanging wall of the OVsz ; it comprises quartzite, mica schist, marble, calcsilicate schist, phyllite, and metabasite (Johnson and Brown 1996). The assemblage ranges in age from Early Cambrian or older to Mississipian, and is equivalent to the Hamill-Badshot-Lardeau succession representing continental margin deposits of the western margin of the ancestral North American craton (Okulitch 1979; Schiarizza and Preto 1987; Johnson 1994) Mount Fowler suite The Mount Fowler Suite contains Devonion granodioritic gneisses that intruded the Eagle Bay Assemblage (Okulitch et al, 1975) forming discordant to subconcordant sheets within the Eagle Bay assemblage and between the Eagle Bay and Lichen assemblages (Johnson 1994). The composition of the gneiss ranges from quartz diorite to monzogranite and typically consists of medium to coarse-granied biotite granodiorite to tonalite gneiss (Johnson 1994). Biotites, commonly forming thin lenticular aggregates, can typically constitute 25% of the rock; in some areas hornblende, epidote, muscovite, and/or chlorite are found in addition to biotite. The Mount Fowler gneiss, located in the hanging wall of the OVsz, has been linked to the Clachnacudainn gneiss, the only granitoid suite of similar age in the hanging wall of the Columbia River fault. The two gneisses are thus suggested to be co-magmatic (Johnson and 40 Brown 1996) and have been used to constrain their palinspastic restoration of extension along the OVsz and Columbia River fault. Two samples were collected from the OVsz hanging wall: BV1223 and BV1227 (Table 2.5). Table 2.5: Two samples taken from the OVsz hanging wall (Coutand 2012) Sample number Sample composition BV1223 Hornblende-dioritic gneiss BV1227 Dioritic schist 2.2.2.8 High angle brittle faults Important brittle faults in the region include, from east to west, the Victor Creek, Joss Pass/Three Valley, and Solsqua faults (Fig. 2.3) (Johnson 1994; Johnson 2006). Similar to the Columbia River fault and OVsz, these faults are believed to have formed as a response to Eocene extensional collapse of the Canadian Cordillera (Johnston et al. 2000; Johnson 2006). More specifically, extensional collapse and exhumation of the SMC and MC would have been accompanied by isostatic rebound of the footwall (Johnson 1994), which could have resulted in the formation of steep west-side-down normal faults, such as the Victor Creek, Joss Pass/Three Valley faults, that cut the footwall mylonites while brittle extensional deformation of the cold hanging wall could have been accommodated by the Solsqua fault (Johnson 1994; Johnson 2006). Johnson (1994) suggests that if isostatic rebound was the driving force for the initiation of these high angle brittle normal faults, then one would expect that the faults should young from east to west – that is, the Three Valley Gap fault should be younger than the Victor Creek fault. Victor Creek fault The Victor Creek fault is a roughly north-south striking, high-angle normal fault (Fig. 2.3)(Read 1980; Johnson and Brown 1996; Lorencak et al. 2001; Johnston 2000) thought to be active around Mid-Eocene (45 Ma) based on offset of apatite fission track ages (Lorencak et al. 2001); this suggest that the activity of this fault is closely linked to that of the Columbia River fault (Lorencak et al. 2001). The Victor Creek fault juxtaposes fine-grained mylonitic migmatites of 41 the Three Valley Assemblage against Monashee quartzites and calcsilicate gneisses (Brown et al. 1993b; Johnson 1994) Three Valley / Joss Pass fault The Three Valley (Johnson 1990, 1994, Johnston 2000) or the Three Valley Gap fault (Fig. 2.3) (Lorencak 2001) is a roughly north–south striking, west-side-down, normal fault with up to about 2 km of dip slip, as estimated from by offset of the muscovite-out isograd across its fault plane (Johnson 1990; Johnson 1994; Lorencak et al. 2001). The timing of activity of the Three Valley Gap fault was determined from apatite and zircon fission track analysis provided by Lorencak et al. (2001) is inconclusive, but based on the rebound theory of Johnson (1994), one would expect it to have been active after 45 Ma, which is the timing estimated for activity of the Victor Creek fault by Lorencak et al. (2001). The Joss Pass fault is considered by Johnston et al. (2000) to be the southern extension of the Three Valley fault (Fig. 2.3). Solsqua fault The Solsqua fault is a northwest-striking brittle normal fault that cuts through the ductile OVsz north of Sicamous (Fig. 2.3); the root of this fault may be found in the ductile brittle detachment at Mara Lake (Johnson 2006). Age constraints for this fault are yet to be determined. 42 CHAPTER 3: THERMOCHRONOLOGY - THEORY AND RESULTS 3.1 Low temperature thermochronology 3.1.1 Introduction Thermochronology is the study of the thermal history of a mineral, rock, or geological region (Reiners et al. 2005) using one or more thermochronometers. It can be used to measure the timing and rate at which rocks reach the earth’s surface from some depth and cool as a result of exhumation (Reiners and Brandon 2006). A thermochronometer, as defined by Reiners et al. (2005), is a radioisotopic system consisting of a radioactive parent, radiogenic daughter product (an isotope or a crystallographic feature), and the mineral in which they are found. Several thermochronometers are used today which rely on three main radioisotopic decay systems, (UTh)/He, 238U/fission-track (FT), and K-Ar (Reiners and Shuster 2009). This study will apply three thermochronometers, apatite fission-track, apatite (U-Th)/He, and zircon (U-Th)/He. (U-Th)/He involves the production of 4He from the alpha decay of 238U, 235U, and 232Th, and their immediate daughter products (through a reaction chain), as well as the alpha decay of Sm. FT analysis involves the production of damage zones called fission tracks from the spontaneous nuclear fission of 238U. 3.1.2 Principles of low temperature thermochronology Low-temperature thermochronology uses thermochronometers sensitive to the thermal history of the earth’s upper crust. Assuming a typical crustal geothermal gradient of around 20-30°C/km (e.g., Gleadow et al. 2002) and closure temperatures up to ~300°C, thermochronometers can provide information on the thermal evolution of the upper ~10 km of the earth’s crust. 3.1.2.1 Radiometric dating Low temperature thermochronology is based on the principle of radioactive decay where an unstable parent isotope decays to produce a daughter product at a known rate. The general age equation, introduced by Rutherford and others at the beginning of the last century (Reiners and Shuster 2009), assumes that the original number of daughter atoms (before they become fully retained in the crystal), Nd,0, is zero and that it is a closed system, such that (Equation 3.1) where, Nd, current number of daughter atoms, Nd,0, original number of daughter atoms (often negligible), Np, current number of parent atoms, t, cooling age, λ, decay constant of parent isotopes. 43 The radiometric age is therefore calculated by rearranging equation 3.1 to the following, (Equation 3.2) 3.1.2.2 Thermochronological age Thermochronometers record the time since a given mineral has cooled sufficiently to fully retain daughter products (Reiners and Brandon 2006). As long as a parent isotope is present, daughter products are continually formed. Whether a daughter product is retained within the crystal lattice or escapes from the thermochronometer depends on temperature-controlled diffusion processes at the atomic scale. The thermochronological (or cooling) age, tC, represents the time at which daughter products become less mobile and start to accumulate (or are retained) in the crystal lattice (Fig. 3.1) (Dodson 1973). Graphically, tC is found by extrapolating the lowtemperature portion of the accumulation curve back to the time axis (Fig. 3.1) (Dodson 1973). Figure 3.1: Definition of closure temperature. The time tC corresponds to the apparent age; T o, initial temperature, TC, effective closure temperature, D/P, the daughter/parent ratio (Dodson 1973). 3.1.2.3 Thermally activated diffusion Thermochronometers are sensitive to heat and lose accumulated daughter products because of thermally-activated diffusion of the daughter products out of the crystal (for (UTh)/He), or annealing of the daughter’s physical features (for FT) (e.g. Reiners and Brandon 2006; Reiners and Shuster 2009). The Arrhenius equation provides a simple mathematical model for diffusion in a cooling solid given by (Dodson 1973): (Equation 3.3) 44 where, D, diffusion coefficient at absolute temperature T, R, gas constant, E, activation energy for the diffusion process, D0, represents the diffusion coefficient at infinitely high temperature. 3.1.2.4 Closure temperature The effective closure temperature, TC, (Equation 3.4) (Dodson 1973) is the temperature corresponding to a grain’s apparent age, tC, or the time at which most of the daughter products are retained within the crystal. Derivation of Tc assumes a steady state monotonic cooling history and that the daughter product retention is controlled by thermally activated diffusion (Reiners and Brandon 2006). Several factors affect TC; for (U-Th)/He systems, TC is a function of the activation energy (for the diffusion process), frequency factor or diffusion coefficient (D0), cooling rate, and geometry and size of the crystal/grain. For FT thermochronometers, TC is a function of the activation energy, a proportionality constant based on the ratio between parent and daughter isotopes, and the cooling rate (Reiners and Brandon 2006). Figure 3.2 illustrates the closure temperature range for several thermochronometers indicating that TC falls within a temperature range and not a discrete temperature value. The closure temperature (TC) of a geochronological system is defined by the following equation: (Equation 3.4) where, Tc, closure temperature, R, gas constant, E, activation energy, τ, time constant with which the diffusion coefficient, D, decreases, D, diffusion coefficient (Do, starting condition for D), a, size of a characteristic diffusion domain, A, numerical constant depending on the shape (or geometry) and decay constant of the parent isotope. 45 Figure 3.2: Closure temperatures of various thermochronometers.Thermochronometers on the left side of the black line represent low temperature thermochronometers (Courtesy of I. Coutand). 3.1.2.5 Partial annealing zone (PAZ)/ Partial retention zone (PRZ) Thermochronometers close over a temperature range rather than at a discrete temperature (Fig. 3.2) (e.g., Reiners and Brandon 2006). The partial retention zone (or partial annealing zone for fission track systems) is the temperature range over which daughter products are only partially retained within a mineral (e.g., Reiners and Brandon 2006). For example, at initially high temperatures the daughter rapidly diffuses from or anneals within the crystal lattice site as fast as they are formed and therefore cannot accumulate (Dodson 1973). As the temperature decreases, the daughter products become partially stable and diffuse/anneal at a slower rate until the temperature is sufficiently low that they are removed at a negligible rate and accumulate in the crystal lattice (Dodson 1973). Daughter product diffusion or annealing behaviour is driven by the kinetics of the thermochronological system / host mineral, with a major contributing factor being sufficiently 46 high temperatures (Mankeltow 1997), as previously described. Several other factors that affect daughter product loss include grain size, composition, radiation damage, and heterogeneous distribution of daughter product (zoning) (Reiners and Shuster 2009). 3.1.2.6. Host minerals Minerals most commonly used for thermochronometry have a consistent concentration and even distribution of parent nuclides, are retentive to these isotopes, and have a low initial daughter isotope concentration (e.g. Attendorn and Bowen 1997; Gleadow et al. 2002; Reiners and Shuster 2009). They typically include apatite [Ca5(PO4)3(F,Cl)] and zircon (ZrSiO4) for (UTh)/He and fission track systems. Zircon is a ubiquitous accessory mineral that has the tendency to concentrate U and Th and is resistant to chemical and physical degradation (Hazen et al. 2009). The average concentration of U and Th in zircon is about 1330 and 560 ppm, respectively (Attendorn and Bowen 1997). Apatite is also a ubiquitous accessory mineral in crustal rocks (~ 1% of rock volume) with moderate to high U and Th content (Farley 2002, Ehlers and Farley 2003, Donelick et al. 2005). Apatite has some resistance to surface and near-surface weathering, however, they are not as robust as zircon, are known to experience a rounding effect from abrasion, and can be soluble in acidic environments (Farley 2002, Ehlers and Farley 2003, Donelick et al. 2005). The concentration of natural uranium in apatite typically ranges from 1–200 ppm (Donelick et al. 2005). 47 3.2 Apatite fission-track thermochronology (AFT) 3.2.1 What is AFT? Fission track thermochronology is a radiometric dating method based on the accumulation of damage trails, or fission tracks, caused by the rare but energetic spontaneous fission of 238U in certain uranium-rich minerals (e.g. Donelick et al. 2005, Tagami and O’Sullivan 2005). While spontaneous fission occurs in very heavy nuclides of the actinide series of elements, only 234U, 235 U, 238U, and 232Th tend to produce significant numbers of spontaneous fission tracks in solids (Table 3.1) (Tagami and O’Sullivan 2005). Further, 238U is the most readily available source of terrestrial fission tracks based on its abundance and half-life (Wagner and Van den haute 1992). The time at which fission tracks begin to be retained is used to calculate the cooling age of the rock / mineral by measuring the number of preserved spontaneous fission tracks (daughter products) and the current uranium content (remaining parent product) and relating them using the radioactive decay equation (e.g., Tagami and O’Sullivan 2005). AFT is a very common and robust method used today for low temperature thermochronology (Donelick et al. 2005). Table 3.1: Abundances, half-lives and decay constants of naturally occurring uranium isotopes (From Donelick et al. 2005 compiled from Lederer et al. 1967, Steiger and Jager 1977, Friedlander et al. 1981). 3.2.2 Fission tracks A widely accepted theory for fission track formation is the “ion explosion spike” model described by Fleischer et al. (1965) (Fig. 3.3). During nuclear fission, the heavy unstable nucleus of the 238U atom energetically disintegrates into a pair of similarly sized and charged nuclear fragments, rarely three, plus 2 or 3 high-energy neutrons (Fig. 3.3a, b) (Donelick et al. 2005). 48 The majority of the energy released (~170 of ~210 MeV) is the kinetic energy of the fission fragments (Tagami and O’Sullivan 2005). The positively charged fission fragments are repelled from each other because of Coulomb repulsion forces and travel in opposite directions at high velocity from the site of nuclear fission through the crystal lattice (Fig. 3.3b). As they travel rapidly along their trajectories, they capture lattice electrons in the crystal leaving behind a strip of cations. The cations repel each other creating a vacancy in the crystal lattice; this damage zone is the fission track (Fig. 3.3c). The nuclear fragments will gradually decelerate until they come to a stop. Fission tracks will form as long as the parent 238U is present in the host apatite grain (Donelick et al. 2005). They form at random orientations in the three dimensional crystal (Gallagher et al. 1998). Figure 3.3: Ion Spike Explosion model (courtesy of I. Coutand, modified from Fleischer et al. 1965). A fission track (Fig 3.4) is a cylindrical feature of amorphous material within a crystalline matrix bounded by a sharp amorphous-crystalline transition (Paul 1993; Tagami and O’Sullivan 2005). Tracks are linear and continuous features that taper off in diameter near their end (Dunlap et al. 1997, Chadderton 2003). In apatite crystals, they are generally less than ~20 µm in length and have a nearly-circular cross-section that is on average ~5-9 nm (Paul and Fitzgerald 1992, 49 Donelick et al. 2005). Reiners and Brandon (2006) report that fresh fission tracks are typically ~16 µm in length. Figure 3.4: Fission tracks a) photograph of etched fission tracks viewed under optical microscope showing structure in three dimensions (reflected light); b) three-dimension view of fission track in a crystal lattice (modified from Tagami and O’Sullivan 2005) 3.2.3 Fission track annealing, closure temperature and partial annealing zone Fission tracks form and anneal continuously as a function of time and temperature (Ketcham 2009). Fission tracks are metastable features that anneal by shortening and fading over time (Gallagher et al. 1998) due to thermally activated diffusion within the crystal lattice (Fleischer et al 1975, Tagami and O’Sullivan. 2005). Annealing (Fig. 3.5) occurs when the amorphous and disordered core of the fission track is gradually replaced by an ordered crystalline matrix (Paul and Fitzgerald 1992; Paul 1993) over time. Figure 3.5 illustrates that both the fission track length and grain age vary as a function of heating time and temperature (Tagami and O’Sullivan 2005) as the tracks anneal, and get shorter from their initial lengths at a rate primarily dependent on temperature (Donelick et al. 2005). Another important factor that affects the annealing kinetics in apatite is the chemical compositional variations in chlorine, hydroxide, and fluorine; for example, Cl-rich apatites tend to be more resistant to annealing than OH- and F-rich varieties (Green et al. 1986, Crowley et al. 1991, Carlson et al. 1999, Barbarand et al. 2003). 50 Figure 3.5: Long-term natural annealing of fission tracks in apatite observed in borehole samples from the Otway Basin, Australia (after Green et al. 1989). Both fission-track age (A) and length (B) are reduced progressively down to zero in the temperature range of ~60–120 °C due to the increase in temperature with depth. Error bars are ± 2σ (Tagami and O’Sullivan 2005). The PAZ (introduced in Section 3.1) is the temperature range between ~60 °C and ~110 °C where apatite fission tracks form but are only partially stable, with older tracks slowly annealing and shortening over geological time (Fig. 3.6) (e.g., Gleadow et al. 1986; Green et al. 1989; Ketcham et al. 2009; Tagami and O’Sullivan 2005). Below the lower temperature limit of the PAZ (< ~60 °C), FTs in apatite are effectively stable and anneal at very slow rates (Fig. 3.6) (e.g., Fitzgerald and Gleadow 1990). Above the upper temperature limit (> ~110 °C), fission tracks are instantaneously annealed as they form (Fig. 3.6). The effective closure temperature for apatite fission track thermochronology is in the range of 90 – 120°C (Laslett et al. 1987; Ketcham et al. 1999); the discrete TC value is estimated to be 116°C (Ketcham 1999) for apatite of average composition (Carlson et al. 1999) for an assumed 10°C/Myr cooling rate (Ketcham 1999; Reiners and Brandon 2006). 51 Figure 3.6: Annealing characteristics for AFT, indicating the location of the PAZ (after Gallagher et al. 1998). Several factors affect how apatite retains fission tracks and thus affect how they anneal. The rate of thermal annealing is strongly affected by the compositional variation of host apatites (Carlson et al. 1999). Variation in fission track retentivity based on composition can lead to some complications in AFT dating particularly if dealing with multi-kinetic populations. Carlson et al. (1999) made the following observations about compositional variation in apatite grains: (1) there is identical annealing behaviour in apatites with very similar compositions; (2) the rate of annealing is reduced in apatites where there is significant substitution for Ca by other cations; the common cations substitutions for Ca are Fe and Mn, but others can include, Sr, Ce, La, and Na; (3) the rate of annealing may depend on the extent or degree of mixing on the halogen site of the crystal which is typically occupied by F, Cl, or OH. According to Reiners and Brandon (2006), the fluoroapatite end-member of natural occurring apatite is known to have the lowest fission track retentivity among all apatite and is also the most commonly occurring apatite in nature. Increased retentivity of fission tracks can occur by two important end member substitutions in apatite (Cl and OH substitutions), which are less common in nature. The annealing rate of fission tracks in apatite is also dependent on the crystallographic orientation of tracks (Donelick 1999, Barbarand et al. 2003b). This anisotropic annealing property causes tracks at high angles to the c-axis to anneal more rapidly than tracks parallel to the c-axis (Green and Durrani, 1977). 52 Several authors suggest that apatite accumulates minimal radiation damage from alpha decay because of the trace amounts of U and Th in its structure (Gleadow et al. 2002; Tagami and O’Sullivan 2005; Donelick et al. 2005) suggesting that the effect of radiation damage on the annealing on spontaneous fission tracks in apatite is minimal. In contrast, U- and Th-rich minerals such as zircon and titanite have a reduction of annealing rate of spontaneous fission tracks with increased radiation damage accumulation (Donelick et al. 2005), there is limited evidence that this is the case for apatite. 3.2.4 Age equation The apatite fission track age equation is derived from the standard radiometric equation, displayed in Section 3.1.2 and it includes three parameters: the number of accumulated daughter products, the number of remaining parent nuclides, and the decay constant of the parent nuclide (refer to Eq. 3.1). For the apatite fission-track method, these are the number of spontaneous fission tracks per unit volume, NS, the number of 238U atoms per unit volume, 238N, and the decay constant for spontaneous nuclear fission, λF, respectively (Tagami and O’Sullivan 2005). Another important consideration regarding AFT analysis is that 238U in apatite undergoes other types of decay in addition to spontaneous nuclear fission, namely alpha and beta decay. The decay constant for alpha decay of 238U is greater than that of spontaneous fission, ~1.55125 × 10⁻¹⁰ y−1 versus ~7.5 × 10⁻¹⁷ y-1 (Table 3.1), making alpha decay the more dominant process (Tagami and O’Sullivan 2005). For every ~2 million 238U atoms that undergo alpha decay, a single 238U nucleus will split by spontaneous nuclear fission (Tagami and O’Sullivan 2005, Donelick et al. 2005). This is an important consideration to be incorporated into the age equation. At Dalhousie University, we use the External Detector Method (EDM; e.g. Gallagher et al., 1998), whereby the age equation includes the following modifications from the classic age equation: NS becomes ρs, the surface density of spontaneous fission-tracks, and 238N becomes ρi, the surface density of induced fission tracks. Another surface density parameter is introduced, ρd, the induced fission track density for a uranium standard (or the dosimetry glass). The analyst measures these three parameters in the lab. Each analyst will also calculate a zeta calibration 53 factor, ζ, which is based on their analysis of age standards, such as Durango apatites, of known ages. Zeta calibration was recommended by the IUGS subcommission on Geochronology (Hurford 1990) and has since been used universally with the External Detector Method (Setion 3.2.5). The final factor, g, is the integrated geometry factor of etched surface (Tagami and O’Sullivan 2005). (Equation 3.5) where, i, grain i; ti, fission track age for grain i; d, total decay constant of 238U (y-1); , zeta calibration factor based on EDM of fission track age standards; g, geometry factor for the EDM method, is equal to 0.5; ρd, induced track density in a CN5 dosimeter glass; s,i, spontaneous fission-track density; and i,i , induced fission-track density. 3.2.5 External Detector Method (EDM) The external detector method is one of two main methods used in apatite fission track thermochronology. EDM is an indirect method to determine the U content in a sample. The other method of AFT analysis involves a direct measurement of uranium concentration by laserablation inductively-coupled plasma mass spectrometry (LA-ICPMS) (Donelick et al. 2005). According to Tagami and O’Sullivan (2005), EDM is the most widely used method of AFT dating because it is well calibrated and it is less expensive. Apatite grains are prepared for EDM by exposing an internal surface through polishing (Fig. 3.7a and b) and chemical etching (Fig. 3.7c) to optically reveal spontaneous fission-tracks (for details on the analytical procedure, see Appendices 1 and 3). Chemical etching enlarges the originally 5 -10 nm wide fission tracks to several micrometres, and allows these features to be observed with an optical microscope (Gleadow et al. 1986). It is important to note that the composition of an apatite grain determines the shape and size of an etched track (Gleadow 1981; Laslett et al. 1984; Barbarand et al 2003); for example, apatites rich in chlorine tend to have larger tracks and etch pits than fluorine-rich varieties (e.g. Carlson et al. 1999; Barbarand et al. 2003). The 238U parent concentration is then indirectly determined by using the fission-track density induced from fission of 235U (Donelick et al. 2005). To do this, each grain mount is sealed in contact with a uranium free external detector (usually a muscovite slab) (Fig. 3.7d). The grain 54 mount-mica pairs are then irradiated with a flux of slow thermal neutrons to induce the fission of 235U in the grains (Fig. 3.7e). Because of its high thermal neutron capture surface, the fission of 235U is induced with negligible induced fission of the other uranium and thorium isotopes (Donelick et al. 2005). The induced fission tracks near the surface of the grain mount impact the external detector, and hence, record the 235U concentration (Fleischer et al. 1975). After irradiation, only the mica will be chemically etched (Fig. 3.7f) to reveal the tracks induced during irradiation. The fission track density of the mica is used to determine the 238U concentration through the known 238U/235U ratio (Fleischer et al. 1975). Another parameter needed for EDM is the intensity of the flux of thermal neutrons during irradiation using a uranium-doped glass (in our case, a CN5-glass) that is similarly attached to an external detector (mica slab) and placed in three locations (top, middle, bottom) in the sample stack (usually 25 samples) sent for irradiation. Similarly, induced tracks near the glass surface will impact the external detector and will permit the calculation of the intensity of the neutron flux traversing the stack of samples during irradiation. The samples for this study have been irradiated at the Technical University of Munich (Germany). 55 Figure 3.7: The external detector method (EDM) (Courtesy of I. Coutand, modified from Gallagher et al. 1998 and Hurford and Carter 1991). 3.2.6 Track lengths distribution The distribution of confined track lengths in AFT analysis allows for the quantitative modeling of a mineral / rock’s thermal history (e.g., Laslett et al. 1982; Green et al. 1989a). This ability to model AFT data based on robust kinetic annealing models is a primary strength of AFT analysis (Ketcham et al. 2009). Confined tracks are the fission tracks that are contained entirely within the boundaries of the crystal being analyzed, that is, they do no intersect any of its surfaces (Figure 3.4.b; Tagami and O’Sullivan 2005). The confined fission tracks used for track length analysis are located below the polished grain surface in a subhorizontal position (Fig. 3.4b) (Bhandari et al. 1971; Laslett et al. 1982; Gleadow et al. 1986). The confined track length distribution monitors the time spent in the PAZ and is critical for providing information on the style of cooling history (e.g. Gallagher et al. 1998, Donelick et al. 2005). 56 For the EDM method, fission tracks that intersect the polished surface are counted for age analysis. The amount of time a grain spends in the PAZ will affect the confined track lengths (Fig. 3.8). If a sample contains mostly long tracks then the probability that a track will intersect the polished surface is higher than if fission tracks are predominantly short. In Figure 3.8, a bedrock sample that experiences rapid cooling and therefore spends a short time in the PAZ will have a uniform distribution of long track lengths and a younger apparent age. In this example, the age is young because the sample has few tracks that are formed in a short time followed by rapid cooling of the sample. This resultant age will not be biased by partial annealing and will reflect the accumulation and preservation of the tracks since the sample cooled below the effective closure temperature. However, if the sample spends an extended time in the PAZ, the number of tracks will increase and the distribution of track lengths will change (Fig. 3.8). Tracks which formed initially will gradually shorten while new tracks will form. Over time a non-uniform distribution of shorter track lengths will develop, which will bias the fission track age to produce an older apparent age. Determining the confined track lengths distribution is critical to determine the amount of time spent in the PAZ and thus reliably interpret the apparent cooling age data. Thermal modeling using confined fission tracks helps to determine the timing of the onset of cooling. When possible, 50-150 track lengths are measured per grain (Gallagher et al. 1998). 57 Figure 3.8: Crustal section through which a bedrock sample (grey dot) experiences contrasted cooling histories. The black line and arrow to the left represent rapid cooling of the sample resulting in almost no annealing and therefore long tracks (see track length distribution at the top left of the figure) and a cooling age of about 5 Ma, which represents the time taken by the sample to cool below the closure temperature, exit the PAZ and reach the surface. The arrow on the right illustrates a slow cooling history (a 50 Myr residence time in the PAZ) resulting in pronounced annealing (see track length distribution on the top right of the figure) and an apparent age younger than 50 Ma, which does not represent a geological event (Courtesy of I. Coutand, modified after Naeser 1979; Wagner, 1979). 58 3.3 (U-Th)/He Thermochronology 3.3.1 What is (U-Th)/He? (U-Th)/He thermochronology is based on the accumulation or ingrowth of 4He from the series decay of U (238U, 235U) and 232Th, and a lesser amount through the alpha-decay of 147Sm to 143Nd (Farley 2002; Ehlers and Farley 2003; Hourigan et al. 2005). The 4He cooling age represents the time since closure of the He system; it is calculated using the concentration of parent isotopes remaining in the host mineral (U, Th, Sm), the concentration of accumulated daughter products present (4He), and the decay constants of the parents (Ehlers and Farley 2003). A decription of the (U-Th)/He procedure is available in Appendices 1 and 2. 3.3.2. Uranium and Thorium isotopes There are three natural isotopes of uranium (Table 3.1), 238U, 235U, and 234U, in order of decreasing abundance. Thorium has one naturally occurring isotope, 232Th (Table 3.1). For the past approximately four decades, the ratio 238U/235U of natural uranium was adopted by convention (Steiger and Jäger 1977) to be exactly 137.88. Heiss et al. (2012) have now reported the ratio with high-precision to have a mean value of 137.818 ± 0.045 (2σ). The U series is the radioactive decay chain of 238U where each atom of 238U produces one atom of stable 206Pb while emitting 8 alpha-particles (4He) and 6 beta-particles. Assuming a closed isotopic system where the intermediate daughters are preserved (Attendorn and Bowen 1997), the equation is, (Equation 3.6) where, Q is the total decay energy of the series, 47.4 MeV atom-1 The Th series is also a radioactive decay chain where each 232Th atom decays to one atom of stable 208Pb and emits 6 alpha-particles and 4 beta-particles, assuming a system closed to Th, Pb, and all the intermediate daughters are preserved (Attendorn and Bowen 1997). The equation is, (Equation 3.7) where, Q is total decay energy of the series, 39.8 MeV atom-1 Samarium is a Rare Earth Element (REE) / lanthanide. It has seven natural isotopes, including 147 Sm (15%). 147 Sm is radioactive and decays by one alpha emission to a stable isotope of 143Nd 59 (Attendorn and Bowen) in the following reaction (Equation 3.8) . It does not decay via a decay chain and produces less energy. (Equation 3.8) Where, Q is the energy produced. 3.3.3 4 He ingrowth The amount of 4He nuclei (or alpha-particles) produced in a host mineral over a given time can be calculated from the 4He ingrowth equation (Farley 2002): (Equation 3.9) Where, 4He, U, and Th present-day concentrations, t, accumulation time or the (U-Th)/He age, λ, decay constants (λ238 = 1.551 ×10⁻¹⁰ yr-1, λ235 = 9.849 ×10⁻¹⁰ yr-1, λ232 =4.948 ×10⁻¹¹ yr-1), coefficients preceding U and Th account for the number of alpha particles emitted within each of the decay series; factor 1/137.88 is the present day 235U/238U ratio. A second 4He ingrowth equation (Equation 3.10) includes the contribution of 4He from samarium (Sm) (Hourigan et al. 2005). This is particularly important for 4He calculation in apatite because He produced from Sm decay can have significant contribution to the total 4He (Kislitsyn 2014, personal communication). (Equation 3.10) Two important assumptions are associated with the use of the 4He ingrowth equation. The first is that of secular equilibrium among all daughter products in the decay chain (Farley 2002); this means that the quantity of decay products in the reaction chain remains constant because the production of daughter product (due to the decay of a parent isotope) equals the rate of decay of daughter product. Farley (2002) states that secular equilibrium is guaranteed for crystals formed more than ~350 kyr before the onset of He ingrowth. The second assumption is that there is an absence of initial 4He in the system. This assumption is generally acceptable because of two key characteristics of 4He, (1) background or atmospheric 4He volume is very low (~5ppm), and (2) the small size of 4He particles allows it to have a high diffusivity through most solids. Despite this, there are conditions that can lead to high concentration of background 4He in host minerals, such as the presence of crustal/mantle 4He-bearing fluid inclusions and the presence of inclusions of other minerals such as apatite, monazite, zircon, titanite and xenotime that contain high concentrations of parent nuclides (Ehlers and Farley 2003). Other important 60 parameters that can affect 4He retention include grain size and degree of radiation damage (Farley 2002). Radiogenic 4He is produced in the crystal as long as parent nuclides are present but can be lost from the crystal because of a thermally-activated diffusion process (e.g. Reiners and Brandon 2006; Reiners and Shuster 2009). 3.3.4 4 He diffusivity behaviour The rate of 4He diffusion out of a mineral is determined by the temperature, 4He diffusivity behaviour of the mineral, and the conditions for 4He retention in the mineral (Reiners and Brandon 2006; Cherniak et al. 2009). 4He diffusivity behaviour varies according to mineral characteristics such as grain size and shape, chemical composition, and defect and/or radiation damage density (Farley 2002). For both apatite and zircon, diffusivity scales with the physical grain size, such that the crystal size controls the length scale of the diffusion domain (Reiners 2005). Diffusivity behaviours of apatite and zircon have been studied extensively in the laboratory largely from outgassing experiments, where samples were heated in a stepwise manner and the 4 He released was measured by mass spectrometry (e.g., Farley et al. 1996; Wolf et al. 1996; House et al. 1997; Wolf et al. 1998; Reiners et al. 2000). Outgassing experiments have provided valuable information on diffusivity behaviours but are unable to provide information about initial 4He distribution or homogeneity of 4He distribution within the grain (Cherniak et al. 2009). Several refinements to step-heating were introduced, for example, the generation of a uniform 3 He distribution by proton irradiation coupled with measurement of the ratio of simultaneously released 4He/3He (Shuster et al. 2003; Shuster and Farley 2004, 2005a,b); direct profiling of 4He distributions to characterize the diffusion of implanted 3He and 4He to evaluate diffusion coefficients using the techniques of nuclear reaction analysis (NRA) and Elastic Recoil Detection (ERD) (e.g., Ouchani et al. 1998; Costantini et al, 2002; Gosset et al. 2002; Trocellier et al. 2003a,b; Miro et al. 2006, 2007); and ion implantation to introduce 3He followed by measuring 3 He concentrations by nuclear reaction analysis (Cherniak et al. 2009). All these efforts have allowed us to better constrain the diffusion behaviors and processes of 4He in apatite and zircon crystals. 61 4 He may have an inhomogeneous distribution in the mineral grain because of the natural distribution of U, Th, and Sm in the grain, alpha ejection from the grain, and differential 4He losses due to past thermal histories (Cherniak et al. 2009). The internal grain structure may be affected by defects such as dislocations which may also affect 4He distribution and mobility when microstructures within the grain may create “diffusion fast paths” which are different but hard to distinguish from lattice diffusion because profiles are not based on the type of 4He analysis used. The loss of 4He nuclides because of thermally-activated diffusion out of the crystal follows an Arrhenius relationship for both apatite and zircon (e.g. Farley 2002; Reiners 2005; Reiners and Brandon 2006; Reiners and Shuster 2009). The resulting relationship indicates that the diffusion rate of 4He is primarily temperature dependent and increases at higher temperatures (Mankeltow 1997). While a linear plot on a Arrhenius curve suggests a simple 4He diffusion pattern in a given mineral phase; a non-linear plot, on the other hand, suggests a more complicated relationship such as multiple diffusion domains or multiple diffusion mechanisms that could be in effect (Farley 2002). 3.3.4.1 Helium diffusivity in apatite For 4He diffusion in apatite, plotting diffusivity over a range of temperatures produces a line on an Arrhenius plot (Fig. 3.9, equation 3.10); this confirms that 4He is lost by a simple thermally driven volume diffusion out of the crystal (e.g., Wolf et al. 1996; Farley 2000). 62 Figure 3.9: Arrhenius plot for helium diffusion in apatite. Diffusion normal to c-axis of an apatite crystal (white circles) have an activation energy of 117±6 kJ/mol; diffusion parallel to c-axis (black circles) appears similar with an activation energy of 129±12 kJ/mol (Cherniak et al. 2009). The activation energy for 4He release is about 32-38 kcal/mol (e.g., Wolf et al. 1996; Farley 2000, 2002). Farley (2000) suggests that a higher activation energy is necessary to facilitate diffusion parallel to the C-axis compared to that needed for diffusion perpendicular to the C-axis indicating that diffusive loss from apatite will be mostly controlled by diffusion perpendicular to the c-axis. Other workers suggest that 4He diffusion in apatite is nearly isotropic allowing it to be modeled with a spherical diffusion geometry (Wolf et al. 1996, 1998; Reiners and Brandon 2006; Spiegel et al. 2007; Cherniak et al. 2009). Given the prismatic shape of euhedral apatite crystals (crystals that are generally elongated along the c-axis), grain dimensions need to be converted to an equivalent spherical radius (Wolf et al. 1996, 1998; Spiegel et al. 2007) to calculate the radius of the diffusion domain. 3.3.4.2 Helium diffusivity in zircon 4 He diffusion in zircon is also temperature dependent. Zircon generally displays an Arrhenius relationship with respect to temperature except for the very early stages of heating when there is excessive diffusivity in the crystal (Reiners et al. 2004). An Arrhenius plot for helium diffusion 63 in zircon (Fig. 3.10) also shows a separate linear relationship for diffusion parallel to the c-axis versus diffusion perpendicular to the c-axis (Cherniak et al. 2009) indicating that diffusion parallel to the c-axis is faster than that perpendicular to the c-axis. Diffusion of 4He parallel to the c-axis is the most energetically favourable because of the variation of energy barriers with temperature and crystallographic direction (Reich et al. 2007; Saadoune et al. 2009; Cherniak et al, 2009). At temperatures below the closure temperature for ZHe, 4He diffusion in zircon is thought to be primarily anisotropic (Reich et al. 2007). According to Reich et al. (2007), below ~380 °C, 4He diffuses favourably along the open channels or “pipes” parallel to the c-axis with few less-favourable thermally active “hop” attempts of 4He between channels perpendicular to the c-axis. Above ~380 °C, however, the hop attempts between channels perpendicular to the c-axis become more frequent (Reich et al. 2007). 4He therefore becomes increasing isotropic above ~380°C as 4He also diffuses in other crystallographic directions (Reich et al. 2009). Figure 3.10: Arrhenius plot for helium diffusion in zircon. Black circles show diffusion parallel to the caxis which are considerably faster than the white or grey circles, which show diffusion normal to the c-axis (Cherniak et al. 2009). 64 Given the complicated nature of 4He diffusion in zircon, Cherniak et al. (2009) has suggested modeling zircon diffusion using cylindrical geometry which involves spherical geometry for the slow diffusion direction and planar geometry for the fast diffusion direction. 3.3.5 Alpha stopping distances Each alpha particle produced by parent nuclides (U, Th, or Sm) has a defined decay energy and therefore a characteristic distance that it will travel before coming to rest; this distance is the stopping distance (Ziegler 1977). If the starting point of an alpha particle’s trajectory is imagined to be the centre of a sphere, the stopping distance is the radius and the alpha particle will stop at the surface of this sphere (Farley 2002). There are three main end results for an alpha particle ejected within any apatite or zircon crystal (Fig. 3.11): (1) it could be retained within the crystal, (2) it could be ejected out of the crystal, or (3) it could be implanted from a neighbouring crystal (Farley 2002). If an alpha particle is ejected from near the edge of the crystal boundary, the probability that it will be ejected from out of grain rises and reaches about 50 percent when it is located directly on the grain edge (Farley 2002). In apatite, the alpha-particles emitted from U and Th decay typically travel ~20 µm through the crystal lattice before stopping. If the alpha particle is produced in a site that is ~20 µm from the grain boundary, alpha ejection can result in the 4He particle being ejected from the grain and lost to the neighbouring environment (Figure 3.11; Elhers and Farley 2003). 4He implantation is often neglected because it is statistically less significant (Elhers and Farley 2003). In zircon, the alpha stopping distances range between 15-20 µm (Fig. 3.11). They are approximately 17.0 µm for the 238U series, 19.6 for the 235U series, and 19.3 for the 232Th series (Farley et al. 1996; Hourigan et al. 2005). Similar to the apatite (U-Th)/He system possible ejection and implantation are restricted to the outer ~20 µm of the crystal. The effect of alpha stopping distances is accounted for in (U-Th)/He analyses; this is described in Section 3.3.8 . 65 Figure 3.11: Effects of alpha stopping distances on 4He retention (modified from Farley 2002). 3.3.6 Radiation damage Radiation damage affects the diffusion of helium and annealing properties in both apatite and zircon crystals (Reiners et al. 2005). It is caused by the alteration of the crystalline structure of a mineral as a result of radioactive decay (Shuster et al. 2006). Introduction of isolated defects and vacancies are caused by: ionization effects from alpha-, beta-, and gamma-decay, atom displacement during alpha decay due to heavy recoiled atoms, atomic stopping of alphaparticles propelled through the crystal lattice, and formation of nuclear fission tracks (Rios et al. 2000, Trachenko et al. 2002, Donelick et al. 2005). Alpha decay is the biggest contributor to radiation damage (e.g. Shuster et al. 2006, Flowers et al. 2009), it accumulates in apatite and zircon at a rate that is a negatively correlated to temperature (Shuster et al. 2006), and has the ability to modify 4He diffusion properties through time (Gautheron et al. 2009). 3.3.6.1 Radiation damage in apatite In apatite, the accumulation and annealing of radiation-induced damage to the lattice structure modifies helium diffusion and retentivity through time (Farley 2000; Crowley et al. 2002; Green et al. 2006; Green and Duddy 2006; Shuster et al. 2006) by obstructing or decreasing 4He diffusion (e.g., Shuster and Farley 2008; Cherniak et al. 2009), increasing of the closure temperature, and increasing 4He retentivity (Shuster et al. 2006, Flowers et al. 2009). Radiation damage decreases diffusion rates (Shuster et al. 2006; Shuster and Farley 2009; Flowers et al. 66 2009) because of a trapping effect (Shuster et al. 2006) that causes 4He to be retained in “traps” created by lattice disruptions caused by alpha recoil particles and other radioactive decay products (Cherniak et al. 2009). As radiation damage increases in the crystal lattice, 4He retention generally increases (Shuster et al. 2006; Flowers et al. 2007; Gautheron et al 2009) with annealing of radiation damage expected to have the reverse effect (Shuster and Farley 2008). Flowers et al. (2009) introduced a new proxy for total radiation damage and annealing called effective spontaneous fission track density, defined as a measure of “radiation damage that incorporates contributions from both U and Th decay in proportion to alpha productivity.” This kinematic parameter is easily measured and modeled on specified time-temperature paths for apatites. This kinetic model is called the radiation damage accumulation and annealing model (RDAAM) and specifically tracks the evolution of 4He retentivity in apatite while accounting for both the accumulation and annealing of radiation damage (Flowers et al. 2009). 3.3.6.2 Radiation damage in zircon Zircons naturally have a higher parent nuclide concentration than apatite which can result in higher amounts of radiation damage, particularly in older grains (Wolfe and Stockli 2010;). Reiners (2005) and Reiners et al. (2004) suggest that radiation damage effects may not have a significant influence on 4He diffusion in zircon for low doses of alpha events per gram (< ~ 2–4 × 10¹⁸ α/g). Reiners (2005) summarises that radiation damage effects only become relevant at high accumulated radiation dosages (> 2–4 × 10¹⁸ α/g), with old ages (100’s of Ma), long-term residence at low temperatures, and relatively high U-Th concentrations. Overall, radiation damage promotes 4He loss from zircon (Farley 2002; Nasdala et al. 2004; Reiners 2005) by drastically reducing 4He retentivity of the crystal lattice (Reiners 2005). According to Guenthner et al. (2013), step heating experiments show that radiation damage affects He diffusion in two ways: (1) diffusivity decreases with an alpha dose of ~1 x 10¹⁶ to 5 x 10¹⁷ α/g; this low dosage causes little damage in zircon that results in a decrease in diffusivity due to damage zones blocking preferred c-axis parallel pathways; (2) diffusivity increases rapidly over ~2 x 10¹⁸ α /g; the increasing damage occurs because damage zones become increasingly interconnected and form fast diffusion pathways that permit more rapid transport 67 of 4He (Nasdala et al. 2004; Reiners 2005; Guenthner et al. 2013). Radiation damage could be so severe to eventually lead to non-retention, for example, in high-radiation damage metamict zircons (Nasdala et al. 2004; Reiners 2005); it can also shrink the size of the effective diffusion domain. Radiation damage accumulates at temperatures below ~250°C (Yamada et al. 1995) and is annealed less readily and at higher temperatures in zircon than in apatite (e.g., Weber et al. 1997; Meldrum et al. 1997, 1999; Palenik and Ewing 2002; Ewing et al. 2003; Palenik et al. 2003). The step-heating experiments by Guenthner et al. (2013) have helped to further explain the kinetics of the zircon (U-Th)/He system and identify ways to relate alpha dose, radiation damage, and He diffusivity. A new damage annealing model was developed by Guenthner et al. (2013) that uses an equation for damage annealing and combines damage-diffusivity parameters and date-effective U concentrations to constrain t-T histories. Effective uranium concentration (eU) is a parameter that weights the decay of the two parents (U and Th) for their alpha productivity; it is computed as [U] + 0.235[Th] (Flowers et al. 2009). This model relies on the kinetics of fission track annealing in zircon. The model is quantified with a series of equations similar to Flowers et al (2009) for apatite. 3.3.7 Helium Partial Retention Zone (HePRZ) The HePRZ is the temperature range within which 4He is only partially retained because of the diffusion effects of temperature (Reiners and Brandon 2006). It is further defined by Wolf et al. (1998) as the conditions for which 4He ages fall between 10 and 90% of the holding time. The HePRZ divides the upper crust into three main zones: a lower limit, a middle limit (HePRZ), and an upper limit (Fig. 3.12) (Farley 2002). At a sufficiently high temperature (and greater depth), above the upper limit (Fig. 3.12), 4He ages are zero because decay products are not retained in the mineral because of fast diffusion at high temperatures. Below the lower limit (shallower depth), the age represents the time since cooling as daughter products have been retained. Between the upper and lower limit is the HePRZ where daughter products are only partially retained (Reiners and Brandon 2006). 68 Figure 3.12: Helium partial retention zone (after Wolf et al 1998) The rate at which a sample passes through the HePRZ affects how much 4He is lost. Rapidly cooled samples lose little 4He while slowly cooled samples lose more 4He as 4He loss will accumulate over time. In addition, the slower the cooling of the crystal grain, the more the grain’s sensitivity increases to other factors such as zonation, grain size, and variability of kinematic parameters (Ehlers and Farley 2003). In apatite, the lower limit ranges from depths corresponding to 40°C to surface temperatures; 4 He is retained in this zone and the ages track calendar time (Farley 2002). The upper limit includes depths corresponding to temperatures higher than 80°C (Farley 2002); 4He is lost as quickly as it is produced resetting the (U-Th)/He age. The middle zone ~40 - 80°C is the HePRZ (Farley et al. 1996; Farley 2000; Stockli et al. 2000) where 4He ages are temperature sensitive (Farley 2002). 4He ages will vary both with temperature (depth) and time until a steady-state condition is reached where 4He retention and loss are balanced at each depth (Wolf et al. 1998; Cherniak et al. 2009). Tc in apatite is ~70 °C for apatite (Farley, 2002). Assuming a thermal gradient of 25°C/km, apatite-helium ages record the low-temperature history of the upper ~3 km of the Earth's crust. In zircon, the HePRZ is ~130-200°C (Stockli and Wolfe 2009). Above ~200°C, 4He is not retained in zircon but below ~130°C, 4He is retained and a 4He age can be obtained. Tc for zircon is ~180 °C (Reiners et al. 2004; Reiners, 2005). 69 3.3.8 Correcting for 4He loss Alpha ejection corrections are applied to all apparent or “raw” 4He ages to account for and rectify the loss of alpha particles that were ejected from the crystal rim. Making these corrections helps reduce errors on (U-Th)/He ages that can be as high as several tens of percents (Ehlers and Farley 2003). The main assumption for alpha ejection corrections is that grains have an idealized geometry, such as a tetragonal prism with bipyramidal terminations for zircons (Reiners 2005) or hexagonal geometry for apatite (Ehlers and Farley 2003). Hourigan et al. (2005) introduced the use of crystal geometries with bipyramidal terminations as more realistic crystal shapes (rather than pinacoidal terminations) and this change is attributed to adjusting the alpha ejection correction by about 1-3 percent. Other important assumptions for alpha ejection corrections include: (i) only alpha ejection is considered (implantation from the surrounding matrix is considered to be negligible) (Hourigan et al. 2005) and (ii) that parent nuclides in the dated mineral have a homogeneous spatial distribution (Ehlers and Farley 2003). Zoned crystals are to be avoided, particularly those with high concentrations of U, Th and Sm near the rim, as they will lose more 4He by ejection than a homogeneous ones and are thus not representative of true conditions (Ehlers and Farley 2003). According to Farley (2002), two important factors controlling FT (Farley 1996), the fraction of radiogenic 4He retained in the host grain, are (i) the surface area to volume ratio (β) (size) of the crystal and (ii) the alpha-stopping distance. Once FT is calculated, dividing the measured or raw age by FT will give the alpha-ejection corrected age (Hourigan et al. 2005). Table 3.2 below provides a second-order polynomial relating FT and β for both U and Th series decay for apatite and zircon (prism terminations are ignored in both cases); the coefficients were obtained by Monte Carlo modeling. Equation 3.11 is the equation necessary for the FT calculation. Equation 3.12 calculates a weighted mean to account for the slightly higher alpha retentivity of 238U than 232 Th; the weighting factor is the fraction of 4He derived from each parent. Equation 3.13 provides the solution for the corrected age. (Equation 3.11) 4 Where, β, is the surface to volume ratio, FT, Fraction of He retained in the grain, a, factor for calculating FT. 70 The final equation for a weighted mean FT values for U and Th is (Farley 2002): (Equation 3.12) Where a238, the fraction of 4He derived from 238U. Table 3.2: Geometry and mineral-specific fit parameters for FT calculation (Farley 2002). Assuming an average diameter between 75 and 170 µm, most apatites are expected to have FT (fraction of alpha-particles retained) values of between ~67% and ~85% (Ehlers and Farley 2003). The 4He age is corrected for ejection loss of 4He by applying the FT correction (Equation 3.13), (Equation 3.13) 4 Where, t′, raw uncorrected He age, t, the corrected age (Farley 1996). 3.3.8.1 Special cases for zircon Zonation in zircon Zircon is often zoned, which can be visible or is easily identifiable using processes such as cathodoluminescence imaging, backscatter election imaging, and ion microprobe U-Pb dating (Ehlers and Farley, 2003). Although U-Th inhomogeneity can be present in apatites as well, it is less well documented (Hourigan et al. 2005). In zircons, zonation creates problems such as Urich cores and U-poor rims which cause high 4He retention and can produce too old ages; on the other hand, U-rich rims tend to produce too young ages (Hourigan et al. 2005). 71 Hourigan et al (2005) used numerical modeling to evaluate relationships between 4He retentivity and U-Th distributions for typical styles of zircon zonation for bipyramidal grain shapes, as well as spherical (note that the model only deals with alpha-ejection for quickly cooled zoned samples and does not treat the combined effect of alpha-ejection and 4He diffusion). The final result is the introduction of a new parameter, FZAC, the bulk 4He retentivity for an entire grain, which is a weighted average involving integration over a 3-dimensional grid (Equations 3.14 and 3.15). This new estimate includes the effect of zoning and deals with more realistic 3dimensional grain morphologies: (Equation 3.14) Where, am(xi, yj, zk), alpha-productivity for an isotope m at position xi, yj, zk, given by (Equation 3.15) Where, αm, number 4He produced by the mth decay chain (serves as the weighting factor for the function fm(xi, yj, zk)), λm, the decay constant, Cm, isotopic concentration fm(xi, yj, zk): local retentivity for isotope m at position xi, yj, zk, ∑, summation over a full range for the indices I, j, k and m, M, 238U, 235U, 232Th, and 147Sm, subscript ZAC, “zonation-dependent alpha correction” Spherical model Hourigan et al. (2005) also modified a spherical model (for rounded grains) originally proposed by Farley et al. (1996) for FT as a function of both crystal size and variable source distribution. The modification allows for inputting arbitrary distributions of 238U and 232Th and provides a reasonable estimate of bulk alpha retentivity (Equation 3.16). (Equation 3.16) Where, ri, radial distance from the center of the sphere = ∆i, ∆, spacing between nodes, r, radius of the sphere Idiomorphic crystal model The typical form of zircon is a pyramidally terminated tetragonal prism (Fig. 3.13). To estimate FZAC accounting for tip heights Hourigan et al. (2005) constructed 3-dimensional matrices of am(xi, yj, zk) and fm(xi, yj, zk) specified all over the grain, with the origin in the centre of the grain. Grain dimensions are calculated the normal way, except this time including tip heights. 72 Including tip height allows for the construction of the idiomorphic, bipyramidal tetragonal prism model crystal. Figure 3.13: Geometry of the idiomorphic zircon crystal model which includes tip height (Hourigan et al. 2005). 73 3.4 Thermochronological results 3.4.1. Sample location and description Twenty samples located along an approximately 50 km-long transect across the SMC and Monashee complexes from Sicamous to Revelstoke (Fig. 3.14), British Columbia, were processed for low temperature thermochronology (Appendices 1 - 3). This transect was chosen because it exposes a range of structural levels parallel to the extensional fault slip direction. Of these, 12 samples yielded grains of adequate size, quality, and quantity for apatite (U-Th)/He, 19 for zircon (U-Th)/He, and 15 for apatite fission track (AFT). In total, 17 samples yielded usable thermochronometric results (Table 3.3). Table 3.3 Sample location and description Sample Structural location Lithology Latitude (N) Longitude (W) RS1201 CRF hanging wall Pegmatite 51° 0' 34" 118° 12' 25" Elevation (m) 469 RS1202 CRF hanging wall Dioritic gneiss 51° 2' 49" 118° 11' 30" 566 RS1203 CRF hanging wall Garnet-sillimanite quartzofeldspathic paragneiss 51° 0' 10" 118° 13' 58" 457 RS1204 Monashee complex Sillimanite gneiss with pegmatite 50° 57' 58" 118° 21' 51" 556 RS1205 Monashee complex Sillimanite-biotite granite gneiss 50° 57' 26" 118° 24' 1" 538 RS1206 SMC Sillimanite gneiss 50° 57' 8" 118° 24' 17" 553 RS1207 SMC Quartz-plagioclasebiotite-sillimanite paragneiss 50° 58' 12" 118° 34' 26" 441 RS1208 SMC Pegmatite gneiss 50° 59' 32" 118° 38' 20" 484 RS1209 SMC Quartzitic gneiss 50° 58' 31" 118° 43' 29" 375 RS1210 SMC Amphibolitic gneiss 50° 53' 20" 118° 51' 24" 360 BV1229 SMC Hornblende-plagioclasebiotite diorite 50° 50' 48" 118° 51' 57" 1341 BV1228 OVsz Biotite-garnet gneiss 50° 50' 13" 118° 56' 50" 500 BV1217 OVsz Dioritic gneiss 50° 47' 58" 119° 0' 12" 363 BV1218 OVsz Quartzite and quartzitic gneiss 50° 48' 6" 118° 59' 53" 352 BV1221 OVsz Quartzite 50° 48' 13" 118° 59' 31" 343 BV1223 OVsz hanging wall Hornblende-dioritic gneiss 50° 53' 44" 118° 57' 52" 1264 BV1227 OVsz hanging wall Dioritic schist 50° 48' 50" 119° 2' 43" 485 74 Figure 3.14: Location and geology of the study area (modified after Johnson 2006). A) The map in inset depicts the five morphogeological belts of the Canadian Cordillera and the location of the Shuswap Metamorphic Complex (in green) within the Omineca belt. Labelled black circles indicate sample name and location. B) The geological cross-section shows the sample locations relative to key tectonic features including the Okanagan Valley shear zone (OVsz), the Monashee decollement (MD), and the Columbia River fault (CRF). Numerical age results and associated 1-σ (AFT) and statistical (AHe and ZHe) errors are reported for the different samples in white (light to heavy grey) boxes for AHe (AFT and ZHe) thermochronometers, respectively. Black stippling pattern represents the aproximate width of the shear zone for the OVsz and MD. 75 Samples from this study were collected at similar elevations ranging from 343 to 566 m, except for two samples located at higher elevations (Figure 3.15). BV1223, in the hanging wall of the OVsz, was collected at an elevation of 1264 m, and BV1229, in the western region of the SMC, at an elevation of 1341 m. Figure 3.15 shows sample elevation distribution with respect to their horizontal distance with the surface trace of the OVsz. Figure 3.15: Horizontal distance of sample from OVsz plotted against elevation. Blue diamonds represent samples from the hanging wall of the Okanagan Valley shear zone (OVsz-HW); red squares from the OVsz; green triangles from the Shuswap metamorphic complex (SMC); purple X’s from the Monashee complex (MC); and blue asterisk represents samples from the hanging wall of the Columbia River fault (CRF-HW). 76 3.4.2 Description of thermochronological ages 3.4.2.1 AHe age results Twelve AHe ages were obtained for this study. The mean AHe ages range from 32.1 ± 2.4 Ma to 2.6 ± 1.0 Ma (Table 3.4). AHe ages form a continuum, with samples in the west yielding older ages than samples in the east of the study area. Five single-grain aliquots were selected for analysis for each samples, except RS1206, which contained only three aliquots because of its low apatite yield. AHe aliquot ages are reported at the 1σ-level, while the mean AHe ages are reported with statistical errors, which are calculated using the standard deviation between selected aliquots divided by the square root of the number of aliquots. Mean AHe ages were calculated from aliquots that produced complete data; aliquots that were not used in the age calculation are highlighted in grey in Table 3.4. The AHe dataset provides ages across the main structural units (Columbia River fault hanging wall, Monashee complex, SMC, OVsz, and the hanging wall of the OVsz) of the study area. Hereafter, results are described from east to west. In the hanging wall of the Columbia River fault, RS1202 yielded an age of 5.2 ± 1.1 Ma that was based on all five aliquots. In the Monashee Complex, one of the two sample ages available, RS1205, also yielded an age based on all five aliquots, 9.0 ± 1.3 Ma. The second sample, RS1204, which contains grains that appear to be inclusion- and defect-free produced an age based on only one aliquot (the remaining four aliquots were reported to have problematic He data because no He was recorded). In the SMC, although five aliquots were processed for RS1208, only three produced ages while the other two were reported to have problematic (no) He data. Of the three ages for RS1208, the first, 42.5 ± 2.4 Ma, is an outlier when compared to the ages yielded by the other two aliquots (3.6 ± 1.6 Ma, 1.6 ± 0.7 Ma); this outlier was removed from the mean age calculation for this sample. In the OVsz, the mean age for sample BV1217 is based on only three of five aliquots; the other two aliquot ages were outliers (16.4 ± 1.1 and 91.2 ± 3.8 Ma) and were discarded from the mean 77 age calculation. Upon further investigation, the discarded aliquots were found to have some fractures and minor abrasions on their surfaces that could have adversely affected their ages. For BV1218, two aliquots were also removed from the mean age calculation because they produced ages that were outliers (94.7 ± 1.7 and 11.0 ± 1.1). These aliquots also contained minor fractures and abrasions on their surfaces that could have lead to potential age inaccuracies. Additional factors that could have lead to problematic data include minor inclusions that were unobservable under the microscope, zoning of uranium in the samples, and potential radiation damage. No AHe data are available for the hanging wall of the OVsz because suitable grains were unavailable in BV1223 and BV1227. Where multi-thermochronometer data is available, AHe ages are younger than AFT ages in all cases. This is an expected result as AHe closure temperature and sensitivity occurs at lower temperatures than for AFT. 78 Table 3.4: Apatite (U-Th)/He results Name 238U (mol) 232Th (mol) 4He (mol) 79 Mean radius (µm) 36.50 Raw age (Ma) Ft Corrected age (Ma) 1.67E-15 Mean length (µm) 117.6 3.96 0.63 6.30 Age error (1 σ) 0.37 Mean age (Ma) Mean age error RS1202_AP1 3.192E-13 3.008E-14 5.2 [5] 1.1 RS1202_AP2 2.083E-13 3.953E-14 9.03E-16 115.15 33.75 3.22 0.61 5.31 0.69 RS1202_AP3 RS1202_AP4 1.564E-13 3.627E-14 4.43E-16 102.8 39.60 2.08 0.64 3.26 0.81 2.788E-13 1.867E-14 5.97E-16 104.55 43.55 1.63 0.66 2.46 0.47 RS1202_AP5 5.025E-13 1.022E-13 4.05E-15 139.25 44.93 5.96 0.69 8.65 0.62 RS1204_AP2 1.232E-13 1.008E-13 3.56E-16 113.95 51.15 1.88 0.70 2.70 0.84 2.7 [1] 0.8 RS1205_AP1 2.269E-12 5.259E-14 2.52E-14 207.95 99.35 8.89 0.87 10.28 0.22 9.0 [5] 1.3 RS1205_AP2 3.321E-13 1.377E-14 1.87E-15 124.1 58.45 4.49 RS1205_AP4 7.668E-13 3.419E-14 1.07E-14 199 80.4 11.12 0.78 5.78 0.50 0.84 13.20 0.46 RS1205_AP5 5.038E-13 1.799E-14 4.44E-15 146.5 61.05 7.04 0.79 8.93 0.67 RS1205_AP6 2.329E-13 2.776E-14 1.43E-15 105.2 48.70 4.81 0.74 6.54 0.43 RS1206_AP1 5.025E-13 3.321E-14 7.77E-15 145 48.38 11.78 0.71 16.64 0.66 14.3 [3] 2.1 RS1206_AP3 1.798E-12 7.315E-14 RS1206_AP4 4.912E-13 1.813E-14 3E-14 216.6 66.28 12.78 0.79 16.27 0.45 4.34E-15 127.2 43.20 6.78 0.68 10.03 0.64 RS1207_AP1 2.985E-13 2.102E-14 RS1207_AP2 2.527E-13 9.983E-15 2.87E-15 115.7 53.53 7.32 0.71 10.27 0.65 7.9 [5] 0.7 1.49E-15 102.3 45.63 4.52 0.67 6.73 0.66 RS1207_AP3 6.013E-13 4.435E-15 5.31E-15 180.45 61.90 6.82 0.77 8.90 0.69 RS1207_AP4 RS1207_AP5 3.234E-13 2.006E-15 2.04E-15 139.1 55.95 4.88 0.73 6.64 0.51 3.959E-13 5.668E-15 2.33E-15 117.95 43.13 4.54 0.67 6.77 0.46 RS1208_AP6 3.948E-14 5.789E-14 2.08E-15 99.6 47.25 31.37 0.74 42.44 2.38 2.6 [2] 1.0 RS1208_AP8 4.097E-14 6.927E-14 1.99E-16 126.4 52.35 2.79 0.77 3.63 1.58 RS1208_AP9 9.067E-14 1.224E-13 1.82E-16 128.6 61.3 1.22 0.79 1.55 0.71 79 Name 238U (mol) 232Th (mol) 4He (mol) 1.5E-15 Mean length (µm 149.1 Mean radius (µm) 55.78 80 Raw age (Ma) Ft Corrected age (Ma) 9.99 0.74 13.57 Age error (1 σ) 1.14 RS1209_AP1 1.107E-13 2.366E-14 RS1209_AP2 1.019E-13 RS1209_AP3 1.218E-13 7.086E-15 1.24E-15 144.8 1.231E-14 1.82E-15 128.6 45.53 9.26 0.70 13.32 1.37 46.40 11.28 0.69 16.33 1.45 RS1209_AP4 3.025E-13 2.484E-14 2.97E-15 135.85 53.45 7.45 0.72 10.30 0.76 RS1209_AP5 3.004E-13 2.029E-14 5.65E-15 146.85 46.23 14.31 0.70 20.48 1.17 RS1210_AP1 5.576E-13 6.142E-14 4.18E-15 171.15 75.60 5.66 0.79 7.13 0.42 RS1210_AP2 RS1210_AP3 1.415E-12 7.233E-14 1.56E-14 247.4 80.58 8.42 0.82 10.29 0.26 2.488E-13 4.517E-14 1.93E-15 111.55 50.55 5.76 0.70 8.25 0.62 RS1210_AP4 4.706E-13 1.592E-14 4.11E-15 124.45 45.03 6.70 0.68 9.81 0.88 RS1210_AP5 2.195E-13 3.971E-14 1.92E-15 161.3 65.85 6.49 0.77 8.44 0.62 BV1217_AP1 9.298E-14 1.522E-14 1.5E-15 104.82 50.15 12.5 0.76 12.44 1.14 BV1217_AP2 1.263E-13 3.25E-14 1.06E-14 130 41.75 60.81 0.67 91.17 3.80 BV1217_AP3 1.274E-13 1.022E-14 8.05E-16 119.15 44.43 4.80 0.68 7.09 1.06 BV1217_AP4 4.037E-13 1.407E-14 2.5E-15 125.7 43.90 4.75 0.68 7.01 0.44 BV1217_AP5 1.392E-13 1.566E-14 8.61E-16 134.1 42.60 4.66 0.68 6.91 0.99 BV1218_AP1 8.887E-13 2.337E-13 8.85E-14 140.85 66.35 72.73 0.76 94.66 1.69 BV1218_AP2 2.85E-12 6.444E-13 8.85E-14 191.25 81.18 22.79 0.81 28.20 0.66 BV1218_AP3 1.593E-12 3.792E-13 3.57E-14 161.15 65.68 16.41 0.77 21.37 0.36 BV1218_AP4 1.017E-13 1.616E-14 9.66E-16 92.25 42.28 7.09 0.65 11.00 1.06 BV1218_AP5 3.739E-13 3.692E-14 6.08E-15 94.7 41.15 12.28 0.64 19.16 1.00 BV1228_AP5 2.706E-13 3.309E-14 4.13E-15 98.45 42.28 11.48 0.65 17.64 0.92 BV1228_AP1 3.634E-13 6.754E-14 8.37E-15 106.25 50.38 17.05 0.69 24.61 1.13 BV1228_AP2 3.942E-13 5.871E-14 5.18E-15 121.7 43.20 9.83 0.67 14.63 0.68 BV1228_AP3 5.651E-13 4.466E-14 1.14E-14 157 62.93 15.31 0.76 20.11 0.72 BV1228_AP4 7.676E-13 8.142E-14 1.8E-14 164.4 60.25 17.68 0.76 23.38 0.80 80 Mean age (Ma) Mean age error 14.8 [5] 1.7 8.8 [5] 0.6 7.0 [3] 0.1 22.9 [3] 2.7 20.1 [5] 1.8 Name 238U (mol) 232Th (mol) 4He (mol) Mean radius (µm) 46.23 Raw age (Ma) Ft Corrected age (Ma) Age error Mean age (Ma) Mean age error 1.07E-14 Mean length (µm 147.9 BV1229_AP1 2.854E-13 2.088E-14 28.42 0.70 40.66 1.59 32.1 [5] 2.4 BV1229_AP2 3.548E-13 BV1229_AP3 1.581E-13 8.151E-14 1.16E-14 140.5 54.15 23.98 0.73 32.98 1.18 1.64E-14 3.99E-15 116.9 50.03 19.04 0.70 27.20 1.61 BV1229_AP4 2.451E-13 1.655E-14 6.96E-15 114.15 44.68 21.59 0.68 31.98 1.40 BV1229_AP5 2.159E-13 1.375E-14 5.58E-15 139.3 50.95 19.67 0.72 27.48 1.56 81 Samples were processed at University of California Santa Cruz (Appendices 1 and 2). Five aliquots were processed per sample. Mean ages are the mean of selected aliquots, and the age error is the standard deviation between selected aliquots divided by the square root of the number of aliquots. The number in parentheses next to the mean age represents the number of aliquots used to calculate the mean age. Aliquots discarded for the age calculation are highlighted in light grey. 81 3.4.2.2 AFT age results Fifteen AFT ages (Table 3.5) were obtained for this study. The central ages range from 37.8 ± 4.2 to 19.2 ± 2.2 Ma. Similar to the AHe dataset, ages form a continuum with samples in the west yielding older ages than samples in the east of the study area. All samples passed the X2 test (>5% probability) (Galbraith 2005) meaning that the single-grain ages obtained are consistent with a common age for each sample. The central age was obtained by counting at least 20 grains for each sample, except for RS1201 in the hanging wall of the Columbia River, with 19 countable grains, and BV1221 in the OVsz where only nine countable grains were found on the mount. Three samples have large errors, BV1221 (26.5 ± 4.7 Ma) from the OVsz, and both samples from the hanging wall of the OVsz, BV1223 (37.8 ± 4.2 Ma) and BV1227 (35.4 ± 3.1 Ma) reflecting the large dispersion of the singlegrain ages for each sample. Apatite grains from these samples were fractured, contained numerous crystal defects and deformities (as observed under the microscope), had low uranium content, and were not adequately polished. Thus, the resulting large age errors may reflect the difficulty to consistently count the spontaneous tracks for these samples. Uranium content ranged from 11.42 – 76.32 ppm (Table 3.5). The lowest uranium levels are found in the western part of the study region: in the SMC in samples RS1208 (11.42 ppm) and RS1209 (14.94 ppm), in the OVsz in sample BV1221 (14.91 ppm), and both samples of the hanging wall of the OVsz, BV1223 (12.48 ppm) and BV1227 (16.22 ppm). These samples all contained low spontaneous track densities on grain mounts and low numbers of subhorizontal confined track lengths, as is expected with grains depleted in uranium. Some of these samples also contained uneven distribution of fission tracks on the external detector (mica), compelling evidence that there was an inhomogeneous distribution of uranium throughout the grain. In this case, grains with near-homogeneous distribution of uranium were pre-selected for counting purposes. Average Dpar values for the region range from 1.53 ± 0.04 m to 2.38 ± 0.04 m, with the largest Dpar values occurring in the western part of the transect. Dpar is the arithmetic mean fission-track etch figure diameter parallel to the crystallographic c-axis (Donelick et al. 2005). For each individual sample, Dpar error values were similarly low (Table 3.5), ranging from 0.02 82 0.05 m suggesting apatites in each sample were of similar chemical composition and therefore have similar annealing behaviours. 83 Table 3.5: Apatite fission-track results Sample Number of grains Spontaneous Track Density Induced Track Density Dosimeter Track Density s x 105 cm-2 i x 105 cm-2 d x 105 cm-2 (Ns) (Ni) (Nd) P(2) (%) Central Age ± 1 U (ppm) (Ma) Confined TrackLengths (TL) MTL (c-Axis Not Corrected) m ± 1 MTL STD m MTL (c-Axis Corrected) (MTL STD) m Dpars m Dpar error m 84 RS1201 19 0.693 (283) 7.81 (3189) 1.36 (9161) 63.16 22.2 ± 1.6 76.32 24 13.00 ± 0.61 3.00 14.17 ± 1.47 1.94 0.03 RS1202 20 0.362 (175) 3.76 (1818) 1.37 (9161) 83.64 24.2 ± 2.1 35.03 24 11.81 ± 0.46 2.23 14.17 ± 1.51 1.93 0.03 RS1203 27 0.379 (380) 4.77 (4788) 1.38 (9161) 72.10 20.0 ± 1.2 46.55 36 12.64 ± 0.44 2.63 14.17 ± 1.49 1.95 0.02 RS1204 25 0.559 (810) 6.31 (9132) 1.38 (9161) 8.12 22.7 ± 1.4 61.1 32 11.88 ± 0.30 1.70 13.9 ± 1.04 1.95 0.04 RS1205 25 0.318 (326) 3.86 (3959) 1.39 (9161) 90.45 21.0 ± 1.4 36.87 9 12.31 ± 0.38 1.15 - 1.53 0.04 RS1206 22 0.598 (977) 6.35 (10365) 1.40 (9161) 42.32 24.1 ± 1.1 59.19 33 12.51 ± 0.38 2.20 14.30 ± 1.30 2.38 0.04 RS1208 23 0.093 (89) 1.24 (1188) 1.40 (9161) 99.17 19.2 ± 2.2 11.42 7 11.15 ± 0.60 1.58 - 1.88 0.03 RS1209 RS1210 23 0.134 (114) 1.57 (1333) 1.41 (9161) 65.20 22.0 ± 2.3 14.94 - - - - 1.79 0.03 20 0.421 (416) 3.16 (3117) 1.42 (9161) 96.55 34.6 ± 2.1 30.31 26 13.16 ± 0.28 1.41 14.61 ± 0.94 2.23 0.02 BV1218 25 0.889 (982) 6.64 (7339) 1.31 (9161) 79.87 32.1 ± 1.5 59.43 30 12.20 ± 0.44 2.41 14.19 ± 1.31 2.05 0.03 BV1221 9 0.162 (36) 1.48 (329) 1.32 (9161) 76.30 26.5 ± 4.7 14.91 1 12.21 - - 1.90 0.05 BV1223 30 0.183 (101) 1.18 (653) 1.33 (9161) 57.01 37.8 ± 4.2 12.48 - - - - 1.91 0.04 BV1227 23 0.255 (175) 1.77 (1214) 1.34 (9161) 28.31 35.4 ± 3.1 16.22 4 13.02 ± 0.65 1.30 - 1.94 0.04 BV1228 29 0.421 (708) 3.62 (6088) 1.35 (9161) 71.65 28.8 ± 1.5 34.77 29 12.81 ± 0.38 2.05 14.71 ± 1.04 2.21 0.02 BV1229 35 0.431 (515) 2.88 (3449) 1.36 (9161) 95.34 36.7 ± 2.2 27.18 65 14.03 ± 0.19 1.50 14.86 ± 1.39 2.13 0.04 Samples were processed at Dalhousie University (Appendices 1 and 3). Central ages were calculated by analysing approximately 20 grains and using a weighted mean Zeta calibration factor (Hurford and Green, 1983) based on 7 IUGS age standards of Durango apatites (Miller et al., 1985; Hurford, 1990) with a stable ζ of 367.0 ±10.3 for the operator (B.Louis) (Appendix 5). Track-length distributions were obtained by measuring subhorizontal confined tracks and the angle between each track and the crystal’s c-axis in apatite mounts. Annealing properties of the apatites were characterized by averaging four Dpar measurements from each analysed crystal, when available (Donelick et al., 1999; Ketcham et al.,1999). All samples passed the Chi Square test (P > 5%) indicating that the single-grain ages are consistent with a common age for each sample. Abbreviations are: Ns, number of spontaneous tracks counted;Ni, number of induced tracks counted; Nd, number of tracks counted in the dosimetry glass; MTL, Mean Track Length. 84 Confined track lengths Samples that yielded more than 20 confined track length measurements were used for thermal modeling. The mean track lengths (MTL) (not C-axis corrected) range from 11.15 ± 0.60 m (STD 1.58 m) to 14.03 ± 0.19 m (STD 1.50 m). The mean track lengths (C-axis corrected) are also long and ranged from 13.90 (STD 1.04 m) to 14.86 (STD 1.39 m) which suggests that all samples cooled rapidly through the PAZ. 3.4.2.3 ZHe age results Of the 19 samples run for zircon (U-Th)/He, only five sample results are presented here because the other 14 (Appendix 4) were run in batches that yielded incorrect standard ages and therefore had to be discarded. Of the five remaining samples, the mean ZHe ages obtained range from 43.8 ± 1.4 to 40.7 ± 1.8 Ma (Table 3.6). In the Monashee Complex, although four aliquots were available for sample RS1203, the fourth aliquot produced an age that was significantly younger and was removed from the mean ZHe age calculation. The data indicate that this aliquot was depleted in He, Th, and U as compared to the others. An investigation of the grain photos does not show any significant physical features that could have contributed to this lower age. Other factors that could have contributed to this age anomaly include potential zonation of uranium and radiation damage. The remaining ZHe samples were taken from the SMC. Five aliquots were available for RS1209 but the fifth aliquot produced an age that was much lower than the others (Table 3.6); this aliquot was therefore removed from the mean age calculation. The data further show that the He, U, and Th content was significantly lower in this aliquot. A review of grain photos for this aliquot shows a euhedral bipyrimidal grain with few inclusions, acceptable conditions for (UTH)/He dating. Factors that can contribute to this anomalous age as mentioned before, can include uranium zonation and radiation damage. 85 Table 3.6: ZHe results Name He (pmol) U (ng) Th (ng) Th/U Raw age (Ma) Rs (mm) RS1201-1 3.02E-12 17.13 0.29 0.02 32.22 59.50 Corrected age (Ma) 42.81 RS1201-2 2.89E-12 17.64 0.63 0.04 29.81 41.49 40.34 RS1201-3 1.86E-12 10.20 0.13 0.01 33.31 50.93 44.91 RS1201-4 5.55E-12 31.27 0.32 0.01 32.50 59.52 42.46 RS1203-1 2.29E-13 1.13 0.13 0.11 36.32 70.51 49.38 RS1203-2 2.23E-13 1.52 0.14 0.09 26.50 36.88 39.75 RS1203-3 5.52E-14 0.44 0.10 0.23 21.83 33.16 33.54 RS1203-4 8.17E-15 0.14 0.02 0.13 10.33 48.75 13.58 RS1208-6 4.66E-13 2.18 0.63 0.29 36.82 56.16 48.65 RS1208-7 4.08E-13 2.17 0.23 0.11 33.74 75.38 42.42 RS1208-8 3.79E-13 1.97 0.25 0.13 34.33 54.53 44.93 RS1208-9 1.71E-13 0.96 0.13 0.13 31.80 48.24 43.34 RS1208-10 1.58E-13 0.95 0.22 0.24 29.05 46.31 39.67 RS1209-3 4.88E-13 2.67 1.02 0.38 30.83 40.29 42.08 RS1209-4 5.31E-13 3.04 0.62 0.20 30.68 41.76 40.94 RS1209-5 1.75E-12 8.61 1.59 0.18 35.71 40.74 47.71 RS1209-6 1.07E-12 5.67 1.63 0.29 32.55 55.20 42.62 RS1209-7 9.11E-14 0.86 0.02 0.02 19.50 47.57 26.09 RS1210-1 2.22E-13 1.11 0.50 0.45 33.30 48.70 42.50 RS1210-2 5.22E-13 2.96 0.68 0.23 30.72 56.19 38.86 Mean age (Ma) Age error (1s) (Ma) 42.6 [4] 0.9 40.9 [3] 4.6 43.8 [5] 1.5 43.3 [4] 1.5 40.7 [2] 1.8 Samples were processed at University of California Santa Cruz (Appendices 1 and 2). Five aliquots were originally processed per sample. Mean ages are the mean for selected aliquots, and the age error is the standard deviation between selected aliquots divided by the square root of the number of aliquots. The number in parentheses next to the mean age represents the number of aliquots used to calculate the average age. Aliquots discarded from the age calculation are highlighted in light grey. 86 3.4.3 Trends in thermochronological ages Figure 3.16 highlights the relationship between sample age and distance across the study area. The x-axis represents the horizontal distance along the studied transect, with the surface position of the OVsz as a reference (0 value). Two main trends are be observed: 1) The youngest ages are represented by the AHe data and range from 32.1 ± 2.4 to 2.6 ± 1.0 Ma (Figure 3.16a); it is also important to note that the AHe data show the largest range in values. The oldest ages in the study region are represented by the ZHe data and range from 43.8 ± 1.5 to 40.7± 1.8 Ma (Figure 3.16c). The AFT ages are generally older than the AHe ages and younger than the ZHe ages and range from 37.8 ± 4.2 to 19.2 ± 2.2 Ma (Figure 3.16b). In addition, for each sample containing multithermochronometric data, AHe ages are always the youngest and the ZHe ages are always the oldest (Fig. 3.16), as is expected. 2) Importantly, apparent cooling ages are younger in the eastern region (hanging wall of the Columbia River fault, Monashee complex) and older in the west (SMC and within the OVsz or in its hanging wall). 87 Figure 3.16: Apparent cooling ages plotted against horizontal distance, relative to their position from the Okanagan Valley sheer zone (OVsz), the Monashee Decollement (MD) and the Colombia River Fault (CRF) which are represented by the vertical dashed lines with (a) AHe data, (b) AFT data and (c) ZHe data. Positive (negative) distance is to the east (west) in the footwall (hangingwall) of the Okanagan Valley shear zone. The general trend is that sample ages decrease eastwards (a) AHe ages range from 32-2 Ma. (b) AFT ages range from 37.8 - 19.2 Ma. (c) ZHe data and range from 34.1-48.2 Ma. 3.4.3.1 AHe cooling age distribution The main trend observed in the AHe dataset is that ages are older toward the western part of the transect (Figure 3.16a). The first sample in the east of the transect, in the hanging wall of the Columbia River fault (RS1202), has yielded an AHe age of 5.2 ± 1.1 Ma, younger than that of RS1205 (9.0 ± 1.3 Ma) located in the Columbia River fault footwall (Monashee complex). The fact that the footwall age is older than that of the hanging wall suggests that the Columbia River fault, which is a eastward dipping normal fault, was not active at the time of cooling of these samples. Further west in the SMC, there is a large dispersion of AHe ages (Fig. 3.16a). Recall from Chapter 2 that the activity of the Monashee decollement ended by Late Paleocene so it is expected that the Monashee complex and SMC cooled as a single unit during the post orogenic extension (<58 Ma). Across the Victor Creek fault (westward steeply dipping normal fault) (Figure 3.13b), the age of sample RS1206 (14.3 ± 2.1 Ma) located in the hanging wall is older than that of sample RS1205 (9.0 ± 1.3 Ma) in the footwall (Figure 3.16) suggesting that the Victor Creek fault was likely active during the time of cooling of samples RS1205 and RS1206 (Figure 3.13b). Further westward along the transect, the AHe ages are younger in the mid SMC region (Fig. 3.13) in samples RS1207 and RS1208 (7.9 ± 0.7 and 2.0 ± 0.8 Ma, respectively, and older again in RS1209 (14.8 ± 1.7 Ma) which is closer to the OVsz. RS1209, RS1210, and BV1229 are the three western-most samples in the SMC. Sample RS1210 shows that the AHe age drops again to 8.8 ± 0.6 Ma but then increases again in BV1229 to the oldest AHe age obtained. BV1229 is further from the OVsz than either RS1209 or RS1210 and is at an elevation of 1341 m, the highest elevation sampled in the study area (Fig. 3.15). Finally, there appears to be a sharp age gradient across the OVsz where AHe ages range from 7 ± 0.05 Ma (BV1217) to 20.1 ± 1.83 (BV1228) to 22.9 ± 2.72 Ma (BV1218) within the OVsz. However, the age of BV1217 appears to be anomalously low for this zone, given its close proximity to BV1218. 88 3.4.3.2 AFT cooling age distribution AFT data follow a similar trend to the AHe data (Fig. 3.16b) with the youngest AFT ages located in the eastern part of the transect and an abrupt increase in ages in the proximity of the OVsz (Figure 3.16b). The youngest AFT age is found on the mid SMC region (Fig. 3.14) in sample RS1208 (19.2 ± 2.2 Ma), similar to the trend observed in the AHe dataset. The ages of the three samples in the western-most region of the SMC, RS1209, RS1210, and BV1229 increase consistently westward from 22.0 ± 2.3 Ma, 34.6 ± 2.1 Ma, to 36.7 ± 2.2 Ma, respectively). BV1229, also at the highest elevation, has the oldest AFT age in the region; this is a similar trend to that observed in the AHe dataset. AFT ages in the OVsz are similarly as old as ages in the western region of the SMC and range from 26.5 ± 4.7 Ma (BV1221) to 32.1 ± 1.5 Ma (BV1218). The two samples in the hanging wall of the OVsz range in age from 35.4 ± 3.1 to 37.8 ± 4.2 Ma (BV1227 and BV1223, respectively) (Fig. 3.16b). The ages obtained from the hanging wall of the OVsz are comparable to the ages of the footwall of this fault could mean that samples have experienced some shear heating due to fault activity. Overall, the AFT ages may be divided into two main cooling age populations: 19-24 Ma in the footwall of the OVsz and 25-38 Ma in the OVsz and its hanging wall (Fig. 3.16b). 3.4.3.3 ZHe cooling age distribution Although only five reliable ZHe cooling ages were derived from this study, the overall trend observed suggests that, within error, ages are similar along the transect (Figure 3.16b). This age distribution is similar to that of 40Ar-39Ar data of Allen (2013) (discussed in Chapter 4). 89 CHAPTER 4: INVERSE THERMAL MODELING WITH HeFTy 4.1. Introduction Inverse thermal modeling is an invaluable tool that can be used to unravel the thermal history of a region from thermochronological data. Apparent cooling ages obtained from low temperature thermochronological analyses may correspond directly to a specific geological thermal event, or if the rock sample’s thermal history is sufficiently complicated, apparent ages may need to be further analysed to interpret their true geological meaning. Inverse thermal modeling provides the analyst the opportunity to ultimately interpret age data in terms of geological processes. As explained in Chapter 3, daughter products from thermochronometric systems are lost or altered by a combination of time-dependent temperature-sensitive factors (e.g. Ketcham 2005, Reiners and Brandon 2006; Reiners and Shuster 2009). For several thermochronometers this sensitivity to heat over time has been systematically explored in a laboratory setting to produce annealing kinetic models (e.g. Ketcham 2007; Flowers et al. 2009; Ketcham 2011; Guenthner et al 2013) that allow analysts to predict time and temperature controls on fission track annealing and helium diffusion, the two systems used in this study. These kinetic models are critical for reconstructing the thermal history of samples based on thermochronological age data and information about the regional geology of the study area (Ketcham 2005). Two main types of thermal models can be constructed; forward models and inverse models. Forward models predict how a thermochronometric system can evolve over time (to the end condition) given a particular starting point and subsequent pre-determined time-temperature history (Ketcham 2005). The analyst can predict the expected apparent ages for a sample undergoing a specified thermal history and can compare these predictions to measured data (apparent ages) (Ketcham 2013). This process is useful for understanding how ages may vary with changing initial conditions and / or thermal histories and for determining which thermochronometric systems can best differentiate between specific thermal histories (Ketcham 2013). 90 Inverse models, used in this study, determine the time-temperature history for a given time span between one or more measurements describing end or present day condition(s) and an assumed starting condition (Ketcham 2005). Inverse modeling is data driven, and includes various inputs such as cooling ages, present-day temperature and assumed initial thermal conditions well as a variable number of time-temperature constraints based on independent geological information. At the end of the thermal modeling process, several (tens to hundreds of thousand) time-temperature paths (or forward models) that are consistent with input parameters/ data are generated, from which the thermal history that best matches the input data is selected. The strength or reliability of the model depends largely on the quality of the input data and constraints confirming that a strong thermochronological dataset is the first important step for thermal modeling (Ketcham 2005). Inverse thermal models have five basic features in common (Ketcham 2005): (1) a theoretical annealing model to predict how a thermochronometric system will behave as a function of temperature and time; (2) an algorithm to continuously calculate the model evolution over the time-temperature path; (3) a statistical way to compare model calculations to measurements; (4) a strategy to search for best-fit scenarios by testing model thermal histories against data; (5) a way to show the range of possible thermal histories that fit the measured data. 4.2 HeFTy HeFTy is a modeling software that calculates a range of thermal histories consistent with data and constraints using forward and inverse modeling (Ketcham 2013). This study uses inverse modeling to define the time-temperature paths within specific time-temperature constraints defined by the user (Fig. 5.1). In HeFTy, inverse modeling is a multi-step process whereby a large number of forward models first produce predicted thermochronometer results which are then compared to the measured values for each forward model (Ketcham 2013). The timetemperature histories are then constrained by using the good and acceptable forward models obtained from the measured data. HeFTy is capable of calculating thermal histories of multiple thermochronometric systems that describe a single sample or locality (Ketcham 2013). The version of HeFTy used for this project is designed for a Windows platform, uses Monte Carlo inversion, and can derive cooling histories 91 from combined sources including apatite and zircon fission track, (U-Th)/He thermochronometric systems, and vitrinite reflectance data. 4.2.1 Input data, assumptions, and constraints Apart from input data, assumptions and constraints need to be defined for each HeFTy model. The assumptions for HeFTy are that the input data are good, data are adequate, and the geological knowledge of the study area is sufficient either to add appropriate constraints to the model and/or to assess the quality of the numerical outputs. Constraints in the timetemperature field represent regions that the thermal history must pass through and are represented by time-Temperature boxes defined from the thermochronometric data collected by the study as well as by geological constraints (Fig. 4.1). Constraints help optimize the modeling process by narrowing the search and provide the most reliable outputs. The initial temperature condition should be sufficiently high to ensure the total annealing (of fission tracks) or that no 4He is retained in the crystals (Ketcham 2005). Sufficiently high temperatures are greater than the upper limit of the PAZ/PRZ to ensure annealing of the most resistant apatite and negligible retention for the most retentive (U-Th)/He thermochronometer. The final constraint is the present-day temperature at which the sample was collected at the surface; this is typically the mean annual temperature of the study area. (2) (3) (1) 92 Figure 4.1: Example of time-temperature constraints from HeFTy (Ketcham, 2005). Four time-temperature constraints can be identified. (1) An initial condition between 70-97.5 Ma at 155185°C (this represents a ZHe system); (2) deposition at/near the surface occurred between 45-65 Ma (1520°C), followed by (3) burial generating heating constrained between 15-45 Ma at 75-115°C, and (4) a final present-day condition of 20°C at time 0 Ma. The paths between constraints are monotonic consistent (heating- or cooling-only) with halve segment values of two times and an intermediate randomizer style. 4.2.2 Theoretical annealing models In HeFTy, three parameters, Dpar, Cl and OH content are quantitatively related to annealing behaviour of apatite crystals in fission track analysis (Ketcham 2013). Dpar, the mean fissiontrack etch pit diameter parallel to the crystallographic c-axis (e.g., Donelick, 1993; Donelick, 1995; Carlson et al., 1999), is the default kinetic variable used by HeFTy. These parameters are used to calculate a variable called rmr0, which characterizes the relationship of one apatite to another with respect to mean length and c-axis projected length data at laboratory time scales (Ketcham et al. 1999). The rmr0 is defined as “the reduced track length of the more resistant apatite at the point where the less resistant apatite first becomes totally annealed” (Ketcham et al. 1999). The user can also directly input an rmr0 value into the program. Four existing annealing models can be used and are specified in HeFTy’s drop-down list allowing the user to decide which fission-track annealing calibration will be used to calculate track length reduction as a function of time and temperature; those include Laslett et al. (1987) for Durango apatite, Crowley et al. (1991) for Fluorine-apatite, and the Ketcham et al. (1999) and (2007b) multikinetic models (Ketcham 2013). HeFTy provides several calibrations for (U-Th)/He models based on an Arrhenius relationship, as described in Chapter 3, with a diffusion domain that is either a subset of the mineral grain or more typically, the radius of the entire grain (Ketcham 2013). HeFTy also incorporates the kinetic model called the radiation damage accumulation and annealing model (RDAAM) model of Flowers et al. (2009) for apatite and that of Guenthner et al. (2013) for zircon, both used for this study. 4.2.3 Searching through candidate thermal histories Searching through potential thermal histories can be carried out by using a simple Monte Carlo approach or an optimization algorithm (Ketcham 2005). The Monte Carlo approach generates and evaluates a large number of independent time-temperature paths while the optimization algorithm iteratively uses already-tried time-temperature paths to statistically identify the one 93 with the best fit (Ketcham 2005). An optimization algorithm is limited by the number of timetemperature paths used because they work best with a fewer number of degrees of freedom; this means that if too many degrees of freedom are used the optimization algorithm could be trapped into local minima or maxima values, which is unwanted. HeFTy uses the Monte Carlo search method (Ketcham 2013). 4.2.4 Statistical comparisons The two main techniques for statistically comparing model predictions to measured ages are (1) the goodness of fit and (2) the joint likelihood methods. The goodness of fit (GOF) analyzes the best fit for age and length distribution using statistical methods (e.g., Corrigan 1991; Ketcham et al. 2000; Lutz and Omar 1991; Willett 1997) while the likelihood method evaluates the likelihood of obtaining the measured lengths and counts (age data) (Gallagher 1995). The GOF approach (used in this study) has three main components for finding an adequate function that measures the agreement between predicted and measured data. The first component measures the GOF between the predicted and measured cooling age (both AFT and U-Th/He) (Ketcham 2000, 2013) and describes the proportion of samples from the distribution that are further away from the measured age than the predicted age (Ketcham 2000). The second component compares the predicted to the measured length distribution for AFT data. Two approaches are available, Kolmogorov-Smirnov (K-S) test and Kuiper’s statistic. The simpler is the K-S test (Press et al. 1988; Willett 1997) which compares the maximum separation distance between the cumulative distribution functions (CDF) of predicted and measured track lengths, and the number of observations making up the CDF of the model track lengths (Ketcham 2005). In any given distribution, the K-S test is generally more sensitive to the median track length while the Kuiper’s statistic harmonizes sensitivity between the median and the tails. The third component combines the GOF obtained for cooling age and the GOF for track length data into a single function describing agreement between data and model (combined merit function) because the two statistics are equivalent in meaning and do not need to be weighted (e.g. Corrigan 1991; Lutz and Omar 1991). Combining the two GOF values can be done by taking the minimum value for single (Willett 1997) or multiple (Ketcham et al. 2000) kinetic populations 94 or thermochronometers. For a minimum statistical value greater than 0.05, the model is considered to be acceptable because the statistics pass the 95 percent confidence test; for a minimum value above 0.5, the model is reported as good (Ketcham 2005). In comparison, the joint likelihood method (Gallagher 1995) evaluates the GOF by using statistics that are based on characteristics of the data such as the physics and geometry of track generation, revelation, and measurement (Ketcham 2005). As such, it is “closer” to the data than the previous methods (Ketcham 2005) because it describes more aspects of the data. It uses the following log-likelihood function (Eqns. 4.1 and 4.2): (Equation 4.1) Where, L, joint likelihood function, parameter θ = ρs /( ρs + ρi), ρs, predicted spontaneous track density, ρi, predicted induced track density, Nc, number of grains counted, Ni, number of induced tracks measured, Ns (number of spontaneous tracks), P(lk), probability of achieving track length distribution. The log-likelihood produces a number to be maximized and the resolution of the model is defined by how close it is to the maximum likelihood value (Ketcham 2005). Both joint likihood and GOF are expected to yield similar results because of the similar underlying principles that they are based on (Reiners 2005). 4.2.5 Model parameters used for this study Time-temperature histories for 14 samples were derived from 10 inverse thermal models using HeFTy Version 1.8.0 software. For AHe model parameters, the most recent RDAAM diffusion model by Flowers et al. (2009) with stopping distances defined by Ketcham et al. (2011) were used. Input data included measured uranium and thorium concentrations, uncorrected single-grain age data and grain radius. Corrected ages were calculated by HeFty using the alpha ejection correction by Ketcham et al. (2011). 95 For AFT model parameters, the most recent annealing model from Ketcham et al. (2007) was chosen. Input data included single-grain age data using the traditional zeta mode (± 95%, uncertainty mode), track-length measurements, track angle to grain C-axis, and the kinetic parameter Dpar. Models were run with c-axis projected lengths (Ketcham et al. 2007). For ZHe model parameters, the Guenthner et al. (2013) calibration and stopping distances defined by Ketcham et al. (2011) were used. Input data included measured uranium and thorium concentrations, uncorrected single-grain age data and grain radius. Similar to the AHe models, the corrected ages were calculated by HeFty using the alpha ejection correction by Ketcham et al. (2011). Using the Monte Carlo random search, each model used between 10,000-50,000 iterations with monotonic intermediate variable path segments and three to four half-segments evenly spaced between each T–t constraint (3l and 4I). Model thermochronologic temperature-time constraints (blue boxes in Figures 4.2 to 4.12) were centred on cooling ages and the closure temperature for the different thermochronometers. To increase the degrees of freedom of the search, the initial vertical size of the boxes spanned the whole range of the PAZ/PRZ and the horizontal size was a value greater than the apparent age plus error. Temperature-time boxes were then progressively reduced in order to optimize the search for good fits. For every model run, the program determined the best-fit path (black bold line), the weighted mean path (blue line) and the good and acceptable fit solutions (pink and green lines, respectively) (Ketcham, 2005). The initial or first constraint for all models marked the beginning of rapid cooling due to post orogenic extension in the Canadian Cordillera, which occurred very soon after compression ended (58 Ma) (cf. Chapter 2). In addition to AHe and AFT ages used to run the models, other constraints included ZHe ages obtained in this study, 40 Ar- 39 Ar (biotite and hornblende) ages obtained by Allen (2013), and ZFT ages obtained by Lorencak et al. (2001). In addition, a present-day mean surface temperature of 20°C was used as the final constraint. Screen shots of model results are available in Appendix 6. 96 4.3 Modeling description and results 4.3.1 Model 1: Hanging wall of the Columbia River fault Model 1 (Fig. 4.2) is based on a pair of samples from the hanging wall of the Columbia River fault, RS1201 and RS1202 (Figure 4.12 for location). The two samples are located at the same structural level, approximately 4.3 km apart in horizontal distance. Their AFT apparent ages are within error (identical), suggesting that they have shared a similar cooling history. Although a ZHe apparent age is available for RS1201, the model would not run with the addition of a ZHe model. Therefore, the AFT and AHe ages for this pair of samples were modeled using the following five constraints (Table 4.11): (1) (700°- 300°C) between 60-55 Ma corresponding to the beginning of Cordilleran post-orogenic extension, (2) (200°- 130°C) between 47-37 Ma (this corresponds to the PRZ for ZHe); the ZHe apparent age for RS1201 is 42.6 ± 0.9 (Chapter 3), (3) (160-60°C) between 30-17 Ma (corresponding to the PAZ for AFT), (4) (80°-40°C) between 5-7 Ma (corresponding to the PRZ for AHe), and (5) (30°-10°C) as present surface conditions. The number of paths tried for this sample was 100 000, out of which there were 1254 acceptable fits and 0 good fits. The weighted mean path for this model (blue line in Fig. 4.2) suggests that these samples went through a three-stage cooling history from below 700°C with the first step from ~60-40 Ma characterised by rapid cooling of at least ~17°C/Ma, followed by slow cooling of ~3°C/Ma from 40-5 Ma and a final acceleration of cooling from ~5-0 Ma at a rate of 8°C/Ma. The final stage of rapid cooling needs careful interpretation as it could be an artefact of the model which tried to reach the final constraint of surface temperature at present. HeFTy grouped all apatite grains from these two samples into one population based on similar Dpar values. The mean AFT model track length is long (13.83 ± 1.42, Table 4.1) suggesting that RS1201 and RS1202 both resided for a short time within the PAZ. The oldest fission-track extracted from the best fit paths was formed at 28.9 Ma (Table 4.1) indicating that samples were cooled from below their total annealing temperature at this time. The mean model age (21.3 Ma, Table 4.1) and apparent FT ages for RS1201 (22.2 ± 1.6 Ma, Chapter 3) and RS1202 (24.2 ± 2.1 Ma, Chapter 3) are within error, confirming that the apparent age is the true age. For the AHe model representing RS1202, both model and AHe apparent ages are within error, 5.8 Ma (Table 4.1) and 5.2 ± 0.6 (Chapter 3), respectively. The GOF for all data is acceptable (> 0.05) (Table 4.1). 97 Figure 4.2: Model 1 representing the cooling paths calculated for two samples from the hanging wall of the Columbia River fault, RS1201 and RS1202. Table 4.1: Summary of calculated measured and modeled ages by HeFTy for Model 1 FT data He data MTL (µm) GOF AFT age (Ma) GOF Oldest track (Ma) AHe age (Ma) GOF Measured 14.10 ± 1.53 0.25 22.8 +2.8/-2.5 0.24 28.9 5.18 ± 0.58 0.3 Modeled 13.83 ± 1.42 21.3 5.79 98 4.3.2 Models 2 and 3: Monashee complex, located between the Columbia River fault and the Monashee décollement Model 2 (Fig. 4.3) represents data from RS1203 which is located in the Monashee Complex, just west of the Columbia River fault (Figure 4.12 for location). Although a ZHe apparent age is available for RS1203, the model would not run with the addition of a ZHe model. Therefore, the AFT and AHe ages for this sample were modeled using the following four constraints (Table 4.11): (1) (700°- 300°C) between 60-55 Ma corresponding to the beginning of Cordilleran postorogenic extension, (2) (200°-150°C) between 45-25 Ma (this corresponds to the PRZ for ZHe); the ZHe apparent age for RS1203 is 40.9 ± 4.61 (Chapter 3), (3) (160-60°C) between 25-15 Ma (this corresponds to the PAZ for AFT), and (4)(30° - 10°C) representing present surface conditions. The model was set to run 50 000 paths using a Monte Carlo search method, out of which there were 6811 acceptable fits and 1592 good fits. The weighted mean path for this model suggests that the sample was characterised by a two-stage cooling history including an initial rapid cooling rate of at least 13°C/Ma from 60-36 Ma, followed by a reduction in cooling to a rate of 5°C/Ma from ~36 Ma to present. HeFTy grouped all grains from this sample into one apatite population based on similar Dpar values. The mean model track length is long (14.23 ± 1.45 µm, Table 4.2) suggesting that RS1203 resided for a short time within the PAZ. The oldest fission-track extracted from the best fit paths was formed at 25.2 Ma, indication that the sample started to cool from below the total annealing temperature at this time. The mean AFT model age (19.8 Ma, Table 4.2) and apparent AFT age (20.0 ± 1.2 Ma, Chapter 3) are within error, confirming that the apparent age is the true age. The GOF for both AFT length and age data (0.99 and 1.0, respectively) is good (Table 4.2). 99 Figure 4.3: Model 2 represents the cooling history of RS1203 in the Monashee Complex Table 4.2: Summary of calculated measured and modeled ages by HeFTy for Model 2 FT data MTL (µm) GOF AFT age (Ma) GOF Oldest (Ma) Measured 14.25 ± 1.39 1.00 19.8 +2.6/-2.3 0.99 25.2 Modeled 14.23 ± 1.45 track 19.8 Model 3 (Fig. 4.4) includes samples RS1204 and RS1205. They are located in the Monashee Complex, east of the Victor Creek fault (and Monashee décollement) (Figure 4.12 for location). These samples are located 2.7 km apart in horizontal distance and have AFT ages that are identical (within error) suggesting that they share a similar cooling history. AFT and AHe apparent ages for this pair of samples were modeled using the following five constraints (Table 4.11): (1) (700°- 300°C) between 60-55 Ma corresponding to the beginning of Cordilleran post orogenic extension, (2) (450°-225°C) between 53-42 Ma (this corresponds to the closure temperature for 40Ar-39Ar (biotite) obtained by Allen 2013, on sample RS1204, (3) (160-60°C) between 27-16 Ma (corresponding to the PAZ for AFT), (4) (80-40°C) between 5-10 Ma (this 100 corresponds to the PRZ for AHe), and (5) (30° - 10°C) representing present surface conditions. The model was set to run 100 000 paths using a Monte Carlo search method, out of which there were 1419 acceptable fits and 24 good fits. The weighted mean path for this model suggests that samples were characterised by a two-stage cooling history below 700°C with an initial cooling rate of at least ~12°C/Ma from ~60-26 Ma followed by a slower cooling rate of 4°C/Ma from 26 Ma to present. HeFTy grouped all grains from this sample into one apatite population based on similar Dpar values. The mean model length is long (14.18 ± 1.17 µm, Table 4.3) suggesting that RS1204 and RS1205 resided for a short time within the PAZ. The oldest fission-track extracted from the best fit paths was formed at 27 Ma, indicating that the samples started to cool from below the total annealing temperature at this time. The mean AFT model age (23 Ma, Table 4.3) and apparent AFTages for RS1204 (22.7 ± 1.4 Ma, Chapter 3) and RS1205 (21.0 ± 1.4 Ma, Chapter 3) are within error, confirming that the apparent age is the true age. For the AHe model representing RS1205, both the model age (9.59 Ma, Table 4.3) and apparent age (9.0 ± 1.34 Ma, Chapter 3) are also within error. The GOF is acceptable for the AFT length data (0.33) and good for the AFT and AHe ages (0.63 and 0.98), respectively (Table 4.3). 101 Figure 4.4: Model 3 shows the combined cooling history for samples RS1204 and RS1205, located in the Monashee Complex Table 4.3 Summary of calculated measured and modeled ages by HeFTy for Model 3 FT data He data MTL (µm) GOF AFT age (Ma) GOF Oldest track (Ma) AHe age (Ma) GOF Measured 13.52 ± 1.29 0.33 22.5 +2.3/-2.1 0.63 27.0 9.58 ± 0.42 0.98 Modeled 14.18 ± 1.17 23 9.59 4.3.3 Models 4 to 8: Shuswap Metamorphic complex (SMC), located between the Monashee décollement and Okanagan Valley shear zone Model 4 (Fig. 4.5) represents the cooling ages for sample RS1206, located in the SMC, west of the Monashee décollement (and Victor Creek fault) (Figure 4.12 for location). AFT and AHe apparent ages for this sample were modeled using the following five constraints (Table 4.11): (1) (700°- 300°C) between 60-55 Ma corresponding to the beginning of Cordilleran post orogenic 102 extension, (2) (120°-440°C) between 54-44 Ma (this corresponds to the closure temperature for ZFT from Lorencak et al. (2001)), (3) (160-60°C) between 29-19 Ma (corresponding to the PAZ for AFT), (4) (80-60°C) from 19-9 Ma (this corresponds to the PRZ for AHe), and (5) (30° - 10°C) representing present surface conditions. The model was set to run 50 000 paths using a Monte Carlo search method, out of which there were 2415 acceptable fits and 109 good fits. The weighted mean path for this model suggests a two-stage cooling history with a rapid initial cooling rate of at least 18°C/Ma from 60-44 Ma followed by slower cooling rate of 5°C/Ma from 44-0 Ma. HeFTy grouped all grains from this sample into one apatite population based on similar Dpar values. The mean model length is long (14.64 ± 1.19 µm, Table 4.4) suggesting that the sample resided for a short time within the PAZ. The oldest fission-track extracted from the best fit paths was formed at 27.2 Ma, indicating that the sample started to cool from below the total annealing temperature at this time. The mean HeFTy AFT model age (24.2 Ma) and the apparent AFT age (24.1 ± 1.1 Ma, Chapter 3) are within error, suggesting that the apparent AFT is the true age for RS1206. For the AHe model, HeFTy’s predicted model age (14.1 Ma) and the apparent AHe ages (14.3 ± 2.14 Ma, Chapter 3) are also within error. The GOF is acceptable for AFT length data, 0.26, and good for AFT and AHe age data, 0.89 and 0.97, respectively (Table 4.4). Figure 4.5: Model 4 represents the cooling path for sample RS1206, located in the SMC 103 Table 4.4: Summary of calculated measured and mo deled ages by HeFTy for Model 4 FT data He data MTL (µm) GOF AFT age (Ma) GOF Oldest track (Ma) AHe age (Ma) GOF Measured 13.87 ± 1.69 0.26 24.1 +2.3/-2.1 0.89 27.2 14.1 ± 0.6 0.97 Modeled 14.64 ± 1.19 24.2 14.1 Model 5 (Fig. 4.6) represents samples RS1207 and 1208, located in the Shuswap Metamorphic complex (SMC), west of the Three Valley Gap fault (Figure 4.12 for location). The samples are 5.2 km apart in horizontal distance, are at the same structural level, and have been combined for geological interpretation and modeling. No AFT models were run for this sample because there were very few FTs present (Chapter 3). Although a ZHe apparent age is available for RS1207, the model would not run with the addition of a ZHe model. Therefore, the AHe age for this pair of samples was modeled using the following six constraints (Table 4.11): (1) (700°300°C) between 60-55 Ma corresponding to the beginning of Cordilleran post orogenic extension, (2) (400°-240°C) between 55-45 Ma (this corresponds to the closure temperature for 40 Ar-39Ar (biotite) obtained by Allen 2013; (3) (200° - 130°C) between 50-35 Ma (this corresponds to closure temperature for ZHe); (4) (160° - 60°C) between 20-10 Ma (this corresponds to closure temperature for AFT); (5) 80-40°C (this corresponds to the PRZ for AHe), and (6) (30° 10°C) as present surface conditions. The model was set to run 50 000 paths using a Monte Carlo search method, out of which there were 6855 acceptable fits and 3781 good fits. The weighted mean path for this model suggests a two-stage cooling history, with an initial rapid cooling rate of at least 20°C/Ma from 60-42 Ma followed by a period of slow cooling with a rate of 4°C/Ma from 42 Ma to present. For the AHe model, HeFTy’s model age (7.65 Ma, Table 4.5) and the apparent age for RS1207 (7.9 ± 0.7 Ma, Chapter 3), are within error, confirming that the apparent ages calculated for these samples represent true ages. The GOF for AHe data is 1.00 (Table 4.5). 104 Figure 4.6: Model 5 represents the combined cooling history for samples RS1207and RS1208, located in the SMC Table 4.5: Summary of calculated measured and modeled ages by HeFTy for Model 5 He data AHe age (Ma) GOF Measured 7.65 ± 0.58 1.0 Modeled 7.65 Model 6 (Fig. 4.7) represents cooling ages of RS1209 which is located in the SMC, 2.1 km from the OVsz (Figure 4.12 for location). No AFT models were run for this sample because there were very few FTs present (Chapter 3). Although a ZHe apparent age is available for RS1209, the model would not run with the addition of a ZHe model. Therefore, the AHe age for this sample was modeled using the following six constraints (Table 4.11): (1) (700°- 300°C) between 60-55 Ma corresponding to the beginning of Cordilleran post orogenic extension, (2) (400°-240°C) between 55-45 Ma (this corresponds to the closure temperature for 40Ar-39Ar(biotite) obtained by Allen 2013; (3) (200° - 130°C) between 50-30 Ma (this corresponds to closure temperature for ZHe); (4) (160° - 60°C) between 27-17 Ma (this corresponds to the PAZ for AFT); (5) (80-40°C) between 20-10 Ma (corresponding to the PRZ for AHe), and (6) (30° - 10°C) representing present surface conditions. The model was set to run 50 000 paths using a Monte Carlo search method, out of which there were 13 565 acceptable fits and 7 661 good fits. The weighted mean path for this model suggests a two-stage cooling pattern with an initial rapid cooling rate 105 of at least 19°C/Ma from 60-42 Ma, followed by a slower cooling rate from 42 Ma to present of 4°C/Ma. For the AHe model, HeFTy’s model age (14.5 Ma, Table 4.6) and the apparent age (14.8 ± 1.71 Ma, Chapter 3), are within error of each other and the calculated, suggesting that the apparent ages calculated for these samples represent true ages. The GOF for AHe data is 1.00 (Table 4.6). Figure 4.7: Model 6 represents the cooling history for sample RS1209, located in the SMC Table 4.6: Summary of calculated measured and modeled ages by HeFTy for Model 6 He data AHe age (Ma) GOF Measured 14.5 ± 1.4 1.0 Modeled 14.5 Model 7 (Fig. 4.8) represents the cooling history of sample RS1210 (Figure 4.12 for location). Although a ZHe apparent age is available for this sample, the model would not run with the 106 addition of a ZHe model. Therefore, the AFT and AHe ages for this pair of samples were modeled using the following five constraints (Table 4.11): (1) (700°- 300°C) between 60-55 Ma corresponding to the beginning of Cordilleran post orogenic extension and the closure temperature for 40Ar-39Ar(hornblende) obtained by Allen 2013; (2) (200° - 130°C) between 53-40 Ma (this corresponds to the PRZ for ZHe); (3) (160-60°C) from 40-30 Ma (corresponding to the PAZ for AFT, (4) (80-40°C) between 14-4 Ma (corresponding to the PRZ for AHe, and (5) (30° 10°C) as present surface conditions. The model was set to run 100 000 paths using a Monte Carlo search method, out of which there were 947 acceptable fits and 1 good fit. The weighted mean path for this model suggests a three-stage cooling history, starting with a rapid cooling rate of at least 21°C/Ma from 60-38 Ma, followed by a dramatic decrease in cooling to a rate of <1°C/Ma from 38-7 Ma, and a final acceleration of cooling at a rate of 6°C/Ma from 7 Ma to present. HeFTy grouped all grains from this sample into one apatite population based on similar Dpar values. The mean model length is long (14.31 ± 0.86 µm, Table 4.7) suggesting that the sample resided for a short time within the PAZ. The oldest fission-track extracted from the best fit paths was formed at 39.6 Ma, indicating that the sample started to cool from below the total annealing temperature at this time. HeFTy’s mean AFT model age (34.6 Ma) and the apparent AFT age (34.6 ± 2.1 Ma, Chapter 3) are within error, suggesting that the apparent AFT is the true age for RS1210. For the AHe model, HeFTy’s model age (14.1 Ma, Table 4.7) and the apparent AHe age (14.3 ± 2.14 Ma, Chapter 3) are also within error. The GOF is acceptable for AFT length data, 0.26, and good for AFT and AHe age data, 0.89 and 0.97, respectively (Table 4.7). 107 Figure 4.8: Model 7 represents the cooling history of sample RS1210, located in the SMC Table 4.7: Summary of calculated measured and modeled ages by HeFTy for Model 7 FT data He data MTL (µm) GOF AFT age (Ma) GOF Oldest track (Ma) AHe age (Ma) GOF Measured 14.50 ± 0.98 0.26 34.6 +4.5/-4.0 0.98 39.6 8.45 ± 0.42 0.75 Modeled 14.31 ± 0.86 34.6 8.58 Model 8 (Fig. 4.9) represents the cooling history of BV1229, located in the SMC, 6.4 km away from the OVsz (Figure 4.12 for location). AFT and AHe ages for this sample were modeled using the following four constraints (Table 4.11): (1) (700°- 300°C) between 60-55 Ma corresponding to the beginning of Cordilleran post orogenic extension, (2) (160°-60°C) between 45-30 Ma (this corresponds to the closure temperature for AFT), (3) (80-40°C) between 37-27 Ma (this corresponds to the PRZ for AHe) and (4) (30° - 10°C) as present surface conditions. The model was set to run 100 000 paths using a Monte Carlo search method, out of which there were 3764 acceptable fits and 141 good fit. The weighted mean path for this model suggests a two-stage 108 cooling history starting with an initial rapid cooling rate of at least 16°C/Ma from 60-32 Ma followed by a final slow cooling rate of <1°C/Ma from 32 Ma to present. HeFTy grouped all grains from this sample into one apatite population based on similar Dpar values. The mean model track length is long (15.17 ± 0.91 µm, Table 4.8) suggesting that the sample resided for a short time within the PAZ. The oldest fission-track extracted from the best fit paths was formed at 38.7 Ma, indicatind that the sample started to cool from below the total annealing temperature at this time. HeFTy’s mean AFT model age (37.5 Ma, Table 4.8) and the apparent AFT age (36.7 ± 2.2 Ma, Chapter 3) are within error, suggesting that the apparent AFT is the true age for BV1229. For the AHe model, HeFTy’s predicted model age ( 31.4 Ma) and the apparent AHe age (32.1 ± 2.44 Ma, Chapter 3) are also within error. The GOF is acceptable for AFT length data, 0.34, and good for AFT and AHe age data, 0.86 and 0.97, respectively (Table 4.8). Figure 4.9: Model 8 represents the cooling history of sample BV1229, located in the SMC 109 Table 4.8: Summary of calculated measured and modeled ages by HeFTy for Model 8 FT data He data MTL (µm) GOF AFT age (Ma) GOF Oldest track (Ma) AHe age (Ma) GOF Measured 15.10 ± 0.96 0.34 37.1 +4.4/-4.0 0.86 38.7 31.3 ± 1.4 0.97 Modeled 15.17 ± 0.91 4.3.4 37.5 31.4 Models 9 and 10: Okanagan Valley shear zone (OVsz) Model 9 (Fig. 4.10) represents the cooling history of BV1228, located in the OVsz (Figure 4.12 for location). AFT and AHe ages for this sample were modeled using the following four constraints (Table 4.11): (1) (700°- 300°C) between 60-55 Ma corresponding to the beginning of Cordilleran post orogenic extension, (2) (160°-60°C) between 35-23 Ma (this corresponds to the closure temperature for AFT) and (3) (80-40°C) between 25-15 Ma (this corresponds to the PRZ for AHe, and (4) (30° - 10°C) as present surface conditions. The model was set to run 100 000 paths using a Monte Carlo search method, out of which there were 3478 acceptable fits and 1492 good fits. The weighted mean path for this model suggests a two-stage cooling history characterised by an initial fast cooling rate of at least 15°C/Ma from 60-30 Ma followed by a slower cooling rate of 2°C/Ma from 30 Ma to present. HeFTy grouped all grains from this sample into one apatite population based on similar Dpar values. The mean model length is long (14.77 ± 0.94 µm, Table 4.9) suggesting that the sample resided for a short time within the PAZ. The oldest fission-track extracted from the best fit paths was formed at 29.0 Ma, indicatiing that the sample started to cool from below the total annealing temperature at this time. HeFTy’s mean AFT model age (28.8 Ma) and the apparent AFT age (28.8 ± 1.5 Ma, Chapter 3) are within error, suggesting that the apparent AFT is the true age for BV1228. For the AHe model, HeFTy’s predicted model age (19.5 Ma) and the AHe apparent age (20.1 ± 1.83 Ma, Chapter 3) are also within error. The GOF is good for all three parameters (Table 4.9). 110 Figure 4.10: Model 9 represents the cooling history of sample BV1228, located in the OVsz Table 4.9: Summary of calculated measured and modeled ages by HeFTy for Model 9 FT data He data MTL (µm) GOF AFT age (Ma) GOF Oldest track (Ma) AHe age (Ma) GOF Measured 14.42 ± 1.10 0.97 28.8 +3.1/-2.8 1.00 29.0 19.5 ± 0.8 1.00 Modeled 14.77 ± 0.94 28.8 19.5 The final model, Model 10 (Fig. 4.11), represents the combined cooling history of BV1217 and BV1218, located in the OVsz (Figure 4.12 for location). AFT and AHe ages for these samples were modeled using the following five constraints (Table 4.11): (1) (700°- 300°C) between 60-55 Ma corresponding to the beginning of Cordilleran post orogenic extension, (2) (400°-200°C) between 55-40 Ma (this corresponds to the closure temperature for 40Ar-39Ar(biotite)) and (3) (160-60°C)between 37-27 Ma (corresponding to the PAZ for AFT), (4) (80-40°C) from 30-15 Ma (corresponding to the PRZ for AHe), and (5) (30° - 10°C) as present surface conditions. The model was set to run 100 000 paths using a Monte Carlo search method, out of which there were 1236 acceptable fits and 135 good fit.The weighted mean path for this model suggests a 111 two-stage cooling history with an initial cooling rate of at least 17°C/Ma from 60-35 Ma followed by a slower cooling of 2°C/Ma from 35 Ma to present. HeFTy grouped all grains from this sample into one apatite population based on similar Dpar values. The mean model length is long (14.48 ± 1.31 µm, Table 4.10) suggesting that the sample resided for a short time within the PAZ. The oldest fission-track extracted from the best fit paths was formed at 37.8 Ma; samples started to cool from below the total annealing temperature at this time. HeFTy’s mean AFT model age (32.2 Ma) and the apparent AFT age (32.1 ± 1.5 Ma for BV1218, Chapter 3) are within error, suggesting that the apparent AFT is the true age for this sample. For the AHe model, HeFTy’s model age (19.0 Ma) and the apparent AHe age (22.9 ± 2.72 Ma, Chapter 3) are also within error. The GOF is good for all three parameters (Table 4.10). Figure 4.11: Model 10 represents the combined cooling history of BV1217 and BV1218, located in the OVsz Table 4.10: Summary of calculated measured and modeled ages by HeFTy for Model 10 FT data He data MTL (µm) GOF AFT age (Ma) GOF Oldest (Ma) Measured 13.83 ± 1.46 0.53 32.2 +3.1/-2.8 1.00 37.8 Modeled 14.48 ± 1.31 32.2 track AHe age (Ma) GOF 19.1 ± 0.2 0.83 19.0 112 4.4 Modeling summary and trends Table 4.11 and Figure 4.12 summarise the modeling results for this study. Overall, models show a two-stage cooling pattern across the region (except for Models 1 and 7), with faster initial cooling (>12°C/Ma, Table 4.11) transitioning to slower cooling (<5°C/Ma, Table 4.11). Further, the second stage of cooling is faster in the eastern region (5-4°C/Ma, Models 1-6) than in the western region (3 to <1°C/Ma, Models 7-10) of the transect. The time that the rate in cooling changes also follows a similar trend, with cooling rates changing generally earlier in the eastern regions. In addition, the ages of the oldest track are higher in the western region, with the oldest track age in the whole region being 39.6 Ma (Model 7). In Model 8, the AFT apparent age and oldest track age (36.7 ± 2.2 and 38.7 Ma, respectively) are within error, suggesting that this sample has been totally reset (or totally annealed). The results for Model 1 (Fig. 4.2) suggest that from the onset of orogenic extension there was initially fast cooling in the hanging wall of the Columbia River fault until ~40 Ma when cooling rate slowed dramatically (to ~15 % of initial cooling rate) until ~5 Ma when the cooling rate accelerated again. Models 2 and 3 also suggest a two-stage cooling pattern in the Monashee complex. The initial and final cooling rates are similar in both models, although the time at which the cooling rate changes could have occurred as much as ~10 Ma later further west, in Model 3 (~26 vs ~36 Ma). In the SMC, two-stage cooling patterns are predominantly observed (Models 4-8). The initial cooling rate ranges from 15-21°C/Ma, with the highest rate in the eastern region of the SMC and the lowest cooling rate in its west. The change in cooling rate occurs between ~44-32 Ma, occuring earlier in the eastern region of the SMC. The final cooling rate of the models for this region range between 5- <1°C/Ma. The final cooling rate appears to be slower in the western region as well. In the Okanagan valley shear zone, initially there is fast cooling at a rate of 15-17°C/Ma. The change of rate occurs sometime between 35-30 Ma which is a similar trend as that of the SMC. 113 Overall, these models confirm that although both eastern and western regions of the study area begin with initially rapid cooling, the eastern region transitions to a second and slower cooling rate earlier than in the west. Subsequent cooling rates are much slower in the west, with low temperature AFT data first recorded in the western region, indicated by the oldest fission tracks identified in Models 7-10 (Table 4.11). 114 Table 4.11: Modeling results Samples RS1201-1202 RS1203 RS1204-1205 RS1206 RS1207-1208 RS1209 Constraint 1 700-300° 700-300° 700-300° 700-300° 700-300° 700-300° PostExtension: Extension: Extension Extension Extension orogenic 60-55 Ma 60-55 Ma 60-55 Ma 60-55 Ma 60-55 Ma extension: 60-55 Ma RS1210 700-300° Extension & 40Ar39Ar(hbl): 60-50 Ma BV1229 700°-300° Extension 60-55 Ma BV1228 700°-300° Extension 60-55 Ma BV1217-1218 700°-300° Extension 60-55 Ma Constraint 2 200-130° ZHe: 47-37 Ma 200-150° ZHe: 45-25 Ma 400-240° 40Ar39Ar(bt): 53-42 Ma 440-120° ZFT: 54-44 Ma 400-240° 40Ar39Ar(bt): 55-45 Ma 400-240° 40Ar39Ar(bt): 55-45 Ma 200-130° ZHe: 53-40 Ma 160-60° AFT: 45-30 Ma 160-60° AFT: 35-24 Ma 400-200° 40Ar39Ar(bt): 55-40 Ma Constraint 3 160-60° AFT: 30-17 Ma 160 -60° AFT: 25-15 Ma 160-60° AFT: 27-16 Ma 160-60° AFT: 29-19 Ma 200-140° ZHe: 50-34 Ma 200-140° 160-60° 80-40° ZHe: 50-30 AFT: 40-30 Ma AHe: 37-27 Ma Ma 80-40° AHe: 25-15 Ma 160-60° AFT: 45-30 Ma 80-40° 20° +/- 10° 80-40° 80-40° AHe: 7-2 Ma Present AHe: 10-5 Ma AHe: 19-9 Ma 160-60° AFT: 25-14 Ma 160-60° 80-40° 20° +/- 10° AFT: 27-17 AHe: 14-4 Ma present Ma 20° +/- 10° present 80-40° AHe: 30-15 Ma Constraint 4 115 Constraint 5 20° +/- 10° present N/A 20° ± 10° present 20° ± 10° present 20° ± 10° 13-3 Ma 80-40° AHe: 20-10 Ma 20° ± 10° present N/A N/A 20° ± 10° present Constraint 6 N/A N/A N/A N/A 20° ± 10° present 20° ± 10° present N/A N/A N/A N/A Paths 100 000 50 000 100 000 50 000 50 000 50 000 100 000 100 000 50 000 100 000 Acceptable fits 1254 6811 1419 2415 6855 13565 947 3764 3478 1236 Good fits 0 1592 24 109 3781 7661 1 141 1492 135 Oldest track 28.9 25.2 27 27.2 -- -- 39.6 38.7 31 37.8 Cooling (1)60-40 Ma; (1)60-36 Ma; (1)60-26 Ma; (1)60-44 Ma; (1)60-42 Ma; (1)60-42 Ma; (1)60-38 Ma; (1)60-32 Ma; (1)60-30 Ma; (1)60-35 Ma; times and 17°C/Ma 13°C/Ma 12°C/Ma 18°C/Ma 20°C/Ma 19°C/Ma 21°C/Ma 16°C/Ma 15°C/Ma 17°C/Ma rates (2)41-5 Ma; (2)36-0 Ma; (2)26-0 Ma; (2)44-0 Ma; (2)42-0 Ma; (2)42-0 Ma; (2)38-7 Ma; (2)32-0 Ma; (2)30-0 Ma; (2)35-0 Ma; 3°C/Ma 5°C/Ma 4°C/Ma 5°C/Ma 4°C/Ma 4°C/Ma <1°C/Ma <1°C/Ma 2°C/Ma 2°C/Ma (3)5-0 Ma; 8°C/Ma (3)7-0 Ma; 5°C/Ma 115 116 116 Figure 4.12: Summary of HeFTy models along the study transect. Data from adjacent samples with similar cooling ages were merged (RS1201-1202; RS1204-1205; BV1217-1218). Modeling for AFT combined Caxis projected track lengths, single-grain ages, and Dpars, and used the annealing model of Ketcham et al.(2007). For AHe and ZHe data, parameters used included the radiation damage models of Flowers et al. (2009) and Guenthner et al. (2013), respectively, and the alpha ejection correction from Ketcham et al. (2011). Each model was run between 10 000-50 000 iterations using a Monte Carlo random search with Intermediate variable path segments and three to four half-segments evenly spaced between each T–t constraint (3l and 4I). Models’ T–t constraints (blue boxes) were originally centred on cooling ages and associated errors for the different thermochronometers. To increase the degree of freedom of the search, initial T–t boxes were set much larger than they appear and were progressively reduced in order to optimize the search for good fits. For every model run, the program determined the best-fit path (black bold line), the weighted mean path (blue line) and the good fit and the acceptable fit solutions (pink and green lines respectively) (Ketcham, 2005). The dashed lines indicate the time and temperature of the change in the cooling rate; they join at the “break in slope” of the cooling curve. 117 CHAPTER 5: DISCUSSION AND CONCLUSION 5.1 Thermal history of the Shuswap Metamorphic Complex (SMC) 5.1.1 Inverse thermal modeling Ten inverse thermal models based on 14 samples along the Sicamous-Revelstoke transect were produced using HeFty thermal modeling software (Version 1.8.0) (Ketcham, 2013). The models consistently yielded a two-stage cooling history for the Shuswap metamorphic complex (SMC) (Fig. 5.1) that suggests initial rapid cooling followed by a second stage of slower cooling (see modeling results in Chapter 4). The models are based on multiple thermochronometers including AHe, AFT, ZHe, ZFT, and 40Ar/39Ar (biotite and hornblende) and include an initial constraint that marks the beginning of rapid cooling due to post orogenic extension in the Canadian Cordillera (~58 Ma; Chapter 2) and a final constraint of a present-day mean surface temperature of 20 ± 10°C (Fig. 5.1). Figure 5.1 (on next page): Summary of HeFTy models (from Chap. 4) along the study transect. Data from adjacent samples with similar cooling ages were merged (RS1201-1202; RS1204-1205; BV1217-1218). Modeling for AFT combined C-axis projected track lengths, single-grain ages, Dpars, and the application of the annealing model of Ketcham et al. (2007). For AHe and ZHe data, parameters used included the radiation damage models of Flowers et al. (2009) and Guenthner et al. (2013), respectively, and the alpha ejection correction from Ketcham et al. (2011). Each model was run between 10 000-50 000 times using a Monte Carlo random search with intermediate variable path segments and three to four half-segments evenly spaced between each T–t constraint (3I and 4I). The models’ T–t constraints (blue boxes) were originally centred on cooling ages and associated errors for the different thermochronometers. To increase the degree of freedom of the search, initial T–t boxes were set much larger than they appear and were progressively reduced in order to optimize the search for good fits. For every model run, the program determined the best-fit path (black bold line), the weighted mean path (blue line) and the good fit and the acceptable fit solutions (pink and green bands respectively) (Ketcham, 2005). The dashed lines indicate the time and temperature of the change in the cooling rate; they join at the “break in slope” of the cooling curve. 118 119 119 Samples across the SMC cooled rapidly (12-21 °C/Ma) during the first stage of cooling and slower (1-5 °C/Ma) during the second stage of cooling (Fig. 5.2a). The temperature at which the change in cooling rate occurs (Fig 5.2b) appears to be much lower at the OVsz and its immediate footwall than for the rest of the SMC, while the time at which the rate of cooling slows down occurs between ~44-26 Ma across the SMC (Fig. 5.2c) . Figure 5.2: Summary of parameters obtained from HeFTy models with a) Cooling rates across the Sicamous-Revelstoke transect – blue boxes (initial cooling), red boxes (second stage of cooling), and b) temperature (blue diamond) at which the cooling rate changed from an initial fast cooling phase to slow cooling. c) time (blue triangle) at which the cooling rate changed from an initial fast cooling phase to slow cooling. Error bars for age (b) were defined by the age range of model good fits (Fig. 5.1) at the time of cooling rate change; similarly, error bars for temperature (c) were defined by the temperature range of model good fits (Fig. 5.1) at the temperature of cooling rate change. 120 Focus on the second stage of “slower” cooling Figure 5.3 illustrates the thermal histories for temperatures < 200 °C for all models produced in this study. To create this figure, the temperature axis was reduced from 700°C to 200°C while keeping all other aspects of the models presented in Chapter 4 the same, that is, no constraints or other inputs were changed. This figure helps to highlight the cooling patterns across the closure temperatures of the low temperature thermochrnometers, AFT and AHe, used in this study. Enlargening this portion of the model highlights that although the second stage of cooling was slower than the initial rapid cooling recorded by U-Pb metamorphic crystallization and re-crystallization ages of zircon, monazite and titanite and 40Ar-39Ar (hornblende, muscovite, biotite) ages, the seond stage of cooling across the SMC was overall fairly rapid. Figure 5.3 also specifically highlights relatively rapid cooling through the apatite PAZ and HePRZ in both the OVsz and the SMC at about the apparent age of the sample. Rapid cooling through the apatite PAZ is also confirmed by long fission track lengths (>14 µm) measured during AFT analysis (Table 3.5). Rapid cooling in addition to very short residence time in the partial annealing zone can suggest that the possible effects of variable apatite composition are minimized (Foster and Raza 2002). Several models in Figure 5.3 display single-stage cooling, including Model 2: RS1203, Model 4: RS1206, Model 5: RS1207-1208, and Model 6: RS1209; the cooling rate for these models range from 4-5°C/Ma. The remaining models show two stage cooling, except for Model 1: RS12011202 and Model 7: RS1210, which show three-stage cooling. The final and third stage of cooling in Models 1 and 7, as mentioned in Chapter 4, needs careful interpretation because it could be an artefact of the model which tried to reach the surface temperature-time constraint. Overall, low temperature (< 200°C) two-stage cooling across the study area start with an initial cooling rate of ~10-16°C/Ma followed by slower cooling ranging from 1-3°C/Ma. Details on the low temperature portion of HeFTy models represented in Figure 5.3 are available in Appendix 7. Figure 5.3 (on next page): Summary of HeFTy models (from Chap. 4) highlighting the low temperature cooling history (< 200°C) for the OVsz and SMC. For every model run, the program determined the bestfit path (black bold line), the weighted mean path (blue line) and the good fit and the acceptable fit solutions (pink and green lines respectively) (Ketcham, 2005). Blue boxes are time-temperature constraints. Orange bars represent the approximate apatite PAZ for each sample; the apatite HePRZ is assumed to be ~40-80C. The dashed lines indicate the time and temperature of the change in the cooling rate; they join at the “break in slope” of the cooling curve (modified from Johnson 2006). 121 122 122 5.1.2 Cooling stage one – high temperature data The SMC is reported to have cooled rapidly from ~700 at 60-55 Ma to ~330 °C at ~50-48 Ma, based on U-Pb metamorphic crystallization and re-crystallization ages of zircon, monazite, and titanite, and 40Ar/39Ar thermochronology (hornblende, muscovite, biotite), respectively (Okulitch 1979; Carr 1991, 1992; Parkinson 1992; Parrish 1995; Sanborn 1996; Crowley and Parrish 1999; Vanderhaeghe et al. 1999; Johnston et al. 2000; Crowley et al. 2001; Lorencak et al. 2001, Vanderhaeghe et al. 2003; Foster et al. 2004; Teyssier et al. 2005; Hinchey et al. 2006; Gervais et al. 2010; Brown et al. 2012; Allen 2013). This initial phase of rapid cooling can be attributed to the main phase of extension accommodated along the OVsz and Columbia River fault. Contnued rapid cooling is proposed to about ~40 Ma (~180 °C) based on zircon fission-track and zircon (UTh)/He thermochronology (Lorencak et al. 2001;Toraman et al. 2014; this study). 5.1.2.1 Crystallization ages The initial stage of cooling is marked by crystallization age data uniformly consistent across the SMC (Fig. 5.4). U-Pb metamorphic crystallization and re-crystallization ages on zircon, monazite, and titanite typically range between 60-50 Ma within the SMC (e.g., Parrish 1995; Crowley and Parrish 1999; Johnston et al. 2000; Crowley et al. 2001; Foster et al. 2004; Gervais et al. 2010; Brown et al. 2012) . Early Eocene extensional exhumation largely coincided with high-grade metamorphism, anatectic melting and migmatization of the footwall gneisses of the OVsz (e.g., Bardoux 1993; Vanderhaeghe et al. 2003; Brown et al. 2012) with maximum metamorphic conditions within the SMC ranging from ~650-800 °C at 7-9 kbar to 750-800 °C at ≥ 10 kbar (Ghent et al. 1977; Duncan 1984; Nyman et al. 1995; Norlander et al. 2002; Teyssier et al. 2005; Hinchey and Carr 2007; Goergen and Whitney 2012a, 2012b). Some of the oldest U-Pb zircon and monazite ages correspond to Middle Jurassic plutonic intrusions located in the hanging walls of the OVsz and Columbia River fault (Fig. 5.4)(Parrish and Wheeler 1983; Parrish and Armstrong 1987; Carr 1991; Crowley and Brown 1994). The older ages suggest that the hanging wall of these structures had very different high temperature thermal histories compared to that of the SMC (Parrish and Wheeler 1983; Parrish and Armstrong 1987; Carr 1991). 123 Figure 5.4: Compilation of published and new data for the Shuswap Metamorphic Complex (SMC). Geochronometers and thermochronometers are colour-coded as per the legend on the right. Boxes with black outlines represent age data from this study. Boxes with dashed outlines represent one sample location from Toraman et al. (2014) that appears to have been plotted in the hanging wall of the CRF while it is in fact located in the footwall of the CRF. Data compiled from multiple sources (See table in Appendix 8). Approximate width of the OVsz and the shear zone associated with the MD are indicated with dashed lines. Abbreviations are: OVsz, Okanagan Valley shear zone; MD, Monashee decollement; CRF, Columbia River Fault. 124 5.1.2.2 Argon thermochronometer (40Ar/39Ar; Tc ≈ 550 – 330°C) 40 Ar/39Ar thermochronology is used to document bedrock cooling below ~550 °C (40Ar/39Ar [hornblende]; Harrison, 1982), ~425 °C (40Ar/39Ar [muscovite]; Célérier et al., 2006) and ~330 °C (40Ar/39Ar [biotite]; Harrison, 1985). Published 40Ar/39Ar cooling ages from the SMC show that the main cluster of 40Ar/39Ar cooling ages for the SMC ranges between ~62 - 48 Ma (40Ar/39Ar [hornblende and biotite]; e.g., Okulitch 1979; Sanborn 1996; Vanderhaeghe 2003; Gervais and Brown 2010; Allen 2013). The oldest cooling ages are reported in the hanging walls of the OVsz and Columbia River fault, which range between Jurassic to Early Cretaceous in age (for 40Ar/39Ar hornblende, muscovite, and biotite) (Johnson 1994; Colpron et al. 1996) (Fig. 5.4). Allen (2013), however, reports data from the immediate hanging wall of the OVsz that suggest rapid cooling from ~425°C at ~53 Ma (40Ar/39Ar [muscovite]) to ~330 °C at ~52-50 Ma (40Ar/39Ar [biotite]). The ages from Allen (2013) are significantly younger than those previously reported for the hanging wall of the OVsz and likely reflect a similarity with footwall cooling ages due to their structural proximity with the main detachment. These samples have likely been thermally affected by the exhumation of the hot footwall beneath the colder hanging wall due to their structural position (Fig. 5.4; Allen, 2013). The 40Ar/39Ar ages (62-48 Ma) reported above suggest that the SMC (including the underlying Monashee Complex) cooled as a single unit from ~550 °C through ~330 °C and that there is no apparent geographic variation across these structural units. 5.1.2.3 Zircon fission-track thermochronometer (ZFT; Tc ≈ 240°C [Tagami, 2005]) There are a limited number of ZFT data available across the SMC that range between ~49.2 ± 4.0 - 44.3 ± 4.0 Ma (Lorencak et al. 2001) (Fig. 5.4). These apparent cooling ages suggest that cooling below ~240°C was probably uniform throughout the footwall of the OVsz, that there was no geographic variation in ages across the SMC (Fig. 5.4), and are compatible with ongoing rapid cooling of the SMC during this time. 125 5.1.2.4 Zircon (U-Th)/He thermochronometer (ZHe; Tc ≈ 170 ± 20°C [e.g., Reiners 2005; Reiners et al. 2004]) ZHe data for the eastern region of the SMC range from ~45.1 ± 1.9 - 37.4 ± 1.2 Ma based on nine data points from Toraman et al. (2014). ZHe data presented in this thesis yielded five apparent ages that range from 43.8 ± 1.48 – 40.9 ± 4.61 Ma. Combined, these datasets also show no significant variation across the SMC, similar to the higher temperature thermochronometric data (Fig. 5.4). Overall, the ZHe apparent ages are compatible with continued rapid cooling of the SMC. 5.1.3 Cooling stage two –Low temperature thermochronology The second stage of cooling is constrained by AFT and AHe data that show clear geographic variation within the SMC, particularly across the OVsz and its immediate footwall (Fig. 5.4). 5.1.3.1 Apatite fission-track thermochronometer (AFT; Tc ≈ 120 ± 20°C; [e.g., Green 1985; Ketcham et al. 1999; Donelick et al. 2005]) The distribution of AFT apparent ages includes a group of older ages that range from 37.8 ± 4.2 28.8 ± 1.5 Ma in the OVsz and younger ages with a smaller range, 24.2 ± 2.1 - 19.2 ± 2.2 Ma, in the SMC and the hanging wall of the Columbia River fault (Fig. 5.4). There are key similarities between the AFT apparent ages from this study and the previous AFT datasets of Lorencak et al. (2001) and Toraman et al. (2014) although there is a large scatter of ages between the different studies (discussed in the next paragraph). Lorencak et al. (2001) report eight AFT apparent ages that range from ~47.1 ± 5.6 – 27.7 ± 3.4 Ma along the Sicamous-Revelstoke transect. These AFT apparent ages are on average older than ages from this study in corresponding locations, however, they do show a trend of older ages in the western part of the transect, similar to dataset in this study. Lorencak et al. (2001) report two AFT ages in the hanging wall of the Columbia River fault (39.6 ± 6.2 and 34.4 ± 9.6 Ma) which are younger than ages in the western part of the SMC, west of Victor Creek fault (Lorencak et al. 2001). This confirms that younger ages continue into the hanging wall of the 126 Columbia River fault, similar to the findings of this study, suggesting that there was no displacement across the Columbia River fault during this time frame. One of the challenges of interpreting data points from Lorencak et al., (2001) study is that of data quality. For example, four of their apparent AFT ages do not pass the X2 test (>5% probability)(Galbraith 2005), meaning that the single-grain ages obtained are not consistent with a common age for each sample. Furthermore, one of the group of four samples that do not pass the X2 test, plus a fifth, have their AFT age calculation based on only six and five grains, respectively, close to one-fourth of the recommended 20 grains normally used for fission-track dating. The remaining three ages are 40.1 ± 5 Ma in the SMC (no track lengths, 12 grains used for age calculation), 39.6 ± 6.2 and 34.4 ± 9.6 Ma, both located in the hanging wall of Columbia River fault (no track lengths, 14 and 15 grains used for age calculation, respectively). Toraman et al. (2014) report AFT apparent ages for the eastern portion of the SicamousRevelstoke transect, east of the Three Valley Gap-Joss Pass fault. The ages range from 28.2 ± 4.2 – 14.0 ± 4.0 Ma (mean track lengths range between 10.69 ± 0.2 - 12.28 ± 0.17 µm) in the SMC and 32.4 ± 6.3 Ma in the hanging wall of the Columbia River fault (mean track length 11.51 ± 0.31 µm). These younger AFT apparent ages from Toraman et al. (2014) are more consistent with the ages obtained in this study for the eastern SMC where data is available (Fig. 5.4). A key difference in the respective age patterns is that their youngest AFT ages range between 16.7 ± 4.0 and 14.0 ± 4.0 Ma (10.78 ± 0.21 µm and no track lengths, respectively), which is significantly younger than those obtained in this study (24.2 ± 2.1 - 19.2 ± 2.2 Ma). Another key difference is that this study’s AFT ages do not vary significantly across the Columbia River fault but they do for Toraman et al. (2014) who reports one available hanging wall age of 32.4 ± 6.3 Ma (11.51 ± 0.31 µm) from Sample 01-63. Upon further investigation of Table SI-3 (Toraman et al. 2014), Sample 01-63 appears to have been plotted in the wrong location in Figure 1 of that publication (boxes with dashed outlines, Fig. 5.4). Based on the latitude and longitude given for Sample 0163 (50°55.798’, -118°27.959’) in Table SI-3, the sample should actually be positioned further west, closer to Victor Lake, within the SMC. Given this new location, AFT apparent ages from this thesis can confidently be reported to satisfactorily agree with relevant previous data. 127 5.1.3.2 Apatite (U-Th)/He thermochronology (AHe; Tc ≈ 60 ± 10°C [Farley 2002; Shuster et al. 2006; Reiners et al. 2006]) The pattern of obtained AHe apparent ages includes a group of older ages that range from 32.1 ± 2.4 - 20.1 ± 1.8 Ma in the OVsz and younger ages eastward that range from 14.8 ± 1.7 - 5.2 ± 1.1 Ma in the SMC and hanging wall of the Columbia River fault (Fig. 5.4). For the eastern portion of the Sicamous-Revelstoke transect (east of the Three Valley Gap-Joss Pass fault) (Fig. 5.1), Toraman et al. (2014) report AHe apparent ages that show similar values in the hangingwall of the Monashee decollement (~13-9 Ma) (Fig. 5.4). In the hanging wall of the Columbia River fault, this study reports a single age of 5.2 ± 1.1 Ma, confirming a trend of young stabilized ages (compared to ages found across the rest of the SMC). Toraman et al. (2014), however, report older apparent ages between ~26.4 ± 1.0 -22.4 ± 1.2 Ma in the hanging wall of the Columbia River fault (Fig. 5.4). A key question is why the two datasets suggest markedly different histories for the hanging wall of the Columbia River fault when they seem to agree for the rest of the SMC. Further investigation of grain data on the four samples from Table SI-3 from Toraman et al. (2014) reveal that AHe sample ages are based on one or two aliquots in each case: 01-57 (0157-1, 01-57-2), 01-58 (01-58-1, 01-58-2), 01-60 (01-60-1, 01-60-2), and 01-61 (01-61-1). The 5.2 ± 1.1 Ma age generated from this thesis is based on five aliquots that replicate well, providing a statistically robust age (Chapter 3, Table 3.4). Although the AHe ages reported by Toraman et al. (2014) in the hanging-wall of the Columbia River fault could still be statistically relevant based on only one or two aliquots, only (U-Th)/He age data based on 3 to 5 aliquots are considered for this study. As a result, the 5.2 ± 1.1 Ma is considered more accurate and statistically meaningful and will be referenced for the rest of the discussion. 128 5.1.4 Published thermal models For the SMC region, two published thermal models suggest different cooling histories. Lorencak et al. (2001) suggest that samples were first cooled to temperatures in the range of the apatite PAZ or slightly above it, then were re-heated through burial before being cooled again to surface temperatures at present time, while Toraman et al. (2014) suggest a three-stage cooling history for the region. The thermal history of AFT apparent ages from Lorencak et al. (2001) was modeled using the Monte Trax program (Gallagher 1995). Apatite fission track lengths were only available for one sample from the Sicamous-Revelstoke transect (Fig. 5.5), and the second model presented here is from the hanging wall of the OVsz (Fig. 5.6) (Lorencak et al. 2001); genetic algorithm modeling suggest that burial and reheating was a major part of the thermal history for both samples. It is not clear what geological constraints were used to impose a reburial of the samples. Thermal modeling of the first sample from the SMC (near Victor Lake) (Fig. 5.5) suggests that it was brought to the surface by ~26 Ma, re-buried between 20-6 Ma, and then exhumed to the surface during the Pliocene. The sample from the hanging wall of the OVsz (66.7 ± 9.6 Ma) (Fig. 5.6) was initially brought to the surface before ~70 Ma, re-buried by ~28 Ma, and brought back to the surface from 28 Ma onward. Figure 5.5: Thermal modeling for a sample within the SMC (modified from Lorencak et al. 2001) 129 Figure 5.6: Thermal modeling for the hanging wall sample of the Okanagan Valley shear zone (modified from Lorencak et al. 2001) Models from Toraman et al. (2014) (Fig. 5.7) suggest three stages of cooling based on HeFTY thermal modeling. The first stage of cooling was rapid (~20–30 °C/Myr) from temperatures >120 °C, the result of a single exhumation cycle (~few million years) that is interpreted as resulting from upward flow of partially molten crust and detachment-driven exhumation to the near surface in Eocene time (Toraman et al. 2014). The second stage of cooling was very slow (<1°C/Myr), located within the apatite PAZ, and interpreted as representing a time of tectonic quiescence (Toraman et al. 2014). The third stage of cooling started sometime between 10 and 1 Ma with a sharp increase in cooling rate, up to ~15 °C/Myr; this final stage of cooling has been attributed to acceleration of erosion and incision of deep valleys owing to the onset of Northern Hemisphere glaciations at ~3 Ma (Toraman et al. 2014). The thermal histories put forward by both Lorencak et al. (2001) and Toraman et al. (2014) are not consistent with the thermal history obtained from this study (Chapter 4). First, none of the ten models generated by this thesis (Fig. 5.1) suggest burial and reheating of the samples; all samples are contnuously cooled in two-stages as they migrated toward the surface. Secondly, the thermal models from Toraman et al. (2014) were run until 100 randomly generated “good” solutions were found. This is an important difference compared to this study where models were run either 50 000 – 100 000 times to obtain as many good fits as possible (Chapter 4). Out of the ten models produced for this study, only two produced fewer than 100 good fits. The number of good fits in the remaining eight models ranges from 109 – 7661. Interestingly, Model 1 (zero good fits, 1254 acceptable fits) (Fig. 4.2) and Model 7 (1 good fit, 947 acceptable fits) 130 (Fig. 4.8, Chapter 4) are the only two models that show a potential three stage cooling pattern. We interpreted this as a potential artifact of the model that tried to reach the final constraint of surface temperature at present. We have reported the outcomes of Models 1 and 7 as threestage cooling in Chapter 4 but prefer to discuss the more regional pattern of two stage cooling. Figure 5.7: Summary HeFTy models for the eastern region of the SMC (from Toraman et al. 2014) 131 5.2 Geographical distribution of cooling ages 5.2.1 Age-depth/distance distribution Another approach to analyze thermochronological data is to identify the spatial distribution of apparent cooling ages along a transect that exposes a range of structural levels and paleodepths parallel to the extensional fault slip direction (Fig. 5.8) (e.g., Foster and John 1999; Stockli 2005). Exhumation due to normal faulting commonly results in an abrupt break in the pattern of apparent cooling ages (Fig. 5.8b). The expected pattern of apparent cooling ages displays a marked variation across a fault/shear zone (Figure 5.8b), with older apparent ages located in the structurally higher hanging wall and younger ages in the structurally deeper footwall (e.g., Campani et al. 2010 a, b). The main point to illustrate here is that footwall samples nearest to the margin of the fault trace / shear zone represent the most recently exposed and cooled samples and therefore are expected to be the youngest (Fig. 5.8). Given that samples for this study were collected across the hanging wall and footwall of the OVsz (Fig. 5.8a), the expected age pattern includes older ages in the hanging wall, decreasing ages across the shear zone, and younger ages in the footwall (Fig. 5.8b). With progressive unroofing of the footwall, samples from originally deeper rocks that exhume to the surface are expected to produce ages that become progressively younger in a down-dip direction (Foster and John 1999; Stockli 2005; Fayon et al. 2000; Wells et al. 2000; Campani et al. 2010 a, b) (Fig. 5.8b). 132 Figure 5.8: Conceptual model illustrating the structural evolution and exhumation of footwall rocks from beneath a low angle normal fault after extension, including a theoretical cooling age distribution as shown on a cooling age versus horizontal distance plot; a) sampling transect (white dots) along the cross-sectional view of a low angle normal fault representing the OVsz; b) theoretical cooling age-distance relationships for the samples from the transect above. 133 The age-distance plot (Fig. 5.9) for this study’s dataset highlights two trends: a steep gradient of older ages (AFT: ~35-22 Ma; AHe ~22.9-7 Ma) within the OVsz and younger concordant ages (AFT: ~24-19 Ma; AHe: ~15-5 Ma) in the SMC and the hanging wall of the Columbia River fault. Samples highlighted in grey (Fig. 5.9) represent those from the shear zones, the OVsz and the shear zone associated with the Monashee decollement; AFT and AHe ages from the OVsz suggest that cooling began as early as ~37 Ma and ended by ~7 Ma. Samples in the footwall of the OVsz are generally younger (grey box, Fig.5.9) than those in the OVsz. Figure 5.9: Apparent cooling age from this study against horizontal distance from Okanagan Valley shear zone (OVsz). Grey shaded area represents samples from the OVsz; Area bounded by grey box represents footwall samples; MD, Monashee decollement; CRF, Columbia River fault; AHe, apatite (U-Th)/He; AFT, apatite fission track; ZHe, zircon (U-Th)/He. Figure 5.10 illustrates the apparent age distribution of sample ages plotted against the structural (normal) distance to the OVsz. The normal distance is calculated by extrapolating the OVsz at an angle of ~15° (Brown et al 2012) and projecting the samples perpendicularly to it. Given a proposed shear zone angle ranging between 10° to 30° for the OVsz (Tempelman-Kluit and Parkinson 1986; Brown et al. 2012), the error bars on the plot incorporates some of this variation by ranging the shear zone angle from 10° to 20°. The resulting pattern (Figure 5.10) also confirms that older ages are located within the shear zone for both AFT and AHe data with 134 younger ages in the footwall. This pattern suggests that cooling below ~120 °C started first along the shear zone, from ~37 Ma, with cooling in the footwall occurring around ~24-19 Ma. Although there is more variability with the AHe data, a similar pattern is observed whereby cooling at the OVsz starts as early as ~32 Ma with cooling in the footwall occurring between ~155 Ma. It is important to note that the OVsz was initially reported to include samples BV1217, BV1218, BV1221, BV1224, BV1226, and BV1228 (Chapter 2); these were the labels that accompanied samples when they arrived the lab for AFT processing. Given that the OVsz is reported to have a width of ~1.5 km (e.g., Brown et al. 2012) and based on structural distance versus age chart (Fig. 5.10), the OVsz may be expanded to include samples from the western regions of the SMC, including, BV1229, RS1210, and RS1209. Figure 5.10: Apparent cooling age from this study against structural distance to the Okanagan Valley shear zone (OVsz). Blue shaded area highlights ZHe ages; red shaded area highlights AFT ages; green shaded area highlights AHe ages; Normal distance is calculated by projecting the OVsz at an angle of ~15° (Brown et al, 2012); Horizontal lines represent normal distance ranges based on shear zone angles of 10° to 30°. OVsz s reported to have a width of ~1-1.5 km (e.g., Brown et al. 2012). 135 Another key trend from Figure 5.10 is that samples in the hanging wall of the Columbia River fault and across the SMC (all east of the OVsz) are all equivalent, within error, which suggests that the Columbia River fault and the Monashee decollement was not active during cooling through the AFT and AHe effective closure temperatures. 5.2.2 Advection of isotherms Low temperature thermochronological systems can be easily affected by subtle thermal effects that perturb isotherms (Braun 2012). Locally elevated geothermal gradients in the footwall of a low angle normal fault are caused by heat transfer from hot lower- to mid-crustal rocks rising from depth to shallow levels (e.g., Fayon et al. 2000). Other thermal effects that can perturb the heat distribution and isotherm geometry across a fault / shear zone include: 1) synkinematic magmatism (Lister and Baldwin 1993), (2) coeval rapid erosion (e.g. Fayon et al. 2000; Thomson and Ring 2006) including footwall flexure-related erosion (Carter et al. 2004); (3) influx of synkinematic hot mineralizing fluids (e.g., Morrison and Anderson 1998); (4) more than one active detachment (e.g., Gessner et al. 2001; Brichau et al. 2009); (5) change in slip rate during footwall exhumation (Carter et al. 2004, 2006). 5.2.2.1 Downward deflection of isotherms towards the hanging wall Sometimes the youngest cooling ages are not located in the region of the footwall closest to the detachment / shear zone (Fig. 5.11)(e.g., Seward et al. 2009). The juxtapositioning of the warmer footwall against the colder hanging-wall can result in the down warping or downward deflection of isotherms towards the hanging wall (Seward et al. 2009). The down warping of isotherms towards the slipping hanging wall causes rocks closer to the fault zone to be cooled through isotherms corresponding to their closure temperatures earlier than more distal samples (Thomson and Ring 2006) resulting in ages closest to the detachment being older. This effect is described as being stronger for low temperature isotherms (Thomson and Ring 2006; Seward et al. 2009). 136 Figure 5.11: Distribution of zircon and apatite fission-track ages in the metamorphic core projected onto a line 025° from the Naxos Island, southern Aegean Sea. White squares represent ZFT ages while black dots represent AFT ages, The data reveal a marginally curved geographical distribution with a very slight increase in ages northwards towards the detachment (Seward et al. 2009). 5.2.2.2 Erosion Advection of mass and heat caused by erosion also causes a net increase in temperature at any given depth relative to the initial temperature prior to erosion (Ehlers et al. 2005, Reiners and Brandon 2006). Erosion may cause isotherms to rise if erosion rate is fast > 1km/Ma (Stuwe et al. 1994) resulting in a steep thermal gradient as isotherms migrate closer to the surface (Reiners and Brandon 2006). In the case of a low angle normal fault, as the hot footwall is unroofed and progressively eroded, advection of isotherms, high surface heat flow, and faster cooling will be promoted in the footwall. If apparent ages do not decrease in the hanging wall slip direction as expected (Fig. 5.8) or if cooling ages remain spatially invariant across the footwall, this could indicate synextension to post-extension distributed erosion (e.g., Fayon et al. 2000; Thomson and Ring 2006). This has been illustrated in models by Grasemann and Dunkl (2003) who constructed two-dimensional thermal models of a low angle normal fault where rock uplift in the footwall is fully compensated by surface erosion (Fig. 5.12). The resulting model (Fig. 5.12) shows that a higher geothermal gradient and higher near-surface heat flow is developed in the footwall. The model 137 also predicts that a faster the rate of extension (5 mm/a versus 2 mm/a) will result in higher heat flow values in the footwall. Figure 5.12: Numerical thermal model results for a 15° dipping low angle normal fault with erosion in the footwall. The temperature distribution within the crust is plotted with extension velocities of 5 and 2 mm/a after 5 Ma, (a) and (b), respectively; c) heat flow is plotted against horizontal distance from the fault trace at the surface. Erosion in the footwall contributes to a higher heat flow in the footwall than in the hanging wall (Grasemann and Dunkl (2003). In Figure 5.13, erosion that is coeval with the contnued unroofing of the footwall is proposed for a section of the footwall. Instead of producing ages that become progressively younger in a down-dip direction (Fig. 5.8), the resulting plot shows that ages in the footwall could remain invariant across the footwall. This is because higher heat flow in that portion of the footwall can cause isotherms to remain elevated leading to a delay in the time that a sample crosses the closure temperature of a particular thermochronometer. The result is that rocks further from the fault zone may be cooled through their closure temperatures at a time similar to that of the samples closest to the fault trace. 138 Figure 5.13: Conceptual model illustrating the potential effects of erosion on the structural evolution and exhumation of footwall rocks from beneath a low angle normal fault after extension, including a theoretical cooling age distribution as shown on a cooling age versus horizontal distance plot; a) sampling transect (white dots) along the cross-sectional view of a low angle normal fault representing the OVsz; b) theoretical cooling age-distance relationships for the samples from the transect above; red dashed lines show the predcted patterns for erosion. 5.2.2.3 Distributed ductile shear High temperature thermochronometers (40Ar-39Ar, Rb-Sr, ZFT) provide evidence of ductile shear along the Simplon Fault Zone, central Alps (Campani et al. 2010b). The data show the expected discontinuity in age pattern across the fault with younger ages in the footwall and older ages in the hanging wall. The key pattern identified here is that with increasing distance from the fault (Simplon Line, Fig. 5.14) ages first decrease over a short distance (~4 km); this has been attributed to distributed ductile shear. Ages then slowly increase at a distance greater than 4 km from the Simplon Line. However, low temperature AFT data do not show the shearing effect (Fig. 5.14), rather, they are described to exhibit a rigid block-like behaviour for cooling during exhumation along the fault zone. It is also important to note that Campani et al. (2010b) argue 139 for activity along the Simplon Fault Zone from at least 20 Ma to 3 Ma (Fig. 5.14) based on the discontinuous cooling ages across the fault zone. Figure 5.14: Age‐distance diagram given for six thermochronometers: AFT, ZFT, biotite Rb‐Sr, biotite 40 Ar/39Ar and K/Ar, white mica 40Ar/39Ar and K/Ar, white mica Rb‐Sr (Modified from Campani et al. 2010b). In this case, displacement on the shear zone is interpreted to have lasted from at least 20 Ma to 3 Ma. Activity along the OVsz can be constrained to have continued through ~37-7 Ma based on the discontinuous mineral ages across the shear zone (Fig. 5.10). This can be attributed to brittle faulting of the upper crust. Brittle behaviour is expected for the upper crustal section of the OVsz for low temperature thermochronometers, similar to that of the Simplon Fault (Fig. 5.13). The pattern observed in this study’s dataset shows a large offset in age across the OVsz. The effect of erosion could be considered for the eastern portion of the study area near Revelstoke. The distribution of apparent ages for AFT and AHe data in Figure 5.10 shows that for both datasets ages are youngest near the OVsz, as described in Figure 5.8, and that ages for the rest of the footwall do not vary much spatially. Further east across the footwall, there is some leveling off of ages for the AFT apparent ages. While the AHe apparent ages are more variable, they may be interpreted as having a similar pattern as the AFT dataset. These age trends suggest that coeval rapid distributed erosion in the eastern region of the footwall of the OVsz may have kept isotherms elevated (Fig. 5.12) and kept ages similar across the footwall. 140 5.3 SMC Integration of thermochronological data with the geology of the OVsz and the 5.3.1 Composite cooling of the OVsz The age pattern displayed for the OVsz in Figure 5.10 suggests the timing of activity of the displacement on the OVsz related to the cooling of each thermochronometer, between ~37-22 Ma (AFT) and ~32-7 Ma (AHe). This cooling pattern can reflect the composite nature of the OVsz (Fig. 5.15). The OVsz is made up of three lithodemic domains (Brown et al. 2012) consisting of coarse-grained granodioritic gneisses at the lowest structural levels that grade progressively to fine-grained mylonitic gneiss, augen gneiss, and mylonite to microbreccia at the top (Tempelman-Kluit and Parkinson 1986). The structurally deepest layer of the OVsz is gradational with the undeformed rocks of the footwall (Brown et al. 2012), that include granodiorite and granite protoliths (Tempelman-Kluit and Parkinson 1986). The structurally deepest layer consists of weak to moderately foliated felsic plutonic rocks (Brown et al. 2012). The structurally middle layer consists of mylotinized, moderate to weakly deformed orthogneiss and paragneiss and the top layer of the OVsz consists of hydrothermally altered ultramylonite, cataclasite, and breccia (Brown et al. 2012). 141 Figure 5.15: Three vertically gradational lithodemic domains typically make up the OVsz (modified from Brown et al. 2012). The upper plate is located in the region west of the OVsz and the lower plate is located east of the OVsz. Map shows the approximate location of the Lake Skaha region (red dot) and Kelowna (black dot) with respect to the Shuawap Complex (green area) and the study are (blue dot). Hydrothermal alteration of rocks within the OVsz (Tempelman-Kluit and Parkinson 1986; Brown et al. 2012) could contribute to or perpetuate heat advection within the shear zone. The large age range recorded within the OVsz could reflect differential cooling of its different structural levels. The data from this study suggest that the shear zone was heated and cooled before the footwall. The structurally highest layer of the shear zone, which is in contact with the cold hanging wall, probably cooled first and contributed to the older AFT ages of ~37 Ma. The deepest structural unit in contact with the hot footwall probably cooled later, producing younger ages (AFT: ~24-19 Ma; AHe: ~15-5 Ma). 5.3.2 Structures influencing SMC cooling ages Low angle normal fault systems commonly display older apparent cooling ages in the structurally higher hanging wall and younger ages in the structurally deeper footwall (Campani et al. 2010 a, b). Data for the Sicamous region typically show younger concordant ages (AFT: ~24-19 Ma; AHe: ~15-5 Ma) in the SMC, footwall of the OVsz, and older ages (AFT: ~35-27 Ma; AHe ~22.9-15 Ma) in the hanging wall and the OVsz (Fig. 5.10). This dataset also confirms some previous conclusions about the Monashee décollement and Columbia River fault. Results indicate no significant apparent AFT and AHe ages variation across either of these structures, which is consistent with reports in the literature stating that thrusting on the Monashee décollement had ended by 58 Ma (Carr 1990; Carr 1991; Carr 1992; Parrish, 1995) to 50 Ma at the deepest exposed levels (Crowley et al., 2001), and movement along the Columbia River fault occurred in early Eocene time (e.g., Parrish et al. 1988; Carr 1992). However, this study suggests that brittle displacement along the OVsz continued into the Neogene. Tempelman-Kluit and Parkinson (1986) reported active strain in, and displacement across, the shear zone within the Middle Eocene; dykes that cut Eocene lavas in the shear zone were found to have be emplaced both syn- and post-kinematically. They also reported apatite and sphene fission-track ages from gneisses within the shear zone that yielded ages between 70 142 and 35 Ma with a mode at 47 Ma (Medford, 1975). This provides some evidence for Cenozoic activity along the OVsz. 5.4 Regional models leading to cooling trends in the SMC The regional model proposed by Lorencak et al. (2001) suggests that the SMC rapidly and homogeneously cooled starting at 60-55 Ma (Vanderhaeghe et al. 1997) until temperatures of ~250 °C were reached at ~45 Ma, after which cooling rates varied as a function of the structural location relative to two high-angle normal faults, the Victor Creek and Columbia River faults. This led to asymmetric cooling whereby the SMC cooled earlier in the western region (45 Ma; 30 ± 20 °C) than in the eastern region (40 ± 3 Ma; 30 ± 20 °C). Lorencak et al. (2001) proposed that the Victor Creek and Columbia River faults were most likely active sometime after 45 Ma and were dominant tectonic controls during the last phases of exhumation. The regional scale model put forward by Toraman et al. (2014) is based on a major, single exhumation event that resulted in the rapid emplacement of the migmatite-cored SMC from the mid-crust to ≤ 2 km depth. This was followed by a period of tectonic quiescence until about ~10-1 Ma when a final cooling event controlled by glacial incision shaped the final landscape of the SMC. Alternatively, a third regional model suggests that cooling in the Canadian Cordillera is a result of large-scale lithospheric mantle delamination and associated isostatic uplift of an orogenic plateau (Bao et al., 2014). Rayleigh wave tomography models reveal (1) the asthenosphere is directly beneath the crust beneath the Canadian Cordillera and (2) a block of intact, delaminated lithosphere has been located within the asthenosphere (Bao et al., 2014). A plateau within the hinterland of the Canadian Cordillera was therefore uplifted as a result of lithospheric delamination (~55 Ma); this led to rapid cooling (~10-20 °C/Ma) from ~500 – 100 °C in the region west of the Rocky Mountain trench (which includes the Sicamous-Revelstoke transect) at about ~56-34 Ma. After this time cooling was a result of enhanced erosion associated with plateau uplift and not tectonic unroofing. This interpretation is supported by synchronous cooling ages obtained across major Eocene faults in the region west of the Rocky Mountain trench (Cubley et al. 2013). 143 This new dataset calls for some modification of these published models. Previous interpretations indicated that the ductile fault activity along the OVsz lasted from 56-47 Ma (e.g., Carr 1992; Brown et al. 2012 and references therein). The results from this thesis suggest that rapid cooling along the OVsz and SMC lasted until the Late Eocene (~37 Ma) after which the OVsz continued to cool at a slower rate from ~37 to ~10-5 Ma based on AFT and AHe ages. Most of this cooling can be attributed to brittle detachment along the OVsz. Some distributed erosion across the OVsz is also proposed but the amount of surface erosion is not significant enough to erase the age gradient observed across the shear zone. It is possible that cooling induced by brittle faulting on the OVsz continued later than ~10-5 Ma but this is not apparent based in the dataset. In addition, as suggested by Toraman et al (2014), erosion from glacial activity would be expected in the Pliocene-Pleistocene and Quaternary but the closure temperatures for ZHe, AFT, and AHe thermochronology are too high to provide the sensitivity to record the effect of these kinds of surface processes. 5.5 Conclusions AHe, AFT, and ZHe data record the lower-temperature part of the exhumation history of the Shuswap Metamorphic Complex. The first stage of cooling within the SMC was rapid and involves the initiation and activity along the Ovsz from ~60-55 Ma at a rapid rate. Rapid cooling transitioned into a second stage of slower cooling from ~37 Ma to ~10-5 Ma based on AFT and AHe ages recorded within the shear zone. Slower cooling within the footwall can be associated with brittle faulting of the upper crust. These results help to address the key questions put forward in the beginning of this thesis. (1) Late-stage cooling in the footwall of the OVsz is primarily due to normal-sense displacement based on the distinct pattern of cooling ages versus structural distance across the OVsz which show older ages in the hanging wall and younger ages in the footwall of the shear zone. (2) Displacement along the OVsz started around 55 Ma based on U-Pb recrystallization ages (zircon, monazite and titanite) and high temperature thermochronology that suggest initial fast cooling until ~37 Ma followed by slower cooling to ~10-5 Ma. (3) Cooling is likely primarily associated with tectonic exhumation driven by displacement on the OVsz, with a small contribution from surface erosion of the footwall. There is limited evidence for crustal cooling after 10-5 Ma and 144 although distributed erosion related to Plio-Quaternary glaciations might have occurred in the region, the closure temperature of the thermochronometers used in this study is is too high to provide the sensitivity needed to establish the rates of Quaternary incision and erosion. 145 BIBLIOGRAPHY Adams, M.G., Lentz, D.R., Shaw, C.S.J., Williams, P.F., Archibald, D.A., and Cousens, B. 2005. Eocene shoshonitic mafic dykes intruding the Monashee Complex, British Columbia: a petrogenetic relationship with the Kamloops Group volcanic sequence? Canadian Journal of Earth Sciences, 42: 11–24. Allen, N. 2013. 40Ar/39Ar Thermochronology of the Okanagan Falley fault system, British Columbia. [B.Sc. thesis]: Kingston, Ontario, Canada, Queen’s University, 113p. Anderson, E.M., 1942. The dynamics of faulting and dyke formation with application to Britain: Edinburgh, Oliver and Boyd, 191 p. Angelier, J., and Coletta, B., 1983. Tension fractures and extensional tectonics: Nature, 301, 4951. Armstrong, R. L., 1982. Cordilleran metamorphic core complexes – from Arizona to southern Canada. Annual Review of Earth and Planetary Sciences, 10, 129–154. Armstrong, R.L., Parrish, R.R., van der Heyden, P., Scott, K., Runkle, D., and Brown, R.L., 1991. Early Proterozoic basement exposures in the southern Canadian Cordillera: Core gneiss of Frenchman Cap, Unit I of the Grand Forks Gneiss, and the Vaseaux Formation. Canadian Journal of Earth Sciences, 28, 1169–1201, doi:10.1139/e91-107. Attendorn, H.-G., and Bowen, R.N.C. 1997. Radioactive and stable isotope geology,Chapman and Hall, London UK. Atwater, T., 1970. Implications of plate tectonics for the Cenozoic tectonic evolution of western North America. Geological Society of America Bulletin, 81, 3513–36. Axen, G. J., 1993. Ramp-flat detachment faulting and low-angle normal reactivation of the Tule Springs thrust, southern Nevada, Geol. Soc. Am. Bull., 105, 1076-1090. Axen, G.J., 2004, Mechanics of low-angle normal faults, in Karner, G., Taylor, B., Driscoll, N., and Kohlstedt, D.L., eds., Rheology and deformation in the lithosphere at continental margins: New York, Columbia University Press,p. 46–91. Axen, G. J. 2007. Research focus: Significance of large-displacement, low-angle normal faults, Geology, 35(3), 287, doi:10.1130/0091-7613(2007)35[287:RFSOLL]2.0.CO;2. Axen, G.J., and Bartley, J.M., 1997. Field test of rolling hinges: Existence, mechanical types, and implications for extensional tectonics: Journal of Geophysical Research, v. 102, p. 20,515– 20,537, doi: 10.1029/97JB01355. Babcock, R.S., Burmester, R.F., Engebretson, D.C., Warnock, A., and Clark, K.P., 1992. A rifted margin origin for the Crescent basalts and related rocks in northern Coast Range volcanic province, Washington and British Columbia. Journal of Geophysical Research, 97, 6799–6821. 146 Bao, X., Eaton, D.W., and Gguest, B. 2014. Plateau uplift in western Canada caused by lithospheric delamination along the craton edge. Nature Geoscience, 7, 830-833 Barbarand, J., Carter, A., Wood, I., and Hurford, A.J. 2003a. Compositional and structural control of fission-track annealing in apatite. Chem Geol 198:107-137 Baldwin, S. L., Lister, G. S., Hill, E. J., Foster, D. A., and McDougall, I. 1993. Thermochronologic constraints on the tectonic evolution of active metamorphic core complexes, D 'EntrecasteauxIs lands, Papua, New Guinea, Tectonics, I2, 611-628. Barbarand, J., Hurford, A.J., Carter, A. 2003b. Variation in apatite fission-track length measurement: implications for thermal history modeling. Chem Geol 198:77-106 Bardoux, M. 1993. The Okanagan Valley fault from Pentiction to Enderby , south-central British Columbia. Ph.D. thesis, Carleton University, Ottawa. Bardoux, M., and Mareschal, J.-C., 1994, Extension in south-central British Columbia: Mechanical and thermal controls. Tectonophysics, 238, 451–470, doi:10.1016/0040-1951(94)90068-X. Beranek, L. P. and J. K. Mortensen. 2011. The timing and provenance record of the Late Permian Klondike Orogeny in northwestern Canada and arc-continent collision along western North America. Tectonics 30(5): TC5017 Bhandari, N., Bhat, S.C., Lal, D., Rajagoplan, G., Tamhane, A.S., Venkatavaradan, V.S. 1971. Fission fragment tracks in apatite: recordable track lengths. Earth Planet Sci Lett 13:191-199 Bol, A.J., Coe, R.S., Gromme, C.S., and Hillhouse, J.W., 1992. Paleomagnetism of the Resurrection Peninsula, Alaska: Implications for the tectonics of southern Alaska and the Kula-Farallon Ridge. Journal of Geophysical Research, 97, 17,213–17,232. Bostock, H.S., 1941, Okanagan Falls: Geological Survey of Canada Map 627A, scale 1:63,360. Bradley, D.C., Haeussler, P., and Kusky, T.M., 1993. Timing of early Tertiary ridge subduction in southern Alaska. U.S Geological Survey Bulletin 2068, 163–177. Braun, J. 2002. Quantifying the effect of recent relief changes on age‐elevation relationships, Earth Planet. Sci. Lett., 200, 331–343, doi:10.1016/S0012-821X(02)00638-6. Braun, J., van der Beek, P., Valla, P., Robert, X., Herman, F., Glotzbach, C., Pedersen, V., Perry, C., Simon-Labric a, T., and Prigent, C. 2012.Quantifying rates of landscape evolution and tectonic processes by thermochronology and numerical modeling of crustal heat transport using PECUBE. Tectonophysics 524–525, 1–28 Breitsprecher, K., Thorkelson, D.J., Groome, W.G., Dostal, J., 2003. Geochemical confirmation of the Kula-Farallon slab window beneath the Pacific Northwest in Eocene time. Geology, 31, 351354. 147 Brichau S., Thomson S. N., and Ring U. 2009. Thermochronometric constraints on the Serifos detachment evolution, Aegean Sea, Greece. International Journal of Earth Sciences, doi: 10.1007/s00531-008-0386-0. Brown, R.L., 1980. Frenchman Cap dome, Shuswap Complex, British Columbia: a progress report. In: Current Research, Part A. Geological Survey of Canada, Paper 80-1A, 47-51. Brown, R. L. 1981. Metamorphic complex of southeast Canadian Cordillera and relationship to foreland thrusting. In Thrust and nappe tectonics. Edited by K. R. McClay and N. J. Price. Geological Society of London, Special Publication 9, pp. 463-474. Brown, D. 2013. Microstructural and crystallographic-preferred orientation analysis of the Okanagan Valley fault system, British Columbia [B.Sc. thesis]: Kingston, Ontario, Canada, Queen’s University, 73p. Brown, R.L. and Carr, S.C. 1990. Lithospheric thickening and orogenic collapse within the Canadian Cordillera. Pacific Rim ’90 Congress. Australasian Institute of Mining and Metallurgy, Brisbane, Australia, 1–10. Brown, R.L., and Gibson, H.D., 2006. An argument for channel flow in the southern Canadian Cordillera and comparison with Himalayan tectonics, in Law, R.R., Searle, M.P., and Godin, L., eds., Channel Flow, Ductile Extrusion and Exhumation in Continental Collision Zones. Geological Society of London Special Publication 268, 543–559. Brown, R.L., and Journeay, J.M., 1987. Tectonic denudation of the Shuswap metamorphic terrane of southeastern British Columbia (Canada). Geology, 15, 142–146. Brown, R.L., and Murphy, D.C., 1982. Kinematic interpretation of mylonitic rocks in part of the Columbia River fault zone, Shuswap terrane, British Columbia. Canadian Journal of Earth Sciences, 19, 456 -465. Brown, R. L., and Read, P. B. 1983. Shuswap Terrane of British Columbia: a Mesozoic "core complex". Geology, 11, 164-168. Brown, R. L., and C. R. Tippett. 1978. The Selkirk fan structure of the southeastern Canadian Cordillera, Geol. Soc. Am. Bull., 89, 548 – 558, doi:10.1130/0016-7606(1978)89<548:TSFSOT>2.0.CO;2. Brown, R.L., Tippett, C. R., and Lane, L. S., 1978. Stratigraphy, facies changes, and correlations in the northern Selkirk Mountains, southern Canadian Cordillera. Canadian Journal of Earth Sciences, 15, 1129- 1140. Brown, R.L., Journeay, J.M., Lane, L.S., Murphy, D.C., and Rees, C.J., 1986. Obduction, backfolding and piggyback thrusting in the metamorphic hinterland of the southeastern Canadian Cordillera. Journal of Structural Geology, 8(3-4), p. 255–268, doi:10.1016/01918141(86)90047-7. 148 Brown, R. L., McNicoll, V. J., Parrish, R. R. and Scamell, R. J. 1992. Middle Jurassic plutonism in the Kootenay Terrane, northern Selkirk Mountains, British Columbia. Geological Survey of Canada Paper, 91-2, 135–141. Brown, R. L., C. Beaumont, and Willett, S. D., 1993. Comparison of the Selkirk fan structure with mechanical models: Implications for interpretation of the southern Canadian Cordillera. Geology, 21, 1015 – 1018, doi:10.1130/0091-7613(1993)021<1015:COTSFS>2.3.CO;2. Brown, R L., Crowley, J. L., and Johnson, B. J., 1993b, Part 2: A transect of the southem Omineca Belt, in Brown, R. L., McDonough, M. R., Crowley, J. L., Johnson, B. J., Mountjoy, E. W., and Simony, P. S., Cordilleran transect, Rocky Mountain foreland and Omineca hinterland, southeastern British Columbia: Geological Association of Canada, Field Trip B-9 Guidebook. Brown, S.R., Gibson, H.D., Andrews, G.D.M., Thorkelson, D.J., Marshall, D.D., Vervoort, J.D., and Rayner, N., 2012. New constraints on Eocene extension within the Canadian Cordillera and identification of Phanerozoic protoliths for footwall gneisses of the Okanagan Valley shear zone. Lithosphere, published online as doi:10.1130/L199.1 Brun, J.-P., and Choukroune, P. 1983. Normal faulting, block tilting, and décollement in a stretched crust, Tectonics, 2(4), 345–356, doi:10.1029/TC002i004p00345. Burchfi el, B.C., and Royden, L.H., 1985. North-south extension within the convergent Himalayan region: Geology, v. 13, p. 679–682, doi: 10.1130/0091-7613(1985)13<679:NEWTCH>2.0.CO;2. Burchfi el, B.C., Chen, Z., Hodges, K.V., Liu, Y., Royden, L.H., Deng, C., and Xu, J., 1992. The South Tibetan detachment system, Himalaya orogen: Extension contemporaneous with and parallel to shortening in a collisional mountain belt: Geological Society of America Special Paper 269, 41 p. Campani, M., Mancktelow, N., Seward, D., Rolland, Y., Müller, W. and Guerra, I. 2010a. Geochronological evidence for continuous exhumation through the ductile‐brittle transition along a crustal‐scale low‐angle normal fault: Simplon Fault Zone, central Alps, Tectonics, 29, TC3002, doi:10.1029/2009TC002582. Campani, M., Herman, F., and Mancktelow, N. 2010b. Two‐ and three‐dimensional thermal modeling of a low‐angle detachment: Exhumation history of the Simplon Fault Zone, central Alps. Journal of Geophysical Research, 115, B10420, doi:10.1029/2009JB007036 Carlson, W.D., Donelick, R.A., and Ketcham, R.A. 1999. Variability of apatite fission-track annealing kinetics: I Experimental results. Am Mineral 84:1213-1223 Carmignani, L., and Kligfield, R. 1990. Crustal extension in the northern Apennines: The transition from compression to extension in the Alpi Apuane core complex, Tectonics, 9, 1275 – 1303. Carr, S. D., 1990. Late Cretaceous- Early Tertiaryt ectonice volution of the southern Omineca Belt, Canadian Cordillera, Ph.D. thesis, 223 pp., Carleton Univ., Ottawa, Ont., Canada. 149 Carr, S. D., 1991. Three crustal zones in the Thor-Odin-Pinnacles area, southern Omineca Belt, British Columbia. Canadian Journal of Earth Sciences, 28, 2003–2023. Carr, S.D., 1992, Tectonic setting and U-Pb geochronology of the Early Tertiary Ladybird leucogranite suite, Thor-Odin-Pinnacles area, southern Omineca Belt, British Columbia. Tectonics, 11, 258–278, doi:10.1029/91TC01644. Carr, S.D. 1995. The southern Omineca Belt, British Columbia: new perspectives from the Lithoprobe Geoscience Program. Canadian Journal of Earth Sciences, 32: 1720–1739. Carr, W.J., and Dickey, D.D. 1976. Cenozoic tectonics of eastern Mojave Desert: U.S. Geological Survey Professional Paper 1000, p. 75. Carr, S.D., Parrish, R.R., and Brown, R.L. 1987. Eocene structural development of the Valhalla complex, southeastern British Columbia. Tectonics, 6: 175 - 196. Carter, T.J., Kohn, B.P., Foster, D.A., and Gleadow, A.J.W. 2004, How the Harcuvar Mountains metamorphic core complex became cool: Evidence from apatite (UTh)/He thermochronometry: Geology, v. 32, no. 11,p. 985–988, doi: 10.1130/G20936.1. Carter, T.J. Kohn, B.P., Foster, D.A., Gleadow, A.J.W., and Woodhead, J.D. 2006. Late-stage evolution of the Chemehuevi and Sacramento detachment faults from apatite (U-Th)/He thermochronometry—Evidence for mid-Miocene accelerated slip. GSA Bulletin; May/June 2006; v. 118; no. 5/6; p. 689–709; doi: 10.1130/B25736.1 Chadderton, L.T., and Montagu-Pollock, H.M. 1963. Fission fragment damage to crystal lattices: heat sensitive crystals. Proc Roy Soc A274:239-252 Chemenda, A. I., Mattauer, M., Malavieille, J., and Bokun, A. N. 1995. A mechanism for syncollisional rock exhumation and associated normal faulting: Results from physical modeling, Earth Planet. Sci. Lett., 132, 225 – 232. Cherniak, D.J., Watson, E.B., and Thomas, J.B. 2009. Diffusion of helium in zircon and apatite. Chemical Geology, 268: 155–166 Church, B.N., 1973. Geology of the White Lake Basin British Columbia. Department of Mines and Petroleum Resources Bulletin 61, 3–141. Cloos, M., 1993. Lithospheric buoyancy and collisional orogenesis: Subduction of oceanic plateaus, continental margins, island arcs, spreading ridges, and seamounts. Geological Society of America Bulletin, 105, 715–737. Colpron, M., Price, R.A., Archibald, D.A., and Carmichael, D.M. 1996. Middle Jurassic exhumation along the western fl ank of the Selkirk fan structure: Thermobarometric and thermochronometric constraints from the Illecillewaet synclinorium, southeastern British Columbia: Geological Society of America Bulletin, v. 108, p. 1372–1392, doi:10.1130/00167606(1996)108<1372:MJEATW>2.3.CO;2. 150 Colpron, M., Warren, M. J., and Price, R. A., 1998. Selkirk fan structure, southeastern Canadian Cordillera:Tectonic wedging against an inherited basement ramp. Geol. Soc. Am. Bull., 110, 1060–1074, doi:10.1130/0016-7606(1998)110<1060:SFSSCC>2.3.CO;2. Colpron, M., Nelson, J.L., and Murphy, D.C. 2007. Northern Cordilleran terranes and their interactions through time. GSA Today, 17, 4-10, doi:10.1130/GSAT01704-5A.1. Coney, P.J., 1972. Cordilleran tectonics and North America plate motion. Am. J. Sci., 272, 603628. Coney, P.J., 1980. Cordilleran metamorphic core complexes: An overview, in Crittenden, M.D., Coney, P.J., and Davis, G.H., eds., Cordilleran Metamorphic Core Complexes. Geological Society of America Memoir 153, 7–13. Coney, P.J., and Harms, T.A., 1984. Cordilleran metamorphic core complexes: Cenozoic extensional relics of Mesozoic compression. Geology, 12, 550–554, doi: 10.1130/00917613(1984)12<550:CMCCCE>2.0.CO;2. Cook, F.A., 1986. Seismic reflection geometry of the Columbia River fault zone and east margin of the Shuswap metamorphic complex in the Canadian Cordillera. Tectonics, 5, 669 - 685. Cook, F.A., Varsek, J.L., Clowes, R.M., Kanasewich, E.R., Spencer, C.S., Parrish, R.R., Brown, R.L., Carr, S.D., Johnson, B.J., and Price, R.A., 1992. Lithoprobe crustal reflection cross section of the southern Canadian Cordillera: 1. Foreland thrust and fold belt to Fraser River Fault. Tectonics, 11, 12–35, doi:10.1029/91TC02332. Corrigan, J.D. 1991. Inversion of apatite fission track data for thermal history information. J Geophys Res 96: 10347-10360 Costantini, J.-M., Trocellier, P., Haussy, J., Grob, J.-J., 2002. Nuclear reaction analysis of helium diffusion in britholite. Nucl. Instrum. Methods B 195, 400–407. Collettini, C. 2011. The mechanical paradox of low-angle normal faults: Current understanding and open questions. Tectonophysics, 510(3), 253-268. Coutand, I. 2012. Field notes. Dalhousie University, Halifax. Crittenden, D., Coney, P.J., and Davis, G.H., 1980. Cordilleran metamorphic core complexes. Geological Society of America, Memoir 153, 490 p. Crowley, J. L. 1997. U-Pb geochronologic constraints on the cover sequence of the Monashee complex, Canadian Cordillera: Paleoproterozoic deposition on basement. Canadian Journal of Earth Sciences 34(7): 1008-1022. Crowley, J.L., 1999. U-Pb geochronologic constraints on Paleoproterozoic tectonism in the Monashee complex, Canadian Cordillera: elucidating an overprinted geologic history. Geological Society of America Bulletin 111, 560-577. 151 Crowley, J. L., and Brown, R. L. 1994. Tectonic links between the Clachnacudainn terrane and Selkirk allochthon, southern Omineca Belt, Canadian Cordillera: Tectonics, v. 13, p. 1035–1051. Crowley, J. L. & Parrish, R. R. 1999. U-Pb isotopic constraints on diachronous metamorphism in the northern Monashee complex, southern Canadian Cordillera. Journal of Metamorphic Geology, 17, 483-502. Crowley, J.L., Brown, R.L., and Parrish, R.R., 2001, Diachronous deformation and a strain gradient beneath the Selkirk allochthon, northern Monashee complex, southeastern Canadian Cordillera: Journal of Structural Geology, 23, 1103–1121, doi:10.1016/S0191-8141(00)00179-6. Crowley, K.D., Cameron, M., and Schaefer, R.L. 1991. Experimental studies of annealing of etched fission tracks in fluorapatite. Geochim Cosmochim Acta 55:1449-1465 Curtin University. John De Laeter Centre For Isotope Research [Internet]. 2013. Curtin University. Curtin University. [cited 2013/10/28]. Available from: http://jdlc.curtin.edu.au/research/geochron.cfm Davis, G.H., 1983, Shear-zone model for the origin of metamorphic core complexes: Geology, 11, 342-347. Davis, A.S., and Plafker, G., 1986. Eocene basalts from the Yakutat terrane; evidence for the origin of an accreting terrane in southern Alaska. Geology, 14, 963–966, doi: 10.1130/00917613(1986)14<963:EBFTYT>2.0.CO;2. Davis, G.A., and Lister, G.S. 1988. Detachment faulting in continental extension: Perspectives from the southwestern U.S Cordillera. Geological Society of America, Special Paper 218. Davis, G.A., Anderson, J.L., Frost, E.G., and Shackelford, T.L. 1979 Regional Miocene detachment faulting and early Tertiary(?) mylonitization, Whipple-Buckskin-Rawhide Mountains, southeastern California and western Arizona, in Abbott, P.L., ed., Geological excursions in the southern California are: San Diego State University, 75-108. Dewey, J.F., 1988. Extensional collapse of orogens. Tectonics 7, 1123-1139. Dodson, M.H., 1973. Closure temperature in cooling geochronological and petrological systems. Contrib. Mineralog. Petrol. 40, 259–274. Donelick, R.A., 1993. A method of fission track analysis utilizing bulk chemical etching of apatite. U.S. Patent # 5,267,274 Donelick, R.A. 1995. A method of fission track analysis utilizing bulk chemical etching of apatite. Australia Patent # 658,800 Donelick, R.A., O’Sullivan, P.B., and Ketcham, R. A. 2005. Apatite fission track analysis. Reviews in Mineralogy and Geochemistry. 58: 49-94. 152 Dostal, J., Breitsprecher, K., Church, B.N., Thorkelson, D.J., Hamilton, T.S., 2003. Eocene melting of Precambrian lithospheric mantle: analcime-bearing volcanic rocks from the Challis-Kamloops Belt of south central British Columbia. Journal of Volcanology and Geothermal Research, 126, 303-326. Dumitru, T. 2000. Fission-track geochronology. Quaternary Geochronology: Methods and applications. Dumitru, T. 1993. A new computer-automated microscope stage system for fission-track analysis. Nucl. Tracks Radiat. Meas., 21(4): 575-580. Duncan, R.A., 1982. A captured island chain in the Coast Range of Oregon and Washington. Journal of Geophysical Research, 87, 10,827–10,837. Duncan, I.J., 1984. Structural evolution of the Thor-Odin gneiss dome. Tectonophysics 101, 87130. Dunlap A, Jaskierowicz G, Jensen J, Della-Negra S (1997) Track separation due to dissociation of MeV C60 inside a solid. Nucl Instr Methods B 132:93-98 Ehlers, T. A. 2005. Crustal Thermal Processes and the Interpretation of Thermochronometer Data. Reviews in Mineralogy and Geochemistry. Vol. 58, pp. 315-350 Ehlers, T. A. and Farley, K. A. 2003. Apatite (U-Th)/He thermochronometry: methods and applications to problems in tectonic and surface processes. Earth and Planetary Sci Letters. 206: 1-14. Ehlers, T., Armstrong, P., and Chapman, D. 2001. Normal fault thermal regimes and the interpretation of low-temperature thermochronometers. Physics of the Earth and Planetary Interiors 126, 179–194. Engebretson, D.C., Cox, A., and Gordon, R.G., 1984. Relative motions between oceanic plates of the Pacific basin. J. Geophys. Res. 89, 10,291–10,310 Engebretson, D.C., Kelley, K.P., Cashman, H.P., and Richards, M.A., 1992. 180 million years of subduction. GSA Today, 2, 93-100. Engebretson, D.C., Cox, A., and Gordon, R.G., eds., 1985. Relative motions between oceanic and continental plates in the Pacific Basin. Geological Society of America Special Paper 206, 1-59. Ewing, T. E. 1980. Paleogene Tectonic Evolution of the Pacific Northwest. The Journal of Geology 88(6): 619-638. England, P.C., Houseman, G.A., 1988. The mechanics of the Tibetan plateau. Philos. Trans. R. Soc. London 326, 301–320. England, P.C., Houseman, G.A., 1989. Extension during continental convergence, with application to the Tibetan Plateau. J. Geophys. Res. 94, 17561– 17579. 153 Ewing, T.E., 1980, Paleogene tectonic evolution of the Pacifi c Northwest: The Journal of Geology, v. 88, p. 619–638, doi:10.1086/628551. Ewing, R.C., Meldrum, A.,Wang, L.M.,Weber,W.J., Corrales, L.R., 2003. Radiation effects in zircon. In: Hanchar, J.M., Hoskin, P.W.O. (Eds.), Zircon: Reviews in Mineralogy and Geochemistry, vol. 53, pp. 387–425. Farley, K.A., 2000. Helium diffusion from apatite: general behavior as illustrated by Durango fluorapatite. J. Geophys. Res. 105, 2903–2914. Farley, K.A., 2002. (U-Th)/ He dating; techniques, calibrations, and applications, in: Noble gases in geochemistry and osmochemistry, Vol. Rev. in Mineralogy and Geochemistry 47 (ed. D. Porcelli, C. J. Ballentine and R. Wieler), pp. 819–843. Min. Soc. Am. Farley, K.A.,Wolf, R.A., Silver, L.T., 1996. The effects of long-stopping distances on (U–Th)/He ages. Geochim. Cosmochim. Acta 60, 4223–4229. Fassoulas, C., Kilias, A., and Mountrakis, D. 1994. Postnappe stacking extension and exhumation of high pressure/low-temperature rocks in the island of Crete, Greece, Tectonics, 13, 127 – 138. Fayon, A.K., Peacock, S.M., Stump, E. and Reynolds, S.J. 2000. Fission track analysis of the footwall of the Catalina detachment fault, Arizona: Tectonic denudation, magmatism, and erosion. Journal of Geophysical Research, 105(B5), 11,047-11,062 Fayon, A.K., Peacock, S.M., Stump, E., and Reynolds, S.J. 2000. Fission track analysis of the footwall of the Catalina detachment fault, Arizona: Tectonic denudation, magmatism, and erosion. Journal of Geophysical Research, 105 (B5), 11,047-11,062. Fitzgerald, P., and Gleadow, A.J.W. 1990. New approaches in fission track geochronology as a tectonic tool: Examples from the Transantarctic Mountains. Nucl Tracks Radiat Meas 17:351-357 Fitzgerald, P. G., Fryxell, J. E. and Wernicke, B. P. 1991. Miocene crustal extension and uplift in southeastern Nevada: constraints from fission track analysis. Geology, 19, 1013-1016. Fleischer R.L., Price P.B., Walker, R.M. 1965. Ion explosion spike mechanism for formation of charged particle tracks in solids. J Appl Phys 36:3645-3652 Fleischer, R.L., Price, P.B., and Walker, R.M. 1975. Nuclear tracks in solids: Principles and applications. University of California Press: Berkeley. Flowers, R., Shuster, D., Wernicke, B., Farley, K., 2007. Radiation damage control on apatite (U– Th)/He dates from the Grand Canyon region, Colorado Plateau. Geology, 35 (5), 447–450. Friedlander, G., Kennedy, J.W., Macias, E.S., Miller, J.M. 1981. Nuclear and Radiochemisty. John Wiley and Sons, New York. Fossen, H. 1999. Extensional tectonics in the Caledonides: Synorogenic or postorogenic?, Tectonics, 19, 213 – 224. 154 Foster, D. A. and John, B. E. 1999. Quantifying tectonic exhumation in an extensional orogen with thermochronology: examples from the southern Basin and Range Province. In: Ring, U., Brandon, M. Z.,Lister, G. S. & Willett, S. D. (eds) Exhumation Processes: Normal Faulting, Ductile Flow and Erosion. Geological Society, London, Special Publications, 154, 343-364. Foster, D.A., and Raza, A., 2002. Low-temperature thermochronological record of exhumation of the Bitterroot metamorphic core complex, northern Cordilleran orogen: Tectonophysics (349), 23–36, doi: 10.1016/S0040-1951(02)00044-6. Foster, D. A., Gleadow, A.J.W., Reynolds, S.J., and Fitzgerald, P. G. 1993. Denudation of metamorphic core complexes and the reconstruction of the transition zone, west‐central Arizona: Constraints from apatite fission‐track thermochronology, J. Geophys. Res., 98, 2167– 2185, doi:10.1029/92JB02407. Foster, D.A., Howard, K. A. and John, B. E. 1994. Thermochronologic constraints on the development of metamorphic core complexes in the lower Colorado River area. US Geological Survey Circular, 1107, 103. Foster, G., Parrish, R. R., Horstwood, M. S. A., Chenery, S., Pyle, J. and Gibson, H. D. 2004. The generation of prograde P-T-t points and paths; a textural, compositional, and chronological study of metamorphic monazite. Earth and Planetary Science Letters, 228, 125–142. Froitzheim, N., and Eberli, G.P. 1990. Extensional detachment faulting in the evolution of a Tethys passive continental margin, Eastern Alps, Switzerland, Geol. Soc. Am. Bull., 102, 1297– 1308, doi:10.1130/0016-7606(1990)102<1297:EDFITE>2.3.CO;2. Gabrielse, H., and Campbell, R.B., 1991. Chapter 6: Upper Proterozoic Assemblages, in Gabrielse, H., and Yorath, C.J., ed., Geology of the Cordilleran Orogen in Canada: Geological Survey of Canada, v. Geology of Canada,No. 4 (also Geological Society of America, Geology of North America, v. G-2), 125–150. Gabrielse, H., and Yorath, C. J., 1991. Tectonic synthesis, Chapter 18 h Geology of the Cordilleran Orogen in Canada, H. Gabrielse and C. J. Yorath (ed.); Geological Survey of Canada, Geology of Canada, no. 4, p. 677-705 (Geological Society of America, The Geology of North America, v. G-2) Gabrielse, H., Monger, J. W. H., Wheeler, J.O. and Yorath, C.J. 1991. Part A. Morphogeological belts, tectonic assemblages, and terranes; in Chapter 2 of Geology of the Cordilleran Orogen in Canada. H. Gabrielse and C. J. Yorath (ed.); Geological Survey of Canada, Geology of Canada, no. 4, p. 15-28. Galbraith, R.F. 2005. Statistics for fission track analysis. Chapman & Hall/CRC: Boca Raton FL. Gallagher, K. 1995. Evolving temperature histories from apatite fission-track data. Earth Planet Sci Lett 136: 421-435 Gallagher, K., Brown, R., Johnson, C.1998. Fission track analysis and its applications to geological problems. Ann Rev Earth Planet Sci 26:519-572 155 Gautheron, C., Tassan-Got, L., Barbarand, J., and Pagel, M. 2009. Effect of alpha-damage annealing on apatite (U–Th)/He thermochronology. Chemical Geology 266 (2009) 157–170 George, E. T., and D. L. Whitney (2012b), Corona networks as three-dimensional records of transport scale and pathways during metamorphism, Geology, 40(2), 183–186. Gervais, F., and Brown, R.L. 2011. Testing modes of exhumation in collisional orogens: Synconvergent channel fl ow in the southeastern Canadian Cordillera: Lithosphere, v. 3, no. 1, p. 55–75, doi:10.1130/L98.1. Gervais, F., Brown,R.L., and Crowley, J.L. 2010. Tectonic implications for a Cordilleran orogenic base in the Frenchman Cap dome, southeastern Canadian Cordillera, J. Struct. Geol., 32(7), 941– 959. Gessner, K., Ring,U., Johnson,C., Hetzel, R., Passchier, C.W., and Gungor , T. 2001. An active bivergent rolling-hinge detachment system: The Central Menderes metamorphic core complex in western Turkey, Geology, 29, 611 – 614. Ghent, E.D., Nicholls, J., Stout, M.Z., and Rottenfusser, B., 1977, Clinopyroxene amphibolite boudins from Three Valley Gap, British Columbia: The Canadian Mineralogist, v. 15, p. 269–282. Gibson, H. D. 2003. Structural and thermal evolution of the northern Selkirk Mountains, southeastern Canadian Cordillera: Tectonic development of a regional-scale composite structural fan. PhD thesis, Carleton University. Gibson, H.D., Brown, R.L., and Parrish, R.R., 1999, Deformation-induced inverted metamorphic field gradients, an example from southeastern Canadian Cordillera: Journal of Structural Geology, v. 21, no. 7, p. 751–767, doi:10.1016/S0191-8141(99)00051-6. Gibson, H.D., Brown, R.L., and Carr, S.D., 2008. Tectonic evolution of the Selkirk fan, southeastern Canadian Cordillera: A composite Middle Jurassic–Cretaceous orogenic structure. Tectonics, 27, doi:10.1029/2007TC002160. Gleadow, A.J.W., Belton, D.X., Kohn, B.P., and Brown, R.W. 2002. Fission track dating of phosphate minerals and the thermochronology of apatite. Rev Mineral Geochem 48:579-630 Gleadow, A.J.W., Duddy, I.R., Green, P.F., and Lovering, J.F. 1986. Confined fission track lengths in apatite: a diagnostic tool for thermal history analysis. Contrib Mineral Petrol 94:405-415 Glombick, P., Thompson, R., Erdmer, P., and Daughtry, K., 2006a. A reappraisal of the tectonic significance of Early Tertiary low-angle shear zones exposed in the Vernon map area (82 L), Shuswap metamorphic complex, southeastern Canadian Cordillera. Canadian Journal of Earth Sciences, 43, 245–268, doi:10.1139/e05-101. Glombick, P., Thompson, R., Erdmer, P., Heaman, L., Friedman, M., Villeneuve, M., and Daughtry, K., 2006b. U-Pb constraints on the thermotectonic evolution of the Vernon antiform and the age of the Aberdeen gneiss complex, southeastern Canadian Cordillera. Canadian Journal of Earth Sciences, 43, 213–244, doi:10.1139/e05-096. 156 Goergen, E.T., and D.L. Whitney (2012a),Long length scales ofelementtransport during reactiontexture development in orthoamphibolecordierite gneiss: Thor-Odin dome, British Columbia, Canada, Contrib. Mineral. Petrol., 163(2), 337–352. Gordey, S.P., Geldsetzer, H.H.J., Morrow, D.W., Bamber, E.W., Henderson, C.M., Richards, B.C., McGugan, A., Gibson, D.W., and Poulton, T.P., 1991. Part A. Ancestral North America; in Upper Devonian to Middle Jurassic assemblages, Chapter 8 of Geology of the Cordilleran Orogen in Canada, H. Gabrielse and C.J. Yorath (ed.); Geological Survey of Canada, Geology of Canada, 4, 219-327 (also Geological Society of America, The Geology of North America, v. (G-2) Gosset, D., Trocellier, P., Serruys, Y., 2002. Determination of the helium diffusion coefficient in nuclear waste storage ceramics by a nuclear reaction analysis method. J. Nucl. Mater. 303, 115– 124. Grasemann, B. and Dunkl, I. (2003): Effects of the geometry of normal faulting on the near surface heat flow during extension: the example of the Rechnitz Metamorphic Core Complex (Austria). Mitteilungen der Österreichischen Geologischen Gesellschaft, 93, 87-104. Green, P.F.1985. A comparison of zeta calibration baselines for apatite zircon and sphene. Chem Geol (Isot Geosci Sect) 58 : 1-22 Green, P.F., and Durrani, S.A., 1977. Annealing studies of tracks in crystals. Nucl. Tracks 1, 33– 39 Green, P.F., Duddy, I.R., Gleadow, A.J.W., Tingate, P.R., and Laslett, G.M. 1986. Thermal annealing of fission tracks in apatite 1. A qualitative description. Chem Geol 59:237-253 Green, P.F., Duddy, I.R., Gleadow, A.J.W., and Lovering, J.F. 1989a. Apatite fission-track analysis as a paleotemperature indicator for hydrocarbon exploration. In: Thermal History of Sedimentary Basins: Methods and Case Histories. Naeser ND, McCulloh TH (eds) Springer-Verlag, New York, p 181-195 Green, P.F., Duddy, I.R., Laslett, G.M., Hegarty, K.A., Gleadow, A.J.W., and Lovering, J.F. (1989b) Thermal annealing of fission tracks in apatite 4. Quantitative modeling techniques and extension to geological timescales. Chem Geol 79:155-182 Haeussler, P.J., Bradley, D., Goldfarb, R., and Snee, L., 1995. Link between ridge subduction and gold mineralization in southern Alaska. Geology, 23, 995–998. Haeussler, P.J., Wells, R.E., Blakely, R.J., Murphy, J., and Wooden, J.L., 2000. Structure and timing of movement on the Seattle fault at Green and Gold Mountains, Kitsap Peninsula, Washington. Geological Society of America Abstracts with Programs, 32 (6), A-16. Haeussler, P.J., Bradley, D.C., Wells, R.E., and Miller, M.L., 2003. Life and death of the Resurrection plate: Evidence for its existence and subduction in the northeastern Pacific in Paleocene–Eocene time. GSA Bulletin, 115(7) 867–880. Hazen, R.M., Ewing, R.C., and Sverjensky, D.A. 2009. Evolution of uranium and thorium minerals. American Mineralogist, Volume 94, pages 1293–1311, 2009 157 Helwig, J., and Emmet, P., 1981. Structure of the early Tertiary Orca Group in Prince William Sound and some implications for the plate tectonic history of southern Alaska. Journal of the Alaska Geological Society, 1, 12–35. Hetzel, R., Ring, U., Akal, C., and Troesch, M. 1995. Miocene NNE-directed extensional unroofing in the Menderes massif, western Turkey, J. Geol. Soc. London, 152, 639 – 654. Hiess, J., Condon, D.J. McLean, N., Noble, S.R. 2012. 238U/235U Systematics in Terrestrial Uranium-Bearing Minerals. Science 335, 1610 Hinchey, A.M., and S.D. Carr(2007),Protolith composition of cordierite-gedrite basement rocks and garnet amphibolite of the Bearpaw lake area of the Thor-Odin dome, Monashee Complex, British Columbia, Canada, Can. Mineral., 45(3), 607–629. Hinchey,A.M.,S.D.Carr,P.D.McNeill,andN.Rayner(2006),Paleocene-Eocenehigh-grade metamorphism,anatexis,and deformation in the Thor-Odin dome, Monashee complex, southeastern British Columbia, Can. J. Earth Sci., 43, 1341–1365. , doi:10.1139/E06-028. Hourigan, J.K., Peterman, E., and Grove, M. In review. A high precision diode laser microfurnace for noble gas geochemistry. Hourigan, J. K., Reiners, P.W., and Brandon M. T. 2005. U-Th zonation-dependent alpha-ejection in (U-Th)/He chronometry. Geochimica et Cosmochimica Acta. 69(13)3349-3365. House, M.A.,Wernicke, B.P., Farley, K.A., Dumitru, T.A., 1997. Cenozoic thermal evolution of the central Sierra Nevada, California, from (U–Th)/He thermochronometry. Earth Planet. Sci. Lett. 151, 167–179. Hurford, A.J. 1990. Standardization of fission track dating calibration: Recommendation by the Fission Track Working Group of the I. U. G. S. Subcommission on Geochronology. Chem Geol 80:171-178 Hurford, A.J., and Carter, A. 1991. The role of fission track dating in discrimination of provenance. In: Developments in Sedimentary Provenance Studies. Morton AC, Todd SP, Haughton PDW (eds) Geol Soc Spec Pub 57:67-78 Hyndman, R.D., and Hamilton, T.S., 1993. Queen Charlotte area Cenozoic tectonics and volcanism and their association with relative plate motions along the northeastern Pacific margin. Journal of Geophysical Research, 98(B8), 14,257–14,277 Ickert, R.B., Thorkelson, D.J., Marshall, D.D., and Ullrich, T.D., 2009. Eocene adakitic volcanism in southern British Columbia: Remelting of arc basalt above a slab window. Tectonophysics, 464, 164-185. doi:10.1016/j.tecto.2007.10.007. John, B.E., and Foster, D.A. 1993. Structural and thermal constraints on the initiation angle of detachment faulting in the southern Basin and Range: the Chemehuevi Mountains case study. Geological Society of America Bulletin, 105, 1091-1108. 158 John, B . E., and K. A. Howard, K.A. 1995. Rapid extension recorded by cooling age patterns and brittle deformation, Naxos, Greece, J. Geophys. Res., 100, 9969-9979 Johnson, B.J., 1989. Geology of the west margin of the Shuswap terrane near Sicarnous: implications for Tertiary extensional tectonics (82 L, M). In Geological fieldwork, 1988. British Columbia Ministry of Energy, Mines. and Petroleum Resources, Paper 1989- 1, 49 -54. Johnson, B.J. 1990. Geology adjacent to the western margin of the Shuswap metamorphic complex (parts of 82 L, M). British Columbia Ministry of Energy, Mines, and Petroleum Resources, Open File 1 990-30. Johnson, B., 1994. Structure and Tectonic Setting of the Okanagan Valley Fault System in the Shuswap Lake Area, Southern British Columbia [Ph.D. thesis]: Ottawa, Ontario, Canada, Carleton University, 266 p. Johnson, B., 2006. Extensional shear zones, granitic melts, and linkage of overstepping normal faults bounding the Shuswap metamorphic core complex, British Columbia. Geological Society of America Bulletin, 118(3/4), 366–382, doi:10.1130/B25800.1. Johnson, B., and Brown, R., 1996. Crustal structure and Early Tertiary extensional tectonics of the Omineca belt at 51°N latitude, southern Canadian Cordillera. Canadian Journal of Earth Sciences, 33, 1596–1611, doi:10.1139/e96-121. Johnston, D.H., Williams, P.F., Brown. R.L., Crowley, J.L. and Carr, S.D. 2000. Northeastward extrusion and extensional exhumation of crystalline rocks of the Monashee complex, southeastern Canadian Cordillera. Journal of Structural Geology, 22, 603–625. Journeay, J.M., 1986. Stratigraphy, internal strain and thermotectonic evolution of northern Frenchman Cap dome: an exhumed duplex structure, Omineca hinterland, S.E. Canadian Cordillera. Ph.D. thesis, Queen's University, Kingston, Ont. Journeay, J.M., and Brown, R.L., 1986. Major tectonic boundaries of the Omineca belt in southern British Columbia: a progress report. In: Current research, Part A. Geological Survey of Canada, Paper 86-1A, 81-88. Kellett, D. A. and Grujic, D. 2012. New insight into the South Tibetan detachment system: Not a single progressive deformation, Tectonics, 31, doi:10.1029/2011TC002957. Ketcham, R. A. 1996. Thermal models of core‐complex evolution in Arizona and New Guinea: Implications for ancient cooling paths and present‐day heat flow, Tectonics, 15, 933–951, doi:10.1029/96TC00033. Ketcham, R. A., 2003, Observations on the relationship between crystallographic orientation and biasing in apatite fission-track measurements: American Mineralogist, v. 88, p. 817. Ketcham, R.A. 2005. Forward and inverse modeling of low-temperature thermochronometry data. Reviews in Mineralogy and Geochemistry, 58, 275–314. 159 Ketcham, R. A., 2009, HeFTy Version 1.6.7: Manual. Ketcham,R.A. 2013. HeFTy manual version 1.8.0. Apatite to Zircon Inc, Idaho, United States Ketcham, R.A, Donelick, R.A., Carlson, W.D. 1999. Variability of apatite fission-track annealing kinetics. III. Extrapolation to geological time scales. Am. Mineral. 84:1235–55 Ketcham, R.A., Donelick, R.A., Donelick, M.B. 2000. AFTSolve: A program for multi-kinetic modeling of apatite fission-track data. Geol Mater Res 2:1-32 Ketcham, R.A., Carter, A., Donelick, R. A., Barbarand, J., Hurford, A. J. 2007. Improved modelling of fission-track annealing in apatite. American Mineralogist, 92, 789–798. Ketcham, R. A., Donelick, R. A., Balestrieri, M. L., and Zattin, M., 2009, Reproducibility of apatite fission-track length data and thermal history reconstruction: Earth and Planetary Science Letters, v. 284, p. 504-515. Kruse, S., and Williams, P.F. 2005. Brittle faulting in the Thor–Odin culmination, Monashee complex, southern Canadian Cordillera: constraints on geometry and kinematics. Can. J. Earth Sci. 42: 2141–2160. Lane, L.S., 1984. Brittle deformation in the Columbia River fault zone near Revelstoke, southeastern British Columbia. Can. J. Earth Sciences, 21, 584-598 Lane, L.S., Ghent, E.D., Stout, M.Z., and Brown, R.L., 1989. P-T history and kinematics of the Monashee décollement near Revelstoke, British Columbia. Canadian Journal of Earth Sciences, 26, 231-243. Laslett, G.M., Kendall, W.S., Gleadow, A.J.W., Duddy, I.R. 1982. Bias in measurement of fissiontrack length distributions. Nucl Tracks 6:79-85 Laslett, G.M., Green, P.F., Duddy, I.R., and Gleadow, A.J.W. 1987. Thermal annealing of fission tracks in apatite 2. A quantitative analysis. Chem Geol 65:1-13 Lederer, C.M., Hollander, J.M., Perlman, I. 1967. Table of isotopes, 6th Edition. John Wiley, New York Lisker, F.,Ventura, B., Glasmacher, U. A. 2009. Thermochronological Methods: From Palaeotemperature Constraints to Landscape Evolution Models. Geological Society, London, Special Publications, 324, 1–23. Lister, G. S., and Baldwin, SL. 1996. Modelling the effect of arbitrary P-T-t histories on argon diffusion in minerals using the MacArgon program for the Apple Macintosh, Tectonophysics, 253, 83 – 109. Lister, G.S., Banga, G., and Feenstra, A., 1984, Metamorphic core complexes of Cordilleran type in the Cyclades Aegean Sea, Greece: Geology, v. 12, p. 221–225, doi:10.1130/00917613(1984)12<221:MCCOCT>2.0.CO;2. 160 Liu, M., 2001. Cenozoic extension and magmatism in the North American Cordillera: The role of gravitational collapse: Tectonophysics, v. 342, p. 407–433. Lonsdale, P., 1988. Paleogene history of the Kula plate. Geological Society of America Bulletin, 100, 733–754. Lorencak, M., Burg, J.P., Seward, D., Vanderhaeghe, O. and Teyssier, C. 2001. Low-temperature cooling history of the Shuswap metamorphic core complex, British Columbia: Constraints from apatite and zircon fission-track ages. Canadian Journal of Earth Sciences, 38, 1615–1625. Lutz, T.M., and Omar, G. 1991. An inverse method of modeling thermal histories from apatite fission-track data. Earth Planet Sci Lett 104:181-195 Madsen, J.K., Thorkelson, D.J., Friedman, R.M., and Marshall, D.D., 2006. Cenozoic to Recent plate configurations in the Pacific Basin: ridge subduction and slab window magmatism in western North America. Geosphere, 2, 1-34 (with additional multimedia) doi: 10.1130/GES00020.1. Malavieille, J., 1993. Late orogenic extension in mountain belts: insights from the basin and range and the late Paleozoic Variscan belt. Tectonics 12, 1115– 1130 Manatschal, G. 2004. New models for evolution of magma‐poor rifted margins based on a review of data and concepts from West Iberia and the Alps, Int. J. Earth Sci., 93, 432–466, doi:10.1007/s00531-004-0394-7. Mancktelow, N.S., and Grasemann, B. 1997. Time-dependent effects of heat advection and topography on cooling histories during erosion. Tectonophysics 270: 167-195 Mantovani, E., Viti, M., Babbucci, D., Tamburelli, C., and Albarello, D. 2001., Back arc extension: Which driving mechanism?, J. Virtual Explorer, 3, 17 – 45. Marshak, R.S., and Karig, D.E., 1977. Triple junctions as a cause for anomalously near-trench igneous activity between the trench and volcanic arc. Geology, 5, 233–236. McClaughry, J.D., and Gaylord, D.R., 2005. Middle Eocene sedimentary and volcanic infilling of an evolving supradetachment basin: White Lake Basin, south-central British Columbia. Canadian Journal of Earth Sciences, 42, 49–66, doi:10.1139/e04-105. McMillan, W. J., 1970, West flank, Frenchman's Cap gneiss dome, Shuswap terrane, British Columbia, in Wheeler, J. 0., ed., Structure of the southern Canadian Cordillera: Geological Association of Canada Special Paper 6, p. 99-106. McMillan, W.J., 1973. Petrology and structure of the west flank, Frenchman Cap dome, near Revelstoke, British Columbia, Geological Survey of Canada, Paper 71-29. McNicoll, V.J., Brown, R.L., 1995. The Monashee décollement at Cariboo Alp, southern flank of the Monashee complex, southern British Columbia, Canada. Journal of Structural Geology, 17, 17-30. 161 Meldrum, A., Boatner, L.A., Ewing, R.C.,1997. Displacive radiation effects in the monazite and zircon-structure orthophosphates. Phys. Rev. B56, 13805–13814. Meldrum, A., Zinkle, S.J., Boatner, L.A., Ewing, R.C., 1999. Heavy-ion irradiation effects in the ABO4 orthosilicates: decomposition, amorphization, and recrystallization. Phys. Rev. B 59, 3981– 3992. Miller E.L., Dumitru T.A., Brown R, Gans P.B. 1999. Rapid Miocene slip on the Snake Range-Deep Creek Range fault system, east-central Nevada. Geol Soc Am Bull 111:886-905 Miro, S., Studer, F., Costantini, J.-M., Haussy, J., Trouslard, P., Grob, J.-J., 2006. Effect of composition on helium diffusion in fluoroapatites investigated with nuclear reaction analysis. J. Nucl. Mater. 355, 1–9. Miro, S., Studer, F., Costantini, J.-M., Berger, P., Haussy, J., Trouslard, P., Grob, J.-J., 2007. Effect of gold ion irradiation on helium migration in fluoroapatites investigated with nuclear reaction analysis. J. Nucl. Mater. 362, 445–450. Molnar, P., England, P., and Martinod, J., 1993. Mantle dynamics, uplift of the Tibetan Plateau, and the Indian Monsoon. Rev. Geophys., 357-396. Monger, J.W.H., 1977. Upper Paleozoic rocks of the western Canadian Cordillera and their bearing on Cordilleran evolution. Canadian Journal of Earth Sciences, 14, 1832–1859. Monger, J.W.H., and Berg, H.C., 1984. Lithotectonic terrane map of western Canada and southeastern Alaska. In: Silberling, N.J., Jones D.L. (Eds.), Lithotectonic terrane maps of the North American Cordillera. U.S. Geological Survey Open File Report 84-523. Monger, J.W.H., and Irving, E., 1979. The Canadian Cordilleran collage. Geological Society of America, Abstracts with Programs, 11, p. 482. Monger, J.W.H. and Journeay, J.M., 1994. Guide to the geology and tectonic evolution of the southern Coast Mountains, Geol Survey of Canada Open File 2490, 77p. Monger, J., and Price, R.A., 2002. The Canadian Cordillera: Geology and Tectonic Evolution, CSEG Recorder, 17-36. Monger, J. W. H., Souther, J. G. and Gabrielse, H. 1972. Evolution of the Canadian Cordillera; a plate-tectonic model. American Journal of Science 272 (7): 577-602. Monger, J.W.H., Price, R.A., and Tempelman-Kluit, D.J., 1982. Tectonic accretion and the origin of the two major metamorphic and plutonic welts in the Canadian Cordillera. Geology, 10, 70– 75, doi:10.1130/0091-7613(1982)10<70:TAATOO>2.0.CO;2. Moore, M.A., and England, P.C. 2001. On the inference of denudation rates from cooling ages of minerals:Earth and Planetary Science Letters, v. 185, p. 265–284. 162 Morrison J., and Anderson J. L. 1998. Footwall refrigeration along a detachment fault: implications for the thermal evolution of core complexes. Science 279:63–66. Murphy, D.C., 1987. Suprastructure-infrastructure transition, east-central Cariboo Mountains, British Columbia: geometry, kinematics, and tectonic implications. Journal of Structural Geology, 9, 13-29. Naeser, C.W. 1979. Fission-track dating and geologic annealing of fission tracks. In: Lectures in Isotope Geology. Jager E, Hunziker JC (eds) Springer-Verlag, Berlin, p 154-169 Nasdala, L., Hanchar, J.M., Kronz, A., Whitehouse, M.J., 2004. Long-term stability of alpha particle damage in natural zircon. Chem. Geol. 220, 83–103. Norlander, B.H., Whitney, D.L., Teyssier, C., and Vanderheaghe, O., 2002. Partial melting and decompression of the Thor-Odin dome, Shuswap metamorphic core complex, Canadian Cordillera, Lithos, 61, 103 – 125, doi:10.1016/S0024-4937(02)00075-0. Nyman, M.W., Pattison, D.R.M., and Ghent, E.D., 1995, Melt extraction during formation of Kfeldspar-sillimanite migmatites, west of Revelstoke, British Columbia: Journal of Petrology, v. 36, p. 351–372. Okulitch, A.V., 1973. Age and correlation of the Kobau Group, Mount Kobau, British Columbia. Canadian Journal of Earth Sciences, 10, 1508-1518. Okulitch, A.V., 1979a. Lithology, stratigraphy, structure and mineral occurrences of the Thompson - Shuswap – Okanagan area, British Columbia. Geological Survey of Canada, Open File 637. Okulitch, A.V., 1979b. Geology and mineral occurrences of the Thompson-Shuswap-Okanagan region, south-central British Columbia. Geological Survey of Canada Open File 637, scale 1:250,000, 3 sheets. Okulitch, A.V., 1984. The role of the Shuswap metamorphic complex in Cordilleran tectonism: A review. Canadian Journal of Earth Sciences, 21, 1171–1193, doi:10.1139/e84-123. Okulitch, A.V., Wanless, R.K., and Loveridge, W.D. 1975. Devonian plutonism in south-central British Columbia. Canadian Journal of Earth Sciences, 2, 1760 - 1769. Ouchani, S., Dran, J.-C., Chaumont, J., 1998. Exfoliation and diffusion following helium ion implantation in fluorapatite: implications for radiochronology and radioactive waste disposal. Appl. Geochem. 13, 707–714. Palenik, C.S., Ewing, R.C., 2002. Microanalysis of radiation damage across a zoned zircon crystal. Scientific Basis for NuclearWaste Management XXV. Symposium, Materials Research Society Symposium Proceedings, vol. 713, pp. 521–526. Palenik, C.S., Nasdala, L., Ewing, R.C., 2003. Radiation damage in zircon. Am. Mineral. 88, 770– 781. 163 Parkinson, D.L., 1985, U-Pb Geochronology and Regional Geology of the Southern Okanagan Valley, British Columbia: The Western Boundary of a Metamorphic Core Complex [M.S. thesis]: Vancouver, British Columbia, Canada, University of British Columbia, 149 p Parkinson, D.L., 1991. Age and isotropic character of early Proterozoic basement gneisses in the southern Monashee complex, southeastern British Columbia. Canadian Journal of Earth Sciences 28, 1159-1168. Parkinson, D.L., 1992. Age and tectonic evolution of the southern Monashee complex, southeastern British Columbia: a windowinto the deep crust. Ph.D. thesis, University of California, Santa Barbara, Calif. Parrish, R.R., 1995. Thermal evolution of the southeastern Canadian Cordillera. Canadian Journal of Earth Sciences, 32, 1618–1642, doi:10.1139/e95-130. Parrish, R.R., and Armstrong, R.L. 1987. The ca. 162 Ma Galena Bay stock and its relationship to the Columbia River fault zone, southeast British Columbia. In Radiogenic age and isotopic studies: Report 1. Geological Survey of Canada, Paper 87-2, pp. 25-32. Parrish, R.R., and Wheeler, J.O. 1983. A U-Pb zircon age of the Kuskanax batholith, southeastern British Columbia. Canadian Journal of Earth Sciences, 20: 1751 -1756. Parrish, R.R., Carr, S.D., and Parkinson, D.L., 1988. Eocene extensional tectonics and geochronology of the southern Omineca Belt, British Columbia and Washington. Tectonics, 7, 181–212, doi:10.1029/TC007i002p00181. Paul, T.A. 1993. Transmission electron microscopy investigation of unetched fission tracks in fluorapatite—physical process of annealing. Nucl Tracks Radiat Meas 21:507-511 Paul, T.A., and Fitzgerald, P.G. 1992. Transmission electron microscopic investigation of fission tracks in fluorapatite.Am Mineral 77:336-344 Pavlis, T.L., and Sisson, V.B., 1995. Structural history of the Chugach metamorphic complex in the Tana River region, eastern Alaska: A record of Eocene ridge subduction. Geological Society of America Bulletin,107, 1333–1355. Platt, J.P., 1986. Dynamics of orogenic wedges and the uplift of high-pressure metamorphic rocks. Geol. Soc. Am. Bull. 97, 1106– 1121. Platt, J.P., and Vissers, R.L.M., 1989. Extensional collapse of thickened continental lithosphere: a working hypothesis for the Alboran Sea and Gibraltar arc. Geology 17, 540– 543. Platt, J. P., Whitehouse, M. J., Kelley, S. P., Carter, A., and Hollick, L. 2003. Simultaneous extensional exhumation across the Alboran Basin: Implications for the causes of late orogenic extension, Geology, 31, 251 – 254. Press, W.H., Flannery, B.P., Teukolsky, S.A., Vettering, W.T. 1988. Numerical Recipes in C. Cambridge University Press, Cambridge 164 Price, R.A., 1981. The Cordilleran foreland thrust and fold belt in the southern Canadian Rocky Mountains. In Thrust and nappe tectonics. Edited by K.R. McClay and N.J. Price. Geological Society of London, Special Publication 9, 427 -488. Price, R.A., 1986. The southeastern Canadian Cordillera: Thrust faulting, tectonic wedging, and delamination of the lithosphere. J. Struct. Geol., 8, 239 –254, doi:10.1016/0191-8141(86)900465. Price, R. A. and D. M. Carmichael. 1986. Geometric test for Late Cretaceous- Paleogene intracontinental transform faulting in the Canadian Cordillera. Geology 14(6): 468-471 Price, R.A., and Monger, J.W.H. 2000. A transect of the southern Canadian Cordillera from Calgary to Vancouver field guide. Price, R.A. and Mountjoy, E.W., 1970. Geological structure of the Canadian Rocky Mountains between Bow and Athabasca Rivers – A progress report. In: WHEELER, J. O. (ed.) Structure of the Southern Canadian Cordillera. Geological Association of Canada, Special Paper, 7–25. Ranalli, G., Brown, R.L. and Bosdachin, R., 1989. A geodynamic model for extension in the Shuswap core complex, southeastern Canadian Cordillera. Canadian Journal of Earth Sciences, 26, 1647–1653. Read, P.B., 1980. Stratigraphy and structure: Thor-Odin to Frenchman Cap “domes”, Vernon east-half map area, southern British Columbia. In: Current research, Part A. Geological Society of Canada, Paper 80-1A, 19-25. Read, P.B. and Brown, R.L. 1981. Columbia River fault zone: southeastern margin of the Shuswap and Monashee complexes, southern British Columbia. Canadian Journal of Earth Sciences, 18, 1127–1145. Read, P.B., and Wheeler, J.0., 1976. Geology, Lardeau west half, British Columbia. Geological Survey of Canada, Open File 432. Reich, M., Ewing, R.C., Ehlers, T.A., Becker, U., 2007. Low-temperature anisotropic diffusion of helium in zircon: implications for zircon (U–Th)/He thermochronometry. Geochim. Cosmochim. Acta 71, 3119–3130. Reiners, P.W., 2005. Zircon (U-Th)/He thermochronometry. Rev. Min. Geochem. 58, 151-179. Reiners, P.W., and Brandon, M.T. 2006. Using Thermochronology to understand orogenic erosion. Annu. Rev. Earth Planet. Sci., 34:419–66 Reiners, P.W., and Brandon, M.T. 2006. Using Thermochronology to understand orogenic erosion. Annu. Rev. Earth Planet. Sci., 34:419–66 Reiners, P.W., and Shuster, D.L. 2009. Thermochronology and landscape evolution. Physics Today (September issue). 165 Reiners, P.W., Brady, R., Farley, K.A., Fryxell, J.E., Wernicke, B., Lux, D., 2000. Helium and argon thermochronometry of the Gold Butte Block, South Virgin Mountains, Nevada. Earth Planet. Sci. Lett. 178, 315–326. Reiners, P.W., Spell, T.L., Nicolescu, S., and Zanetti, K.A. 2004. Zircon (U-Th)/He thermochronometry: He diffusion and comparisons with 40Ar/39Ar dating. Geochimica et Cosmochimica Acta, 68(8): 1857-1887. Reiners, P.W., Ehlers, T.A., and Zeitler, P.K. 2005. Past, Present, and Future of Thermochronology Reviews in Mineralogy and Geochemistry Vol. 58, pp. 1-18, 2005 Rey, P., Vanderhaeghe, O., and Teyssier, C. 2001. Gravitational collapse of the continental crust: definition, regimes and modes. Tectonophysics 342, 435– 449. Rey, P., Teyssier, C., Kruckenberg, S., and Whitney, D.L., 2011, Viscous collision in channel explains double domes in metamorphic core complexes: Geology, v. 39, p. 387-390. Ring, U., Brandon, M. T., Willett, S. D. and Lister, G. S. 1999. Exhumation processes. In: Ring, U., Brandon, M. T., Lister, G. S. & Willett, S. D. (eds) Exhumation Processes: Normal Faulting, Ductile Flow and Erosion. Geological Society, London, Special Publications, 154, 1-27. Rios, S. et al. 2000. Amorphization in zircon: evidence for direct impact damage, J. Phys., Condens. Matter 12 (11) (2000) 2401–2412. Saadoune, I., Purton, J.A., Leeuw, N.H. 2009. He incorporation and diffusion pathways in pure and defective ZrSiO4: a density functional theory study. Chem. Geol. 258, 182–196. Sanborn, N. M. 1996. Constraints on the timing and conditions of Cordilleran tectonism in Frenchman Cap dome, Monashee complex, southeast British Columbia, from 40Ar/39Ar geochronology. BSc (Hons) Thesis, Queens University, Kingston, Ontario, Canada. Scammell, R.J., 1993. Mid-Cretaceous to Tertiary thermotectonic history of former mid-crustal rocks,southern Omineca belt, Canadian Cordillera. PhD thesis, Queen’s University. Scammell, R.J. and Brown, R.L. 1990. Cover gneisses of the Monashee Terrane: a record of synsedimentary rifting in the North American Cordillera. Canadian Journal of Earth Sciences, 27, 712–726. Schiarizza, P. and Preto, V.A., 1987. Geology of the Adams plateau-Clearwater-Vavenby area. British Columbia Ministry of Energy, Mines, and Petroleum Resources, Paper 1987-2. Seward, D., Vanderhaeghe, O., Siebenaller, L., Thomson, S., Hibsch, C., Zingg, A., Holzner, P., Ring, U., and Duche, S. 2009. Cenozoic tectonic evolution of Naxos Island through a multifaceted approach of fission-track analysis from: Ring, U. & Wernicke, B. (eds) Extending a Continent: Architecture, Rheology and Heat Budget. Geological Society, London, Special Publications, 321, 179–196. 166 Shuster, D.L., Flowers, R.M., Farley, K.A., 2006. The influence of natural radiation damage on helium diffusion kinetics in apatite. Earth Planet. Sci. Lett. 249, 148–161. Shuster, D.L., Farley, K.A., 2004. 4He/3He thermochronometry. Earth Planet. Sci. Lett. 217, 1–17. Shuster, D.L., Farley, K.A., 2005a. 4He/3He thermochronometry; theory, practice, and potential complications. In: Reiners, P.W., Ehlers, T.A. (Eds.), Low-temperature Thermochronology: Techniques, Interpretations, and Applications. Reviews in Mineralogy and Geochemistry, vol. 58. Mineralogical Society of America and Geochemical Society,Washington, DC, pp. 181–203. Shuster, D.L., Farley, K.A., 2005b. Diffusion kinetics of proton-induced Ne-21, He-3, and He-4 in quartz. Geochim. Cosmochim. Acta 69, 2349–2359. Shuster, D.L., Farley, K.A., 2009. The influence of artificial radiation damage and thermal annealing on helium diffusion kinetics in apatite. Geochim. Cosmochim. Acta 73, 183–196. Shuster, D.L., Farley, K.A., Sisterson, J.M., Burnett, D.S., 2003. Quantifying the diffusion kinetics and spatial distribution of radiogenic 4He in minerals containing protoninduced 3He. Earth Planet. Sci. Lett. 217, 19–32. Silva, M. 1986. Placer gold recovery methods. California Department of Conservation, Division of Mines and Geology, Special Publication, 87. Simpson, R.W., and Cox, A., 1977. Paleomagnetic evidence for tectonic rotation of the Oregon Coast Range. Geology, 5, 585–589. Sisson, V.B., and Pavlis, T.L., 1993. Geologic consequences of plate reorganization: An example from the Eocene southern Alaska forearc. Geology, 21, 913–916. Sisson, V.B., Hollister, L.S., and Onstott, T.C., 1989. Petrologic and age constraints on the origin of a lowpressure/ high temperature metamorphic complex, southern Alaska. Journal of Geophysical Research, 94, 4392–4410. Smith, A.D., and Thorkelson, D.J., 2001. Geochemical and Nd-Sr-Pb isotopic evidence on the origin and geodynamic evolution of mid-Cretaceous continental arc volcanic rocks of the Spences Bridge Group, south-central British Columbia, Geological Journal, 36, 1-20. Sonder, L.J., and Jones, C.H. 1999. Western United States extension: How the West was widened. Annu. Rev. Earth Planet. Sci. 27:417–62 Spiegel, C., Kohn, B., Belton, D., Berner, Z., Gleadow, A. 2009. Apatite (U–Th–Sm)/He thermochronology of rapidly cooled samples: The effect of He implantation. Earth and Planetary Science Letters 285: 105–114. Steiger, R.H., Jäger, E. 1977. Subcommission on geochronology: Convention on the use of decay constants in geo- and cosmochronology. Earth Planet Sci Lett 36:359-362 167 Stock, J., and Molnar, P., 1988. Uncertainties and implications of the late Cretaceous and Tertiary position of North America relative to the Farallon, Kula, and Pacific plates. Tectonics, 6, 1339–84 Stockli, D.F., 2005. Application of low-temperature thermochronometry to extensional tectonic settings. Reviews in Mineralogy and Geochemistry, Vol. 58, pp. 411-448, 2005 Stockli, D. F. and Wolfe, M. R. 2009. Zircon (U-Th)/He thermochronometry in the KTB drill hole, Germany - Implications for He diffusion in zircon. American Geophysical Union, Fall Meeting 2009, abstract #V52C-05 Stockli, D.F., Farley, K.A., Dumitru, T.A., 2000. Calibration of the apatite (U–Th)/He thermochronometer on an exhumed fault block, White Mountains, California. Geology 28 (11), 983–986. Stüwe, K., White, L., and Brown, R. 1994. The influence of eroding topography on steady state isotherms: Application to fission track analysis, Earth Planet. Sci. Lett., 124, 63–74, doi:10.1016/0012-821X(94)00068-9. Tagami, T. and O’Sullivan, P.B. 2005. Fundamentals of fission-track thermochronology. Reviews in Mineralogy and Geochemistry. 58: 19-47. Tempelman-Kluit, D., 1989. Geology, Penticton, British Columbia: Geological Survey of Canada Map 1736A, scale 1:250,000, 1 sheet. Tempelman-Kluit, D., and Parkinson, D., 1986. Extension across the Eocene Okanagan crustal shear in southern British Columbia. Geology, 14, 318–321, doi:10.1130/00917613(1986)14<318:EATEOC>2.0.CO;2. Teyssier, C., Ferre, E., Whitney, D.L., Norlander, B., Vanderhaeghe, O., and Parkinson, D., 2005. Flow of partially molten crust and origin of detachments during collapse of the Cordilleran orogen, in Bruhn, D., and Burlini, L., eds., High-Strain Zones: Structure and Physical Properties. Geological Society of London Special Publication 245, 39–64. Thomson, S.N., and Ring, U. 2006. Thermochronologic evaluation of postcollision extension in the Anatolide orogen, western Turkey. Tectonics, 25, TC3005, doi:10.1029/2005TC001833, 2006 Thomson, S. N., Stockhert, B.,and Brix, M. R. 1999. Miocene high-pressure metamorphic rocks of Crete, Greece: Rapid exhumation by buoyant escape, in Exhumation Processes: Normal Faulting, Ductile Flow and Erosion, edited by U. Ring et al., Geol. Soc. Spec. Publ., 154, 87 – 108. Thorkelson, D.J., and Taylor, R.P., 1989. Cordilleran slab windows. Geology, 17, 833–836. Thorkelson, D.J., Madsen, J.K. and Sluggett, C.L., 2011. Mantle flow through the Northern Cordilleran slab window revealed by volcanic geochemistry. Geology, 39, 267-270, doi: 10.1130/G31522.1. 168 Toraman, E., C. Teyssier, D. L. Whitney, A. K. Fayon, S. N. Thomson, and P. W. Reiners (2014), Low-temperature thermochronologic record of Eocene migmatite dome emplacement and late Cenozoic landscape development, Shuswap core complex, British Columbia, Tectonics, 33, 1616–1635, doi:10.1002/2013TC003442. Trachenko, K., Dove, M.T., and Salje, E.K.H. 2002. Structural changes in zircon under alpha-decay irradiation, Phys. Rev., B 65 (18). Trocellier, P., Gosset, D., Simeone, D., Costantini, J.M., Deschanels, X., Roudil, D., Serruys, Y., Grynszpan, R., Saudé, S., Beauvy, M., 2003a. Application of nuclear reaction geometry for 3He depth profiling in nuclear ceramics. Nucl. Instrum. Methods B206, 1077–1082. Trocellier, P., Gosset, D., Simeone, D., Costantini, J.-M., Deschanels, X., Roudil, D., Serruys, Y., Grynszpan, R., Saudé, S., Beauvy, M., 2003b. 3He thermal diffusion coefficient measurement in crystalline ceramics by NRA depth profiling. Nucl. Instrum. Methods B210, 507–512. Vanderhaeghe, O., 1997. Role of partial melting during late-orogenic collapse. Ph.D. thesis, University of Minnesota, Minneapolis, Minn. Vanderhaeghe, O., and Teyssier, C., 1997. Formation of the Shuswap metamorphic core complex during late-orogenic collapse of the Canadian Cordillera. Role of ductile thinning and partial melting of the mid-to lower crust. Geodinamica Acta, 10(2), 41-58. Vanderhaeghe, O., and Teyssier, C. 2001a. Crustal-scale rheologogical transitions during late orogenic collapse. Tectonophysics, 335: 211-228. Vanderhaeghe, O., and Teyssier, C. 2001b. Partial melting and the flow of orogens. Tectonophysics, 342: 451-472. Vanderhaeghe, O., Teyssier, C., and Wysoczansky, R., 1999. Structural and geochronological constraints on the role of partial melting during the formation of the Shuswap metamorphic core complex at the latitude of the Thor–Odin dome, British Columbia. Canadian Journal of Earth Sciences, 36, 917–943. Vanderhaeghe, O., Teyssier, C., McDougall, I., James, W., 2003. Cooling and exhumation of the Shuswap metamorphic core complex constrained by (40Ar/39Ar thermochronology. Geological Society of America Bulletin, 115(2), 200-216. Wagner, G., and Van de haute, P. 1992. Boston: Fission-track dating. Kluer Academic Publishers Hurley, Patrick M.; Fairbairn, Harold W. 1956. Abundance and distribution of uranium and thorium in zircon, sphene, apatite, epidote, and monazite in granitic rocks. USGS Trace Elements Investigations: 636 Wanless, R. K., and Reesor, J. E., 1975, Precambrian zircon age of orthogneiss in the Shuswap Metamorphic Complex, British Columbia: Canadian Journal of Earth Sciences, 12, 326-332. 169 Weber, W.J., Ewing, R.C., Meldrum, A., 1997. The kinetics of alpha decay-induced amorphization in zircon and apatite containing weapons-grade plutonium or other actinides. J. Nucl. Mater. 250 (2–3), 147–155. Wells, R.E., Engebretson, D.C., Snavely, P.D., Jr., and Coe, R.S. 1984. Cenozoic plate motions and the volcano-tectonic evolution of western Oregon and Washington. Tectonics, 3(2), 275-294 Wells, M. L., Snee, L. W. and Blythe, A. E. 2000. Dating of major normal fault systems using thermochronology: An example from the Raft River detachment, Basin and Range, western United States, J. Geophys. Res., 105, 16,303–16,327, doi:10.1029/2000JB900094. Wernicke, B., 1981, Low-angle normal faults in the Basin and Range Province: Nappe tectonics in an extending orogen: Nature, v. 291, p. 645–648, doi: 10.1038/291645a0. Wernicke, B., 1985. Uniform-sense normal simple shear of the continental lithosphere, Can. J. Earth Sci., 22, 108-125. Wernicke, B., 1995. Low-angle normal faults and seismicity: A review: Journal of Geophysical Research, 100, 20,159–20,174, doi: 10.1029/95JB01911. Wernicke, B. 2009. The detachment era (1977–1982) and its role in revolutionizing continental tectonics. Geological Society, London, Special Publications, 321(1), 1-8. Wernicke, B., and Axen, G.J. 1988. On the role of isostasy in the evolutionof normal‐fault systems, Geology, 16, 848–851, doi:10.1130/0091-7613(1988)016<0848:OTROII>2.3.CO;2. Wheeler, J. O., and McFeely, P., 1991, Tectonic assemblage map of the Canadian Cordillera and adjacent parts of the United States of America, Geological Survey of Canada Map 1712A, scale 1:2M. Wheeler, J. and Butler, R. W. H. 1994. Criteria for identifying structures related to true crustal extension in orogens. Journal of Structural Geology, 16, 1023-1027. Wheeler, J.O., Brookfeld, A.J., Gabrielse, H., Monger, J.W.H., Tipper, H.W., Woodsworth, G.J., compilers, 1991. Terrane map of the Canadian Cordillera. Geological Survey of Canada, Map 1713A. Whitney, D. L., Teyssier, C., Rey, P. & Buck, W. R., 2013. Continental and oceanic core complexes. Geological Society of America Bulletin, Volume 125, pp. 273-298. Willett, S.D. 1997. Inverse modeling of annealing of fission tracks in apatite 1: A controlled random search method. Am J Sci 297:939-969 Wolf, R.A., Farley, K.A., and Silver, L.T. 1996. Helium diffusion and low temperature thermochronometry of apatite Geochim. Cosmochim. Acta, 60: 4231–4240 Wolf, R.A., Farley, K.A., and Kass, D.M. 1998. Modeling of the temperature sensitivity of the apatite (U–Th)/He thermochronometer, Chemical Geology, 148 (1–2): 105–114 170 Wolfe, M.R., and Stockli, D.F. 2010. Zircon (U–Th)/He thermochronometry in the KTB drill hole, Germany, and its implications for bulk He diffusion kinetics in zircon. Earth and Planetary Science Letters 295 (2010) 69–82. Woods, M.T., and Davies, G.R., 1982, Late Cretaceous genesis of the Kula plate. Earth and Planetary Science Letters, v. 58, p. 161-166. Yamada R., Tagami T., Nishimura S., and Ito H. 1995. Annealing kinetics of fission tracks in zircon: An experimental study. Chem. Geol. 122, 249–258. Zeitler, P.K., Herczig, A.L., McDougall, I., Honda, M., 1987. U–Th–He dating of apatite: a potential thermochronometer. Geochim. Cosmochim. Acta 51, 2865–2868. Ziegler, J.F., Biersack, J.P., 2006. The stopping and range of ions in matter. Computer code SRIM 2006, http://www.srim.org. 171 APPENDIX 1: Analytical procedures for apatite and zircon mineral separation Samples were crushed using a jaw crusher and disk mill to produce sand-sized material. The fraction between ~60 and 500 µm was sieved and retained for mineral separation. The sample was then processed using a Wilfley table to concentrate the heavy mineral fraction. The Wilfley table separates minerals based on density (and grain size) (Silva 1986). The sample and wash water were fed at the top of the table while the motor attached to the table caused it to be shaken sideways (along its length), perpendicular to the feed direction. This activity caused the grains to move diagonally across the table with the heaviest / densest minerals concentrating on the far left edge of the table, where they were collected. The sample was then dried in preparation for heavy liquid separation. The first heavy liquid to be used was Lithium Metatungstate (LMT). The heavy fraction was placed in a solution of LMT with a density of ~2.9 g/cm-3; this caused the apatite and other heavy minerals (e.g., zircon, sphene) to sink while other lighter minerals such as quartz, feldspar, and calcite floated. The heavy fraction from this step was then washed and dried and then run through the Frantz isodynamic separator to remove magnetic minerals and separate the remaining minerals based on their magnetic susceptibility (Donelick et al. 2005). The Franz was set at a slope of 25° and a tilt of 10° and run at three different current settings: 0.4, 0.8, and 1.2 A. In each run, the magnetic fraction was retained and the non-magnetic fraction was further processed at a higher current setting. The final non-magnetic fraction obtained from the Frantz was placed in Diiodomethane (density of ~3.32 g/cm-3) to separate apatite from zircon. 172 APPENDIX 2: Analytical procedures for apatite and zircon (U-Th)/He Sample preparation was performed at Dalhousie University, Department of Earth Sciences. Individual apatite and zircon grains were selected on the basis of size, morphology and lack of inclusions as specified by Farley (2002). When available, five grains per sample were handpicked using a Zeiss stereoscopic microscope at 106 x magnification under cross-polarized light to screen for fluid and solid inclusions. Selected crystals were measured (height, width, tip lengths) and photographed in three different directions (x-, y-, and z-axes) in order to determine the alpha-ejection correction (Reiners, 2005). Each crystal was then packed into a small (~1 mm) Nb tube. He extraction and measurement was performed at University of California, Santa Cruz, Department of Earth and Planetary Sciences. The Nb tubes were loaded into a 46-well custom copper planchet, along with two standards and one blank tube. Apatites and zircons were run separately. For apatite runs, the standard used was derived from fragments of a single, large, crushed Durango apatite crystal; Fish Canyon Tuff zircons were used as the standard for the zircon runs. For Helium extraction, the tubes were heated by direct lasing with a focused ~1 mm beam of a 980-nm 22 W fiber couple diode (Coherent FEP 600) laser interfaced with a Newport 5600 High Power Diode Driver to temperatures of 1250 °C for 10 minute extraction intervals (zircon) and 1000 °C for 3 minute extraction intervals (apatite) (Hourigan et al., in review). Zircons were then subject to one or more re-extractions to reduce successive He yields to less than 2–3% of the total initial yields (Reiners, 2005). The apatite grains generally needed only one run through the He line to reduce He yields to less than 2-3%. LabVIEW software controlled and automated the laser heating, gas handling, cryogenic focusing and purification, and quadrupole mass spectrometry stages of the He line (Hourigan et al., in review). In preparation for U/Th analysis, zircon grains were transferred from the copper planchet into labelled Teflon micro-vials. A measured drop of 233U/229Th spike was added followed by 150 µL of 8:1 2x TD HF/ 2x TD HNO3. Three blanks were prepared containing spike and the HF concoction. The Teflon micro-vials were then stacked into bomb liners (with a moat of HF concoction around the vials to help equilibrate pressure in vials during heating). The digestion 173 bombs were then sealed and placed in an oven for 72 hours at 225°C. After zircon digestion, the contents of the micro-vials were cooled then transferred to larger labelled polypropylene vials; 2.5 ml of type 1 ultrapure water was added for dilution. After He analysis, apatite grains were transferred directly to polypropylene vials. One measured drop of 233U/229Th spike followed by 200 µL of 2x TD HNO3 were added. The vials were then placed on a hot plate at medium heat for 1 hour. After apatite digestion, the contents of the polypropylene vials were diluted with type 1 ultrapure water. U/Th ratios were measured on these solutions by using an X Series 2 ICP-Mass Spectrometer. 174 APPENDIX 3: Analytical procedure for apatite fission track thermochronology Mounting and polishing of apatite grain mounts in preparation for the EDM was carried out at Dalhousie University. The ideal grain mount for AFT analysis was prepared to contain a sufficient number of apatite grains and sufficient spacing between grains to allow them to be distinguishable (Donelick et al. 2005). The final apatite fraction retrieved from mineral separation was placed on a mounting medium (epoxy) on a glass slide. The grain mount was allowed sufficient time to dry completely. Once dried, the grain mount was polished. Five levels of polishing were carried out on these samples with thorough washing of grain mounts between polishing levels. The first two levels of polishing utilized a silicon carbide grinding paper, Grit 600 and 800, and was done manually. This step was necessary to remove the top layer of epoxy and expose the apatite grains. The next two levels of polishing were completed using a mechanical polishing apparatus and water based diamond suspension and lubricants, initially at 9 µm then at 3 µm. These two levels of polishing were necessary to grind down the apatite grains to approximately half their size in order to expose the centre of the grain for etching and further processing. The final level of polishing utilized a 1.0 um deagglomerated alpha alumina micropolisher. This last polishing step was necessary to smooth out the epoxy surface and enhance the final grain mount appearance. Grain mounts were then etched to enhance and therefore optically reveal fission tracks that intersect the polished apatite grain surface. Grain mounts were etched in 5.5 N HNO3 for 20.0 s (± 0.5 s) at 21 °C (±1 °C), a procedure based on the work of Carlson et al. (1999), Ketcham et al. (1999), and Ketcham (2003). Once etched, grain mounts were rinsed thoroughly and dried. The grain mounts were then prepared for EDM and irradiation as described in Section 3.2. 175 APPENDIX 4: Full ZHe dataset Original ZHe results for 19 samples Sample Ages AVE AGE (uncorrected) (uncorrected) 122.52 Error AVE AGE (corrected) (corrected) BV_12-23-4 102.27 BV_12-23-5 116.12 116.12 BV_12-23-2 154.62 202.56 BV_12-23-3 117.08 140.73 BV_12-23-1 55.74 71.68 RS_12-07-7 31.45 RS_12-07-3 38.42 46.81 RS_12-07-4 61.72 76.14 RS_12-07-5 31.73 41.26 RS_12-07-6 16.88 21.92 BV_12-27-5 58.71 BV_12-27-4 47.08 59.87 BV_12-27-3 25.95 33.01 BV_12-27-2 43.42 56.17 BV_12-27-1 79.10 99.11 RS_12-08-1 74.96 RS_12-08-3 74.34 89.26 RS_12-08-4 76.67 115.45 RS_12-08-5 42.42 53.57 RS_12-08-2 124.06 155.99 RS_12-08-6 36.82 RS_12-08-7 33.74 42.42 RS_12-08-8 34.33 44.93 RS_12-08-9 31.80 43.34 RS_12-08-10 29.05 39.67 RS_12-06-1 48.53 RS_12-06-2 43.35 53.13 RS_12-06-3 34.13 43.65 RS_12-06-4 46.22 57.88 RS_12-06-5 47.66 61.56 RS_12-05-1 55.30 RS_12-05-2 39.21 53.15 RS_12-05-3 28.45 40.47 RS_12-05-4 31.41 41.68 36.04 50.85 67.09 33.15 43.98 36.66 176 11.22 Ages 7.32 8.80 8.24 1.30 2.61 5.04 102.27 42.57 77.14 93.51 48.65 60.38 72.05 error 140.42 22.19 Run 2 45.74 8.73 Run 2 65.06 11.04 Run 1 87.95 12.82 Run 1 43.80 1.48 Run 4 55.32 3.26 Run 2 49.27 3.26 Run 2 Sample Ages AVE AGE (uncorrected) (uncorrected) Error Ages AVE AGE (corrected) (corrected) error RS_12-05-5 28.93 39.03 RS_12-02-1 279.76 RS_12-02-2 69.37 88.78 RS_12-02-4 67.63 89.38 RS_12-02-5 35.77 46.07 RS_12-02-3 94.84 115.24 RS_12-04-1 40.09 RS_12-04-2 54.88 74.94 RS_12-04-3 45.57 63.42 RS_12-04-4 57.25 78.29 RS_12-04-5 53.98 73.50 RS_12-10-3 58.43 RS_12-10-4 23.61 32.05 Run 2 RS_12-10-5 43.89 54.80 Run 2 RS_12-10-1 33.30 42.50 Run 4 RS_12-10-2 30.72 38.86 Run 4 BV_12-29-1 124.04 BV_12-29-2 51.37 71.32 BV_12-29-3 41.92 50.48 BV_12-29-4 37.83 44.42 BV_12-29-5 123.29 157.17 BV_12-28-5 47.05 BV_12-28-4 64.81 82.00 BV_12-28-3 85.66 103.54 BV_12-28-2 65.71 80.14 BV_12-28-1 115.94 133.93 BV_12-26-6 48.93 BV_12-26-5 50.65 64.62 BV_12-26-3 39.87 52.53 BV_12-26-2 41.56 54.10 BV_12-26-1 38.90 53.24 BV_12-24-5 39.67 BV_12-24-4 34.66 44.48 BV_12-24-3 50.15 63.36 BV_12-24-2 62.29 79.02 BV_12-24-1 57.16 70.48 BV_12-21-6 53.76 BV_12-21-7 47.84 43.19 50.35 37.99 43.71 65.81 43.98 48.79 46.51 10.92 3.23 6.06 4.01 7.89 2.42 5.18 2.94 334.97 50.74 72.85 159.81 62.59 62.61 48.95 60.95 56.83 177 74.74 14.34 Run 1 68.18 5.02 Run 1 48.21 7.18 Run 2 55.41 6.31 Run 1 82.07 8.39 Run 1 57.42 2.56 Run 1 61.26 6.47 Run 1 55.54 2.69 Run 2 Sample Age AVE AGE (uncorrected) (uncorrected) Error Age AVE AGE (corrected) (corrected) BV_12-21-8 37.63 46.38 BV_21-21-9 42.19 53.16 BV_12-21-3 51.14 60.41 BV_12-17-1 55.75 BV_12-17-2 37.49 50.61 BV_12-17-3 48.23 63.03 BV_12-17-5 47.18 62.63 BV_12-17-4 85.08 118.33 BV_12-18-1 82.07 BV_12-18-2 71.74 89.63 BV_12-18-3 56.00 73.02 BV_12-18-4 42.23 55.92 BV_12-18-5 55.26 72.37 RS_12-09-3 30.83 RS_12-09-4 30.68 40.94 RS_12-09-5 35.71 47.71 RS_12-09-6 32.55 42.62 RS_12-09-7 19.50 26.09 RS_12-03-1 36.32 RS_12-03-2 26.50 39.75 RS_12-03-3 21.83 33.54 RS_12-03-4 10.33 13.58 RS_12-01-1 32.22 RS_12-01-2 29.81 40.34 RS_12-01-3 33.31 44.91 37.73 61.46 29.85 23.74 31.96 3.75 6.96 2.74 5.40 0.75 69.69 111.12 42.08 49.38 42.81 61.49 3.97 Run 2 72.74 6.88 Run 2 39.89 3.64 Run 4 34.06 7.56 Run 4 42.63 0.94 Run 4 RS_12-01-4 32.50 42.46 Samples were processed at University of California Santa Cruz. Five aliquots were originally processed per sample. Of the 19 samples run for zircon (U-Th)/He, only five sample results are presented here because the other 14 were run in batches (Runs 1 and 2) that yielded incorrect standard ages and therefore had to be discarded. The five samples are: RS1201, RS1202, RS1208, RS1209, and RS1210. Limited raw data is available for ZHe analysis. 178 Error APPENDIX 5: AFT counting data RS1201 179 RS1202 180 RS1203 181 RS1204 182 RS1205 183 RS1206 184 RS1208 185 RS1210 186 BV1229 187 BV1228 188 BV1221 189 BV1218 190 BV1223 191 BV1227 192 APPENDIX 6: HeFTy model screen shots: full 193 193 Model 1:RS1201-02 194 194 Model 2: RS1203 195 195 Model 3: RS1204-05 196 196 Model 4: RS1206 197 197 Model 5: RS1207-08 198 198 Model 6: RS1209 199 199 Model 7: RS1210 200 200 Model 8: BV1229 201 201 Model 9: BV1228 202 202 Model 10: BV1217-18 203 203 APPENDIX 7: HeFTy model screen shots: < 200°C Model 1: RS1201-1202 204 Model 2: RS1203 205 Model 3: RS1204-1205 206 Model 4: RS1206 207 Model 5: RS1207-1208 208 Model 6: RS1209 209 Model 7: RS1210 210 Model 8: BV1229 211 Model 9: BV1228 212 Model 10: BV1217-1218 213 APPENDIX 8: Compilation of previous geochronological & thermochronolical data Summary and interpretation of previous geochronological and thermochronological data available for the study region Previous data Okanagan Valley shear zone (OVsz) Shuswap Metamorphic Complex (SMC) -- AHe 12-7 Ma 47 Ma AFT 44 Ma 40 9 9 28-19 Ma 10 45-37 Ma 10 49 Ma 9 40-27, 209,10 14 Ma, -- 49-44 Ma 39 Ar- Ar (biotite) 52-50 Ma 8 52-46 Ma 3,4,8 40-32 9,10 Ma -- 9 -- -55-47 5,7,8,12 Ma 156-131 1 Ma 50-47 Ma 8 8 40 Ar- Ar (muscovite) 39 53 Ma 40 Ar- Ar (hornblende) 39 111-74 1,2 Ma 62-48, 74, 90, 305 (total fusion hbl) 1,4,5,6,8 Ma : 58-52 3,7,12 Ma U-Pb zircon / monazite 56–49 11, 16 Ma 86, 59-56 2,15,19 Ma 73, 67-60, 59-54 2,15,17,18, Ma -- -- 11,16 20,21 51Ma 61-60 Ma 51 Ma 14 2 52–49 12 Ma 97-89, 64 15 Ma 214 Older ages could represent crystallization ages Eocene cooling below ~330°C in the OVsz Oldest cooling (Cretaceous) on the OVsz hanging-wall --- 55 Ma Interpretations Cooling below ~60°C occurred later in the SMC Cooling below ~120°C could be younging to the east Cooling below ~180°C occurring during this time Pattern of cooling below ~250°C not very clear Eocene cooling below ~300°C across the OVsz, SMC, and MC 26-15 10 Ma 9 -- ZFT Columbia River fault (CRF) hangingwall -- 10 46-44 Ma ZHe Monashee complex 15 metamorphic ages explaining timing of exhumation: including high grade metamorphism, anatectic melting and migmatization 1- Colpron et al. 1996; 2- Johnson, 1994; 3- Vanderhaeghe et al., 2003; 4-Okulitch, 1979; 5- Vanderhaeghe, 2003; 6- Johnson and Brown, 1996; 7- Sanborn, 1996; 8-Allen 2013; 9-Lorencak et al. 2001; 10-Toraman et al. 2014; 11Brown et al. 2012; 12- Crowley and Parrish 1999; 13-Carr 1991; 14-Carr 1995; 14-Parrish 1983; 15-Parrish et al. 1988; 16- Parkinson, 1985; 17-Parish et al. 1995; 18-Parrish and Scammel 1998; 19-Scammel 1993; 20-Carr, 1992; 21-C rowley et al. 2001 215


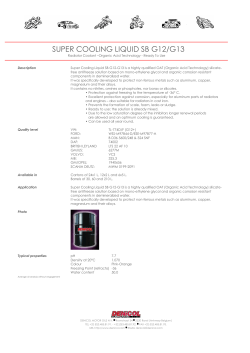
© Copyright 2026