
Characteristics and origin of abnormally high porosity zones in
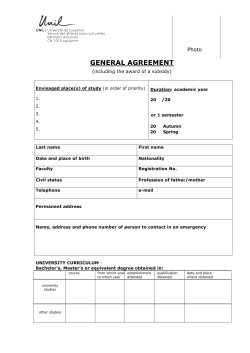
Pet.Sci.(2014)11:346-362 346 DOI 10.1007/s12182-014-0349-y Characteristics and origin of abnormally high porosity zones in buried Paleogene clastic reservoirs in the Shengtuo area, Dongying Sag, East China Cao Yingchang , Yuan Guanghui, Li Xiaoyan, Wang Yanzhong, Xi Kelai, Wang Xiaoming, Jia Zhenzhen and Yang Tian School of Geosciences, China University of Petroleum, Qingdao, Shandong 266580, China © China University of Petroleum (Beijing) and Springer-Verlag Berlin Heidelberg 2014 Abstract: There are three abnormally high porosity zones developed in buried Paleogene nearshore subaqueous fan and sublacustrine fan clastic reservoirs at 2,800-3,200 m, 3,250-3,700 m and 3,9004,400 m, respectively, within the Shengtuo area of the Dongying Sag. Here the porosity of reservoirs buried deeper than 4,000 m can still be greater than 20%. Investigation of these three abnormally high porosity (AHP) zones in the 3rd to 4thPHPEHURIWKH3DOHRJHQH6KDKHMLH)RUPDWLRQLQWKH6KHQJWXRDUHD ZDVFDUULHGRXWZLWKXWLOL]DWLRQRIFRUHREVHUYDWLRQWKLQVHFWLRQLGHQWL¿FDWLRQ6(0REVHUYDWLRQLPDJH analysis, core physical property testing and other technical methods. The results show that, the AHP ]RQHVLQPDQGPDUHYLVLEOHSRUHVSULPDU\$+3]RQHVGRPLQDWHGE\VLJQL¿FDQW primary intergranular pores (more than 50% of the total porosity), while secondary pores and micropores in authigenic clays may develop in some reservoirs. AHP reservoirs in the AHP zone of 3,900-4,400 m are dominated by micropores in matrix, visible pores are mainly grain dissolution pores but with low absolute content (< 1%), so this zone belongs to the micropores primary AHP zone. The genesis of the three AHP zones was studied to distinguish between porosity enhancement and porosity preservation. Our research shows that, in deeply buried clastic reservoirs in the Shengtuo area, mineral dissolution occurred in a relatively closed diagenetic system with high temperature and high salinity. Reservoir rocks underwent extensive feldspar dissolution, while detrital carbonate grains and carbonate cements show QRHYLGHQFHRIH[WHQVLYHGLVVROXWLRQ$OWKRXJKVLJQL¿FDQWIHOGVSDUGLVVROXWLRQSRUHVGHYHORSHGIHOGVSDU dissolution enhanced porosity only a little due to the precipitation of almost isovolumetric dissolution products in the nearby primary intergranular pores in forms of authigenic clays and quartz cements. Net enhanced porosity originating from feldspar dissolution is generally less than 0.25%. Thus, the subsurface dissolution has little impact on the mid-deep buried high porosity reservoirs. Reservoirs in braided channels of middle fans in sublacustrine fans and reservoirs in the middle-front of fan bodies of nearshore VXEDTXHRXVIDQVSURYLGHWKHEDVLVIRUWKHGHYHORSPHQWRI$+3]RQHV7KHVKDOORZGHYHORSPHQWRIÀXLG overpressure and early hydrocarbon emplacement have effectively retarded compaction and carbonate FHPHQWDWLRQVRWKDWWKHKLJKSRURVLW\LQWKHVXSHU¿FLDOOD\HUVLVSUHVHUYHGLQWKHPLGGHHSOD\HUV7KHVH are the main controlling factors in the development of AHP zones. Key words: Dongying Sag, Shengtuo area, abnormally high porosity zone, pores, genesis 1 Introduction Studies by Bloch et al (2002) of global basins show that in specific geological conditions, deeply buried reservoirs can still be effective for accumulation and production of petroleum and in particular that some areas exhibit *Corresponding author. email: [email protected] Received May 11, 2013 unexpectedly high porosity and permeability at substantial burial depth. Studies on the origin and distribution of these high-quality abnormally high porosity (AHP) reservoirs are of great importance for oil-gas exploration and production. %ORFKHWDOGH¿QHG$+3DVUHVHUYRLUSRURVLW\ZKLFK is statistically higher than the porosity values occurring in typical sandstone reservoirs of a given lithology (composition and texture), age and burial/temperature history. In sandstones containing abnormally high porosities, such porosities Pet.Sci.(2014)11:346-362 exceed the maximum porosity of the typical sandstone VXESRSXODWLRQ:LWKLQVSLUDWLRQIURPWKLVGH¿QLWLRQ0HQJHW DOGH¿QHGWKH$+3]RQHDVWKHUHVHUYRLUGHYHORSPHQW zone with porosities higher than the maximum porosity of clastic rocks that develop in normal sedimentary and diagenetic environments. The concept of an AHP zone emphasizes only the abnormally high level of reservoir porosity regardless of the pore types. In addition, Chinese scholars also referred to the AHP zone as the secondary pore development zone, secondary pore zone, (abnormal) pore development zone, secondary pore development section, etc., of which, the secondary pore development zone has been used widely (Yuan and Wang, 2001; Zhu et al, 2006; Liu et al, 2009; Wang, 2010). Some scholars considered the relative content of secondary pores in the reservoirs (Wang and Shao, 1999; Wang, 2010), for example, Wang (2010) VXPPDUL]HGVWXGLHVRIWKH&KLQHVHVFKRODUVDQGGH¿QHGWKH secondary pore development zone as a zone where reservoirs with high porosity (higher than the ĭcutoff) developed, based on the introduction of effective reservoir porosity cutoff (ĭcutoff), and where the percentage of secondary pores in reservoirs is more than 50%. However, without considering the content of secondary pores in reservoirs, some scholars subjectively GH¿QHGWKHFRQFHQWUDWHGGHYHORSPHQW]RQHRI$+3UHVHUYRLUV with secondary pores as the secondary pore development zone (Zhong et al, 2003; Xiao et al, 2003; Liu and Zhu, 2006; Zhu et al, 2007; Zhang et al, 2011). Publications suggest that both geological processes beneficial to porosity preservation (e.g. (1) the shallow GHYHORSPHQWRIÀXLGRYHUSUHVVXUHDQGFKORULWHFRDWVDQG early hydrocarbon emplacement) and processes beneficial to porosity enhancement (mineral dissolution) can be the important controlling factors to the development of middeep AHP reservoirs (Ehrenberg, 1993; Warren and Pulham, 2001; Luo et al, 2002; Bloch et al, 2002; Marchand et al, 2002; Zhong et al, 2003; Zhu et al, 2004; 2006; Zhang et al, 2007; Yu et al, 2008; Peng et al, 2009; Zhong et al, 2008; Taylor et al, 2010; Meng et al, 2010; Wang, 2010; Jin et al, 2011; Chen et al, 2011; Zhu et al, 2012). Even recently, most Chinese scholars still thought that burial dissolution of minerals (particularly mesogenenic dissolution) is the main controlling factor of the mid-deep AHP zones (Zhang et al, 2003; Zhu et al, 2004; Yuan et al, 2007; Zhu et al, 2006; Yu et al, 2008; Zhong et al, 2008; Zhu et al, 2012). In recent years, many foreign scholars and some Chinese scholars began to accentuate the importance of geological processes beneficial to porosity preservation (e.g. fluid overpressure, hydrocarbon emplacement and chlorite coats), and rethought the importance of secondary pores (Bloch et al, 2002; Taylor et al, 2010; Berger et al, 2009; Marchand et al, 2002; Higgs et al, 2007; Jin et al, 2011; Ehrenberg et al, 2012; Yuan et DOE:KHQJHRORJLFDOSURFHVVHVEHQH¿FLDOWRSRURVLW\ preservation serve as main controlling factors, AHP reservoirs consist mainly of primary pores; while when the secondary dissolution is the main controlling factor, the AHP reservoirs consist mainly of secondary pores (Bloch et al, 2002; Meng et al, 2006; 2010). Thus, we suggested dividing the AHP zones into two types: the primary AHP zone (the relative percentage content of primary pores in reservoirs is more than 50%) and 347 the secondary AHP zone (the relative percentage content of secondary pores in reservoirs is more than 50%) (Cao et al, 2013). Also, exploration ideas and methods should differ between these types of AHP zones. The mid-deep clastic reservoirs (>2,500 m) in the Shengtuo area of the northern steep slope zone in the Dongying Sag developed three AHP zones at 2,800-3,200 m, 3,250-3,700 m and 3,700-4,400 m, respectively. Great success has been achieved in oil-gas exploration in Es4-Es3z VXEWOH UHVHUYRLUV LQ UHFHQW \HDUV )RU H[DPSOH:HOO7 Well T76, Well T710, Well T719 and Well T764 all obtained high yields in the Es4-Es3x formations. However, there is still much debate on pore types and genesis of the AHP reservoirs. Previous studies suggested that, the deep buried Paleogene clastic reservoirs in the Shengtuo area consist mainly of secondary pores, and subsurface dissolution is the main controlling factor of these AHP zones (Zhong et al, 2003; Zhu et al, 2006; Yuan et al, 2007; Gao et al, 2008). Among them, Zhong et al (2003) and Zhu et al (2006) proposed that the reservoirs consist mainly of intergranular dissolution pores, and significant dissolution of carbonate cements is critical to the AHP zones. However, Yuan et al (2007) and Gao et al (2008) argued that the dissolution of carbonate cements is not obvious, and significant feldspar pores contribute more WRWKHVH$+3]RQHV*HRORJLFDOIDFWRUVEHQH¿FLDOWRSULPDU\ SRUHSUHVHUYDWLRQVXFKDVÀXLGRYHUSUHVVXUHDQGK\GURFDUERQ emplacement occur commonly in the Shengtuo area (Zhang et al, 2009; Wang, 2010; Sun, 2010). However, the AHP zones were identified as secondary AHP zones (secondary pore development zones) by previous studies (Zhong et al, 2003; Zhu et al, 2006; Yuan et al, 2007; Gao et al, 2008), which is questionable. Using core observation, thin section identification, SEM analysis, image analysis, rock physical property tests, fluid inclusion analysis, statistical analysis and other techniques, on the basis of the distribution of AHP zones in the Shengtuo area, we studied the pore types and the genesis of these AHP zones. 2 Geological background The Dongying Sag is a sub-tectonic unit lying in the southeastern part of the Jiyang Depression of the Bohai Bay %DVLQ (DVW &KLQD )LJ D ,W LV D 0HVR]RLF&HQR]RLF half graben rift-downwarped lacustrine basin, developed on Paleozoic bedrock paleotopography (Yuan et al, 2007). The Dongying Sag, which is located west of the Qingtuozi Salient, north of the Luxi Uplift and Guangrao Salient, east of the Linfanjia and Gaoqing Salient, south of the ChenjiazhuangBinxian Salient. It covers an area of 5,850 km2 with an eastZHVWD[LVRINPDQGDQRUWKVRXWKD[LVRINP,QSUR¿OH the Dongying Sag is a half graben with a faulted northern margin and a gentle southern margin. In plan, the Dongying sag is further subdivided into secondary structural units, such as the northern steep slope zone, middle uplift belt, trough zones of the Lijin, Minfeng, Niuzhuang and Boxing subsags, DQGWKHVRXWKHUQJHQWOHVORSH]RQH=KDQJHWDO)LJ 1(b)). The Shengtuo area is located in the middle part of the northern steep slope zone of the Dongying sag, with the Pet.Sci.(2014)11:346-362 348 (a) ld Fo Ⱦ t Yanshan Ca Lu ng xi U xia pl nu ift pli f Ƚ Ċ ċ Jinan Coast line China 36° Tanlu strike-slip fault zone jia an f n Li 118° 120° nt lie Sa 124° Binxian Salient Binnan-lijin fault zone Ga oq ing Salient an fault Chenn slope zone steep ture c ra -f b Minfeng ng su eng-Yo subsag Tuo-Sh Northern ag subs Lijin Middle uplift Lizezheng subsag Qingcheng Salient 122° fa ult zo ne 116° ag ubs s g ne an t zo zhu faul u g i n N iaga j ang ng-w a u h anz ngu Che Shic un fa ult zo ne Boxing subsag ne e zo slop n r e th Sou e nh ia m Ba e on tz l u fa t alien rao S g n a Gu Boxing fault zone Luxi 20km 10 40° 38° Beijing (b) 0 Chenjiazhuang Dalian Bohai Bay Up lift ĉ Jia odo ng Taihangs han U pl ift lt Be Qingtuozi Salient Ď 100km Lia od on gU pli ft N 0 Beijing 114° N 42° Sag Uplift Paleogene area Paleogene overlap zone Major fault Paleogene denuded zone Uplift Study area Fig. 1 (a) Tectonic setting of the Dongying Sag in the Jiyang Depression ( ) of the Bohai Bay Basin, East China. Other depressions in the Bohai Bay Basin are Jizhong Depression ( ), Huanghua Depression (II), Bozhong Depression (IV), Liaohe Depression (V) and Dongpu Depression (VI) (After Liu et al, 2012). (b) Structural map of the Dongying Sag. The area in the green line is the study area (After Zhang et al, 2006). Chenjiazhuang Salient to the north, the central faulted anticlinal zone to the south, the Lijin subsag to the southwest and the Minfeng subsag to the southeast, with an exploration area of 230 km 2 *DR HW DO )LJ E7KH EDVLQ controlling boundary Chennan fault and the secondary TuoSheng-Yong sub fracture system, jointly controlled the terrace tectonic style in the Shengtuo area, and had important LQIOXHQFHRQVHGLPHQWVDQGUHVHUYRLUV)LJ'XULQJWKH early period of Es4x, the Tuo-Sheng-Yong sub fracture system had not yet begun to develop, and nearshore subaqueous IDQVGHSRVLWHG)URPWKHODWHSHULRGRI(V4x to the period of Es3z, the Tuo-Sheng-Yong sub fracture system developed and formed the terrace. The nearshore subaqueous fans deposited on the terrace that was constrained by the Chennan fault and Tuo-Sheng-Yong sub fracture system, and sublacustrine fans deposited in the subsag that was close to the Tuo-Sheng<RQJ VXE IUDFWXUH V\VWHP $Q )LJ &RQWUROOHG by the tectonic setting, the formation fluid pressure in the Shengtuo area has apparent zoning. Normal and weak fluid overpressure developed mainly in the nearshore subaqueous fans, and medium-strong overpressure with the pressure FRHI¿FLHQWRIGHYHORSHGLQWKHVXEODFXVWULQHIDQV*DR et al, 2008; An, 2010). 3 Petrography and diagenesis 3.1 Petrography The data show that in the mid-deep Paleogene reservoirs in the Shengtuo area, the quartz content is 5%-63% with an average of 32%, the feldspar content is 4%-74% with an average of 37% and the detritus content is 3%-88% with an average of 30%. The reservoir rocks consist mainly of lithic DUNRVH DQG IHOGVSDWKLF OLWKLF VDQGVWRQHV )LJ 2Q WKH whole, detrital grains are moderately to poorly sorted, with sub-angular or sub-rounded shapes. Grain contacts are mainly point contact and point-line contact. 3.2 Diagenesis features According to the new diagenetic stage division standard of clastic reservoirs in China’s oil and gas industry (Standard No. SY/T5477-2003), the Paleogene Es4-Es3z reservoirs at depths of 1,500-4,500 m in the Shengtuo area are mainly in the eogenetic and mesogenetic stages. Among them, 1,5002,200 m belongs to the eogenetic stage A period, 2,200-3,000 m belongs to the B period of the eogenetic stage, 3,000-3,500 m belongs to the A1 sub-period of the mesogenetic stage, and 3,500-4,500 m belongs to the mesogenetic stage A2 subperiod (Table 1). The major diagenetic events in the reservoir rocks include compaction, carbonate cements (mainly calcite, dolomite, ferroan calcite and ankerite), quartz cements, feldspar dissolution, quartz dissolution, authigenetic clays NDROLQLWHDQGLOOLWHDQGLOOLWL]DWLRQRINDROLQLWH)LJ)LJ 5). Using textural evidence of precipitation and dissolution of minerals and the homogenization temperatures (Th) of fluid inclusions, the epigenetic sequence was determined as follows: 1) compaction, early carbonate cementation Pet.Sci.(2014)11:346-362 349 T24 T145 T123 T127 Tg2 T126 T125 T122 120 T121 T156 T158 T164 T764 T766 T717 T71 T718 T742 T715 T76 T732 T761 T765 T746 2100 T713 T166 Lithologic column RT ȍ.m 0 20 T17 2150 T714 134 Well-T 145 3250 T167 T81 (c) RT SP ȍ.m mv -10 90 0 80 T129 T128 T170 T112 Lithologic column 2050 T160 T116 Well-T 714 3300 T131 T105 T75 T137 T175 SP mv 10 100 3150 T104 T174 N Depth, m Salient Chennan Fault T82 4km 3200 Chenjiazhuang 2 2000 0 Depth, m (b) (a) T7 T153 Tuo-Sheng-Yong sub fracture system 60 Well site Normal Contour line Root of fan body Middle-front of fan body Fan edge subfacies Sublacustrine Deep lake Middle Gritstone Fine Fine sandstone SandMudstone /well number fault of sand content in subaqueous fan in subaqueous fan facies conglomerate conglomerate in subaqueous fan fan conglomerate Fig. 2 (a) Distribution map of nearshore subaqueous fans and sublacustrine fans in Es4sLQWKH6KHQJWXRDUHDPRGL¿HGIURP$Q 2010). (b) Depositional sequence of sublacustrine fans and deep lake facies. (c) Depositional sequence of nearshore subaqueous fans 9%. The quartz cements, generally less than 1% in reservoirs, DUHPDLQO\TXDUW]RYHUJURZWKV)LJFIKDQGDIHZ quartz crystals. The distribution of authigenic clay minerals in reservoirs has a regularity: above 3,150 m is mainly kaolinite, DQGVKDUSO\EHORZPNDROLQLWHWUDQVIRUPVWRLOOLWH)LJ )URPWKHVKDOORZWRWKHGHHSOD\HUVWKHUHODWLYHFRQWHQW of illite/smectite mixed layer minerals increases, but the ratio of smectite in illite/smectite mix minerals decreases gradually )LJ 6FDO\ RU SHWDO VKDSHG FKORULWH EXW QR HDUO\ JUDLQ coating chlorite, develops in some reservoir rocks (Zhu et al, 2008; Chen et al, 2009). Quartz, % 100 Subfeldsarenite 0 Quartz arenite Sublitharenite 20 80 40 60 60 40 0 Lithic Feldspathic Feldsarenite feldsarenite litharenite 100 Feldspar, % 4 Distribution of porosity intervals and zones 80 20 80 60 40 Litharenite 20 100 0 Rock fragment, % Fig. 3 Ternary plot showing composition of Paleogene Es4-Es reservoirs in the Shengtuo area, the Dongying Sag (using sandstone classification VFKHPHRI)RONHWDO z 3 )LJFGIHOGVSDUGLVVROXWLRQTXDUW]FHPHQWDWLRQ DXWKLJHQLF NDROLQLWH SUHFLSLWDWLRQ )LJ F TXDUW] GLVVROXWLRQODWHFDUERQDWHFHPHQWDWLRQ)LJJIHOGVSDU GLVVROXWLRQ TXDUW] FHPHQWDWLRQ )LJ J LOOLWL]DWLRQ RI NDROLQLWHDQGDXWKLJHQLFLOOLWHSUHFLSLWDWLRQ)LJHI The compaction was mainly mechanical compaction, and pressure dissolution was weak. The dissolution mainly LQFOXGHV IHOGVSDU GLVVROXWLRQ )LJ F H J )LJ F (e)), a little dissolution of aluminosilicate detrital grains DQGTXDUW]JUDLQV'HWULWDOFDUERQDWHJUDLQV)LJEH IDQGFDUERQDWHFHPHQWV)LJFKVKRZQRHYLGHQFH of significant dissolution. Carbonate cements represent the PRVWDEXQGDQWSRUH¿OOLQJFHPHQWV)LJZLWKDPD[LPXP FRQWHQWXSWR)LJDQGDQDYHUDJHFRQWHQWRI 3RURVLW\LQWHUYDODQG]RQHFODVVL¿FDWLRQVFKHPH Core porosities of Paleogene Es4-Es 3z reservoirs were XVHGWRSORWWKHSRURVLW\GHSWKSUR¿OH,QWKHSRURVLW\GHSWK profile, normal porosity development depth intervals, AHP development depth intervals, and AHP zones, high porosity zones, low porosity zones in different depth intervals were identified with the constraints of three curves, namely, the normal evolution curve of average porosity, the normal evolution curve of maximum porosity and the porosity HQYHORSHFXUYH,QWKHSRURVLW\GHSWKSUR¿OHWKH]RQHVZKHUH reservoirs with porosities that deviated from the normal evolution curve of maximum porosity to higher values is recognized as AHP zones; the zones where reservoirs with porosities that deviated from the normal evolution curve of maximum porosity to lower values but deviated from normal evolution curve of average porosity to higher values is recognized as high porosity zones; the zones where reservoirs with porosities that deviated from normal evolution curve of average porosity to lower values is recognized as low porosity zones. In the porosity-depth profile, the depth interval Pet.Sci.(2014)11:346-362 350 Table 1 Diagenetic stages and main characteristics of the Es4-Es3z reservoirs in the Shengtuo area, the Dongying Sag Organic matter I/S Ch 65 Debris Eodiagenesis 2200 100 Immature I Feldspar A K Dissolution Quartz Organic acids Oil CO2 Authigenic cements in sandstones Carbonate cements Feldspar cements Quartz cements R o, % Relative yield %S in Maturity I/S Compaction Temperature, °C Stage Period Depth, m Diagenetic stage Contact type Pore type Point Primary dominant 0.35 65 Middle mature B ĉ Line Primary point secondary 40 3000 120 0.5 Low mature A1 3500 35 Mesodiagenesis Mature 4500 160 Point Primary line, secondary Line Ċ Point Secondary line, dominant Line 20 1.3 High mature B 5000 180 Ċ 20 0.7 A2 ĉ Line point, Primary Point secondary line 30 1.5 20 with AHP zones is recognized as the AHP development depth interval and the depth interval without AHP zones is recognized as the normal porosity development depth interval. 4.2 Normal evolution curve of maximum (average) porosity The normal evolution curve of maximum porosity in clastic reservoirs refers to the evolution curve of the maximum porosity evolving with the burial depth in reservoirs that did not experience abnormal geological processes in favor of porosity enhancement and porosity preservation during deep burial. It can be determined by connecting the maximum porosity at different depths with a smooth curve in the porosity-depth profile. Among these abnormal geological processes, the process in favor of porosity enhancement is the dissolution of unstable minerals (e.g. feldspars and carbonate minerals), while the processes in favor of porosity preservation consist mainly of fluid overpressure, early hydrocarbon emplacement, and grain coats. Thus, the normal evolution curve of maximum porosity almost follows the compaction curve. In order to determine the distribution of AHP zones in WKH 6KHQJWXR DUHD ZH GLG WKH IROORZLQJ ZRUN )LUVW ZLWK WKHFRQVWUDLQWVRIWKHPHDVXUHGIRUPDWLRQÀXLGSUHVVXUHWKH formation fluid pressure of over 300 wells in the northern steep slope zone in the Dongying Sag was calculated by the equivalent-depth method with acoustic logging data. Comparison between calculated mudstone fluid pressure and measured adjacent sandstone fluid pressure shows that the difference is always less than 5%. As well, the oilbearing properties of more than 8,000 reservoir samples with core porosity data were analyzed with core-logging PDWHULDOV6HFRQGE\UHMHFWLQJWKHSRURVLWLHVUHODWLQJWRÀXLG overpressure and/or high-level oil saturation (oil immersion, oil saturated and oil rich) from the porosity database, one SRURVLW\GHSWKSUR¿OHZDVSORWWHGXVLQJUHVHUYRLUSRURVLWLHV with normal pressure and low level oil content (oil-free, oil trace, fluorescence and oil patches). The normal evolution curve of maximum porosity in Es 4-Es 3z reservoirs in the northern steep slope zone in the Dongying Sag was then determined through the smooth connection of maximum SRURVLWLHVDWGLIIHUHQWGHSWKVLQVXFKDSRURVLW\GHSWKSUR¿OH )LJ$VHDUO\JUDLQFRDWLQJFKORULWHZDVQRWGHYHORSHG and reservoirs with significant dissolution also have relatively good oiliness, the rejection of porosities relating to fluid overpressure and/or high-level oil saturation from porosity database promises the elimination of the influence of abnormal geological processes (fluid overpressure, hydrocarbon emplacement, grain coats and rims, and dissolution) on porosities in the Shengtuo area. The normal evolution curve of average porosity in clastic reservoirs refers to the evolution curve of the average porosity evolving with the burial depth in reservoirs that did not experience abnormal geological processes in favor of porosity enhancement and porosity preservation during deep burial. On Pet.Sci.(2014)11:346-362 351 Qa FD Qa Qa FD FD (a) 200ȝP Well T165, 3236.08 m (-) FD (b) Qa FD 200ȝP Well T145, 2018.3 m (-) K K FD FD FD FD FD K K Qa FD K (c) 100ȝP Well T714, 2841.3 m (-) (d) Well T714, 2841.3 m (-) 25ȝP Qa Qa FD I I Qa FD (e) 100ȝP Well T720, 3671.1 m (-) (f) 100ȝP Well T720, 3671.1 m (-) An FD An Qa (g) Well T168, 3110.1 m (-) 50ȝP (h) Well T713, 3032.45 m (+) 100ȝP Fig. 4 Photomicrographs showing diagenetic features related to feldspar dissolution in Paleogene Es4-Es3z reservoirs in the Shengtuo area, the Dongying Sag. (a) Primary pores dominate, surface porosity of feldspar dissolution is 0.1%; (b) Primary pores dominate, surface porosity of feldspar dissolution is 0.5%; (c) Massive quartz overgrowths and kaolinite, surface porosity of feldspar dissolution is 2.462%; (d) Authigenic kaolinite and its micropores; (e) feldspar secondary pores and authigenic illite; (f) Quartz RYHUJURZWKVDQGDXWKLJHQLFLOOLWHJ)HOGVSDUSRUHVSDUWLDOO\¿OOHGZLWKDQNHULWHK4XDUW]RYHUJURZWKV SDUWLDOO\UHSODFHGE\DQNHULWHWKLQVHFWLRQDJUHGHSR[\UHVLQ±LPSUHJQDWHGWKLQVHFWLRQ)')HOGVSDU dissolution pores; Qa: Quartz overgrowths; K: Kaolinite; I: Illite; An: Ankerite the basis of the normal evolution curve of maximum porosity in clastic reservoirs, the normal average porosity of different depth intervals can be calculated using reservoir porosities with normal pressure and low oil-bearing saturation. Then in the porosity-depth profile, the normal evolution curve of average porosity in clastic reservoirs can be determined by connecting the average porosities at different depths with a VPRRWKFXUYH)LJ 4.3 Porosity intervals and zones With the constraints of the three curves, 3,880 core porosities in the Shengtuo area show one normal porosity development depth interval at depth of 1,300-2,800 m and three AHP development depth intervals developed vertically in Es4-Es3z reservoirs in the Shengtuo area. The three AHP development depth intervals are at 2,800-3,200 m, 3,2503,700 m, 3,900-4,400 m respectively, and three AHP zones Pet.Sci.(2014)11:346-362 352 Cc Cc Cc (a) Well T167, 2969.63 m (+) 200ȝP (b) Cd Well T165, 3236.08 m (+) 100ȝP Cc Cc FD F (c) F As 50ȝP Well T73, 3371.25 m (-) (d) Well T73, 3371.25 m (+) Cc Cc Cd Cd FD (e) FD Well T720, 3535.0 m (-) D 50ȝP 200ȝP (f) Well T720, 3535.0 m (+) 200ȝP D Qa-Ċ An An Qa-ĉ FD (g) Well T720, 3535.0 m (+) 25ȝP (h) 5/11/2006 Well T724, 4169.8 m, SEM HFW WD Mag 20.0μm Fig. 5 Photomicrographs showing diagenetic features related to carbonate cements in Paleogene Es4-Es3z reservoirs in the Shengtuo area, the Dongying Sag. (a) Carbonate cement filled most pores, (b) Carbonate detrital grain and the carbonate overgrowths, (c), (d) Intact early carbonate cement cladding and extensive GLVVROYHGIHOGVSDUIHOGVSDUGLVVROXWLRQSRUHVSDUWLDOO\¿OOHGZLWKDVSKDOWHI,QWDFWFDUERQDWHGHWULWDOJUDLQV and early carbonate cement cladding, extensively dissolved feldspars, (g) Two stages of quartz overgrowths, intact ankerite wrapped in Qa-II, (h) Euhedral ankerite cements. (a, b, g): thin sections; (c-f) red epoxy resin– LPSUHJQDWHGWKLQVHFWLRQ&F&DUERQDWHFHPHQWV&G'HWULWDOFDUERQDWHJUDLQ)')HOGVSDUGLVVROXWLRQSRUHV As: Asphalt; An: Ankerite; Qa: Quartz overgrowths H[LVWLQWKHWKUHH$+3GHYHORSPHQWGHSWKLQWHUYDOV)LJ Low porosity zones and high porosity zones develop in the normal porosity development depth interval, while the three AHP development depth intervals contain the corresponding low porosity zones, high porosity zones and AHP zones. In the AHP development interval I (2,800-3,200 m), porosities have a bimodal distribution pattern, and are mainly GLVWULEXWHGLQ)LJ,QWKHSRURVLW\GDWDVHWWKH low porosities account for 35%, the high porosities 33%, and the abnormally high porosities 32%. In the AHP development interval II (3,250-3,700 m), the histogram of porosities shows negative skewness, and the porosities are mainly GLVWULEXWHGLQ)LJ,QWKHSRURVLW\GDWDVHWWKH low porosities account for 46%, the high porosities 37%, and Pet.Sci.(2014)11:346-362 353 Core porosity, % 1.0 10 0 20 30 40 Kaolinite, wt% 50 1.0 Es3z Es3x Es4s Es4x 1.5 20 40 60 80 Illite, wt% 0 20 40 60 %Smectite in I/S Illite/Smectite, wt% 80 0 20 40 60 80 0 20 40 60 80 Chlorite, wt% 0 20 40 60 Carbonate cements, wt% 80 0 10 20 30 40 50 1.5 Normal porosity development interval Normal evolution curve of average porosity 2.5 Porosity envelope curve 3.0 Abnormally high porosity Anomalously development high porosity intervalĉ zoneĉ 3.5 Abnormally high porosity Anomalously development high porosity intervalĊ zoneĊ 4.0 2.0 Depth, km 2.0 Depth, km 0 3.0 3.5 4.0 Abnormally Anomalously high porosity high porosity development interval ċ zone ċ Normal evolution curve of maximum porosity 4.5 2.5 Es3z Es3x Es4s Es4x Es3z Es3x Es4s Es4x Es3z Es3x Es4s Es4x Es3z Es3x Es4s Es4x Es3z Es3x Es4s Es4x Es3z Es3x Es4s Es4x 4.5 Fig. 6 Vertical distribution of core porosities, clays and carbonate cements in Paleogene Es4-Es3z reservoirs in the Shengtuo area, the Dongying Sag the abnormally high porosities 23%. In the AHP development interval III (3,900-4,400 m), the histogram of porosities distribution shows positive skewness, and the porosities are 30 20 15 10 5 0 30 3250-3700 m Sample No.: 1105 25 Frequency, % 2800-3200 m Sample No.: 1203 25 Frequency, % Frequency, % 30 PDLQO\GLVWULEXWHGLQ)LJ7KHORZSRURVLWLHV account for 1%, the high porosities 9%, and the abnormally high porosities 90%. 20 15 10 5 0 0 4 8 12 16 20 Porosity, % 24 28 3900-4400 m Sample No.: 88 25 20 15 10 5 0 0 4 8 12 16 20 Porosity, % 24 28 0 4 8 12 16 20 24 28 Porosity, % Fig. 7 Histograms of porosities in different AHP development depth intervals in the Shengtuo area, the Dongying Sag 5 Reservoir pores In order to determine the type of an AHP zone, the relative content and absolute content of primary pores and secondary SRUHVLQUHVHUYRLUVVKRXOGEHFRQVLGHUHGWRJHWKHU)URP)LJ it can be seen that, with an increase of core porosity, both the primary thin section porosity and the secondary thin section porosity tend to increase, but the percentage of primary thin section porosity increases and the percentage of secondary WKLQ VHFWLRQ SRURVLW\ GHFUHDVHV JHQHUDOO\ )RU$+3 ]RQH , (2,800-3200 m) and II (3,250-3,700 m), reservoirs with AHP FRQVLVWPDLQO\RIYLVLEOHSRUHV)LJDE)LJDE and the content of micropores is much less than that of visible pores. In reservoirs with AHP, primary pores dominate the visible pores and account for 50%-90% of the total visible SRUHV)LJVR$+3]RQHV,DQG,,VKRXOGEHSULPDU\$+3 zones. The secondary surface porosity in reservoirs with AHP ranges from 0.5% to 3.0%. Micropores in authigenic clays DOVRGHYHORSZKHQVLJQL¿FDQWGLVVROXWLRQSRUHVGHYHORS )RU$+3 ]RQH ,,, P WKH SHUFHQWDJH RI secondary surface porosity in the total surface porosity is about 100%, but its absolute value is always less than &RUH SRURVLWLHV FDQ UHDFK XS WR )LJ and polished thin section and SEM samples show that PLFURSRUHVLQWKHPDWUL[)LJJK)LJFGHYHORS and contribute much more to the core porosity than secondary SRUHV$VDUHVXOWWKLV]RQHVKRXOGDOVREHLGHQWL¿HGDVWKH primary AHP zone, but with predominantly micropores in the matrix. The pores in high porosity sandstones in different AHP development depth intervals are complex, and the reservoir VSDFHFRQVLVWVRIQRWRQO\SULPDU\SRUHV)LJ)LJE (e)), but sometimes secondary pores. However, for the low porosity reservoirs, due to strong compaction or extensive carbonate cementation, the reservoir space consists just a small proportion of secondary pores or matrix micropores )LJ)LJFILDQGYLVLEOHSRUHVGRQRWGHYHORS Pet.Sci.(2014)11:346-362 354 Primary surface porosity, % 1.5 0 2 4 6 8 10 12 Percentage of primary surface porosity in total surface porosity, % Secondary surface porosity, % 0 2 4 6 8 10 12 0 20 40 60 80 Percentage of secondary surface porosity in total surface porosity, % 0 20 40 60 80 Porosity intervals Core porosity, % 100 1.5 2.0 2.0 2.5 2.5 0 10 20 30 40 50 Normal porosity development interval Normal evolution curve of average porosity Depth, km Depth, km Porosity envelope curve 3.0 Abnormally Primary high porosity abnormally development high porosity intervalĉ zoneĉ 3.5 3.5 Abnormally high porosity Primary abnormally development high porosity intervalĊ zoneĊ 4.0 4.0 3.0 2% 1% 4.5 2% 1% 4.5 Anomalously high porosity reservoir High porosity reservoir Primary abnormally high porosity zone ċ Abnormally high porosity development interval ċ Normal evolution curve of maximum porosity Low porosity reservoir Fig. 8 Core plug porosity, secondary surface porosity, percentage of secondary surface porosity in total surface porosity and percentage of primary surface porosity in total surface porosity in Paleogene Es4-Es3z reservoirs in the Shengtuo area, Dongying 6DJ)RUHDFKFRUHSRURVLW\VDPSOHWKHUHDUHPDWFKHGWKLQVHFWLRQDQGUHGHSR[\UHVLQ±LPSUHJQDWHGWKLQVHFWLRQ High porosity sandstones (3900-4400m) Abnormally high porosity development interval Ⅲ (3250m-3700m) Abnormally high porosity development interval Ⅱ (2800m-3200m) Abnormally high porosity development interval Ⅰ Anomalously high porosity sandstones (a) 200ȝP (b) Tuo76, 2942.02 m, ĭ=22.3%; primary pores (-) B-1 (d) (e) 200ȝP B-2 200ȝP (c) Tuo168, 3098.24 m, ĭ=15.6%; primary pores (-) Tuo720, 3671.1 m, ĭ=14.2%; primary pores (-) (g) 100ȝP Low porosity sandstones (f) 100ȝP B-3 (h) HFW WD Mag 50.0μm 100ȝP Tuo73, 3368.4 m, ĭ=3.5%; debris secondary pores (-) Tuo73, 3371.25 m, ĭ=10.2%; mainly primary pores (-) 5/9/2006 200ȝP Tuo167, 2969.63 m, ĭ=2.6%; little secondary pores (-) (i) B-3 200ȝP 3 20 47 PM SD 13 μm SD μm Tuo764, 3949.45 m, ĭ=10.9%; micropores in matrix dominate (-) Tuo764, 3951.05 m, ĭ=14.6%; micropores in matrix, SEM Tuo764, 3950.25 m, ĭ=1.8%; little debris secondary pores (-) Fig. 9 Photomicrographs showing pores of Paleogene Es4-Es3z reservoirs with different porosity levels in different AHP development intervals. (a-g, i): red epoxy resin–impregnated thin section Pet.Sci.(2014)11:346-362 30 20 (b) PP 40 30 Well T720,P, ĭ=19.0%,k P' Well T76,P, ĭ=12.9%,k P' Well T73,P, ĭ=3.5%,k P' 20 50 Percentage, % 40 50 Percentage, % :HOO7P ĭ=22.3%, k P' Well T126,P, ĭ=16.6%,k P' Well T167,P, ĭ=4.6%,k P' DPP 30 0 0 0. 0.000 0.006 0.010 0.016 0.025 0.040 0 0.63 0.10 0.16 0.25 0.40 1.63 1.00 2.60 4.50 6.00 1030 16.0 25.0 40.0 63.0 .0 0 0. 0.000 0.006 0.010 0.016 0.025 0.040 0 0.63 0.10 0.16 0.25 0.40 1.63 1.00 2.60 4.50 6.00 1030 16.0 25.0 40.0 63.0 .0 10 Pore radius, ȝP 3RUHUDGLXVȝP Macro pores AQRPDORXVO\KLJKSRURVLW\VDQGVWRQHV Micro pores Well T764,P, ĭ=14.4%,k P' Well T764,P, ĭ=6.1%,k P' Well 764,P, ĭ=1.8%,k P' 20 10 Micro pores (c) PP 40 10 0. 0.000 0.006 0.010 0.016 0.025 0.040 0 0.63 0.10 0.16 0.25 0.40 1.63 1.00 2.60 4.50 6.00 1030 16.0 25.0 40.0 63.0 .0 Percentage, % 50 355 Pore radius, ȝP Macro pores Micro pores +LJKSRURVLW\VDQGVWRQHV Macro pores /RZSRURVLW\VDQGVWRQHV Fig. 10 Pore-throat radius distribution of Paleogene Es4-Es3z reservoirs with different porosity levels in different AHP development intervals 6 Genesis of AHP zones 6.1 Diagenetic environment and mineral dissolution 6.1.1 Diagenetic environment )HOGVSDU GLVVROXWLRQ FDUERQDWH dissolution, authigenic kaolinite and quartz cements indicate that reservoirs experienced an acidic diagenetic environment; and quartz dissolution, feldspar overgrowths, carbonate cements are symbols that reservoirs experienced an alkaline diagenetic environment (Zhou et al, 2011). With extensive feldspar dissolution and weak quartz dissolution in Paleogene reservoirs, we focus on the acidic diagenetic environment that is critical to secondary pores. 1) Fluid inclusions Quartz overgrowths are common in reservoirs and their WKLFNQHVVJHQHUDOO\UDQJHVIURPȝPWRȝP$VSUHVVXUH dissolution was weak, the quartz cements probably mainly originate from feldspar dissolution (Yuan et al, 2013a). Th of ÀXLGLQFOXVLRQVLQTXDUW]RYHUJURZWKVFRQFHQWUDWHVLQ& -130 °C and 160 °C -180 °C (Table 2), respectively, indicating that reservoirs experienced two stages of feldspar dissolution and product precipitation in the diagenetic process. This FDQDOVREHYHUL¿HGE\WKHWZRVWDJHVRITXDUW]RYHUJURZWKV LQWKLQVHFWLRQV)LJJ7KHVDOLQLW\RIIOXLGLQFOXVLRQV usually exceeds 10%. The high Th and salinity indicate a weak LQÀXHQFHRIPHWHRULFZDWHURQIHOGVSDUOHDFKLQJ7DEOHVR we conclude that feldspar dissolution and authigenic quartz cementation in Es4-Es3z reservoirs occurred in a deep burial diagenetic environment. Table 2)OXLGLQFOXVLRQVGDWDRITXDUW]RYHUJURZWKVLQ3DOHRJHQH(V4UHVHUYRLUVLQWKH6KHQJWXRDUHD'DWDIURPWKH*HRORJLFDO6FLHQWL¿F 5HVHDUFK,QVWLWXWHRI6,123(&6KHQJOL2LO¿HOG&RPSDQ\ Well No. Depth, m Strata Host minerals Type Size, ȝP Vapor phase, vol.% Th, °C Tice, °C Salinity, %NaCl Tuo719 3562.1 Es4s Quartz overgrowth Salt-water 7 6 103.7 -10.4 14.4 Tuo719 3562.1 Es4s Quartz overgrowth Salt-water 4 5 124.4 -8.0 11.7 3562.1 s Quartz overgrowth Salt-water 7 10 128.1 -6.9 10.4 s Quartz overgrowth Salt-water 5 7 179.6 -13.5 17.3 s Quartz overgrowth Salt-water 6 9 168.7 -6.2 9.5 Tuo719 Tuo719 Tuo762 3562.1 3451 Es4 Es4 Es4 2) Fluid pressure With disequilibrium compaction, hydrocarbon generation and clay dehydration, fluid overpressure developed in Es4-Es3z reservoirs in the Shengtuo area, especially in the sublacustrine fans (Zhang et al, 2009). According to the PHDVXUHGÀXLGSUHVVXUHGDWDZHDNÀXLGRYHUSUHVVXUHEHJDQ to develop at 2,000 m in the northern steep slope zone, and medium-strong fluid overpressure developed commonly ZKHQWKHEXULDOGHSWKH[FHHGHGP)LJ$FFRUGLQJ WRHYROXWLRQKLVWRU\RIÀXLGSUHVVXUHLQWKH6KHQJWXRDUHD)LJ 12), fluid overpressure began to develop in Es4 reservoirs at 40 Ma and in Es3z reservoirs at 14 Ma (Tang, 2007; Sun, 2010) when the reservoir burial depth exceeded 2,200 m. In the source rocks, kerogen began to generate large amounts of organic acids and CO2 when the depth exceeded 2,000 m. So ZKHQVLJQL¿FDQWRUJDQLFDFLGVDQG&22 were expelled into the reservoirs, overpressure was generated. This suggested that feldspar dissolution occurred in a relatively closed diagenetic V\VWHPZLWKÀXLGRYHUSUHVVXUH 3) Thermal evolution of organic matter and acidic fluid source )URP&WR&WKHNHURJHQYLWULQLWHUHIOHFWDQFH Pet.Sci.(2014)11:346-362 356 Fluid pressure, MPa 1.0 0 10 20 30 40 50 60 Fluid pressure coefficient 0.6 0.8 1.0 1.2 1.4 1.6 1.8 0 R o, % 0.5 1.0 0.35 0.7 CO2 in natural gas, % Temperature, °C 1.5 0 50 100 150 0 5 10 15 20 1.3 1.5 Depth, km 2.0 B sub-stage of eogenesis 2.5 3.0 Early-A sub-stage of mesogenesis 3.5 Late-A sub-stage of mesogenesis 4.0 Hydrostatic pressure 4.5 Fig. 11'LVWULEXWLRQRIPHDVXUHGÀXLGSUHVVXUHNHURJHQYLWULQLWHUHÀHFWDQFHRo), formation temperature and CO2 contents in the northern steep slope zone of the Dongying Sag (Ro) is 0.35%-0.70% in the diagenetic stage from period B of the eogenetic stage to sub-period A1 of the mesogenetic stage. Thermal evolution of organic matter can generate large amounts of organic acids and CO2 )LJ 7KHVH acidic fluids expelled into reservoirs from source rocks by compaction and overpressure related to hydrocarbon generation and clay dehydration should be the most likely source of acids for stage-I feldspar leaching. The stage-II feldspar dissolution mainly occurred at 160 °C to 180 °C. When the temperature exceeded 160 °C, the degradation of organic matter in source rocks generated CO2. Meanwhile, the organic acid generated earlier experienced intense decarboxylation, and its concentration decreased sharply. CO 2 generated in these processes diffused into the pore water and released H+, which controlled the pH and provided acidic fluids for the stage II feldspar leaching (Surdam et al, 1989). CO 2 detected in the fluid inclusions in quartz overgrowths also suggests the formation of these cements in the presence of CO2 (Chen et al, 2010). In addition, in the oilgas reservoirs below 4,000 m, the low CO2 content indicates the consumption of CO2E\IHOGVSDUGLVVROXWLRQ)LJ 6.1.2 Little porosity enhancement from feldspar dissolution Whether feldspar dissolution can effectively increase the reservoir porosity depends on whether the dissolution byproducts can be removed from the dissolution area. The feldspar dissolution in Es 4-Es 3z reservoirs occurred in a relatively closed diagenetic system with high temperature and salinity. We can also determine this from microscopy, which shows that if the feldspar dissolution is weak, the dissolution byproducts are less; if feldspar dissolution is abundant, the dissolution byproducts are abundant. To objectively evaluate the impact of feldspar dissolution on reservoir porosities, using interactive image analysis techniques, quantitative statistics were collected for the contents of feldspar pores, authigenic kaolinite and quartz overgrowths with red epoxy UHVLQ±LPSUHJQDWHGWKLQVHFWLRQV)LJVKRZVWKDWZLWKRXW calibration of kaolinite micropores, the difference between the contents of feldspar pores and byproducts is generally below 0. He and Nan (2004) found authigenic kaolinite microporosity to be 25%-50%. With an average value of 37%, we made the correction of kaolinite content. Then, the difference between contents of feldspar pores and byproducts was generally less WKDQDQGXVXDOO\YHU\FORVHWR)LJ7UDQVIHU of the dissolution byproducts out of the sandstones may take place during dissipation of overpressure, resulting in some enhanced porosity. However, the data demonstrate that, in a UHODWLYHO\FORVHGV\VWHPVLJQL¿FDQWIHOGVSDUSRUHVH[LVWEXW the feldspar dissolution has little impact on porosity. The main function of feldspar dissolution is converting primary pores into isovolumetric feldspar secondary pores and micropores in authigenic clays. In relatively closed diagenetic systems, the feldspar dissolution products cannot be effectively removed from the sandstones. Precipitation occurs in forms of authigenic clay minerals (kaolinite and illite) and quartz cements in situ, and the maximum enhanced porosity by dissolution of one unit volume of K-feldspar, albite and anorthite is 13%, 7% and 4%, respectively (Giles and de Boer, 1990). The maximum amount of feldspar pores in reservoirs in the Shengtuo area is about 3%, then, the maximum enhanced porosity due to feldspar dissolution (suppose all are K-feldspars) is just 0.4% (3%×13%=0.4%), which is in consistent with the statistical data. 6.1.3 Little dissolution of carbonate minerals Based on the negative relationship between core porosity and the amount of carbonate cements, Zhong et al (2003), Zhu et al (2007) and Zhang et al (2007) argued that the low content of carbonate cements in the high porosity reservoirs LQWKH6KHQJWXRDUHDRULJLQDWHGIURPVLJQL¿FDQWGLVVROXWLRQRI Pet.Sci.(2014)11:346-362 357 Tectonic stage Rifting stage 50 Age, Ma Es3s Es3z Es4x Es3x 0 Es4s Stratigraphy Tectonic uplift stage 40 30 Es2 20 Es1 Depression period 10 Ng Ed 0 Nm Q 20 ņ 40 ņ Depth, km Burial and thermal history 1 60 ņ 80 ņ 100 ņ 2 120 ņ 3 4 140 ņ 160 ņ Well Tuo-764 160 ņ Pressure increasing stage due to low compaction with rapid subsidence 1.6 Pressure coefficient Pressure evolution and oil charging history in Es3x-Ex3z 1.8 Pressure stable stage with slow subsidence Pressure decreasing stage with tectonic uplift Pressure increasing stage due to hydrocarbon generation with relative rapid subsidence Hydrocarbon charging intermission period Oil charging periodⅡ (13.8-0Ma) Medium-high overpressure accumulation system 1.4 1.2 1.0 Oil charging periodⅠ (35-26Ma) Normal-weak overpressure accumulation system 0.8 1st period hydrocarbon including fluid Es3x-Ex3z 1.8 Pressure coefficient Pressure evolution and oil charging history in Es4 1.6 2nd period hydrocarbon including fluid Present formation fluid 1st period hydrocarbon including fluid Es4 2nd period hydrocarbon including fluid Present formation fluid Normal pressure Pressure increasing stage Stable pressure Pressure decreasing stage with rapid due to low compaction stage with stage with with rapid subsidence subsidence slow subsidence tectonic uplift and hydrocarbon generation Pressure increasing stage due to hydrocarbon generation with relative rapid subsidence 1.4 1.2 1.0 0.8 Oil charging period Ⅰ(39-31.9Ma) Weak-medium overpressure accumulation system Hydrocarbon charging intermission period Oil charging periodⅡ(13-0Ma) Medium-high overpressure accumulation system Fig. 12 Burial and thermal history, fluid pressure evolution history and hydrocarbon charging history of VXEODFXVWULQHIDQVLQWKH6KHQJWXRDUHD'DWDRIK\GURFDUERQFKDUJLQJKLVWRU\DQGÀXLGSUHVVXUHHYROXWLRQKLVWRU\ from Cai et al (2009) and Sun (2010)) FDUERQDWHFHPHQWVDQGWKHVLJQL¿FDQWLQWHUJUDQXODUSRUHVDUH mainly carbonate cement dissolution pores. With observation of nearly 200 thin sections and red epoxy resin–impregnated thin sections and 55 SEM samples in the Shengtuo area, we found carbonate cements occur as FRQQHFWHG SDWFKHV )LJ D VLQJOH FU\VWDO )LJ J RU JUDLQFRDWLQJFDUERQDWH)LJFIDQGFRPPRQO\H[KLELW HXKHGUDOFU\VWDOIDFHVZKHUHDEXWWLQJRSHQSRUHVSDFH)LJ 5(h)). The euhedral dolomite coated with stage-II quartz RYHUJURZWKV )LJ J VXJJHVWV WKDW FDUERQDWH PLQHUDOV were not leached when stage-II feldspar dissolution and quartz cement precipitation took place. In addition, detrital carbonate grains and grain coating carbonate cements show QR HYLGHQFH RI GLVVROXWLRQ )LJ FI7KH FDUERQDWH overgrowths are often found accompanying detrital carbonate JUDLQV )LJ E +RZHYHU IHOGVSDU JUDLQV ZUDSSHG E\ early grain coating carbonate cements or close to detrital FDUERQDWHJUDLQVZHUHGLVVROYHGH[WHQVLYHO\)LJFI These phenomena demonstrate that carbonate cements and detrital carbonate grains were not noticeably corroded. As no HYLGHQFHVKRZVVLJQL¿FDQWGLVVROXWLRQRIFDUERQDWHFHPHQWV a large number of intergranular pores are likely to be primary intergranular pores instead of carbonate cement dissolution pores. The most likely reason for the negative relationship between porosity and percent carbonate cements should be the carbonate cementation degree, rather than the carbonate cement dissolution degree. About the selective dissolution phenomena between feldspars and carbonate minerals, we explain this as follows: 1) At depths of 2,500-3,500 m, the formation temperature in the Dongying Sag is about 100 °C-130 °C, and the Ro of NHURJHQLQVRXUFHURFNVLVZKLFKDUHEHQH¿FLDO for the generation and preservation of organic acids. Organic acids control the alkalinity of pore water, and the pCO2 is UHODWLYHO\KLJK)LJ,QVXFKDQRUJDQLFDFLGV±FDUERQLF acid–pCO2–carbonate minerals–aluminum silicate minerals Pet.Sci.(2014)11:346-362 358 1.9 0 Feldspar pores, % 1 2 3 0 Kaolinite, % 1 2 3 0 Quartz overgrowth, % 0.2 0.4 0.6 0.8 1 A, % -1 0 1 -0.5 B, % 0 0.5 1.0 2.1 Depth, km 2.3 2.5 2.7 2.9 3.1 3.3 A, %: Difference between feldspar pore content and dissolution byproducts; B, %: Difference between feldspar pore content and 62.5% of kaolinite content and quartz overgrowth content Fig. 13 Amount of feldspar pores, dissolution products, and their differences in Es4-Es3z reservoirs buffer system, the carbonate minerals tend to be precipitated rather than to be corroded, but the feldspars tend to be leached (Surdam et al, 1989). 2) Thick gypsum and salt layers and carbonate layers exist in the Palaeogene Es4 )RUPDWLRQ DQG VXJJHVW D KLJK salinity and strong alkalinity of the sedimentary water (Wang, 6DOLQLW\GDWDRIÀXLGLQFOXVLRQVLQTXDUW]RYHUJURZWKV LQGLFDWHWKHOHDFKLQJRIIHOGVSDUVE\DFLGLFÀXLGVZLWKKLJK salinity (Table 2). The modern pore water in reservoirs has high salinity, and the concentration of Ca2+ and Mg2+ is high )LJ+LJKVDOLQLW\DQGKLJKFRQFHQWUDWLRQRI&D2+ and Mg2+ probably inhibit carbonate dissolution, and promote its precipitation due to the common-ion effect. 3) The main source rocks in the Dongying Sag contain high percentage of carbonate minerals (up to 50%), feldspars DQGRWKHUXQVWDEOHPLQHUDOV4LDQHWDO)LQHXQVWDEOH minerals with high specific surface area in source rocks UHDFWHG¿UVWZLWKWKHRUJDQLFDFLGVWKDWZHUHUHOHDVHGGXULQJ thermal evolution of organic matter due to their proximity (Giles and Marshall, 1986). In addition, the initial salinity of SRUHZDWHUZDVKLJKVRÀXLGH[SHOOHGIURPVRXUFHURFNVLQWR reservoirs would be rich in various ions. As the fluid with high salinity and weak acidity entered into the reservoirs, its acidity decreased further, in such condition, the carbonate minerals tended to be precipitated, rather than be dissolved (Zeng, 2001). 4) The study by Song and Huang (1990) shows that carbonate minerals may precipitate at a pH between 5 and 6, although most scholars argued that carbonate minerals begin to precipitate when pH exceeds 8.4. In addition, the calculation results by Huang et al (2009a) show that, for carbonate dissolution in deep buried reservoirs (>3,000 m), the pH of fluid should be lower than 5. However, CaCl2type pore water with high salinity of the relatively stagnant environment in the Shengtuo area is generally weakly acidic ZLWKS+EHWZHHQDQG)LJZKLFKLVQRWIDYRUDEOHIRU carbonate dissolution in deep burial. 5) The calculation of Meshri (1986) shows that at 25 °C DQGEDUWKH*LEEVIUHHHQHUJ\ǻG) for leaching of anorthite and K-feldspar by acetic acid to form kaolinite is –36.9 kJ/ PRODQG±N-PRODQGǻG of the reaction between calcite and acetic acid is +11.20 kJ/mol. Meanwhile, as temperature DQG SUHVVXUH LQFUHDVHǻG of reaction between organic acid and feldspars decreases (Huang et al, 2009b), while as temperature increases, the solubility of carbonate minerals decreases sharply. Therefore, in a relatively closed diagenetic environment with high temperature, the organic acids tend to dissolve feldspars rather than carbonate minerals. 6.2 Geological processes in favor of porosity preservation 6.2.1 Sedimentary facies Statistical data show that sedimentary facies in the Shengtuo area have significant influence on the reservoir porosity. On the whole, porosities of sublacustrine fan reservoirs are higher than those of nearshore subaqueous fans, which might be related to the fluid overpressure in VXEODFXVWULQH IDQV )RU H[DPSOH LQ$+3 GHYHORSPHQW intervals I and II, reservoirs in sublacustrine fans have an average porosity of 15.03% and 10.72%, while the average porosity of reservoirs in nearshore subaqueous fans is just 10.43% and 6.43% (Table 3). In sublacustrine fans, porosities of reservoirs in braided channels in the mid-fan are the best, followed by porosities of main channels innerfan, and porosities of outer fan and inter-channels in midfan are the worst. In nearshore subaqueous fans, porosities of reservoirs in middle-front of fan body are the best, porosities of reservoirs in root of fan body and fan edge are worse (Table 3). 6.2.2 Fluid overpressure The fluid pressure in the Es4 formation experienced five stages: 1) normal pressure stage with rapid subsidence at 4940 Ma, 2) pressure increase stage due to low compaction with Pet.Sci.(2014)11:346-362 pH 1.5 6.0 359 K+ & Na+, mg/L 7.0 1000 100000 Ca2+, mg/L 100 Mg2+, mg/L 10000 10 Clí, mg/L 1000 1000 SO 42í, mg/L 100000 100 1000 HCO3í , mg/L 100 Total salinity, mg/L 10000 1000 Water type 100000 CaCl2 NaHCO3 MgCl2 2.0 Depth, km 2.5 3.0 3.5 Es3s Es3z Es3x Es4s Es4x 4.0 Fig. 14 Characteristics of pore water in Palaeogene Es4-Es3 formation Table 35HVHUYRLUSRURVLW\RIGLIIHUHQWVHGLPHQWDU\IDFLHVPLFURIDFLHVÀXLGSUHVVXUHDQGRLOLQHVVLQGLIIHUHQW$+3GHYHORSPHQWLQWHUYDOV Sedimentray facies Contro olling Controlling fa actors factors P Porosity i intervals Abnormally high porosity development interval ĉ Poro osity Porosity Normal Medium Strong Oil -weak No oil, Oil Root of MiddleMain overoverimmersion, Braided Inter overoil trace spot Tot Total fan front of )DQHGJH Total water )DQHGJH pressure pressure oil bearing channel channel pressure body fan body channel Nearshore subaqueous fan 1.0 1. 1.0 2.6 1.9 1.4 3.5 1.4 1.7 1.8 1.0 1.8 1.4 1.0 1.4 2.9 Max, % 22.0 19.2 22.0 23.6 29.5 19.7 29.5 21.1 19.9 27.0 19.9 29.5 26.9 23.8 29.5 Ave, % 10.43 7.46 12.92 6.62 15.03 10.33 17.70 8.34 9.02 11.20 11.62 15.39 10.22 11.35 16.55 50 302 164 873 78 595 27 173 426 294 669 363 425 601 Min, % 0.7 0.7 1.8 2.9 1.1 1.5 1.6 1.2 1.1 0.7 1.1 1.2 0.7 1.3 1.5 Max, % 20.9 8.8 20.9 20.9 32.9 28.1 32.9 16.8 19.9 11.4 22.1 32.9 22.1 28.1 32.9 Ave, % 6.43 3.57 8.60 11.06 10.72 9.66 12.55 6.89 7.16 5.27 10.18 11.92 6.44 10.02 13.63 71 70 30 793 166 451 93 83 142 544 278 345 293 326 Sample No. 171 Abnormally high porosity development interval ċ Sublacustrine fan Min, % M Sample No. 516 Abnormally high porosity development interval Ċ Oiliness of sandstones )OXLGSUHVVXUH Min, % ʊ ʊ ʊ ʊ 1.8 ʊ 1.8 ʊ ʊ ʊ 1.8 ʊ 1.8 6.1 8.6 Max, % ʊ ʊ ʊ ʊ 22.3 ʊ 22.3 ʊ ʊ ʊ 22.3 ʊ 13.9 22.3 21.7 Ave, % ʊ ʊ ʊ ʊ 15.12 ʊ 15.12 ʊ ʊ ʊ 15.12 ʊ 9.56 14.71 16.22 Sample No. ʊ ʊ ʊ ʊ 88 ʊ 88 ʊ ʊ ʊ 88 ʊ 11 13 64 rapid subsidence and hydrocarbon generation at 40-31.9 Ma, 3) stable pressure stage with slow subsidence at 31.9-24.6 Ma, 4) pressure decrease stage with tectonic uplifting at 24.614 Ma and 5) pressure increase stage due to hydrocarbon JHQHUDWLRQZLWKUHODWLYHO\UDSLGVXEVLGHQFHDW0D)LJ 12) (Zhang et al, 2009; Sun, 2010). Before 13 Ma, fluid pressure in sublacustrine fans in Es 3 was generally normal, but with weak overpressure development at 35-24.6 Ma. Moderate-strong overpressure EHJDQWRGHYHORSDIWHUDERXW0D)LJ&DLHWDO :KHQÀXLGRYHUSUHVVXUHEHJDQWRGHYHORSWKHEXULDOGHSWKV of sublacustrine fan reservoirs in Es3 and Es 4 are always shallower than 2,200 m. The shallow development of fluid overpressure retarded compaction during deeper burial and pores in reservoirs were preserved to greater depths. Data in Table 3 show that as fluid overpressure Pet.Sci.(2014)11:346-362 360 increases, the average porosity of reservoirs in the three AHP development intervals increases significantly. In AHP development interval I, reservoirs with normal-weak pressure KDYHDQDYHUDJHSRURVLW\RIWKRVHZLWKPLGGOHÀXLG overpressure have an average porosity of 11.62%, and those with high fluid overpressure have an average porosity of 15.39% (Table 3). In AHP development interval II, reservoirs ZLWKQRUPDOÀXLGSUHVVXUHDQGZHDNÀXLGRYHUSUHVVXUHKDYH an average porosity of 5.27%, those with middle overpressure have an average porosity of 10.18%, and those with strong overpressure have an average porosity of 11.92% (Table 3). In $+3GHYHORSPHQWLQWHUYDO,,,DOOUHVHUYRLUVKDYHPLGGOHÀXLG overpressure, and the average porosity is up to 15.12% (Table 3). So we can say that the shallow development of fluid overpressure effectively retarded the compaction, leading to point contact and line-point contact of detrital grains in deeply EXULHGUHVHUYRLUV)LJDJ7KXVVKDOORZGHYHORSPHQW RIÀXLGRYHUSUHVVXUHLVRIVLJQL¿FDQFHWRWKHGHYHORSPHQWRI AHP zones in deeply buried strata. 6.2.3 Hydrocarbon emplacement Hydrocarbon emplacement in Es4 reservoirs occurred PDLQO\ DW 0D DQG 0D )LJ 6XQ Hydrocarbon emplacement in Es3x-Es3z reservoirs occurred PDLQO\ DW 0D DQG 0D )LJ &DL HW al, 2009), and the second stage is more important. When hydrocarbon emplacement took place, the reservoirs were always shallower than 2,500 m. The early hydrocarbon emplacement inhibited carbonate cementation during late burial and reservoir pores were preserved to deeper depth. Data in Table 3 show that as oil saturation increases, the average porosity of reservoirs in the three AHP development intervals increases sharply, and carbonate cement content decreases significantly. In AHP development interval I, reservoirs with no oil, fluorescence or oil trace have an average porosity of 10.22% and an average carbonate cement content of 11.22%. Reservoirs with oil spots have an average porosity of 11.35% and an average carbonate cement content of 12.32%. Oil saturated or oil rich reservoirs have an average porosity of 16.55% and an average carbonate cement content of 6.99% (Table 3). In AHP development interval ,,UHVHUYRLUVZLWKQRRLOÀXRUHVFHQFHRUMXVWDWUDFHRIRLO have an average porosity of 6.44% and an average carbonate cement content of 9.95%. Reservoirs with oil spots have an average porosity of 10.02% and an average carbonate cement content of 15.60%. Oil saturated or oil rich reservoirs have an average porosity of 13.63% and an average carbonate cement content of 5.15% (Table 3). In AHP development interval ,,,UHVHUYRLUVZLWKQRRLOÀXRUHVFHQFHRURLOWUDFHVKDYHDQ average porosity of 9.56% and an average carbonate cement content of 14.20%. Reservoirs with oil spot have an average porosity of 14.71% and an average carbonate cement content of 10.40%. Oil saturated or oil rich reservoirs have an average porosity of 16.22% and an average carbonate cement content of 9.82% (Table 3). So we can say that the early hydrocarbon emplacement effectively inhibited carbonate cementation and WKDWHDUO\K\GURFDUERQHPSODFHPHQWLVRIVLJQL¿FDQFHWRWKH development of AHP zones in deeply buried strata. 7 Conclusions 1) Three AHP zones developed in Palaeogene Es4-Es3z reservoirs in the Shengtuo area of the Dongying Sag, at depths of 2,800-3,200 m, 3,250-3,700 m and 3,900-4,400 m, respectively. 2) AHP zones at depths of 2,800-3,200 m and 3,250-3,700 m are visible pore primary AHP zones, with visible primary intergranular pores dominating. AHP zones at the depth of 3,900-4,400 m are micropores primary AHP zones, with micropores in matrix dominating. 3) In the relatively closed diagenetic system with high temperature and salinity, burial dissolution contribute little to the AHP zone due to low porosity enhancement by feldspar dissolution and little dissolution of carbonate cements. Reservoirs in braided channels of middle fans in sublacustrine fans and reservoirs in middle-front of fan bodies of nearshore subaqueous fans provided the basis for WKHGHYHORSPHQWRI$+3]RQHV6KDOORZGHYHORSPHQWRIÀXLG overpressure and early hydrocarbon emplacement preserved high porosity in deep layers by inhibiting compaction and carbonate cementation effectively during deep burial. Thus, the favorable exploration targets should be reservoirs with good primary porosity that experienced fluid overpressure developed from shallow layers, early hydrocarbon emplacement, and good preservation during later burial. Acknowledgements This study was financially supported by the National 1DWXUDO6FLHQFH)RXQGDWLRQRI&KLQD1R81R 41102058), a National Science and Technology Special Grant 1R=;DQG)RXQGDWLRQIRUWKH$XWKRURI National Excellent Doctoral Dissertation of China. We also thank the following individuals and institutions: Jon Gluyas of Durham University, Meng Yuanlin of Northeast Petroleum University, Zhu Guohua in the Hangzhou Institute of Petroleum Geology, CNPC, and reviewers of this manuscript. 7KH6KHQJOL2LO¿HOG&RPSDQ\RI6,123(&SURYLGHGDOOWKH related core samples and some geological data. References An J. The study of sedimentary reservoirs of sand-conglomerate bodies in the Es3-Es4 Members in the Shengtuo area. Master Thesis. China University of Petroleum (East China). 2010 (in Chinese) Berger A, Gier S and Krois P. Porosity-preserving chlorite cements in shallow-marine volcaniclastic sandstones: Evidence from Cretaceous VDQGVWRQHVRIWKH6DZDQJDV¿HOG3DNLVWDQ$$3*%XOOHWLQ 93(5): 595-615 Bloch S, Lander R H and Bonnell L. Anomalously high porosity and permeability in deeply buried sandstone reservoirs: Origin and predictability. AAPG Bulletin. 2002. 86(2): 301-328 Cai L M, Chen H H, Li C Q, et al. Reconstruction of the paleo-fluid SRWHQWLDO¿HOGRI(V3 in the Dongying Sag of the Jiyang Depression ZLWKV\VWHPDWLFÀXLGLQFOXVLRQDQDO\VLV2LO*DV*HRORJ\ 30(1): 17-24 (in Chinese) Cao Y C, Yuan G H, Li X Y, et al. Types and characteristics of anomalously high porosity zones in Paleogene mid-deep buried reservoirs in the northern slope, Dongying Sag. Acta Petrolei Sinica. Pet.Sci.(2014)11:346-362 2013. 34(4): 683-691 (in Chinese) Chen G J, Du G C, Zhang G C, et al. Chlorite cement and its effect on the reservoir quality of sandstones from the Panyu low-uplift, Pearl River Mouth Basin. Petroleum Science. 2011. 8: 143-150 Chen X, Zhong J H, Yuan J, et al. Development and formation of Paleogene kaolinite, Bonan Subsag. Petroleum Exploration and Development. 2009. 36(4): 456-462 (in Chinese) Chen Y, Lin C Y, Zhang S W, et al. Study on fluid inclusions in deep natural gas reservoirs in Minfeng sub-sag, Dongying Sag. Acta Sedimentologica Sinica. 2010. 28(3): 620-625 (in Chinese) Ehrenberg S N, Walderhaug O and Bjørlykke K. Carbonate porosity creation by mesogenetic dissolution: Reality or illusion?. AAPG Bulletin. 2012. 96(2): 217-233 Ehrenberg S N. Preservation of anomalously high porosity in deeply buried sandstones by grain-coating chlorite: examples from the Norwegian Continental Shelf. AAPG Bulletin. 1993. 77(7): 12601286 )RON 5 /$QGUHZV 3 % DQG /HZLV ': 'HWULWDO VHGLPHQWDU\ URFN classification and nomenclature for use in New Zealand. New Zealand Journal of Geology and Geophysics. 1970. 13: 937-968 *DR-**DR6;:DQJ)+HWDO&KDUDFWHULVWLFVRIIRUPDWLRQSUHVVXUH DQGLWVLQÀXHQFHVRQUHVHUYRLUVRIWKHIRXUWKPHPEHURIWKH6KDKHMLH )RUPDWLRQ LQ 6KHQJWXR DUHD RI 'RQJ\LQJ 'HSUHVVLRQ 3HWUROHXP *HRORJ\DQG5HFRYHU\(I¿FLHQF\LQ&KLQHVH *LOHV05DQGGH%RHU5%2ULJLQDQGVLJQL¿FDQFHRIUHGLVWULEXWLRQDO secondary porosity. Marine and Petroleum Geology. 1990. 7: 378-397 Giles M R and Marshall J D. Constraints on the development of secondary porosity in the subsurface: re-evaluation of processes. Marine and Petroleum Geology. 1986. 3: 243-255 He Z X and Nan J X. Atlas of Upper Paleozoic Reservoirs in the Ordos Basin. Beijing: Petroleum Industry Press. 2004. 84 (in Chinese) Higgs K E, Zwingmann H, Reyes A G, et al. Diagenesis, porosity evolution, and petroleum emplacement in tight gas reservoirs, Taranaki basin, New Zealand. Journal of Sedimentary Research. 2007. 77: 1003-1025 Huang K K, Huang S J, Tong H P, et al. Thermodynamic calculation of feldspar dissolution and its significance on research of clastic reservoir. Geological Bulletin of China. 2009a. 28(4): 474-482 (in Chinese) Huang S J, Huang K K, Zhang X H, et al. Chemical thermodynamics foundation of retrograde solubility for carbonate: Solution media related to CO 2. Journal of Chengdu University of Technology (Science & Technology Edition). 2009b. 36(5): 457-464 (in Chinese) Jin Z K, Su K and Su N N. Origin of Jurassic deep burial high-quality reservoirs in the central Junggar Basin. Acta Petrolei Sinica. 2011. 32(1): 25-31 (in Chinese) /LX +-LDQJ=;=KDQJ5)HWDO*UDYHOVLQWKH'D[LQJFRQJORPHUDWH and their effect on reservoirs in the Oligocene Langgu Depression of the Bohai Bay Basin, North China. Marine and Petroleum Geology. 2012. 29: 192-203 Liu W and Zhu X M. Distribution and genesis of secondary pores in Tertiary clastic reservoir in Southwestern Qaidam Basin. Petroleum Exploration and Development. 2006. 33(3): 315-318 (in Chinese) /LX<<<X%6=KX-)HWDO'LDJHQHVLVDQGLWVLQÀXHQFHRQSK\VLFDO properties in Paleogene clastic reservoir in the West Sag of the beach area, Liaohe Depression. Geoscience. 2009. 23(4): 731-738 (in Chinese) Luo J L, Morad S, Zhang X L, et al. Reconstruction of the diagenesis RIWKHÀXYLDOODFXVWULQHGHOWDLFVDQGVWRQHVDQGLWVLQÀXHQFHRQWKH reservoir quality evolution—evidence from Jurassic and Triassic VDQGVWRQHV<DQFKDQJ 2LO )LHOG 2UGRV %DVLQ 6FLHQFH LQ &KLQD Series D: Earth Sciences. 2002. 45(7): 616-634 Marchand A M E, Smalley P C, Haszeldine R S, et al. Note on the importance of hydrocarbon fill for reservoir quality prediction in 361 sandstones. AAPG Bulletin. 2002. 86(9): 1561-1571 Meng Y L, Gao J J, Liu D L, et al. Diagenetic facies analysis and anomalously high porosity zone prediction of the Yuanyanggou area in the Liaohe Depression. Journal of Jilin University (Earth Science Edition). 2006. 36(2): 227-233 (in Chinese) 0HQJ<//LDQJ+:0HQJ)-HWDO'LVWULEXWLRQDQGJHQHVLVRIWKH anomalously high porosity zones in the middle-shallow horizons of the northern Songliao Basin. Petroleum Science. 2010. 7: 302-310 Meshri I D. On the reactivity of carbonic and organic acids and generation of secondary porosity. SEPM Special Publication. 1986. 28: 123-128 Peng J, Liu J K, Wang Y, et al. Origin and controlling factors of chlorite coatings—an example from the reservoir of T3x Group of the Baojie area, Sichuan Basin, China. Petroleum Science. 2009. 6: 376-382 4LDQ+-/X;&=KDQJ;)HWDO6SDWLDOSDOHRVDOLQLW\GLVWULEXWLRQDQG element geochemistry of argillaceous source rocks in the upper part of 4th0HPEHURI7HUWLDU\6KDKHMLH)RUPDWLRQLQ'RQJ\LQJ6DJ$FWD Petrologica et Mineralogica. 2009. 28(2): 161-168 (in Chinese) Song H R and Huang S Y. Crystallized precipitation of carbonate. Carsologica Sinica. 1990. 9(2): 105-118 (in Chinese) Sun X L. Hydrocarbon charging mechanism and reservoir forming models in the deep formations of the north belt, Dongying Depression. Master’s Thesis. China University of Geosciences. 2010 (in Chinese) Surdam R C, Crossey L J, Hagen E S, et al. Organic-inorganic interactions and sandstone diagenesis. AAPG Bulletin. 1989. 73: 1-23 Tang J C. The reconstruction of paleo-fluid potential and the study of oil migration and accumulation characteristics of the third member RI 6KDKHMLH )RUPDWLRQ 'RQJ\LQJ 6DJ 0DVWHU¶V 7KHVLV &KLQD University of Geosciences. 2007 (in Chinese) Taylor T R, Giles M R, Hathon L A, et al. Sandstone diagenesis and reservoir quality prediction: Models, myths, and reality. AAPG Bulletin. 2010. 94(8): 1093-1132 Wang C and Shao H M. A study on secondary pores of medium combination formation to the west of Daqing Placanticline. 3HWUROHXP*HRORJ\2LO¿HOG'HYHORSPHQWLQ'DTLQJ 5-7 (in Chinese) Wang Y Z. Genetic mechanisms and evolution models of the Paleogene secondary pore development zone in the North Zone in Dongying Depression. Ph.D. Thesis. China University of Petroleum (East China). 2010 (in Chinese) Warren E A and Pulham A J. Anomalous porosity and permeability preservation in deeply buried Tertiary and Mesozoic sandstones LQ WKH &XVLDQD ILHOG /ODQRV )RRWKLOOV &RORPELD -RXUQDO RI Sedimentary Research. 2001. 71(1): 2-14 Xiao L H, Meng Y L, Hou C Y, et al. Diagenetic modeling and prediction of secondary pore zone in the deep of the Shengping area in the Songliao Basin. Geological Review. 2003. 49(5): 544-551 (in Chinese) Yu B S, Dong H L and Ruan Z. Mechanism for calcite dissolution and its contribution to development of reservoir porosity and permeability LQWKH.HODJDV¿HOG7DULP%DVLQ&KLQD6FLHQFHLQ&KLQD6HULHV' Earth Sciences. 2008. 51(4): 567-578 <XDQ*+&DR<&;L./HWDO)HOGVSDUGLVVROXWLRQDQGLWVLPSDFW on physical properties of Paleogene clastic reservoirs in the northern slope zone of the Dongying Sag. Acta Petrolei Sinica. 2013a. 34(5): 853-866 (in Chinese) Yuan G H, Cao Y C, Yang T, et al. Porosity enhancement potential through mineral dissolution by organic acids in the diagenetic SURJUHVVRIFODVWLFUHVHUYRLU(DUWK6FLHQFH)URQWLHUVE 207-119 (in Chinese) Yuan J and Wang Q Z. Distribution and generation of deep reservoir secondary pores, Paleogene, Dongying Sag. Journal of Mineralogy 362 and Petrology. 2001. 21(1): 43-47 (in Chinese) Yuan J, Zhang S W, Qiao J, et al. Cause of formation and dynamic mechanisms in multiple medium of dissolved pores in deep formation of Dongying Sag. Acta Sedimentologica Sinica. 2007. 25(6): 840-846 (in Chinese) =HQJ-+(IIHFWRIÀXLGURFNLQWHUDFWLRQRQSRURVLW\RIUHVHUYRLUURFNV in Tertiary system, Dongying Sag. Acta Petrolei Sinica. 2001. 22(4): 39-43 (in Chinese) Zhang Q, Zhong D K, Zhu X M, et al. Pore evolution and genesis of secondary porosity of Paleogene clastic reservoirs in Dongying Sag. Oil & Gas Geology. 2003. 24(3): 281-284 (in Chinese) =KDQJ6:<XDQ-6XL)*HWDO0XOWLSOHGLDJHQHWLFHQYLURQPHQWVDQG evolvement model in deep formation of the 4th Member, Shahejie )RUPDWLRQ LQ WKH QRUWKHUQ 'RQJ\LQJ 6DJ &KLQHVH -RXUQDO RI Geology. 2007. 43(3): 576-587 (in Chinese) =KDQJ6:=KDQJ/<=KDQJ6&HWDO)RUPDWLRQRIDEQRUPDOKLJK pressure and its application in the study of oil-bearing property of lithologic hydrocarbon reservoirs in the Dongying Sag. Chinese Science Bulletin. 2009. 54: 1570-1578 =KDQJ< ):DQJ * 4 )X % / HW DO7KH GLDJHQHVLV DQG WKH RULJLQ of anomalously high porosity zone in the deep clastic reservoir in Changling fault depression. Journal of Jilin University (Earth Science Edition). 2011. 41(2): 372-376 (in Chinese) Zhang Y G, Xue W P, Wang G L, et al. Hydrocarbon Reservoir )RUPDWLRQ$JJUHJDWLRQLQWKH&RQWLQHQWDO5LIW%DVLQ(DVW&KLQD Beijing: Petroleum Industry Press. 2006. 127-131 (in Chinese) Zhong D K, Zhu X M and Wang H J. Characteristics and genetic Pet.Sci.(2014)11:346-362 mechanism of deep-buried clastic reservoirs in China. Science in China Series D: Earth Sciences. 2008. 51(Supp.II): 11-19 (in Chinese) Zhong D K, Zhu X M, Zhang Z H, et al. Origin of secondary porosity of Paleogene sandstone in the Dongying Sag. Petroleum Exploration and Development. 2003. 30(6): 51-53 (in Chinese) Zhou Y Q, Zhou Z Z, Chen Y, et al. Research on diagenetic environmental changes of deep reservoir in Minfeng area, Dongying 6DJ(DUWK6FLHQFH)URQWLHUVLQ&KLQHVH =KX 6)=KX;0:DQJ;/HWDO=HROLWHGLDJHQHVLVDQGLWVFRQWURO on petroleum reservoir quality of Permian in northwestern margin of Junggar Basin, China. Science in China Series D: Earth Sciences. 2012. 5: 389-396 Zhu X M, Mi L J, Zhong D K, et al. Paleogene diagenesis and its control on reservoir quality in Jiyang Depression. Journal of Palaeogeography. 2006. 8(3): 296-305 (in Chinese) Zhu X M, Wang Y G, Zhong D K, et al. Pore types and secondary pore evolution of Paleogene reservoir in the Jiyang Sag. Acta Geologica Sinica. 2007. 81(2): 197-204 (in Chinese) Zhu X M, Zhong D K, Zhang Q, et al. Paleogene Clastic Reservoir Characteristics and Evaluation of the Jiyang Depression. Beijing: Science Press. 2008. 160-168 (in Chinese) Zhu X M, Zhong D K, Zhang Q, et al. Sandstone diagenesis and porosity evolution of Paleogene in Huimin Depression. Petroleum Science. 2004. 1(3): 23-29 (Edited by Hao Jie)


© Copyright 2026