
TCRP Report 55 Guidelines for Enhancing Suburban Mobility Using Public Transportation
T
R A N S I T
C
O O P E R A T I V E
R
E S E A R C H
P
R O G R A M
SPONSORED BY
The Federal Transit Administration
TCRP Report 55
Guidelines for Enhancing Suburban
Mobility Using Public Transportation
Transportation Research Board
National Research Council
TCRP OVERSIGHT AND PROJECT
SELECTION COMMITTEE
TRANSPORTATION RESEARCH BOARD EXECUTIVE COMMITTEE 1999
CHAIR
PAUL J. LARROUSSE
Madison Metro Transit System
OFFICERS
MEMBERS
GORDON AOYAGI
Montgomery County Government
JEAN PAUL BAILLY
Union Internationale des Transports Publics
J. BARRY BARKER
Transit Authority of River City
LEE BARNES
Barwood, Inc.
RONALD L. BARNES
Central Ohio Transit Authority
GERALD L. BLAIR
Indiana County Transit Authority
ANDREW BONDS, JR.
Parsons Transportation Group, Inc.
ROBERT I. BROWNSTEIN
Spear Technologies
SANDRA DRAGGOO
CATA
RONALD L. FREELAND
Maryland MTA
LOUIS J. GAMBACCINI
National Transit Institute
CONSTANCE GARBER
York County Community Action Corp.
SHARON GREENE
Sharon Greene & Associates
KATHARINE HUNTER-ZAWORSKI
Oregon State University
JOYCE H. JOHNSON
North Carolina A&T State University
EVA LERNER-LAM
The Palisades Consulting Group, Inc.
GORDON J. LINTON
FTA
DON S. MONROE
Pierce Transit
PATRICIA S. NETTLESHIP
The Nettleship Group, Inc.
JAMES P. REICHERT
Reichert Management Services
RICHARD J. SIMONETTA
MARTA
PAUL P. SKOUTELAS
Port Authority of Allegheny County
PAUL TOLIVER
King County DOT/Metro
MICHAEL S. TOWNES
Peninsula Transportation Dist. Comm.
LINDA S. WATSON
Corpus Christi RTA
AMY YORK
Amalgamated Transit Union
EX OFFICIO MEMBERS
WILLIAM W. MILLAR
APTA
KENNETH R. WYKLE
FHWA
JOHN C. HORSLEY
AASHTO
ROBERT E. SKINNER, JR.
TRB
TDC EXECUTIVE DIRECTOR
LOUIS F. SANDERS
APTA
SECRETARY
ROBERT J. REILLY
TRB
Chair: Wayne Shackelford, Commissioner, Georgia DOT
Vice Chair: Martin Wachs, Director, Institute of Transportation Studies, University of California
at Berkeley
Executive Director: Robert E. Skinner, Jr., Transportation Research Board
MEMBERS
SHARON D. BANKS, General Manager, AC Transit (Past Chairwoman, 1998)
THOMAS F. BARRY, JR., Secretary of Transportation, Florida DOT
BRIAN J. L. BERRY, Lloyd Viel Berkner Regental Professor, University of Texas at Dallas
SARAH C. CAMPBELL, President, TransManagement, Inc., Washington, DC
ANNE P. CANBY, Secretary of Transportation, Delaware DOT
E. DEAN CARLSON, Secretary, Kansas DOT
JOANNE F. CASEY, President, Intermodal Association of North America, Greenbelt, MD
JOHN W. FISHER, Joseph T. Stuart Professor of Civil Engineering and Director, ATLSS Engineering
Research Center, Lehigh University
GORMAN GILBERT, Director, Institute for Transportation Research and Education, North Carolina State
University
DELON HAMPTON, Chair and CEO, Delon Hampton & Associates, Washington, DC
LESTER A. HOEL, Hamilton Professor, Civil Engineering, University of Virginia
JAMES L. LAMMIE, Director, Parsons Brinckerhoff, Inc., New York, NY
THOMAS F. LARWIN, General Manager, San Diego Metropolitan Transit Development Board
BRADLEY L. MALLORY, Secretary of Transportation, Pennsylvania DOT
JEFFREY J. MCCAIG, President and CEO, Trimac Corporation, Calgary, Alberta, Canada
MARSHALL W. MOORE, Director, North Dakota DOT
JEFFREY R. MORELAND, Senior VP, Burlington Northern Santa Fe Corporation
SID MORRISON, Secretary of Transportation, Washington State DOT
JOHN P. POORMAN, Staff Director, Capital District Transportation Committee
ANDREA RINIKER, Executive Director, Port of Tacoma, Tacoma, WA
JOHN M. SAMUELS, VP—Operations Planning & Budget, Norfolk Southern Corporation, Norfolk, VA
CHARLES H. THOMPSON, Secretary, Wisconsin DOT
JAMES A. WILDING, President and CEO, Metropolitan Washington Airports Authority
DAVID N. WORMLEY, Dean of Engineering, Pennsylvania State University
EX OFFICIO MEMBERS
MIKE ACOTT, President, National Asphalt Pavement Association
JOE N. BALLARD, Chief of Engineers and Commander, U.S. Army Corps of Engineers
KELLEY S. COYNER, Administrator, Research and Special Programs, U.S.DOT
MORTIMER L. DOWNEY, Deputy Secretary, Office of the Secretary, U.S.DOT
DAVID GARDINER, Assistant Administrator, U.S. Environmental Protection Agency
JANE F. GARVEY, Administrator, Federal Aviation Administration, U.S.DOT
EDWARD R. HAMBERGER, President and CEO, Association of American Railroads
CLYDE J. HART, JR., Maritime Administrator, U.S.DOT
JOHN C. HORSLEY, Executive Director, American Association of State Highway and
Transportation Officials
GORDON J. LINTON, Federal Transit Administrator, U.S.DOT
RICARDO MARTINEZ, National Highway Traffic Safety Administrator, U.S.DOT
WILLIAM W. MILLAR, President, American Public Transit Association
JOLENE M. MOLITORIS, Federal Railroad Administrator, U.S.DOT
VALENTIN J. RIVA, President and CEO, American Concrete Pavement Association
ASHISH K. SEN, Director, Bureau of Transportation Statistics, U.S.DOT
GEORGE D. WARRINGTON, President and CEO, National Railroad Passenger Corporation
KENNETH R. WYKLE, Federal Highway Administrator, U.S.DOT
TRANSIT COOPERATIVE RESEARCH PROGRAM
Transportation Research Board Executive Committee Subcommittee for TCRP
WAYNE SHACKELFORD, Georgia DOT (Chair)
SHARON D. BANKS, AC Transit
LESTER A. HOEL, University of Virginia
THOMAS F. LARWIN, San Diego Metropolitan Transit Development Board
GORDON J. LINTON, FTA U.S.DOT
WILLIAM W. MILLAR, American Public Transit Administration
ROBERT E. SKINNER, JR., Transportation Research Board
MARTIN WACHS, Institute of Transportation Studies, University of California at Berkeley
T
R A N S I T
C
O O P E R A T I V E
R
E S E A R C H
P
R O G R A M
Report 55
Guidelines for Enhancing Suburban
Mobility Using Public Transportation
URBITRAN ASSOCIATES, INC.
New York, NY
in association with
MULTISYSTEMS, INC.
Cambridge, MA
SG ASSOCIATES, INC.
Annandale, VA
and
ROBERT CERVERO
Berkeley, CA
Subject Areas
Planning and Administration
Public Transit
Research Sponsored by the Federal Transit Administration in
Cooperation with the Transit Development Corporation
TRANSPORTATION RESEARCH BOARD
NATIONAL RESEARCH COUNCIL
NATIONAL ACADEMY PRESS
Washington, D.C. 1999
TRANSIT COOPERATIVE RESEARCH PROGRAM
TCRP REPORT 55
The nation’s growth and the need to meet mobility,
environmental, and energy objectives place demands on public
transit systems. Current systems, some of which are old and in need
of upgrading, must expand service area, increase service frequency,
and improve efficiency to serve these demands. Research is
necessary to solve operating problems, to adapt appropriate new
technologies from other industries, and to introduce innovations into
the transit industry. The Transit Cooperative Research Program
(TCRP) serves as one of the principal means by which the transit
industry can develop innovative near-term solutions to meet
demands placed on it.
The need for TCRP was originally identified in TRB Special
Report 213—Research for Public Transit: New Directions,
published in 1987 and based on a study sponsored by the Urban
Mass Transportation Administration—now the Federal Transit
Administration (FTA). A report by the American Public Transit
Association (APTA), Transportation 2000, also recognized the need
for local, problem-solving research. TCRP, modeled after the
longstanding and successful National Cooperative Highway
Research Program, undertakes research and other technical activities
in response to the needs of transit service providers. The scope of
TCRP includes a variety of transit research fields including planning, service configuration, equipment, facilities, operations, human
resources, maintenance, policy, and administrative practices.
TCRP was established under FTA sponsorship in July 1992.
Proposed by the U.S. Department of Transportation, TCRP was
authorized as part of the Intermodal Surface Transportation
Efficiency Act of 1991 (ISTEA). On May 13, 1992, a memorandum
agreement outlining TCRP operating procedures was executed by
the three cooperating organizations: FTA, the National Academy of
Sciences, acting through the Transportation Research Board (TRB);
and the Transit Development Corporation, Inc. (TDC), a nonprofit
educational and research organization established by APTA. TDC is
responsible for forming the independent governing board,
designated as the TCRP Oversight and Project Selection (TOPS)
Committee.
Research problem statements for TCRP are solicited periodically
but may be submitted to TRB by anyone at any time. It is the
responsibility of the TOPS Committee to formulate the research
program by identifying the highest priority projects. As part of the
evaluation, the TOPS Committee defines funding levels and
expected products.
Once selected, each project is assigned to an expert panel,
appointed by the Transportation Research Board. The panels prepare
project statements (requests for proposals), select contractors, and
provide technical guidance and counsel throughout the life of the
project. The process for developing research problem statements and
selecting research agencies has been used by TRB in managing
cooperative research programs since 1962. As in other TRB activities, TCRP project panels serve voluntarily without compensation.
Because research cannot have the desired impact if products fail
to reach the intended audience, special emphasis is placed on
disseminating TCRP results to the intended end users of the
research: transit agencies, service providers, and suppliers. TRB
provides a series of research reports, syntheses of transit practice,
and other supporting material developed by TCRP research. APTA
will arrange for workshops, training aids, field visits, and other
activities to ensure that results are implemented by urban and rural
transit industry practitioners.
The TCRP provides a forum where transit agencies can
cooperatively address common operational problems. The TCRP
results support and complement other ongoing transit research and
training programs.
Project B-6 FY’94
ISSN 1073-4872
ISBN 0-309-06612-3
Library of Congress Catalog Card No. 99-71387
© 1999 Transportation Research Board
Price $29.00
NOTICE
The project that is the subject of this report was a part of the Transit Cooperative
Research Program conducted by the Transportation Research Board with the
approval of the Governing Board of the National Research Council. Such
approval reflects the Governing Board’s judgment that the project concerned is
appropriate with respect to both the purposes and resources of the National
Research Council.
The members of the technical advisory panel selected to monitor this project and
to review this report were chosen for recognized scholarly competence and with
due consideration for the balance of disciplines appropriate to the project. The
opinions and conclusions expressed or implied are those of the research agency
that performed the research, and while they have been accepted as appropriate
by the technical panel, they are not necessarily those of the Transportation
Research Board, the National Research Council, the Transit Development
Corporation, or the Federal Transit Administration of the U.S. Department of
Transportation.
Each report is reviewed and accepted for publication by the technical panel
according to procedures established and monitored by the Transportation
Research Board Executive Committee and the Governing Board of the National
Research Council.
Special Notice
The Transportation Research Board, the National Research Council, the Transit
Development Corporation, and the Federal Transit Administration (sponsor of
the Transit Cooperative Research Program) do not endorse products or
manufacturers. Trade or manufacturers’ names appear herein solely because they
are considered essential to the clarity and completeness of the project reporting.
Published reports of the
TRANSIT COOPERATIVE RESEARCH PROGRAM
are available from:
Transportation Research Board
National Research Council
2101 Constitution Avenue, N.W.
Washington, D.C. 20418
and can be ordered through the Internet at
http://www.nas.edu/trb/index.html
Printed in the United States of America
FOREWORD
By Staff
Transportation Research
Board
These guidelines identify, assess, and document the current practices that transit
operators use to enhance their bus networks to better serve suburban travel needs. Taking into consideration the range of environments implied by the term “suburb,” the
guidelines identify six types of suburban environments and the applicability of individual types of transit service to each. The guidelines provide information on modifications and improvements to the overall suburban transit framework, and information
on support and complementary services to public transportation. There is discussion on
transit center-based networks, express bus services, limited-stop routes, local area circulators, shuttle links, subscription buses, and vanpools. Operating techniques such as
route deviation, point deviation, and demand-response services are also discussed.
Included in the guidelines are 11 case studies. Using the information gathered from the
case studies, the guidelines discuss each type of service, covering its description,
applicability, performance range, and conditions of effectiveness. The intended audience includes transit planners, general managers, and project managers; transportation
policy makers; and city and regional planners.
The impact of suburban development on America’s transit industry has been dramatic. Where transit operators once had well-defined downtown cores and could provide radial networks that served them effectively, the environment now contains multiple origin/destination pairs. Some operators have adapted well, offering riders a
“family of services” concept, such as local and express bus routes, crosstown services,
demand-response community-based services, and ridesharing and vanpooling. Other
suburban transit operators have not fared as well. The oldest form of public transit in
suburban areas is radial commuter service supported by various feeder services.
Because of the gradual dispersal of jobs to suburban centers over the last 30 years,
there is a need to better link these radial services to suburban job and residential centers for both traditional commuters and reverse commuters. In order to improve effectiveness and provide greater mobility to their constituencies, transportation providers,
public officials, and planners need to improve the connectivity of suburban transit services. Transit service providers need easy-to-use methodologies for analyzing
changes. Improving connections between transit services would expand destination
choice and reduce travel time, thereby contributing to improved mobility, productivity, and efficiency.
Urbitran Associates, Inc., in association with Multisystems, Inc.; SG Associates, Inc.;
and Dr. Robert Cervero prepared the final report for TCRP Project B-6. To achieve the
project objective of providing guidance to transit operators and regional policy makers
on how to enhance suburban mobility through traditional and nontraditional services,
the researchers conducted a comprehensive review of current practices related to
improving transit connections. A detailed typology was developed to classify suburban
areas. Based on the literature review and the detailed typology, case study sites were
selected that reflect the diversity of suburban types. The guidelines were developed on
the basis of on-site visits and interviews with 11 transit operators from the United States
and Canada, supplemented by reports and data for a select number of additional suburban transit services contacted during the course of the research.
CONTENTS
1
SUMMARY
4
CHAPTER 1 Guidelines for Enhancing Suburban Mobility:
Overview and Summary of Findings
Suburbanization and Mobility, 4
The Guidelines: An Overview, 6
Study Purpose and Objectives, 6
The Case Study Approach, 6
Suburban Transit Services and Operating Environments, 7
Classifying Suburban Public Transportation Services, 9
Summary of Findings: The Keys to Suburban Success, 11
Report Organization, 15
17
CHAPTER 2 Suburban Transit Services: The Planning Context
Planning for Suburban Transit Services, 17
Suburban Transit Services and Operating Environments, 17
Land-Use Strategies, 18
Transit-Supportive Design Guidelines, 19
TOD, 19
Regional Growth Management, 22
Marketing Suburban Transit Services, 23
26
CHAPTER 3 Actions to Modify and Improve the Overall Suburban
Transit Framework
Establishing a Transit Centers Concept and Timed-Transfer Program, 26
Description, 26
Applicability, 26
Performance Range, 27
Conditions of Effectiveness, 29
Enhancing Line-Haul Services, 30
Express Routes, 31
Limited Routes, 36
38
CHAPTER 4 Circulators and Shuttles
Local Area Circulators, 38
Fixed-Route Suburban Circulator Services, 38
Route Deviation Suburban Circulator Services, 44
Demand Response Suburban Circulator Services, 48
Shuttle Services, 53
Rail Station to Employment Center Shuttles, 53
Residence to Regional Bus or Rail Shuttles, 59
Midday Employee Shuttles, 63
65
CHAPTER 5 Subscription Buses and Vanpools
Subscription Buses, 65
Vanpools, 66
68
CHAPTER 6 Summary: Lessons and Conclusions
What Has Worked?, 68
Operating Environment, 68
Markets, 68
Cost Control, 68
Vehicle Types, 69
Linked Services, 69
Service Innovations, 69
Public-Private Cosponsorship, 70
What Hasn’t Worked?, 70
Where to Go from Here: Future Directions, 70
72
BIBLIOGRAPHY
76
APPENDIX A
Classifying Suburban Environments
COOPERATIVE RESEARCH PROGRAMS STAFF
ROBERT J. REILLY, Director, Cooperative Research Programs
STEPHEN J. ANDRLE, Manager, Transit Cooperative Research Program
GWEN CHISHOLM, Senior Program Officer
EILEEN P. DELANEY, Managing Editor
HILARY FREER, Associate Editor
PROJECT PANEL B-6
BRENDA CLAYBROOK, Dallas Area Rapid Transit, Dallas, TX (Chair)
SHELDON CRUM, Carter Goble Associates, Columbia, SC
RONALD DOWNING, Washington Metropolitan Area Transit Authority
LINDA K. HOWE, University of California at Berkeley
PATRISHA PIRAS, San Lorenzo, CA
PHYLLIS E. PODGORSKI, Metra, Chicago, IL
KENNETH O. STANLEY, Honolulu, HI
JOSEPH GOODMAN, FTA Liaison Representative
PETER SHAW, TRB Liaison Representative
AUTHOR ACKNOWLEDGMENTS
The research reported herein was performed under TCRP Project
B-6 by Urbitran Associates, in association with Multisystems, SG
Associates, and Dr. Robert Cervero. Urbitran was the prime contractor for this project.
David J. Sampson, Vice President, Urbitran Associates, was the
principal investigator and major author of the report. Contributors
from Multisystems included Dan Fleishman, Principal; Susan Bregnan, Associate; and Rick Halvorsen, Associate. SG Associates staff
were Frank Speilberg, President, and Randall Farwell, Associate.
Dr. Robert Cervero of the University of California at Berkeley was
a major contributor to the work effort and authored several sections
of the final report. Design and layout of the report were created by
Ron Vogel, Senior Art Director, Urbitran Associates.
Finally, the project team would like to thank the staff of each of
the transit agencies, metropolitan planning organizations, and local
governments who contributed their time and insights for the case
studies used in this report.
1
GUIDELINES FOR ENHANCING
SUBURBAN MOBILITY USING PUBLIC
TRANSPORTATION
SUMMARY
Improving suburban mobility is a difficult national challenge, which is particularly
acute for transit. Suburban development has had several major implications on the
provision of transit services:
• Suburban regions are larger than traditional cities and have significantly lower den-
sities. This means greater travel distances for most trips, fewer origins and destinations within walking distance of any single route, and more vehicle miles traveled to
serve activities than in urban settings.
• The greater setback of buildings from roadways means that more deviations off
the primary route may be required.
• Unless there are a diversity of uses in a suburban area, demand will be heavily
peaked, with peaks at different times of day depending on trip purpose. Thus, to
maintain reasonable levels of service effectiveness, services may have to be
adaptable to different route patterns and configurations.
• In suburban settings, there are frequently several agencies involved in provision
of transit services, and coordination of services and policies becomes a key issue
in improving mobility.
The differences cited above with regard to travel patterns, land-use arrangements,
and institutions suggest that not only service but also evaluation criteria need to be tailored to the suburban setting.
To provide a level of consumer appeal competitive with the private automobile, planning for mobility in suburban areas must embrace the family or services concept.
Options must be created that are responsive to narrow market segments and special
conditions of effectiveness. The challenge is significant.
STUDY OBJECTIVES
Suburban bus service planning needs to reflect the specific needs, patterns, and concerns of each local area. The purpose of the Guidelines is to provide those planning and
2
operating transit in the suburbs with information about the types of services being introduced, the relative effectiveness of the services, and their applicability to specific urban
settings. The Guidelines identify, assess, systematize, and document the current practices that transit operators use to enhance their existing bus networks to better serve
suburban travel needs.
The Guidelines are based on case studies developed from on-site visits and interviews of 11 transit operators from the United States and Canada, supplemented by pertinent reports and data for a select number of additional suburban transit services from
other operators contacted during the course of the research.
SUBURBAN OPERATING ENVIRONMENTS
One of the first tasks was to identify the range of suburban environments and to
identify to the extent possible how they influence travel patterns and the suitability of
individual transit applications. Six types of suburban land-use environments were
identified:
•
•
•
•
•
•
Residential suburbs,
Balanced, mixed-use suburbs,
Suburban campuses,
Edge cities,
Suburban corridors, and
Exurban corporate enclaves.
Each environment represents a distinct operating setting that poses unique challenges to America’s public transit industry.
CLASSIFICATION OF SUBURBAN PUBLIC TRANSIT SERVICES
How does transit serve these environments? Based on a review of the 11 case studies and supporting materials from other operators, a classification scheme was developed for describing the range of transit applications identified. The classification scheme
is as follows:
Actions to Modify and Improve the Overall Suburban Transit Framework
• Establishing a transit centers concept and timed-transfer program; and
• Enhancing line-haul services, express buses, and limited services.
Actions That Create Supporting/Complementary Services
•
•
•
•
Internal, local area circulators;
Shuttle links;
Subscription buses; and
Vanpools.
SUMMARY OF FINDINGS: KEYS TO SUBURBAN SUCCESS
The Guidelines provide useful policy insights regarding how future transit services
might be designed to better serve suburban markets. Following are 12 key findings the
3
researchers believe to be some of the common features of successful transit strategies
introduced for serving suburban transit markets:
1. Develop services around focal points.
2. Operate along moderately dense suburban corridors. Connect land-use mixes
that consist of all-day trip generators.
3. Serve transit’s more traditional markets such as lower income, blue-collar
neighborhoods.
4. Link suburban transit services, especially local circulators and shuttles, to the
broader regional line-haul network.
5. Target markets appropriately.
6. Economize on expenses.
7. Adapt vehicle fleets to customer demand.
8. Creatively adapt transit service practices to the landscape.
9. Obtain private sector support.
10. Plan with the community.
11. Establish realistic goals, objectives, and standards.
12. Develop supportive policies, plans, and regulations.
4
CHAPTER 1
GUIDELINES FOR ENHANCING SUBURBAN MOBILITY:
OVERVIEW AND SUMMARY OF FINDINGS
Improving suburban mobility is a difficult national challenge. For transit, the problem is particularly acute. Networks
historically have been designed to serve downtowns and concentrated urban centers. Many are ill-suited for serving the
lower density and dispersed travel patterns characteristic of
suburban patterns of development.
Suburban traffic congestion has grown tremendously
over the past two decades, and it has become the increasing
focus of the transportation profession. Mobility planning
in the 1990s has shifted from emphasizing the automobile
to enhancing transit services and transportation demand
management (TDM). With passage of the Intermodal Surface Transportation Efficiency Act (ISTEA), and its emphasis on intermodalism, and the Clean Air Act Amendments
of 1990, the need for expanding public transportation options
and increased cooperation between the public and private
sectors has been heightened.
The impact of suburban development on America’s transit
industry has been dramatic. Where operators once had welldefined downtown cores and could provide radial networks
that served them effectively, the environment now contains
multiple centers, lower overall densities, and multiple origin/
destination pairs. Some operators have adapted well, offering
riders a “family of services” concept, such as local and express
bus routes, crosstown services, demand response communitybased services, and ridesharing and vanpooling. Transit operators have reached out to work with transportation management associations, local governments, and private employers
in efforts to expand mobility choices and also to act as partners
in meeting the needs of the community, including addressing
the Clean Air Act requirements.
SUBURBANIZATION AND MOBILITY
During the 1980s, America’s suburbs experienced a third
wave of growth. The first wave of suburban development,
which began earlier in the century, consisted largely of
middle- and upper-income households leaving the urban
core in search of more spacious living conditions. This was
followed by a second wave, with retail businesses migrating outward closer to their customer base and locating along
commercial strips, in regional shopping malls, and every-
where in between. Decentralization of jobs marked the third
wave of growth.
As a result of these trends, many of today’s suburbs feature the same activities found in traditional cities, though
often spread over a much larger area. More Americans now
are living, shopping, and working in lower density settings
that are less and less conducive to transit riding.
Average residential and employment densities today are not
only much lower than a decade or more ago, but trip origins
and destinations are also far more spread out. Nationwide, the
share of work trips both beginning and ending in the suburbs,
for instance, increased from 38 percent in 1970 to 52 percent
in 1990. Traditional commuting paths are being replaced by a
patchwork of radial, crosstown, lateral, and reverse-direction
travel. Increasingly, there is a mismatch between the geometry of traditional highway, bus, and rail networks, which
mostly follow a hub-and-spoke pattern, and the geography of
commuting, which seemingly moves in all directions. This
has led to more circuitous trip making and increased suburban
congestion.
Suburban development patterns have several implications
on how transit services are provided:
• Unless there are a diversity of uses in an area, demand
will be heavily peaked, and these peaks will be at different times of day. In a traditional central city, the mix
of employment, retail, and service activity means that
demand exists along a route throughout the day. In a
suburban setting, an office park will have high employment-related peaks, whereas a shopping center will
have midday and evening peaks. To maintain reasonable levels of service effectiveness, vehicles may need
to operate quite different routes and service patterns at
different times.
• Suburban regions encompass far more land area than
traditional cities. For example, Washington, D.C., covers about 75 mi2 (194.25 km2), whereas suburban Fairfax County, Virginia, with a slightly larger population,
is almost 400 mi2 (1,036 km2). Suburban densities are
lower than those of traditional urban centers.
• The lower average densities of suburban areas means not
only that fewer origins or destinations are within walking
distance of any transit route but also that the distances
5
traveled between points, on average, are longer. In addition, the lack of an interconnected street system results in
less direct routings and more vehicle miles traveled to
serve activities than in urban settings (Figure 1).
• The greater setbacks of buildings from roadways means
that more deviation off the primary route may be required
(Figure 2).
In suburban settings, several agencies frequently are involved in providing transit services (e.g., the regional bus
service, one or more local suburban area bus services, and, in
some places, a rail operator). The service policies and fare
structures of these multiple operators may or may not be
coordinated. The degree of coordination often depends on
the funding policies of the specific state or locality.
Differences in trip patterns and in spatial and institutional
arrangements between the suburb and the traditional city suggest not only that transit services be tailored to the new conditions but also that the criteria used to plan and evaluate services be different.
Encouraging and facilitating transit use in suburban settings requires recognizing that the automobile dominates
travel and that the attributes that contribute to its dominance
must be considered when new services are being designed.
These attributes should be considered in developing “conditions of effectiveness” for planning new services (e.g., the criteria that new services will need to consider in the planning
process to ensure effectiveness). Consumer appeal is central
to the ultimate success of these programs and thus must be
central to the planning effort. The following attributes of consumer appeal need to be taken into account when considering
mobility options to the automobile:
• Directness and comparative travel time;
• Comfort and service quality;
• Scheduling for convenience (e.g., flexibility, minimized
transferring, connectivity);
• Pricing, including overall cost and simplification of
payments; and
• Market coverage.
Figure 1. A moderate density suburb in Portland,
Oregon, showing how the roadway network inhibits fixedroute transit service.
Figure 2. A corporate office campus in Dallas, Texas, set
back from the street, is a typical example of suburban
employment centers nationwide.
Transit planning must account for these and other factors
and must respond with appropriate services and policies. For
example, to be competitive with the private automobile, rail
shuttles must be designed to (1) minimize travel time by ensuring well-timed connections; (2) provide these connections as
effortlessly as possible with short walk distances, tight scheduling, and appropriate frequencies; (3) consider mechanisms
for single pricing of the entire trip; and (4) provide a direct,
comfortable link between the station and destination. Even
with adherence to these quality-of-service criteria, planners
and operators need to recognize that only a portion of the market will be served by any particular service option and that
other types of action will likely be needed to meet the needs of
other market segments.
Planning for mobility in suburban areas must embrace the
family of services concept and segment markets in order to be
successful. Options must be carefully delineated to reflect
what is, in many cases, a narrow range of conditions of effectiveness. Operators and planners used to counting center-city
oriented ridership in the hundreds and thousands per day need
to be attuned to the special nature of many suburban services.
Depending on local goals and objectives, options attracting as
few as 30 to 50 trips per day, if tailored to meet very specific
demands, may be considered successful; such is the case with
many rail shuttle connections, community-based demand
response feeders, and single run subscription buses to single
employers/employment parks.
The challenges of making transit work in the suburbs are
immense. Transit today finds itself competing with the
automobile in suburban environments with extremely low
densities, dispersed trip patterns, abundant free parking,
and inhospitable walking environs. And, based on national
statistics, transit is clearly losing the competition; its market share of commute trips has fallen from 6.4 percent in
1980 to 5.3 percent in 1990.
Clearly, short of massive new investments in transit, coupled with a fundamental policy shift toward the creation of
6
transit-oriented suburban development, transit will never
achieve the level of usage found in most central cities.
Nevertheless, effective planning and promotion of a range
of market-oriented services should help to capture a greater
share of the suburban travel market and thereby help communities address their mobility and environmental concerns.
This document is designed to provide assistance in this
planning effort.
tices to identify the types of enhancement strategies that have
been used in different suburban transit markets to integrate
transit into overall mobility strategies.
These Guidelines are directed to agencies, operators, and
public officials in suburban areas who are involved in both
short- and long-range mobility planning. The Guidelines are
intended to be instructive in helping to upgrade and improve
existing services and to restructure services to address the
needs of the suburban traveler.
THE GUIDELINES: AN OVERVIEW
Study Purpose and Objectives
The Case Study Approach
The task of creating effective public transportation in the
suburbs presents significant challenges. Transit in the suburban market, a market characterized by generally lower
densities and more diverse travel patterns than the traditional urban transit market, has evolved gradually over the
past two decades. The range of travel movements is broad
but generally is characterized by three distinct patterns:
trips from the suburbs to the urban core, reverse commute
trips from the urban core to the suburbs, and suburb-tosuburb movements. Transit operators and planners are constantly working to adapt fixed-route services that work in
urban settings to the suburbs, testing new and more flexible
concepts taken from experiences with paratransit services,
and broadening horizons to embrace vanpooling and other
transportation demand management (TDM) techniques previously considered outside the realm of traditional transit
operations.
Suburban bus service planning needs to reflect the specific
needs, patterns, and concerns of each local area. Those planning and operating transit in the suburbs, therefore, need to
have at their disposal a clear understanding of the local setting and types of service options available. As transit services
are being upgraded or expanded nationally in the suburbs in
response to local issues and objectives, better information
needs to be made available to local planners and operators
about the types of services being introduced, the relative
effectiveness of the services, and their applicability to specific
suburban settings.
The Guidelines focus on suburb-to-suburb and intrasuburban travel. The dissemination of information and a better
understanding of transit service options for these trips will help
local operators and service planners to make more informed
choices for local services.
The purpose of these Guidelines is to identify, assess, systematize, and document the current practices that transit operators use to enhance their existing bus networks to better serve
suburban travel needs. The suburban service strategies featured in these Guidelines concentrate on service modifications
and innovations designed to create more effective networks.
The presence of a suburban bus network is presumed.
Through survey research and case studies, the Guidelines
bring together information on the range of contemporary prac-
The Guidelines are based on case studies developed from
on-site visits and interviews during 1995 of 11 transit operators from the United States and Canada, supplemented by pertinent reports and data for a select number of additional suburban transit services from other operators contacted during
the course of the research (Figure 3). Principal among these
additional operators were New Jersey Transit (NJ Transit);
Norwalk Transit District (NTD), Norwalk, Connecticut; Long
Island Bus (LIBus), New York; Suffolk County Transit, New
York; and Westchester County, New York.
The case study locations were selected by the research
team, project panel, and TCRP staff based on information
collected from a broader mail-out and telephone interview
process during the first phase of the research. After a mailing to 140 transit agencies in the United States and Canada,
interviews were conducted with the approximately 50
transit operators who contacted the team and agreed to
participate.
The Guidelines used to select the case studies included
consideration of the following:
• Selection of a group that would cover the full spectrum
of suburban delivery methods;
• Distribution of agencies to include both small/medium,
and large systems;
• Selection of operators both with and without rail systems;
• Broad geographic representation;
• Opportunities at each site to investigate multiple sub-
urban actions;
• Selection from among those who responded affirma-
tively to the initial interview and indicated an interest in
further participation.
One other criterion was used in the selection process:
Cases already covered in TCRP Synthesis No. 14, “Innovative Suburb-to-Suburb Transit Practices,” were not to be
included as case studies. The agencies included PACE Suburban Bus Division of RTA (PACE), Grand Rapids Area
Transit Authority (GRATA), Ottawa-Carleton Regional
Transit Commission (OC Transpo), and New Jersey Transit
(NJ Transit).
7
Figure 3. Location of study sites investigated for this research project.
Case study visits varied from 1 to 3 days on-site. During the
visit, topics covered planning and project initiation, operating
and financial performance, public policy, private sector participation, land-use and demographic profiles, and other pertinent information and issues. The intent of each case study
was to develop materials to document performance and to
study it in context to identify factors either contributing to
good performance or creating conditions for failure (Table 1).
The case study data formed the basis for the development
of these Guidelines, including observations on performance,
conditions of effectiveness, and other planning-related issues.
Even though a detailed protocol was developed for the case
studies and 1 to 3 days was spent at each location, what is
clearly evident from the research is the lack of uniformity in
the data collected and reported from site to site, the inability
of some operators to track individual suburban services separately from their larger program, and the unavailability of
a consistent database about the market. To the degree that
supportive data are available, evidence suggesting the influences of these service strategies on operating performance is
reviewed.
However, it should be cautioned, attributing performance
improvements or declines to service changes is fraught with
difficulties. This is partly because few of the 11 case site systems had consciously sought to conduct before and after
evaluations of service changes. Thus, no control sites were
established by transit agencies within the 11 case study areas,
nor were before and after performance data systematically
compiled beyond basic operating and financial performance
data. Nevertheless, although the Guidelines established in this
research can only draw inferences from the associations between changes in suburban transit services and operating performance, and the influence of particular suburban settings,
doing so has allowed the researchers to identify and categorize
all types of services, to develop expected performance ranges,
and to identify factors that contribute to success or failure.
Suburban Transit Services
and Operating Environments
The term suburb is a generic identification applied to the
developed areas surrounding traditional urban centers, and
it implies a homogeneous type of settlement uniformly
characterized by single-family houses and condominiums,
strip development and malls, and campus business settings.
The term does not suitably reflect the true heterogeneity of
these areas, evolving patterns of development, and changing
demographics.
One of the first tasks in this research was to identify the
range of suburban environments and to identify as far as possible how they influence travel patterns and the suitability of
individual transit applications. Research led to identification
of six types of suburban land-use environments across the
United States:
8
TABLE 1 General Characteristics—Case Study Systems (U.S. Systems)
•
•
•
•
•
•
Residential suburbs,
Balanced mixed-use suburbs,
Suburban campuses,
Edge cities,
Suburban corridors, and
Exurban corporate enclaves.
Each of these environments represents a distinct operating
setting that poses unique challenges to America’s public transit industry. It was hoped that relating these environments to
the case studies and services being offered in the suburbs
would lead to conclusions about the challenges and opportunities associated with serving each of these operating environments. Appendix A provides a detailed discussion of the six
operating environments and the methods used for classifying
America’s suburbs, which are summarized here.
Residential suburbs, which occupy much of suburbia’s
land mass, range from large-lot, single-family tract subdivisions to more compact settings with a mixture of housing
stock (Figure 4).
Balanced suburbs typically feature a mixture of housing,
employment, and commercial land uses (Figure 5).
Suburban campuses, which proliferated during the 1980s,
mainly comprise office parks, industrial estates, and lowdensity business centers. Most are master-planned projects
configured like university campuses. All the case study sites
had some degree of suburban campus development (Figure 6).
Edge cities, the massive suburban downtowns that blossomed throughout metropolitan America in the 1980s, feature
many of the same land-use mixes and sometimes match the
employment densities of traditional downtowns (Figure 7).
According to one study, there were 181 edge cities in late
1994. Commute modal splits by transit among edge city
employees have been as high as 30 to 35 percent in metropolitan Washington, D.C. (Crystal City, Rosslyn, and Ballston, Virginia; Silver Spring, Maryland) and as low as 0.2 percent in the Troy/Big Beaver Road Area outside of Detroit,
Michigan, and the Boca Raton/I-95 area in south Florida. As
they mature, America’s edge cities are increasingly being
vacated by large corporations, with smaller companies taking
9
Figure 4. Residential suburbs—newly developed singlefamily homes in Riverside County, California.
Figure 6. Suburban office campuses—a suburban campus
outside Dallas shows the difficulties that buses encounter in
trying to obtain access.
their places. Edge Cities in the San Francisco area are shown
in (Figure 8).
Suburban corridors differ from many of the other operating settings in that they are linearly configured, often
made up of an assemblage of land uses aligned along an
axial thoroughfare or freeway (Figure 9).
Exurban corporate enclaves, the last class of operating
environment, is largely a 1990s phenomenon. Research has
documented the leapfrogging of new commercial developments into favored corridors and exurban frontiers in many
growing parts of the country. Examples abound: Bishop Ranch
is a major exurban enclave located in suburban Contra Costa
County, California (Figure 10). Chrysler moved its corporate
headquarters to Auburn Hills 25 mi (40.23 km) north of downtown Detroit; Sears moved its merchandising division to Hoffman Estates, 37 mi (59.5 km) from downtown Chicago and
12 mi (19.31 km) farther out than Schaumburg, where much
of the region’s office space located during the 1980s; and J.C.
Penny opened its new 2 million ft2 (185,806 m2) corporate
headquarters in Plano, 35 mi (56.33 km) north of downtown
Dallas.
Figure 5. Pleasant Hill, within the CCCTA service area,
contains a mix of housing, office, and commercial uses,
which are beginning to form a transit village.
Figure 7. Walnut Creek, California, an edge city in the
suburban San Francisco area, located in Contra Costa
County.
Classifying Suburban Public
Transportation Services
How does transit serve these environments? Based on a
review of the 11 case studies and supporting materials from
other operators regarding suburban public transportation
delivery methods, a classification scheme was developed for
describing the range of applications identified. The classification system for suburban service strategies used for these
Guidelines concentrates on service modifications and innovations designed to create more effective networks. After
having reviewed the experiences from the case studies and
supplementary programs noted earlier, a classification scheme
has been developed that defines two major categories of actions
used to improve existing suburban networks.
10
Figure 8. Edge cities in the San Francisco area. Source: Garreau,
Edge Cities.
Actions to Modify and Improve the Overall
Suburban Transit Framework
All the suburban areas studied in this project already have
bus service provided in at least a portion of their local service
areas. In some cases, the services are outward extensions of
traditional urban core services; in other cases, the services are
provided by an entirely new entity created solely to address
suburban transit issues. What is important is to realize that the
framework for the local bus network in most suburban areas
has been in place for some time.
Suburban operators have sought ways to improve the overall design of their programs to foster better linkages and to
create better alternatives to the single-occupant vehicle.
These actions represent the first step in mobility strategies of
most suburban operators and are generally taken at a system
level. They include the following:
• Establishing a transit centers concept and timed-transfer
program and
• Enhancing line-haul services, express buses, and limited
services.
Actions That Create Supporting/
Complementary Services
The actions described above are those taken by an operator
to ensure that the core program/network is operating effectively. The second set of actions represents those that create
supporting or complementary actions. This group includes
11
Figure 10. Bishop Ranch, a 585-acre exurban enclave
located in Contra Costa County, California.
Figure 9. A mixed-use suburban corridor along a major
arterial in the Tidewater Transit District, Virginia.
those activities undertaken by transit operators to enhance and
complete their network. These actions represent enhancements
to the network—actions taken to meet localized needs, niche
markets, low-density markets where fixed route services cannot be effective, and emerging markets outside the current
fixed-route network. They can be operated as fixed routes,
route deviation services, or demand response services in
response to local issues and concerns. For the most part, these
complementary actions are linked to the core network to
create a coordinated program of services in the community.
Featured among these actions are the following:
•
•
•
•
Internal, local area circulators,
Shuttle links,
Subscription buses, and
Vanpools.
Table 2 classifies, by transit system, each of the operating
programs investigated for this research by the categories
defined above.
SUMMARY OF FINDINGS: THE KEYS
TO SUBURBAN SUCCESS
The Guidelines provide useful policy insights about how
future transit services might be designed to better serve suburban markets. Clearly, conclusions based on the findings
from about a dozen transit agencies risk oversimplifying
matters, particularly given that transit’s response to suburban growth is still largely embryonic and not documented
in a systematic manner. However, some patterns were uncovered that provide useful guidance to those planning new
services, whether they be core services forming the basic
network of services provided or niche services aimed at meeting special/localized needs among smaller segments of the
population.
This section outlines the key findings, what the researchers
believe to be some of the common features of successful transit strategies introduced for serving suburban markets.
1. Develop Services Around Focal Points
A distinguishing feature of the more successful suburban transit service strategies has been the servicing
of hubs—that is, points that represent either concentrations of people or transit vehicles. A people hub is
a large suburban employment center, like Bishop
Ranch in Contra Costa County or the Texas Medical
Center in Houston. A transit hub is a designated
transit-transfer point, such as successfully defined and
employed by Tidewater Regional Transit or park-andride terminuses operated by Houston METRO. Quite
consistently, successful suburban transit services
have focused on points where the concentration of
activities generates relatively high ridership counts,
allows for efficient routing, and eases the transfer
process.
2. Operate Along Moderately Dense Suburban Corridors: Connect Land-Use Mixes That Consist of AllDay Trip Generators
Suburbs present a rich mix of densities and land-use
types, with transit services provided across a landscape
featuring suburban downtowns and highly developed
corridors as well as many low-density residential enclaves and developing, nearly rural fringe areas. The
range of performance among routes serving these areas
is equally large. The research findings support the longheld belief that compact, mixed-use development is a
key determinant for introducing and sustaining healthy
fixed-route transit services and therefore underscore
the need to more carefully integrate land-use planning
and transit service planning in coming years as a means
of strengthening transit’s presence in suburbia.
3. Serve Transit’s More Traditional Markets Such
As Lower Income, Blue-Collar Neighborhoods
As the suburbs have matured, they have become
increasingly diverse with respect to age, income, and
employment classifications. Although the patterns of
travel are more diverse and densities are lower in the
suburbs, the profile and travel needs of the residents
there largely mirror those of urban residents. As such,
most transit services in the suburbs, and especially the
12
core services largely consisting of traditional fixedroute services, work best within the context of the
traditional transit markets.
4. Link Suburban Transit Services, Especially Local
Circulators and Shuttles, to the Broader Regional
Line-Haul Network
The most successful suburban services are those
linked to transit centers and regional line-haul services.
Routes serving regional rail stations are particularly
successful, providing the link for central business district-oriented travel. Successful dial-a-ride and routedeviation services, which often are used to supplement
the core network, work best when they operate within
a limited territory and efficiently tie to mainline bus
routes and rail lines. Operating strategies that combine
these two elements can result in an effective network of
flexibly routed services in low-density areas that are
tied to lower-cost/higher-capacity fixed-route services
in built-up areas.
5. Target Markets Appropriately
There are many examples of suburban transit that successfully serves “choice” customers, most notably
express shuttles and park-and-ride bus runs to largescale employment centers, but these services are
oriented to niche markets and have a greater chance
for failure. Services targeted to choice riders succeed
TABLE 2 Classification of Programs by Service Type and System
13
only if they are appropriately supported and if they
have an appropriate role to serve. Since choice riders
would prefer to use their cars, highway congestion
and high parking fees continue to be the most significant factors influencing transit choice. Without these
factors, niche services have great difficulty in achieving success. Besides such environmental factors,
which make the service competitive with the automobile, these services must have active private sector
involvement as well as pubic financial support.
6. Economize on Expenses
Given that suburban services invariably have lower
productivities than their urban counterparts, opera-
tors recognize the need to keep the costs of these services down so that their overall cost per trip, generally the key measure of effectiveness, is reasonable
and competitive with other services they offer. The
most common strategy for cost containment is competitive contracting of services to private operators
with significantly lower cost structures. Several transit agencies have worked in partnership with their
operator unions to establish differential wage scales
for nontraditional services, which provides a win-win
situation for both. In other cases, services sponsored
by the transit operator have been contracted to local
communities, who then provide the service through
(continued on next page)
14
TABLE 2 (Continued )
municipal departments at a lower cost. Finally, subscription vanpools have also been turned to as a costsavings strategy, replacing more costly express bus and
park-and-ride bus services in low-density suburban
corridors.
7. Adapt Vehicle Fleets to Customer Demand
In addition to using standard transit coaches on regular fixed routes, suburban operators need to diversify
their fleets just as they need to diversify their services.
Large, comfortable, over-the-road coaches have been
essential in attracting choice riders on longer-haul
express routes (Figure 11) whereas vans and minibuses
have been the vehicle of choice for flexible services
penetrating suburban residential communities, serving
suburban downtowns, and providing shuttle services
to regional rail systems.
8. Creatively Adapt Transit Service Practices to the
Landscape
Suburban transit services must be flexible to adapt
to the divergent markets they serve. Operators need
to use the full range of operating actions available to
them, think creatively when seeking solutions, and
link these solutions together into a cohesive transit
network. Although middle- and high-density corridors and downtowns may be practical for traditional
fixed-route services—possibly augmented by express
services—where densities are very low, route deviation and door-to-door services are recognized as the
only practical ways to provide the level of service and
convenience that can compete with the automobile.
Using all tools available, and acting as a “mobility
manager” and not as a bus operator, is a hallmark of
the most successful programs.
Figure 11. An over-the-road coach used to provide the
Route 110 Clipper service in Suffolk County, New York.
15
9. Obtain Private Sector Support
Because of the inherent risks involve in providing suburban transit services, the greatest inroads in establishing new and successful services have been made when
the public and private sectors have worked closely
together. The private sector can support new service
initiatives in many ways: direct financial support; participation in employee subsidy programs; marketing
and outreach; and a comprehensive TDM program
offering flex-time, guaranteed-ride home, and other
complementary actions. This support is a key component for successful introduction of niche services to the
choice rider for work trip services.
10. Plan with the Community
The best services are those that are initiated by transit
operators working closely with the local community
(i.e., customers, local planners and policy makers, and
the private sector). Services initiated in this manner
achieve broad-based support, are more responsive to
real rather than perceived mobility needs, and in general are more responsive to the local issues, problems,
and needs they are intended to satisfy.
11. Establish Realistic Goals, Objectives, and Standards
Suburban transit ridership and productivity levels,
even among core routes in a network (as opposed to
niche market services) typically are significantly lower
than for their urban counterparts. Expectations need
to be realistic, and appropriate standards for success
need to be set before services are initiated.
12. Develop Supportive Policies, Plans, and Regulations
Land-use policies that foster transit-friendly environments and transit-supportive densities (e.g., concentrated development around suburban hubs) will
contribute to the success of public transportation in
the suburbs (Figure 12). Parking fees, mandatory
automobile-occupancy standards, and other regulatory efforts will also contribute to the immediate
success of many projects, but such actions need to be
integrated into a well-developed and coordinated
land-use, transportation, and growth strategy in order
to provide for longer-term success for transit as a key
component. Integrated fare structures to create seamless travel also need to be encouraged, along with
TDM strategies to complement transit and provide
flexibility and choice for consumers.
REPORT ORGANIZATION
Chapter 1 has provided the background for this research,
including a discussion of suburban mobility issues, the objec-
16
Chapter 2 places suburban transit development within the
suburban planning context and identifies the relationships
found in the case studies between suburban transit services
and the operating environment. Specific strategies covered
in some depth include transit-supportive guidelines, transitoriented development, and regional growth management.
The next three chapters describe the suburban mobility
strategies in detail, with information on specific services,
performance levels, and applicability:
• Chapter 3 describes actions that modify and improve the
Figure 12. The cover of Planning and Design for Transit,
guidelines for integrated land use and transportation
development in Portland, Oregon.
overall suburban transit framework, including transit
centers and timed transfers, express buses, and limited
services.
• Chapter 4 describes experiences with circulators and
shuttles.
• Chapter 5 describes subscription bus and vanpool programs.
tives of the project, and the case study approach. Furthermore,
it has defined the classification scheme adopted for suburban
transit strategies and presented a summary of the key findings
taken from the research.
Finally, Chapter 6 provides a synthesis of the findings,
identifying what are believed to be some of the common features of successful as well as unsuccessful strategies introduced for serving suburban markets and future directions for
continued research into this subject.
17
CHAPTER 2
SUBURBAN TRANSIT SERVICES: THE PLANNING CONTEXT
PLANNING FOR SUBURBAN
TRANSIT SERVICES
The case studies reveal that the planning process used for
designing suburban transit services is largely indistinguishable from traditional transit service planning. Most service
planning takes place within the context of route-by-route performance evaluations carried out annually or semiannually as
part of 5-year strategic plan updates. Routes are normally
held against a performance standard, such as a minimum
average number of revenue passengers per service hour. Poor
performers are normally considered for either major service
revisions or elimination.
New suburban services are normally instigated as part of a
formal suburban service planning process. Once service options
are proposed, designed, and evaluated, they are usually subjected to comprehensive review among stakeholders, including
local transportation agencies and citizen interest groups. Other
institutional forums were also introduced among the case study
sites; some involved coordination among both public agencies
and private organizations. An example is the Transpac (Transportation Partnerships and Cooperation) formed in Contra
Costa County, a corporation that makes subregional transportation planning recommendations and promotes developing
alternatives to private automobile travel.
Some transit agencies have carried out original research in
designing suburban services. DART, for example, reviewed
experiences with transit services in smaller communities
across the United States to develop minimum population and
employment density thresholds necessary to sustain various
types of supply options.
SUBURBAN TRANSIT SERVICES
AND OPERATING ENVIRONMENTS
In carrying out this research, the researchers identified
six types of suburban land-use environments across the
United States:
•
•
•
•
•
•
Residential suburbs,
Balanced mixed-use suburbs,
Suburban campuses,
Edge cities,
Suburban corridors, and
Exurban corporate enclaves.
Each represents a distinct operating setting that poses unique
challenges to America’s public transit industry. Appendix A
discusses each of these six operating environments and the
methods used in this research report for classifying America’s
suburbs.
Table 3 presents a matrix that cross-tabulates the different
types of suburban service strategies reviewed in this report
that have been applied to each of the six land-use environments. Several patterns are revealed by the matrix. The more
traditional suburban settings—residential suburbs, mixed-use
suburbs, and suburban campuses—have generally received
the greatest variety of transit service strategies. Circulators
and line-haul enhancements, in particular, have been concentrated in these settings. This likely reflects the fact that traditional suburban settings provide a more established and
stable ridership base for designing and sustaining reasonably
successful suburban services.
More flexible service options—route deviation and
demand-responsive services—have been targeted predominantly at residential suburban markets. Residential suburbs
also usually represent one end (the origin) of feeder links to
rail stations and transit hubs. The reliance on more flexible
and feeder types of services to accommodate residential
markets reflects both the low densities and choice-rider
characteristics of these markets.
Balanced, mixed-use suburbs have received very comparable suburban services as predominantly residential suburbs.
In general, the market characteristics of these two settings
appear to be similar enough that the same types of service
offerings are provided.
Suburban campuses, like office parks, have likewise
received a breadth of line-haul enhancements, like express
routes to rail hubs, and supportive services, like midday runs
between the campuses and nearby shopping centers. These
more specialized services tend to rely on small vehicles (e.g.,
bubble-top vans), operate during limited hours, and cost
nothing to eligible employees.
The types of services targeted at edge cities have largely
paralleled those introduced to large-scale suburban campuses, with a few exceptions (e.g., circumferential services in
Houston). In both of these instances, it has been the concentration of thousands of workers, regardless of whether they
are spread out in campuses or contained in mid-rise buildings, that has given rise to these specialized transit services.
18
TABLE 3 Matrix of Suburban Transit Service Strategies and Land-Use Environments
Moreover, transit services tailored to office parks and edges
cities have also been spawned by mandatory trip reduction
ordinances and TDM requirements. It has been in large part
the critical masses of workers and institutional support from
large companies that have helped sustain specialized feeder
and shuttle services to large employment centers.
To date, suburban corridors have received both direct
express and circumferentially configured bus services. Among
the case sites, most suburban-corridor examples are in the
Houston area. In cases of exurban corporate enclaves, like
Plano north of Dallas (Figure 13) and the Woodlands north of
Houston, express, crosstown bus connections from either residential neighborhoods or park-and-ride lots have been relied
upon to serve these markets. The most ambitious transit program to date targeted at an exurban enclave is found not
among the case sites but in the Chicago region, where PACE
has introduced nearly 100 subscription vans to serve the new
Sears merchandising center headquarters in the community of
Hoffman Estates. The program has been highly successful,
with around 30 percent of Sears’s 5000 suburban workers currently commuting by some form of mass transit, compared
with around 6 percent of suburban/exurban workers who
transit-commute for the Chicago region at large.
Overall, the case studies provide glimpses into which
service strategies work best in which kinds of operating environment settings. Low-density, single-use settings—like residential suburbs and suburban campuses—tend to receive
point-to-point services, with buses often tying into a transfer
hub or rail station, or else demand responsive services. Mixeduse suburbs and edge cities, because of their higher average
densities and variety of activities, tend to receive both these as
well as more specialized services (e.g., noontime shuttles) that
are usually integrated into timed-transfer networks. Beyond
these generalizations, however, it is apparent that considerable
knowledge gaps remain regarding the relative success at
adapting suburban transit services to different land-use environments. This is an area in which consideration should be
given to targeting future research efforts.
LAND-USE STRATEGIES
Figure 13. DART Crosstown Limited bus services
providing service to office parks in Plano, Texas.
Three different types of land-use strategies have been introduced as tools for promoting transit ridership in suburban
settings: (1) development of transit-supportive design guidelines; (2) planning and formation of transit-oriented development (TOD); and (3) regional growth management. These
strategies have sought to create built forms that are conducive
to transit riding at three different grains of development.
Design guidelines have focused at the site level, seeking to promote suburban designs that both facilitate walking access to
transit stops and allow for efficient transit vehicular movements. TOD initiatives, on the other hand, have generally been
19
directed at the community level, aiming to create suburban
neighborhoods that are compact, mixed-use, and pedestrianfriendly within close proximity to rail stations and major bus
transit stops. Regional growth management efforts have generally sought to influence urban form at a regional level, such
as through defining urban growth boundaries that hem in new
development.
oriented suburban strip might be retrofitted into a more compact, mixed-use, transit-oriented community. Key to this conversion are up-front public improvements that improve the
quality of the neighborhood and, as a result, help to jumpstart private sector improvements. Several of SNO-TRANS’s
board members regularly meet with developers to review the
manual and an accompanying videotape, and the board annually awards a prize to the county’s most transit-friendly new
development.
Transit-Supportive Design Guidelines
A 1993 national survey found that about 25 percent of transit agencies in the United States have some form of transitsupportive design guidelines. In general, these guidelines
promote the physical development of properties and sites (and,
to a lesser degree, subdivisions and corridors) in a manner that
supports transit services. Besides imparting technical design
information, guidelines promote coordination among stakeholders, encourage long-range planning for transit, emphasize
the importance of transit design considerations during project
review, and educate the general public about transit issues.
Some of the more effective guidelines provide examples of
“good design practices” that developers can emulate.
Among the case study sites, CCCTA, Tri-Met, San Diego
Transit, and BC Transit have strongly promoted transitsupportive site designs by widely disseminating design manuals (and in the case of San Diego, videotapes). In 1982,
CCCTA published one of the nation’s first transit-supportive
design guidelines, Coordination of Property Development
and Improvements. The document makes recommendations
on the designs of residential subdivisions, roadways (e.g.,
geometrics), and transit facilities (e.g., siting of bus shelters). CCCTA’s planning department has distributed the
guidelines to areawide developers and other interests, hoping to promote transit-sensitive designs at the project conceptualization stage. Although CCCTA planners review and
comment on all major development projects within the
agency’s service area, they have never tried to block a project for design reasons; they view their role simply as one of
education rather than enforcement.
In the Portland region, Tri-Met has published Planning
and Design for Transit. The manual describes the many
virtues of transit-supportive development and presents
examples of designing for pedestrian districts, zoning for
land uses, and laying out on-site road systems. Figure 14
presents an example of how to appropriately design bus stop
amenities, taken from Tri-Met’s manual.
One of the most effective campaigns to date to promote
transit-sensitive site designs has been undertaken by Snohomish
County Transit, or SNO-TRANS, which serves sprawling
Snohomish County north of Seattle. SNO-TRANS guidelines,
A Guide to Land Use and Public Transportation, makes liberal
use of graphics and illustrations and has gained national recognition as one of the best how-to guidelines for designing
transit-friendly projects. Figure 15 presents an exhibit from
the manual showing how, over time, a typical automobile-
TOD
TOD has gained currency in recent years to describe places
conducive to transit riding—compact, mixed-use communities that, by design, invite residents, workers, and shoppers to
drive their cars less and use transit more. TODs embrace many
of the design principles from traditional American towns like
Princeton, New Jersey; Savannah, Georgia; and Annapolis,
Maryland. Among the hallmarks of a neighborhood-scale
TOD is a commercial transit-served core within walking distance of several thousand residents, a well-connected grid-like
street network, narrow roads with curbside parking (to buffer
pedestrians) and back-lot alleys, diverse land uses, and various
styles and densities of housing.
Among the 11 case study sites, four stand out for their
leadership in promoting suburban TOD—San Francisco’s
East Bay (CCCTA), San Diego, Portland (Tri-Met), and Vancouver (BC Transit). All have consciously sought to create a
new form of suburban environment that in the long run could
dramatically increase transit ridership.
San Francisco’s East Bay
Within the service jurisdiction of CCCTA is the emerging
transit village surrounding Bay Area Rapid Transit’s (BART’s)
Pleasant Hill station. Between 1988 and 1993, over 1,800
housing units and 1.5 million ft2 (0.14 million m2) of class A
office space were built within one-quarter mi (0.4 km) of the
Pleasant Hill station. Pleasant Hill’s success is attributable to
three key factors: (a) the creation of a specific plan in the early
1980s that served as a blueprint for targeting growth near the
rail station over the next 15 years; (b) the existence of a proactive redevelopment authority whose staff aggressively sought
to implement the plan by assembling irregular parcels into
developable parcels and issuing tax-exempt bond financing for
public and private improvements; (c) having a local elected
official who became the project’s political champion, working
tirelessly and participating in innumerable public hearings to
shepherd the project through to implementation. Current plans
call for converting two BART parking lots at the Pleasant Hill
station into structured replacement parking in order to open up
land for restaurants, retail shops, and a regional cultural complex, activities that are currently missing but are widely viewed
as vital toward creating a more village-like atmosphere.
20
Figure 14. Designing bus stop amenities, one of the many guidelines
provided by Tri-Met in Planning and Design for Transit.
Surveys of people living in Pleasant Hill’s transit village
reveal that 47 percent patronize some form of mass transit to
work (either BART or the County Connection). This transit
modal split is three times higher than for the entire city of
Pleasant Hill and around five times higher than the Bay Area
average. Tenants of the transit-oriented housing also own relatively fewer vehicles than the county average, in part
because of the availability of BART and frequent CCCTA
feeder services.
San Diego
In recent years, the city of San Diego has strongly promoted transit-oriented designs, adopting a formal policy “to
direct growth into compact neighborhood patterns of development, where living and working environments are within
walkable distances of transit systems” (City Council Policy
600–39). Since 1990, more than 380 modern apartment units
have been built adjacent to the Amaya light-rail station in the
21
Figure 15. Automobile strip-to-transit conversion, in SNO-TRAN’s Guide to Land Use and Public Transportation,
Seattle, Washington.
22
San Diego suburb of La Mesa. Currently under construction
is Otay Ranch, a master-planned community adjacent to the
cities of San Diego and Chula Vista, which will feature five
village clusters and will be served directly by an extension of
the trolley line. The most ambitious TOD planning, however,
is currently under way along the $240 million Mission Valley trolley line now under construction. Mission Valley has
grown rapidly in recent years; it is the recipient of two
regional shopping malls, several campus-style office parks,
and San Diego’s Jack Murphy Stadium. To effectively serve
TOD, the Mission Valley crosses the San Diego River three
times in order to serve site developments on the flat valley
floors and preserve the sensitive hillsides that define the valley. Whereas earlier San Diego trolley lines were aligned
along abandoned freight rail lines and freeway corridors to
minimize land acquisition costs, San Diego officials have
opted to align the Mission Valley corridor to maximize development potential, even if it means dramatically inflating the
project’s cost.
Portland, Oregon
Portland, Oregon, has gained a reputation as a national
leader in promoting TOD. The MAX light-rail line is widely
credited with stimulating redevelopment in downtown Portland and the Lloyd Center; however, to date little has happened along the east-side line that extends to the suburban
community of Gresham. Portland planners hope to more
effectively leverage transit, however, with the MAX extension currently under way on the city’s west side. There, an
ambitious, state-of-the-art planning campaign aims to create
new transit-oriented communities that will obviate the need to
build a planned west-side freeway. This western corridor in
suburban Washington County has experienced phenomenal
growth in recent years. During the 1980s, it accounted for
two-thirds of population growth and 96 percent of employment growth in the Portland metropolitan area. Planning for
this corridor has been a joint public-private endeavor. The
region’s governing body, Metro, in coordination with local
and county governments, has led public sector planning. In
parallel, the 1000 Friends of Oregon, an independent proenvironment group, carried out its own comprehensive planning, under the aegis of the LUTRAQ (land use, transportation,
and air quality connection) program. The LUTRAQ study
recently concluded that transit-oriented communities could
accommodate 65 percent of new homes and 78 percent of new
jobs in suburban Washington County.
Among the innovative planning measures currently under
way along the west-side corridor has been the use of interim
zoning to prevent land uses that might be incompatible
with TOD during the planning stages. Besides prohibiting
automobile-oriented uses within one-half mi (0.8 km) of
planned stations, interim zoning sets minimum densities, limits parking supplies, and requires buildings to be physically
oriented to light-rail station entrances. Additionally, publicprivate master development of transit-oriented communities,
using some 1,500 acres (6.07 kms) of vacant land, is now
breaking ground. One site, Beaverton Creek, located in the
upscale suburb of Beaverton in the state’s high-tech Silicon
Forest, is slated to be the first project built under Portland’s
transit-oriented design guidelines. It is being planned by
a team of landowners, including Specht Development, First
Western Investments, U.S. Bank, Texktronix, and Tri-Met.
The west-side line was routed to take advantage of Beaverton
Creek’s prime development parcel. Some 1,600 multifamily
units at blended densities of 22 to 35 units per acre and several
hundred single-family homes are proposed for the Beaverton
Creek site. A generous system of pathways will also tie it to
the Nike world headquarters, immediately to the north.
Vancouver, British Columbia
Since adopting the Liveable Region Plan in 1975, Vancouver has sought to create a system of town centers
throughout the metropolitan area that would be efficiently
linked by the SkyTrain advanced light-rail system and feeder
transit services. The long-range plan calls for a hierarchy of
urban centers, with the primary centers interconnected by
rail and smaller centers relying on radial crosstown express
services and feeder vans Figure 16. An example of transitoriented development is the Burnaby Metrotown, an urban
center that boasts a SkyTrain station in its core. Burnaby is
a mature inner suburb of some 160,000 inhabitants located
6 mi (9.66 km) south of downtown Vancouver. In its transitserved core are moderate density commercial, office, and
other mixed land uses. The core is surrounded by parks and a
supporting ring of multifamily mid-rise apartments and townhouses. Single-family housing lies beyond the higher-density
housing. This wedding-cake pattern of densities has put those
most likely to ride transit— shoppers, office workers, and
apartment dwellers—closest to the SkyTrain hub. Ninety
percent of all commercial parking spaces in Burnaby are
provided in structures or below ground. This has freed up
land for parks, passageways, and bike paths that connect
surrounding residential areas to the SkyTrain station.
REGIONAL GROWTH MANAGEMENT
Several of the case study areas also stand out for attempting to manage regional growth to create a more compact,
transit-supportive urban form. Portland has long had one of
the most ambitious regional planning and growth management efforts in North America. The Portland region has
enacted an urban growth boundary (UGB). This boundary
sets the outer limits for urban development over a 20-year
period. Metro, the region’s governing body, defined the UGB
in 1979 and has made only minor revisions to it since then.
The UGB’s strength in containing sprawl will likely be tested
23
Figure 16. The long-range plan for the Vancouver, British Columbia, region links a hierarchy of urban centers
using rail and bus services.
in coming years; it was originally drawn to contain a generous supply of land, and only recently have some cities begun
to run out of developable land. To guide future growth, Metro
has recently worked with local governments and citizens to
reach a consensus on the region’s future preferred settlement
pattern in a process know as Region 2040. The adopted
growth strategy calls for concentrating future growth in regional centers that are served by multimodal arteries and transit services (Figure 17). With an urban growth strategy now in
place, the region has begun to move toward designing specific
neighborhood plans, many of which are focused on rail transit
stations.
Much of the impetus for regional growth management in
the Portland region has come from the state of Oregon. In
1991, statewide legislation was passed that mandates implementation of transportation and land-use measures that will
reduce per capita vehicle miles traveled in the Portland region
by 10 percent in 20 years and by 20 percent in 30 years. This
transportation planning rule has set into motion various initiatives to limit parking near rail stops, improve pedestrian
and bicycle connections, and build more transit-oriented
communities.
In the Greater Vancouver area, regional transportationland-use planning and growth management can be traced
back to the 1930s. The vision of compact and sustainable
regional growth was crystallized in the region’s historic Liveable Region’s Plan that embraced the idea of connecting
regional town centers by fast and efficient public transportation. As noted, these town centers have become the foci of
higher-density development and the building blocks for a
regional system of high-capacity transit linkages.
Last, the San Diego region has enacted a regional growth
management strategy through the San Diego Association
of Governments. The centerpiece of the regional growth
management strategy is the development of reasonably selfcontained, less automobile-dependent communities, like
Mission Valley, that are conducive to transit riding.
MARKETING SUBURBAN TRANSIT SERVICES
Given the general unfamiliarity of many suburban residents and employees with nontraditional transit services,
marketing takes on a particularly vital role in an suburban
transit service program. As elsewhere, marketing has two key
features: (a) identifying and targeting services to existing,
potential, and emerging ridership markets; and (b) promoting
and acquainting the public with service options.
24
Figure 17. Development guideline examples taken from the Portland, Oregon, area’s Region
2040 plan.
25
Figure 18. A CCCTA one-stop transit shopping center.
Identification and evaluation of suburban transit markets
are normally carried out through formal surveys, focus
groups, and meetings with regional stakeholders and informants. Less formal approaches are also sometimes used. For
example, transit managers often meet with drivers to discuss
ways of tailoring services to customer needs.
Once services are introduced, typical marketing approaches
include direct mailings, distribution of fliers, advertising campaigns, and radio jingles. Some service providers have gone
the extra distance to get the public to notice and try their new
services. When the WhirlyBird Mall express shuttle service
was introduced, LANTA had a costumed mascot at the mall
and gave away promotional coloring books with coupons good
for free rides and gifts from mall merchants. LANTA adds the
special touch of sending patrons a birthday card and free ride
coupon when they turn 65. In Contra Costa County, new shuttles services were aggressively marketed through newspaper
stories, television coverage, circulating brochures, and hanging banners along shuttle routes. CCCTA also considers its
Figure 19. The Riverside, California, intermodal center
showing the RTA information center.
“one-stop transit shopping center” to be an important feature
of its marketing campaign (Figure 18). Open from 6 AM to
7 PM on weekdays, the Center provides full customer information and services, including personal and automated trip
planning, multiride punch cards and regional transit connection discount cards, and telephone information.
Where services are directed at specific residential neighborhoods, marketing has tended to be more targeted (Figure
19). The Fort Worth T mailed information packages describing the Rider Request component of route-deviation services,
along with a refrigerator magnet listing the reservation telephone number.
To make their services stand out, several suburban transit
agencies have also introduced unique color schemes.
LANTA uses a special color and logo to distinguish shuttles
from core bus services. CCCTA similarly uses a distinctive
logo and color scheme for its shoppers’ shuttle in downtown
Walnut Creek.
26
CHAPTER 3
ACTIONS TO MODIFY AND IMPROVE THE OVERALL
SUBURBAN TRANSIT FRAMEWORK
This chapter describes strategies used by suburban operators to enhance the performance of their overall network—
transit centers and timed transfers, express bus routes, and
limited-stop services. The sections describing each of the
strategies, for this chapter as well as for each succeeding
chapter, are divided as follows:
•
•
•
•
Description,
Applicability,
Performance range, and
Conditions of effectiveness.
ESTABLISHING A TRANSIT CENTERS CONCEPT
AND TIMED-TRANSFER PROGRAM
Description
One of the most common types of changes introduced on a
regional basis for improving suburban transit services is the
introduction of timed-transfer systems organized around suburban transit centers. In metropolitan areas with rail services,
these centers are very often intermodal terminals located at
rail stations, supplemented by other centers located at malls,
in suburban downtowns, or at other key activity centers. In
non-rail cities, the transfer terminals are also often associated
with the malls and suburban downtowns, and commonly offer
transfers to urban bus routes to provide for regional trip making. The experience of Tidewater Transit, however, demonstrates that transfer centers can also exist independently of
activity nodes.
Timed-transfer systems organized around transit centers
are designed to facilitate transfers and reduce the length of
waits. Timed transfers are particularly important in suburban
settings because low-density operating environments often
result in relatively long headways. Transit centers, ranging
from the simple shelters of the Tidewater Transit District to
enclosed, temperature-controlled structures such as in Dallas,
serve as the intermodal hubs where suburban transfers are
made (Figures 20 and 21).
Applicability
One national survey of 88 U.S. transit properties found
that 68 percent of the surveyed agencies had some form of
timed-transfer and transit center services; among properties
with more than 350 vehicles, almost 90 percent used timed
transfers.
Among the 11 case sites the researchers examined, two
general approaches to designing timed-transfer networks
were found, pulsed, and coordinated.
• Pulsed systems involve designing suburban transit routes
so that buses arrive and depart transit centers at approximately the same time. Often a “window” is set where
buses are to arrive within 3 to 5 min of each other. This
means buses fan out from a designated transit center into
different neighborhoods at roughly the same time and feed
back into the same center at approximately the same time.
A prime example of a pulsed system is Tidewater Regional
Transit (TRT). Among the 11 case sites, TRT’s timedtransfer system is the most impressive. Using Edmonton’s
seminal timed-transfer system as a model, TRT introduced 13 direct transfer centers in 1989. These are locations where buses serving two or more routes arrive within
3 min of each other. (Buses operate on 30-min intervals,
normally scheduled to arrive at centers 15 min before and
after the hour.) A 3-min wait time is scheduled at each
location (with up to a 2-min extension if a driver sends a
radio message that he or she is running late).
• Coordinated timed-transfer systems tend to operate
more loosely. Here, bus schedules are not strictly set
with vehicles expected to arrive within a few minutes of
each other. Rather, in view of the sometimes circuitous
roadways found in low-density settings, efforts are
made to bring buses together at a transit center within
a more liberal time allotment, usually between 10 and
15 min. In the case of Portland Tri-Met’s timed-transfer
system, feeder buses tying into transit centers face
tighter on-time requirements than other buses, and they
have a window during which they can wait for a delayed
trunk-line route (Figure 22). However, waits of 10 to 15
min to transfer between buses among Tri-Met’s 15 transit centers are not uncommon.
Every one of the operators surveyed had at least some element of timed-transfer/transit centers within their overall
framework, whether the concept was a simple as coordinated
transfers between feeder routes and trunk routes at malls in
27
Figure 20. A very basic transit center design from the
Tidewater Transit District in Norfolk, Virginia.
LANTA or as complex as the network of suburban transfer
centers in large metropolitan areas such as Dallas, Tidewater,
Houston, Portland, and Vancouver (BC). In the latter cases,
major transfer terminals were developed to serve as hubs
around the region for the confluence of local suburban bus
services, local circulators and shuttles, central business district
(CBD)-oriented radial bus and rail services.
Tidewater’s direct transfer centers operate in a manner
akin to the downtown “pulse points” found in many smaller
cities. The difference is that there are multiple pulse points
and they are located throughout the region. An important feature of TRT’s direct transfer centers is that they are fairly
modest, which has lowered capital costs and saved on ongoing maintenance. Because all connections are timed, passengers usually move directly from bus to bus. This means
they need not wait at the center or if they do have to wait, it
is for only a few minutes. In inclement weather, passengers
are permitted to stay aboard buses until their connecting
buses arrive. Because all transfer activity occurs when several buses are at the center, security is less of a problem, even
during evening hours.
DART has oriented its service around 14 transit centers,
most of which include a park-and-ride component (Figure 23).
The transit center serves as the transfer point between feeder/
distributor routes, express routes, and crosstown routes. Most
facilities include an enclosed climate-controlled waiting room
with off-street loading for up to 12 buses. Several transit stations will become rail stations when the new light-rail system
expands into the suburbs.
LANTA adopted a 10-year strategic plan in 1993 to meet
its changing needs and included a strong push toward new
services in the suburban areas outside the urban core. Shuttles have been developed that are linked to suburban malls,
where regular CBD-oriented bus services are available. Use
of regional malls enhances the viability of the circulators for
local travel and offers a linkage for suburb to CBD trips that
otherwise would be too costly to provide with a single direct
route (Figure 24). It also allows LANTA to keep its capital
costs low and fosters participation from the mall developers.
CCCTA operates all of its fixed route buses into BART
stations with a tie to BART timetables but not a true timedtransfer pattern. Bus-to-bus transfers are increasing, however, and CCCTA is beginning to concentrate on non-rail
station transit centers in other areas of the county. The centers themselves are carefully designed to accommodate bus
operations as well as to maximize customer comfort and convenience during the transfer process. The concept is further
supported by transit-friendly regulations aimed at concentrating activities around these transit hubs and promoting the
transit village concept. In general, BART has designed intermodal facilities to allow for efficient bus maneuvers into stations, to ensure safety, and to make transferring convenient.
Within its stations, bus staging areas are designed to provide
sufficient turning radii and layover facilities for buses, space
for shuttles, and to prevent vehicle conflicts. The sawtooth
boarding bay arrangement at most stations allows buses to
pull in and out easily and has made buses more easily identifiable, thus expediting passenger transfers.
The transit environment in suburban areas is defined by
diverse origin-destination patterns and moderate to low
densities. Under these conditions, it is recognized that ubiquitous networks are impossible to provide and even moderate networks are costly to maintain unless the services can
be organized and focused so that the diverse trip patterns
can be concentrated and transit services appropriately organized. As the case studies demonstrate, the transfer centers
concept is recognized as the most appropriate approach to
addressing these issues. It is applicable across the board as
a means of focusing services, linking local and regional
systems in the most cost-effective manner, and linking the
family of services needed to tailor transit to the suburban market. It enables operators to serve multiple origin-destination
patterns more effectively and, through the use of timed
transfers, to do so with a minimum of disruption to the
customer.
Performance Range
Figure 21. A temperature-controlled suburban transit
center in Dallas, Texas.
Implementation of the first direct transfer centers in Tidewater in 1989 coincided with the first gain in system ridership
after 4 years of steady decline. However, the specific influ-
28
Figure 22. The network of transit centers for the Tri-Met transit system in Portland, Oregon.
ence of the direct transfer centers on these gains cannot be
determined because other events occurred at the same time—
elimination of direct service to some locations, provision of
new services to other areas, and so forth. Moreover, the ridership gains immediately following the initiation of timedtransfer services were short lived. Ridership continued to fall
throughout the Tidewater area during the first half of the
1990s in large part because of a downturn in the economy
induced by defense industry cuts and deployment of naval
personnel to the Middle East and other military locations.
From a user’s perspective, TRT’s direct transfer system
appears to have been well received. A 1992 on-board ridership survey revealed that three-quarters of TRT’s customers
preferred timed transfers to previous services.
More compelling evidence about the potential ridership
benefits of timed transfers comes from AC Transit, serving
the Oakland (East Bay) region of the San Francisco Bay Area.
In the late-1980s, AC Transit began phasing in timed transfers in response to the suburbanization of employment. A
multidestination transit centers program was formally initiated in early 1989. Table 4 shows that ridership increased
during a 2-year period (1989–1991) when timed transfers and
pulse scheduling were introduced within two subdistricts of
AC Transit’s service area. By contrast, patronage on the rest
of AC Transit’s service area, where traditional radial services
remained, continued to fall over the same period. Service levels (vehicle miles of service per 1,000 households) were similar across the subdistricts over the 1989–1991 period.
29
Figure 23. Layout of the DART timed-transfer bus systems.
Historic data from other areas also seem to indicate that the
switch to timed transfers can have a positive impact on ridership. Comparisons of ridership 1 year after introduction of
timed transfers showed systemwide increases of 3.2 percent
in Dayton, Ohio (between 1990 and 1991), and 40 percent in
Painsville, Ohio (between 1989 and 1990), even though ridership was falling for most other Ohio transit properties for the
same periods.
In general, even in the absence of any quantitative data on
performance, operators and customers generally agree that the
timed-transfer concept provides mobility benefits to the customer and cost savings to the operator, albeit with a modest
loss in directness for some origin-destination pairs.
Conditions of Effectiveness
The conditions of effectiveness are generally straightforward for implementing a transfer centers approach. They
include the following:
30
•
•
•
Figure 24. A LANTA suburban transfer center located at
the regional mall offers convenient transfers between local
circulators and shuttles and the regional line-haul network.
•
• An overall strategy described in a long-range plan for the
area can provide significant support in the development
of a transfer center concept. Having a coordinated landuse/transportation strategy in place has provided the
impetus for major initiatives in Vancouver (BC) and Dallas and supports the actions taken in Tidewater and Contra Costa County by fostering development strategies that
will strengthen the concept. Plans with long-term commitments to transit-friendly designs, land-use controls to
concentrate development around transit centers, and the
like will continue to strengthen the impetus for transit
center development.
• Establishing support among local planners and policy
makers, developers, and mall owners helps to develop,
design, and promote transit-friendly centers. Being
TABLE 4
•
allowed to develop centers at malls or other major activity centers (besides rail stations) enhances use of buses
for both local and regional travel.
Clearly, the presence of rail to serve as a hub for the
transfer center concept helps immensely, providing a
major impetus to local bus ridership. Strong connections
to express buses and other CBD-bound services can have
similar effects, especially if wait times are minimized.
Not all arrivals at a transit center come by local bus for
their transfer to rail or express bus. Parking lots at transit
centers will encourage transit use for the line-haul trip
even if it competes, locally with the feeder bus network.
Although it is recognized that no level of bus service will
attract everyone, park-and-ride lots will provide additional benefits to the community at large if a significant
number of riders are persuaded to make their line-haul trip
via transit and not on congested roadways (Figure 25).
Because the concept tends to lengthen many trips by
forcing routes into a transfer center, care needs to be
taken to understand origin-destination patterns to avoid
long bus trips compared with the same trip taken by car.
The transit trip cannot be made so indirect that it becomes
uncompetitive even for the nontransferring passenger.
Although the transit center can be quite modest, constant
attention is still required to keep it clean and attractive to
users. Furthermore, riders need to feel safe and secure,
which requires consideration of the center location as
well as a plan for ongoing supervision of the site.
Transfer fees, if any, need to be kept low to encourage
these trips. Furthermore, low-cost or no-cost transfers
should be allowed between various operators, with
the ideal being a seamless fare approach that allows free
movement among all operators using the transfer center.
ENHANCING LINE-HAUL SERVICES
The backbone of any bus system, urban or suburban, is its
network of trunk-line routes. Suburban operators have found
that, when properly planned and implemented, enhancing
Ridership Trends Associated with Phase-In by AC Transit of Multidestination, Timed-transfer System, 1989–1991
31
Figure 25. Many of the Dallas transfer centers are
located at park-and-ride facilities.
these local routes with limited-stop or express bus routes
offering a higher quality of service can improve service for
its core riders and can attract choice riders to the system. This
section describes experiences with these two concepts for
suburb-to-suburb travel.
Figure 26. Cover art for route maps and schedules for
two suburban express bus services.
For long distance trip making from suburb-to-suburb, particularly for commuter trips, many operators have begun
express bus services, hoping to provide travel speeds similar to
single-occupant vehicles coupled with comfort and reliability
aimed at offering a stress-free ride.
frequently, these lanes are oriented to CBD-bound express
buses, but the use of HOV lanes for suburb-to-suburb travel
has been increasing and was cited in at least one of the case
studies. To minimize in-vehicle travel times, express buses
will originate at park-and-ride lots in some cases, with collection being done either by local buses or by automobile.
Finally, operators increasingly have developed express bus
services with special equipment, featuring cushioned seats,
individual interior lighting, and other features to compete
with the comforts of the automobile.
Description
Applicability
Express bus service generally consists of long-haul,
moderate- to high-speed routes with few stops, serving regional trips. Stops, if any, are widely spaced, for collection
and distribution, and most of the route is operated at high
speeds along the arterial or highway network (Figure 26).
Ideally, express services are provided with special equipment,
which is designed for more comfort than regular coaches in
local service.
There are a range of variations in the way express bus services are provided, but the underlying principal is to provide
a higher speed, more comfortable ride than local bus service
offers, so that public transportation can be competitive with
the automobile for longer distance trips, particularly for commuter trips. Speed, reliability, and comfort are key determinants of the success of these services along with pricing and
availability.
To obtain reliable travel times and competitive travel
speeds, as much of the trip as possible is provided on highways or arterial roadways, preferably with special treatments
such as bus or high-occupancy vehicle (HOV) lanes. Most
There are two general applications of express bus services
found among suburban operations.
Express Routes
Corridor Enhancement. Express bus services are used to
offer a higher level of service in heavily traveled corridors,
often to supplement local bus services running along the same
corridor. These expresses often use the same roadways as the
local buses, achieving higher operating speeds by reducing
the number of stops along the route. To achieve higher speeds,
selected sections of the routes can be operated along limited
access highways instead of along the arterial road network.
Passengers boarding and alighting at the ends of existing
local routes are provided with higher quality service, and
at the same time loads on heavily traveled local buses can
be reduced to acceptable levels. New riders are attracted by
the faster travel speeds and, in many cases, more comfortable
equipment used on the express buses.
Corridors in which suburb-to-suburb express services
operate need to be densely developed with both significant
numbers of residents and activity centers. Furthermore, they
32
need to be anchored by well-defined, active terminal points
upon which the service is oriented. In the case of the Inland
Empire Express, operated by the Riverside Transit Agency,
the two terminal locations are the Edge Cities of San
Bernardino and Riverside, which are not only final destinations for many trips but also major transfer points to local
Omnitrans and Riverside Transit buses.
Long Island Bus (LI Bus), which operates in suburban
Nassau County and adjoins New York City on the east, has a
number of high-density bus corridors that connect major suburban activity centers to the New York City subway network
in Eastern Queens County. Once primarily oriented for Nassau residents going into New York, these corridors now have
significant travel in both directions as employment opportunities have expanded to the suburbs. In recent planning studies, these corridors have been identified for the development
of express bus and limited bus services, operated in much the
same manner as described for the Inland Empire Express.
The express services would operate between the terminals in
Queens and those in Nassau County without interim stops;
the limiteds would provide stops along the route at key activity nodes. LI Bus hopes to separate loads in this manner to
operate more efficiently, thus improving overall operations,
and to enhance its services to attract additional choice riders
to transit.
In both cases, another factor in the application of express
services is to offer a premium service, relative to a local bus,
but at a fare lower than that of parallel rail services—
Metrolink in Riverside County and Long Island Rail Road in
Nassau County. The express buses and rail services, though
both in the same corridor, have been found to attract different markets, with the bus riders generally having a lower
income profile and shorter average trip lengths.
The frequency of the service and total trip length appear to
be highly dependent on local conditions and markets. Riverside Transit operates Route 100 on 75-min headways, and the
total route travel time is 35 min. As the next section on performance shows, despite the long headways, the route has
good ridership. The LI Bus service, as described in the
agency’s recent planning study, could have as many as four
to six express trips per hour interspersed with a local service
operating as frequently as every 5 min.
Typical travel times are 30 to 60 min, but the range among
the case studies was from 20 to nearly 90 min. The application
is best suited to trips of at least 30 min on the express bus itself
and only where the in-bus travel time can be competitive with
the drive time by automobile. HOV lanes and priority treatments at tolls or exit ramps significantly increase the competitive edge of the bus over the single-occupant vehicle.
Among the peak-hour express services described in the
case studies, three operate from park-and-ride lots and serve
major suburban work sites. Collection, which is time consuming and costly to operate, is dependent on automobiles in
each case. None of the park-and-ride lots is served by collector buses. The express buses do provide distribution and collection at the work trip end, but, for total travel times to be
competitive with the automobile, most of the time must be
spent in express operation on the highway. The Route 110
Clipper in Suffolk County operates in an HOV lane of the
Long Island Expressway (Figure 27).
Houston METRO provides express crosstown services
between several park-and-ride lots and outlying employment
centers, the most significant of which is Route 292, which
runs from the Westwood park-and-ride lot, located in a principally residential area to the Texas Medical Center (TMC),
a massive suburban employment enclave with 3,000 workers.
TMC was considered an excellent candidate for express
crosstown services for several reasons: it is one of the few
suburban locales with significant parking charges—$70 per
month for a garage space, $55 per month for a surface lot, and
$40 per month at service lots; it features on-street amenities
like sidewalks, shelters, and skyway pedestrian connections
between buildings; and most employers help underwrite the
costs of employees’ transit expenses.
One of the services, the I-Bus from Stamford, Connecticut,
to White Plains, New York, operates between the centers of
two edge cities as well as along the I-287 employment corridor (Figure 28). Access to the service can be made via other
buses and rail services at intermodal centers in both cities or
from several residential areas through which the bus passes
before using I-95. This service, initiated in 1996, provides a
transit link in a heavily traveled east-west highway corridor
unserved by rail.
Peak Employment Services. Express buses are used by a
number of operators to offer entirely new commuter-oriented
services to compete with the single-occupant vehicle in heavily congested corridors. Typically there are three to five trips
in the peak direction during peak periods. To provide flexibility, operators often ensure that service extends to the shoulders
of the peak and that midday travel needs are met with either
one or two bus trips or an employee-sponsored guaranteed
ride home/emergency service program. Early morning and
late evening runs generally have very low productivities compared with the peak runs but have been shown to be important
“safety nets” for drawing riders to these services.
Range of Performance
Corridor Express Service. The sole corridor express service identified in the case studies was the Riverside Transit
Agency Inland Express, which has a productivity of 38 passengers per trip on weekdays and 20 passengers per trip on
Saturdays, which translates to 21.7 passengers per hour on
weekdays and 14.4 on Saturdays. During peak hours, there is
often standing-room-only. The cost recovery rate was 20 percent. In comparison, Riverside Transit’s local fixed routes
had a 1994–95 productivity of 26 passengers per hour, with
a range from 3.7 to 37.9 passengers per hour. For developing
33
Figure 27. Route map and schedule of the Route 110 Clipper, Suffolk
County, New York.
urban area routes, as designated by Riverside Transit, the
average productivity in that period was 16.0 passengers per
hour. The service also is considered a success in meeting
regional mobility needs, as it strengthens the commitments
to interregional cooperation, offers alternatives to transitdependent populations unable to afford rail, and complements
other fixed-route services.
Peak Commuter Express Service. The range of performance is large for the peak commuter express services
surveyed for the project.
Introduced in fall 1994, Houston METRO Route 292 operates at 15-min peak-hour headways, similar to downtown
express services. A daily ridership target of 648 was set for
Route 292; however, after 1 year of service it was averaging
only a little over 200 passengers daily. Follow-up surveys by
METRO revealed part of the reason for this disappointing per-
formance: many TMC employees were unaware of the service
and the availability of employer-paid transit allowances. Several employees indicated they were not willing to “experiment” with transit because if they go back to driving, they
would be placed at the bottom of the priority list for available parking spaces (i.e., they’ll be assigned to the most remote
parking space). METRO plans to continue supporting Route
292 and hopes to increase ridership through targeted marketing and working with TMC employers to change parking policies. METRO also anticipates trying new crosstown express
routes in the future, most likely with contracted minibuses.
The Suffolk County, New York, Route 110 Clipper and
Connecticut Transit/Westchester County (NY) I-Bus are relatively new services in their first year of operation. Each is
generating approximately 10 to 11 persons per trip, with the
Route 110 Clipper providing approximately 130 trips per day
and the I-Bus approximately 180 trips per day. Both operators
34
Figure 28. Route map and schedule of the I-Bus between White Plains, New York, and Stamford, Connecticut.
believe the services have started well and have potential for
growth and will continue the projects for at least 2 years with
CMAQ funding. The farebox recovery for the I-Bus was 16.6
percent. The Route 110 Clipper is operated by a private operator under contract to Suffolk County.
The last of the services included in this section is the Lakewood Park and Ride, operated by a private contractor for NJ
Transit. The service, between two park-and-ride lots in southern Ocean County and the Lakewood Industrial Park, a
medium-density employment location at the north end of the
county, was discontinued after 2 years of operation because
of poor performance. Before being discontinued, ridership
levels were about three persons per trip, and the farebox
recovery rate was 7.9 percent. The NJ Transit standard for
their suburban service experiments is 25 percent after the second year. Elements contributing to poor performance were a
lack of support from employers in the industrial park, no significant time savings for the buses on the Garden State Parkway operating in mixed traffic, and a dispersed residential
marketshed from which to draw riders.
Conditions of Effectiveness
Clearly the range of performance indicates that a number
of conditions that contribute to or detract from the opportunity
to succeed with suburban express bus services.
35
Key contributing factors appear to be the following:
1. Real employer support: Although many projects are
begun with the knowledge and interest of the private
sector, in some cases supported by assurances of support,
those projects with better records of accomplishment are
those for which the private sector has contributed tangibly, with financial support either through direct subsidy
or employee-subsidized passes and nonfinancial support
with guaranteed ride home, flex-time, marketing and
promotion, and so forth. The need for employer support
is amplified for the peak-hour projects, which depend on
commuters and specific employers, and less important
for the all-day corridor routes, which serve a larger variety and generally more densely populated market. Planning projects with the private sector also contributes
noticeably to success.
2. Participatory planning and local support: Projects
that are planned with intended riders and/or sponsors
have a greater record of success than those initiated
and planned internally at a transit agency. Focus groups
and surveys of riders; service planning with employers
and projected riders; and participation among regional
agencies, TMAs, or other groups are all actions taken
to develop and promote new services.
3. Congestion and parking fees that make automobile
travel less attractive: There is a direct correlation
between ridership and the level of congestion and parking fees in the corridor for which the express service is
planned. Route 292 in Houston capitalizes on the high
cost of parking around the TMC; the Route 110 Clipper
uses an HOV lane to bypass heavy congestion on the
Long Island Expressway.
4. High density destinations: To obtain a reasonable
level of ridership, given that even in the best corridors
the transit share will be a fraction of the total travel market, there must be a sizable travel market from which to
draw. Therefore, the destination for the express bus service must be reasonably populated and fairly com-
5.
6.
7.
8.
pact—the number provides a base from which to draw,
and the density allows the operator to provide reasonable distribution times that do not detract from the overall time savings achieved on the express portion of the
trip.
Reasonably populated residential marketsheds:
Similarly, the collection end of the service must have a
reasonable population from which to draw riders. The
origins can be served either by the bus itself operating
in a collection mode, which works best in densely
developed neighborhoods, or via park-and-ride lots in
less dense areas.
Bus priority treatments: Bus priority treatments such
as HOV lanes (Figure 29) or queue bypasses at entrances
or toll booths allow express buses to save time over
single-occupant vehicles, increasing the attraction of the
bus service.
Supportive regional planning: Success often depends
on the support of regional plans for transportation and
economic development, policies that recognize transit
as a tool for long-term regional viability, and establishment of reasonable program goals and objectives.
Suburban transit service, taken as a whole, does not
achieve the levels of productivity and cost-effectiveness associated with urban services; however, these
services may contribute to regional goals for congestion reduction, air quality, and economic development.
Although unreasonable costs are unwarranted, lower
thresholds have been established in many areas for suburban services in recognition of their contributions to
these other aspects associated with the “quality of life”
in metropolitan areas.
Transit-dependent populations: The more successful express services are designed as much for the traditional transit-dependent markets as for the choice rider.
Depending solely on choice users, in the absence of
strict regulation or high parking fees and congestion,
does not produce the volume of riders needed to support
express bus service.
Figure 29. HOV lanes increase the attraction of express bus services in Long Island and San Diego.
36
9. Special equipment: Comfortable over-the-road coaches
with special equipment—individual lighting, cushioned
seats—are recognized as very important contributors to
successful peak commuter express services, especially
those that rely on the choice market for support.
Limited Routes
Description
Midway between local bus routes and express routes is
the category of limited routes. Limiteds operate in much the
same manner as the arterial expresses described above.
They are used to offer a higher level of service in heavily
traveled corridors, supplementing local bus services running along the same corridor. Limiteds use the same roadways as the local buses and achieve higher operating speeds
by reducing the number of stops along the route. The M5
service in Manhattan, operated by the New York City Transit Authority, is an urban example of the savings that can be
achieved between a local and limited service operating in
the same arterial corridor. Along 5th Avenue from 57th Street
to 14th Street in Midtown Manhattan, the local bus generally
stops at every third block, or approximately 15 times; in
the same section, the limited stops only 6 times. The travel
time savings in this 2-mi (3.2-km) section, associated with
fewer stops—including the time spent getting to and from the
curb, signal delays, and loading and unloading—can be as
much as 10 min. Passengers boarding and alighting at key
stop locations are provided with higher quality service, and
at the same time loads on heavily traveled local buses can be
reduced to acceptable levels. New riders are attracted by the
faster travel speeds.
not established to supplement existing local services but rather
to serve emerging patterns identified by planners.
As noted in the section on express buses, LI Bus, in its most
recent service development planning study, identified corridors
for limited-stop services connecting major suburban activity
centers to the New York City subway network in Eastern
Queens County. These corridors have significant travel in both
directions; limited routes would supplement the local services,
providing stops along the route at key activity nodes.
Performance Range
The performance range is derived from only two cases. In
data from 1996, Route 134 provided 96 passenger trips per
day, a rate of 5.3 passengers per trip. Route 133 performed
better, with 115 passenger trips per day at a rate of 9.6 passengers per trip. Both services operate well below the system
average of 20.73 passengers per trip for all suburban crosstown services, including locals and limiteds. However, ridership on both routes has nearly doubled over the past year,
from 53 daily riders for Route 134 and 64 riders for Route
133. Both are still below expectations for this type of service,
which were expected to approximate the system average for
crosstown services of about 20 passengers per trip.
Conditions of Effectiveness
Limited services are designed to provide faster travel times
for commuters than local bus services, thus making the transit option more attractive compared with the automobile during peak periods. Two planning factors appear important to
the successful implementation of limited services:
• Presence of successful local service: Although only lim-
Applicability
Corridors where limited services are applied need to be
densely developed with both significant numbers of residents
and multiple activity centers along the route. Local service
needs to be fairly dense and well utilized to justify the additional level of service offered. Limited services require concentrated activities at key locations along the local route. If
there are no concentrated stop locations along the local route,
or if most of the trips being made are relatively short, then the
limited service is not applicable to the route.
Only two suburban limited services, both from the Dallas
area, were identified in the case studies. These routes provide
limited-stop services to suburban employment centers. Route
134 connects transit centers in Plano, Richardson, Prestonwood, and North Irving, with local buses at each transit center serving as collectors/distributors. Route 133 connects the
South Garland transit center to the medical area of Dallas.
Route 134 was designed to provide reverse commute services
from Irving toward Richardson and Plano. The routes were
ited data are available from the case studies, it is apparent that limited services are more readily successful
when they are used to upgrade existing services instead
of to establish new services. DART is establishing a new
service, and although it has the potential for long-term
success, its slow growth pattern requires the patience to
let the market build. Where a market is already established, limited services have the potential for built-in
success with exiting riders, while choice riders are
marketed and attracted to the new service.
• Concentrated stop activity and long trips: Limiteds stop
only where there is significant activity. To have enough
activity to justify the service, the corridor being served
must have identifiable activity centers that will draw
sufficient ridership; furthermore, passengers going to
and from these centers need to come from far enough
away so that the use of limited service is practical.
Implementing limited service is largely a technical exercise related to travel patterns, trip densities, and other oper-
37
ating factors. It is easiest to do in established local corridors,
where load factors and travel times can readily establish the
justification for the service. Planning is less clear when new
services are being established and needs to be done slowly,
with sufficient data, and in concert with the public/target market. In new markets, good data on origin-destination patterns,
travel speeds, and complementing and competing services
are essential when laying out new services, followed by mar-
keting and development of public awareness. Planners must
understand how the service will operate and what kinds of
competitive advantages are offered over existing transit services and the single-occupant vehicle in order to accurately
estimate the demand for the service. Focus groups and other
outreach efforts taken in the planning phase of a project can
help direct the planning effort toward services that reflect
market desires.
GO TO CHAPTER 4
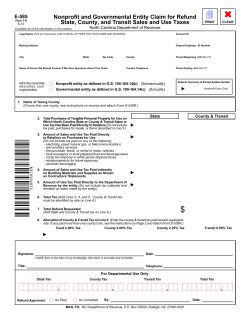


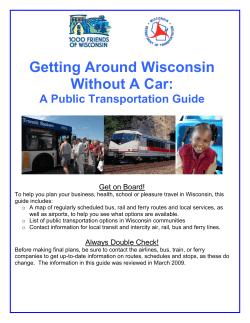


© Copyright 2026