
KU Leuven Case Study on apple supply chains in
Bernd Annaert, Jana Schwarz and Erik Mathijs – KU Leuven
Case Study on apple supply chains in Belgium (Task 3.5)
The research leading to these results has received funding from the European Union’s Seventh Framework
Programme for research, technological development and demonstration under grant agreement n° 311778
2015
To be quoted as:
Annaert B., Schwarz J., Mathijs E. (2014) Glamur project: case study on apple supply
chains in Belgium. KU Leuven, Belgium.
www.glamur.eu
2
Case Study on apple supply chains in Belgium
(Task 3.5)
Annaert B., Schwarz J., Mathijs E. – KU Leuven
www.glamur.eu
3
Summary
In this report we present a case study on apple supply chains. More specific, we present
a study on two different types of apple chains, a local one and a global one, through
which apples are being supplied to consumers in Flanders, a region in the north of
Belgium. The study was conducted within the framework of work package 3 of the
GLAMUR project. The case study on apples is part of the case study group ‘fruits and
vegetables’, which is one of the five groups defined in GLAMUR for which products are
being assessed (besides wine, pork, grains and dairy). Our direct partner within this
category is the ICTA research team of the UAB in Spain. Hence, the same research on
the performance on local and global apple supply chains will be carried out from a
Spanish perspective.
The general objective of this study is to evaluate and to compare the multi-dimensional
performance of the local and global apple supply chain. In particular, we are interested
in how both chains are contributing to economic development, on their use of resources
and their impact on the environment, on the fairness of distribution of costs and
benefits between actors in the chains and on labour conditions. The study uses both
quantitative and qualitative methods.
The global chain represents the most common practice. The apples are first cultivated in
commercial apple farms in Flanders based on integrated fruit production methods.
Afterwards they are transported to a cooperative auction where they are sorted, stored,
packed and sold. A big retailer buys the apples and transports them to its supermarkets
in Flanders. In the local chain, on the other hand, the apples are being cultivated on a
small scale organic farm and sold directly to a group of consumers through seasonal
fruit and vegetable baskets.
In a first step we identify main issues related to these local-global cases based on
insights from work package 2, a review of additional scientific and public documents and
interviews with actors in the chains. Critical issues are ‘the viability of the farm’,
‘pesticide hazard’ and ‘productivity’. Based on these three critical issues and we defined
5 research questions:
R1: What is the contribution of both chains to economic development in the region?
R2: How fair are costs and benefits distributed among actors in the chain?
R3: What is the difference in resource use between both chains?
R1: What is the difference in environmental pollution between both chains?
R5: Are there differences in labour conditions between the two chains?
Attributes and indicators were defined in order to evaluate the performance of the
selected chains and in order to answer the above presented research questions.
Our results suggest that the local chain contributes more to economic development in
terms of added value created along the chain and the creation of jobs. Farmers in the
local chain also receive a larger share (90 percent) of the price paid by the consumer
www.glamur.eu
4
compared to farmers in the global chain. The global chain was on the other hand more
land and labour productive and more efficient in terms of energy use. The global chain
has also a lower environmental impact when these impacts are expressed per kilogram.
In other words it is more efficient in terms of environmental pollution. But at the same
time the global chain is more intensive, which means that it has a greater impact than
the local chain when expressed per land unit. In other words, the global chains has a
greater environmental impact on a certain area than the local chain. We compared our
findings with previous studies on New Zealand apples imported to Europe. The main
conclusion from this comparison is that the NZ chain emits most greenhouse gasses and
depletes most fossil fuels because of the long distance that the apples have to travel
(more than 20 000 km by boat).
www.glamur.eu
5
Contents
1.
Summary ...........................................................................................................................................4
Introduction...................................................................................................................................8
1.1 General introduction ...........................................................................................................8
1.2 General presentation of the sectorial national context ....................................................9
2. Context of the case study ...................................................................................................... 10
2.1 Selection of a local and global chain: selection criteria and differences between
both chains ..................................................................................................................................... 10
2.2 Description of the global chain........................................................................................... 11
2.3 Description of the local chain............................................................................................. 14
2.4 Critical issues .......................................................................................................................... 15
2.4.1 Viability of the agricultural farm ............................................................................... 15
2.4.2 Pesticide hazard ........................................................................................................... 16
2.4.3 Productivity..................................................................................................................... 16
3 Research design ....................................................................................................................... 16
3.1 Research questions ................................................................................................................ 16
3.2 Selected Attributes and indicators ..................................................................................... 17
3.3 Selected Indicators ........................................................................................................... 19
3.4 Synoptic table........................................................................................................................ 20
4 Methods ..................................................................................................................................... 21
4.1 Methods of data collection.................................................................................................. 21
4.2 Methods of indicator calculation ........................................................................................ 22
4.2.1 Contribution to economic development ..................................................................... 22
Total added value ................................................................................................................... 22
Work created ........................................................................................................................... 23
4.2.2 Fair trade ....................................................................................................................... 23
Distribution of revenues .......................................................................................................... 23
4.2.3 Resource use ................................................................................................................... 24
Fossil energy efficiency .......................................................................................................... 24
Fossil energy intensity ............................................................................................................. 24
Land productivity ..................................................................................................................... 24
Labour productivity ................................................................................................................. 24
4.2.4 Pollution........................................................................................................................... 24
Greenhouse gas emissions...................................................................................................... 25
Pesticide hazard ...................................................................................................................... 25
Acidification .............................................................................................................................. 26
Eutrophication ........................................................................................................................... 26
4.2.5 Labour relations ........................................................................................................... 26
Work contracts ......................................................................................................................... 26
Working hours .......................................................................................................................... 27
5. Results and discussion .................................................................................................................. 27
5.1 Contribution to economic development ........................................................................ 28
Added value ............................................................................................................................. 28
Work created ........................................................................................................................... 28
www.glamur.eu
6
5.2 Fair trade ........................................................................................................................... 29
Distribution of revenues .......................................................................................................... 29
5.3 Resource Use ..................................................................................................................... 30
Fossil energy efficiency .......................................................................................................... 30
Fossil energy intensity ............................................................................................................. 30
Land Productivity ..................................................................................................................... 30
Labour productivity ................................................................................................................. 31
5.4 Pollution .............................................................................................................................. 31
Greenhouse gas emissions...................................................................................................... 31
Pesticide hazard ...................................................................................................................... 31
Acidification .............................................................................................................................. 31
Eutrophication ........................................................................................................................... 32
5.5 Labour relations ................................................................................................................ 32
5.6 Data quality check ................................................................................................................ 32
6. Comparing our findings with Apples from New Zealand .................................................... 34
7.
6.1 Description of the New Zealand apple chain ............................................................. 34
6.2 Critical issues .................................................................................................................... 35
6.2.1Competitive pressure on small family farms ............................................................. 35
6.2.2 Food miles ...................................................................................................................... 35
6.3 Comparison of performance .......................................................................................... 35
6.3.1. Contribution to economic development .................................................................... 36
6.3.2 Resource use ................................................................................................................... 36
6.3.3 Pollution........................................................................................................................... 37
General discussion (WP4) ...................................................................................................... 38
8. Conclusion ...................................................................................................................................... 38
9. References ..................................................................................................................................... 39
www.glamur.eu
7
1. Introduction
1.1 General introduction
An increasing number of European consumers is willing to apply sustainable food
consumption principles. Scientific research is needed in order to better inform these
consumers and other decision-makers on the performance and quality of existing food
supply chains. Scientists and other actors have recently claimed that local food chains
can be a solution to negative effects of the global food system (e.g. Pollan, 2006).
However, other actors argue that ‘local’ does not necessary mean better (e.g.
Desrochers, 2012). In GLAMUR we investigate and compare ‘local’ and ‘global’ food
chains and we evaluate the performance of food chains related to the health, social,
economic, environmental and ethical dimension. Insights from this research project will
be used to inform European policy makers and other decision-makers.
In this report we discuss the performance of apple supply chains. We focus on apples
that are being supplied to consumers in Flanders, a region in the north of Belgium. The
study was conducted within the framework of work package 3 of GLAMUR. In the
previous work package we have already explored different attributes that can be linked
to the performance of food supply chains (Annaert et al., 2014; Kirwan et al. 2014).
Indicators will now be linked to these attributes in order to evaluate and to compare the
chains under study.
The case study on apples is part of the case study group ‘fruits and vegetables’, which is
one of the five groups defined in GLAMUR for which products are being assessed
(besides wine, pork, grains and dairy). Our direct partner within this category is Spain.
Hence, the same research on the performance on local and global apple supply chains
will be carried out from a Spanish perspective. This will enable a comparison between
the two countries which will be made in a report of work package 4. Other case studies
from the fruits and vegetable sector are carried out on blueberries (assessed in Latvia),
raspberries (assessed in Serbia) and asparagus chains (assessed by our own team in
Belgium and Peru).
The general objective of the present study is to evaluate and to compare the
performance of apple supply chains from a Flemish perspective. In particular, we are
interested in how chains are contributing to economic development, on their use of
resources and their impact on the environment, on the fairness of distribution of costs
and benefits between chain actors and on labour conditions. The study uses both
quantitative and qualitative methods.
In the next paragraph we first give a brief presentation of the fruit and apple sector in
Flanders. Afterwards we present the local and global chain under study and the main
differences between both chains in more detail. The subsequent chapters discuss the
main issues that are relevant when comparing the performance of our local and global
www.glamur.eu
8
chain and the attributes and indicators that are linked to these critical issues. The fourth
chapter describes how the data was gathered and how indicators were calculated.
Afterwards the results are presented and discussed. In the sixth chapter we will
compare our findings with previous studies on imported apples from New Zealand. The
last chapter will present the main conclusions of this study.
1.2 General presentation of the sectorial national context
The fruit production sector in Flanders covers approximately 16000 hectares. This is one
percent of the total area of Flanders and 2.5 percent of the total agricultural area
(ADSEI, 2011). The extent of this area has remained constant since the end of the
nineties. The biggest share is allocated to open air apple and pear production.
Most apple cultivators are located in the south-east of Flanders, a region called
‘Haspengauw’. They generated in 2010 a total added value of 110 million Euros
(ADSEI,2011). This was 30 % of the total fruit sector and 7 % of the total agricultural
sector in Flanders.
The farmers are mainly cultivating apples, sometimes in combination with pears. They
cultivate different apple cultivars. The ‘Jonagold’ cultivar is the most common one.
Plantations with Jonagold apples and Jonagold mutants are covering more than 60 % of
the total area on which apples are being produced (ADSEI, 2011). Other important
cultivars are ‘Golden delicious’, ‘boskoop’, and ‘Elstar’. Most companies have only one
fixed worker, possibly supported by one or more family members. There is however a
lot of seasonal work on the farms, especially during the harvest period in September
and October.
The largest amount of apples is, as in the case of most horticultural products in Flanders,
sold through a cooperative auction. Several auctions exist in Flanders. The biggest one in
the fruit sector is the ‘Belgium fruit auction’. Other important auctions are ‘de
Limburgse tuinbouwveiling’, ‘Belorta’, and ‘veiling Haspengauw’. There used to be more
auctions but many of them have merged into bigger ones during the last decades. The
main objective of these auctions is to lower the operational costs of farmers by sharing
the costs for sorting, cooling, storing and selling. All auctions are organized into an
association (VBT). This had led to increased transparency in price formation.
The best quality apples are sold at the national market. Big retail groups are buying
them at the auctions and sell them in their supermarkets. The three biggest retailers in
the Belgian national market are Colruyt, Delhaize and Carrefour. They represent more
than 70 % of the market share. Delhaize and Colruyt are Belgian companies, Carrefour is
a French multinational.
A large share of apples is also exported. The country that is importing the biggest
quantity of apples is the Netherlands (64 million kg in 2010). Germany (46.1 million kg)
and Russia (46.7 million) are also in the top three of importing countries. The recent ban
on agricultural products by Russia had a huge impact on the sector. A big part of the
apples were not harvested this year because the harvesting costs were too high
www.glamur.eu
9
compared to the revenues. However, the farmers have been granted compensation
from the European Union for the lost revenues due to the Russia ban.
2. Context of the case study
2.1 Selection of a local and global chain: selection criteria and differences
between both chains
In the next parts of this report we discuss the performance of two specific chains. We
have defined one chain as being ‘local’ and the other one as being ‘global’, especially
based on their production method and their distribution method. The global chain
represents the most common practice in Flanders, that is, the apples are produced
based on integrated fruit production methods and sold through the auction and
supermarkets across Flanders. So, although we defined the chain as being ‘global’, we
only consider stages of the chain in Flanders four our performance assessment. A part of
these apples are however also exported to other countries. Second, in the local chain
the apples are being produced organically and sold directly to a group of consumers
through seasonal fruit and vegetable baskets. This is summarized in table 1.
Table 1. Conceptualization of the local and global chain
Production
Integrated apple production
Organic apple production
Distribution
Long (auction + supermarket)
Global chain
Short (direct selling)
Local chain
Both chains are supplying fresh Jonagold apples. As mentioned in the paragraph above it
is the most produced cultivar in Flanders. Hence, the local and global apples look very
similar, nevertheless there are differences in how these apples were produced and how
they reach the consumer. The local chain is more embedded in a certain territory and
ecosystem whereas the apples in the global chain are more commodified. We are
interested in the influence of this difference on the performance of both chains.
Before giving a more detailed description of the local and global chain, we will first
discuss them in relation to four global/local dimensions that have been identified in the
GLAMUR project. These four dimensions are: physical/geographical distance;
governance and organization issues; the kind of resource, knowledge and technologies
employed in the production process; the role of territory in defining the identity of the
product.
www.glamur.eu
10
Physical / geographical distance
The distance between producers and consumers in the global chain is larger than the
one in the local chain. The main stages (farm, auction, retail) of the global chain are
located across the region of Flanders while the stages of the local chain (farm,
distribution) are located much closer to each other, often at less than 20 km.
Governance and organization issues
The global and the local chain are organized in different ways. There is a more personal
and direct relation between the producer and the consumer in the local chain. This
relation is based on trust and solidarity. Producers in global chains do not have this bond
with the consumers, communication between them occurs via labels and information on
the product. Another important difference is that producers in the global chain are
working together through cooperative auctions to lower the working costs and to stay
competitive on the national and international markets. This is not the case for the
producer in the local chain.
The kind of resources, knowledge and technologies employed in the production process
The methods of production in the two chains are different. The most common practice
for producers in the global chain is to cultivate the Jonagold apple with integrated fruit
production techniques. Integrated production is defined as "an economically
responsible production of quality fruit, where preference is given to cultivation methods
that are more environmentally friendly, with a minimal use of chemical substances, and
where the undesirable side effects are limited in order to protect the environment and
human health" (Flemish Government, 2004).
The most common practice in the local case is organic production. Therefore, they are
not using herbicides and they are limiting the use of inorganic fertilizers. In that sense it
goes a step further than the global farmers in protecting the ecosystem and maintaining
the local environmental quality.
The role of territory in defining the identity of the product.
Throughout history horticulture has always been an important part of the territory of
Flanders because of the good quality of the soils in the regions where the apples are
grown. Apples are therefore perceived by many as a regional product. This is
emphasized in the global chain by the ‘Flandria’ label. The best quality apples are sold
under this label in national and international markets.
2.2 Description of the global chain
There are around 400 apple cultivators at the basis of the global chain that we have
been evaluating. They all supply apples to the Belgian fruit auction, the biggest fruit
auction in Flanders with a market share of more than 50 percent. The large majority of
farmers is using integrated fruit production techniques to grow the apples. They harvest
www.glamur.eu
11
the apples in the months September and October. Most farmers harvest three times.
Apples with a good red color are harvested during the first harvest, the other apples
stay a little longer on the trees and are harvested during the second or third time.
Apples that are damaged are not harvested. They will fall from the tree and they will
nourish the soil. Seasonal labour is needed to harvest the apples. Most of these
seasonal workers are coming from Romania, Poland and Bulgaria. Apple farmers need to
register every seasonal worker. The government is conducting at least once a year
controls to see if the farmer is respecting the labour conditions.
The farmers are also cultivating according to environmental and food safety standards
which are imposed by retailers, the government and the fruit auction. Two independent
control organisms perform controls at the farm: ‘TUV Nord Integra’ and ‘SGS’. The
apples are also controlled when they arrive at the Belgian fruit auction.
Most farmers stay up to date with the latest production techniques through the
research centre ‘Proefcentrum fruitteelt’. This research centre delivers advanced
knowledge on integrated fruit production techniques.
After harvest, the apples are transported by the farmers to the Belgian fruit auction,
mostly using tractors with an open load. The apples are thus not cooled during
transport. The load capacity is between 9 and 14 tonnes. When the apples arrive at the
fruit auction, they are first pre cooled in transit refrigerators until they reach a
temperature of 4°C. Afterwards they go in ULO (ultra low oxygen) cool cells with a
temperature of 1°C. The apples stay in the cells until they are sold.
The Belgian Fruit auction started in 1952 with 34 members and after several mergers
with other cooperative auctions it became an important international player with more
than 1500 members. Today it has 4 separate sites located in Flanders, in order to be
close to all the farms that supply fruit products to them. The four sites are:
- The main office in the city of Sint-Truiden where delivery, sales, packing and
administration take place
- A second site in the village Glabbeek with delivery, packing and cooling
- A hypermodern cooling centre in the village Zoutleeuw
- Another cooling installation In the village Hannuit
When a cooling cell is opened, often the total content of it is sold. But before selling, the
apples are first sorted. This occurs with an intelligent quality sorting system (IQS) and
modern machines. The machines sort 15 tonnes of apples per hour based on size,
weight and colour. Every apple is photographed 72 times during the sorting. In that way
it is even possible to trace back the origin of every apple. Water is being reused during
sorting.
After sorting, the quality of the apples is controlled and approved by people from the
auction. Then they are packed and presented to buyers at the auction. Buyers can come
two times a week to the auction where they gather in the sales room. In this room the
price of the apples is shown on a big clock. The price decreases until one of the buyers
pushes a button meaning that he buys the apples for that price. When the price
www.glamur.eu
12
decreases too much, the apples are removed and later they will be sold again. If the
apples are still not sold the second time, one can choose to sell them to the processing
industry. In that case the farmer will receive a smaller amount of money for his produce.
Lower quality apples go the processing industry. On average 25 percent of the apples at
the Belgian fruit auction go there. If the quality of the apples is too bad for the
processing industry there are two options: or they are spread again on the fields, or they
go to a biogas installation.
In our global case study the apples are bought at the auction by Colruyt, one of the
three big retailers in Belgium next to Delhaize and Carrefour. Then they are transported
to the national distribution centre of Colruyt in Halle. The apples are not cooled during
this transport and it takes on average one hour to transport them from the auction to
Halle, a distance of 100 km. The apples are stored maximum 2 days in the national
distribution centre of Colruyt in a refrigerated space. From there they are transported to
the supermarket stores in Flanders. The different stages of the chain are presented
briefly in figure 2.
Figure 2: Main stages of the global chain
The most important stakeholders are presented in figure 3 : the farmers, the Belgian
fruit auction (BFV), the retail group Colruyt, consumers, the control organisms SGS, TUV
Nord Integra and FAVV (the Federal Food Safety Agency) and the research centre PC
fruit (Proefcentrum fruitteelt). The blue arrows indicate a trade relation, for instance
between BFV, Colruyt and consumers. The light blue arrow between farmers and BFV
indicates that farmers are members of the auction. The green arrows indicate a control
www.glamur.eu
13
relation, and the orange arrows a collaboration relation. TUV Nord Integra and SGS are
two independent control organisms that collaborate with BFV to carry out controls at
the farm stage. The research centre PC fruit collaborates with the farmers and BFV to
deliver advanced knowledge on fruit production techniques. FAVV carries out food
safety controls at different stages of the chain.
Figure 3: Main stakeholders in the global chain
2.3 Description of the local chain
There exists a very small community of 15 organic apple farmers in Flanders (Van
Eykeren, personal communication, 2013). They gather several times a year to exchange
knowledge and most of them sell apples through the auction and through direct selling
to consumers. We are interested in the latter marketing channel and in the differences
between this local type of chain and the global chain that we have described above.
The apples in the local chain are also harvested in the months of September and
October. Just as in the global chain, there are seasonal workers working on the farms.
The apples are sold directly to consumers who are organized in so called ‘food teams’.
These teams exist of on average 20 households that work together to buy fresh food
products directly from local producers. The team of consumers can order its products
through the web shop of the association ‘Food teams’. This umbrella association gathers
all the food teams across Flanders and supports the creation of new teams. The
association started in 1996 And since that year the number of members has been
increasing. Today 167 food teams exist in Flanders.
Before reaching the food team the apples are first transported to a central farm where
they are put in baskets together with other fruits and vegetables from other local
www.glamur.eu
14
producers. The baskets are transported afterwards to a depot owned by the specific
food team. This can be for example the garage of one of the food team members.
Members of the food team collect their food basket including the apples every week at
the local storage room. The households go to the storage room and collect the baskets
themselves. We assume that apples are transported with a small van, with a load
capacity of on average 300 kg.
The main stages of the local chain are presented in figure 4.
Figure 4: Main stages of the local chain
2.4 Critical issues
Different important issues related to the local-global debate came out of the discourse
analysis conducted for work package 2. This however was an analysis focusing on the
total food system in Flanders. Thus, we analysed additional scientific and public
documents focusing on the apple sector and performed interviews with actors in the
chains. The resulting main issues are the viability of the agricultural farm, pesticide
hazard and productivity which are further explained in the next paragraphs.
2.4.1 Viability of the agricultural farm
The number of apple producers in the global chain has been decreasing in recent years.
As in most agricultural sectors farmers are encountering difficulties to stay profitable
and competitive on the national and international markets. Farmers demand a correct
and viable price for their products. In other words, they demand that costs and benefits
are fairly distributed among actors at the different stages of the chain (farm, auction,
retail, consumption). Flemish farmers in global chains have the perception that this is
not always the case (Annaert et al., 2014).
The price farmers receive when selling directly to local consumers is less influenced by
events on the international markets. Hence, farmers have freedom to set a fair price.
Because of this reason the local farm is sometimes being perceived to be more viable
(Annaert et al., 2014). However, it takes time to build a local network so viability can be
a problem at the beginning when farmers switch to direct selling. Moreover, some
operational costs are not shared in the case of direct selling as opposed to the global
chain (where farmers are organized in cooperative auctions), so they are less cost
efficient. Hence, local chains are being perceived by some actors in global chains as
adopting less efficient methods and measures and hence being less profitable (Annaert
et al., 2014).
The viability issue was also discussed in the Flemish report of work package 2 in relation
to the attribute that we have defined as ‘fair distribution of costs and benefits’. In the
www.glamur.eu
15
comparative European report of work package 2 the issue is being discussed within the
attributes ‘profitability/competitiveness’ and ‘fair trade’.
2.4.2 Pesticide hazard
Pesticide use is an important issue in the Flemish fruit production sector and also
relevant for the comparison of our chains because both chains use different cultivation
techniques and hence their use of pesticides is also different. Pesticide use can be toxic
for the environment, the workers on the field and the insects and animals in and around
the field. Fruit producers in Flanders perceive this issue as the main environmental
threat (De Meyer, 2012). According to the farmers in the study of De Meyer et al. (2012)
the limitation of the quantity of pesticides and the reduction of drift to surroundings are
important steps to take in the future. Pesticide use is also related to food safety, an
important issue for the Federal government since the dioxin crisis in the nineties hence,
there are severe controls performed by the federal agency for food safety. They control
the use of pesticides and residues on the final products. Every pesticide has an allowable
dose and since the European REACH (registration, evaluation, authorisation and
restriction of chemicals) reglementation there is a more severe control on the products
that are entering the market. A critique from NGO’s is that the effects of combining
different pesticides and the long term effects on human health are unknown. Organic
farms have a stricter list of fungicides and insecticides that they can use compared to
integrated apple production. Organic farms also do not use herbicides.
2.4.3 Productivity
Agricultural production methods are often very intensive in Flanders because of the
limited area of farmland. As well in the horticultural and fruit production sector. Hence,
productivity has been identified as an important food chain performance issue by
Flemish actors from public, policy, scientific and market spheres in the discourse
analysis of work package 2 (Annaert et al., 2014). This especially because of economic
reasons and concerns about food security.
3 Research design
3.1 Research questions
There are three overall research questions in the project GLAMUR:
1. What are the key food chain performance issues with regards to a global-local
comparison?
www.glamur.eu
16
2. What is the methodological strength and weakness of overall applied pairwise
comparative analysis?
3. What are the specific interactions of the food chains under study and the policy
settings?
In addition, we have defined several specific research questions for the apple case study
based on the insights of work package 2 and previous exploratory research. Some of
these questions are related to the critical issues presented in the previous paragraph.
Others are related to the more general debate on local and global chains. The five
specific research questions are presented below.
R1: What is the contribution of both chains to economic development in the region?
R2: How fair are costs and benefits distributed among actors in the chain?
R3: What is the difference in resource use between both chains?
R1: What is the difference in environmental pollution between both chains?
R5: Are there differences in labour conditions between the two chains?
3.2 Selected attributes and indicators
The comparative report of work package 2 presents a list of 24 attributes that are
related the performance of food chains in Europe (Kirwan et al., 2014). From this list we
have selected some attributes that are relevant for the present case study. The selection
was made based on insights from the national discourse analysis, interviews with
stakeholders and existing studies. An important study on which we have based our
selection is a recent study on the sustainability of Flemish fruit farms performed by De
Meyer et al. (2012). This study has used participatory approaches to identify main
criteria for the evaluation of the sustainability of fruit farms in Flanders. To identify the
most important criteria in the environmental dimension we have reviewed existing LCA
studies on apples (e.g. Blanke et al., 2005; Mila I canals et al., 2005; Edwards-Jones et
al., 2008, Alaphilippe et al., 2013). Findings from these studies were discussed with the
interviewed stakeholders.
The selected attributes are presented below. These relate to our research questions and
each attribute is represented by a set of indicators that are shortly mentioned below
and will be discussed in detail in section 3.3.
www.glamur.eu
17
Contribution to economic development
This attribute has been defined in work package 2 as “the contribution that food supply
chains can make to economic development at a national, regional and local level”
(Kirwan et al., 2014). It is clearly linked to the economic dimension of food chain
performance. In our assessment we will concentrate on the added value of the food
chains and the jobs that they create in the region.
Labour relations
This attribute covers “worker-related social issues” (Kirwan et al., 2014). In the case of
apple chains it will especially be discussed in relation to seasonal work. We will
investigate the difference in seasonal work conditions between the local and the global
chain. It is related to the social and ethical dimension.
Resource use
This attribute was defined in WP2 as “the use and management of the resources used to
make food” (Kirwan et al., 2014). We will focus on energy, labour and land resources
and investigate to what extend there are differences in resource use between the local
and global chain. These resources are necessary factors to sustain the food chains.
Hence, they also demonstrate in a certain way the resilience of the food chains. The
attribute is related both to the environmental and the economic dimension.
Pollution
Pollution encompasses any input into the natural environment which causes adverse
changes to ecosystems. This attribute covers the different forms of pollution which may be
caused by food supply chains - for instance, water, soil and/or air pollution through greenhouse gas emissions and/or the use of chemicals in fertilization processes, which may cause
disruption to ecosystems (Kirwan et al., 2014). The attribute is clearly linked to the
environmental dimension and to a lesser extent also to the health dimension. It is closely
related to the attribute ‘biodiversity’.
Fair trade
Under this attribute we understand a fair distribution of costs and benefits between
actors in the food chain. Especially farmers are often complaining about high costs and
low benefits compared to other actors in the chain. We will investigate if and how this is
www.glamur.eu
18
different for the global and the local chain. This attribute belongs to the social
dimension.
3.3
Selected Indicators
Based on the attributes and the related research questions we have defined a set of
indicators that will ultimately be used to assess and compare the performance of the
apple supply chains. The indicators are presented in table 2.
Most indicators are adapted from existing impact assessment methods. We have
especially used indicators from three sources: the Musiasem approach (Giampietro,
2009; Life cycle analysis (ISO..) and the SAFA guidelines (FAO, 2013a and FAO, 2013b).
The selected indicators are presented below in table 2. The table includes the name and
description of each indicators, the unit and the source of the indicator. The indicators
are sorted according to the attribute they belong to. A description of how indicators
were calculated is given in the paragraph following the table.
Table 2: Description of the selected performance indicators
Attribute
Indicator name Indicator description
Total added
The difference between the sum of all revenues
Contribution
value
in the chain and the sum of the non factor costs
to economic
in the chain, expressed per ton of apples
development
Work created Work hours created in the whole chain per ton of
apples
Distribution of Price received by the producer compared to the
Fair trade
revenues
price paid by the consumer
Fossil energy
Use of direct and indirect fossil energy in the
efficiency
total chain per tonne of apples. Direct fossil
energy use includes fuel use for transport and
machinery; indirect fossil energy includes fossil
energy use for the production of fertilizers,
pesticides and electricity
Fossil energy
Use of direct and indirect fossil energy at farm
Resource use
intensity
stage per land unit. Direct fossil energy use
includes fuel use for machinery; indirect fossil
energy includes fossil energy use for the
production of fertilizers and pesticides.
Labour
Total kilograms of apples produced per labour
productivity
unit at farm stage
Land
Total kilograms of apples produced per land use
productivity
unit at farm stage
GHG emissions Total emissions of greenhouse gasses in the
Pollution
chain. Direct emissions from field operations,
cooling and transport are taken into account.
Indirect emissions from fertilizer and pesticide
www.glamur.eu
Unit
€/t
Source
GLAMUR
h/t
Musiasem
%
GLAMUR
MJ/kg
LCA
GJ/ha
Musiasem/
LCA
kg/h
Musiasem
kg/ha
Musiasem
g CO2
eq./kg
LCA
19
Labour
relations
production are also included.
Pesticide
Toxicity caused by the use of pesticides at the
hazard
farm stage. Toxicity factors are taken from
Kovach et al (1992). Impacts on the environment,
farm workers and consumers are included.
Eutrophication Total contribution to eutrophication at farm
stage stemming from emissions related to
fertilizer use (losses of phosphorus and leaching
and volatilization of nitrogen)
Acidification
Contributions to acidiphication at farm stage
stemming from emissions of sulphur oxides and
nitrogen oxide related to machinery use and
ammonia emissions related to fertilizer use.
Work contracts Shares of workers who have a legally binding
work contract and no vulnerable employment
Working hours Percentage of workforce whose working time
arrangements are fully compliant to the
standards of the International Labour
Organisation (ILO)
EIQ/ha
LCA
g PO43eq./kg
LCA
g SO2
eq./kg
LCA
%
SAFA
(adapted)
SAFA
(adapted)
%
3.4 Synoptic table
Table 3 gives an overview of the research questions that we have defined and the
attributes and indicators that were chosen in order to evaluate the performance of both
chains. In addition, we give a first overview of the data collection methods that were
used to gather data to calculate the indicators.
Table 3: Synoptic table with research questions, selected attributes and indicators and data collection methods.
Dimension
Attribute
Economic
Contribution to
economic
development
Social
Fair trade
Economic/
Environment
Resource use
www.glamur.eu
Brief attribute
description (cf.
Comparative
Report)
“the contribution
that food supply
chains can make to
economic
development at a
national, regional
and local level”
“the extent to
which individual
actors are achieving
a fair return for
their contribution”
“use and
management of the
resources used to
make food”
Used indicators
Research questions
Data collection methods
• Total added value
per tonne apples
• Work created
1
• Interview with local
farmer
• Review of company
accountings
• FADN data
• Distribution of
revenues
2
• Interview with local
farmer
• Review of accounting
studies
• Fossil energy use
per ha harvest
year
• Fossil energy use
per kg of apples
3
• Review of FADN data
• Interviews with local
farmers
• Review
of
general
statistics
20
• Land productivity
• Labour
productivity
Environment
/ Health
Pollution
“any input into the
natural
environment which
causes adverse
changes to
ecosystems”
• Pesticide hazard
• Greenhouse gas
emissions
• Eutrophication
potential
• Acidification
potential
4
Social
Labour relations
“worker-related
social issues”
• Seasonal work
contracts
• Wage payments
• Working hours
5
• Interview with auction
representatives
• Interview with retail
representatives
• Review of FADN data
• Interview with auction
representative
• Interview with retail
representative
• Review
of
existing
studies
• Review of existing
publications
• Interview with local
farmer
• Interview with farmer
union representative
4 Methods
4.1 Methods of data collection
We have used several methods to gather data in order to calculate the performance
indicators. First, we conducted qualitative unstructured interviews with actors and
stakeholders of the chain. More specific, we have interviewed farmers both from local
and global chains and representatives of the Belgian fruit auction and Colruyt. We have
also interviewed a representative from ‘Boerenbond’, the biggest farmer union in
Flanders. These qualitative unstructured interviews gave a good insight in the different
stages of the chain and the critical issues.
Second, we gathered specific quantitative data related to the farm stage. We received
this data from the Regional department of Fisheries and Agriculture. The data belongs to
the farm accountancy data network (FADN). We could gather data both for integrated
fruit farmers as well as for organic fruit farmers. Of course, the number of integrated
fruit farmers is larger than the number of organic apple farmers. We analyzed data on
inputs used (fertilizers, pesticides, energy carriers), labour hours, revenues, land use and
the produced amount of Jonagold apples. This was done for three growing seasons
(2010-2012). The sample with integrated apple farms existed of 50 farms with in total
97 plots. The organic sample exists of only 3 farms with in total 5 plots.
Third, we collected additional quantitative data from key respondents and company
accountings. Useful data was also found in annual reports of the Belgian fruit auction
and Colruyt, in existing regional agricultural statistics and in scientific studies.
The different data collection methods and target respondents are summarized in table
4.
www.glamur.eu
21
Table 4: Data collection methods and target respondents.
Data Collection Method
Target Respondents / Information Source
Qualitative unstructured
interviews
•
•
•
•
Farmers
Auction representative
Actors from the retail group
Actors from the farmer union
Collection of quantitative data
from key respondents and
company accountings
•
•
•
Farmers
Retail group
Auction representative
General quantitative data from
existing databases and annual
reports
•
•
Regional agricultural statistics (from the department
of agriculture and fisheries)
Year reports from the retailer and auction in the chain
Collection and analysis of
primary FADN data
Literature and document
review
•
The Flemish department of agriculture and fisheries
•
•
Scientific studies
Reports on the state of the agrifood system in Flanders
4.2 Methods of indicator calculation
4.2.1 Contribution to economic development
Total added value
The added value expresses the essence of producing and processing, i.e. adding value to
a product. It is created in the global chain at three different stages: the farm stage, the
auction stage and the retail stage. We have summed the added value created at the
different stages to obtain the total added value of the chain. In the local chain added
value is created at only one stage: the farm stage.
We compare the total added value of the global chain with the added value of the local
chain in order to understand how much value they both add to the Flemish economy. In
the calculations we include revenues from sales and operational costs. Operational costs
are costs for inputs and at the farm stage we include energy costs, pesticide costs,
fertilizer costs, post-harvest-and sales costs and maintaining costs related to machinery.
Values for the global chain are taken from Van Broekhoven et al. (2010) in which
average costs and revenues were calculated for a sample of 59 farms. The added value
www.glamur.eu
22
created at the farm stage in the local chain is calculated based on the accountings of
only one local farm which is the only farm from which we could receive accounting data.
Because of limited data availability and the necessity of comparison between the two
chains we only consider accounting data for the year 2008.
Added value created at the auction stage (in the global chain) is calculated by
subtracting the auction’s operational costs from the revenues and then multiplying this
amount by the share in weight of Jonagold apples at the auction. The costs and
revenues were taken from the accountings of the Belgian fruit auction for the same year
(2008) as data from the farm stage.
Added value at the retail stage was estimated by multiplying the consumer price index
of Jonagold apples in 2008 with the profit margin of Colruyt in 2008.
Work created
The total labour hours per tonne of apples in the two chains are calculated as a proxy
for the number of jobs generated in the chain. For the global chain we include the
labour hours needed for cultivating the apples during one growing season, labor hours
needed to transport the apples (from farm to auction, from auction to distribution
centre and from distribution centre to supermarket) and labour hours to control, to
sort, to store and to pack the apples at the auction.
Calculation of total labour hours in the local chain included labour needed for cultivation
during one growing season and labour needed for distributing the apples to the food
team members (transport from the farm to the central farm and from the central farm
to the food team store included).
Average labour hours at the farms stage were calculated based on the FADN database.
This average value was calculated from the organic farmers sample (3 farms with in total
5 orchards) and integrated farmers sample (50 integrated farms with in total 97
orchards) for three growing seasons (2010-2012).
Labour hours needed during distribution were estimated based on interviews with chain
actors.
4.2.2 Fair trade
Distribution of revenues
The indicator ‘distribution of revenues’ compares the price received by the producer to
the price paid by the consumer for a certain amount of Jonagold apples.
We calculate this indicator for the global chain by dividing the average consumer price
of apples for 2008 by the average price received by farmers in the same yearas
calculated by Van Broekhoven et al. (2010) for a sample of 59 farmers.
For the local chain we calculate this indicator based on the farm accountings and
interviews.
www.glamur.eu
23
4.2.3 Resource use
Fossil energy efficiency
Fossil energy efficiency is expressed in Mega joules per kilogram of apples. It is used to
study how much fossil energy is being consumed over the chain to produce a certain
amount of apples. Both direct and indirect forms of energy use are included in the
calculation. Direct energy is being consumed at the farm stage during field operations
and during transport, and during stocking, cooling, sorting and transport at the other
stages of the chain. We considered 100 days of cooling for both chain as this can be
assumed as the average(Karel Belmans, personal communication, 2014). Indirect
energy is consumed to produce and supply fertilizers and pesticides. Coefficiënts to
convert quantities of inputs into amounts of embedded energy were taken from the
ecoinvent database, following a life cycle analysis (LCA) approach. More information
about this approach will be given in the paragraph on environmental pollution.
Fossil energy intensity
The second indicator is fossil energy intensity which refers to the fossil energy use at the
farm stage per unit of land. It demonstrates how energy intense a farmer is cultivating
on a certain area. Also for this indicator we included direct and indirect energy.
Land productivity
Land productivity refers only to the farm stage. It is expressed as kilogram of apples
produced per hectare. We took the average value for the 291 observations in our
sample of integrated farmers (50 farmers cultivating 97 orchards and observation for
the growing seasons 2010-2012). In the same way we calculated the average value for
the organic sample (15 observations: 3 farmers, 5 orchards, growing seasons 20102012).
Labour productivity
The second indicator is labour productivity. It is defined as the total amount of apples
that is produced per hour of labour input and is expressed as kilogram apples per hour.
We included also the distribution stage in this calculation (auction and retail for the
global market and preparation and distribution of baskets in the local chain). Average
values related to the farm stage were calculated based on the FADN database in the
same way as described above for ‘land productivity’. Values for the other stages were
estimated based on interviews.
4.2.4 Pollution
www.glamur.eu
24
Indicators related to the attribute ‘pollution’ were calculated based on the life cycle
analysis (LCA) method. This method is used to analyse the environmental impact that a
certain product has from his cradle to his grave. The environmental impact of our apples
was calculated from the moment that they are cultivated at the farm stage until they
reach the supermarket shelf. The analysis was performed according to the ISO 14044
framework (ISO,2006). The four typical steps of an LCA that are described in this
framework were followed: goal and scope of the study, life cycle inventory, impact
assessment and interpretation of the results. Four indicators were calculated in this
way: greenhouse gas emissions; Pesticide hazard; Acidification and Eutrophication.
Data related to the farm stage was obtained through the FADN database. The different
pollution indicators were calculated at this stage for the 291 observations of the
integrated group (97 orchards, growing seasons 2010-2012) and 15 observations of the
organic group (5 orchards, growing seasons 2010-2012). Data related to the other stages
of the chain were obtained through interviews.
Greenhouse gas emissions
Greenhouse gases are emitted in the chain mainly due to energy use and fertilizer use.
Energy is used for machinery, for cooling and for transport. Indirect energy use for the
production and supply of fertilizers and pesticides is also taken into account. Fertilizers
are contributing to greenhouse gas emissions at the farm stage. A major contribution is
made through nitrogen application through which N2O is emitted, an important
greenhouse gas.
For the farm stage we calculated greenhouse gas emissions based on the FADN
database. This database includes energy, fertilizer and pesticide inputs used in the
organic and integrated orchards. Emissions related to these inputs were calculated by
using characterisation factors. These factors were taken from IPCC (2006). Factors for
the calculation of indirect emissions were taken from Lal et al. (2004).
We calculated greenhouse gas emissions for each of our observations and then built
average values for the organic and integrated group.
Greenhouse gas emissions related to the other stages are mainly due to energy use
during cooling, sorting and transport. Data on these inputs, gathered through interviews
with actors, was also converted into greenhouse gas emissions by using factors from
IPCC (2006).
The Greenhouse gas emissions are expressed as CO2 equivalents per kilogram of apples.
Pesticide hazard
Pesticide hazard refers to the toxicity impact on the environment caused by pesticides.
The indicator is only referring to the farm stage. Data on the type and amount of
pesticides used in the integrated and organic farms were taken from the FADN database
for the growing seasons 2010-2012 (see section 4.2). For every orchard we multiplied
www.glamur.eu
25
the active ingredients of the different pesticides with toxicity factors. These factors were
taken from Kovach et al. (1992). They are constructed based on the toxicity that active
ingredients cause on farmworkers, consumers and the local ecosystem. The toxicity is
expressed as an environmental impact quotient which can only be used for relative
comparisons. The absolute values do not have a useful meaning.
Toxicity is expressed as environmental impact quotient per per kilogram of apples.
Acidification
Acidification of the environment is mainly caused through fuel use (during field
operations and transport) and fertilizer use. Fuel combustion emits sulphur oxides and
nitrogen oxide. Fertilizers are emitting ammonia. Emitting factors were taken from FAO
(2001). Data on fuel use and, fertilizer use were obtained through the FADN database
and interviews.
Acidification potential is expressed in SO2 equivalents per kilogram of apples.
Eutrophication
Eutrophication is the ecosystem response to the addition of artificial or natural
substances, mainly phosphates, through detergents, fertilizers, or sewage, to an aquatic
system (Shindler, 2004). It stems mainly from emissions related to fertilizer use (e.g.
losses of phosphor and leaching and volatilization of nitrogen). Characterisation factors
were taken from FAO (2001), IPCC (2006) and Jensen et al. (1997).
Eutrophication potential is expressed in PO4 equivalents per kilogram of apples.
4.2.5 Labour relations
The indicators that are related to the attribute ‘labour relations’ were adapted from
SAFA (FAO, 2012).
SAFA provides a holistic framework for the sustainability assessment of food and
agricultural supply chains. Within the SAFA framework, a set of 118 indicators related to
four broad dimensions of sustainability (good governance, environmental integrity,
economic resilience, social wellbeing) were developed. These four broad dimensions are
subdivided into 4-6 universal themes per dimension and furthermore detailed into subthemes with associated sustainability objectives. For example, in the dimension “social
wellbeing”, one theme is called “decent livelihood” and the sub-theme “quality of live”.
We have adapted two SAFA indicators from the dimension “social wellbeing” to study
the labour relations in the two chains.
Work contracts
The indicator work contracts is defined as ‘the share of workers who have a legally
binding work contract and no vulnerable employment’ (FAO, 2013).
www.glamur.eu
26
Working hours
The indicator working hours is defined in SAFA as ‘the percentage of workforce whose
working time arrangements are fully compliant to the standards of the international
labour organisation (ILO)’. Studying labour relations in apple farms is especially relevant
in relation to seasonal work. We did interviews with farmers and one farmer union
representative to understand how seasonal work on apple farms is organized and
regulated in Flanders.
5. Results and discussion
In this paragraph we present the results of the performance indicator calculation. Values
were calculated for the local and the global apple supply chain, respectively. The values
of the two chains are compared to each other and discussed. The results of the different
indicators are presented in table 5. They are further discussed in the section below this
table.
The findings are summarized in table 5.
Table 5: Results of performance for the local and global chain.
Local chain
Contribution to economic development
Added value
743 €/ t
Work
Fair trade
Distribution of
revenues
Resource use
Land productivity
Labour
productivity
Fossil energy
efficiency
Fossil energy
intensity
Pollution
GHG emissions
Pesticide hazard
Acidification
potential
www.glamur.eu
Global chain
293 €/ t
29 h/t
17 h/t
90 %
20 %
36.7 t/ha
34 kg/h
44.6 t/ha
59 kg/h
1.69 MJ/kg
1.37 MJ/kg
23.75 GJ/ha
30.01 GJ/ha
146.25 g CO2eq./kg
84.7 g CO2 eq./kg
34.9 EIQ/kg
1.09 g SO2 eq./kg
26.1 EIQ/kg
0.75 g SO2 eq./kg
27
Eutrophication
potential
Labour relations
Work contracts
Working hours
0.21 g/kg
0.38 g/kg
99 %
99 %
99 %
99 %
5.1 Contribution to economic development
Added value
In the global chain we calculated added value at three different supply chain stages in
the year 2008. First, the added value at the farm stage is 209 Euros per tonne of apples.
The integrated farmers have an average sales revenue of 13,601 Euros per hectare and
an average operational cost of 2,641 Euros per hectare (costs for energy, machinery
maintenance, fertilizers and pesticides) (Van Broekhoven et al., 2010). Second, the
added value created at the auction stage is 4.5 Euros per tonne. It makes sense that this
added value is low because the auction redistributes a part of its profit to the farmers
(these revenues are thus included at the farm stage). The main objective of the auction
is to share operational costs rather than making profit. Third, at the retail stage we
estimate an added value of 100 Euros per tonne of apples. This is calculated by
multiplying the average price for Jonagold apples in 2008 (1408 Euro per tonne) with
the profit margin of Colruyt being 7.1 %. The strategy of the retailer is to sell a large
amount of products at low prices. The added value per product unit is hence low (0.1
euro per kilogram of apples). If we sum the added values of the three stages of the
global apple chain we find a total added value of 314.5 Euros per tonne.
In the local chain added value is created mainly at the farm stage because the main
cultivation and distribution steps occur at this stage). The added value is 743 Euro per
tonne of apples. Our local farm had in 2008 a revenue of 31,930 Euros per hectare and
total operational costs of 1,653 Euros per hectare.
When comparing the two chains we see that the added value of the local chain is higher
than the added value of the global chain. A main reason is that higher prices are paid to
the farmer in the local chain.
Work created
The total labour hours that are needed to produce one tonne of apples is calculated as a
proxy for the number of jobs generated in each chain.
In the global chain on average 15 hours of labour are needed to produce one tonne of
apples. Most of this labour is needed at the farm stage: 13 hours per tonne. We found
www.glamur.eu
28
this value by taking the average total amount of hours worked per hectare in the
integrated farms of our FADN sample (591 hours) and by dividing this by the average
harvest of 44.6 tonnes per hectare. Based on our interviews we assume that one more
hour is needed per tonne at the auction to control the apples. Transport and sorting are
on the other hand very efficient and hence not many labour is needed for these
processes. For example, transport from the auction to the distribution centre of the
retailer happens in one hour with trucks with a load capacity of 27 tonnes of apples.
Another example of labour efficiency is sorting at the auction. This happens with
machines that can sort 15 tonnes of apples per hour.
In the local chain more labour is needed, on average 20 working hours per tonne of
apples. The three local farms in the FADN sample need on average 674 hours of work
per tonne of apples. Their average yield is 37 tonnes per hectare. Hence, to produce one
tonne of apples in these local farms 18 hours of work are needed. Distribution and
transport is also less efficient than in the global chains so more labour is needed. This is
especially the case for the preparation of the fruit and vegetable baskets. Based on the
interviews we estimate that on average 30 minutes are needed to sort one tonne of
apples and to put them in baskets.
We saw earlier that around 5,300 hectares are covered with orchards in Flanders. If all
this area was covered with farms of the local type, one would have a total harvest of
196,100 tonnes (37 tonnes per hectare x 5300 hectare) and 3,922,000 labor hours
would be needed. If one person works 2,080 hours a year (40h x 52 weeks), work would
be created for 1,886 persons. If these 5,300 hectares would be covered only with farms
from the global type work would be created for only 1,705 persons.
Thus, the global chain is more labour efficient but more work could be created through
the local chain.
5.2 Fair trade
Distribution of revenues
Farmers received on average 0.28 Euros per kilogram of apples that they produced in
2008 (van Broekhoven et al., 2008). The average consumer price for apples was 1.408
Euro per kilogram in that same year. Hence, around one fifth of the price paid by the
consumer in the supermarket is received by the farmer.
The farmer in the local chain sells directly to consumers. He gives 10 percent of his
revenues to the umbrella organisation ‘food teams’ in order to be part of their network.
Hence, 0.90 percent of the price paid by the consumer is received by the farmer. The
price paid by the consumer was 0.55 Euros per kilogram (Van Eykeren, personal
communication, 2014), so the farmer received 0.5 Euros per kilogram.
www.glamur.eu
29
5.3 Resource Use
Fossil energy intensity
Fossil energy intensity refers to the fossil energy use at the farm stage per unit of land. It
demonstrates how energy intense a farmer is cultivating on a certain area. Fossil energy
is mainly consumed through fuel use for tractors and machinery. Indirect fossil energy
needed to produce and supply pesticides and fertilizers are also taken into account.
Fossil energy intensity is larger for the global chain than for the local chain. The main
reason for that is that global farmers are using larger quantities of inorganic fertilizers
and hence larger amounts of indirect energy. The local farms had on average a larger
direct energy consumption during field operations than the farmers in the global chain
but because of lower inorganic fertilizer use the total amount of energy depletion
resulted to be higher in the global chain. Our calculations resulted in a fossil fuel
consumption of 30 GJ per hectare in the global while the local chain consumes 24 GJ per
hectare.
Fossil energy efficiency
The global chain is more energy efficient than the local chain. The difference between
the chains is especially due to higher yields in the global chain. Transport is also more
efficient in the global chain than in the local chain but apples travel a longer distance.
Most energy is being consumed at the farm stage. The global chain consumes on
average 0.70 MJ per kilogram apples at the farm stage and 0.67 MJ per kilogram apples
at the distribution stage. Cooling is responsible for 0.4 MJ fossil fuel consumption. The
local farms consumes on average 1.69 MJ/kg of fossil fuels. 1.16 MJ/kg is consumed at
the farm stage. In addition, 0.53 MJ per kilogram is needed to cool and transport the
apples.
Land Productivity
Land productivity refers only to the farm stage of the two chains. We calculated the
average value in the FADN database for the 50 integrated fruit farmers and the three
organic fruit farmers. The global integrated fruit farms have an average land
productivity of 44.6 tonnes per hectare. The local organic farms on the other hand have
an average land productivity of 36.7 tonnes per hectare. The land productivity of the
integrated fruit farms in the global chain is hence larger than that in the local chain. In
other words, the global chain produces more Jonagold apples per unit of land that is
used. One reason for the lower land productivity of organic farms is that these use less
fertilizers.
www.glamur.eu
30
Labour productivity
Labour is also an important resource for the production of apples. In the global chain,
more apples can be produced with an input of 1 hour of labour compared to the local
chain. This is in a first place because the global chain is more mechanized than the local
chain. Sorting happens for example with high tech sorting machines, while the sorting
and preparation of fruit baskets in the local chain is happening with manual labour.
Hence, one needs less human labour in the global chain to produce and supply a certain
amount of apples.
5.4 Pollution
Greenhouse gas emissions
The global chain emits 85 grams of CO2 equivalents per kilogram of apples. The chain is
more efficient in terms of greenhouse gas emissions compared to the local chain. The
latter emits 146 grams of CO2 per kilogram of apples. The main reason for this
difference is that in the local chain, lower average yields are produced for a certain rate
of mechanization at the farm stage and transport and cooling is less efficient. Most
greenhouse gasses are emitted at the farm stage, 54 g CO2 equivalents for the global
chain and 130 g CO2 equivalents for the local chain. These emissions stem mainly from
fuel use and fertilizer use (in particular nitrogen use resulting in nitrous oxide
emissions).
Pesticide hazard
Farmers from both integrated and organic production systems use pesticides so both
systems have toxic effects on the environment. The organic farms had according to our
calculations on average a higher toxic effect compared to the integrated farmers.
However, we tested if the results of the sample of organic plots were significantly
different from the integrated plot and no significant difference was found (based on the
Kolmogorov-smirnov test (p<0.1). Therefore, there is no significant difference in PH per
kg between the organic production system in the local chain and the integrated system
in the global chain. This might be surprising because organic farmers are not allowed to
use herbicides. They do, however, use fungicides and insecticides, which have a higher
toxicity impact than herbicides. Consequently, the overall toxicity of organic production
is similar to that of integrated production. Especially the use of sulphur in organic farms
resulted in a high toxic effect.
Acidification
www.glamur.eu
31
The global chain has an average value of 0.75 g SO2 equivalents per kilogram.
Acidification is mainly caused through the emissions of NOx and SOx related to the use
of machinery and emissions of ammonia through the use of nitrogen for fertilization.
The local chain emits 1.09 g SO2 equivalents per kilogram. This is in particular because
more direct energy was consumed during field operations at the farm stage and
because of lower yields.
Eutrophication
The global chain emits on average 0.38 g PO4 equivalents per kilogram of apples.
Eutrophication is mainly caused through emissions related to the use of nitrogen and
phosphor for fertilization. The eutrophication efficiency differs significantly among the
two chains. The organic system has a lower average value, 0.21 g PO4 equivalents /kg.
This makes sense because the organic farmers apply a lower amount of fertilizers than
farmers that use integrated production methods.
5.5 Labour relations
We do not find differences in labour conditions between the global and the local chain.
Seasonal work at the farm is strictly regulated in Flanders. Farmers need to register
every worker and need to respect the wages and working hours that are fixed by the
government. Compliance with labour regulation is controlled at least once a year.
Hence, we assume that farmers in the chains respect the law (we assume 99 % of them
respecting the law). This means that workers in both chains have a legally binding work
contract and no vulnerable employment and that working time arrangements are fully
compliant with ILO standards.
5.6 Data quality check
In order to check the quality of the data used to calculate the indicators, the pedigree
matrix approach is used (Ciroth, 2013; Lewandowska, 2004). Table 6 shows five criteria
of evaluation of the data quality: reliability of source, completeness of data, temporal
correlation, geographical correlation, further technological correlation. For the first
criterion, two types of reliable sources are specified, but only one is to be selected
depending on the qualitative or quantitative nature of the analysed data. For each
criterion, there is an ideal requirement that is called “data quality goal” (DQG), and four
other categories called “data quality indicators” (DQI) from 1 to 4 that represent a lower
quality of data than the DQG. The DQG is associated to the score 1, and the DQI are
successively associated to the scores 0.8, 0.6, 0.4 and 0.2. The higher the score, the
better the data. Every single data is reviewed following the five criteria: for each
criterion, a “data quality distance” (DQD) is calculated:
www.glamur.eu
32
So, the lower the DQD, the better the data. Then for one data point, the five DQD (one
for each criterion) are summed up to give a total DQD. This number is then interpreted
with the pedigree matrix: the total DQD is associated to a letter representing the data
quality class. Letter A is for the best data quality (total DQD between 0 and 0.2), and
letter E is for the worst data quality (total DQD between 3.2 and 4).
Table 6: Data quality check
local
Company
accountings
global
Labour
productivity
local
Company
accountings
global
Fossil energy
intensity
fossil energy
efficiency
local
FADN
global
FADN
local
FADN; Interview
with local
farmer
FADN; Interview
with auction
representative
global
Pollution
Pesticide
hazard
Greenhouse
gas emissions
local
FADN
global
FADN
local
local
FADN; Interview
with local
farmers
FADN; Interview
with auction
representative
FADN
global
FADN
local
FADN
global
FADN
global
Eutrophication
potential
Acidiphication
potential
www.glamur.eu
Quality Class
Resource use
Land
productivity
Total DQD
global
Further
technological
correlation
FADN; interview
with local
farmer
Geographical
Correlation
local
Temporal
correlation
Company
accountings;
Company year
reports; FADN;
Interviews
global
Work
Completenes
s
local
Reliability
Data source
Indicator
Attribute
Added value
Contribution to
economic
development
0
0.6
0.2
0
0
0.8
A
0.2
0.4
0.2
0
0
0.8
A
0
0.6
0.2
0
0
0.8
A
0.2
0.4
0.2
0
0
0.8
A
0
0.6
0.2
0
0
0.8
A
0.2
0.4
0.2
0
0
0.8
A
0
0.6
0.2
0
0
0.8
A
0.2
0.4
0.2
0
0
0.8
A
0
0.4
0
0
0
0.4
A
0
0.4
0
0
0
0.4
A
0
0.4
0
0
0
0.4
A
0.4
0
0
0
0.4
A
0
0.4
0
0
0
0.4
A
0
0.4
0
0
0
0.4
A
0
0.4
0
0
0
0.4
A
0
0.4
0
0
0
0.4
A
0
0.4
0
0
0
0.4
A
0
0.4
0
0
0
0.4
A
0
0.4
0
0
0
0.4
A
0
0.4
0
0
0
0.4
A
33
Fair trade
Distribution of
revenues
Seasonal work
contracts
local
global
local
Labour relations
global
Working hours
company
accountings
Interview with
farmer union
representative
0
0.6
0.2
0
0
0.8
A
0.2
0.4
0.2
0
0
0.8
A
0
0
0
0
0
0
A
0
0
0
0
0
0
A
Local
0
0
0
0
0
0
A
global
0
0
0
0
0
0
A
6. Comparing our findings with Apples from New Zealand
In this additional chapter we compare our findings with scientific studies on apples
imported to Europe from New Zealand, a global food supply chain. The performance of
New Zealand apple chains has previously been assessed mainly in relation to the
environmental dimension. We have based the comparison in particular on the work
carried out by Mila i Canals (2003), part of which has been published in Mila i Canals et
al. (2006). In this study a comprehensive life cycle analysis (LCA) is conducted that
addresses all relevant environmental impacts. Other LCA studies only address carbon
and energy aspects of apple production systems in New Zealand (Blanke and Burdick,
2005; Saunders et al., 2006; McLaren et al., 2009; Frater, 2010).
6.1 Description of the New Zealand apple chain
Together with Chile and South Africa, New Zealand is a major fruit producer and
exporter. Exports of fresh and processed apples account for the third largest export
share in horticultural products, only preceded by exports of wine and kiwifruit (Aitken
and Hewett, 2012). It is in particular exporting a large amount of apples, accounting for
about 5 percent of global apple trade (MPI, 2014). Annual export volumes amounted to
$NZ 341.6 million. However, from 2011 to 2012, income from apple exports decreased
by $NZ 21.7 million, i.e. a decrease of 6%. Apple varieties exported include the
traditional varieties of Braeburn and Royal Gala (60.2% of exports), but increasingly also
new varieties such as the Pacific series, Fuji, Jazz, Envy and Pink Lady. Europe is the most
important export destination with 51% of total apple exports in 2012. Most of these
exports are destined to the UK and Ireland (Aitken and Hewett, 2012).
In 2012, apples in New Zealand have been cultivated on 391 orchards and covered 8,324
ha. The number of orchards has decreased tremendously from 920 in 2005, indicating a
decrease by 57.5% between 2005 and 2012. Also, the area planted with apples has
decreased from 12, 585 ha in 2004. Most of the orchards are located in the regions of
Hawke’s Bay and Nelson (60 and 30 % respectively). Like in Flanders, most apples are
cultivated with integrated production practices. In 2011 94% of the orchards used
www.glamur.eu
34
integrated production methods and 6% were certified organic (Aitken and Hewett,
2012). For example, understory management is applied which implies that the tree line
is kept vegetation free with herbicides while the alley is planted with a grass/legume
mix. After harvest the apples are sold to packers who package, store and export the
apples. In 2011, there have been 70 export packhouses. Apples are graded in three
classes according to fruit size, colour and storage characteristics: Grade 1 is designated
for export, Grade 2 for domestic markets and Grade 3 for processing (Mila i Canals et al.,
2006). The main exporting company is ENZA (formerly the New Zealand Apple and Pear
Marketing Board) and in total, there have been 90 apple exporters in 2011 (Aitken and
Hewett, 2012). Apples that are exported to Belgium are first transported by boat to the
harbour of Antwerp. The export company transports the apples from there to the
distribution centres of the big retail groups (the most important ones are Carrefour,
Colruyt and Delhaize). From the national distribution centres of the retailer the apples
are transported to the supermarkets.
6.2 Critical issues
6.2.1Competitive pressure on small family farms
There has been an increasing tendency towards vertical integration. Vertical integration
is mostly backward integration by large growers, packers and shippers: the top 8
packhouse operators account for about two thirds of the traded volume and 25 out of
70 packhouses handle 91% of the export apples. Regarding export companies, 25 out of
90 handle 90% of exports (Aitken and Hewett, 2012). The number of smaller family
farms has declined mainly due to competitive pressure. Average farm size has increased
steadily. At the same time, there is increasing concentration at the buyer’s side. This has
resulted in more or less constant income on a per hectare basis, but declining
profitability at the whole farm level (MPI, 2014).
6.2.2 Food miles
A concern to decision makers is the long distance that apples have to travel before
arriving at their export destination. Apples that travel to Europe, the main export
destination, are transported more than 20 000 kilometers before reaching their
destination. This transport contributes to greenhouse gas emissions and fossil fuel
depletion. A recent study by Mc Laren et al. (2009) has demonstrated that more than
50% of greenhouse gas emissions are due to shipping.
6.3 Comparison of performance
Table 7 presents the indicators that we have compared for the Belgian and the New
Zealand case studies. The indicators cover three performance attributes: Contribution to
economic development, resource use and pollution. Data come mainly from the
www.glamur.eu
35
ministry of primary industries (MPI) and earlier LCA studies on New Zealand apple
exports.
Table 7: main attributes, indicators and data sources to compare the performance of the NZ apple chain
and the belgian apple chains
Dimension
Main attribute
Indicators
Data sources
Economic
Contribution to
economic
development
• Added value
Ministry of Primary Industries
(MPI), 2012, Horticulture
Monitoring
Economic/
environmenta
l
Resource use
• Energy intensity
• Energy efficiency
• Land productivity
Mila i Canals (2003); Saunders et
al. (2009), Frater (2010)
Blanke and Burdick (2005)
Ministry of Primary Industries
(MPI), 2012, Horticulture
Monitoring
Environmenta
l/health
Pollution
• Greenhouse gas
emissions
• Acidification
Blanke and Burdick (2005)
Mila i Canals (2003)
6.3.1. Contribution to economic development
Added value
The Braeburn apple production sector generated an added value of 143 $/t in 2008
(MPI, 2012). If we multiply this with the average $NZ - EUR conversion rate in 2008
(0.7134) we obtain an added value of 102 EUR/t at the farm stage. This value is much
lower than the values we have calculated at the farm stage in the Flemish chains (209
EUR/t for the global chain and 743 EUR/t for the local chain). The Braeburn apple adds
hence less value per ton to the New Zealand economy compared to what the Jonagold
apple adds to the Flemish economy.
6.3.2 Resource use
Land productivity
The average yield of Braeburn apples in the Hawke’s Bay region in New Zealand is 55.1
t/ha. This is more than 10 t more than the average yields in Flanders. The global chain in
Flanders had an average yield of 44.6 t/ha and the local chain 36.7 t/ha. The New
www.glamur.eu
36
Zealand chain is hence the most productive one per ha. This performance is relevant not
only in relation to resource use (land use) but also in relation to food security.
Fossil energy intensity
Mila i Canals et al. (2006) assessed the fossil energy intensity at the farm stage in two
regions of the New Zealand Braeburn apple chain. The farmers in the region Central
Otago consumed 20 GJ/ha of apple production. Farmers in the Hawke’s Bay region
consumed on average 30 GJ/ha. Our own calculations in Belgium result in 30 GJ/ha for
the global chain and 24 GJ/ha for the local chain. We should be carefull with comparing
these results because the study of Mila i Canals et al. includes also energy use for
machinery and fuel production. This was not included in our calculations which would
otherwise be higher. Therefore we conclude that farms in Flanders are slightly more
fossil fuel intensive compared to New Zealand farms.
Fossil energy efficiency
Regarding fossil energy use along the whole supply chain we find that the New Zealand
chain consumes most fossil energy because of the long distance the apples have to
travel. This adds to the energy used at the production stage. According to Blanke and
Burdick (2005) 2.5 MJ/kg apples is consumed to ship apples from Nelson in New Zealand
to the harbour in Antwerp. This amount alone is already more than the total energy
consumption of the Flemish chains (1.4 MJ/kg for the global Flemish chain and 1.7
MJ/kg for the local chain). Based on the study of Blanke and Burdick we assume an
energy consumption of 4.5 MJ/kg for the total New Zealand apple chain from cultivation
until the national distribution centre of retail groups in Belgium. This amount inludes 28
days of cooling during shipping. In the calculations of the Flemish chains we included
100 days of cooling. New Zealand apples exported to Belgium are hence consuming
around 4 times more fossil energy than the Flemish chains.
6.3.3 Pollution
Greenhouse gas (GHG) emissions
GHG emissions of the New Zealand export apple chain have been calculated in previous
LCA studies (e.g. Defra et al., 2008; Stadig et al., 1997; Blonke et al., 2011). These studies
find that on average the apple export chain is emitting 450 g CO2 eq./kg. This is more
than 3 times higher than what we have calculated for the Flemish local chain, 146g CO2
eq./kg. The Flemish global chain emits even less GHG being 85 g CO2 eq./kg. Most GHG
are emitted during transportation of the apples.
www.glamur.eu
37
Acidification potential
The acidification potential at the farm stage of the New Zealand export apple chain is
estimated to being 0.8 g SO2 eq./kg (Mila i Canals, 2006). This is similar to what we find
for the global chain in Flanders (0.75 g SO2 eq./kg). The farmers in the local Flemish
chain are less efficient with an acidiphication potential of AP of 1.09 SO2 eq/kg.
7. General discussion (WP4)
8. Conclusion
We can draw several conclusions from this case study. A first conclusion is that our local
chain is contributing more to economic development. As shown in our study the local
apple chains can add more value to the economy and they can create more jobs. The
latter is in particular because more human labour was needed to produce and distribute
a certain amount of apples. The main reason for the difference in added value on the
other hand is that local farmers receive higher prices for their products while actors in
the global chain tend to produce or distribute large quantities with low profit margins
per product and therefore their added value per product is also low. Farmers in the local
chain were also receiving a larger share (90 percent) of the price payed by the
consumer, compared to farmers in the global chain.
The global chain was on the other more land and labour productive. Apple farms in New
Zealand seem to be even more land productive than the Flemish farms. The local farms
had on average the lowest yields. Therefore they were also less efficient in terms of
energy use or environmental impact per product. However, when expressing energy use
or environmental impacts per hectare they are often performing better than the global
chains because they are less land intensive. In other words, the global chain has a
greater environmental impact on a certain area than the local chain. Decision makers
should hence not only focus on efficiency but they should also keep the intensity of the
systems in mind.
From the comparisons with studies on New Zealand apple supply chain we can conclude
that the NZ chain emits most greenhouse gasses and depletes most fossil fuels because
of the long distance that the apples have to travel (more than 20 000 km by boat).
www.glamur.eu
38
9. References
Aitken, A.G. & Hewett, E.W., 2012. Fresh Facts. New Zealand Horticulture 2012.
http://www.freshfacts.co.nz/file/fresh-facts-2012.pdf
Algemene Directie Statistiek en Economische Informatie [ADSEI]. (2012). Oppervlakte van de
fruitaanplantingen volgens aanplantingsjaren. Retrieved 6/04/2014, 2014
Andrews, P. K., Glover, J. D., & Reganold, J. P. (2001). Horticultural performance, soil quality, and
orchard profitability of integrated, organic and conventional apple production systems.
Integrated Fruit Production, 24(5), 393 - 400.
Annaert B., Avermaete T., Mathijs E. (2014) GLAMUR WP2 - National level report. Belgium:
KULE.
Cerutti, A. K., Bruun, S., Beccaro, G. L., & Bounous, G. (2011). A review of studies applying
environmental impact assessment methods on fruit production systems. Journal of
environmental Management, 92, 2277 - 2286.
Demeyer, R., De Baets, T., de Schaetzen, C., D’hooghe, J., Keulemans, W. ; Marchans, F.
&Wustenberghs, H. (2012). Duurzame Fruitbedrijven : bepalende factoren-indicatoren-hot issus.
Brussel : De Vlaamse Overheid.
Desrochers, P., Shimizu, H. (2012). The locavare's dilemma: in praise of the 10000-mile diet.
Public affairs.
Esnouf, C., Russel, M., & Bricas, N. (2011). Pour une alimentation durable: Reflexion stratégique
duALIne. Paris, France: Editions Quae.
Intergovermental Panel on Climate Change [IPCC]. (2006). IPCC guidelines for national
greenhouse gas inventories (Vol. 4 - Agriculture, forestry and other land use). Japan: IGES.
Intergovermental Panel on Climate Change [IPCC]. (2007a). IPCC Fourth assessment report:
Climate change 2007. In A. Allali, R. Bojarui, S. Diaz, I. Elgizouli, D. Griggs, D. Hawkins, O.
Hohmeyer, B. P. Jallow, L. Kajfez-Bogataj, N. Leary, H. Lee & D. Wratt (Eds.), Synthesis report.
Cambridge, UK: Intergovermental Panel on Climate Change (IPCC).
Intergovermental Panel on Climate Change [IPCC]. (2007b). IPCC Fourth assessment report:
Climate change 2007. In S. Solomon, D. Qin, M. Manning, Z. Chen, M. Marquis, K. B. Averyt, M.
Tignor & H. L. Miller (Eds.), The physical science basis. Cambridge, UK: Intergovermental Panel
on Climate Change (IPCC).
www.glamur.eu
39
International Bureau of Weights and Measures. (2006). The international system of units (SI).
Paris.
International Organiszation for Standardization [ISO]. (2006). International Standard 14044:2006
Environmental Management - Life Cycle Assessment - Requirements and Guidelines. .
Keymeulen, M. (2011). Strategisch plan korte keten. Brussel: Departement Landbouw & Visserij.
Kirwan, J., Maye, D., Bundhoo, D., Keech, D. and Brunori, G., (2014) GLAMUR WP2 - Scoping /
framing general comparative report on food chain performance (deliverable 2.3).
Landbouwmonitoringsnetwerk. (2008). Algemene bedrijfsgegevens 2008.
Ministry for Primary Industries, 2012, http://www.mpi.govt.nz/agriculture/horticulture/fruits
Mila i Canals, L., Burnip, G. M., & Cowell, S. J. (2006). Evaluation of the environmental impacts of
apple production using life cycle assessment (LCA): case study in New Zealand. Agriculture,
Ecosystems and Environment, 114, 226 - 238.
Mila i Canals, L., Burnip, G. M., Suckling, D. M., & Cowell, S. J. (2003). Sources of site-dependency
and importance of energy consumption in agricultural LCA: apple production in New Zealand.
Paper presented at the 4th international conference, Bygholm, Denmark.
Mouron, P., Scholz, R. W., Nemecek, T., & Weber, O. (2006a). Life cycle management on Swiss
fruit farms: Relating environmental and income indicators for apple-growing. Ecological
Economics, 58, 561 - 578.
Mouron, P., Scholz, R. W., Nemecek, T., & Weber, O. (2006b). Management influence on
environmental impacts in apple production system on Swiss fruit farms: Combining life cycle
assessment with statistical risk assessment. Agriculture, Ecosystems and Environment, 114, 311 322.
Pollan, M/ (2006). The omnivore's dillema: a natural history of four meals. Penguin books.
Van Broekhoven, E., Somers, L., & Tacquenier, B. (2010). Overzicht van de boekhoudkundige
resultaten van 767 land- en tuinbouwbedrijven - Boekjaar 2008. Brussel:
Landbouwmonitoringsnetwerk, Beleidsdomein Landbouw en Visserij, afdeling Monitoring en
Studie.
www.glamur.eu
40


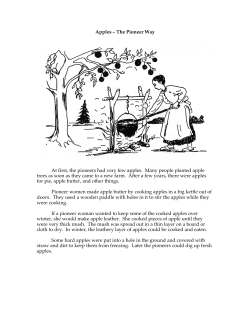


© Copyright 2026