
Statistical Bulletin Deaths Related to Drug Poisoning in England and Wales, 2012
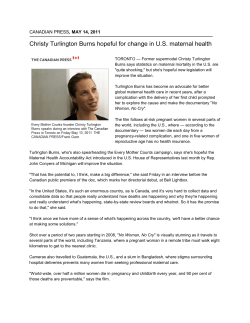
Statistical Bulletin
Deaths Related to Drug Poisoning
in England and Wales, 2012
Coverage: England and Wales
Date: 28 August 2013
Geographical Areas: Country, Region
Theme: Health and Social Care
Theme: Population
Key findings
•
There were 1,706 male drug poisoning deaths (involving both legal and illegal drugs) registered
in 2012, a 4% decrease since 2011.
•
Female drug poisoning deaths have increased every year since 2009, reaching 891 in 2012.
•
The number of male drug misuse deaths (involving illegal drugs) decreased by 9% from 1,192 in
2011 to 1,086 in 2012; female deaths decreased by 1% from 413 in 2011 to 410 in 2012.
•
The highest mortality rate from drug misuse was in 30 to 39-year-olds, at 97.8 and 28.9 deaths
per million population for males and females respectively in 2012.
•
The number of deaths involving heroin/morphine fell slightly in 2012 to 579 deaths, but these
remain the substances most commonly involved in drug poisoning deaths.
•
The number of deaths involving tramadol have continued to rise, with 175 deaths in 2012 – more
than double the number seen in 2008 (83 deaths).
•
Mortality rates from drug misuse were significantly higher in Wales than in England in 2012, at
45.8 and 25.4 deaths per million population respectively.
•
In England, the North West had the highest mortality rate from drug misuse in 2012 (41.0 deaths
per million population).
•
All figures presented in this bulletin are based on deaths registered in a particular calendar year,
and out of the 2,597 drug-related deaths registered in 2012, 1,358 (just over half) occurred in
years prior to 2012.
Office for National Statistics | 1
Deaths Related to Drug Poisoning in England and Wales, 2012 | 28 August 2013
Summary
This bulletin presents the latest figures from the Office for National Statistics (ONS) on deaths
related to drug poisoning (involving both legal and illegal drugs) and drug misuse (involving illegal
drugs) in England and Wales for the last five years. Figures from 1993 are available to download,
and are discussed in the commentary to provide context to the latest (2012) data.
Figures presented in this bulletin are for deaths registered each year, rather than deaths occurring
each year – see the ‘Impact of registration delays on drug-related deaths’ section below for more
information. Figures are presented by cause of death, sex, age, substance(s) involved in the death,
and area of usual residence of the deceased.
Mortality rates for 2002–11 have been recalculated using revised mid-year population estimates
which take account of the 2011 Census. These may differ from previously published figures (see
Background note 13).
There were 2,597 drug poisoning deaths (involving both legal and illegal drugs) registered in 2012,
and as in previous years, the majority (just over two-thirds) of these deaths were in males. There
were 1,706 male deaths from drug poisoning in 2012, a decrease of 4% since 2011, and the lowest
since 1995. The equivalent number of female deaths rose to 891, an increase of 1% since 2011, and
the highest since 2004.
In 2012 males aged 30 to 39 had the highest mortality rate from drug misuse (97.8 deaths per
million population), followed by males aged 40 to 49 (85.9 deaths per million population). The male
mortality rates in these two age groups were significantly higher than the rates in all other age
groups and much higher than females of any age.
As with males, the highest rates for females were among those aged 30 to 39 and 40 to 49 (28.9
and 28.7 deaths per million respectively), and these rates were significantly higher than the rates in
other age groups.
Over half (52%) of all deaths related to drug poisoning involved an opiate drug, and in men aged
30 to 39, nearly two thirds (63%) of drug-related deaths involved an opiate. In 2012, as in previous
years, the most commonly mentioned opiates were heroin and/or morphine, which were involved in
579 deaths.
Deaths involving heroin/morphine decreased in 2012, but deaths involving another opiate – tramadol
– have continued to rise. There were 175 deaths involving tramadol in 2012 – more than double the
number recorded in 2008 (83 deaths). In addition, deaths involving new psychoactive substances
(sometimes referred to as ‘legal highs’) such as mephedrone have increased sharply in the last
year from 29 deaths in 2011 to 52 deaths in 2012. But the number of deaths from new psychoactive
substances are still much lower than the number of deaths from heroin/morphine.
For the first time this bulletin presents analysis of geographical variations in mortality rates from
drug misuse. This analysis showed that in 2012 rates were significantly higher in Wales than in
England (45.8 and 25.4 deaths per million population respectively). In England, the North West had
the highest mortality rate from drug misuse in 2012 (41.0 deaths per million population).
Office for National Statistics | 2
Deaths Related to Drug Poisoning in England and Wales, 2012 | 28 August 2013
Introduction
Drug use and drug dependence are known causes of premature mortality, with drug poisoning
accounting for nearly one in eight deaths among people in their 20s and 30s in 2012 (see
Background note 7). Drug-related deaths occur in a variety of circumstances, each with different
social and policy implications. Consequently, there is considerable political, media and public
interest in these figures.
This bulletin covers accidents and suicides involving drug poisonings, as well as deaths from drug
abuse and drug dependence, but not other adverse effects of drugs (for example anaphylactic
shock). Drug poisoning deaths involve a broad spectrum of substances, including legal and illegal
drugs, prescription drugs (either prescribed to the deceased or obtained by other means) and overthe-counter medications. Some of these deaths may also be the result of complications of drug
abuse, such as deep vein thrombosis or septicaemia resulting from intravenous drug use, rather
than an acute drug overdose.
The figures presented in this bulletin are for deaths registered each year, rather than deaths
occurring each year. Almost all drug-related deaths are certified by a coroner, and due to the length
of time it takes to hold an inquest, just over half of drug-related deaths registered in 2012 will have
actually occurred prior to 2012 – see the ‘Impact of registration delays on drug-related deaths’
section below for more information.
Policy context
In December 2010 the Coalition Government launched a new drug strategy entitled 'Reducing
demand, restricting supply, building recovery: supporting people to live a drug-free life' (Home Office,
2010). This strategy highlights preventing drug-related deaths as one of the key outcomes that
recovery-oriented services should be focused on. In 2011 a new initiative was launched in eight pilot
areas in England, trialling payment by results for providers of treatment services for people with drug
and/or alcohol problems. The Department of Health is funding a three year independent evaluation
of these pilots, which is being led by the University of Manchester.
Patterns of drug use change over time. For instance, in recent years people have been taking new
psychoactive substances, including so-called ‘legal highs’. In response to this, the Government’s
2010 drug strategy outlined the introduction of a system of temporary 12-month bans on newly
emerging substances. The Advisory Council on the Misuse of Drugs (ACMD) can then evaluate the
harm caused by the substance and advise whether there should be a permanent ban.
In February 2013, the Welsh Government published the Substance Misuse Delivery Plan 2013–
2015 (Welsh Government, 2013), which included the specific target of ‘reducing the number of
substance misuse related deaths and non-fatal overdoses / alcohol poisonings in Wales’. To support
this, new proposals to undertake rapid case reviews for both fatal and non-fatal poisonings have
been developed and will be formally consulted on next month.
Office for National Statistics | 3
Deaths Related to Drug Poisoning in England and Wales, 2012 | 28 August 2013
Uses made of this data
The figures contained in this statistical bulletin are used by a range of public bodies, such as Public
Health England (PHE), the Department of Health (DH) and the Welsh Government to evaluate the
effectiveness of various drug strategies.
In April 2013, the key functions of the National Treatment Agency for Substance Misuse were
transferred into PHE, and they have linked ONS data on drug-related deaths with data from the
National Drug Treatment Monitoring System (NDTMS), to investigate the timing of drug-related
deaths in relation to treatment history. This research will also examine risk factors associated with
these deaths and carry out area-based comparisons.
The Welsh Government and Public Health Wales are linking ONS data to information on the
distribution and coverage of the National Take-Home Naloxone (THN) programme. This will be used
to evaluate whether the THN program is having an impact on the number of drug-related deaths in
Wales, and also to identify hotspots and areas requiring further focus.
The European Monitoring Centre for Drugs and Drug Addiction (EMCDDA) combines data for
England and Wales from the ONS drug poisoning database with data from Scotland and Northern
Ireland to publish UK figures, allowing comparisons to be made with other European countries.
The latest EMCDDA report shows that the drug-related mortality rate in the UK was the fourth
highest in Europe (EMCDDA, 2013). However, caution should be applied when making international
comparisons, because of differences in definitions and the quality of reporting.
ONS drug poisoning data are also used by academic researchers. For example, analysis of this
data by the Centre for Suicide Research at the University of Oxford revealed that there was a major
reduction in deaths involving co-proxamol following its withdrawal in 2005, with no evidence of an
increase in deaths involving other analgesics, apart from oxycodone (Hawton et al, 2012). Updated
data on deaths involving co-proxamol and other analgesics are shown in Reference Table 6a.
Number of deaths from drug-related poisoning
There were 2,597 drug poisoning deaths (involving both legal and illegal drugs) registered in 2012,
and as in previous years, the majority (just over two-thirds) of these deaths were in males. There
were 1,706 male deaths from drug poisoning in 2012, a decrease of 4% since 2011, and the lowest
since 1995. The equivalent number of female deaths rose to 891, an increase of 1% since 2011, and
the highest since 2004.
Office for National Statistics | 4
Deaths Related to Drug Poisoning in England and Wales, 2012 | 28 August 2013
Table 1: Number of deaths from drug-related poisoning and drug misuse, by sex, deaths
registered in 2008–2012
England and Wales
Deaths
Registration year All drug poisoning
Drug misuse
Males
Females
Males
Females
2008
2,075
853
1,506
435
2009
2,098
780
1,510
364
2010
1,890
857
1,382
402
2011
1,772
880
1,192
413
2012
1,706
891
1,086
410
Table source: Office for National Statistics
Table notes:
1. Cause of death was defined using the International Classification of Diseases, Tenth Revision (ICD-10). The
underlying cause of death codes used to select deaths related to drug poisoning and drug misuse are shown in
Background notes 4 and 5.
2. Figures are for deaths registered, rather than deaths occurring in each calendar. Due to the length of time it takes
to complete a coroner’s inquest, it can take months or even years for a drug-related death to be registered. More
details can be found in the ‘Impact of registration delays on drug-related deaths’ section below.
3. Figures for England and Wales include deaths of non-residents.
Download table
XLS format
(60.5 Kb)
Number of drug-related deaths by underlying cause
In January 2011, ONS introduced a new version of ICD-10 (software version 2010), which replaced
the version introduced in 2001 (version 2001.2). This means figures for 2011 onwards will not be
directly comparable with figures for 2001 to 2010. More information about the impact of this coding
change on drug-related deaths statistics can be found in last year’s statistical bulletin.
In both males and females the largest proportion of drug-related deaths were from accidental
poisonings (65% of all drug poisoning deaths in males and 49% in females). In males the number of
accidental poisonings remained virtually unchanged at 1,104 deaths in 2012. In females, accidental
poisonings decreased slightly from 445 to 437 deaths between 2011 and 2012, a 2% fall. There
were substantial increases in the number of deaths from accidental poisonings between 2010 and
2011, which were almost certainly due to the introduction of ICD-10 v2010.
In females just under half of all drug poisoning deaths were suicides (defined as intentional selfpoisoning or poisoning of undetermined intent). In 2012, the number of female drug-related suicides
increased slightly, from 418 deaths in 2011 to 422 deaths in 2012; this continues the upward trend
Office for National Statistics | 5
Deaths Related to Drug Poisoning in England and Wales, 2012 | 28 August 2013
that has been seen since 2009. In males, 31% of all drug poisoning deaths were suicides. The
number of deaths went down from 576 to 525 deaths between 2011 and 2012 – a 9% decrease.
This reverses the large increase seen in 2011, and the number of drug-related male suicides in 2012
were similar to the levels seen between 2006 and 2009.
In males the number of deaths where the underlying cause was a mental and behavioural disorder
due to drug use declined from 86 deaths in 2011 to 72 in 2012. In females, the equivalent number
increased from 17 deaths in 2011 to 29 in 2012. It is not clear what has caused this increase in
females, and it may just be a random fluctuation, rather than the start of an upward trend.
Table 2: Number of deaths from drug-related poisoning by underlying cause, males, deaths
registered in 2008–2012
England and Wales
Deaths (males)
Underlying
cause of
death
2008
2009
2010
2011
2012
All drug
poisoning
deaths
2,075
2,098
1,890
1,772
1,706
Mental and
behavioural
disorders due
to drug use
705
586
504
86
72
Accidental
poisoning by
drugs
861
983
899
1,107
1,104
Intentional
selfpoisoning and
poisoning of
undetermined
intent by drugs
500
524
482
576
525
9
5
5
3
5
Assault by
drugs
Table source: Office for National Statistics
Table notes:
1. Underlying cause of death was defined using the International Classification of Diseases, Tenth Revision (ICD-10)
codes given in Background note 4.
2. In January 2011 ONS introduced a new version of ICD-10, so figures for 2011 onwards are not directly comparable
with figures for 2008–10. More information can be found in last year’s drug-related deaths statistical bulletin.
Office for National Statistics | 6
Deaths Related to Drug Poisoning in England and Wales, 2012 | 28 August 2013
3.
Figures are for deaths registered, rather than deaths occurring in each calendar year. Due to the length of time it
4.
takes to complete a coroner’s inquest, it can take months or even years for a drug-related death to be registered.
More details can be found in the ‘Impact of registration delays on drug-related deaths’ section below.
Figures for England and Wales include non-residents.
Download table
XLS format
(61.5 Kb)
Table 3: Number of deaths from drug-related poisoning by underlying cause, females, deaths
registered in 2008–2012
England and Wales
Deaths (females)
Underlying
cause of
death
2008
2009
2010
2011
2012
All drug
poisoning
deaths
853
780
857
880
891
Mental and
behavioural
disorders due
to drug use
139
101
96
17
29
Accidental
poisoning by
drugs
327
305
369
445
437
Intentional
selfpoisoning and
poisoning of
undetermined
intent, by drugs
385
374
391
418
422
2
0
1
0
3
Assault by
drugs
Table source: Office for National Statistics
Table notes:
1. Underlying cause of death was defined using the International Classification of Diseases, Tenth Revision (ICD-10)
codes given in Background note 4.
2. In January 2011 ONS introduced a new version of ICD-10, so figures for 2011 onwards are not directly comparable
with figures for 2008–10. More information can be found in last year’s drug-related deaths statistical bulletin.
Office for National Statistics | 7
Deaths Related to Drug Poisoning in England and Wales, 2012 | 28 August 2013
3.
Figures are for deaths registered, rather than deaths occurring in each calendar year. Due to the length of time it
4.
takes to complete a coroner’s inquest, it can take months or even years for a drug-related death to be registered.
More details can be found in the ‘Impact of registration delays on drug-related deaths’ section below.
Figures for England and Wales include deaths of non-residents.
Download table
XLS format
(60.5 Kb)
Number of deaths related to drug misuse
The definition of this indicator is (a) deaths where the underlying cause is drug abuse or drug
dependence or (b) deaths where the underlying cause is drug poisoning and where any of the
substances controlled under the Misuse of Drugs Act 1971 are involved. This definition has been
adopted across the UK.
In 2012 there were 1,496 drug misuse deaths. The number of male deaths decreased by 9% from
1,192 in 2011 to 1,086 in 2012. Over the same period the number of female deaths fell by 1% from
413 to 410 (Table 1).
Since 1993 there has been an upward trend in the proportion of drug poisoning deaths that were
related to drug misuse for both males and females. In males this proportion peaked in 2010 at 73%,
but went down to 64% in 2012. In females, this proportion peaked in 2008 at 51%, but has since
dropped slightly to 46%.
Mortality rates for all drug-related poisonings and drug misuse
In 2012, as in previous years, mortality rates from all drug poisonings and drug misuse were
significantly higher in males than in females. The Crime Survey for England and Wales (formerly
the British Crime Survey, Home Office, 2012) showed that men were more than twice as likely as
women to have used illicit drugs in the last year which partly explains the higher mortality rate from
drug misuse in males. However, this cannot be the only explanation, as more than 40% of drug
poisoning deaths are not related to drug misuse.
The male mortality rate for all drug-related poisonings rose steeply between 1993 and 1999. Since
then mortality rates have fallen, but there have been large annual fluctuations, especially over
the 10 year period of 1999 to 2008. The rate dropped significantly between 2009 and 2010 (see
Background note 14 for an explanation of statistical significance) and has steadily decreased each
year since, falling to 61.0 deaths per million population in 2012 (Figure 1). This is the lowest male
mortality rate for drug-related poisonings since 1994.
In contrast, between 1993 and 2004 trends in female mortality rates from drug poisoning were
relatively stable. From 2004 rates began to decline, reaching their lowest level in 2007 (25.0 deaths
per million population). Female mortality rates have increased every year since 2009, reaching 30.1
deaths per million population in 2012. So female mortality rates from drug poisoning have shown the
opposite trend to male mortality rates in recent years.
Office for National Statistics | 8
Deaths Related to Drug Poisoning in England and Wales, 2012 | 28 August 2013
The male mortality rate from drug misuse has dropped significantly from its peak of 55.7 deaths
per million population in 2001. Over the period 2001 to 2010 drug misuse rates were subject to
fluctuations. Between 2001 and 2003 the rate decreased significantly from 55.7 in 2001 to 42.8
per million population in 2003. Between 2003 and 2009 the rate generally increased reaching 55.4
deaths per million population in 2009. From 2010 onwards the mortality rate has steadily decreased,
dropping to 39.2 deaths per million population in 2012, the lowest rate since 1996.
Despite some annual fluctuations, the female mortality rate from drug misuse has tended to increase
since 1993. The mortality rate peaked in 2008 at 15.5 deaths per million population, then dropped
significantly in 2009, but increased slightly again between 2009 and 2010. Since 2010, the female
mortality rate from drug misuse has been relatively stable, at 14.1 deaths per million population in
2012.
Figure 1: Age-standardised mortality rates for deaths related to drug poisoning and drug
misuse, by sex, deaths registered in 1993–2012
England and Wales
Source: Office for National Statistics
Notes:
1. Age-standardised mortality rates per 1 million population, standardised to the 1976 European Standard Population.
Age-standardised rates are used to allow comparison between populations which may contain different proportions
of people of different ages.
2. Rates for 2002–11 have been recalculated using revised mid-year population estimates which take account of the
2011 Census and may therefore differ from previously published figures.
3. Cause of death was defined using the International Classification of Diseases, Ninth Revision (ICD 9) for the years
1993 to 2000 and Tenth Revision (ICD-10) from 2001 onwards. The underlying cause of death codes used to select
'all drug poisonings' and 'drug misuse' deaths are shown in Background note 4. Drug misuse as defined by the
Office for National Statistics | 9
Deaths Related to Drug Poisoning in England and Wales, 2012 | 28 August 2013
current headline indicator shown in Background note 5. Deaths from drug misuse are included in the figures for all
4.
5.
drug poisoning.
Figures are for deaths registered, rather than deaths occurring in each calendar year. Due to the length of time it
takes to complete a coroner’s inquest, it can take months or even years for a drug-related death to be registered.
More details can be found in the ‘Impact of registration delays on drug-related deaths’ section below.
Deaths in England and Wales include non-residents.
Download chart
XLS format
(69 Kb)
Age-specific mortality rates for deaths related to drug misuse
Males
In 2012 males aged 30 to 39 had the highest mortality rate from drug misuse (97.8 deaths per
million population), followed by males aged 40 to 49 (85.9 deaths per million population). The male
mortality rates in these two age groups were significantly higher than the rates in all other age
groups and much higher than females of any age. Although males aged 30 to 39 had the highest
mortality rate, this has declined sharply in recent years and is now at its lowest level since 1998. The
male mortality rate in 40 to 49-year-olds has also declined since its peak in 2009, but not as steeply
as the decline seen in 30 to 39-year-olds.
Mortality rates in younger males continued their downward trend and are now at their lowest level
since records began (2.5 and 47.6 deaths per million population in 2012 for under 20s and 20 to 29year-olds respectively).
Mortality rates in males aged 50 to 69 increased significantly between 1998 and 2010, but have
remained stable since then, with 24.1 deaths per million population in 2012.
Male mortality rates in the oldest age group (70 and over) have shown no consistent trends over
time and remained low in 2012 with 7.3 deaths per million population.
This pattern of drug misuse deaths is broadly in line with treatment figures from the Public Health
England (PHE – previously the National Treatment Agency, 2012), which showed that as the drugdependent population ages, the over 40s have become the largest age group starting treatment. In
contrast, the number of 18 to 24-year-olds newly entering treatment for heroin and crack use has
halved over the last five years.
Office for National Statistics | 10
Deaths Related to Drug Poisoning in England and Wales, 2012 | 28 August 2013
Figure 2: Age-specific mortality rates for deaths related to drug misuse, males, deaths
registered in 2008–2012
England and Wales
Source: Office for National Statistics
Notes:
1. Age-specific mortality rates per one million population. Rates for 2008–11 have been recalculated using revised
mid-year population estimates which take account of the 2011 Census and may therefore differ from previously
published figures.
2. Cause of death was defined using the International Classification of Diseases, Tenth Revision (ICD-10). Deaths
were included where the underlying cause was due to drug poisoning and where a drug controlled under the
Misuse of Drugs Act 1971 was mentioned on the death certificate. More details on the definition of a death related
to drug misuse can be found in Background notes 4 and 5.
3. Figures are for deaths registered, rather than deaths occurring in each calendar year. Due to the length of time it
takes to complete a coroner’s inquest, it can take months or even years for a drug-related death to be registered.
More details can be found in the ‘Impact of registration delays on drug-related deaths’ section below.
4. Figures for England and Wales include deaths of non-residents.
Download chart
XLS format
(71 Kb)
Females
In 2012, mortality rates from drug misuse for females were lower than males in every age group,
except those aged 70 and over where rates were very similar in men and women. As with males,
Office for National Statistics | 11
Deaths Related to Drug Poisoning in England and Wales, 2012 | 28 August 2013
the highest rates were among those aged 30 to 39 and 40 to 49 (28.9 and 28.7 deaths per million
population respectively), and these rates were significantly higher than the rate in other age groups.
Unlike in males, where the mortality rate fell in 30 to 39 and 40 to 49-year-olds, the female mortality
rates in these age groups remained stable in 2012.
The female mortality rate for 50 to 69-year-olds has increased steadily over the last few years and is
now at 15.7 deaths per million population – its highest level since records began in 1993.
The opposite trend is seen in females aged 20 to 29, where the mortality rate has decreased
significantly from 18.9 deaths per million population in 2008 to 10.7 per million in 2012. These trends
mean that the female mortality rate in 20 to 29-year-olds is now slightly lower than the rate in 50 to
69-year-olds.
As with males, the lowest female mortality rates in 2012 were in those aged under 20 (1.2 deaths
per million population) and 70 and over (7.9 deaths per million population).
Figure 3: Age-specific mortality rates for deaths related to drug misuse, females, deaths
registered in 2008–2012
England and Wales
Source: Office for National Statistics
Notes:
1. Age-specific mortality rates per one million population. Rates for 2008–11 have been recalculated using revised
mid-year population estimates which take account of the 2011 Census and may therefore differ from previously
published figures.
2. Cause of death was defined using the International Classification of Diseases, Tenth Revision (ICD-10). Deaths
were included where the underlying cause was due to drug poisoning and where a drug controlled under the
Office for National Statistics | 12
Deaths Related to Drug Poisoning in England and Wales, 2012 | 28 August 2013
Misuse of Drugs Act 1971 was mentioned on the death certificate. More details on the definition of a death related
3.
4.
to drug misuse can be found in Background notes 4 and 5.
Figures are for deaths registered, rather than deaths occurring in each calendar year. Due to the length of time it
takes to complete a coroner’s inquest, it can take months or even years for a drug-related death to be registered.
More details can be found in the ‘Impact of registration delays on drug-related deaths’ section below.
Figures for England and Wales include deaths of non-residents.
Download chart
XLS format
(62 Kb)
Drug related deaths involving specific substances
Figures 4 and 5 give the age-standardised mortality rates where selected substances were
mentioned on the death certificate for 2008 to 2012 and Table 4 gives the number of deaths from
a wide range of substances. These figures need to be interpreted with caution for the following
reasons:
•
•
•
•
•
These figures are based only on information reported on the coroner’s death certificate, and may
not include every substance involved in the death.
In around 12% of drug poisoning deaths only a general description is recorded on the coroner’s
death certificate (such as 'drug overdose' or 'multiple drug toxicity'). Deaths where the certificate
contains only non-specific information cannot contribute to the counts of deaths involving specific
substances.
In an additional 31% of all drug poisoning deaths, the death certificate mentions more than
one specific drug. Where more than one drug is mentioned, it is not possible to tell which was
primarily responsible for the death.
Where more than one drug is mentioned on a death certificate the death will be counted in more
than one category in Table 4. For example, if both heroin and methadone are mentioned, the
death will be recorded once under heroin and once under methadone. Therefore the numbers for
different substances cannot be added together to give the total number of deaths.
Approximately 30% of all drug-related poisoning deaths also contain a mention of alcohol or
long-term alcohol abuse (for example, cirrhosis) in addition to a drug.
Office for National Statistics | 13
Deaths Related to Drug Poisoning in England and Wales, 2012 | 28 August 2013
Table 4: Number of drug-related deaths where selected substances were mentioned on the
death certificate, deaths registered in 2008–2012
England and Wales
Deaths
2008
2009
2010
2011
2012
All drug
poisoning
deaths
2,928
2,878
2,747
2,652
2,597
Heroin and
Morphine
897
880
791
596
579
Methadone
378
408
355
486
414
All
amphetamines
99
76
56
62
97
MDMA/Ecstasy
44
27
8
13
31
PMA / PMMA
0
0
0
1
20
Novel
psychoactive
substances
25
26
22
29
52
0
0
6
6
18
All
benzodiazepines
230
261
307
293
284
Diazepam
133
160
186
179
207
All
antidepressants
383
406
381
393
468
Tricyclic
antidepressants
(BNF 4.3.1)
229
219
194
200
233
Selective
serotonin
re-uptake
inhibitors (BNF
4.3.3)
116
113
136
127
158
Other
antidepressants
(BNF 4.3.2 and
4.3.4)
50
83
74
84
104
260
255
199
207
182
83
87
132
154
175
Cathinones
Paracetamol
Tramadol
4
Office for National Statistics | 14
Deaths Related to Drug Poisoning in England and Wales, 2012 | 28 August 2013
Other opiate
(including
Codeine and
Dihydrocodeine)
Helium
2008
2009
2010
2011
2012
381
418
418
418
348
12
21
33
42
58
Table source: Office for National Statistics
Table notes:
1. Underlying cause of death was defined using the International Classification of Diseases, Tenth Revision (ICD-10).
The ICD-10 codes used to select deaths related to drug poisoning are shown in Background note 4.
2. Figures are for deaths registered, rather than deaths occurring in each calendar year. Due to the length of time it
takes to complete a coroner’s inquest, it can take months or even years for a drug-related death to be registered.
More details can be found in the ‘Impact of registration delays on drug-related deaths’ section below.
3. Figures for England and Wales include deaths of non-residents.
4.
Dextropropoxyphene is very rarely ingested except in combination with paracetamol, therefore figures include
dextropropoxyphene mentioned without paracetamol.
Download table
XLS format
(61 Kb)
Figure 4: Age-standardised mortality rates for selected substances, males, deaths registered
in 2008–2012
England and Wales
Office for National Statistics | 15
Deaths Related to Drug Poisoning in England and Wales, 2012 | 28 August 2013
Source: Office for National Statistics
Notes:
1. Age-standardised mortality rates per one million population, standardised to the 1976 European Standard
Population. Age-standardised rates are used to allow comparison between populations which may contain different
proportions of people of different ages.
2. Rates for 2008–11 have been recalculated using revised mid-year population estimates which take account of the
2011 Census and may therefore differ from previously published figures.
3. Cause of death was defined using the International Classification of Diseases, Tenth Revision (ICD-10). The
4.
5.
underlying cause of death codes used to select deaths related to drug poisoning are shown in Background note 4.
Figures are for deaths registered, rather than deaths occurring in each calendar year. Due to the length of time it
takes to complete a coroner’s inquest, it can take months or even years for a drug-related death to be registered.
More details can be found in the ‘Impact of registration delays on drug-related deaths’ section below.
Figures for England and Wales include deaths of non-residents.
Download chart
XLS format
(55.5 Kb)
Figure 5: Age-standardised mortality rates for selected substances, females, deaths
registered in 2008–2012
England and Wales
Source: Office for National Statistics
Office for National Statistics | 16
Deaths Related to Drug Poisoning in England and Wales, 2012 | 28 August 2013
Notes:
1.
2.
3.
4.
5.
Age-standardised mortality rates per one million population, standardised to the 1976 European Standard
Population. Age-standardised rates are used to allow comparison between populations which may contain different
proportions of people of different ages.
Rates for 2008–11 have been recalculated using revised mid-year population estimates which take account of the
2011 Census and may therefore differ from previously published figures.
Cause of death was defined using the International Classification of Diseases, Tenth Revision (ICD-10). The
underlying cause of death codes used to select deaths related to drug poisoning are shown in Background note 4.
Figures are for deaths registered, rather than deaths occurring in each calendar year. Due to the length of time it
takes to complete a coroner’s inquest, it can take months or even years for a drug-related death to be registered.
More details can be found in the ‘Impact of registration delays on drug-related deaths’ section below.
Figures for England and Wales include deaths of non-residents.
Download chart
XLS format
(63 Kb)
Heroin and Morphine
Over half (52%) of all deaths related to drug poisoning involved an opiate drug, in fact in men aged
30 to 39, nearly two thirds (63%) of drug-related deaths involved an opiate. In 2012, as in previous
years, the most commonly mentioned opiates were heroin and/or morphine, which were involved in
579 deaths (see Background note 8). Although these substances are involved in many drug-related
deaths, the mortality rate for males has fallen sharply in recent years, down from 27.7 deaths per
million population in 2009 to 15.6 in 2012. This is a 44% fall and the lowest rate since 1997. The
female mortality rate for deaths involving heroin/morphine increased slightly between 2011 and 2012
from 4.4 to 5.2 deaths per million population, but was still much lower than the corresponding rate in
males.
Evidence suggests that in 2010/11 there was a ‘heroin drought’ in the UK, with reduced availability
of heroin persisting in some areas in 2011/12 and 2012/13 (SOCA, 2011, 2012 and 2013). Also, the
typical street heroin purity has fallen from 46% in September 2009 to around 15–20% in 2012/13
(SOCA, 2011 and 2013).
Public Health England (2013) report that the number of people starting treatment for heroin and/
or crack addiction (including those returning to treatment) fell from 64,288 in 2005-06 to 47,210
in 2011-12. They suggest this is because treatment has helped to shrink the pool of heroin and
crack addicts in England. However, evidence from the Crime Survey for England and Wales (Home
Office, 2012) suggests generally there has been little variation in heroin use year on year since their
measurement began.
A combination of these factors may explain the decline in deaths involving heroin/morphine that has
been seen over the last few years.
Office for National Statistics | 17
Deaths Related to Drug Poisoning in England and Wales, 2012 | 28 August 2013
Methadone
In 2012 there were 414 deaths involving methadone (an opiate substance used to treat heroin
addiction, which is sometimes abused). The male mortality rate for deaths involving methadone
decreased by 16% from 13.4 deaths per million population in 2011 to 11.3 in 2012. The equivalent
rate for females decreased by 9% between 2011 and 2012 (from 4.2 to 3.8 to deaths per million
population). Despite this fall, the female mortality rate for deaths involving methadone is still the
second highest on record.
Cocaine
There were 139 deaths involving cocaine in 2012. The male mortality rate declined significantly
between 2008 and 2011, but then increased again slightly in 2012 to 4.3 deaths per million
population in 2012. The equivalent rate in females was lower than for males (0.8 deaths per million
population in 2012), and this rate has remained relatively unchanged since 2009 (see Background
note 9).
Amphetamines and Ecstasy
The number of deaths involving amphetamines increased from 62 deaths in 2011 to 97
in 2012. In addition to amphetamine itself, the amphetamines group includes a variety of
substances such as ecstasy, methylamphetamine, paramethoxyamphetamine (PMA) and paramethoxymethamphetamine (PMMA). There were almost four times as many deaths involving
ecstasy in 2012 compared with 2010 (31 deaths and eight deaths respectively). In addition,
there was a large increase in the number of death certificates mentioning PMA or PMMA. These
substances were only involved in one death in 2011, but were involved in 20 in 2012 (a small
number of these deaths also mentioned ecstasy). It has been suggested that people may be
ingesting PMA/PMMA in the belief that they are taking ecstasy tablets (Frank, 2013). However, there
is not enough information recorded on coroner’s death certificates to confirm if this was the case for
the deaths registered in 2012.
New psychoactive substances (including ‘legal highs’)
Over the past few years a number of new drugs have been controlled under the Misuse of
Drugs Act (1971), including synthetic cannabinoid receptor agonists (for example, ‘spice’),
gamma-hydroxybutyrate (GHB) and its precursor gamma-butyrolactone (GBL), piperazines
(benzylpiperazine – BZP and trifluoromethylphenylpiperazine – TFMPP), cathinones such as
mephedrone, and pipradrols such as desoxypipradrol. This group of substances are sometimes
called legal highs, but most are now controlled under the Misuse of Drugs Act (1971), so will be
referred to as new psychoactive substances (NPS) in this report. There is no official definition of
NPS, and the drugs included in this category in this bulletin are listed in Background note 11. This
grouping may be revised in future years.
Although the number of deaths involving NPS are low compared with the number of deaths from
heroin/morphine poisoning, NPS deaths increased sharply in the last year from 29 deaths in 2011
to 52 deaths in 2012 (see Background note 11). In particular, death involving cathinones tripled
Office for National Statistics | 18
Deaths Related to Drug Poisoning in England and Wales, 2012 | 28 August 2013
from six deaths in 2011 to 18 deaths in 2012. This was despite evidence from the Crime Survey for
England and Wales suggesting that the proportion of 16 to 59-year-olds using mephedrone in the
last year has declined since 2010/11 (Home Office, 2013).
Benzodiazepines
There were 284 drug poisoning deaths involving benzodiazepines in 2012. Mortality rates in males
increased significantly from an all-time low of 4.5 deaths per million population in 2006 to an alltime high of 7.9 deaths per million population in 2011, but fell slightly to 7.3 deaths per million in
2012. Equivalent mortality rates in females were significantly lower than in males at 2.8 deaths per
million population in 2012, but have risen slightly since 2011. Diazepam was the most common type
of benzodiazepine mentioned on deaths certificates in 2012, and was involved in 207 deaths, the
highest number on record.
The increase in deaths involving diazepam is consistent with a recent survey suggesting that
there has been a continued increase in the use and availability of illicit benzodiazepines, such as
diazepam (Daly, 2012). However, the role of diazepam and other benzodiazepines in drug-related
deaths is unclear, as more than 9 out of 10 deaths involving benzodiazepines also mentioned
another drug.
Antidepressants
There were 468 deaths involving antidepressants in 2012, up from 393 in 2011. This increase was
seen across all classes of antidepressants. Mortality rates were similar in males and females in 2011
(7.8 and 8.5 deaths per million population respectively), and both rose slightly between 2011 and
2012. The female mortality rate was the highest since 1999.
Deaths involving tricyclic antidepressants (TCAs) increased from 200 in 2011 to 233 in 2012,
and the majority of these deaths involved amitriptyline (155 deaths in 2012, see Reference Table
6a (303.5 Kb Excel sheet)). Although TCAs are still involved in more deaths than other types of
antidepressants, the number of deaths from TCA poisoning are now much lower than their peak of
497 deaths in 1998.
Deaths involving Selective Serotonin Re-uptake Inhibitors (SSRIs) have been steadily increasing,
and reached their highest ever level in 2012 (158 deaths). The majority of these deaths involve the
SSRI drug citalopram (101 deaths in 2012). Studies show that SSRIs are less toxic in overdose
than TCAs (Hawton et al, 2010), but SSRIs are prescribed more frequently. In the last five years
prescriptions for SSRIs have increased more rapidly than prescriptions for TCAs (Health and Social
Care Information Centre – HSCIC, 2009 and 2013), which may explain the rise in deaths involving
SSRIs.
In 2012 deaths involving other types of antidepressants reached a record high, at 104 deaths.
Reference Table 6a shows that in 2012 the majority of these deaths involved venlafaxine or
mirtazapine (British National Formulary section 4.3.4, British Medical Association and Royal
Pharmaceutical Society, 2013) with only one death involving a Monoamine-Oxidase Inhibitor – MAOI
(BNF section 4.3.2). National Institute for Health and Clinical Excellence guidelines (NICE, 2009)
suggest that these drugs should not be used as a first-line treatment for depression, and should only
Office for National Statistics | 19
Deaths Related to Drug Poisoning in England and Wales, 2012 | 28 August 2013
be prescribed to people who have not responded to SSRIs. Venlafaxine in particular is associated
with a greater risk of death from overdose.
Prescriptions for ‘other antidepressant drugs’ like venlafaxine and mirtazapine (BNF section 4.3.4)
accounted for only 17% of all antidepressant prescriptions in 2012. However, prescriptions for this
type of antidepressant increased by 60% between 2008 and 2012 (HSCIC, 2009 and 2013), which
may partly explain the increase in deaths.
Paracetamol and other analgesics
There were 182 deaths involving paracetamol and its compounds in 2012. The mortality rates for
males and females were similar, and both decreased slightly between 2011 and 2012. During this
period the male mortality rate decreased from 3.0 to 2.7 deaths per million population (the lowest
rate since records began). In females, the equivalent rate went down from 3.6 to 3.2 deaths per
million population, but has largely remained stable since 2007.
Tramadol
A notable trend that has emerged in recent years is the steady increase in the number of deaths
mentioning tramadol (a synthetic opioid analgesic). The first recorded death was in 1996, and
deaths have risen to an all-time high of 175 deaths in 2012. This increase in deaths may be partly
explained by a 35% increase in tramadol prescriptions over the last five years (HSCIC, 2009 and
2013). In addition, the latest ‘Street drug trends survey’ carried out among police forces, drug
agencies, frontline treatment services and drug user groups highlighted the continued rise in the
recreational use of tramadol and other synthetic opioids (Daly, 2012). Unlike most other opioid
analgesics, tramadol is not controlled under the Misuse of Drugs Act 1971. However, the Advisory
Council on the Misuse of Drugs (ACMD) have recently advised that tramadol be controlled as a
class C substance under the Misuse of Drugs Act 1971, (ACMD, 2013). In response to the ACMD
recommendation the Government is running a public consultation to assess the impact of controlling
tramadol on the healthcare sector in particular.
Helium
There were 58 deaths mentioning helium in 2012, almost five times higher than the 12 deaths
recorded in 2008 (see Background note 12 for further information on helium deaths). Although
the number of deaths involving these substances is still relatively small, the large increases are of
particular interest to those concerned with suicide prevention, as almost all of these deaths were
suicides. The National Suicide Prevention Strategy Advisory Group are considering options to
reduce these deaths.
Geographical variations in deaths related to drug misuse
In England, the mortality rate for deaths related to drug misuse declined significantly between 2008
and 2012 (from 34.7 to 25.4 deaths per million population). The equivalent mortality rate in Wales
peaked at 53.4 deaths per million population in 2010 (though due to registration delays, the exact
timing of this peak may have been in 2009, see the ‘Impact of registration delays’ section below for
Office for National Statistics | 20
Deaths Related to Drug Poisoning in England and Wales, 2012 | 28 August 2013
more details). Mortality rates in Wales have since fallen slightly to 45.8 deaths per million in 2012,
but were still significantly higher than the England average between 2009 and 2012.
There was considerable regional variation within England. In 2012 the lowest mortality from deaths
related to drug misuse was in London (17.2 deaths per million population), where the rates have
generally been low over the last five years. The regions with the highest mortality rates over the last
five years were the North East and North West. In 2012 mortality rates in the North were more than
double that of London (37.4 and 41.0 deaths per million population in the North East and North West
respectively).
Table 5: Age-standardised mortality rate per million population for deaths related to drug
misuse, by country and region, deaths registered in 2008–2012
England and Wales
Deaths
Country and
Region
2008
2009
2010
2011
2012
34.7
32.9
30.8
27.4
25.4
North East
47.0
53.9
47.8
41.5
37.4
North West
50.1
47.3
40.5
44.3
41.0
Yorkshire and
The Humber
37.7
36.9
35.8
29.1
30.3
East Midlands
27.0
29.5
23.8
21.7
21.0
West
Midlands
31.5
23.9
28.2
22.8
23.2
East of
England
32.5
25.7
23.2
26.9
22.3
London
28.1
24.8
26.0
19.4
17.2
South East
26.9
31.7
28.7
23.5
20.5
South West
45.4
40.5
35.6
30.2
29.2
39.9
47.1
53.4
48.3
45.8
England
Wales
Table source: Office for National Statistics
Table notes:
1. Age-standardised mortality rates per one million population, standardised to the 1976 European Standard
Population (see Background note 13).
2. Cause of death was defined using the International Classification of Diseases, Tenth Revision (ICD-10). Deaths
were included where the underlying cause was due to drug poisoning and where a drug controlled under the
Misuse of Drugs Act 1971 was mentioned on the death certificate (see Background notes 4 and 5).
3. Deaths are for persons usually resident in each country and region, based on boundaries as of May 2013.
Office for National Statistics | 21
Deaths Related to Drug Poisoning in England and Wales, 2012 | 28 August 2013
4.
Figures are for deaths registered, rather than deaths occurring in each calendar year. Due to the length of time it
takes to complete a coroner’s inquest, it can take months or even years for a drug-related death to be registered.
More details can be found in the ‘Impact of registration delays on drug-related deaths’ section below.
Download table
XLS format
(61.5 Kb)
Comparisons with the rest of the UK
Figures on drug-related deaths in Scotland are available from National Records of Scotland and the
Information Services Division of NHS Scotland.
Figures for Northern Ireland are available from the Northern Ireland Statistics and Research Agency.
Figures for Europe are available from the European Monitoring Centre for Drugs and Drug Addiction
(EMCDDA).
Figures for other countries may not be comparable with figures presented above for England and
Wales, due to differences in data collection methods and in the death registration system.
Impact of registration delays on drug-related deaths
In England and Wales almost all drug-related deaths are certified by a coroner following an inquest.
The death cannot be registered until the inquest is completed, which can take many months or even
years, and ONS is not notified that a death has occurred until it is registered. If someone is to be
charged in relation to the death, the coroner must adjourn the inquest, and they may carry out an
accelerated registration. However, the full details are not recorded until the inquest is completed,
and these accelerated registration deaths are not included in the drug-related deaths figures.
In common with most other mortality statistics, figures for drug-related deaths are presented
for deaths registered in a particular calendar year, which enables figures to be published in a
timely manner. The alternative would be to publish statistics based on the year in which the death
occurred. However, if ONS were to do this the publication would be delayed by at least six months
to allow enough time for the majority of the deaths that occurred in a given year to be registered. If it
was produced any earlier the data would be incomplete, and hence inaccurate.
Due to the length of time it takes to hold an inquest, this bulletin actually presents information on
deaths that may have occurred months or even years ago. Out of the 2,597 drug-related deaths
registered in 2012, 1,358 (just over half) occurred in years prior to 2012. This makes it more difficult
to evaluate how changes such as the heroin drought or the banning of certain new psychoactive
substances have affected drug-related deaths. It also makes it more difficult to compare trends in
drug-related deaths between local areas, as registration delays vary considerably across England
and Wales.
Office for National Statistics | 22
Deaths Related to Drug Poisoning in England and Wales, 2012 | 28 August 2013
Figure 6: Average registration delay for all drug poisoning deaths and deaths related to drug
misuse, deaths registered in 1993–2012
England and Wales
Source: Office for National Statistics
Notes:
1. The registration delay is calculated as the difference between the date each death occurred and the date it was
registered, measured in days. The average delay is represented using the median. Additional information on the
calculation of registration delays is provided Background note 16.
2. Cause of death was defined using the International Classification of Diseases, Ninth Revision (ICD-9) for the years
1993 to 2000 and Tenth Revision (ICD-10) from 2001 onwards. The underlying cause of death codes used to select
'all drug poisonings' and 'drug misuse' deaths are shown in Background note 4. Drug misuse as defined by the
3.
4.
current headline indicator shown in Background note 5. Deaths from drug misuse are included in the figures for all
drug poisoning.
Figures are for deaths registered, rather than deaths occurring in each calendar year.
Figures for England and Wales include deaths of non-residents.
Download chart
XLS format
(61 Kb)
Figure 6 shows that the average registration delay has gradually increased over time. In 1993 the
average delay was 70 days for all drug-related deaths, and this had more than doubled to 170 days
in 2012. However, registration delays have remained virtually unchanged since 2008, suggesting the
upward trend has stabilised. Over the same period the number of deaths from all causes that were
Office for National Statistics | 23
Deaths Related to Drug Poisoning in England and Wales, 2012 | 28 August 2013
referred to coroners increased from 22% in 1993 to a peak of nearly 40% in 2010, but has since
levelled off. This increase may have contributed to the lengthening registration delays. Figure 6 also
shows that deaths related to drug misuse took five days longer to register than other types of drug
poisoning deaths in 2012.
Downloadable reference tables
A back series of data on deaths related to drug poisoning in England and Wales between 1993 and
2012 are available to download in a Microsoft Excel workbook from the ONS website (303.5 Kb
Excel sheet).
The workbook contains the following tables:
•
•
•
•
•
•
•
•
•
•
•
•
•
•
•
Table 1: Number of deaths from drug-related poisoning and drug misuse, by sex and country,
England and Wales, deaths registered in 1993–2012
Table 2: Number of deaths from drug-related poisoning by sex and underlying cause, England
and Wales, deaths registered in 1993–2012
Table 3: Number of deaths related to drug misuse by sex and underlying cause, England and
Wales, deaths registered in 1993–2012
Table 4: Number of deaths from drug-related poisoning by sex and age, England and Wales,
deaths registered in 1993–2012
Table 5: Number of deaths related to drug misuse by sex and age, England and Wales, deaths
registered in 1993–2012
Table 6a: Number of drug-related deaths where selected substances were mentioned on the
death certificate, England and Wales, deaths registered in 1993–2012
Table 6b: Number of drug-related deaths where selected substances were mentioned without
other drugs, England and Wales, deaths registered in 1993–2012
Table 6c: Number of drug-related deaths where selected substances were mentioned with
alcohol, England and Wales, deaths registered in 1993–2012
Table 7: Number of deaths and age-standardised mortality rate for deaths related to drug misuse,
by country and region, England and Wales, deaths registered in 1993–2012
Figure 1: Age-standardised mortality rates for deaths related to drug poisoning and drug misuse,
by sex, England and Wales, deaths registered in 1993–2012
Figure 2: Age-specific mortality rates for deaths related to drug misuse, males, England and
Wales, deaths registered in 1993–2012
Figure 3: Age-specific mortality rates for deaths related to drug misuse, females, England and
Wales, deaths registered in 1993–2012
Figure 4: Age-standardised mortality rates for selected substances, males, England and Wales,
deaths registered in 1993–2012
Figure 5: Age-standardised mortality rates for selected substances, females, England and Wales,
deaths registered in 1993–2012
Figure 6: Average registration delay for all drug poisoning deaths and deaths related to drug
misuse, England and Wales, deaths registered in 1993–2012
Office for National Statistics | 24
Deaths Related to Drug Poisoning in England and Wales, 2012 | 28 August 2013
References
1.
2.
3.
4.
5.
6.
The Advisory Council on the Misuse of Drugs (2000) Reducing drug related deaths, Home
Office: London.
The Advisory Council on the Misuse of Drugs (2013) ‘ACMD consideration of tramadol’
British Medical Association and Royal Pharmaceutical Society (2013) ‘British National Formulary
65’, BMJ Group and Pharmaceutical Press.
Christophersen O, Rooney C and Kelly S (1998) ‘Drug related deaths: methods and trends’,
Population Trends 93, 29–37.
Daly (2012) ‘2012 Street Drug Trends Survey’ Druglink November/December 2012
Department of Health (2001) ‘The Government Response to the Advisory Council on the Misuse
of Drugs Report into Drug Related Deaths’.
7.
The European Monitoring Centre for Drugs and Drug Addiction (2013) ‘Statistical Bulletin 2013:
Drug-related deaths and mortality’
8.
Frank (2013) ‘What is PMA’
9.
Hawton K, Bergen H, Simkin S, Cooper J, Waters K, Gunnell D and N Kapur (2010) ‘Toxicity
of antidepressants: rates of suicide relative to prescribing and non-fatal overdose’, The British
Journal of Psychiatry 196, 354-358.
Hawton K, Bergen H, Simkin S, Wells C, Kapur N and Gunnell D (2012) ‘Six-Year Follow-Up
of Impact of Co-proxamol Withdrawal in England and Wales on Prescribing and Deaths: TimeSeries Study’, PLOS Medicine.
Health and Social Care Information Centre (2009) ‘Prescription Cost Analysis: England 2008’.
Health and Social Care Information Centre (2013) ‘Prescription Cost Analysis: England 2012’.
Home Office (2010) ‘Drug Strategy 2010 – Reducing demand, restricting supply, building
recovery: supporting people to live a drug-free life'.
Home Office (2012) 'Drug misuse declared: findings from the 2011 to 2012 Crime Survey for
England and Wales'.
Home Office (2013) 'Drug misuse: findings from the 2012 to 2013 Crime Survey for England and
Wales (CSEW)'.
The Misuse of Drugs Act (1971) The Stationery Office Ltd.
National Institute for Health and Clinical Excellence – NICE (2009) ‘Quick reference guide:
Depression’.
National Treatment Agency (2012) ‘Drug treatment in England: the road to recovery’.
Office for National Statistics (2002) ‘Report: Deaths related to drug poisoning: results for
England and Wales, 1993 to 2000’, Health Statistics Quarterly 13, 76–82.
Office for National Statistics (2011) ‘Results of the ICD-10 v2010 bridge coding study, England
and Wales, 2009’.
Public Health England (2013) ‘Falling drug use: the impact of treatment’
SOCA (2011) ‘Serious Organised Crime Agency Annual Report and Accounts 2010/11’
SOCA (2012) ‘Serious Organised Crime Agency Annual Report and Accounts 2011/12’
SOCA (2013) ‘Serious Organised Crime Agency Annual Report and Accounts 2012/13’
10.
11.
12.
13.
14.
15.
16.
17.
18.
19.
20.
21.
22.
23.
24.
Office for National Statistics | 25
Deaths Related to Drug Poisoning in England and Wales, 2012 | 28 August 2013
25. Welsh Government (2013) ‘Substance Misuse Delivery Plan 2013 – 2015’
26. World Health Organisation – WHO (2010) International Statistical Classification of Diseases and
Related Health Problems, volumes 1, 2 and 3 (Tenth Revision). WHO: Geneva.
Background notes
1.
Quality information
Further information about the quality of drug-related deaths data can be found in the Quality and
Methodology Information (QMI) paper.
2.
Mortality metadata
Information about the underlying mortality data, including details on how the data is collected
and coded are available in the mortality metadata.
3.
Drug poisoning database
The figures presented in this bulletin have been produced using a special database of deaths
related to drug poisoning, which has been developed to facilitate research into these deaths
and to aid the identification of specific substances involved. The database is extracted from
the national mortality database for England and Wales. Deaths are included if the underlying
cause of death is regarded as drug-related, according to the National Statistics definition. More
information on this definition and issues relating to the interpretation of drug-related deaths data
can be found in Christophersen et al (1998).
Almost all deaths on the drug poisoning database had a coroner’s inquest. For each death the
database includes the following information:
•
•
•
•
4.
The ICD codes for underlying cause of death and other causes mentioned on the death
certificate.
Every mention of a substance recorded by the coroner in the cause of death section or
elsewhere on the coroner's certificate after inquest (up to seven substances).
An indicator to show if alcohol is mentioned – this includes a wide variety of scenarios
ranging from evidence of alcohol consumption around the time of death (for example an
empty vodka bottle found at the scene or alcohol found after toxicology tests) to long-term
alcohol abuse and cirrhosis of the liver.
Other information recorded at death registration such as age, sex, marital status, occupation
and place of usual residence.
Definition of a drug-related death
Office for National Statistics | 26
Deaths Related to Drug Poisoning in England and Wales, 2012 | 28 August 2013
International Classification of Diseases, Ninth Revision (ICD-9) and Tenth Revision
(ICD-10) codes used to define deaths related to drug poisoning
Description
ICD-9 Codes
ICD-10 Codes
Mental and behavioural
disorders due to drug use
(excluding alcohol and
tobacco)
292, 304, 305.2–305.9
F11–F16, F18–F19
Accidental poisoning by
drugs, medicaments and
biological substances
E850–E858
X40–X44
Intentional self-poisoning
by drugs, medicaments
and biological substances
E950.0–E950.5
X60–X64
Assault by drugs,
medicaments and
biological substances
E962.0
X85
Poisoning by drugs,
medicaments and
biological substances,
undetermined intent
E980.0–E980.5
Y10–Y14
Download table
XLS format
(17.5 Kb)
5.
Definition of a death related to drug misuse
In 2000 the Advisory Council on the Misuse of Drugs published a report called ‘Reducing Drug
Related Deaths’. In response to this report’s recommendations on improving the present system
for collecting data on drug-related deaths, a technical working group was set up. This group,
consisting of experts across government, the devolved administrations, coroners, toxicologists
and drugs agencies, proposed a headline indicator for drug misuse deaths as part of the
government’s action plan (Department of Health, 2001) to reduce the number of these deaths.
This indicator also takes into account the information needs of the European Monitoring Centre
for Drugs and Drug Addiction. The baseline year for monitoring deaths related to drug misuse
was set as 1999. The definition of the headline indicator using ICD-10 is shown below. The
definition using ICD-9 was published in a previous annual report (Office for National Statistics,
2002).
Cause of death categories included in the headline indicator of drug misuse deaths (the relevant
ICD-10 codes are given in brackets):
Office for National Statistics | 27
Deaths Related to Drug Poisoning in England and Wales, 2012 | 28 August 2013
a) Deaths where the underlying cause of death has been coded to one of the following
categories of mental and behavioural disorders due to psychoactive substance use (excluding
alcohol, tobacco and volatile solvents):
•
•
•
•
•
•
•
opioids (F11)
cannabinoids (F12)
sedatives or hypnotics (F13)
cocaine (F14)
other stimulants, including caffeine (F15)
hallucinogens (F16)
multiple drug use and use of other psychoactive substances (F19)
b) Deaths where the underlying cause of death has been coded to one of the following
categories and where a drug controlled under the Misuse of Drugs Act 1971, was mentioned on
the death certificate:
•
•
•
•
•
Accidental poisoning by drugs, medicaments and biological substances (X40–X44)
Intentional self-poisoning by drugs, medicaments and biological substances (X60–X64)
Poisoning by drugs, medicaments and biological substances, undetermined intent (Y10–
Y14)
Assault by drugs, medicaments and biological substances (X85)
Mental and behavioural disorders due to use of volatile solvents (F18)
Specific rules were adopted for dealing with compound analgesics which contain relatively
small quantities of drugs listed under the Misuse of Drugs Act, the major ones being
dextropropoxyphene, dihydrocodeine and codeine. Where these drugs are mentioned on
a death record, they have been excluded from the drug misuse indicator if they are part of
a compound analgesic (such as co-proxamol, co-dydramol or co-codamol) or cold remedy.
Dextropropoxyphene has been excluded on all occasions, whether or not paracetamol or a
compound analgesic was mentioned. This is because dextropropoxyphene is rarely, if ever,
available other than as part of a paracetamol compound. However, codeine or dihydrocodeine
mentioned without paracetamol or ibuprofen were included in the indicator. This is because they
are routinely available and known to be abused in this form. This approach is the same as that
taken by National Records of Scotland (NRS). Drugs controlled under the Misuse of Drugs Act
1971 include class A, B and C drugs.
6.
Revisions to drug misuse
A small number of revisions were made to the to the drug misuse indicator in 2013 and the full
back series from 1993 has been revised. Several new psychoactive substances which have
been controlled under the Misuse of Drugs Act 1971 in the last few years have been added,
and alkyl nitrites have been removed as they were incorrectly being classed as controlled
substances. These changes affect no more than two deaths a year.
7.
Deaths among people in their 20s and 30s
Office for National Statistics | 28
Deaths Related to Drug Poisoning in England and Wales, 2012 | 28 August 2013
Nearly one in eight deaths among people in their 20s and 30s were drug-related. This figure has
been calculated from the number of deaths from all drug poisonings of people aged 20 to 39,
(1,021 deaths) and the number of deaths from all causes in this age group (8,265 deaths) for
England and Wales in 2012. The number of deaths from all causes, by sex and age is available
on the ONS website.
8.
Heroin and morphine
Heroin (diamorphine) breaks down in the body into morphine, so either heroin and/or morphine
may be detected at post mortem and recorded on the death certificate. Therefore a combined
figure for deaths where heroin or morphine was mentioned on the death certificate is included in
Table 4.
9.
Cocaine
The figure for cocaine in Table 4 includes deaths where cocaine was taken in the form of crack
cocaine. It is not possible to separately identify crack cocaine from other forms of cocaine at
post mortem. Other evidence to distinguish the form of cocaine taken is rarely provided on death
certificates.
10. GHB and GBL
The figure for GHB (gamma-hydroxybutyrate) in Reference Table 6a includes deaths where GBL
(gamma-butyrolactone) was taken. It is not possible to separately identify GBL and GHB at post
mortem as GBL is rapidly converted to GHB when ingested into the human body.
11. List of drugs included as new psychoactive substances
There is no official definition new psychoactive substances. The following substances have been
included in this group in this bulletin:
•
•
•
•
•
•
•
•
•
•
•
•
•
•
•
•
1-(Benzofuran-6-yl)-propan-2-amine
2-(1H-Indol-5-yl)-1-methylethylamine
4-Fluoroephedrine
4-Fluoromethcathinone
4-Methylamphetamine
4-Methylethcathinone
Alpha-methyltryptamine
BZP
Cathinone
Desoxypipradrol
Fluoromethcathinone
GHB
Khat
Legal high
Mephedrone
Methiopropamine
Office for National Statistics | 29
Deaths Related to Drug Poisoning in England and Wales, 2012 | 28 August 2013
•
•
•
•
•
Methoxetamine
Methylenedioxypyrovalerone
Methylone
Synthetic cannabinoid
TFMPP
It is likely that this list will be revised in future as new substances emerge.
12. Helium
The number of deaths mentioning helium reported in this statistical bulletin before 2011 are
likely to be an underestimate, as some deaths involving helium were assigned an underlying
cause of death of hanging, strangulation and suffocation (ICD-10 codes X70 and Y20), and
were not included in the drug poisoning database. From 2011 onwards, we have tried to ensure
that all deaths mentioning helium are coded to the appropriate poisoning code and not as a
suffocation.
13. Calculation of mortality rates
Mortality rates are presented as deaths per one million population. The mortality rates in
Figures 2 and 3 are age-specific rates; and those in Figures 1, 4 and 5 and Table 5 are directly
age-standardised to the 1976 European standard population. Age-standardised rates are
used to allow comparison between populations which may contain different proportions of
people of different ages, including comparisons between males and females and over time.
Eurostat, the statistical institute of the European Union, has decided to update the European
Standard Population, which is used in the calculation of age-standardised rates. ONS will
publish details of the impact of this change on age-standardised rates, and, following user
engagement in Summer 2013, the timetable for implementation of the new standard population
in relevant publications. ONS is consulting on the implementation of the new European Standard
Population between 09 August and 03 October 2013.
Mortality rates are calculated using mid-year population estimates. Rates for 2002–11 have
been recalculated using revised mid-year population estimates which take account of the 2011
Census and therefore differ from previously published figures. Analysis shows that rates have
been consistently revised down, but these changes were small. The differences tended to be
larger at the end of the revision period (2011), than at the beginning (2002) and the biggest
change was seen for female drug poisoning deaths in 2010, with rates decreasing from 29.2 to
28.9 deaths per million population (a 1.0% reduction).
14. Confidence intervals
Excel workbooks containing the data used to produce Figures 1 to 6 and Tables 1 to 5 are
available to download from the ONS website (303.5 Kb Excel sheet). These tables contain both
the mortality rate and the upper and lower confidence limits. These limits form a confidence
interval, which is a measure of the statistical precision of an estimate and shows the range of
uncertainty around the estimated figure. Calculations based on small numbers of events are
often subject to random fluctuations. As a general rule, if the confidence interval around one
Office for National Statistics | 30
Deaths Related to Drug Poisoning in England and Wales, 2012 | 28 August 2013
figure overlaps with the interval around another, we cannot say with certainty that there is more
than a chance difference between the two figures. Within this statistical bulletin, a difference
which is described as ‘significant’, means ‘statistically significant’, assessed by examining the
confidence intervals.
15. Revisions
The ONS revisions policy is available on our website.
16. Calculation of registration delays
Figure 6 presents data on the length of time taken to register a death (also known as the
registration delay) for drug-related deaths. This is calculated as the difference between the date
each death occurred and the date it was registered, measured in days. Data where the exact
date of death was unknown or where either the date of death or date of registration was clearly
recorded incorrectly (that is, the death appeared to have been registered before it occurred)
were excluded from this analysis. Approximately 0.2% of the data were excluded for these
reasons. Analysis showed that the data were positively skewed, and contains some deaths
with very long registration delays (for example, more than eight years). Therefore the average
registration delay has been presented using the median value, as this is not influenced by
extreme values. The median is defined as the value that is halfway through the ordered data set,
below and above which there lies an equal number of data values.
17. Special extracts of data
Special extracts and tabulations of drug poisoning deaths data are available to order (subject to
legal frameworks, disclosure control and agreement of costs, where appropriate). Such requests
or enquiries should be made to:
Mortality Analysis Team, Life Events and Population Sources Division
Office for National Statistics
Government Buildings
Cardiff Road
Newport NP10 8XG
Tel: +44 (0)1633 455341
Email: [email protected]
The ONS charging policy is available on our website.
18. Feedback
We would welcome feedback on the content, format and relevance of this release. Please send
feedback to the postal or email address above.
19. Plan for mortality outputs
Office for National Statistics | 31
Deaths Related to Drug Poisoning in England and Wales, 2012 | 28 August 2013
Future changes to mortality outputs are outlined in the plan for mortality outputs available on the
ONS website.
20. Pre-release access
A list of the names of those given pre-publication access to the statistics and written
commentary is available in this pre-release access list for deaths related to drug poisoning in
England and Wales in 2012. The rules and principles which govern pre-release access are
featured within the Pre-release Access to Official Statistics Order 2008.
21. National Statistics
The UK Statistics Authority has designated these statistics as National Statistics, in accordance
with the Statistics and Registration Service Act 2007 and signifying compliance with the Code of
Practice for Official Statistics.
Designation can be broadly interpreted to mean that the statistics:
•
•
•
•
meet identified user needs
are well explained and readily accessible
are produced according to sound methods
are managed impartially and objectively in the public interest.
Once statistics have been designated as National Statistics it is a statutory requirement that the
Code of Practice shall continue to be observed.
22. Terms and conditions
You may use or re-use this information (not including logos) free of charge in any format or
medium, under the terms of the Open Government Licence. To view this licence, visit the
National Archives website, write to: The Information Policy Team, The National Archives, Kew,
London TW9 4DU, or email: [email protected].
23. Details of the policy governing the release of new data are available by visiting
www.statisticsauthority.gov.uk/assessment/code-of-practice/index.html or from the Media
Relations Office email: [email protected]
These National Statistics are produced to high professional standards and released according to
the arrangements approved by the UK Statistics Authority.
Copyright
© Crown copyright 2013
You may use or re-use this information (not including logos) free of charge in any format
or medium, under the terms of the Open Government Licence. To view this licence, visit
Office for National Statistics | 32
Deaths Related to Drug Poisoning in England and Wales, 2012 | 28 August 2013
www.nationalarchives.gov.uk/doc/open-government-licence/ or write to the Information Policy Team,
The National Archives, Kew, London TW9 4DU, or email: [email protected].
This document is also available on our website at www.ons.gov.uk.
Statistical contacts
Name
Vanessa Fearn
Phone
Department
Email
+44 (0)1633 455341 Office for National [email protected]
Statistics
Issuing Body:
Office for National Statistics
Media Contact Details:
Telephone: 0845 604 1858
(8.30am-5.30pm Weekdays)
Emergency out of hours (limited service): 07867 906553
Email:
[email protected]
Office for National Statistics | 33


© Copyright 2026