
Ten-Year Trends in the Health of Young Children in California
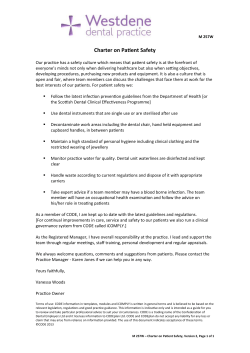
Health Policy Brief
May 2015
Ten-Year Trends in the Health
of Young Children in California:
2003 to 2011-2012
Sue Holtby, Elaine Zahnd, and David Grant
‘‘
There have
been significant
improvements in
health coverage,
dental care,
and parental
involvement.
’’
SUMMARY: This policy brief presents 10year trends in several key health and wellness
indicators for children ages 0-5 in California.
These indicators are health insurance coverage;
source of medical care; dental visits; overweightfor-age; parents singing and reading to their
child and going out with the child; and preschool
attendance. The data are from the California
Health Interview Survey (CHIS), the largest state
health survey in the U.S. The survey gathers
information on a range of health behaviors and
health conditions, as well as on access to health
care among children, adolescents, and adults in
California. A number of these key indicators are
compared by income and by racial/ethnic group.
This policy brief covers the years 2003 to 20112012, a period in which public health efforts
S
This policy brief was made
possible with support from
First 5 California.
ince the passage of the California
Children and Families Act (1998), California
has committed to improving the health and
school readiness of poor and low-income
children ages 0-5. Health and social wellbeing are central to school readiness and the
ability of children to thrive and develop into
happy, productive, engaged adults. Studies
indicate that social and economic factors have
a tremendous impact on the health and wellbeing of very young children.1, 2 Using data
from the California Health Interview Survey
(CHIS), an ongoing statewide health survey,
for children focused on childhood obesity and
improved nutrition, access to low-cost and free
dental services, and the expansion of children’s
health insurance programs. CHIS data show
improvement in health insurance coverage
and access to dental services for low-income
children over the 10-year period. However, the
percentage of children who were overweight for
their age remained unchanged among those
in households with incomes below 200 percent
of the federal poverty level (FPL). In terms of
measures associated with school readiness,
preschool attendance dropped overall between
2003 and 2011-2012, but the proportions of
parents who sang, read, and went out with their
children every day increased significantly during
the 10-year period.
this brief provides findings on the health
and school readiness of California’s young
children for the period from 2003 to 20112012. It follows an earlier policy brief using
CHIS data on trends in child health from
2001 to 2005.3 Child health indicators were
examined for overall trends and differences by
income and by California’s four main racial/
ethnic groups: Latinos, whites, Asians, and
African-Americans.4
The current findings show a mixed picture
in which income disparities have been
UCLA CENTER FOR HEALTH POLICY RESEARCH
2
Uninsured All or Part of Past 12 Months by Income, Children Ages 0-5, California 20032011/12
Exhibit 1
16%
14%
12%
13.0* (10.5-15.4)
10%
8.9** (6.4-11.4)
8%
6%
7.3 (5.5-9.0)
7.9 (6.6-9.1)
5.4 (3.0-7.8)
4%
2%
3.5 (2.5-4.4)
0%
2003
2005
0-199% FPL
‘‘
Low-income
children were
more likely to
have coverage
by 2012.
’’
2007
2009
Total
2011-2012
200%+ FPL
* Significantly higher than rate for 200%+ FPL.
**Significantly lower than 2003 rate but higher than rate for
200%+ FPL.
Source: 2003, 2005, 2007, 2009, 2011-2012 California Health
Interview Surveys
eliminated in some areas, such as access to
dental care and health insurance coverage,
while remaining unchanged in others,
such as overweight-for-age. Trends among
California’s main racial/ethnic groups also
held constant for most of the indicators
included in this policy brief.
and (2) the percentage of children who were
covered by public or private insurance or who
were uninsured at the time of the interview
(Exhibit 2).
Examining trends over the 10-year period
between 2003 and 2011-2012 provides data
that can help guide policy and planning
efforts to best meet the health and school
readiness needs of young children in California.
Uninsured Rate Dropped Among
Low-Income Young Children
Due to a lack of employment-based coverage
and the high cost of buying insurance, lowincome households have historically had
lower rates of health insurance coverage than
middle- and upper-income households.5, 6
To examine both the extent and types of
insurance coverage among young children
in California, this policy brief shows two
rates: (1) the percentage of children who
were uninsured for all or part of the past
12 months by income category (Exhibit 1),
In 2003, approximately one in twelve
children ages 0-5 in California lacked health
insurance for all or part of the preceding 12
months (7.9 percent; Exhibit 1). While this
overall rate remained fairly flat from 2003
to 2011-2012 (7.3 percent in 2011-2012;
Exhibit 1), income-based disparities eased. In
2003, children in households with incomes
below 200 percent of the federal poverty
level (FPL) were significantly more likely to
have been uninsured for all or part of the past
12 months than children in higher-income
households (0-199 percent FPL=13 percent;
200 percent and above FPL=3.5 percent).
By 2011-2012, this income disparity was no
longer significant (0-199 percent FPL=8.9
percent; 200 percent FPL and above=5.4
percent), due to a drop in the percentage of
uninsured children in the low-income group
between 2003 (13.0 percent) and 2011-2012
(8.9 percent; Exhibit 1).
UCLA CENTER FOR HEALTH POLICY RESEARCH
3
Type of Health Insurance Coverage, Children Ages 0-5, California 2003-2011/12
Exhibit 2
70%
60%
56.9 (54.7-59.1)
52.7* (49.7-55.7)
50%
40%
38.5 (36.4-40.7)
43.8** (40.9-46.7)
30%
20%
10%
4.6 (3.6-5.6)
3.5 (2.3-4.7)
0%
2003
2005
Private
2007
2009
Public
Uninsured
2011-12
* 2011-2012 public insurance rate is significantly higher than
public insurance rate in 2003 among 0-5 yrs.
** 2011-2012 private insurance rate is significantly lower than
private insurance rate in 2003 among 0-5 yrs.
Source: 2003, 2005, 2007, 2009, 2011-2012 California Health
Interview Surveys
Public Coverage Increases as Private
Health Insurance Declines
Overall, the proportion of young children
who were uninsured at the time of the
CHIS interview decreased slightly during
the 10-year period, but the decline was not
statistically significant (from 4.6 percent in
2003 to 3.5 percent in 2011-2012; Exhibit 2).
In this policy brief, “public” coverage
refers to enrollment in the Medi-Cal or
Healthy Families programs, and “private”
health insurance means employer-based or
individually purchased plans.
Trend data for public and private health
insurance among young children in California
present a stark contrast between 2003 and
2011-2012. As shown in Exhibit 2, the
trend lines crossed between 2009 and 20112012. In 2003, more than half (56.9 percent)
of children ages 0-5 had private health
insurance; by 2011-2012, that percentage
had dropped to 43.8 percent (Exhibit 2).
During this period, the proportion of young
children with public coverage increased
significantly, from 38.5 percent in 2003 to
52.7 percent in 2011-2012 (Exhibit 2).
‘‘
Disparities in Type of Usual Source of
Medical Care
The majority of children ages 0-5 in California
had a usual source of medical care during the
period from 2003 to 2011-2012 (97 percent).
More than two-thirds of them went to private
providers, which includes private doctors’
offices and health maintenance organizations
(HMOs), and about 30 percent went to
public providers (e.g., community clinics and
hospitals), according to parent reports.
Private health
coverage dropped
significantly
during the
time period.
’’
UCLA CENTER FOR HEALTH POLICY RESEARCH
4
Public Type of Usual Source of Care by Race/Ethnicity, Children Ages 0-5, California
2003-2011/12
Exhibit 3
45%
40%
41.8 (38.5-45.2)
39.6 (35.1-44.0)
35%
30%
25%
28.4 (26.3-30.4)
29.4 (26.4-32.3)
27.0 (12.7-41.3)
26.2 (17.4-35.0)
20%
15%
10%
20.1 (10.9-29.3)
18.0 (13.3-22.8)
14.6 (10.9-18.3)
10.9 (8.9-12.8)
5%
0%
2003
Latino
2005
Total
2007
2009
African-American
2011-12
Asian
White
Source: 2003, 2005, 2007, 2009, 2011-2012 California Health
Interview Surveys
‘‘
Latino children
were more likely
to have a public
usual source
of care.
’’
However, having a public or private usual
source of care differed by racial/ethnic group.
Among young Latino children, 41.8 percent
had a public usual source of care in 2011-2012,
while white (14.6 percent) and Asian
children (20.1 percent) were much less likely
to have a public usual source of care (Exhibit 3).
The public/private rates for Latino and Asian
children were consistent during the 10-year
period, but among white children there was
a significant decrease in the proportion who
had a private usual source of care, from 87.4
percent in 2003 to 82.1 percent in 20112012 (data not shown). Because of the small
sample size of white children who had a
public usual source of care, the increase from
10.9 percent to 14.6 percent during this
period did not reach statistical significance.
Income Differences in Dental Visits
Greatly Reduced
Tooth decay is one of the most common
childhood problems in the U.S. It can lead
to other conditions, such as ear and sinus
infections, and it can affect concentration
and school performance.7 A healthy diet,
good oral hygiene, and regular dental visits
for cleaning and treatment can help prevent
tooth decay. Dentists and pediatricians
recommend that children visit a dentist at
least once a year after getting their first tooth.
UCLA CENTER FOR HEALTH POLICY RESEARCH
5
Visited a Dentist Within the Past 12 Months by Household Income, Children Ages 2-5,
California 2003-2011/12
Exhibit 4
80%
75%
74.3 (71.0-77.6)
(69.1-79.4)
70%
(70.3-78.3)
65%
59.8 (56.5-63.2)
60%
55%
56.3
(53.2-59.0)
50%
52.1* (47.8-56.6)
45%
40%
2003
2005
0-199% FPL
2007
Total
2009
2011-2012
200%+ FPL
* 0-199% FPL significantly lower than 200%+ FPL Source: 2003, 2005, 2007, 2009, 2011-2012 California Health
Interview Surveys
According to parent reports in CHIS, the
proportion of children ages 2-5 who had
visited a dentist in the past year increased
significantly between 2003 and 2011-2012,
from 56.3 percent to 74.3 percent (Exhibit 4).
One of the most positive aspects of this
trend was the rise in dental care utilization
among children living in households with
incomes below 200 percent of the federal
poverty level (FPL). In 2003, these children
were significantly less likely to have visited
a dentist in the past year (52.1 percent) than
children with household incomes at or above
200 percent FPL (59.8 percent). By 2011-2012,
there was no difference between the two
income groups, with 74.3 percent of both
groups reporting at least one dental visit in
the previous 12 months (Exhibit 4). Even
when comparing past-year dental visits
among children in the poorest households
(below 100 percent FPL) with those in
the 300+ percent FPL group, we found no
significant differences (data not shown).
to dental care among children have paid
off. First 5 California funded a $7 million
program between 2004 and 2008 called
“Healthy Smiles,” which provided oral health
training and education to more than 18,000
dental and medical providers at Women,
Infants and Children (WIC), Head Start, and
other child care programs and facilities.
These trends suggest that efforts over the past
decade to improve dental health and access
‘‘
An evaluation of the program found
significant improvements in dental services
for children, as well as in parents’ attention
to brushing or wiping young children’s teeth.
There was also a significant increase in the
percentage of primary care providers who
referred their pregnant patients to a dentist.
Increased awareness of Medi-Cal and Healthy
Families dental benefits was also an aim of
this and other programs, particularly at the
county level. While no causal effect in the
population can be assigned to these programs,
the steady increase in dental care utilization
over the 10-year period measured with CHIS
data paralleled the efforts to improve access
to dental services.
The proportion
of young children
who visited
a dentist in
the past year
increased from
56 percent to
74 percent.
’’
UCLA CENTER FOR HEALTH POLICY RESEARCH
6
Percent Reporting Overweight by Household Income, Children Ages 0-5, California 2003
and 2011-12
Exhibit 5
18%
16%
14%
12%
16.2%
(12.5-19.9)
14.4%
(11.9-16.9)
11.8%
(10.0-13.6)
13.0%
(11.5-14.5)
12.1%
(10.0-14.3)
10%
7.7%*
(5.8-9.5)
8%
6%
4%
2%
0%
2003
2011-2012
0-199% FPL
‘‘
Overweight-forage decreased
significantly
among children
in wealthier
households, but
not among those
in low-income
households.
’’
200%+ FPL
Total
Note: “Overweight” refers to children whose weight is above
the 95th percentile for their age and gender on national
growth charts.
*Significantly lower than the 2003 rate for the 200%+ FPL group.
Source: 2003 and 2011-2012 California Health Interview Survey
Childhood Overweight-for-Age Rates
Remained Constant in Most Groups
CHIS has tracked overweight-for-age rates
among children since 2001. Because of the
inaccuracy of parental reports of children’s
height, CHIS uses the child’s sex, age (in
months), and weight to determine whether
the child is overweight. A child is considered
overweight if he or she is above the ninetyfifth percentile for age and gender on national
growth charts.11 Unlike the body mass index
(BMI), this indicator does not incorporate
height.
Children who are overweight-for-age
(subsequently referred to as overweight)
at young ages are more likely to develop
asthma, diabetes, sleep apnea, and other
health problems than children who are not
overweight.8 Preventing childhood obesity
is a public health priority nationwide and
in California. In 2010, Congress passed
the Healthy, Hunger-Free Kids Act (PL
111-296), which set policy for the U.S.
Department of Agriculture’s (USDA) core
child nutrition programs, including school
lunch programs and the Women, Infants and
Children (WIC) program.9 The goal was to
reduce the amounts of sugar, fat, and salt in
the foods available through these programs.
In California, the first healthy eating campaign
was launched in 1985 with the “California
5 a Day—for Better Health!” program. In
2003, California became the first state in the
nation to ban soda in elementary schools.10
The prevalence of overweight among
children ages 0-5 in California dropped
slightly between 2001 and 2005, from 14
percent to 12 percent. CHIS data from 2003
to 2011-2012 show that the overall rate
remained virtually unchanged (Exhibit 5).3
However, there was a significant decrease in
overweight-for-age among children living
in households with incomes at or above 200
percent FPL. The proportion of overweight
children ages 0-5 in this group dropped
from 11.8 percent in 2003 to 7.7 percent
in 2011-2012 (Exhibit 5). Among children
UCLA CENTER FOR HEALTH POLICY RESEARCH
7
Parent Involvement: Singing, Reading, or Going Out with Child Every Day, Children Ages
0-5, California 2003-2011/12
Exhibit 6
80%
70%
60%
68.2%*
(65.3-71.1)
64.1%
(61.5-66.6)
62.2%*
(59.1-65.2)
52.5%
(49.8-55.1)
50%
40%
37.2%*
(34.3-40.1)
31.5%
(29.1-34.0)
30%
20%
10%
0%
2003
Sings/Plays Music with Child
2011-2012
Reads/Looks at Picture Books with Child
Takes Child Out
* 2011-2012 significantly higher than 2003 for all three variables
Source: 2003, 2005, 2007, 2009, 2011-2012 California Health
Interview Surveys
living in households with incomes below
200 percent FPL, there was no statistically
significant change during the 10-year period
(14.4 percent in 2003 and 16.2 percent in
2011-2012). Changes in the proportions of
Asian, Latino, white, and African-American
children who were overweight were also not
significant during this time period.
years old decreased significantly between
2003-2004 and 2011-2012, from 13.9
percent to 8.4 percent, while California’s rate
remained flat at 12 percent.14
Research based on CHIS data has also
explored the eating habits of young children
and how those habits may contribute to
overweight and obesity.12, 13 While soda
consumption has declined significantly
among young children in California over the
past 10 years, only 57 percent of children
ages two to five eat five servings of fruits and
vegetables per day, and 60 percent eat at least
one fast food meal per week. California has
not witnessed the same decline in obesity
among young children that has occurred
nationally. According to data from the
National Health and Nutrition Examination
Survey (NHANES), the national prevalence
of overweight among children two to five
Parents Are Singing, Reading, and Going
Out More with Their Young Children
‘‘
In 2014, First 5 California started a media
campaign called “Talk, Read, Sing,”
which encourages parents to interact with
their young children to promote brain
development and emotional and social
growth. The First 5 California website has a
range of related activities that parents can do
with their children.15
Since 2003, CHIS has asked parents a set
of questions about how often they read or
look at picture books, play music, or sing
songs with their children or take their child
out somewhere, such as to a park, store, or
playground. Exhibit 6 shows the percentages
of parents who reported doing these activities
every day in 2003 and in 2011-2012. Singing
or playing music with their child was the
Sixty-two percent
of parents said
they read or
looked at picture
books with their
children in
2011–2012,
a 10 percentage
point increase
since 2003.
’’
UCLA CENTER FOR HEALTH POLICY RESEARCH
8
‘‘
In 2012, only
30 percent of
three- and fouryear-olds were
enrolled in
Head Start or
another preschool
program for
10 or more
hours per week.
’’
most common of the three activities, followed
by reading or looking at picture books and
taking the child out (Exhibit 6).
Over the 10-year period, the proportions for
all three activities increased significantly.
In 2003, 64.1 percent of parents reported
singing or playing music with their child
every day; by 2011-2012, that figure had
increased to 68.2 percent. About half (52.5
percent) of parents in 2003 said they had
read or looked at picture books with their
child every day; that proportion had risen to
62.2 percent by 2011-2012. In 2003, onethird (31.5 percent) of the parents surveyed
reported that they took their child out
somewhere every day; in 2011-2012, 37.2
percent of parents reported doing so.
In addition to promoting brain and social
development, the actions of talking, reading,
and singing with young children help prepare
them for school, a top priority of First 5
California. The organization’s investments
in the “Talk, Read, Sing” campaign and in
preschool programs reflect the importance
that First 5 state and county commissions
place on giving all children the ability to
begin school ready to learn.
Preschool Enrollment Declines
This publication contains
data from the California
Health Interview Survey
(CHIS), the nation’s largest
state health survey.
Conducted by the UCLA
Center for Health Policy
Research, CHIS data give
a detailed picture of the
health and health care
needs of California’s large
and diverse population.
Learn more at:
www.chis.ucla.edu
Preschool programs are designed to introduce
children to a fun learning environment that
helps prepare them for kindergarten. Since
2001, CHIS has asked parents whether their
child receives child care for 10 or more hours
per week from “a Head Start or state preschool
program, or from some other preschool or
nursery school.” Grant and Kurosky reported
CHIS data showing that between 2001 and
2003, the proportion of three- and fouryear-olds who were enrolled in Head Start
or another type of preschool for 10 or more
hours per week increased from 25 percent to
37 percent, then stayed the same from 2003
to 2005.3
In 2011-2012, only 30.3 percent of threeand four-year-olds were enrolled in Head
Start or another preschool program for 10 or
more hours per week, a significant decrease
from 2003. The income and racial/ethnic
differences that Grant and Kurosky found
earlier remained consistent. Children living in
households with incomes below 200 percent
FPL were less likely to be enrolled in preschool,
including Head Start (19.5 percent), than
those in households with incomes at or above
200 percent FPL (42.7 percent) (data not
shown). Latino children continued to have the
lowest rate of enrollment (20.5 percent), but
there was a trend toward higher enrollment
among Asian children (32.6 percent in 2003
and 53.8 percent in 2011-2012). White
and African-American children had similar
preschool attendance rates in 2003 (41.3
percent and 38.3 percent, respectively) and
2011-2012 (data not shown). Because the
preschool analyses were limited to three- and
four-year-olds, the sample sizes were too
small for measuring statistical differences
other than the overall trend. However, the
decrease in preschool enrollment among poor
children during the 10-year period (from
27.1 percent to 19.5 percent) nearly reached
statistical significance (p < .057).
Discussion and Recommendations
The findings presented in this policy brief
point to several areas that merit continued
attention as we strive to improve health and
school readiness among young children.
A summary table highlighting the main
findings on trends related to young children’s
health in California is shown on page 9.
Although health insurance coverage has
increased overall among young children
in California, continued monitoring of
uninsured rates and of disparities within
particular communities and income groups
will remain important. In addition, tracking
demographic trends in usual sources of care
among young children will help in state and
local planning and policy efforts.
Closing the income gap in the percent of
children who had at least one dental visit
in the past 12 months was a significant
UCLA CENTER FOR HEALTH POLICY RESEARCH
achievement over the 10-year period. Going
forward, the focus should be on increasing the
rate among all income groups.
Preventing obesity and improving eating
habits have been at the center of public health
efforts in California for more than two decades,
yet overweight rates among young children
are now higher in California than the national
average, and the rate of overweight-for-age did
not improve during the 10-year survey period.
CHIS data show that low-income and Latino
children are more likely to be overweight
than other children. Renewed efforts are
clearly required to reduce these disparities.
The measures of parental actions that
support school readiness—playing music,
reading, and going out with the child—
showed significant increases over the 10-year
period. First 5 campaigns such as “Talk.
Read. Sing.” should continue to promote
parental involvement with young children to
maximize early brain development.
Preschool enrollment rates declined
significantly over the 10-year period. The data
show a trend toward decreased enrollment
among low-income children, many of whom
may qualify for Head Start and other state
programs. Future research could help us to
understand why enrollment among lowincome children is declining. It is important
that policymakers in early childhood
education and health continue to support
access to quality preschools for all young
children.
Data Source and Methods
Data for this policy brief are drawn from the 2003
to 2011-2012 California Health Interview Surveys
(CHIS 2003, 2005, 2007, 2009, 2011-2012), a
random-digit-dial telephone survey of the California
population living in households and the largest
statewide health survey in the nation. Sampling
tolerances at the 95 percent confidence level were
used to calculate statistically significant differences
between groups. All differences between groups
reported in the policy brief are statistically different
at p < .05. Determination of adequate sample size to
report data was based on analysis of the coefficient of
variation (CV), using a criterion of 30.
Author Information
Sue Holtby, MPH, is a program director at the Public
Health Institute (PHI) and staff to the California
Health Interview Survey (CHIS). Elaine Zahnd, PhD,
is a faculty associate at the UCLA Center for Health
Policy Research. David Grant, PhD, is director of
CHIS at the UCLA Center for Health Policy Research.
Funder Information
This policy brief was made possible by funds
received from First 5 California, which is working
to ensure that California’s children receive the best
possible start in life and continue to thrive.
Indicator
2003
2011-2012
Change
Children Without Health Insurance Any Time Past 12 Months
7.9%
7.3%
No
Low-Income Children Without Health Insurance Any Time Past 12 Months
13.0%
8.9%
↓
Children with Public Health Insurance
38.5%
52.7%
↑
Children with Private Health Insurance
56.9%
43.8%
↓
Children Who Had at Least One Dental Visit Past 12 Months (Ages 2-5)
56.3%
74.3%
↑
Low-Income Children with at Least One Dental Visit Past 12 Months
(Ages 2-5)
52.1%
74.3%
↑
Middle- & Upper-Income Children with at Least One Dental Visit
Past 12 Months (Ages 2-5)
59.8%
74.3%
↑
Children Who Are Overweight for Age
13.0%
12.1%
No
Low-Income Children Who Are Overweight for Age
14.4%
16.2%
No
Middle- & Upper-Income Children Who Are Overweight for Age
11.8%
7.7%
↓
Family Member Sings or Plays Music with Child Every Day
64.1%
68.2%
↑
Family Member Reads to Child Every Day
52.5%
62.2%
↑
Family Member Takes Child Out Every Day
31.5%
37.2%
↑
9
UCLA CENTER FOR HEALTH POLICY RESEARCH
10960 Wilshire Blvd., Suite 1550
Los Angeles, California 90024
The UCLA Center
for Health Policy Research
is affiliated with the
UCLA Fielding School of Public Health and
the UCLA Luskin School of Public Affairs.
The analyses, interpretations, conclusions,
and views expressed in this policy brief are
those of the authors and do not necessarily
represent the UCLA Center for Health Policy
Research, the Regents of the University
of California, or collaborating
organizations or funders.
PB2015-2
Copyright © 2015 by the Regents of the
University of California. All rights reserved.
Editor-in-Chief: Gerald F. Kominski, PhD
Phone: 310-794-0909
Fax: 310-794-2686
Email: [email protected]
www.healthpolicy.ucla.edu
Acknowledgments
The authors appreciate the contributions of
Melanie Levy, MS, who conducted the data
analyses at the Center for Health Policy
Research. We would also like to thank David
Dodds and Gretchen Williams of First 5
California for their guidance with the policy
brief. Valuable reviews were provided by Sue
Babey, PhD, senior research scientist at the
Center, and Kristen Marchi, MPH, senior
research scientist and co-director of the
Center on Social Disparities in Health in the
Department of Family and Community Medicine
at the University of California, San Francisco.
Suggested Citation
Holtby S, Zahnd E, Grant D. Ten-Year Trends in
the Health of Young Children in California: 2003 to
2011-2012. Los Angeles, CA: UCLA Center for
Health Policy Research, 2015.
Endnotes
1
2
3
Read this publication online
4
Braveman P, Egerter S, Arena K, Aslam R. 2014.
Issue Brief: Early Childhood Experiences Shape Health
and Well-Being Throughout Life. Robert Wood
Johnson Foundation Commission to Build a
Healthier America. http://www.rwjf.org/commission
Center on the Developing Child at Harvard
University. 2010. The Foundations of Lifelong Health
Are Built in Early Childhood. Cambridge, MA: Harvard
University. http://www.developingchild.harvard.edu
Grant D, Kurosky S. 2008. Trends in the Health of
Young Children in California. Los Angeles, CA: UCLA
Center for Health Policy Research.
The “Asian” category does not include Native
Hawaiians and other Pacific Islanders. Beyond the
four racial/ethnic groups reported, the sample size
for other groups was too small to support statistically
stable results.
5
Mangione-Smith R, DeCristofaro AH, Setodji
CM, et al. 2007. The Quality of Ambulatory Care
Delivered to Children in the United States. New
England Journal of Medicine 357(15): 1515–1523.
6
DeVoe JE, Tillotson CJ, Wallace LS, Lesko SE,
Pandhi N. 2012. Is Health Insurance Enough?
A Usual Source of Care May Be More Important
to Ensure a Child Receives Preventive Health
Counseling. Maternal and Child Health Journal 16
(2):306-315.
7
Kwan SY, Petersen PE, Pine CM, Borutta A. 2005.
Health-Promoting Schools: An Opportunity for
Oral Health Promotion. Bulletin of the World Health
Organization 83(9):677-685. http://www.who.int/
bulletin/volumes/83/9/kwan0905abstract/en/index.html
8
Wang G, Dietz WH. 2002. Economic Burden of
Obesity in Youths Aged 6 to 17 Years: 1979-1999.
Pediatrics 109: 1-6.
9See www.fns.usda.gov/school.meals/healthy-hunger-freekids-act.
10
Senate Bill No. 677 (K-8 Soda Ban; Ortiz) was
passed in 2003 to prevent sodas from being sold on
the campuses of elementary, middle, and junior high
schools in California.
11See http://www.cdc.gov/nchs/about/major/nhanes/
growthcharts/datafiles.htm.
12
Babey SH, Jones M, Yu H, Goldstein H. 2009.
Bubbling Over: Soda Consumption and Its Link to Obesity
in California. Los Angeles, CA: UCLA Center for
Health Policy Research and California Center for
Public Health Advocacy.
13
Holtby S, Zahnd, E, Grant D. 2013. Majority of
Young Children in California Eat Fast Food Regularly
but Drink Less Soda. Los Angeles, CA: UCLA Center
for Health Policy Research.
14See http://www.cdc.gov/nccdphp/dnpa/obesity/childhood/
prevalence.htm.
15See http://www.first5california.com/parents/
parentsactivity-center.


© Copyright 2026