
Health and Health Behaviors of Japanese Americans in California: A
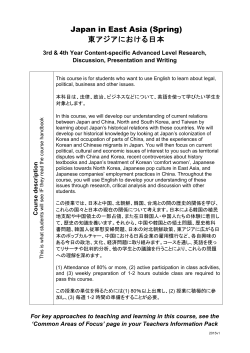
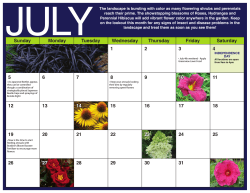
April 2015
Health and Health Behaviors of
Japanese Americans in California: A Sign
of Things to Come for Aging Americans?
Ying-Ying Meng, DrPH
Tamanna Rahman, MPH
Melissa C. Pickett, MPH
Ninez Ponce, PhD, MPP
©iStock.com/rakkogumi
Funded by a grant from Keiro Senior HealthCare
April 2015
Health and Health Behaviors of
Japanese Americans in California: A Sign
of Things to Come for Aging Americans?
Ying-Ying Meng, DrPH
Tamanna Rahman, MPH
Melissa C. Pickett, MPH
Ninez Ponce, PhD, MPP
The UCLA Center for Health Policy Research is based
in the UCLA School of Public Health and affiliated
with the UCLA Luskin School of Public Affairs.
www.healthpolicy.ucla.edu
Funded by a grant from Keiro Senior HealthCare
The views expressed in this report are those of the authors and do not
necessarily represent the UCLA Center for Health Policy Research, the
Regents of the University of California, or collaborating organizations
or funders.
Suggested Citation
Meng YY, Rahman T, Pickett MC, Ponce NA. Health and Health Behaviors
of Japanese Americans in California: A Sign of Things to Come for Aging
Americans? Los Angeles, CA: UCLA Center for Health Policy Research, 2015.
www.chis.ucla.edu
Support for this policy brief was provided by a grant from
Keiro Senior HealthCare.
Copyright © 2015 by the Regents of the University of California.
The UCLA Center for Health Policy Research is based
in the UCLA School of Public Health and affiliated
with the UCLA Luskin School of Public Affairs.
www.healthpolicy.ucla.edu
Read the full report: http://healthpolicy.ucla.edu/publications/search/pages/detail.aspx?PubID=1385
Executive Summary
The Japanese American population is leading the
nation in aging. According to the 2010 U.S. Census,
the number of adults 65 and older among Japanese
Americans (23.6%) was nearly twice the number of
adults in that age group in the general population
(12.9%). The same trend has also been observed in
California. The Japanese American population in
California also has the highest proportion among all
Asian subgroups of individuals who identify as having
mixed-race heritage.1,2 Because of aging, acculturation,
immigration patterns, and increasing diversity among
Japanese Americans, the health status and behaviors
of this group today could well be the face of aging
Americans in general tomorrow. Health conditions
and behaviors among those in the Japanese American
community can provide insights into key aspects of
the aging population and help the U.S. prepare for the
changes ahead.
This report provides a close look at the health and
health behaviors of the Japanese American population
in California. Using data from the California Health
Interview Survey (2003, 2005, 2007, 2009, and 2011-
2012), this report contributes to the understanding of
the health status and health-related characteristics of
Japanese Americans. The report examines a number
of health indicators for Japanese Americans compared
to other Asian ethnic groups in the state (Chinese,
Filipino, Korean, Vietnamese, South Asian, and other
Asian), as well as other racial/ethnic groups (Latinos,
African Americans, Whites, American Indians/
Alaska Natives, and other single and multi-ethnic
Californians). While Japanese Americans are too often
lumped together with other Asian ethnic groups, this
report shows that they have unique health concerns
and assets relative to other Asian ethnic groups and the
general population.
This report looks at 15 indicators related to health
status and health behavior. In the first section of the
report, we look at health areas of concern for Japaneseonly and Japanese-all (explained below), and we then
compare health indicators for Japanese Americans to
Let’s Get Healthy California 2022 targets.3 Health
indicators in which Japanese Americans exceed other
ethnic groups are also examined.
Definitions of Japanese Categories Used in Report
Japanese-Only
Japanese Multiracial
Japanese-All
(monoracial Japanese) Includes those who
report their racial/ ethnic group as “Japanese”
and report belonging only to a single race
and ethnic group.
(mixed-race Japanese) Regardless of which
ethnic group a person identifies with the
most, this category includes those who
report their racial/ ethnic group as Asian and
report belonging to more than one Asian
ethnic group (including Japanese).
Includes anyone who identifies as Japanese:
respondents who report their racial/ethnic
group as Asian and report belonging
to a single Asian ethnic group—in this
case, Japanese (i.e., Japanese-only). If a
respondent reports more than one ethnic
group, the respondent most identifies as
Japanese; also includes those respondents
who respond as multiracial and select
Japanese, but do not necessarily most
identify as Japanese (i.e., Japanese multiracial).
3
The second section of this report looks at subgroups
within the Japanese American population by
specifically looking at the large group of mixed-race
people of Japanese descent. As mentioned previously,
the Japanese American community is a heterogeneous
group that includes not only multiple generations but
also a small immigrant population, a larger elderly
population, and a rapidly growing proportion of
individuals who identify as biracial or multiracial. To
this end, this report also presents novel data on several
health indicators among Californians who identify as
(1) monoracial Japanese (Japanese-only), (2) mixedrace Japanese (multiracial Japanese), and (3) these two
groups as a whole (Japanese-all).
Exhibit 1 highlights some of the key findings of the
comparison of Japanese American adults (i.e., Japaneseall and Japanese-only) with other racial/ethnic groups
and other Asian subgroups.
Exhibit 1.
Key Findings Comparing Japanese Americans
to Other Racial/Ethnic Groups in California,
Adults 18+ Years
Higher Risk
Hypertension: The prevalence of hypertension
was significantly higher among Japanese-only
(39%) and Japanese-all (33%) in comparison to the
overall Asian population (21%). The prevalence of
hypertension among Japanese-only was comparable
to all other racial/ethnic groups except Latinos,
whose rate was lower (27%). The prevalence of
hypertension among Japanese Americans was
higher than the national Healthy People 2020
target of 26.9%.
Arthritis: Japanese Americans reported the highest
prevalence of arthritis (35% for Japanese-all, and
36% for Japanese-only) when compared to all Asian
subgroups except for Vietnamese and other Asian.
Binge drinking: The prevalence of binge drinking
among Japanese Americans was significantly higher
(32% for Japanese-all and 28% for Japanese-only)
than among Chinese (17%) or Vietnamese (14%).
Moderate
Risk*
Diabetes: The prevalence among Japanese-all and
Japanese-only was about 9%, which is higher than
the Let’s Get Healthy California 2022 target (7%) but
comparable to California adults in general.
Obesity: While the prevalence of obesity was
higher among Japanese Americans (~14%)
compared to the Chinese community (6%),
Japanese adults had a significantly lower
prevalence of obesity than all other racial/ethnic
groups, especially in comparison to Latinos (30%)
and African Americans (35%).
Smoking status: The percentages of Japanese-all
and Japanese-only who reported being current
smokers were 12% and 11%, respectively, which
were higher than the Let’s Get Healthy California
2022 target (9%) but comparable to the rates for
both California adults (14%) and Asians overall (11%).
Lower Risk
Health status: The rate of self-reported fair or poor
overall health status was lower among Japaneseall (8%) and Japanese-only (7%) than among the
overall Asian population (20.1%), and it was much
lower compared to Vietnamese (50%), Korean
(31%), and Chinese (19%) respondents.
Psychological distress: The prevalence of serious
psychological distress was lower among Japanese
(5% for Japanese-all and 3% for Japanese-only) than
among all other racial/ethnic groups. However, this
lower rate among the Japanese was comparable to
all other Asian subgroups.
©iStock.com/photosoup
Elderly falls: Japanese adults age 65 and older
had a significantly lower prevalence of falls (7.8%
for Japanese-all and 8.1% for Japanese-only) than
adults age 65+ who were American Indian/Alaska
Native (31%), other single/multiple races (20%),
Latino (15%), or white (14%).
4
Food insecurity: Both Japanese-all and Japaneseonly adults had lower levels of food insecurity (21%)
compared to Filipinos, whose prevalence of food
insecurity was about 41%. The prevalence of food
insecurity among Latinos was 40%, and among
African Americans it was 43%.
*Does not meet Let’s Get Healthy California 2022 targets.
Exhibit 2.
Key Findings Comparing Japanese Subgroups
in California, Adults 18–64 Years
Higher Risk
Fast food consumption: Multiracial Japanese
reported having fast food more often (25%) than
respondents who identified as Japanese-only (11%)
and Japanese-all (15%).
Lower Risk
Hypertension: Multiracial Japanese had the lowest
age-adjusted rate of hypertension (8%) when
compared to Japanese-only (22%) and Japanese-all
(19%). However, higher consumption of fast food—
with its higher sodium content—could exacerbate
hypertension risk among multiracial Japanese as
they age.
The findings of this study highlight the need to
take steps promoting healthy aging, lifestyles, and
diets, while also addressing the challenges associated
with preventable health conditions and declining
quality of life. The findings also highlight the
need to ensure that interventions and programs are
targeted and culturally competent so that health
services are available to meet the needs of the
different Japanese subpopulations. As a result, there
is also a need for more community-based education
and interventions within the Japanese population
in California. More data and studies are needed
to further improve our understanding of Japanese
health and health behaviors, especially for multiracial
Japanese subpopulations. These efforts will position
the Japanese American community in California as
a potential model for the nation in addressing the
needs of the aging population, which in the next few
decades will likely overburden multiple systems.
©iStock.com/imtmphoto
Compared to the general population and often to all
other Asian ethnic groups, Japanese Americans seem
to be in relatively good health. However, when the
three Japanese subgroups defined above are examined,
areas of concern emerge. Exhibit 2 highlights some of
the key differences in Japanese American health, with
Japanese subgroups compared.
5
6
Executive Summary
3
Introduction9
©iStock.com/fotoVoyager
Table of Contents
Table of Contents
7
List of Exhibits
8
Section 1: Japanese-Only and Japanese-All Compared to
Other Racial/Ethnic Groups
Japanese Americans Did Not Fare Well in Certain
Health Indicators
11
Hypertension, Adults Age 18 and Older Arthritis, Adults Age 40 and Older Binge Drinking Past Year, Adults Age 18 and Older Japanese Americans Still Fell Behind “Let’s Get Healthy California 2022” Targets
Diabetes, Adults Age 18 and Older Obesity, Adults Age 18 and Older Current Smokers, Adults Age 18 and Older 11
12
13
14
11
14
15
16
Japanese Americans Lead in Healthy Aging
17
Ever Diagnosed with Heart Disease, Adults 40 and Older (CHIS 2011-2012)
Ever Diagnosed with Stroke, Adults 65 and Older Self-Reported Fair or Poor Health Status, Adults 18 and Older
Serious Psychological Distress, Adults 18 and Older Disability Status, Adults 40 and Older Elderly Falls, Adults 65 and Older Food Insecurity with and without Hunger, Adults 18 and Older Civic Engagement, Adults 18 and Older Internet Use to Access Health Information, Adults 18 and Older
17
Section 2: Multiracial Japanese Compared to Japanese-Only
and Japanese-All
23
Multiracial Japanese Americans Differ from Other Japanese In California 23
Chronic Conditions, Adults 18–64 Health Behavior/Neighborhood & Housing/Food Environment, Adults 18–64
24
24
Section 3: Conclusions and Recommendations
25
Data Source and Methods
27
17
18
19
20
20
21
22
22
Author Information
27
Acknowledgments27
Funding27
Suggested Citation
27
Endnotes28
7
Table of Contents
Appendix29
Sample Size Notes
29
Table 1.1: Chronic Disease Prevalence for Japanese and 30
Respondents of Other Asian Ethnic Subgroups,
Adults 18+, CHIS 2011-2012
Table 1.2: Health Behaviors and Environment for Japanese and
Respondents of Other Asian Ethnic Subgroups,
Adults 18+, CHIS 2011-2012
Table 2.1: Health Behaviors and Environment for Japanese and
Respondents of Other Asian Ethnic Subgroups,
Adults 18+, CHIS 2011-2012
Table 2.2: Health Behaviors and Environment for Japanese and
Respondents of Other Races/Ethnicities, Adults 18+,
CHIS 2011-2012
Table 3.1: Demographic Characteristics and Chronic Disease
Prevention for Californians of Japanese Descent,
Adults 18–64, CHIS 2007, 2009, 2011-2012
Table 3.2: Demographic Characteristics, Health Behaviors,
and Environmental Prevalence for Californians of
Japanese Descent, Adults 18–64, CHIS 2007, 2009,
2011-2012
List of Exhibits
8
Exhibit 1: Key Findings Comparing Japanese Americans to Other Racial/Ethnic Groups in California, Adults 18+
Exhibit 2: Key Findings Comparing Japanese Subgroups in California, Adults 18–64 Years
Exhibit 3: Distribution of Adults by Race/Ethnicity, Adults 65+ Years
Exhibit 4: Prevalence of Hypertension, Adults 18+ Years Exhibit 5: Prevalence of Arthritis, Adults 40+ Years Exhibit 6: Prevalence of Binge Drinking During Past Year
Among Adults 18+ Years
Exhibit 7: Prevalence of Diabetes, Adults 18+ Years Exhibit 8: Prevalence of Obesity, Adults 18+ Years Exhibit 9: Prevalence of Current Smokers, Adults 18+ Years Exhibit 10: Prevalence of Self-Reported Fair or Poor Health Status, Adults 18+ Years
Exhibit 11: Prevalence of Serious Psychological Distress, Adults 18+ Years
Exhibit 12: Prevalence of Elderly Falls, Adults 65+ Years Exhibit 13: Prevalence of Food Insecurity, Adults 18+ Years Exhibit 14: Racial and Ethnic Distribution in California, CHIS 2007, 2009, 2011-2012
Exhibit 15: Prevalence of Fast Food Consumption 4+ Times in Past Week, Adults 18–64 Years
30
31
31
32
32
4
5
9
11
12
13
14
15
16
18
19
20
21
23
24
Introduction
Japanese Americans are leading the nation in aging.
According to the 2010 U.S. Census, the Japanese
American population had close to twice the number
of adults 65 and older (24%) as the general U.S.
population (13%). This trend has also been observed
in California, where there are nearly twice as many
Japanese-only adults age 65 and older as in the
general California elderly population (Exhibit 3).
The aging of Japanese populations in the United
States may be partially due to their longevity,
low birth rates, and immigration patterns. When
compared to other Asian groups, Japanese Americans
have one of the highest percentages of people who
were born in the United States and who primarily
speak English as their first language.2 The Japanese
American population also has the highest proportion
of people who identify as having mixed-race
heritage, which is significantly higher than other
Asian groups.1 Additionally, among Asian American
newlyweds, Japanese have the highest rate of
intermarriage.
Exhibit 3.
Distribution of Adults by Race/Ethnicity, Adults 65+ Years
30.0%
28.4%
27.0%
25.0%
20.0%
23.7%
20.0%
16.5%
15.8%
15.0%
11.8%
10.0%
9.4%
7.7%
5.0%
0.0%
Japaneseall
Japaneseonly
Latino
White
African
American
American
Indian/
Alaska
Native
Other Single/
2+ Races
Asian
overall
California
overall
Source: California Health Interview Survey 2011-2012
9
Using data from the California Health Interview
Survey 2003, 2005, 2007, 2009, and 2011-2012,
this report presents findings related to the health
and health behaviors of the Japanese population
in California. The report provides comparisons of
the health status and health-related characteristics
of Japanese to those of other Asian ethnic groups
(Chinese, Filipino, Korean, Vietnamese, South
Asian, and other Asian) and other racial/ethnic
groups (Latinos, African Americans, Whites,
American Indians/Alaska Natives, and other single
or multiracial/ethnic Californians). It also provides
the first look at novel data on several age-adjusted
health indicators among Californians who identify
as monoracial Japanese (Japanese-only), those
who identify themselves as mixed-race Japanese
(multiracial Japanese), and these two groups as a
whole (Japanese-all). The health-related issues and
behaviors among those in the Japanese American
community can provide key lessons for addressing the
health concerns of the nation’s aging population and
help the U.S. prepare for the changes ahead.
©iStock.com/imtmphoto
Based on the 2010 U.S. Census, most people with
Japanese heritage are concentrated in the Western
states (71%). Thirty-three percent of all Japanese
in the United States live in California, followed
by Hawaii, at 24 percent. Due to the patterns of
aging, acculturation, and increasing diversity among
Japanese Americans, an understanding of the health
status and behaviors of Japanese Americans today
could provide insight and offer help in addressing the
issues that older Americans will face in the coming
decades. This is especially pertinent considering
that by 2050, it is anticipated that the number of
Americans 65 and older will be approximately 89
million, or more than double the number of older
adults in the United States in 2010.4 As Americans
continue to live longer and with proportionately
more older adults than in previous generations, it is
especially crucial to understand the complex issues
associated with an aging community.
10
1
Japanese-Only and Japanese-All
Compared to Other Racial/Ethnic Groups
Japanese Americans Did Not Fare
Well in Certain Health Indicators
Hypertension, Adults Age 18 and Older
(CHIS 2011-2012)
The prevalence of hypertension, or high blood
pressure, for those who identify as Japanese-only
(39%) is nearly double that of the overall Asian
population (21%). Attesting to the idea that Japanese
Americans should not be lumped together with other
Asian subgroups, the prevalence of hypertension
was significantly higher among Japanese adults than
Chinese (20%) and South Asians (8%) (Exhibit 4)
(see Appendix, Table 1.1). And while the prevalence
of hypertension among the Japanese population was
slightly higher than among Californians in general
(30%), it was significantly higher than the prevalence
among Latinos (27%). However, the prevalence of
hypertension among Japanese adults was comparable
to rates among African Americans (43%) and
American Indians/Alaska Natives (43%) (see
Appendix, Table 2.1). Additionally, the prevalence
of hypertension was significantly higher among
Japanese-only and Japanese-all than the national
Healthy People 2020 target of 26.9 percent.
This high prevalence of hypertension—sometimes
called “the silent killer”5—among Japanese Americans
is a major concern. Failure to control high blood
pressure through medication or lifestyle changes can
lead to a number of major health problems, such as
heart disease, stroke, kidney failure, and other health
issues. Risk factors for high blood pressure include
aging and genetics/family history, in addition to
behaviors such as unhealthy diet, alcohol consumption,
smoking, physical inactivity, and obesity.6
Exhibit 4.
Prevalence of Hypertension, Adults Age 18 and Older
39.0%
32.6%
28.0%
29.0%
29.7%
29.8%
20.6%
19.6%
18.1%
7.7%
Japaneseall
Japaneseonly
Chinese
Filipino
Korean
Vietnamese
South
Asian
Other
Asian
Asian
overall
California
overall
Source: California Health Interview Survey 2011-2012
11
Arthritis, Adults Age 40 and Older
(CHIS 2011-2012)
Another chronic condition of major concern among
Japanese Americans is arthritis, which may be due
to the larger proportion of older people among the
population. The Japanese community (Japanese-all
35% and Japanese-only 36%) reported a greater
prevalence of arthritis than Asians in general (23%).
Compared to Japanese adults, the prevalence of
arthritis was also lower among Chinese (21%) and
Koreans (18%). The prevalence of arthritis among
the Japanese population is comparable to the
overall California population (35%) (Exhibit 5 and
Appendix, Tables 1.1 and 2.1).† Arthritis is the most
common cause of disability among adults in the
United States because of its impact on function and
mobility. Some of the disabling effects of arthritis
include activity limitations, work limitations, and
severe pain.
†
Ranking not possible due to confidence interval overlap.
Exhibit 5.
Prevalence of Arthritis, Adults Age 40 and Older
35.3%
35.6%
34.8%
29.7%
26.5%
21.0%
24.2%
22.7%
18.4%
12.5%
Japaneseall
Japaneseonly
Chinese
Filipino
Source: California Health Interview Survey 2011-2012
12
Korean
Vietnamese
South
Asian
Other
Asian
Asian
overall
California
overall
Binge Drinking Past Year, Adults
Age 18 and Older (CHIS 2011-2012)
©iStock.com/kevinruss
Japanese Americans have the highest percentages of
binge drinking (32%) after Filipinos. Binge drinking
is defined as having five or more alcoholic drinks on
at least one occasion in the past year for men, and
four or more drinks for women. Compared to Asians
overall, the prevalence of binge drinking among
Japanese-all adults in California was significantly
higher (32%). More specifically, the prevalence
of binge drinking was higher among all Japanese
respondents than among those who identified as
Chinese (17%) or Vietnamese (14%). It is important
to note that binge drinking rates among all Japanese
respondents seemed to be more similar to those of
Latinos, whites, Filipinos, and the general California
adult population (31%) (Exhibit 6; Appendix,
Table 2.1).
Exhibit 6.
Prevalence of Binge Drinking During Past Year Among Adults 18+ Years
31.9%
35.3%
27.6%
16.9%
Japaneseall
Japaneseonly
Chinese
31.7%
19.5%
Filipino
Korean
13.6%
Vietnamese
20.4%
South
Asian
Other
Asian
22.9%
Asian
overall
31.1%
California
overall
Source: California Health Interview Survey 2011-2012
13
Japanese Americans Still Fell
Behind Let’s Get Healthy California
2022 Targets
along with other lifestyle factors, increases the risk of
diabetes.8 In California, no single major ethnic group
has met the Let’s Get Healthy California 2022 target
of 7% for diabetes prevalence. The prevalence of
diabetes among all Japanese (9%) was comparable to
that among the general California population (9%),
Asians overall (8%), and other racial/ethnic groups.
Diabetes, Adults Age 18 and Older
(CHIS 2011-2012)
The prevalence of diabetes has been increasing, with
a heavier burden felt by many racial/ethnic minority
populations.7 Acculturation to a diet high in fats,
Exhibit 7.
Prevalence of Diabetes, Adults 18+ Years
12.0%
9.4%
Prevalence of Diabetes (%)
10.0%
8.5%
8.0%
Let’s Get Healthy California
2022 target (7%)
8.0%
9.4%
6.0%
4.0%
2.0%
0.0%
Japanese-all
Source: California Health Interview Survey 2011-2012
14
Japanese-only
Asian overall
California overall
Obesity, Adults Age 18 and Older
(CHIS 2011-2012)
In general, obesity is not a prevalent issue among
Japanese respondents compared to other racial/ethnic
groups in California. However, Japanese Californians
had higher obesity rates (14%) than all other major
Asian ethnic groups except Filipinos. Chinese
Californians had a significantly lower prevalence of
obesity (6%) than Japanese-all (Exhibit 8; Appendix,
Table 1.1). The prevalence of obesity among Japanese
adults was also three points higher than the Let’s
Get Healthy California 2022 target (11%), but it
was significantly lower than the prevalence among
Californians in general (23.6%). Japanese adults had
a much lower prevalence of obesity (~14%) than
African Americans (35%), American Indians/Alaska
Natives (33%), Latinos (30%), and whites (22%)
(see Appendix, Table 2.1).
Exhibit 8.
Prevalence of Obesity, Adults 18+ Years
40.0%
35.1%
35.0%
33.1%
30.3%
30.0%
Let’s Get Healthy California
2022 target (11%)
25.1%
25.0%
23.6%
21.8%
20.0%
15.0%
13.1%
10.0%
9.5%
5.0%
0.0%
Japaneseonly
Latino
White
African
American
American
Indian/
Alaska
Native
Other Single/
2+ Races
Asian
overall
California
overall
Source: California Health Interview Survey 2011-2012
15
Current Smokers, Adults 18 and Older
(CHIS 2011-2012)
Smoking is a major public health concern, and over
recent decades there have been successful efforts to
reduce the number of people who smoke. While there
have been reductions in general, it is important to
consider smoking rates among minority populations.
Among Japanese adults, the prevalence of those
who reported being current smokers (Japanese-all
13%, and Japanese-only 11%) was higher than the
Let’s Get Healthy California 2022 target of 9%
(Exhibit 9). The rate of smoking among all Japanese
adults was comparable to that of both Californians
in general (14%) and Asians overall (10%) (Exhibit
9; Appendix, Table 1.1). However, the proportions
of current smokers among both Japanese-all and
Japanese-only were significantly lower in comparison
to the proportions among American Indians/Alaska
Natives (29%) and African Americans (21%) (see
Appendix, Table 2.1).
Exhibit 9.
Prevalence of Current Smokers, Adults 18+ Years
35.0%
30.0%
28.7%
25.0%
Let’s Get Healthy California
2022 target (9%)
20.7%
20.7%
20.0%
14.7%
15.0%
12.5%
13.8%
12.3%
11.2%
10.1%
10.0%
5.0%
0.0%
Japaneseall
Japaneseonly
Latino
Source: California Health Interview Survey 2011-2012
16
White
African
American
American
Indian/
Alaska
Native
Other Single/
2+ Races
Asian
overall
California
overall
Japanese Americans Lead in
Healthy Aging
Ever Diagnosed with Stroke, Adults Age 65 and
Older (CHIS 2003, 2005, 2011-2012)
A major cause of disability among adults, stroke
is the fourth leading cause of death in the United
States.9 In general, certain lifestyle choices—e.g.,
having a diet high in cholesterol and saturated/
trans fats, being physically inactive, being obese,
and consuming too much alcohol—can increase the
risk of stroke.11 The prevalence of stroke among the
Japanese-all 65+ population in California was 7%,
which was comparable to Californians in general
(9%) and Asians overall (6.5%). And even though
Japanese have a larger proportion of older adults,
the prevalence of stroke among all Japanese is
lower in comparison to African Americans (12%)
and American Indians/Alaska Natives (14%) (see
Appendix, Table 2.1).
Ever Diagnosed with Heart Disease, Adults Age
40 and Older (CHIS 2011-2012)
©iStock.com/kevinruss
Heart disease is the leading cause of death in the
United States.9 Certain health conditions and lifestyle
factors can increase the risk of developing heart
disease. For example, those with high blood pressure
or diabetes or who are physically inactive, are obese,
have poor diets, currently smoke, or drink excessive
amounts of alcoholic beverages are at higher risk of
developing heart disease.10 The prevalence of heart
disease among Japanese-all adults was 9%, which
was comparable to Californians in general (11%)
but lower than the prevalence among white adults
(13%). The prevalence of heart disease among the
Japanese population was also comparable to other
Asian subgroups. While the prevalence of heart
disease among Japanese Americans currently may be
comparable to other racial/ethnic groups, the higher
prevalence of hypertension poses a future concern (see
Appendix, Tables 1.1 and 2.1).
17
Self-Reported Fair or Poor Health Status,
Adults Age 18 and Older (CHIS 2011-2012)
to further investigate why there is such a disparity.
Japanese-all and Japanese-only respondents also have
significantly lower rates of self-reported fair or poor
health when compared to the California population
in general (20%). The Japanese community overall
also had a lower rate of self-reported fair or poor
health compared to Latinos (29%), American Indians/
Alaska Natives (25%), African Americans (24%),
those of other single or mixed race/ethnicity (20%),
and whites (14%) (Appendix, Table 2.1). In-depth
analysis to understand this health status assessment
may provide insights into cultural and other factors
that might contribute to perceived good health
among the Japanese American community
in California.
The rate of self-reported fair or poor overall health
was significantly lower among Japanese-all and
Japanese-only than among respondents belonging to
other Asian subgroups. For example, a significantly
greater percentage of Vietnamese (50%), Koreans
(32%), and Chinese (19%) perceived their health to
be fair or poor compared to Japanese-all (8%) and
Japanese-only (7%) (Exhibit 10; Appendix, Table
1.1). These significantly higher rates among other
Asian subgroups compared to the Japanese not only
show how diverse the Asian minority groups are
from each other, but also highlight an opportunity
Exhibit 10.
Prevalence of Self-Reported Fair or Poor Health Status, Adults 18+ Years
49.9%
50.0%
40.0%
30.0%
Let’s Get Healthy California
2022 Target (10%)
19.2%
20.0%
10.0%
31.5%
8.1%
7.2%
Japaneseall
Japaneseonly
15.9%
11.1%
20.1%
20.1%
Asian
overall
California
overall
6.1%
0.0%
Chinese
Source: California Health Interview Survey 2011-2012
18
Filipino
Korean
Vietnamese
South
Asian
Other
Asian
Serious Psychological Distress, Adults Age 18
and Older (CHIS 2007, 2009, 2011-2012)
In California, about 5% of Japanese-all and 3%
of Japanese-only adults reported having serious
psychological distress during the past year (Exhibit
11). The prevalence of reported serious psychological
distress was lower compared to Californians in
general (8%) and all other racial/ethnic groups
except for whites (see Appendix, Tables 1.1 and
2.1). The prevalence of psychological distress among
the Japanese was comparable to all other Asian
subgroups. It is important to highlight, however, that
reporting of psychological distress is dependent on
how respondents view issues related to mental illness,
which is often associated with stigma or shame.
Studies have demonstrated that the unwillingness
among Japanese American families to acknowledge
psychological disorders may prevent elders who are
depressed or experiencing early stages of dementia
from getting appropriate needed and preventive care.2
Exhibit 11.
Prevalence of Serious Psychological Distress, Adults 18+ Years
Japanese-all
Japanese-only
Asian overall
Latino
White
5.1%
3.1%
6.0%
8.7%
7.2%
10.5%
African American
American Indian/Alaska Native
13.2%
Other Single/2+ Races
13.2%
California overall
7.8%
Source: California Health Interview Survey 2007, 2009, 2011-2012
19
Disability Status, Adults 40 and Older
(CHIS 2011-2012)
Elderly Falls, Adults 65 and Older
(CHIS 2003, 2005, 2011-2012)
Twenty-nine percent of Japanese-all and 22% of
Japanese-only reported having some form of disability
due to physical, mental, or emotional conditions.
This rate among Japanese adults was lower than
that among Californians in general (40%). More
specifically, the prevalence of disability among
Japanese-all was lower than that among other single
or mixed-race/ethnicity groups (51%), African
Americans (48%), Latinos (42%), and whites (40%).
American Indians/Alaska Natives had nearly twice
the prevalence of disability (60%) as Japanese-all
(see Appendix, Table 2.1). However, disability
status among Japanese-all and Japanese-only was
comparable to all other Asian subgroups except
Vietnamese (47%) (see Appendix, Table 1.1).
Falls often cause severe disability among the elderly.
Injuries from falls can lead to fear of falling, sedentary
behavior, impaired function, and lower quality
of life. Despite the larger proportion of elderly
among Japanese Americans, older Japanese had a
significantly lower prevalence of falls than older
adults in the general California population (14%)
(Exhibit 12). More specifically, the prevalence of
elderly falls was nearly four times higher among
American Indians/Alaska Natives (31%) than among
Japanese-all (8%) (see Appendix, Table 2.2). The rate
of elderly falls among the Japanese was similar to that
among other Asian subgroups.
Exhibit 12.
Prevalence of Elderly Falls, Adults 65+ Years
Japanese-all
7.9%
Japanese-only
8.1%
Asian overall
7.9%
Latino
White
African American
15.1%
14.1%
13.0%
American Indian/Alaska Native
31.2%
20.0%
Other Single/2+ Races
California overall
13.6%
Source: California Health Interview Survey 2007, 2009, 2011-2012
20
Food Insecurity with and without Hunger,
Adults 18 and Older
(CHIS 2007, 2009, 2011-2012)
rate of food insecurity of all ethnic groups. However,
one-fifth of Japanese-all were still food insecure
(Exhibit 13). Among Asian subgroups, Japanese-all
and Japanese-only adults had lower levels of food
insecurity (with and without hunger) when compared
to Filipinos, whose prevalence of food insecurity
was about 41%. The rate of food insecurity among
Japanese-all was also lower than the overall food
insecurity prevalence among California adults, which
was 37% (see Appendix, Tables 1.2 and 2.2).
Food insecurity is defined as limited access or
uncertain availability of nutritionally adequate food.
While food insecurity affects people of every age
and race/ethnicity, certain subgroups are especially
vulnerable. The California Health Interview Survey
(CHIS) collects food security information only from
adults with incomes less than 200% of the federal
poverty level (FPL).12 Japanese adults had the lowest
Exhibit 13.
Prevalence of Food Insecurity, Adults 18+ Years
42.7%
40.2%
31.7%
29.9%
20.6%
Japaneseall
36.1%
41.3%
36.6%
17.2%
Japaneseonly
Asian
overall
Latino
White
African
American
American
Indian/
Alaska
Native
Other Single/
2+ Races
California
overall
Source: California Health Interview Surveys 2007,
2009, 2011-2012
21
Internet Use to Access Health information,
Adults 18 and Older (CHIS 2011-2012)
Japanese-all and Japanese-only adults had a higher
prevalence of civic engagement (46% and 48%,
respectively) compared to Asians overall (36%),
and more specifically to Vietnamese (30%) and
Filipinos (32%). And while the level of civic
engagement among Japanese Americans was
similar to that of Californians in general (41%),
the Japanese community had higher rates of civic
engagement compared to Latinos (30%). This may
be attributable to greater community integration, a
higher proportion of older people, and higher voter
participation among the elderly (see Appendix,
Tables 1.2 and 2.2).
Overall, 60% of Japanese-all and Japanese-only
adults reported using the Internet to access health
information. This rate among the Japanese population
is comparable to national levels; a nationwide
study found that a majority of American adults
(approximately 61%) accessed health information
online.13 Levels of Internet use to access health
information are similar across all racial/ethnic groups
(see Appendix, Tables 1.1 and 2.2).
©iStock.com/PeterAlbrektsen
Civic Engagement, Adults 18 and Older
(CHIS 2011-2012)
22
2
Multiracial Japanese Compared to
Japanese-Only and Japanese-All
Multiracial Japanese Americans
Differ from Other Japanese
in California
A key characteristic that distinguishes Japanese
Americans from members of other Asian communities
in the United States is the high proportion of people
who identify as biracial or multiracial. According
to a recent Pew study surveying Asian groups in
the United States, Japanese Americans are among
the most comfortable with intergroup marriage:
71% of Japanese Americans say they would be very
comfortable if their children married someone from
another country-of-origin group, and 67% would be
very comfortable if their child married a non-Asian.14
This high rate of intermarriage may be linked to the
health and health behaviors of Japanese Americans.
Based on pooled CHIS 2007, 2009, and 2011-2012
data, respondents who identified as multiracial
Japanese made up approximately 20% of the Japanese
population in California. Multiracial Japanese comprised
approximately 2% of the California population, or
approximately twice as many as single-race Japanese
(Exhibit 14). The demographic analysis of the
Japanese subpopulation demonstrated that multiracial
Japanese are younger than those who are Japaneseonly: the population distribution of those ages 18-34
was 57% for multiracial Japanese, but 14% for
Japanese-only (see Appendix, Tables 3.1 and 3.2).
As a result, analyses involving multiracial Japanese
adults were age-adjusted for those ages 18-64.
Exhibit 14. Racial and Ethnic Distribution
in California, Adults 18+ Years
1.0%
2.1%
0.4%
5.6%
13.1%
43.5%
White
Multiracial Japanese
Latino
Japanese only
Asian
(excluding Japanese)
American Indians/Alaska Native
African-American
Source: California Health Interview Surveys 2007, 2009, 2011-2012
©iStock.com/digitalskillet
34.2%
23
Chronic Conditions, Adults 18–64 (CHIS 2007,
2009, 2011-2012)*
• The prevalence of overweight or obesity was 46%
among multiracial Japanese. The prevalence of
obesity was similar across all Japanese groups, at
approximately 29%.
• An estimated 13% of multiracial Japanese adults
ages 18-64 reported having either fair or poor
overall health.
• Within the Japanese population, multiracial
Japanese had the lowest age-adjusted rate of
hypertension (8%) when compared to Japaneseonly (22%) and Japanese-all (19%). However,
higher consumption of fast foods—with their
higher sodium content—could exacerbate
hypertension risk among multiracial Japanese as
they age.
*See Appendix, Table 3.1.
Health Behavior/Neighborhood & Housing/
Food Environment, Adults 18–64
(CHIS 2007, 2009, 2011-2012)**
• Multiracial Japanese in California reported having
fast food more often (25%) than respondents who
identified as Japanese-only (11%) and Japaneseall (15%) (Exhibit 15).
• The age-adjusted proportion of current smokers
among multiracial Japanese adults was 19%.
• Thirty-six percent of multiracial Japanese adults
reported binge drinking in the past year.
• In an examination of the age-adjusted rate of flu
shots among adults ages 18-64, 22% of multiracial
Japanese reported getting a flu shot during the
previous year, whereas 31% of Japanese-only
adults got flu shots during the past year.
• The level of civic engagement is similar across
all Japanese subgroups. The prevalence of civic
engagement among multiracial Japanese adults
was 62%.
**See Appendix, Table 3.2.
Exhibit 15. Prevalence of Fast Food Consumption 4+ Times in Past Week, Adults 18–64
40.2%
15.4%
10.7%
Japaneseall
Japaneseonly
Japanese
multiracial
Source: California Health Interview Surveys 2007, 2009, 2011-12
24
3
Conclusions and Recommendations
This report highlights the unique status of Japanese
Americans as not just the nation’s oldest ethnic
group, but also a possible portent of America’s
future aging population. This study shows that for a
majority of the indicators (9 out of 15), the Japanese
American adult population experiences lower risk.
As such, their health and health behaviors may be a
source of future study for examining healthy aging,
not only in California but also in the United States
in general. Although Japanese Americans were often
at lower risk than other groups, they did not meet
the Let’s Get Healthy California 2022 targets in any
category except self-reported health status.
This report also paints a very diverse and complex
picture of Japanese health and health behaviors when
compared to both other Asian groups and other racial/
ethnic groups in California. These differences may
be attributable to the culture of Japanese Americans
and their immigration history. In recent decades, the
Japanese American population has had lower rates
of immigration compared to immigrant populations
from China, Korea, India, the Philippines, and
Southeast Asia.2 Related to the lower rates of
immigration and a more stabilized population,
there are more older adults (65 and older) among
the Japanese community compared to the overall
California population. Compared to other Asian
groups in the United States, Japanese have greater
rates of acculturation and assimilation, with a high
rate of intermarriage. As a result, a large proportion
of Japanese in the U.S. identify themselves as biracial
or multiracial.1 This unique mixture of demographics
and historical presence in California is reflected in
the health status and health behaviors noted in this
report. Understanding these issues will provide useful
and important insights for policymakers, senior care
providers, and community organizations. The coming
impacts on older individuals, their families, and their
communities will be far-reaching, with significant
implications for public health, social services, and
health care systems. Based on the findings of this
study, following are some policy implications and
recommendations.
A Potential Model of Healthy Aging
Since the Japanese American population is leading
the nation in aging, information on key lifestyle and
quality-of-life practices that support healthy aging
among the Japanese population can help the U.S.
prepare for the influx of aging baby boomers. While
a significant proportion of Japanese American adults
reported a variety of chronic health conditions that
can diminish quality of life, such as hypertension
and arthritis, more Japanese adults in California
reported better physical, mental, and functional
health outcomes compared to other racial/ethnic
groups. Because Japanese Americans have better
health outcomes than most other racial/ethnic groups,
it is important to further explore the key biological,
behavioral, environmental, and social factors that
may be associated with better health outcomes.
Understanding the factors associated with the
physical, mental, and functional health of Japanese
Americans will provide useful and important
insights for policymakers, senior care providers, and
community organizations catering not only to other
Asian groups, but also to the older adult demographic
in general. Taking steps now to promote healthy
aging, lifestyle, and diet, while also addressing the
challenges associated with preventable adverse health
conditions and declining quality of life, will position
25
the Japanese American community as a potential
model for the nation when addressing the needs of an
aging population that will likely overburden multiple
systems in the next few decades.
Targeted and culturally competent
interventions and health services for different
Japanese subpopulations
This report shows that Japanese American health is
not uniform. The outstanding health issues among
the Japanese-only subgroup include hypertension,
arthritis, and binge drinking. Culturally appropriate
diet and physical activity interventions might help
members of this subgroup to prevent and control
hypertension. Culturally appropriate interventions
are also needed for those conditions that appeared to
have low prevalence. For instance, the low prevalence
of psychological distress may be due to the stigma
associated with mental illness within the Japanese
culture, with Japanese Americans perhaps reluctant
to seek professional assistance or to reveal their
psychological distress.15 It is important to address the
stigma associated with mental illness and any barriers
that may prevent people from seeking needed mental
health–related treatment.
Developing initiatives for community-based
primary preventions
Some of the health behaviors or risk factors—such as
high rates of binge drinking among Japanese-only,
and high consumption of fast food among multiracial
Japanese—highlight the need for more communitybased primary prevention programs prioritizing
different subpopulations within the Japanese
population in non–health care settings. These
26
settings could include the home, school, workplace,
and community, such as churches, temples, and
community centers. These interventions should focus
on promoting health and protecting healthy people
from developing preventable diseases or experiencing
injuries that may diminish quality of life.
More data and studies to improve our
understanding of Japanese health and
health behaviors
Given the available data and the stability of the
estimates, this report compiles and provides data
that depict the health and health needs of the
Japanese population in California as best as possible.
This report also presents health-related data for the
multiracial Japanese American population, for which
there is a paucity of information. Data limitations
present barriers to better understanding the diverse
Japanese population. For this analysis, it was difficult
due to the limited sample size to stratify the study
population by various health-related factors. Further
assessments are needed to examine factors such as age,
gender, generation, income level, level of educational
attainment, health care utilization, and other behaviors,
which ultimately impact health. The multiracial
Japanese analysis was also limited; however, the
health indicators that were selected provide some key
insights into the diverse, multiracial Japanese groups
and highlight the importance of more studies on this
growing population. Another area of analysis that
should be included in future assessments is that of
healthy aging indicators. Examples of key indicators
to consider are loneliness and social or family support.
Data Sources and Methods
Author Information
This report utilizes findings primarily from the 20112012 California Health Interview Survey (CHIS), but
it also pools CHIS years 2007, 2009, and 2011-2012
to stabilize the estimates due to the small sample size
of the Japanese American population in the survey.
For this study, three categories to define Japanese
Americans were created: Japanese-all, Japanese-only
(monoracial Japanese), and multiracial Japanese.
Ying-Ying Meng, DrPH, is a senior research scientist
and co-director of the Chronic Disease Program at the
UCLA Center for Health Policy Research. Tamanna
Rahman, MPH, is a graduate student researcher at
the UCLA Center for Health Policy Research and
a doctoral student in the UCLA Fielding School of
Public Health, Department of Environmental Health
Sciences. Melissa C. Pickett, MPH, is a research
associate at the UCLA Center for Health Policy
Research. Ninez Ponce, PhD, MPP, is a professor in
the Department of Health Policy and Management
at UCLA; director of the Center for Global and
Immigrant Health, UCLA Fielding School of Public
Health; principal investigator for the California
Health Interview Survey; and associate director of
the UCLA Center for Health Policy Research.
To be considered in the “Japanese-all” category,
survey respondents had to identify their racial/ethnic
group as Asian and report belonging to a single Asian
ethnic group (in this case, Japanese). Respondents
who identified more than one racial/ethnic group had
to most identify as Japanese. Additionally, those
respondents who identified as multiracial, and who
selected Japanese but did not necessarily most identify
as Japanese, were included in the Japanese-all group.
Acknowledgments
To be considered in the Japanese-only category,
respondents had to identify as Asian and then select
only a single race/ethnicity (in this case, Japanese).
The authors wish to thank Akbar Esfahani, Venetia
Lai, and Gwen Driscoll for their assistance. The authors
would also like to thank the following individuals for
their thoughtful reviews and helpful comments:
Lastly, “multiracial Japanese” were respondents who
identified as belonging to more than one racial/ethnic
group, and who selected “Japanese” as one of the
racial/ethnic groups they identified with but not
necessarily most identified with.
Shawn Miyake
President and Chief Executive Officer
Keiro Senior HealthCare
CHIS is a two-stage, geographically stratified,
random-digit-dial (RDD) telephone survey that
has been conducted biannually among California’s
noninstitutionalized population since 2001. CHIS
2011-2012 interviews were conducted from June 2011
to January 2013. The interviews were conducted
in one of five languages: English, Spanish, Chinese
(Mandarin and Cantonese dialects), Vietnamese, or
Korean. CHIS 2011-2012 interviewed approximately
43,000 adults ages 18 or older.
Dianne Kujubu Belli
Chief Administrative Officer
Keiro Senior HealthCare
Bogdan Rau, MPH
Project Coordinator
California Health Interview Survey (CHIS)
UCLA Center for Health Policy Research
Funding
Support for this report was provided by a grant
from Keiro Senior HealthCare.
27
Suggested Citation
10
Centers for Disease Control and Prevention. 2009. Heart Disease Risk
Factors. Available at http://www.cdc.gov/heartdisease/risk_factors.htm.
Meng YY, Rahman T, Pickett MC, Ponce NA. 2015.
Health and Health Behaviors of Japanese Americans
in California: A Sign of Things to Come for Aging
Americans? Los Angeles, CA: UCLA Center for
Health Policy Research.
11
Centers for Disease Control and Prevention. 2014. Behaviors That
Increase Risk for Stroke. National Center for Chronic Disease Prevention
and Health Promotion, Division for Heart Disease and Stroke
Prevention. Last updated March 17, 2014. Available at http://www.cdc.
gov/stroke/behavior.htm.
12
MkNelly B, Kuyper E, Nishio S. 2006. Hunger and Food Insecurity.
California Food Guide: Fulfilling the Dietary Guidelines for Americans.
Available at http://www.dhcs.ca.gov/formsandpubs/publications/CaliforniaFood
Guide/25HungerandFoodInsecurity.pdf.
13
Fox S, Jones S. 2009. The Social Life of Health Information: Americans’
Pursuit of Health Takes Place Within a Widening Network of both Online
and Offline Sources. Pew Internet and California Healthcare Foundation.
Available at http://www.pewinternet.org/files/old-media//Files/Reports/2009/
PIP_Health_2009.pdf.
Endnotes
28
1
Hoeffel EM, Rastogi S, Kim MO, Shahid H. 2012. Washington,
D.C.: The Asian Population 2010 Census Briefs. U.S. Census Report No.
C2010BR-11.
2
Shibusawa T. 2013. Japanese Americans: Current Health Issues and
Directions for Future Research. Yoo GJ, Le MN, Oda AY (eds.),
Handbook of Asian American Health. New York: Springer, pp. 59-72.
14
Pew Research Center. 2013. The Rise of Asian Americans. Available at
http://www.pewsocialtrends.org/files/2013/04/Asian-Americans-new-fullreport-04-2013.pdf.
3
Let’s Get Healthy California 2022 is a 10-year plan for improving the
health of Californians, addressing health care costs, promoting personal
responsibility for individual health, and advancing health equity. Under
the overarching aims of bettering health, improving care, and lowering
cost, 39 indicators are used to track the progress of Let’s Get Healthy
California. This report uses the indicators sourced from CHIS data to
contextually present the Japanese population, where applicable.
15
Shibusawa T. 2005. Japanese Families. In McGoldrick M, Giordano
J, and Garcia-Preto N (eds.), Ethnicity and Family Therapy. New York:
Guilford Press, pp. 339-348.
4
Centers for Disease Control and Prevention. 2013. The State of Aging
and Health in America 2013. Atlanta, GA: Centers for Disease Control
and Prevention, U.S. Dept. of Health and Human Services. Available at
http://www.cdc.gov/aging/pdf/state-aging-health-in-america-2013.pdf.
5
National Institute on Aging. 2015. High Blood Pressure. Available at
http://www.nia.nih.gov/health/publication/high-blood-pressure.
6
Centers for Disease Control and Prevention. 2014. High Blood Pressure
Risk Factors. Available at http://www.cdc.gov/bloodpressure/risk_factors.htm.
7
Seinfeld K. 2012. Despite Healthy Image, Japanese-Americans’ Diabetes
Risk Higher. Available at http://www.kplu.org/post/despite-healthy-imagejapanese-americans-diabetes-risk-higher.
8
McKeeley MJ, Boyko EJ. 2004. Type 2 Diabetes Prevalence in Asian
Americans: Results of a National Health Survey. Diabetes Care 27:6669. Available at http://care.diabetesjournals.org/content/27/1/66.full.
9
Murphy SL, Xu JQ, Kochanek KD. 2013. Deaths: Final Data for 2010.
National Vital Statistics Report 61(4). Available at http://www.cdc.gov/
nchs/data/nvsr/nvsr61/nvsr61_04.pdf.
Appendix
Sample Size Notes
Definitions
Japanese-All
Under this variable, respondents
who report their racial/ethnic
group as Asian, and report
belonging to a single Asian
ethnic group, in this case,
Japanese. If a respondent
reports more than one ethnic
group, the respondent most
identifies as Japanese. Also
includes those respondents who
respond as multiracial, select
Japanese, but do not necessarily
most identify as Japanese.
Japanese-Only
Respondents who report their
racial/ ethnic group as Japanese
and report belonging to a single
race and ethnic group only.
CHIS
2011-2012
Pooled
(2007, 2009,
2011-2012)
Japanese-All
404
1459
Japanese-Only
327
1158
Japanese Multiracial
77
301
Japanese Multiracial
Respondents who report their
racial/ ethnic group as Asian
and report belonging to more
than one Asian ethnic group
(including Japanese), regardless
of which ethnic group he/she
identifies with the most; also,
the non-Latino prerequisite
is removed.
CHIS POOLED
2007, 2009,
2011-2012
CHIS Health Profile - Japanese
Used CHIS constructed variable
ASNHP2. Respondents who report their racial/ethnic group as
Asian and report belonging to
a single Asian ethnic group are
assigned to one of eight Asian
ethnic groups. If a respondent
reported more than one Asian
group, that respondent was
assigned to the group he/she
identified with the most.
JapaneseAll
JapaneseOnly
Japanese
Multiracial
N
%
N
%
N
%
18-34
190
13.02%
76
6.56%
114
37.87%
35-44
208
14.25%
133
11.49%
75
24.92%
45-54
300
20.56%
226
19.52%
74
24.58%
55-64
284
19.47%
255
22.02%
29
9.63%
65 and over
477
32.69%
468
40.41%
9
2.99%
29
Table 1.1.
Chronic Disease Prevalence for Japanese and Respondents of Other Asian Ethnic Subgroups,
Adults 18+, CHIS 2011-2012
JapaneseAll
%
Pop. N
JapaneseOnly
%
Pop. N
Chinese
%
Pop. N
Filipino
%
Pop. N
Korean
%
Pop. N
Vietnamese
%
Pop. N
South
Asian
%
Pop. N
Other
Asian
%
Pop. N
Asian
Overall
%
Pop. N
80.0
220.277
20.0
55,081
19.3
53,133
(95% C.I.)
32.6
(25.8-39.3)
35.3
(27.9-42.7)
8.5
(4.9-12.1)
8.7
(5.1-12.3)
73.0
148,966
27.0
55,081
19.2
39,245
(95% C.I.)
39.0
(30.9-47.2)
35.6
(27.8-43.4)
9.4
(5.3-13.6)
9.8
(5.7-13.8)
88.7
89.0
77.8
85.7
97.4
94.5
88.2
11.3
11.0
22.2
14.3
2.6
5.5
11.8
25.5
19.5
36.8
58.7
19.7
37.9
28.5
(95% C.I.)
19.6
(16.3-22.9)
21.0
(16.9-25.1)
5.5
(3.8-7.2)
7.0
(4.1-9.9)
(95% C.I.)
28.0
(22.1-33.9)
26.5
(19.82-33.2)
9.5
(6.0-13.1)
10.1
(5.9-14.3)
(95% C.I.)
29.1
(22.9-35.2)
18.4
(12.8-24.0)
11.9
(7.3-16.5)
4.6
(2.7-6.5)
(95% C.I.)
29.8
(24.1-35.6)
29.7
(23.5-35.9)
11.4
(7.9-14.9)
7.7
(4.4-11.0)
(95% C.I.)
7.7
(5.2-10.2)
12.5
(7.1-17.9)
5.8
(3.0-8.5)
7.0
(3.1-10.9)
(95% C.I.)
18.1
(9.3-27.0)
24.2*
(9.0-39.5)
4.8*
(1.9-7.7)
8.8*
(1.1-15.9)
(95% C.I.)
20.6
(18.8-22.4)
22.7
(20.1-25.2)
8.0
(6.6-9.3)
7.6
(6.0-9.2)
7.0
(3.7-10.4)
‡
5.7
(3.1-8.3)
7.7
(3.3-12.2)
9.3*
(3.5-15.1)
7.5
(3.4-11.5)
7.7*
(1.3-14.1)
10.0
(6.8-13.1)
6.5
(4.71-8.37)
5.1
(2.8-7.4)
3.1
(1.4-4.9)
4.4
(3.1-5.6)
7.6
(5.1-10.2)
6.2
(3.5-8.9)
6.1*
(2.4-9.8)
4.2
(2.6-5.7)
9.8
(5.2-14.3)
6.0
(4.9-7.0)
Fair or Poor Health
8.1
(4.9-11.4)
7.2
(4.1-10.3)
19.2
(15.7-22.7)
11.1
(7.2-14.9)
31.5
(24.9-38.1)
49.9
(42.6-57.1)
6.1
(3.2-9.0)
15.9
(8.6-23.2)
20.1
(18.1-22.1)
Disability Status Due
to Physical/Mental/
Emotional Condition
28.8
(22.0-35.6)
22.2
(16.0-28.4)
24.9
(20.4-29.4)
35.1
(27.4-42.8)
26.2
(19.7-32.7)
46.9
(39.9-53.9)
24.1
(15.9-32.3)
31.7
(15.5-47.9)
31.0
(28.1-34.0)
Obese
14.0
(8.8-19.1)
13.1
(7.2-18.9)
5.8
(3.8-7.8)
16.7
(11.7-21.7)
2.2*
(0.8-3.6)
6.5
(3.9-9.1)
7.8
(3.9-11.7)
16.4
(6.8-26.0)
9.5
(7.7-11.2)
Demographics
Age 18-64
Age 65+
Below 200% FPL
Chronic Conditions
Hypertension
Arthritis
(40+ year)
Diabetes
Heart Disease
(40+ years)
Stroke
(65+ years; CHIS 2003,
2005, 2011-2012)
Serious Psychological
Distress
(CHIS 2007, 2009, 2011-2012)
*Estimate is not statistically stable
‡Estimate is not provided.
Note: See “Sample Size Notes” at start of Appendix for indicator definitions.
Table 1.2.
Health Behaviors and Environment for Japanese and Respondents of Other Asian Ethnic Subgroups, Adults 18+, CHIS 2011-2012
JapaneseAll
%
Pop. N
JapaneseOnly
%
Pop. N
Chinese
%
Pop. N
Filipino
%
Pop. N
Korean
%
Pop. N
Vietnamese
%
Pop. N
South
Asian
%
Pop. N
Other
Asian
%
Pop. N
Asian
Overall
%
Pop. N
73.0
148,966
27.0
55,081
19.2
39,245
(95% C.I.)
39.0
(30.9-47.2)
88.7
89.0
77.8
85.7
97.4
94.5
88.2
11.3
11.0
22.2
14.3
2.6
5.5
11.8
25.5
19.5
36.8
58.7
19.7
37.9
28.5
Binge Drinking
80.0
220.277
20.0
55,081
19.3
53,133
(95% C.I.)
32.6
(25.8-39.3)
(95% C.I.)
19.6
(16.3-22.9)
(95% C.I.)
28.0
(22.1-33.9)
(95% C.I.)
29.1
(22.9-35.2)
(95% C.I.)
29.8
(24.1-35.6)
(95% C.I.)
7.7
(5.2-10.2)
(95% C.I.)
18.1
(9.3-27.0)
(95% C.I.)
20.6
(18.8-22.4)
Elderly Falls
(65+ years; CHIS 2003, 2007,
2011-2012)
7.9
(3.8-12.1)
8.1
(3.9-12.3)
5.7
(3.0-8.5)
9.8
(5.5-14.1)
7.6
(4.1-11.1)
13.4
(7.8-19.0)
‡
‡
7.9
(5.7-10.0)
Current Smoker
12.4
(7.7-17.1)
36.2
(29.3-43.0)
11.0
(5.7-16.3)
42.0
(33.7-50.3)
7.6
(5.02-10.1)
36.5
(32.1-40.9)
13.1
(8.6-17.5)
33.9
(27.7-40.6)
13.0
(7.4-18..6)
49.4
(41.7-57.1)
14.4
(9.8-19.0)
45.9
(38.9-52.9)
2.8*
(1.1-4.6)
34.0
(27.4-40.6)
11.8*
(2.8-20.9)
23.0
(14.6-31.4)
10.1
(8.4-11.7)
37.2
(34.5-39.8)
7.0
(3.7-10.4)
‡
5.7
(3.1-8.3)
7.7
(3.3-12.2)
9.3*
(3.5-15.1)
7.5
(3.4-11.5)
7.7*
(1.3-14.1)
10.0
(6.8-13.1)
6.5
(4.71-8.37)
Demographics
Age 18-64
Age 65+
Below 200% FPL
Health Behaviors
Flu Shot
Internet Use for
Health Information
(18 years and over;
CHIS 2011-2012)
Neighborhood and Housing
Civic Engagement
46.3
(38.6-53.9)
47.5
(38.8-56.2)
38.9
(34.3-43.6)
32.1
(25.6-38.6)
36.8
(29.3-44.3)
29.8
(22.8-36.9)
39.5
(32.7-46.4)
39.5
(28.8-50.4)
35.9
(33.2-38.7)
Food Environment
Food Insecurity
(CHIS 2007, 2009, 2011-2012)
20.6
(12.6-28.6)
17.2
(8.5-25.9)
26.5
(20.9-32.2)
41.0
(31.4-50.6)
17.9
(10.8-25.0)
28.8
(22.5-35.0)
18.3
(10.4-26.2)
34.4
(24.4-44.4)
29.9
(26.1-33.7)
*Estimate is not statistically stable
30
‡Estimate is not provided.
Note: See “Sample Size Notes” at start of Appendix for indicator definitions.
Table 2.1.
Chronic Disease Prevalence for Japanese and Respondents of Other Races/Ethnicities, Adults 18+, CHIS 2011-2012
Japanese-All
%
Pop. N
JapaneseOnly
%
Pop. N
Latino
%
Pop. N
White
%
Pop. N
African
American
%
Pop. N
American
Indians/ Alaska
Natives
%
Pop. N
Other
Single/
Multiple
Races
%
Pop. N
California
Overall
%
Pop. N
80.0
220,277
20.0
55,081
19.3
53,133
73.0
148,966
27.0
55,081
19.2
39,245
92.3
76.3
83.5
71.6
90.6
84.2
7.7
23.7
16.5
28.4
9.4
15.8
58.2
20.1
42.3
40.6
31.6
35.9
32.6
(25.8-39.3)
35.3
(27.9-42.7)
8.5
(4.9-12.1)
8.7
(5.1-12.3)
39.0
(30.9-47.2)
35.6
(27.8-43.4)
9.4
(5.3-13.6)
9.8
(5.7-13.8)
26.5
(24.9-28.0)
28.2
(26.1-30.3)
11.5
(10.3-12.6)
9.5
(7.9-11.0)
32.5
(31.5-33.4)
39.1
(38.0-40.1)
8.0
(7.5-8.5)
13.3
(12.6-14.1)
42.5
(38.9-46.2)
42.0
(37.9-46.1)
12.9
(10.7-15.0)
9.7
(7.6-11.9)
43.2
(32.8-53.7)
43.8
(31.8-55.8)
16.3
(9.7-23.0)
19.6*
(7.2-31.9)
24.1
(19.2-29.0)
44.1
(37.3-50.9)
6.7
(4.3-9.0)
15.2
(10.5-19.8)
29.7
(29.0-30.5)
34.8
(33.9-35.7)
9.4
(8.9-9.9)
11.5
(10.9-12.1)
7.0
(3.7-10.4)
‡
7.8
(6.3-9.2)
9.2
(8.6-9.7)
11.6
(9.2-14.0)
14.2*
(5.3-23.2)
10.0
(6.8-13.1)
8.8
(8.4-9.3)
5.1
(2.8-7.4)
8.1
(4.9-11.4)
28.8
(22.0-35.6)
14.0
(8.8-19.1)
3.1
(1.4-4.9)
7.2
(4.1-10.3)
22.2
(16.0-28.4)
13.1
(7.2-18.9)
8.7
(8.0-9.5)
28.5
(26.8-30.2)
42.4
(40.0-44.8)
30.3
(28.7-32.0)
7.2
(6.8-7.6)
14.2
(13.5-14.9)
39.9
(38.9-41.0)
21.8
(20.9-22.7)
10.5
(8.4-12.6)
23.9
(20.8-27.0)
48.1
(43.9-52.3)
35.1
31.6-38.6)
13.2
(9.2-17.2)
25.2
(16.4-34.0)
61.8
(50.3-73.3)
33.1
(24.2-42.1)
13.2
(10.7-15.6)
20.3
(15.6-25.0)
50.6
(43.4-57.8)
25.1
(16.7-30.4)
7.8
(7.5-8.2)
20.1
(19.4-20.8)
40.2
(39.3-41.2)
23.6
(22.9-24.3)
Demographics
Age 18-64
Age 65+
Below 200% FPL
Chronic Conditions
Hypertension
Arthritis
(40+ year)
Diabetes
Heart Disease
(40+ years)
Stroke
(65+ years; CHIS 2003, 2005,
2011-2012)
Serious Psychological Distress
(CHIS 2007, 2009, 2011-2012)
Fair or Poor Health
Disability Status Due to Physical/
Mental/Emotional Condition
Obese
*Estimate is not statistically stable
‡Estimate is not provided.
Note: See “Sample Size Notes” at start of Appendix for indicator definitions.
Table 2.2.
Health Behaviors and Environment for Japanese and Respondents of Other Races/Ethnicities,
Adults 18+, CHIS 2011-2012
Japanese-All
%
Pop. N
JapaneseOnly
%
Pop. N
Latino
%
Pop. N
White
%
Pop. N
African
American
%
Pop. N
American
Indians/ Alaska
Natives
%
Pop. N
Other
Single/
Multiple
Races
%
Pop. N
California
Overall
%
Pop. N
80.0
220,277
20.0
55,081
19.3
53,133
73.0
148,966
27.0
55,081
19.2
39,245
92.3
76.3
83.5
71.6
90.6
84.2
7.7
23.7
16.5
28.4
9.4
15.8
58.2
20.1
42.3
40.6
31.6
35.9
Binge Drinking
31.9
(24.2-39.6)
27.6
(19.0-36.2)
33.7
(31.9-35.5)
32.5
(31.3-33.6)
23.9
(20.6-27.3)
28.3
(19.5-37.2)
37.6
(31.0-44.2)
31.1
(30.3-32.0)
Elderly Falls
(65+ years; CHIS 2003, 2007,
2011-2012)
7.9
(3.8-12.1)
8.1
(3.9-12.3)
15.1
(12.8-17.4)
14.1
(13.4-14.8)
13.0
(9.7-16.2)
31.2
(21.2-41.1)
20.0
(14.2-25.9)
13.6
(13.0-14.3)
Current Smoker
12.5
(7.8-17.3)
54.4
(36.7-72.1)
36.2
(29.3-43.0)
60.1
(51.3-68.9)
11.2
(5.8-16.5)
12.3
(11.2-13.3)
55.6
(52.1-59.1)
31.3
(29.7-31.9)
54.0
(51.8-56.2)
14.7
(13.9-15.5)
31.5
(28.2-34.7)
41.5
(40.5-42.5)
69.3
(68.2-70.4)
20.7
(17.7-23.6)
46.1
(35.4-56.8)
29.4
(26.2-32.5)
58.2
(53.9-62.5)
28.7
(19.6-37.8)
47.7*
(11.8-83.7)
47.2
(36.2-58.1)
53.9
(41.8-66.0)
20.7
(15.7-25.6)
42.9
(32.4-53.3)
32.3
(26.6-38.0)
66.5
(60.0-73.0)
13.8
(13.2-14.3)
43.9
(41.7-46.2)
36.8
(36.0-37.6)
63.7
(62.7-64.7)
Demographics
Age 18-64
Age 65+
Below 200% FPL
Health Behaviors
Regular Physical Activity
(0-17 years)
Flu Shot
Internet Use for Health Information
(18 and older, CHIS 2011-2012)
Neighborhood and Housing
Civic Engagement
(18 years and over; CHIS 2011-2012)
Food Environment
Food Insecurity
(CHIS 2007, 2009, 2011-2012)
*Estimate is not statistically stable
‡
42.0
(33.7-50.3)
60.0
(49.5-70.5)
46.3
(38.6-53.9)
47.5
(38.8-56.2)
30.1
(28.4-31.8)
49.6
(48.5-50.7)
41.6
(37.9-45.4)
40.4
(30.2-50.7)
51.6
(45.3-58.0)
41.3
(40.4-42.2)
20.6
(12.6-28.6)
17.2
(8.5-25.9)
40.2
(38.3-42.1)
31.7
(29.5-33.9)
42.7
(38.1-47.4)
36.1
(27.2-44.9)
41.3
(34.5-48.0)
36.7
(35.4-37.9)
‡Estimate is not provided.
Note: See “Sample Size Notes” at start of Appendix for indicator definitions.
31
Table 3.1.
Demographic Characteristics and Chronic
Disease Prevalence for Californians of
Japanese Descent, Adults 18–64, CHIS 2007,
2009, 2011-2012
Demographics
Age 0-17
Age 18-34
Age 35-64
Below 200% FPL
JapaneseAll
%
Pop. N
JapaneseOnly
%
Pop. N
JapaneseMulti
%
Pop. N
26.9
111,020
26.1
77,783
50.7
150,063
15.0
43,971
‡
‡
14.0
30,243
54.7
117,447
13.9
(11.0-16.8)
57.9
47,541
40.5
32,617
18.0
14,416
19.1
(15.4-22.9)
8.6
(5.8-11.4)
14.9
(10.8-18.9)
21.6
(16.3-26.9)
7.1
(4.1-10.0)
15.3
(9.2-21.3)
8.4
(4.2-12.6)
12.7
(7.3-18.1)
18.6
(11.9-25.2)
Chronic Conditions
Hypertension
Fair or Poor Health
Obese
Table 3.2.
Demographic Characteristics, Health
Behaviors, and Environmental Prevalence
for Californians of Japanese Descent, Adults
18–64, CHIS 2007, 2009, 2011-2012
Demographics
Age 0-17
Age 18-34
Age 35-64
Below 200% FPL
JapaneseAll
%
Pop. N
JapaneseOnly
%
Pop. N
JapaneseMulti
%
Pop. N
26.9
111,020
26.1
77,783
50.7
150,063
15.0
(12.3-17.8)
‡
‡
14.0
30,243
54.7
117,447
13.9
(11.0-16.8)
57.9
47,541
40.5
32,617
18.0
(11.6-24.4)
33.1
(27.3-38.9)
16.7
(11.9-21.6)
27.0
(22.8-31.2)
30.1
(23.2-37.0)
13.7
(8.8-18.5)
30.7
(24.8-36.7)
36.0
(28.4-43.6)
19.4
(12.3-26.5)
21.5
(15.8-27.2)
62.2
(53.4-70.9)
53.2
(45.0-61.5)
62.4
(51.0-73.9)
15.4
(11.2-19.6)
10.7
(6.1-15.4)
24.6
(17.0-32.3)
Health Behaviors
*Estimate is not statistically stable.
‡Estimate is not provided.
Note: See “Sample Size Notes” at start of Appendix for indicator definitions.
Binge Drinking
Current Smoker
Flu Shot
Neighborhood and Housing
Civic Engagement
Food Environment
Fast Food 4+ Times in Past Week
*Estimate is not statistically stable.
‡Estimate is not provided.
Note: See “Sample Size Notes” at start of Appendix for indicator definitions.
32
Our Mission
The UCLA Center for Health Policy Research
improves the public’s health by advancing
health policy through research, public service,
community partnership, and education.
Visit our website at www.healthpolicy.ucla.edu
for more information on our free data,
publications, services, and events.
10960 Wilshire Boulevard, Suite 1550
Los Angeles, California 90024
Phone: 310.794.0909
Fax: 310.794.2686
Email: [email protected]


© Copyright 2026