
Cosmological dynamics with non-minimally coupled scalar field and
arXiv:1507.00654v1 [hep-ph] 2 Jul 2015 The Electroweak Vacuum Angle at Finite Temperature and Implications for Baryogenesis Andrew J. Long,a,∗ Hiren H. Patel,b,† and Mark Troddenc,‡ a Physics Department and School of Earth and Space Exploration, Arizona State University, Tempe, Arizona 85287, USA. b Particle and Astro-Particle Physics Division, Max-Planck Institut fuer Kernphysik (MPIK) c Center for Particle Cosmology, Department of Physics and Astronomy, University of Pennsylvania, Philadelphia, PA 19104, USA Abstract We initiate a study of cosmological implications of sphaleron-mediated CP-violation arising from the electroweak vacuum angle under the reasonable assumption that the semiclassical suppression is lifted at finite temperature. In this article, we explore the implications for existing scenarios of baryogenesis. Many compelling models of baryogenesis rely on electroweak sphalerons to relax a (B + L) charge asymmetry. Depending on the sign of the CP-violating parameter, it is shown that the erasure of positive (B + L) will proceed more or less quickly than the relaxation of negative (B + L). This is a higher order effect in the kinetic equation for baryon number, which we derive here through order n2b+l . Its impact on known baryogenesis models therefore seems minor, since phenomenologically nb+l is much smaller than the entropy density. However, there remains an intriguing unexplored possibility that baryogenesis could be achieved with the vacuum angle alone providing the required CP-violation. ∗ [email protected] [email protected] ‡ [email protected] † Prepared for submission to JCAP arXiv:1507.00568v1 [gr-qc] 2 Jul 2015 Solar System Constraints on Disformal Gravity Theories Hiu Yan Ip,a Jeremy Sakstein,b Fabian Schmidta a b Max-Planck-Institut f¨ ur Astrophysik, Karl-Schwarzschild-Str. 1, 85741 Garching, Germany Institute of Cosmology and Gravitation, University of Portsmouth, Portsmouth PO1 3FX, UK E-mail: [email protected], [email protected], [email protected] Abstract. Disformal theories of gravity are scalar-tensor theories where the scalar couples derivatively to matter via the Jordan frame metric. These models have recently attracted interest in the cosmological context since they admit accelerating solutions. We derive the solution for a static isolated mass in generic disformal gravity theories and transform it into the parameterised post-Newtonian form. This allows us to investigate constraints placed on such theories by local tests of gravity. The tightest constraints come from preferred-frame effects due to the motion of the Solar System with respect to the evolving cosmological background field. The constraints we obtain improve upon the previous solar system constraints by two orders of magnitude, and constrain the scale of the disformal coupling for generic models to M & 100 eV. These constraints render all disformal effects irrelevant for cosmology. 1 arXiv:1507.00531v1 [gr-qc] 2 Jul 2015 A divergence free parametrization of deceleration parameter for scalar field dark energy Abdulla Al Mamon1 and Sudipta Das2 Department of Physics, Visva-Bharati, Santiniketan- 731235, India. PACS Nos.: 98.80.Hw Abstract In this paper, we have considered a spatially flat FRW universe filled with pressureless matter and dark energy. We have considered a phenomenological parametrization of the deceleration parameter q(z) and from this we have reconstructed the equation of state for dark energy ωφ (z). Using the combination of datasets (SN Ia + Hubble + BAO/CMB), we have constrained the transition redshift zt (at which the universe switches from a decelerating to an accelerating phase) and have found the best fit value of zt . We have also found that the reconstructed results of q(z) and ωφ (z) are in good agreement with the recent observations. The potential term for the present toy model is found to be functionally similar to a Higgs potential. Keywords: Cosmic acceleration, Parametrization, Deceleration parameter, Data analysis 1 Introduction The discovery of the late-time cosmic acceleration [1, 2] opened up a new field of research in modern cosmology. A number of theoretical models have been constructed to explain this accelerated phenomenon. Most of them are based either on some modification of the Einstein-Hilbert action [3, 4] or the existence of new kind of exotic fields in nature, dubbed as “dark energy” (DE). In this paper, we will focus on the second aspect and consider DE as the driving agent for the current accelerated expansion of the universe which is considered as a hypothetical energy component with a large negative pressure. In the last decade numerous DE models have been explored to account for this phenomenon (for review, see refs. [5, 6, 7, 8, 9]). In spite of those efforts, however, the true nature of dark energy still remains a mystery. The most popular and simplest cosmological DE model is the ΛCDM model, which is in good agreement with the recent observational data. The ΛCDM model is obtained by introducing a cosmological constant Λ into general relativity, for which the equation of state parameter ωΛ = −1. However, it suffers from two major problems, namely, fine tuning and cosmological coincidence problems [10, 11]. This motivates theorists to 1 2 E-mail : [email protected] E-mail: [email protected] Dark matter, Mach’s ether and the QCD vacuum Gilles Cohen-Tannoudjia Laboratoire de recherche sur les sciences de la matière (LARSIM) CEA Saclay Abstract Here is proposed the idea of linking the dark matter issue (considered as a major problem of contemporary research in physics) with two other theoretical open questions, one, almost centenary about the existence of an unavoidable ether in general relativity agreeing with the Mach’s principle, and one, more recent, about the properties of the quantum vacuum in the quantum field theory of strong interactions, Quantum ChromoDynamics (QCD). According to this idea, on the one hand dark matter and dark energy, that according to the current standard model of cosmology, represent about 95% of the universe content can be considered as forming two distinct components of the Mach’s ether and, on the other hand, dark matter, as a perfect fluid emerging from the QCD vacuum, could be modeled as a Bose Einstein condensate. 1/ Introduction The so-called CDM new standard model of cosmology has reached a robustness level comparable to the one of the standard model of particle physics. However these two standard models are in conflict about the issue of the dark matter, an outcome of the cosmological standard model that is a contribution to the balance of cosmological densities, about five times the one of the ordinary (baryonic) matter, which does not seem to be explainable in terms of the theories of the particle physics standard model. The purpose of the present paper is to put in debate the hypothesis that this conflict could be resolved by linking dark matter with a concept which plays a crucial role in hadronic and nuclear physics, and belongs to the fundamentals of the standard model of particle physics, namely the QCD vacuum. Actually, to support this assumption, it appeared useful to revisit an almost centenary debate about a third concept, the Mach’s ether of general relativity, which led me formulating my hypothesis in the following way: Mach’s ether, dark matter and QCD vacuum are three modes of existence of a same entity. The idea is that in a quantum field theory like QCD, what one calls “vacuum” is the ground state, the state of minimal energy, namely the state in the Fock space for which all the occupation numbers are zero. But this vacuum is not the amailto:[email protected] 1 Draft version July 3, 2015 Preprint typeset using LATEX style emulateapj v. 5/2/11 ´ SPECTRAL BREAKS OF ALFVENIC TURBULENCE IN A COLLISIONLESS PLASMA Stanislav Boldyrev1 , Christopher H. K. Chen2 , Qian Xia1 , Vladimir Zhdankin1 1 Department of Physics, University of Wisconsin–Madison, Madison, 2 Department of Physics, Imperial College London, London SW7 WI 53706, USA 2AZ, UK (Dated: July 3, 2015) arXiv:1507.00416v1 [physics.space-ph] 2 Jul 2015 Draft version July 3, 2015 ABSTRACT Recent observations reveal that magnetic turbulence in the nearly colisionless solar wind plasma extends to scales smaller than the plasma microscales, such as ion gyroradius and ion inertial length. Measured breaks in the spectra of magnetic and density fluctuations at high frequencies are thought to be related to the transition from large-scale hydromagnetic to small-scale kinetic turbulence. The scales of such transitions and the responsible physical mechanisms are not well understood however. In the present work we emphasize the crucial role of the plasma parameters in the transition to kinetic turbulence, such as the ion and electron plasma beta, the electron to ion temperature ratio, the degree of obliquity of turbulent fluctuations. We then propose an explanation for the spectral breaks reported in recent observations. Subject headings: magnetic fields — magnetohydrodynamics — turbulence 1. INTRODUCTION In situ measurements of the magnetic, electric, and density fluctuations in the solar wind provide valuable information on nonlinear dynamics of a nearly collisionless astrophysical plasma. At large hydrodynamic scales (corresponding to low frequencies in the measurements), such fluctuations are thought to be consistent with magnetohydrodynamic turbulence viewed as interacting oblique Alfv´en modes propagating along the background magnetic field (Iroshnikov 1963; Kraichnan 1965; Goldreich & Sridhar 1995; Galtier et al. 2000; Boldyrev 2006). At higher frequencies the spectrum of such turbulence exhibits a break, which corresponds to the spatial scale broadly consistent with the plasma microscales such as the ion gyroradius or the ion inertial length. It has been proposed that the spectral break in the solar wind and other astrophysical plasmas can mark a transition from the non-dispersive Alfv´en modes to the dispersive kinetic-Alfv´en modes (Bale et al. 2005; Leamon et al. 1998, 1999; Hollweg 1999; Howes et al. 2006; Chandran et al. 2009; Shaikh & Zank 2009; Chandran et al. 2010; Chen et al. 2010; Howes & Quataert 2010; Petrosyan et al. 2010; Howes et al. 2011; Chandran et al. 2011; TenBarge & Howes 2012; Boldyrev & Perez 2012; Sahraoui et al. 2012; Mithaiwala et al. 2012; Boldyrev & Perez 2013; Podesta 2013; Chen et al. 2013; Haverkorn & Spangler 2013). A possibility of transition to whistler turbulence has also been considered (Beinroth & Neubauer 1981; Coroniti et al. 1982; Goldstein et al. 1994; Stawicki et al. 2001; Galtier & Bhattacharjee 2003, 2005; Gary et al. 2008; Saito et al. 2008; Gary & Smith 2009; Shaikh 2009, 2010; Gary et al. 2010), however, recent studies (e.g., Podesta 2013; Chen et al. 2013) suggest that whistler turbulence, if present at subpropton scales, contributes only a small fraction of fluctuations energy. A conclusion is then drawn that the spectral break occurs at the proton gyroscale. A recent work by Chen et al. (2014) tested this pre- diction by analyzing the solar wind intervals having very large and very small plasma beta, the ratio of the kinetic energy of the plasma particles to the magnetic energy. In particular, the intervals were selected with ion and electron plasma beta satisfying βi ∼ βe ≫ 1 and 1 ≫ βe ≫ βi . In the first case, the theory of oblique Alfv´enic turbulence predicts the break at the ion gyroscale, in the second one at the ion acoustic scale. The observations of (Chen et al. 2014) agree with the theory in the first case, and disagree in the second, where the break is observed at the ion inertial length instead. This puzzling result may question the applicability of the theory of turbulent cascade to the solar wind plasma. We address this contradiction by inspecting the theory of Alfv´en turbulence in the limiting cases of large and small plasma beta. We consider various mechanisms that may be responsible for the spectral break, including the possibility that the major assumption of the standard theory, the obliquity of propagation, can break down in the case 1 ≫ βe ≫ βi . The reason for the latter possibility is upscatter of the Alfv´enic fluctuations due to their interactions with the ion-acoustic modes and the fast modes that are weakly damped in a non-isothermal low-beta plasma. The Afv´enic turbulence then develops a non-oblique component kk & k⊥ , which is dissipated due to the ion cyclotron resonance at the ion inertial scale thus explaining the observed spectral break in this case. 2. KINETIC DERIVATION pIn what follows we will use the notation: ωpα = 2 p4πn0α qα /mα is the plasma frequency, and vT α = Tα /mα is the thermal velocity associated with the particles of kind α. For a plasma consisting of electrons and ions, the p so-called ion-acoustic velocity can be defined, Te /mi . It is also vs = √ convenient to introduce the Alfv´en speed vA = B0 / 4πn0 mi , and the plasma beta, which is the ratio of the thermal energy of the particles to the magnetic energy of the plasma, and which can be The I-Q relations for rapidly rotating neutron stars in f ( R) gravity Daniela D. Doneva,1, 2, ∗ Stoytcho S. Yazadjiev,3, 1, † and Kostas D. Kokkotas1, ‡ 1 Theoretical arXiv:1507.00378v1 [gr-qc] 1 Jul 2015 Astrophysics, Eberhard Karls University of Tubingen, ¨ Tubingen ¨ 72076, Germany 2 INRNE - Bulgarian Academy of Sciences, 1784 Sofia, Bulgaria 3 Department of Theoretical Physics, Faculty of Physics, Sofia University, Sofia 1164, Bulgaria In the present paper we study the behavior of the normalized I-Q relation for neutron stars in a particular class of f ( R) theories of gravity, namely the R2 gravity that is one of the most natural and simplest extensions of general relativity in the strong field regime. We study both the slowly and rapidly rotating cases. The results show that the I-Q relation remain nearly equation of state independent for fixed values of the normalized rotational parameter, but the deviations from universality can be a little bit larger compared to the general relativistic case. What is the most interesting in our studies, is that the differences with the pure Einstein’s theory can be large reaching above 20%. This is qualitative different from the majority of alternative theories of gravity, where the normalized I-Q relations are almost indistinguishable from the general relativistic case, and can lead to observational constraints on the f ( R) theories in the future. PACS numbers: I. INTRODUCTION Studies of generalized theories of gravity are becoming more and more intense in the last decade. There are both theoretical and observational motivations for this. On one hand the theories trying to unify all the interactions predict that the standard Einstein-Hilbert action should be modified. On the other hand it was shown in many cases that studying generalizations of Einstein’s gravity can give us a deeper understanding of general relativity (GR) itself. On the observational front still remain phenomena that do not fit very well in the standard framework, such as the accelerated expansion of the universe, and that is why modifications of the theory of gravity are often employed as an alternative explanations. One should keep also in mind, that even though general relativity is very well tested in the weak field regime, the strong field remains essentially unconstrained that leaves space for a variety of modifications. One of the most natural generalizations of Einstein’s theory of gravity are the f ( R) theories, where the Ricci scalar R in the Einstein-Hilbert action is replaced by some function of R. Such modification has a theoretical motivation for example from the quantum field theory in curved spacetime. f ( R) theories are also widely used as an alternative explanation of the dark energy phenomena which places them amongst the most popular and widely explored alternative theories of gravity. Most of the studies on f ( R) theories though are in cosmological aspect in relation to the accelerated expansion of the universe [1–3]. The examinations of the astrophysical manifestations of these theories is more scarce and this would be the main focus of our paper. Natural objects to study within the f ( R) theories of gravity at astrophysical scales are the neutron stars, where the strong gravity effects are non-negligible. The neutron stars within the f ( R) theories can differ significantly from their GR counterpart [4–6] which makes them a very good candidate to test f ( R) theories on astrophysical scales. Unfortunately one has to pay a high price – the nuclear matter equation of state (EOS) at densities as high as the ones in the neutron star cores, is still unknown. That is why in many cases the deviations coming from the generalizations of Einstein’s gravity are comparable or even smaller than the deviations resulting from the uncertainties in the EOS. A way to circumvent this problem is to search for predictions or derive relations that are independent of the EOS. This was exactly the idea in [7, 8] where the famous I-Love-Q relations were discovered. These relations connect the ∗ Electronic address: [email protected] address: [email protected] ‡ Electronic address: [email protected] † Electronic DRAFT: July 3, 2015 Preprint typeset using LATEX style emulateapj v. 5/2/11 PHYSICAL PROPERTIES OF A PILOT SAMPLE OF SPECTROSCOPIC CLOSE PAIR GALAXIES AT Z ∼ 2 David R. Law1 , Alice E. Shapley2 , Jade Checlair3 , Charles C. Steidel4 arXiv:1507.00721v1 [astro-ph.GA] 2 Jul 2015 DRAFT: July 3, 2015 ABSTRACT We use Hubble Space Telescope Wide-Field Camera 3 (HST/WFC3) rest-frame optical imaging to select a pilot sample of star-forming galaxies in the redshift range z = 2.00 − 2.65 whose multicomponent morphologies are consistent with expectations for major mergers. We follow up this sample of major merger candidates with Keck/NIRSPEC longslit spectroscopy obtained in excellent seeing conditions (FWHM ∼ 0.5 arcsec) to obtain Hα-based redshifts of each of the morphological components in order to distinguish spectroscopic pairs from false pairs created by projection along the line of sight. Of six pair candidates observed, companions (estimated mass ratios 5:1 and 7:1) are detected for two galaxies down to a 3σ limiting emission-line flux of ∼ 10−17 erg s−1 cm−2 . This detection rate is consistent with a ∼ 50% false pair fraction at such angular separations (1 − 2 arcsec), and with recent claims that the star-formation rate (SFR) can differ by an order of magnitude between the components in such mergers. The two spectroscopic pairs identified have total SFR, SFR surface densities, and stellar masses consistent on average with the overall z ∼ 2 star forming galaxy population. Subject headings: galaxies: fundamental parameters — galaxies: high-redshift — galaxies: structure 1. INTRODUCTION At redshift z ∼ 2 − 3 galaxies are growing rapidly and build up a large fraction of their present-day stellar mass (e.g. Reddy et al. 2008). As they grow, the increased stellar mass is thought to stabilize these systems against gravitational instabilities resulting from their large gas fractions (e.g., Kassin et al. 2014; van der Wel et al. 2014), decreasing their formerlyhigh gas-phase velocity dispersions (Law et al. 2007b, 2009; F¨orster Schreiber et al. 2009; Newman et al. 2013) and causing a morphological transformation from highlyirregular clumpy starbursts (e.g., Guo et al. 2012; Law et al. 2012a; van der Wel et al. 2014, and references therein) to the modern-day Hubble sequence (e.g., Papovich et al. 2005; Law et al. 2012b; Conselice 2014). One mechanism by which such growth occurs is the conversion of massive gas reservoirs into stars. Such star formation is observed to occur at a typical rate ∼ 30M⊙ yr−1 for rest-UV selected galaxy samples (e.g., Erb et al. 2006; Wuyts et al. 2011), although this SFR may represent only a small fraction of the gas continually cycling into (e.g., Genzel et al. 2008; Dekel et al. 2009) and out of the galaxies (e.g., Steidel et al. 2010) through large-scale gas flows. Likewise, galaxies also grow through both major (mass ratio 3 : 1 or lower) and minor (mass ratio 4 : 1 or higher) mergers with other galaxies. Such events typically contribute both stars and gas, thereby building up the galactic stellar spheroid population and providing fuel for future generations of star formation. The role of mergers and merger1 Space Telescope Science Institute, 3700 San Martin Drive, Baltimore, MD 21218, USA ([email protected]) 2 Department of Physics and Astronomy, University of California, Los Angeles, CA 90095, USA 3 Dunlap Institute for Astronomy & Astrophysics, University of Toronto, 50 St. George Street, Toronto M5S 3H4, Ontario, Canada 4 California Institute of Technology, MS 249-17, Pasadena, CA 91125, USA induced star formation compared to in-situ star formation in building up the present day galaxy population has been the subject of considerable debate, with various studies claiming both that mergers are (de Ravel et al. 2009; Puech et al. 2014; Tasca et al. 2014) and are not (Shapiro et al. 2008; Williams et al. 2011; Wuyts et al. 2011; Kaviraj et al. 2013) major drivers of star formation and galactic stellar mass assembly since z ∼ 4. Significant effort has therefore been invested both in constraining the evolution of the merger fraction for star-forming galaxies (e.g., Conselice et al. 2008, 2011; Lotz et al. 2008, 2011; Rawat et al. 2008) and in assessing the physical effects of such mergers on the star formation properties of the galaxies (e.g., Law et al. 2007a, 2012a; Lotz et al. 2008; Lee et al. 2013). One method employed by such studies is to use high-resolution imaging to quantify disturbances and irregularities in the surface brightness profile using a variety of nonparametric indices (e.g., Conselice et al. 2000; Lotz et al. 2004; Law et al. 2007a). However, it is often challenging to intepret such indices unambiguously because z ∼ 2 − 3 galaxies are intrinsically clumpy and irregular and similar disturbed morphologies can arise both in merging systems and in isolated star forming galaxies due to internal dynamical instabilities (e.g., Bournaud & Elmegreen 2009; Genzel et al. 2011). An alternative way of identifying major mergers is to look for close angular pairs (r . 50 kpc, 6 arcsec at z ∼ 2−3). When the velocity separation between the two components in such a pair is . 500 km s−1 (see discussion by Lin et al. 2004; Lotz et al. 2008) numerical simulations suggest that such systems should predominantly trace major galaxy-galaxy mergers during their first pericentric passage and before final coalescence (Lotz et al. 2008, 2010). Indeed, when merger rates derived from such close pairs (e.g., Bundy et al. 2009; Williams et al. 2011; de Ravel et al. 2009; L´ opez-Sanjuan et al. 2013; Tasca et al. 2014) are combined with physically moti- Prepared for submission to JCAP arXiv:1507.00718v1 [astro-ph.CO] 2 Jul 2015 CMB and BAO constraints for an induced gravity dark energy model with a quartic potential C. Umiltàa,b,c M. Ballardinid,e,f F. Finellie,f and D. Paolettie,f a Institut d’Astrophysique de Paris, CNRS (UMR7095), 98 bis Boulevard Arago, F-75014, Paris, France b UPMC Univ Paris 06, UMR7095, 98 bis Boulevard Arago, F-75014, Paris, France c Sorbonne Universités, Institut Lagrange de Paris (ILP), 98 bis Boulevard Arago, 75014 Paris, France d DIFA, Dipartimento di Fisica e Astronomia, Via Berti Pichat, I-40129 Bologna, Italy e INAF-IASF Bologna, via Gobetti 101, I-40129 Bologna, Italy f INFN, Sezione di Bologna, Via Irnerio 46, I-40126 Bologna, Italy E-mail: [email protected], [email protected], [email protected], [email protected] Abstract. We study the predictions for structure formation in an induced gravity dark energy model with a quartic potential. By developing a dedicated Einstein-Boltzmann code, we study self-consistently the dynamics of homogeneous cosmology and of linear perturbations without using any parametrization. By evolving linear perturbations with initial conditions in the radiation era, we accurately recover the quasi-static analytic approximation in the matter dominated era. We use Planck 2013 data and a compilation of baryonic acoustic oscillation (BAO) data to constrain the coupling γ to the Ricci curvature and the other cosmological parameters. By connecting the gravitational constant in the Einstein equation to the one measured in a Cavendish-like experiment, we find γ < 0.0012 at 95% CL with Planck 2013 and BAO data. This is the tightest cosmological constraint on γ and on the corresponding derived post-Newtonian parameters. Because of a degeneracy between γ and the Hubble constant H0 , we show how larger values for γ are allowed, but not preferred at a significant statistical level, when local measurements of H0 are combined in the analysis with Planck 2013 data. Draft version July 3, 2015 Preprint typeset using LATEX style emulateapj v. 5/2/11 CONNECTING THE DOTS: TRACKING GALAXY EVOLUTION USING CONSTANT CUMULATIVE NUMBER DENSITY AT 3 ≤ z ≤ 7 Jason Jaacks1 ∗, Steven L. Finkelstein1 & Kentaro Nagamine2,3 1 Department of Astronomy, The University of Texas at Austin, Austin, TX 78712 of Earth and Space Science, Graduate School of Science, Osaka University, 1-1 Machikaneyama-cho, Toyonaka, Osaka 560-0043, Japan 3 Department of Physics & Astronomy, University of Nevada, Las Vegas, 4505 S. Maryland Pkwy, Las Vegas, NV, 89154-4002, USA Draft version July 3, 2015 arXiv:1507.00713v1 [astro-ph.GA] 2 Jul 2015 2 Department ABSTRACT Using the cosmological smoothed particle hydrodynamical code GADGET-3 we make a realistic assessment of the technique of using constant cumulative number density as a tracer of galaxy evolution at high redshift. We find that over a redshift range of 3 ≤ z ≤ 7 one can on average track the growth of the stellar mass of a population of galaxies selected from the same cumulative number density bin to within ∼ 0.20 dex. Over the stellar mass range we probe (1010.39 ≤ Ms /M ≤ 1010.75 at z = 3 and 108.48 ≤ Ms /M ≤ 109.55 at z = 7) one can reduce this bias by selecting galaxies based on an evolving cumulative number density. We find the cumulative number density evolution exhibits a trend towards higher values which can be quantified by simple linear formulations going as −0.10∆z for descendants and 0.12∆z for progenitors. Utilizing such an evolving cumulative number density increases the accuracy of descendant/progenitor tracking by a factor of ∼ 2. This result is in excellent agreement, within 0.10 dex, with abundance matching results over the same redshift range. However, we find that our more realistic cosmological hydrodynamic simulations produce a much larger scatter in descendant/progenitor stellar masses than previous studies, particularly when tracking progenitors. This large scatter makes the application of either the constant cumulative number density or evolving cumulative number density technique limited to average stellar masses of populations only, as the diverse mass assembly histories caused by stochastic physical processes such as gas accretion, mergers, and star formation of individual galaxies will lead to a larger scatter in other physical properties such as metallicity and star-formation rate. Subject headings: cosmology: theory — stars: formation — galaxies: evolution – galaxies: formation – methods: numerical 1. INTRODUCTION Understanding how galaxies evolved from minute perturbations in the distant Universe into the diverse zoo of shapes and sizes we see today is one of the fundamental goals of modern astronomy. The current frontier lies at the edge of the observable universe, ∼ 500 Myr after the Big Bang, and is primarily possible using the Wide Field Camera 3 (WFC3) instrument aboard the Hubble Space Telescope (HST). Using the Lyman-break technique and/or photometric redshifts to select candidate galaxies, programs such as CANDELS (PIs Faber & Ferguson), BoRG (Trenti et al. 2011), and HUDF09/UDF12 (Bouwens et al. 2011; Ellis et al. 2013), are able to identify galaxies down to rest-frame UV magnitudes of Muv ∼ −17.5 (e.g., Finkelstein et al. 2012, 2014; Trenti et al. 2011; Bouwens et al. 2012; Ellis et al. 2013). Two of these galaxies have been spectroscopically confirmed to be the earliest known galaxies to date with redshifts of z=7.51 (Finkelstein et al. 2013) and z=7.73 (Oesch et al. 2015). With the help of the gravitational lensing effect of massive foreground galaxy clusters, campaigns such as CLASH (Bouwens et al. 2014) and the HST Frontier Fields will extend our understanding even further to z ≥ 9 and UV magnitudes as faint as Muv ∼ −13, greatly increasing the dynamic range of the observed galaxy pop* [email protected] ulation for study. From these surveys, fundamental properties such as stellar mass, age and star formation rate (SFR) can be derived by comparing the spectral energy distributions (SEDs) of galaxies to stellar population models. By selecting galaxies at different epochs (“snapshots” in time), we can in principle directly observe how galaxies evolve. However, tracing galaxies from one epoch to another has proven challenging, and frequently accompanied by misinterpretation. Previous studies have matched galaxies at different epochs by comparing samples selected to have similar physical tracers, such as a constant stellar mass or SFR (e.g., Stark et al. 2009). This can be problematic as two galaxies, one at z=6 and the other at z=3, both with stellar masses of M∗ ≈ 1010 M could have dramatically different mass assembly histories depending on their individual star formation histories (SFHs), environments and/or merger histories. A novel approach to this problem was suggested by van Dokkum et al. (2010) who tracked a population of galaxies through cosmic time (z=2 to z=0.1) selected to have a constant number density, using the observed cumulative galaxy stellar mass function (CSMF). The critical assumption this approach makes is that galaxies in the same number density bin will grow at a similar, smooth rate with a conserved rank order. Monte Carlo simulations were utilized to test the effects of mergers and MNRAS 000, 1–6 (2008) Preprint 3 July 2015 Hyperfine transitions of 13 Compiled using MNRAS LATEX style file v3.0 CN from pre-protostellar sources D. R. Flower1⋆ , P. Hily-Blant2 1 Physics arXiv:1507.00709v1 [astro-ph.GA] 2 Jul 2015 2 LAOG Department, The University, Durham DH1 3LE, UK (UMR 5571), Universit´ e de Grenoble, BP 53, F-38041 Grenoble Cedex 09, France Accepted 2008 December 15. Received 2008 December 14; in original form 2008 October 11 ABSTRACT Recent quantum mechanical calculations of rate coefficients for collisional transfer of population between the hyperfine states of 13 CN enable their population densities to be determined. We have computed the relative populations of the hyperfine states of the N = 0, 1, 2 rotational states for kinetic temperatures 5 6 T 6 20 K and molecular hydrogen densities 1 6 n(H2 ) 6 1010 cm−3 . Spontaneous and induced radiative transitions were taken into account. Our calculations show that, if the lines are optically thin, the populations of the hyperfine states, F , within a given rotational manifold are proportional to their statistical weights, (2F + 1) – i.e. in LTE – over the entire range of densities. We have re-analyzed IRAM 30 m telescope observations of 13 CN hyperfine transitions (N = 1 → 0) in four starless cores. A comparison of these observations with our calculations confirms that the hyperfine states are statistically populated in these sources. Key words: ISM: molecules – molecular processes – submillimetre: ISM – stars: low-mass. 1 INTRODUCTION The interpretation of the emission lines of molecules in the interstellar medium (ISM) is often complicated by the effects of re-absorption and scattering, owing to significant optical depths in the lines. Partly for this reason, observations of less abundant isotopologues are analyzed, in addition or in preference to those of the principal species; this is the case of CO, for example, where 13 CO and C18 O lines are used, and also of CN, where 13 CN and C15 N serve a similar purpose. In the present paper, we consider the emission lines of 13 CN, observed at millimetre wavelengths in pre-protostellar sources. 13 CN has a rich spectrum at mm-wavelengths, where it displays the effects of the fine structure interaction, between the electron spin and the nuclear rotation, and of the hyperfine interaction with the spins of the 13 C (I1 = 21 ) and N (I2 = 1) nuclei. Thus, Bogey et al. (1984) listed 16 ‘allowed’ transitions, in the vicinity of 100 GHz, between the rotational states N = 0 and N = 1, and a further 25 transitions at 200 GHz between the N = 1 and N = 2 states. It is this cornucopia of optically thin transitions that one wishes to exploit, in order to obtain a better understanding of the conditions in pre-protostellar objects. It is generally assumed that the hyperfine levels, F , of ⋆ E-mail: [email protected] c 2008 The Authors a given N are populated in proportion to their statistical weights, (2F + 1), i.e. that they are in local thermodynamic equilibrium LTE. However, LTE is the exception, rather than the rule, in the ISM, because very low densities prevail. The assumption of LTE is usually dictated by a lack of rate coefficients for collisional population transfer between the hyperfine levels of the molecule. In the case of 13 CN (and of C15 N), this situation has been rectified recently by the calculations of Flower & Lique (2015), which provide rate coefficients for collisions with para-H2 in its rotational ground state – the dominant perturber at low kinetic temperatures, T . Thus, the opportunity arises to calculate the hyperfine level populations explicitly, allowing for collisional and radiative transfer, where the latter is induced by the cosmic microwave background or by the emission of dust present in the medium. We present the details of the calculations in Section 2 and the numerical results and their implications in the following Section 3. Our concluding remarks are in Section 4. 2 CALCULATIONS Bogey et al. (1984) note that the rotational (N ) and the hyperfine (F ) are the ‘good’ quantum numbers of 13 CN. Accordingly, we evaluate the relative populations, in equilibrium, of the levels (N, F ), for a wide range of values of Version from July 3, 2015 arXiv:1507.00708v1 [astro-ph.SR] 2 Jul 2015 On Infrared Excesses Associated With Li-Rich K Giants Luisa M. Rebull1 , Joleen K. Carlberg2,3, John C. Gibbs4 , J. Elin Deeb5 , Estefania Larsen6 , David V. Black7 , Shailyn Altepeter6 , Ethan Bucksbee6 , Sarah Cashen4 , Matthew Clarke6, Ashwin Datta4 , Emily Hodgson4 , Megan Lince4 ABSTRACT Infrared (IR) excesses around K-type red giants (RGs) have previously been discovered using Infrared Astronomy Satellite (IRAS) data, and past studies have suggested a link between RGs with overabundant Li and IR excesses, implying the ejection of circumstellar shells or disks. We revisit the question of IR excesses around RGs using higher spatial resolution IR data, primarily from the Wide-field Infrared Survey Explorer (WISE). Our goal was to elucidate the link between three unusual RG properties: fast rotation, enriched Li, and IR excess. Our sample of RGs includes those with previous IR detections, a sample with well-defined rotation and Li abundance measurements with no previous IR measurements, and a large sample of RGs asserted to be Li-rich in the literature; we have 316 targets thought to be K giants, about 40% of which we take to be Li-rich. In 24 cases with previous detections of IR excess at low spatial resolution, we believe that source confusion is playing a role, in that either (a) the source that is bright in the optical is not responsible for the IR flux, or (b) there is more than one source responsible for the IR flux as measured in IRAS. We looked for IR excesses in the remaining sources, identifying 28 that have significant IR excesses by ∼20 µm (with possible excesses for 2 additional sources). There appears to be an intriguing correlation in that the largest IR excesses are all in Li-rich K giants, though very few Li-rich K giants have IR excesses (large or small). These largest IR excesses also tend to be found in the fastest rotators. There is no correlation of IR excess with the carbon isotopic ratio, 12 C/13 C. IR excesses by 20 µm, though relatively rare, are at least twice as common among our sample of Li-rich K giants. If dust shell production is a common by-product of Li enrichment mechanisms, these observations suggest that the IR excess stage is very short-lived, which is supported by theoretical calculations. Conversely, the Li-enrichment mechanism may only occasionally produce dust, and an additional parameter (e.g., rotation) may control whether or not a shell is ejected. Subject headings: stars: late-type; stars:evolution; infrared:stars 1 Spitzer Science Center (SSC) and Infrared Science Archive (IRSA), Infrared Processing and Analysis Center (IPAC), 1200 E. California Blvd., California Institute of Technology, Pasadena, CA 91125 USA; [email protected] 2 NASA Goddard Space Flight Center, Code 667, Greenbelt MD 20771 USA 3 NASA Postdoctoral Program Fellow 4 Glencoe 5 Bear High School, 2700 NW Glencoe Rd., Hillsboro, OR 97124 USA Creek High School, 9800 W. Dartmouth Pl., Lakewood, CO 80227 USA 6 Millard South High School, 14905 Q St., Omaha, NE 68137 USA 7 Walden School of Liberal Arts, 4230 N. University Ave., Provo, UT 84604 USA Acta Polytechnica 00(0):1–12, 0000 © Czech Technical University in Prague, 2015 PREPRINT 2015-07-03 GALACTIC CENTER MINISPIRAL: INTERACTION MODES OF NEUTRON STARS Michal Zajačeka,b,c,d,∗ , Vladimír Karasc , Devaky Kunneriathc a I. Physikalisches Institut der Universität zu Köln, Zülpicher Strasse 77, D-50937 Köln, Germany b Max-Planck-Institut für Radioastronomie (MPIfR), Auf dem Hügel 69, D-53121 Bonn, Germany c Astronomical Institute, Academy of Sciences, Boční II 1401, CZ-14131 Prague, Czech Republic d Charles University in Prague, Faculty of Mathematics and Physics, V Holešovičkách 2, CZ-18000 Prague, Czech Republic arXiv:1507.00706v1 [astro-ph.GA] 2 Jul 2015 ∗ corresponding author: [email protected] Abstract. Streams of gas and dust in the inner parsec of the Galactic center form a distinct feature known as the Minispiral, which has been studied in radio waveband as well as in the infrared wavebands. A large fraction of the Minispiral gas is ionized by radiation of OB stars present in the Nuclear Star Cluster (NSC). Based on the inferred mass in the innermost parsec (∼ 106 solar masses), over ∼ 103 – 104 neutron stars should move in the sphere of gravitational influence of the SMBH. We estimate that a fraction of them propagate through the denser, ionized medium concentrated mainly along the three arms of the Minispiral. Based on the properties of the gaseous medium, we discuss different interaction regimes of magnetised neutron stars passing through this region. Moreover, we sketch expected observational effects of these regimes. The simulation results may be applied to other galactic nuclei hosting NSC, where the expected distribution of the interaction regimes is different across different galaxy types. Keywords: Galaxy: center, ISM: individual objects (Sagittarius A), Stars: neutron. 1. Introduction The Galactic center hosts the supermassive black hole (SMBH) observed as the compact radio source Sgr A*, which is surrounded by the Nuclear star cluster (NSC) and gaseous-dusty structures, such as HII Minispiral arms of Sgr A West, supernova remnant Sgr A East, molecular clouds, and the Circumnuclear disk [1, 2]. It is the closest SMBH and hence its environment can be studied with the highest resolution among galactic nuclei in the radio-, mm-, submm-, infrared, and X-ray wavebands [2]. However, despite highresolution multiwavelength studies several processes are still not satisfactorily explained, such as the starformation near the SMBH, the feeding and feedback of Sgr A*, and the distribution of the magnetic field and its interaction with other stellar and non-stellar components. The observations of the Galactic center region revealed a large population of young massive stars orbiting the SMBH as close as ∼ 0.1 pc [3]. In fact, the NSC seems to be one of the densest concentrations of young massive stars in the Galaxy [1]. On the other hand, there is an observable flat distribution of late-type stars with a radius of as much as 1000 [4, 5]. Thus, a steep relaxed Bahcall-Wolf cusp of stars with a slope of 7/4 or 3/2 [6, 7] is probably absent [5, 8]. The estimates of the number of stellar remnants that use the power-law initial mass function (IMF) (standard Salpeter or top-heavy) combined with the mass segregation over the age of the bulge (∼ 10 Gyr) lead to a considerable population of stellar black holes of the order of ∼ 104 [9–11]. The same order is expected for neutron stars based on multiwavelength statistical studies [12]. Based on the total X-ray luminosity of the innermost parsec, [13] set an upper limit on the number of compact remnants (. 40 000). Such an abundant population of neutron stars exhibiting strong magnetic fields could be utilized to further extend our knowledge about the processes in the Galactic center. The observations of neutron stars (pulsars as well as X-ray sources) near the SMBH would contribute to: • our understanding of the star formation processes near the Galactic center using the number and the age distribution of observed sources, • mapping the gravitational potential near the SMBH using their period derivatives, • constraining the electron density profile in the Galactic center using their dispersion measures. Despite continuing efforts only very few pulsars have been detected in the broader Galactic center region. It is thought that the lack of detections is due to profound interstellar dispersion and scattering. However, there are observational hints that such a population is present. [14] report the discovery of two highly dispersed pulsars with the angular separation . 0.3◦ from the Galactic center. [15] confirm the detection of three pulsars with large dispersion measures with an offset of ∼ 100 –150 from Sgr A*. There is an 1 arXiv:1507.00704v1 [astro-ph.GA] 2 Jul 2015 CHANG-ES V: Nuclear Radio Outflow in a Virgo Cluster Spiral after a Tidal Disruption Event Judith A. Irwin1 , Richard N. Henriksen1 , Marita Krause2 , Q. Daniel Wang3 , Theresa Wiegert1 , Eric J. Murphy4 , George Heald5 , and Eric Perlman6 ABSTRACT We have observed the Virgo Cluster spiral galaxy, NGC 4845, at 1.6 and 6 GHz using the Karl G. Jansky Very Large Array, as part of the ‘Continuum Halos in Nearby Galaxies – an EVLA Survey’ (CHANG-ES). The source consists of a bright unresolved core with a surrounding weak central disk (1.8 kpc diameter). The core is variable over the 6 month time scale of the CHANG-ES data and has increased by a factor of ≈ 6 since 1995. The wide bandwidths of CHANG-ES have allowed us to determine the spectral evolution of this core which peaks between 1.6 and 6 GHz (it is a GigaHertz-peaked spectrum source). We show that the spectral turnover is dominated by synchrotron self-absorption and that the spectral evolution can be explained by adiabatic expansion (outflow), likely in the form of a jet or cone. The CHANG-ES observations serendipitously overlap in time with the hard X-ray light curve obtained by Nikolajuk & Walter (2013) which they interpret as due to a tidal disruption event (TDE) of a super-Jupiter mass object around a 105 M black hole. We outline a standard jet model, provide an explanation for the observed circular polarization, and quantitatively suggest a link between the peak radio and peak X-ray emission via inverse Compton upscattering of the photons emitted by the relativistic electrons. We predict that it should be possible to resolve a young radio jet via VLBI as a result of this nearby TDE. Subject headings: galaxies: individual (NGC 4845) — galaxies: active — galaxies: jets — galaxies: nuclei 1. Introduction 1 Dept. of Physics, Engineering Physics, & Astronomy, Queen’s University, Kingston, Ontario, Canada, K7L 3N6 [email protected], [email protected], [email protected] . 2 Max-Planck-Institut f¨ ur Radioastronomie, Auf dem H¨ ugel 69, 53121, Bonn, Germany, [email protected]. 3 Dept. of Astronomy, University of Massachusetts, 710 North Pleasant St., Amherst, MA, 01003, USA, [email protected]. 4 US Planck Data Center, The California Institute of Technology, MC 220-6, Pasadena, CA, 91125, USA, [email protected]. 5 Netherlands Institute for Radio Astronomy (ASTRON), Postbus 2, 7990 AA, Dwingeloo, The Netherlands, [email protected]. 6 Physics and Space Sciences Dept., Florida Institute of Technology, 150 West University Boulevard, Melbourne, FL, 32901, USA, [email protected]. The discovery of a hard X-ray source at the center of the galaxy, NGC 4845, by INTEGRAL (IGRJ12580+0134) has been interpreted as the tidal disruption of a super-Jupiter by a massive black hole (Nikolajuk & Walter 2013). As part of the Continuum Halos in Nearby Galaxies – an EVLA1 Survey (CHANG-ES), we have detected a variable radio source (a compact core) in NGC4845 (Table 1), showing unambiguously that this galaxy harbours an active galactic nucleus (AGN). The peak of the X-ray light curve occurred on January 22, 2011. Our radio observations were carried out approximately one year 1 The Expanded Very Large Array is now known as the Jansky Very Large Array. 1 Draft version July 3, 2015 Preprint typeset using LATEX style emulateapj v. 04/17/13 CHARGE OF INTERSTELLAR DUST IN DENSE MOLECULAR CLOUDS: EFFECT OF COSMIC RAYS A. V. Ivlev1 , M. Padovani2,3 , D. Galli3 , and P. Caselli1 arXiv:1507.00692v1 [astro-ph.GA] 1 Jul 2015 2 1 Max-Planck-Institut f¨ ur Extraterrestrische Physik, 85741 Garching, Germany Laboratoire Univers et Particules de Montpellier, UMR 5299 du CNRS, Universit´ e de Montpellier, 34095 Montpellier, France 3 INAF-Osservatorio Astrofisico di Arcetri, 50125 Firenze, Italy Draft version July 3, 2015 ABSTRACT The local cosmic-ray (CR) spectra are calculated for typical characteristic regions of a cold dense molecular cloud, to investigate two so far neglected mechanisms of dust charging: collection of suprathermal CR electrons and protons by grains, and photoelectric emission from grains due to the UV radiation generated by CRs. The two mechanisms add to the conventional charging by ambient plasma, produced in the cloud by CRs. We show that the CR-induced photoemission can dramatically modify the charge distribution function for submicron grains. We demonstrate the importance of the obtained results for dust coagulation: While the charging by ambient plasma alone leads to a strong Coulomb repulsion between grains and inhibits their further coagulation, the combination with the photoemission provides optimum conditions for the growth of large dust aggregates in a certain region of the cloud, corresponding to the densities n(H2 ) between ∼ 104 cm−3 and ∼ 106 cm−3 . The charging effect of CR is of generic nature, and therefore is expected to operate not only in dense molecular clouds but also in the upper layers and the outer parts of protoplanetary discs. Subject headings: ISM: dust – ISM: clouds – ISM: cosmic rays 1. INTRODUCTION Interstellar dust grains in dense molecular clouds are subject to several electric charging processes (e.g., Draine & Salpeter 1979; Draine & Sutin 1987; Weingartner & Draine 2001b). The resulting net electric charge carried by micron or sub-micron size grains has important consequences for the chemical and dynamical evolution of molecular clouds: it affects the process of dust coagulation (Okuzumi 2009; Dominik et al. 2007), the rate of grain-catalyzed electron-ion recombination (Mestel & Spitzer 1956; Watson 1974), the amount of gas-phase elemental depletion (Spitzer 1941), and the electrical resistivity of the cloud’s plasma (Elmegreen 1979; Wardle & Ng 1999). The resistivity, in turn, controls the coupling between the neutral gas and the interstellar magnetic field, and eventually the dynamics of gravitational collapse of molecular clouds and the formation of stars (e.g., Nakano et al. 2002; Shu et al. 2006). Collisions of dust grains with the plasma of thermal electrons and ions from the gas (hereafter, cold plasma charging) represent an important dust charging process in molecular clouds (e.g., Draine & Sutin 1987; Draine 2011). Since electrons of mass me have a thermal speed which is much p larger than that of ions of mass mi (by the factor mi /me ≫ 1), grains acquire by this process a (predominantly) negative charge. The photoelectric effect (also called photoemission), on the other hand, results in positive charging of dust grains, and is set by the radiation field in the cloud at energies above a few eV. Photoemission is an important charging process for diffuse gas with visual extinction AV . 10 (e.g., Bakes & Tielens 1994; Weingartner & Draine 2001b). As the interstellar radiation field is exponentially attenuated with increasing AV , photoemission is usually neglected to compute the charge distribution of e-mail: [email protected] grains in the dense gas of molecular cloud cores (e.g., Umebayashi & Nakano 1980; Nishi et al. 1991). Cold plasma charging and photoemission are usually assumed to be the dominant grain charging mechanisms in the cold interstellar medium. In this paper we study the effects of cosmic rays (CRs) on the charging of submicron dust grains in molecular clouds. We focus on two charging processes that contribute in addition to the cold-plasma charging, but have been completely neglected so far. By calculating the local CR spectra for typical cloud regions, we investigate the effects of (i) collection of suprathermal CR electrons and protons by grains and (ii) photoelectric emission from grains due to the UV radiation generated by CRs. Using the coldplasma collection as the “reference case”, we show that the photoelectric emission can dramatically modify the charge distribution function for dust in almost the entire cloud, and discuss important implications of the obtained results. In particular, we point out that while the cold-plasma charging alone leads to a strong Coulomb repulsion between grains and inhibits their further coagulation, the combination with the CR-induced photoemission provides optimum conditions for the growth of large dust aggregates in a certain region of the cloud. 2. CR PROPERTIES RELEVANT TO DUST CHARGING The specific intensities (or spectra) of CR protons and electrons inside a dense molecular cloud are determined by the interstellar CR spectra. In order to constrain the trend of the interstellar spectra at high energies (E & 500 MeV), we use the latest results of the Alpha Magnetic Spectrometer (AMS-02), mounted on the International Space Station (Aguilar et al. 2014, 2015). The high-energy spectrum slope is −3.2 for electrons, while for protons it is −2.7. At lower energies, the shape of the interstellar CR spectrum is highly uncertain due to the effect of Solar mod- The Wide Area VISTA Extra-galactic Survey (WAVES) arXiv:1507.00676v1 [astro-ph.CO] 2 Jul 2015 Simon P. Driver, Luke J. Davies, Martin Meyer, Chris Power, Aaron S.G. Robotham, Ivan K. Baldry, Jochen Liske and Peder Norberg Abstract The “Wide Area VISTA Extra-galactic Survey” (WAVES) is a 4MOST Consortium Design Reference Survey which will use the VISTA/4MOST facility to spectroscopically survey ∼ 2 million galaxies to rAB < 22 mag. WAVES consists of two interlocking galaxy surveys (“WAVES-Deep” and “WAVES-Wide”), providing the next two steps beyond the highly successful 1M galaxy Sloan Digital Sky Survey and the 250k Galaxy And Mass Assembly survey. WAVES will enable an unprecedented study of the distribution and evolution of mass, energy, and structures extending from 1-kpc dwarf galaxies in the local void to the morphologies of 200Mpc filaments at z ∼ 1. A key aim of both surveys will be to compare comprehensive empirical observations of the spatial properties of galaxies, groups, and filaments, against state-of-the-art numerical simulations to distinguish between various Dark Matter models. 1 Introduction Since the pioneering days of the 2dFGRS and SDSS, extra-galactic spectroscopic surveys have come in two flavours: those optimised for cosmology, and those optiSimon P. Driver, Luke J. Davies, Martin Meyer, Chris Power, Aaron S.G. Robotham International Centre for Radio Astronomy Research (ICRAR), School of Physics, University of Western Australia, M468, 35 Stirling Highway, Crawley, Western Australia, WA 6009 e-mail: [email protected] Ivan K.Baldry Astrophysics Research Institute, Liverpool John Moores University, IC2, Liverpool Science Park, 146 Brownlow Hill Liverpool, L3 5RF, UK Jochen Liske European Southern Observatory, Karl-Schwarzschild-Str. 2, 85748, Garching, Germany Peder Norberg International Cosmology Centre, Durham University, Durham, DH1 3LE, UK 1 Mon. Not. R. Astron. Soc. 000, 1–?? () Printed 3 July 2015 (MN LATEX style file v2.2) arXiv:1507.00675v1 [astro-ph.CO] 2 Jul 2015 A giant ring-like structure at 0.78 < z < 0.86 displayed by GRBs L. G. Bal´azs1,2⋆ , Z. Bagoly2,3, J. E. Hakkila4, I. Horv´ath3, J. K´obori2, I. R´acz1, L. V. T´oth2 1 MTA CSFK Konkoly Observatory, Konkoly-Thege M. u ´t 13-17, Budapest, 1121, Hungary University, P´ azm´ any P´ eter s´ et´ any 1/A, Budapest,1117, Hungary 3 National University of Public Service, 1083, Budapest, Hungary 4 Department of Physics and Astronomy, The College of Charleston, Charleston, SC 29424-0001, USA 2 E¨ otv¨ os ABSTRACT According to the cosmological principle, Universal large-scale structure is homogeneous and isotropic. The observable Universe, however, shows complex structures even on very large scales. The recent discoveries of structures significantly exceeding the transition scale of 370 Mpc pose a challenge to the cosmological principle. We report here the discovery of the largest regular formation in the observable Universe; a ring with a diameter of 1720 Mpc, displayed by 9 gamma ray bursts (GRBs), exceeding by a factor of five the transition scale to the homogeneous and isotropic distribution. The ring has a major diameter of 43o and a minor diameter of 30o at a distance of 2770 Mpc in the 0.78 < z < 0.86 redshift range, with a probability of 2 × 10⁻⁶ of being the result of a random fluctuation in the GRB count rate. Evidence suggests that this feature is the projection of a shell onto the plane of the sky. Voids and string-like formations are common outcomes of large-scale structure. However, these structures have maximum sizes of 150 Mpc, which are an order of magnitude smaller than the observed GRB ring diameter. Evidence in support of the shell interpretation requires that temporal information of the transient GRBs be included in the analysis. This ring-shaped feature is large enough to contradict the cosmological principle. The physical mechanism responsible for causing it is unknown. Key words: Large-scale structure of Universe, cosmology: observations, gamma-ray burst: general 1 INTRODUCTION Quasars are well-suited for mapping out the large-scale distribution of matter in the Universe, due to their very high luminosities and preferentially large redshifts. Quasars are associated by groups and poor clusters of galaxies (Hein¨ am¨ aki et al. 2005; Lietzen et al. 2009) and can be observed even when the underlying galaxies are faint and difficult to detect. When quasars cluster, they identify considerable amounts of underlying matter, such that quasar clusters have been used to detect matter clustered on very large scales. Some of this matter is clustered on scales equal to or exceeding that of the Sloan Great Wall (Gott et al. 2005). A number of large quasar groups (LQG) have been iden- ⋆ E-mail, [email protected] c RAS tified in recent years; each one mapping out large amounts of much fainter matter. After Webster (1982) found a group of four quasars at z = 0.37 with a size of about 100 Mpc, having a low probability of being a chance alignment, Komberg, Kravtsov & Lukash (1994) identified strong clustering in the quasar distribution at scales less than 20 h−1 Mpc, and defined LQGs using a well-known cluster analysis technique. Subsequently, Komberg, Kravtsov & Lukash (1996) identified additional LQGs, and Komberg & Lukash (1998) reported a new finding of eleven LQGs based on systematic cluster analysis. The sizes of these clusters ranged from 70 to 160 h−1 Mpc. Newman et al. (1998a,b) later discovered a 150 h−1 Mpc group of 13 quasars at median redshift z ∼ = 1.51. Williger et al. (2002) mapped 18 quasars spanning ≈ 5◦ × 2.5◦ on the sky, with a quasar spatial overdensity 6−10 times greater than the mean. Haberzettl et al. (2009) investigated two sheet-like structures of galaxies at arXiv:1507.00665v1 [astro-ph.GA] 2 Jul 2015 Galaxy And Mass Assembly (GAMA): A study of energy, mass, and structure (1kpc-1Mpc) at z < 0.3 Simon P. Driver,1,2 (and the GAMA team) 1 International Centre for Radio Astronomy Research (ICRAR), School of Physics, University of Western Australia, Crawley, Perth, WA 6009, Australia; Simon.Driver@ uwa.edu.au 2 SUPA, School of Physics and Astronomy, University of St Andrews, North Haugh, St Andrews, Fife, KY16 9SS, UK, spd3@ st-and.ac.uk Abstract. The GAMA survey has now completed its spectroscopic campaign of over 250,000 galaxies (r < 19.8mag), and will shortly complete the assimilation of the complementary panchromatic imaging data from GALEX, VST, VISTA, WISE, and Herschel. In the coming years the GAMA fields will be observed by the Australian Square Kilometer Array Pathfinder allowing a complete study of the stellar, dust, and gas mass constituents of galaxies within the low-z Universe (z < 0.3). The science directive is to study the distribution of mass, energy, and structure on kpc-Mpc scales over a 3billion year timeline. This is being pursued both as an empirical study in its own right, as well as providing a benchmark resource against which the outputs from numerical simulations can be compared. GAMA has three particularly compelling aspects which set it apart: completeness, selection, and panchromatic coverage. The very high redshift completeness (∼ 98%) allows for extremely complete and robust pair and group catalogues; the simple selection (r < 19.8mag) minimises the selection bias and simplifies its management; and the panchromatic coverage, 0.2µm - 1m, enables studies of the complete energy distributions for individual galaxies, well defined sub-samples, and population assembles (either directly or via stacking techniques). For further details and data releases see: http://www.gama-survey.org 1. Introduction Extra-galactic studies, in and around the 21st century, can arguably be broken down into four distinct categories: Focused experiments (e.g., WiggleZ, BOSS, DES, Euclid); high-fidelity studies of well selected sub-samples (e.g., S4 G, ATLAS3D, MANGA etc); frontier studies (e.g., HDF, UDF, Frontier’s fields); and open-ended legacy studies (e.g., 2MASS, SDSS, COSMOS, GEMS, CANDLES). These distinct approaches are all important and highly complementary. The Galaxy And Mass Assembly survey (GAMA; Driver et al. 2011), very much fits into the latter category, by providing a broad legacy resource to the community, with a key focus on being comprehensive and complete. GAMA, like its predecessors the SDSS and 2MASS, is now forming the basis for highfidelity follow-on studies (e.g., SAMI/IFU, ASKAP/DINGO, Euclid Legacy Science), and even frontier studies (e.g., HST lens sample, JWST usage of GAMA groups as probes to z > 10). Internally the GAMA team now consists of over 100 scientists studying the distribution and evolution of mass, energy, and structure with data also flowing through to external teams fueling collaborative projects. 1 arXiv:1507.00651v1 [astro-ph.SR] 2 Jul 2015 Confined Flares in Solar Active Region 12192 from 2014 October 18 to 29 Huadong Chen1 , Jun Zhang1 , Suli Ma2 , Shuhong Yang1 , Leping Li1 , Xin Huang1 , Junmin Xiao1 [email protected] ABSTRACT Using the observations from the Atmospheric Imaging Assembly (AIA) and Helioseismic and Magnetic Imager (HMI) aboard the Solar Dynamics Observatory (SDO), we investigate six X-class and twentynine M-class flares occurring in solar active region (AR) 12192 from October 18 to 29. Among them, thirty (including six X- and twenty-four M-class) flares originated from the AR core and the other five M-flares appeared at the AR periphery. Four of the X-flares exhibited similar flaring structures, indicating they were homologous flares with analogous triggering mechanism. The possible scenario is: photospheric motions of emerged magnetic fluxes lead to shearing of the associated coronal magnetic field, which then yields a tether-cutting favorable configuration. Among the five periphery M-flares, four were associated with jet activities. The HMI vertical magnetic field data show that the photospheric fluxes of opposite magnetic polarities emerged, converged and canceled with each other at the footpoints of the jets before the flares. Only one M-flare from the AR periphery was followed by a coronal mass ejection (CME). From October 20 to 26, the mean decay index of the horizontal background field within the height range of 40–105 Mm is below the typical threshold for torus instability onset. This suggests that a strong confinement from the overlying magnetic field might be responsible for the poor CME production of AR 12192. Subject headings: Sun: activity — Sun: coronal mass ejections (CMEs) — Sun: flares — Sun: UV radiation 1 Key Laboratory of Solar Activity, National Astronomical Observatories, Chinese Academy of Sciences, Beijing 100012, China 2 College of Science, China University of Petroleum, Qingdao 266580, China Mon. Not. R. Astron. Soc. 000, 1–6 (2015) Printed 3 July 2015 (MN LATEX style file v2.2) arXiv:1507.00643v1 [astro-ph.HE] 2 Jul 2015 On the variable timing behavior of PSR B0540−69 and PSR J1846−0258 F. F. Kou, Z. W. Ou & H. Tong⋆ Xinjiang Astronomical Observatory, Chinese Academy of Sciences, Urumqi, Xinjiang 830011, China 2015.7 v1 ABSTRACT The pulsar wind model is applied to explain the variable timing behavior of PSR B0540−69 and PSR J1846−0258. For PSR B0540−69, a 36% relative increase in the spin down rate was reported recently. Similarly, a net decrease in the spin frequency ∆ν ≈ −10−4 Hz after a large glitch and a lower braking index were detected for PSR J1846−0258. In the pulsar wind model, braking indices of these two pulsar which are all larger than 1 but smaller than 3 can be well explained. The particle density reflects the magnetospheric activity in real-time and may be responsible for the changing spin down behavior. A different state of particle density (κ0 ± ∆κ) will result in increase (or decrease) in the spin down rate. Corresponding to the variable timing behavior of PSR B0540−69 and PSR J1846−0258, the relative increase in the particle density are respectively 88% and 44% in the vacuum gap model. A changing particle density (κ(t)) will lead to a varying braking index. The changing particle density is κ˙ = 1.68 × 10⁻⁹ s−1 for PSR J1846−0258 corresponding to its lower braking index 2.19 ± 0.03. Key words: pulsars: general – pulsars: individual (PSR B0540−69; PSR J1846−0258) – stars: neutron – wind 1 INTRODUCTION PSR B0540−69, known as the “Crab Twin”, is a young radio pulsar with a characteristic magnetic field about 1013 G at the magnetic poles1 . It was discovered with the Einstein Observatory (Seward, Harnden & Helfand 1984) and had been long-term monitored by the RXTE satellite etc. Only two glitches with relative small changes in spin down parameters were reported (Zhang et al. 2001; Cusumano, Massaro & Mineo 2003; Livingstone, Kaspi& Gavriil 2005; Ferdman, Archibald & Kaspi 2015). Recently, a persistent and unprecedented increase in the spin down rate of PSR B0540−69 was reported: the relative increase in the spindown rate is 36% which is orders magnitude larger than the changes induced by glitches (Marshall, Guillemot & Harding 2015). Coincidentally, a net decrease in the spin frequency (∆ν ≈ −104 Hz) after the large glitch had been observed for PSR J1846−0258 (Livingstone, Kaspi, & Gavriil 2010). Besides, just like the Crab pulsar, a lower braking index n = 2.19±0.03 of PSR J1846−0258 was detected later which obviously deviates from the pre-outburst value 2.65 ± 0.01 (Livingstone et al. 2006, 2011; Archibald et al. 2015b). These ⋆ Corresponding author: [email protected] Assuming all the rotational energy is consumed pby magneto19 dipole radiation in vacuum, B(pole) = 6.4 × 10 P P˙ G 1 two sources are just two examples of the variable timing behavior of pulsars. The physics behind the variable timing behavior is still unknown. The spin down behavior of pulsars can be described by the power law: ν˙ = −Cν n , (1) where ν and ν˙ are respectively the spin down frequency and frequency derivative, C is usually taken as a constant and n is the braking index. The braking index is defined accordingly: n= ν ν¨ , ν˙ 2 (2) where ν¨ is the second derivative of spin frequency. The braking index reflects the pulsar braking mechanism (Tong 2015). In the magneto-dipole braking model, a pulsar ro2 2 µ ν 3 sin2 α. Where µ = tates uniformly in vacuum ν˙ = − 8π 3Ic3 3 1/2BR is the magnetic dipole moment and I = 1045 g cm2 is the moment of inertia, c is the speed of light, and α is the angle between the rotational axis and the magnetic axis (i.e. the inclination angle). The braking index is three in the magnetic dipole braking model. It is not consistent with the braking index observations of pulsars (Lyne et al. 2015) Furthermore, the fundamental assumption of the magnetic dipole braking model (vacuum condition) does not exist arXiv:1507.00603v1 [astro-ph.CO] 2 Jul 2015 Prepared for submission to JCAP Theoretical Estimate of the Sensitivity of the CUORE Detector to Solar Axions Dawei. Li,a,1 R.J. Creswick,a F.T. Avignone III,a and Yuanxu. Wangb a Department b School of Physics and Astronomy, University of South Carolina, Columbia, SC, USA of Physics and Electronics, Henan University, Kaifeng, Henan, China E-mail: [email protected] Abstract. In this paper we calculate the potential sensitivity of the CUORE detector to axions produced in the Sun through the Primakoff process and detected by coherent Bragg conversion by the inverse Primakoff process. The conversion rate is calculated using density functional theory for the electron density and realistic expectations for the energy resolution and background of CUORE. Monte Carlo calculations for 5 y×741 kg=3705 kg y of exposure are analyzed using time correlation of individual events with the theoretical time-dependent counting rate and lead to an expected limit on the axion-photon coupling gaγγ < 3.83 × 10⁻¹⁰ GeV −1 for axion masses less than several eV. 1 Corresponding author. c ESO 2015 Astronomy & Astrophysics manuscript no. gx304 July 3, 2015 Luminosity-dependent spectral and timing properties of the accreting pulsar GX 304−1 measured with INTEGRAL C. Malacaria, D. Klochkov, A. Santangelo, and R. Staubert Institut für Astronomie und Astrophysik, Sand 1, 72076 Tübingen, Germany e-mail: [email protected] arXiv:1507.00595v1 [astro-ph.HE] 2 Jul 2015 July 3, 2015 ABSTRACT Context. Be/X-ray binaries show outbursts with peak luminosities up to a few times 1037 erg/s, during which they can be observed and studied in detail. Most (if not all) Be/X-ray binaries harbour accreting pulsars, whose X-ray spectra in many cases contain cyclotron resonant scattering features related to the magnetic field of the sources. Spectral variations as a function of luminosity and of the rotational phase of the neutron star are observed in many accreting pulsars. Aims. We explore X-ray spectral and timing properties of the Be/X-ray binary GX 304-1 during an outburst episode. Specifically, we investigate the behavior of the cyclotron resonant scattering feature, the continuum spectral parameters, the pulse period, and the energy- and luminosity-resolved pulse profiles. We combine the luminosity-resolved spectral and timing analysis to probe the accretion geometry and the beaming patterns of the rotating neutron star. Methods. We analyze the INTEGRAL data from the two JEM-X modules, ISGRI and SPI, covering the January-February 2012 outburst, divided in six observations. We obtain pulse profiles in two energy bands, phase-averaged and phase-resolved spectra for each observation. Results. We confirm the positive luminosity-dependence of the cyclotron line energy in GX 304-1, and report a dependence of the photon index on luminosity. Using a pulse-phase connection technique, we find a pulse period solution valid for the entire outburst. Our pulse-phase resolved analysis shows, that the centroid energy of the cyclotron line is varying only slightly with pulse phase, while other spectral parameters show more pronounced variations. Our results are consistent with a scenario in which, as the pulsar rotates, we are exploring only a small portion of its beam pattern. Key words. X-rays: binaries – stars: neutron – accretion, accretion disks – pulsars: individual: GX 304-1 1. Introduction GX 304-1 is a Be/X-ray binary (BeXRB) system discovered as an X-ray source in 1967 during a balloon observation (Lewin et al. 1968a,b). Subsequently, the source was established to be an X-ray pulsar with a pulse period of ∼ 272 s (McClintock et al. 1977). A study of the recurrent outburst activity revealed a ∼ 132.5 d periodicity, likely due to the system’s orbital period (Priedhorsky & Terrell 1983). The optical counterpart of the binary is a B2 Vne star, whose distance has been measured to be 2.4 ± 0.5 kpc (Parkes et al. 1980). Since 1980, the source entered an X-ray off-state (Pietsch et al. 1986), showing no detectable emission for 28 years. The quiescence was interrupted in June 2008, when INTEGRAL detected hard X-ray emission from the source (Manousakis et al. 2008). Since then, GX 304-1 lighted up repeatedly, becoming a periodically outbursting X-ray source. The period of the outbursts after 2009 is roughly the same as before 1980, i.e., ∼132.5 d. The peak luminosities are .1037 erg/s in the 5 − 100 keV energy band. The origin of the X-ray emission is believed to be accretion of matter from the circumstellar equatorial disk around the optical companion onto a magnetized neutron star. The strong magnetic field of the accretor (∼1012 G) channels the captured matter towards its magnetic poles where X-ray emission originates in an accretion structure. A Cyclotron Resonant Scattering feature (CRSF), or cyclotron line, has been detected in the spectrum of GX 304-1 with a centroid energy of ∼ 52 keV (Yamamoto et al. 2011). CRSFs are important features in the spectra of accreting pulsars. In a strong magnetic field, electron energies corresponding to their motion perpendicular to the magnetic field lines are quantized in Landau levels, causing resonant scattering of impinging photons. The first such line ever was detected in data from a balloon observation of Her X-1 (Trümper et al. 1978). Nowadays, they have turned out to be rather common in accreting X-ray pulsars, with ∼ 20 objects being confirmed cyclotron line sources, with several objects showing multiple lines (up to four harmonics in 4U 0115+63, Santangelo et al. 1999). Reviews are given by e.g. Coburn et al. (2002); Staubert (2003); Heindl et al. (2004); Terada et al. (2007); Wilms (2012); Caballero & Wilms (2012). The energy of the fundamental line Ecyc is directly proportional to the magnetic field strength at the emission site, Ecyc ∼ 11.6 × B12 (1 + zg ) keV, where B12 is the magnetic field in units of 1012 G, and zg is the gravitational redshift. More recent observations have shown that the cyclotron line energy in GX 304-1 is positively correlated with the observed luminosity (Klochkov et al. 2012). Such a positive correlation was first observed in Her X-1 by Staubert et al. (2007) and is now observed also for GX 304-1 , Vela X-1 (Fürst et al. 2014) and recently also for A 0535+26 (Sartore et al. 2015). The opposite correlation, a negative dependence between the cyclotron line energy and the luminosity, was actually detected earlier in high luminosity transient sources (4U 0115+63, Cep X-4, and V 0332+53, Mihara et al. 1998). During the 2004/2005 outburst of V 0332+53, a clear anti-correlation of Article number, page 1 of 12 c ESO 2015 Astronomy & Astrophysics manuscript no. SelfGen July 3, 2015 Non-linear cosmic ray Galactic transport in the light of AMS-02 and Voyager data (Research Note) R. Aloisio,1, 2 P. Blasi2, 1 and P. D. Serpico3 1 arXiv:1507.00594v1 [astro-ph.HE] 2 Jul 2015 2 3 Gran Sasso Science Institute (INFN), Viale F. Crispi 7, 67100 L’Aquila, Italy e-mail: [email protected] INAF/Osservatorio Astrofisico di Arcetri, Largo E. Fermi, 5 50125 Firenze, Italy e-mail: [email protected] LAPTh, Univ. Savoie Mont Blanc, CNRS, B.P.110, Annecy-le-Vieux F-74941, France e-mail: [email protected] Received; accepted Preprint numbers: LAPTH-036/15 ABSTRACT Context. Features in the spectra of primary cosmic rays (CRs) provide invaluable information on the propagation of these particles in the Galaxy. In the rigidity region around a few hundred GV, such features have been measured in the proton and helium spectra by the PAMELA experiment and later confirmed with a higher significance by AMS-02. We investigate the implications of these datasets for the scenario in which CRs propagate under the action of self-generated waves. Aims. We show that the recent data on the spectrum of protons and helium nuclei as collected with AMS-02 and Voyager are in very good agreement with the predictions of a model in which the transport of Galactic CRs is regulated by self-generated waves. We also study the implications of the scenario for the boron-to-carbon ratio: although a good overall agreement is found, at high energy we find marginal support for a (quasi) energy independent contribution to the grammage, that we argue may come from the sources themselves. Methods. The transport equation for both primary and secondary nuclei is solved together with an equation for the evolution of the self-generated waves and a background of pre-existing waves. The solution of this system of non-linear equations is found with an iterative method elaborated by the same authors in previous work on this topic. Results. A break in the spectra of all nuclei is found at rigidity of a few hundred GV, as a result of a transition from self-generated waves to pre-existing waves with a Kolmogorov power spectrum. Neither the slope of the diffusion coefficient, nor its normalisation are free parameters. Moreover, at rigidities below a few GV, CRs are predicted to be advected with the self-generated waves at the local Alfvén speed. This effect, predicted in our previous work, provides an excellent fit to the Voyager data on the proton and helium spectra at low energies, providing additional support to the model. 1. Introduction The transport of Galactic cosmic rays (CRs) is likely to be very complex: the structure of the large scale magnetic field is complicated and very poorly known, and the structures on small scales (resonant with the CR particles) are basically unknown, although the fact that the diffusion paradigm seems to work can be considered as an indirect evidence for the existence of such small scale turbulence. The origin of the power on small scales is also unknown, but one contribution that seems to be hardly avoidable is that due to the self-generation of perturbations due to the CR current, proportional to the gradient of CRs, which in turn is due to the existence of the same scattering centres, responsible for diffusion. This simple description is sufficient to emphasise the non-linear nature of this process, which is qualitatively similar to what happens at supernova shocks, thought to be the main sources of Galactic CRs (see the recent review by Blasi (2013)). In addition to the self-generated waves, turbulence at larger spatial scales is generically expected and becomes important for scattering CRs of higher energies. This scenario has been analysed in detail in (Blasi et al. 2012; Aloisio 2013), where the main implications were discussed: Blasi et al. (2012) calculated the spectrum of protons under the action of both the self-generated and pre-existing turbulence, and compared the results with the PAMELA data available at the time (Adriani 2011), where the first direct detection of a spectral break in proton and helium fluxes at few hundred GV was claimed. The first release of the data collected by AMS-02 (Haino 2013; Choutko 2013) did not confirm the existence of these spectral features and brought the investigation on this topic to an almost complete standstill, waiting for the resolution of the observational conundrum. Recently the AMS collaboration published the final analysis of the data on the proton spectrum (Aguilar et al. 2015), where a change of slope at few hundred GV is evident. At the present time, only preliminary results on the spectrum of helium and carbon nuclei are available (AMS-02 2015), but a similar break is visible in such data as well. Moreover, preliminary data on the B/C ratio have also been presented: the small statistical error bars up to high energies allow us to use this tool as a powerful indicator of the propagation of CRs through the Galaxy. In addition to the AMS-02 data, the results of another invaluable experimental effort became available in the last few years: the Voyager spacecraft, launched in 1977, reached the termination shock and is now believed to be moving in the interstellar medium, unaffected by the solar wind (Stone et al. 2013). Article number, page 1 of 5 Solar Physics DOI: 10.1007/•••••-•••-•••-••••-• Quantifying the Difference Between the Flux-Tube Expansion Factor at the Source Surface and at the Alfv´ en Surface Using A Global MHD Model for the Solar Wind arXiv:1507.00572v1 [astro-ph.SR] 2 Jul 2015 O. Cohen1 · c Springer •••• Abstract The potential field approximation has been providing a fast, and computationally inexpensive estimation for the solar corona’s global magnetic field geometry for several decades. In contrast, more physics-based global magnetohydrodynamic (MHD) models have been used for a similar purpose, while being much more computationally expensive. Here, we investigate the difference in the field geometry between a global MHD model and the potential field source surface model (PFSSM) by tracing individual magnetic field lines in the MHD model from the Alfv´en surface (AS), through the source surface (SS), all the way to the field line footpoint, and then back to the source surface in the PFSSM. We also compare the flux-tube expansion at two points at the SS and the AS along the same radial line. We study the effect of solar cycle variations, the order of the potential field harmonic expansion, and different magnetogram sources. We find that the flux-tube expansion factor is consistently smaller at the AS than at the SS for solar minimum and the fast solar wind, but it is consistently larger for solar maximum and the slow solar wind. We use the Wang–Sheeley–Arge (WSA) model to calculate the associated wind speed for each field line, and propagate these solar-wind speeds to 1 AU. We find a more than five hours deviation in the arrival time between the two models for 20 % of the field lines in the solar minimum case, and for 40 % of the field lines in the solar maximum case. Keywords: Magnetic fields, Models — Solar Wind, Theory — Velocity Fields, Solar Wind 1. Introduction The magnetic field above the solar photosphere and in the solar corona is weak. Therefore, it is hard to obtain observationally the three-dimensional topol1 Harvard-Smithsonian Center for Astrophysics, 60 Garden St. Cambridge, MA 02138, USA email: [email protected] SOLA: ms.tex; 3 July 2015; 0:37; p. 1 arXiv:1507.00540v1 [astro-ph.SR] 2 Jul 2015 Heliosphere for a wide range of interstellar magnetic field strengths as a source of energetic neutral atoms A. Czechowski1 and J. Grygorczuk2 Space Research Centre, Polish Academy of Sciences, Bartycka 18A, 00-716 Warsaw, Poland and D. J. McComas3 Southwest Research Institute, San Antonio, TX 78228 USA and Dept. of Physics and Astronomy, University of Texas at San Antonio, San Antonio, TX 78249, U.S.A. ABSTRACT Observations of the energetic neutral atoms (ENAs) of heliospheric origin by IBEX differ from expectations based on heliospheric models. It was proposed that the structure of the heliosphere may be similar to the ”two-stream” model derived in 1961 by Parker for the case of strong interstellar magnetic field. Using MHD simulations, we examine possible structure of the heliosphere for a wide range of interstellar magnetic field strengths, with different choices of interstellar medium and solar wind parameters. For the model heliospheres, we calculate the fluxes of ENAs created in the inner heliosheath, and compare with IBEX observations. We find that the plasma flow in the model heliospheres for strong interstellar field (∼20 µG) has a ”two-stream” structure, which remains visible down to ∼5 µG. The obtained ENA flux distribution show the features similar to the ”split tail” effect observed by IBEX. In our model, the main cause of this effect is the two component (fast and slow) solar wind structure. Subject headings: Sun: heliosphere — Sun: solar wind — ISM: magnetic fields — magnetohydrodynamics 1. sphere in the case of the Sun) were first introduced in the classic work by Parker (1961). As shown by Parker, in the case of a star moving through unmagnetized interstellar plasma, the stellar wind flow, after passing the termination shock, turns ultimately in the direction opposite to the motion of the star, forming the ”tail” (heliotail). This structure was indeed obtained in all models of the heliosphere based on numerical solutions of the gas dynamical or MHD equations. Recently, another class of these models was included in the discussion. As again shown by Parker (1961), in the case of a star at rest with respect to the interstellar medium with strong magnetic field, the stellar wind may form, instead of a single astrotail, two oppositely directed streams Introduction Energetic neutral atoms (ENAs) created in the distant heliosphere by energetic ion neutralization provide a means to remotely observe the distant regions of the heliosphere. Theoretical models of the large scale structure of the heliosphere are important for understanding and interpreting these observations. The global models of the stellar wind interaction with the interstellar medium (ISM), leading to the formation of the astrospheres (the helio1 e-mail: [email protected] [email protected] 3 e-mail: [email protected] 2 e-mail: 1 c ESO 2015 Astronomy & Astrophysics manuscript no. new July 3, 2015 Relationship between the column density distribution and evolutionary class of molecular clouds as viewed by ATLASGAL Abreu-Vicente, J.1⋆ , Kainulainen, J.1 , Stutz, A.1 , Henning, Th.1 , Beuther, H.1 Max-Planck-Institut für Astronomie (MPIA), Königstuhl 17, 69117, Heidelberg, Germany arXiv:1507.00538v1 [astro-ph.GA] 2 Jul 2015 July 3, 2015 ABSTRACT We present the first study of the relationship between the column density distribution of molecular clouds within nearby Galactic spiral arms and their evolutionary status as measured from their stellar content. We analyze a sample of 195 molecular clouds located at distances below 5.5 kpc, identified from the ATLASGAL 870 µm data. We define three evolutionary classes within this sample: starless clumps, star-forming clouds with associated young stellar objects, and clouds associated with H ii regions. We find that the N(H2 ) probability density functions (N-PDFs) of these three classes of objects are clearly different: the N-PDFs of starless clumps are narrowest and close to log-normal in shape, while star-forming clouds and H ii regions exhibit a power-law shape over a wide range of column densities and log-normal-like components only at low column densities. We use the N-PDFs to estimate the evolutionary time-scales of the three classes of objects based on a simple analytic model from literature. Finally, we show that the integral of the N-PDFs, the dense gas mass fraction, depends on the total mass of the regions as measured by ATLASGAL: more massive clouds contain greater relative amounts of dense gas across all evolutionary classes. Key words. ISM: clouds – dust – extinction – ISM: structure – stars: formation – infrared: ISM 1. Introduction Molecular clouds (MCs) are the densest regions of the interstellar medium and the birth sites of stars. Nevertheless, despite this important role in star formation, key aspects of MC evolution remain unclear: What are the key parameters in determining the star-forming activity of MCs? How do these parameters change with MC evolution? The column density distribution of MCs has been found to be sensitive to the relevant physical processes (Hennebelle & Falgarone 2012). The study of the density structure of clouds that are at different evolutionary stages can therefore help to understand which physical processes are dominating the cloud structure at those stages. Column density probability density functions (N-PDFs) are useful tools for inferring the role of different physical processes in shaping the structure of molecular clouds. Observations have shown that non-star-forming molecular clouds show bottom-heavy1 N-PDFs, while the star-forming molecular clouds show top-heavy2 N-PDFs (Kainulainen et al. 2009, 2011b, 2014; Kainulainen & Tan 2013; Schneider et al. 2013). It is generally accepted that the top-heavy N-PDFs are well described by a power-law function in their high-column density regimes. The description of the shapes of the low-column density regimes of both kinds of N-PDFs is still a matter of debate. The papers cited above describe the low-column density regimes as log-normal functions. In contrast, Alves et al. (2014) and Lombardi et al. (2015) argue that a power-law function fits the observed N-PDFs Send offprint requests to: J. Abreu-Vicente, e-mail: [email protected] ⋆ Member of the International Max Planck Research School (IMPRS) at the University of Heidelberg 1 Most of their mass is in low-column density material. 2 They have a significant amount of mass enclosed in high-column density regions. throughout their range. The origin of these differences is currently unclear. Simulations predict that turbulence-dominated gas develops a log-normal N-PDF (Federrath & Klessen 2013); such a form is predicted for the volume density PDF (hereafter ρ-PDF) of isothermal, supersonic turbulent, and non-selfgravitating gas (Vazquez-Semadeni 1994; Padoan et al. 1997; Scalo et al. 1998; Ostriker et al. 2001; Padoan & Nordlund 2011; Ballesteros-Paredes et al. 2011; Federrath & Klessen 2013). Log-normal ρ-PDFs can, however, result also from processes other than supersonic turbulence such as gravity opposed only by thermal-pressure forces or gravitationally-driven ambipolar diffusion (Tassis et al. 2010). The log-normal N-PDF is defined as: ! −(s − µ)2 1 , p(s; µ, σ s ) = √ exp 2σ2s σ s 2π (1) where s = ln (AV /AV ) is the mean-normalized visual extinction (tracer of column density, see Section 2.3), and µ and σ s are respectively the mean and standard deviation of the distribution. The log-normal component that is used to describe low column densities has typically the width of σ s = 0.3 − 0.4 (Kainulainen et al. 2009). It has been suggested that the determination of the width can be affected by issues such as unrelated dust emission along the line of sight to the cloud (Schneider et al. 2015). Practically all star-forming clouds in the Solar neighborhood show an excess to this component at higher column densities, following a power-law, or a wider lognormal function (Kainulainen et al. 2009; Kainulainen & Tan 2013; Schneider et al. 2013), especially reflecting their ongoing star formation activity (Kainulainen et al. 2014; Sadavoy et al. 2014; Stutz & Kainulainen 2015). Such behavior is suggested Article number, page 1 of 21 Detecting gravitational-wave transients at five sigma: a hierarchical approach Eric Thrane1, a and Michael Coughlin2 arXiv:1507.00537v1 [astro-ph.IM] 2 Jul 2015 1 School of Physics and Astronomy, Monash University, Clayton, Victoria 3800, Australia 2 Department of Physics, Harvard University, Cambridge, MA 02138, USA As second-generation gravitational-wave detectors prepare to analyze data at unprecedented sensitivity, there is great interest in searches for unmodeled transients, commonly called bursts. Significant effort has yielded a variety of techniques to identify and characterize such transient signals, and many of these methods have been applied to produce astrophysical results using data from first-generation detectors. However, the computational cost of background estimation remains a challenging problem; it is difficult to claim a 5σ detection with reasonable computational resources without paying for efficiency with reduced sensitivity. We demonstrate a hierarchical approach to gravitational-wave transient detection, focusing on long-lived signals, which can be used to detect transients with significance in excess of 5σ using modest computational resources. In particular, we show how previously developed seedless clustering techniques can be applied to large datasets to identify high-significance candidates without having to trade sensitivity for speed. Introduction. With second-generation gravitationalwave (GW) detectors coming online later this year, the first direct detection of GWs may be near. In order to establish the significance of a detection, it is common to report a false alarm probability (FAP), which quantifies the probability that a noise fluctuation could produce an event at least as loud as the observed candidate (as measured by some detection statistic). In some subfields, e.g., particle physics,“5σ significance,” corresponding to FAP ≈ 5.7 × 10⁻⁷ , is used as a detection threshold. In order to estimate the FAP of a GW candidate, it is common to perform time-shifts in which the GW strain time series from one detector is shifted with respect to the series from a second detector by an amount greater than both the travel time between the detectors and the coherence time of the signals being targeted. Time-shifting preserves non-Gaussian and non-stationary features that characterize the zero-lag (no time-shift) noise, while simultaneously eliminating true GW signals. By performing N time-shifts, it is possible to generate a distribution of the detection statistic, which can be used to estimate FAP to a level of ≥ 1/N . The 5σ threshold corresponds to N ≈ 1.7 × 10⁶ . In many cases it is computationally impractical to carry out this many time-shifts, though, it has been accomplished in the “detection” of a LIGO blind injection with a matched filter search [1]. Despite the pervasive use of time-shifts, there are limitations [2, 3]. For many transient GW searches, the significant computing costs incurred by background estimation arise from a desire to use a coherent detection statistic. Coherent algorithms utilize the complex-valued cross-power obtained by cross-correlating strain data from ≥2 detectors instead of or in addition to the incoherent autopower observed in each detector separately; see, e.g., [4– 7]. The extra phase information helps differentiate sig- a Electronic address: [email protected] nal from background, improving the sensitivity of the search. However, the cost of background estimation for coherent searches is relatively large compared to a comparable incoherent search because the detection statistic must be recalculated for each time-shift, after the fresh application of a clustering algorithm. Some algorithms use single-detector auto-power exclusively, which allows for much more rapid background estimation [8, 9]. In this Letter, we describe a hierarchical approach to background estimation in the context of a search for longlived, unmodeled GW transients using seedless clustering [10, 11]. First, we identify “events” using a computationally intensive, but incoherent, single-detector statistic. Second, we calculate a computationally fast, coherent detection statistic for each event identified with the single-detector statistic. The second, coherent detection statistic is used to evaluate significance. By splitting the calculation into an incoherent stage and a coherent stage, it is possible to carry out computationally intensive calculations just once, allowing rapid background estimation without sacrificing the sensitivity gained by the use of coherence. We demonstrate this technique by estimating the background—past the 5σ level—for two weeks of simulated Monte Carlo data and two weeks of Initial LIGO noise, recolored to resemble data from Advanced LIGO [12]. We calculate the sensitivity of this mock search for several toy model waveforms and find that it is not adversely affected by the incoherent stage. The remainder of this Letter is organized as follows. We review the basics of transient identification with seedless clustering and describe the details of the new hierarchical detection statistic, we describe a mock analysis carried out on two weeks of Monte Carlo data and two weeks of recolored Initial LIGO noise, and we present results demonstrating the ability to estimate background at the 5σ level. Method. In previous work, we have described seedless clustering [10, 11, 13–15], a technique in which GW July 3, 2015 0:23 WSPC Proceedings - 9.75in x 6.5in proceedings 1 Super Massive Black Holes and the Origin of High-Velocity Stars arXiv:1507.00520v1 [astro-ph.GA] 2 Jul 2015 Roberto Capuzzo-Dolcetta∗ and Giacomo Fragione∗∗ Dep. of Physics, Sapienza, Univ. of Roma P.le A. Moro 2, Roma, Italy ∗ E-mail: [email protected] ∗∗ E-mail: [email protected] The origin of high velocity stars observed in the halo of our Galaxy is still unclear. In this work we test the hypothesis, raised by results of recent high precision N -body simulations, of strong acceleration of stars belonging to a massive globular cluster orbitally decayed in the central region of the host galaxy where it suffers of a close interaction with a super massive black hole, which, for these test cases, we assumed 108 M⊙ in mass. Keywords: galaxies: haloes, nuclei, super massive black holes, clusters. 1. Introduction Hypervelocity stars (HVS) are stars escaping the host galaxy. Hills 6 was the first to predict theoretically their existence as a consequence of interactions with a massive Black Hole (BH) in the Galactic Centre 6 , while Brown et al. serendipitously discovered the first HVS in the outer stellar halo of the Galaxy, a B-type star moving over twice the Galactic escape velocity 2 . The most recent HVS Survey is the Multiple Mirror Telescope Survey, which revealed 21 HVSs at distances between 50 and 120 kpc 3 . Hills’ mechanism involves the tidal breakup of a binary passing close to a massive BH, which could lead also to a population of stars orbiting in the inner regions of the Galaxy around the central BH, the so-called S stars 9 . Since the Hills’ prediction, many other mechanisms have been proposed to explain the production of HVSs, which involve different astrophysical frameworks and phenomena 10,11 . The study of the characteristics of these stars would help to infer information on both the small and large scales of the Galaxy, i.e. the region near massive BHs as well the shape of the Galaxy and Dark Matter gravitational potential 5 . The aim of the present work is to investigate another mechanism of production of HVS, which involve a Globular Cluster (GC) that during its orbit has the chance to pass close to a super massive black hole (SMBH) in the center of its host galaxy. 2. Close Globular Cluster-Super Massive Black Hole Interactions From direct N -body simulations of a GC passing close to an SMBH 1 , there is evidence that some GC stars are ejected in sort of jets. Therefore, in order to understand the underlying physical mechanism leading to such ejections, we performed 3-body scattering experiments involving an SMBH, a GC and a star. In our simulations the BH is initially set in the origin of the reference frame, while the GC (considered as a point mass) follows an elliptical orbit around it within the SMBH influence radius. This assumption is justified by that the GC has had the time page 1 arXiv:1507.00516v1 [astro-ph.SR] 2 Jul 2015 Solar and Heliospheric Physics with the Square Kilometre Array Valery M. Nakariakov1, Mario M. Bisi2 , Philippa K. Browning3, Dalmiro Maia4 , Eduard P. Kontar5 , Divya Oberoi6 , Peter T. Gallagher7 , Iver H. Cairns8 , Heather Ratcliffe1 1 Centre for Fusion, Space and Astrophysics, Physics Department, University of Warwick, Coventry CV4 7AL, UK; 2 RAL Space, Science & Technology Facilities Council – Rutherford Appleton Laboratory, Harwell Oxford, Oxfordshire, OX11 0QX, England, UK; 3 Jodrell Bank Centre for Astrophysics, University of Manchester, Manchester, M13 9PL, UK; 4 CICGE, Observatorio Astronomico Professor Manuel de Barros, Faculdade de Ciencias da Universidade do Porto, Vila Nova de Gaia, Portugal; 5 School of Physics and Astronomy, University of Glasgow, Glasgow, G12 8QQ, UK; 6 National Centre for Radio Astrophysics, Tata Institute of Fundamental Research, India; 7 School of Physics, Trinity College Dublin, 2, Dublin, Ireland; 8 School of Physics, University of Sydney, Sydney, NSW 2006, Australia. E-mail: V.Nakariakov at warwick.ac.uk; Mario.Bisi at stfc.ac.uk The fields of solar radiophysics and solar system radio physics, or radio heliophysics, will benefit immensely from an instrument with the capabilities projected for SKA. Potential applications include interplanetary scintillation (IPS), radio-burst tracking, and solar spectral radio imaging with a superior sensitivity. These will provide breakthrough new insights and results in topics of fundamental importance, such as the physics of impulsive energy releases, magnetohydrodynamic oscillations and turbulence, the dynamics of post-eruptive processes, energetic particle acceleration, the structure of the solar wind and the development and evolution of solar wind transients at distances up to and beyond the orbit of the Earth. The combination of the high spectral, time and spatial resolution and the unprecedented sensitivity of the SKA will radically advance our understanding of basic physical processes operating in solar and heliospheric plasmas and provide a solid foundation for the forecasting of space weather events. Advancing Astrophysics with the Square Kilometre Array June 8-13, 2014 Giardini Naxos, Sicily, Italy © Copyright owned by the author(s) under the terms of the Creative Commons Attribution-NonCommercial-ShareAlike Licence. http://pos.sissa.it/ Solar and Heliospheric Physics with SKA 1. Introduction The Sun is the brightest radio object in the Universe visible from the Earth. In powerful flares, the radio flux density may exceed 109 Jy. The wide variety of mechanisms, both coherent and incoherent, for solar and heliospheric radio emission provide us with unique information required for understanding the basic physical processes operating in natural and laboratory plasmas, at both microscopic and macroscopic levels. The topics of ongoing intensive investigations are the fundamental problems of plasma astrophysics: the release of magnetic energy, acceleration of charged particles, magnetohydrodynamic (MHD) waves and turbulence, wave-particle interaction, etc. The proximity of the Sun to the Earth allows for its study with an unprecedented combination of time, spatial and spectral resolution, and a unique opportunity to study fundamental plasma physics processes both in situ and remotely. Finally, plasma physics processes in the solar atmosphere are directly relevant to geophysical challenges such as climate change and space weather; a strong additional motivation for the intensive development of solar and heliospheric radio physics. Observations of solar and heliospheric radio emission are mainly performed with dedicated instruments, such as radio interferometers. However these are rather limited. For example the highest spatial resolution in the microwave band currently achieved by the Nobeyama Radioheliograph (NoRH, Nakajima et al. 1994), 5" at 34 GHz, is much lower than the spatial scale of plasma structures in the solar corona as resolved in the EUV and X-ray bands (smaller than 1"). Not even the upcoming new generation of state-of-the-art specialised solar radio interferometers, namely the Chinese Spectral Radioheliograph (CSRH, frequency range 0.4–15 GHz, longest baseline 3 km, Yan et al. 2009), the upgraded Siberian Solar Radio Telescope (SSRT, frequency range 4–8 GHz, longest baseline 622.3 m, Lesovoi et al. 2014) and the Expanded Owens Valley Solar Array (eOVSA, frequency range 1–18 GHz, longest baseline 1.8 km, Gary et al. 2012) will reach the SKA’s spatial resolution and sensitivity. In short, as well as providing simultaneously high spectral and spatial resolution unavailable with current instruments, the SKA will radically (by two orders of magnitude) improve on their sensitivity, allowing for the detection of a number of physical phenomena predicted theoretically. The breakthrough potential of SKA in solar and heliospheric studies in the low frequency band has already been demonstrated in frames of the LOw Frequency ARray (LOFAR) and Murchison Widefield Array (MWA), both of which are SKA pathfinder projects. These instruments include solar and heliospheric physics, and space weather amongst their key science objectives and have already lead to several interesting publications (e.g. Mann et al. 2011; Oberoi et al. 2011; Bowman et al. 2013). A further interesting opportunity is connected with the fact that for a 300 km baseline, the proximity of the Sun to the interferometer puts it in the near-field zone of the instrument at higher frequencies. The sphericity of the waves coming from spatially localised solar sources can be measured and the radial distance to the source can be estimated, providing us with 3D information: both angular coordinates on the plane-of-the-sky and the distance to the source (e.g. giving radial resolution of 0.1 R⊙ at 1.5 GHz on a 300 km baseline, Braun 1997). For imaging purposes, solar observations are particularly challenging. First of all there is the immense dynamic range. During major outbursts the flux can be dominated by very spatiallylocalised sources and simultaneously there are elongated features whose brightness temperature over the same spatial extent as the narrow source could be nine orders of magnitude lower. The 2 Draft version July 3, 2015 Preprint typeset using LATEX style emulateapj v. 5/2/11 THE MOST INTENSIVE GAMMA-RAY FLARE OF QUASAR 3C 279 WITH THE SECOND-ORDER FERMI ACCELERATION Katsuaki Asano, and Masaaki Hayashida Institute for Cosmic Ray Research, The University of Tokyo and 5-1-5 Kashiwanoha, Kashiwa, Chiba 277-8582, Japan (Dated: Submitted; accepted) arXiv:1507.00514v1 [astro-ph.HE] 2 Jul 2015 Draft version July 3, 2015 ABSTRACT The very short and bright flare of 3C 279 detected with Fermi-LAT in 2013 December is tested by a model with stochastic electron acceleration by turbulences. Our time-dependent simulation shows that the very hard spectrum and asymmetric lightcurve are successfully reproduced by changing only the magnetic field from the value in the steady period. The maximum energy of electrons drastically grows by the decrease of the magnetic field, which yields hard photon spectrum as observed. Succeeding rapid cooling due to the inverse Compton scattering with the external photons reproduces the decaying feature of the lightcurve. The inferred energy density of the magnetic field is much less than the electron and photon energy densities. The low magnetic field and short variability timescale are unfavorable for the jet acceleration model by the gradual Poynting flux dissipation. Subject headings: acceleration of particles — quasars: individual (3C 279) — radiation mechanisms: non-thermal — turbulence 1. INTRODUCTION Multi-wavelength lightcurves of blazar flares show complex and diversified feature. While in some cases, there is a time-lag between gamma-ray and X-ray/optical flares (e.g. Bla˙zejowski et al. 2005; Fossati et al. 2008; Abdo et al. 2010a; Hayashida et al. 2012), in other cases an orphan flare in a certain wavelength was detected (e.g. Krawczynski et al. 2004; Abdo et al. 2010b). Even if a time-dependent model is adopted, such various behaviors may be difficult to be reproduced by a one-zone model (Kusunose, Takahara & Li 2000; Krawczynski, Coppi & Aharonian 2002; Asano et al. 2014). While spatial gradients of the physical parameters in the emission regions (Janiak et al. 2012) may explain some fraction of the lags, some flares have too complex spectral evolutions to be modeled even with a time-dependent multi-zone radiative transfer simulations (Chen et al. 2011). This may imply inhomogeneous emission regions evolving with a longer timescale than the dynamical one. Such nontrivial properties in blazar flare make it difficult to probe physical processes such as electron acceleration or cooling. In 2013 December, Fermi Large Area Telescope (LAT) detected one of the most intense flares in the gammaray band from a flat spectrum radio quasar (FSRQ) 3C 279, reaching ∼ 1 × 10⁻⁵ ph cm−2 s−1 for the integrated flux above 100 MeV (Hayashida et al. 2015, hereafter H15). The flux level is comparable to the historical maximum of this source observed at the gamma-ray band (Wehrle et al. 1998). The gamma-ray flare showed a very rapid variability with asymmetric time profile with the shorter rising time of ∼ 2 hrs and the longer falling time of ∼ 7 hrs. We can expect that this extraordinary flare was emitted from a sufficiently compact region that can be regarded as homogeneous differently from other usual flares. In this case, the decaying timescale may [email protected], [email protected] rectly correspond to the cooling timescale, and the flare is an ideal target to discuss the physical processes. Another important property in this flare of 3C 279, a very hard photon index of Γγ = 1.7 ± 0.1 was observed in the > 100 MeV band by Fermi-LAT. Such a hard photon index has been rarely observed in FSRQs, whose luminosity peak by inverse-Compton (IC) scattering is usually located below 100 MeV. While the mean of the Γγ distribution is FSRQs corresponds to about 2.4 (Ackermann et al. 2015), hard photon indices Γγ < 2 have been occasionally observed in some bright FSRQs only during rapid flaring events (Pacciani et al. 2014). In order to reproduce the hard photon index by IC scattering in the fast cooling regime, the index of parent electrons should be much harder than 2, which can hardly be generated in a normal shock acceleration process. In addition, the flare event of 3C 279 indicates a high Compton dominance parameter Lγ /Lsyn > 300, leading to extremely low jet magnetization with LB /Lj . 10−4 (H15). To explain the flare event of 3C 279, rather than assuming prompt electron injection by the shock acceleration, we propose the stochastic acceleration (SA) model, which is phenomenologically equivalent to the second-order Fermi acceleration (FermiII, e.g. Katarzy´ nski et al. 2006; Stawarz & Petrosian 2008; Lefa, Rieger & Aharonian 2011, and references therein). The SA may be drived by magnetic reconnection (Lazarian et al. 2012). Otherwise, hydrodynamical turbulences that drive the acceleration are possibly induced via the Kelvin–Helmholtz instability as an axial mode (e.g. Mizuno, Hardee & Nishikawa 2007), or the Rayleigh–Taylor and Richtmyer–Meshkov instabilities as radial modes (Matsumoto & Masada 2013). Broadband spectra of blazars in the steady state have been successfully fitted with recent SA models (Asano et al. 2014; Diltz & B¨ottcher 2014; Kakuwa et al. 2015). The flare state should be also tested with such models to show the wide-range applicability of the SA. This is the first at- NORDITA-2015-83 Evolution of Primordial Magnetic Fields: From Generation Till Today Tina Kahniashvili∗ arXiv:1507.00510v1 [astro-ph.CO] 2 Jul 2015 The McWilliams Center for Cosmology and Department of Physics, Carnegie Mellon University, 5000 Forbes Ave, Pittsburgh, PA 15213, USA Department of Physics, Laurentian University, Ramsey Lake Road, Sudbury, ON P3E 2C, Canada and Abastumani Astrophysical Observatory, Ilia State University, 3-5 Cholokashvili Avenue, Tbilisi, 0162, Georgia Axel Brandenburg† Nordita, KTH Royal Institute of Technology and Stockholm University, Roslagstullsbacken 23, 10691 Stockholm, Sweden and Department of Astronomy, AlbaNova University Center, Stockholm University, 10691 Stockholm, Sweden Alexander G. Tevzadze‡ Faculty of Exact and Natural Sciences, Tbilisi State University, 3 Chavchavadze Avenue, Tbilisi, 0179, Georgia and Abastumani Astrophysical Observatory, Ilia State University, 3-5 Cholokashvili Avenue, Tbilisi, 0162, Georgia Abstract In this presentation we summarize our previous results concerning the evolution of primordial magnetic fields with and without helicity during the expansion of the Universe. We address different magnetogenesis scenarios such as inflation, electroweak and QCD phase transitions magnetogenesis. A high Reynolds number in the early Universe ensures strong coupling between magnetic field and fluid motions. After generation the subsequent dynamics of the magnetic field is governed by decaying hydromagnetic turbulence. We claim that primordial magnetic fields can be considered as a seeds for observed magnetic fields in galaxies and clusters. Magnetic field strength bounds obtained in our analysis are consistent with the upper and lower limits of extragalactic magnetic fields. ∗ Electronic address: [email protected] Electronic address: [email protected] ‡ Electronic address: [email protected] † 1 Effect of Stellar Encounters on Comet Cloud Formation A. Higuchi arXiv:1507.00502v1 [astro-ph.EP] 2 Jul 2015 Department of Earth and Planetary Sciences, Faculty of Science, Tokyo Institute of Technology, Meguro, Tokyo 152-8551 and E. Kokubo Division of Theoretical Astronomy, National Astronomical Observatory of Japan, Mitaka, Tokyo 181-8588 Received ; accepted –2– ABSTRACT We have investigated the effect of stellar encounters on the formation and disruption of the Oort cloud using the classical impulse approximation. We calculate the evolution of a planetesimal disk into a spherical Oort cloud due to the perturbation from passing stars for 10 Gyr. We obtain the empirical fits of the e-folding time for the number of Oort cloud comets using the standard exponential and Kohlrausch formulae as functions of the stellar parameters and the initial semimajor axes of planetesimals. The e-folding time and the evolution timescales of the orbital elements are also analytically derived. In some calculations, the effect of the Galactic tide is additionally considered. We also show the radial variations of the e-folding times to the Oort cloud. From these timescales, we show that if the initial planetesimal disk has the semimajor axes distribution dn/da ∝ a−2 , which is produced by planetary scattering (Higuchi et al. 2006), the e-folding time for planetesimals in the Oort cloud is ∼10 Gyr at any heliocentric distance r. This uniform e-folding time over the Oort cloud means that the supply of comets from the inner Oort cloud to the outer Oort cloud is sufficiently effective to keep the comet distribution as dn/dr ∝ r −2 . We also show that the final distribution of the semimajor axes in the Oort cloud is approximately proportional to a−2 for any initial distribution. Subject headings: Oort Cloud — comets: general Distributed image reconstruction for very large arrays in radio astronomy Andr´e Ferrari, David Mary, R´emi Flamary and C´edric Richard arXiv:1507.00501v1 [astro-ph.IM] 2 Jul 2015 Laboratoire Joseph-Louis Lagrange Universit´e de Nice Sophia-Antipolis, CNRS, Observatoire de la Cˆote d’Azur Nice, France Email: [email protected] Abstract—Current and future radio interferometric arrays such as LOFAR and SKA are characterized by a paradox. Their large number of receptors (up to millions) allow theoretically unprecedented high imaging resolution. In the same time, the ultra massive amounts of samples makes the data transfer and computational loads (correlation and calibration) order of magnitudes too high to allow any currently existing image reconstruction algorithm to achieve, or even approach, the theoretical resolution. We investigate here decentralized and distributed image reconstruction strategies which select, transfer and process only a fraction of the total data. The loss in MSE incurred by the proposed approach is evaluated theoretically and numerically on simple test cases. I. I NTRODUCTION Since the commissioning of the first large radio interferometers in the 70s and 80s (such as the VLA in the USA and the WSRT) radio astronomy in the range of large wavelengths has grown dramatically, particularly with the development of more and more extended antenna arrays. In the prospect of the most sensitive radio telescope ever built, the SKA which will be operational in the 2020s, several new generation radio telescopes are being built or planned (LOFAR in the Netherlands, ASKAP and the Murchison Widefield Array Australia, e-MERLIN in the UK, e-EVN based in Europe, MeerKAT in South Africa, JVLA the United States). As an example, LOFAR consists of 48 groups of antennas (stations), among which approximately 35,000 elementary antennas are located in the Netherlands. The “superterp”, the heart of LOFAR is a super-station: a cluster of six stations. Eight other stations, totalizing approximately 13,000 antennas are located in the surrounding countries. A project of a new super-station in Nanc¸ay (F) is under consideration. Within each station, antennas form a phased array which allows for digital beamforming simultaneously in several directions and frequency bands. The beam-formed data from the stations are centralized at the University of Groningen in the Netherlands where a supercomputer is responsible for the combination of the beam data from all stations. The resulting data are then stored on a cluster of ASTRON, the Netherlands Institute for Radio Astronomy, where the images (and other deliverables) are reconstructed. As a mean of comparison SKA will totalize 2.5 millions antennas, with a square kilometer collecting area distributed over an area of ≈ 5,000 km diameter. Beyond specific objectives that distinguish these new fully digital “software telescopes”, they are all characterized by a great flexibility. Another common point is the amount of data which must be transferred to the central computer and processed. It amounts to 1 terabit/second for LOFAR and will be of the order of 14 exabyte/day This work was supported by CNRS grant MASTODONS; DISPLAY project. for SKA (more than 100 times the global internet traffic). LOFAR uses a 1.5 Blue Gene/P for the data reduction and the computation of correlations. IBM et ASTRON will develop by 2024 a supercomputer to process and store 1 petabytes of data everyday [2]. This correspondence investigates the possibility to distribute the image reconstruction over the super-stations. The main objective is to avoid centralization of the sampled electromagnetic fields acquired by all stations in order to reduce the data transfer and the exponential increase in the calibration and computational load. Section II recalls the basis of radio astronomy with aperture synthesis and proposes a strategy where each super-station uses all its antenna and one reference signal from the other super-stations. The loss of performances that follows is evaluated on a simple model using the Cram´er Rao Lower Bound (CRLB). Section III shows that the image reconstruction problem can be written as a global variable consensus problem with regularization. Numerical simulations illustrate the performances of the proposed approach. A concluding section presents perpectives. II. A PERTURE SYNTHESIS FOR RADIO ASTRONOMY A. Standard aperture synthesis model This section provides the basic equations of radio astronomy with multiple sensor array and describes a partial aperture synthesis strategy which aims to reduce data transfer, allowing a decentralized image reconstruction. To simplify the notations and without loss of generality, we will not make explicit the wavelengths dependence and the Earth rotation and assume punctual antennas. The coordinates of the stations (within each station, a beam is created from the phased array) in a plane perpendicular to the line of sight are denoted as r j and the map of interest (the “image” of a region of the sky) is x(p) where p denotes the angular coordinates on the sky. The fundamental equation of interferometry relates the Fourier transform of the map to the spatial coherency (visibility) of the incoming electromagnetic field. A measurement of the coherency is obtained by correlating the signal acquired by a pair of stations (i, j) properly delayed located at r i and r j , giving in the noiseless case a point of visibility at spatial frequency u` = r j − r i : Z t v(u` ) = x(p)e−2πu` p dp (1) See for example [9], [10] for a comprehensive description of radio astronomy and signal processing related tools. Computation of v(u` ) obviously requires the transfer of signals from stations i and j in the same place. The stations are normally grouped in “super-stations” (e.g. the superterp for LOFAR) accounting for low frequencies (kr i − r j k2 small). Resolution is ANNz2 - Photometric redshift and probability density function estimation using machine learning methods I. Sadeh1,2⋆ , F. B. Abdalla1,3 and O. Lahav1 1 Department of Physics & Astronomy, University College London, Gower Street, London WC1E 6BT, UK D-15735 Zeuthen, Germany 3 Department of Physics and Electronics, Rhodes University, PO Box 94, Grahamstown, 6140, South Africa arXiv:1507.00490v1 [astro-ph.CO] 2 Jul 2015 2 DESY-Zeuthen, 1 July 2015 ABSTRACT We present ANNz2, a new implementation of the public software for photometric redshift (photo-z) estimation of Collister and Lahav (2004). Large photometric galaxy surveys are important for cosmological studies, and in particular for characterizing the nature of dark energy. The success of such surveys greatly depends on the ability to measure photo-zs, based on limited spectral data. ANNz2 utilizes multiple machine learning methods, such as artificial neural networks, boosted decision/regression trees and k-nearest neighbours. The objective of the algorithm is to dynamically optimize the performance of the photo-z estimation, and to properly derive the associated uncertainties. In addition to single-value solutions, the new code also generates full probability density functions (PDFs) in two different ways. In addition, estimators are incorporated to mitigate possible problems of spectroscopic training samples which are not representative or are incomplete. ANNz2 is also adapted to provide optimized solutions to general classification problems, such as star/galaxy separation. We illustrate the functionality of the code using data from the tenth data release of the Sloan Digital Sky Survey and the Baryon Oscillation Spectroscopic Survey. The code is available for download at https://github.com/IftachSadeh/ANNZ . Key words: Photometric redshifts, star/galaxy separation, machine learning methods. 1 INTRODUCTION Redshifts, usually denoted by z, effectively provide a third, radial dimension to Cosmological analyses. They allow the study of phenomena as a function of distance and time, as well as enable the identification of large structures, such as galaxy clusters. The current and next generations of dark energy experiments, such as the Dark Energy Survey (DES), the Large Synoptic Survey Telescope (LSST) and the Euclid experiment1 will observe a few billion galaxies. Redshifts may be measured with great precision using spectroscopy. However, it is infeasible to obtain spectra for such large galaxy samples. The success of these imaging surveys is therefore critically dependent on the measurement of high-quality photometric redshifts (photo-zs). For instance, a benchmark of LSST is to measure the dark energy equation of state parameter, w, with per-cent level uncertainty. This is expected to be achievable with weak-lensing tomography (Hu 1999; Zhan and Knox 2006). However, it will require a precision of ∼ 0.002 · (1 + z) in determination of the systematic bias in the redshift. This paper presents ANNz2, a new implementation of the popular code of Collister and Lahav (2004), which uses artificial neural networks to estimate photometric redshifts. ANNz2 is free and publicly available2 ; the code has already been incorporated as part of the analysis chain of the anchez et al. 2014), and is planned to be included DES (S´ in the software pipeline of Euclid. The new code incorporates a variety of machine learning techniques in addition to artificial neural networks. It has been designed to calculate both photometric redshifts and photo-z probability density functions (PDFs), doing so in several different ways. The introduction of photo-z PDFs has been shown to improve the accuracy of cosmological ⋆ E-mail: [email protected] . See http://www.darkenergysurvey.org , http://www.lsst.org and http://sci.esa.int/euclid/ . 1 2 See https://github.com/IftachSadeh/ANNZ . arXiv:1507.00475v1 [astro-ph.SR] 2 Jul 2015 Detailed photospheric abundances of 28 Peg and HD 202240✩ ¨ Aslı Elmaslı, S¸eyma C ¸ alı¸skan, Tolgahan Kılı¸co˘glu∗, K¨ ubra¨ozge Unal, Yahya Nasolo, and Berahitdin Albayrak Department of Astronomy and Space Sciences, Ankara University, 06100, Tando˘gan, Ankara, Turkey Abstract The atmospheric parameters and chemical abundances of two neglected Atype stars, 28 Peg and HD 202240, were derived using high resolution spectra ¨ ITAK ˙ obtained at the TUB National Observatory. We determined the photospheric abundances of eleven elements for 28 Peg and twenty for HD 202240, using equivalent-width measurement and spectral synthesis methods. Their abundance patterns are in good agreement with those of chemically normal A-type stars having similar atmospheric parameters. We pinpoint the position of these stars on the H-R diagram and estimate their masses and ages as; 2.60 ± 0.10 M⊙ and 650 ± 50 Myr for 28 Peg and 4.50 ± 0.09 M⊙ and 150 ± 10 Myr for HD 202240. To compare our abundance determinations with those of stars having similar ages and atmospheric parameters, we select members of open clusters. We notice that our target stars exhibit similar abundance patterns with these members. ✩ ¨ ITAK ˙ Based on observations made at the TUB National Observatory, Turkey (Program ID 09BRTT150-477-0). ∗ Corresponding author. Tel.: +90 312 212 67 20; fax +90 312 223 23 95 Email address: [email protected] (Tolgahan Kılı¸co˘glu) Preprint submitted to New Astronomy July 3, 2015 Published in Astronomy Letters, 2015, Vol. 41, No. 8, pp. 383-393. Variation of the baryon-to-photon ratio due to decay of dark matter particles E. O. Zavarygin1,2⋆ and A. V. Ivanchik1,2⋆⋆ 1 2 Ioffe Institute, ul. Politekhnicheskaya 26, St. Petersburg, 194021 Russia Peter the Great St.Petersburg Polytechnic University, ul. Politekhnicheskaya 29, St. Petersburg, Russia arXiv:1507.00469v1 [astro-ph.CO] 2 Jul 2015 Received 05 December, 2014 Abstract The influence of dark matter particle decay on the baryon-to-photon ratio has been studied for different cosmological epochs. We consider different parameter values of dark matter particles such as mass, lifetime, the relative fraction of dark matter particles. It is shown that the modern value of the dark matter density ΩCDM = 0.26 is enough to lead to variation of the baryon-to-photon ratio up to ∆η/η ∼ 0.01 ÷ 1 for decays of the particles with masses 10 GeV ÷ 1 TeV. However, such processes can also be accompanied by emergence of an excessive gamma ray flux. The observational data on the diffuse gamma ray background are used to making constraints on the dark matter decay models and on the maximum possible variation of the baryon-to-photon ratio ∆η/η . 10−5 . Detection of such variation of the baryon density in future cosmological experiments can serve as a powerful means of studying properties of dark matter particles. Key words. cosmology, dark matter, baryonic matter 1. INTRODUCTION In the last decade, cosmology has passed into the category of precision sciences. Many cosmological parameters are currently determined with a high precision that occasionally reaches fractions of a percent (Ade et al. 2014). One of such parameters is the baryon-to-photon ratio η ≡ nb /nγ , where nb and nγ are the baryon and photon number densities in the Universe, respectively. In the standard cosmological model, the present value of η is assumed to have been formed upon completion of electron-positron annihilation several seconds after the Big Bang and has not changed up to now. The value of nγ associated with the cosmic microwave background (CMB) photons is defined by the well-known relation 3 3 T 2ζ(3) kT = 410.73 cm−3 , nγ = π2 ~c 2.7255 K where ζ(x) is the Riemann zeta function, k is the Boltzmann constant, ~ is the Planck constant, c is the speed of light, and T is the CMB temperature at the corresponding epoch. The CMB temperature is currently determined with a high accuracy and is T0 = 2.7255(6) K at the present epoch (Fixsen 2009); for other epochs, it is expressed by the relation T = T0 (1 + z), where z is the cosmological redshift at the corresponding epoch. Thus, given nγ , a relation between the parameter η and Ωb , the relative baryon density in the Universe, can be obtained (Steigman 2006): η = 273.9 × 10⁻¹⁰ Ωb h2 , ⋆ ⋆⋆ E-mail: [email protected] E-mail: [email protected] where h = 0.673(12) is the dimensionless Hubble parameter at the present epoch (Ade et al. 2014). According to present views, the baryon density, which is the density of ordinary matter (atoms, molecules, planets and stars, interstellar and intergalactic gases), does not exceed 5% of the entire matter filling the Universe, while 95% of the density in the Universe is composed of unknown forms of matter/energy that manifest themselves (for the time being) gravitationally (see, e.g., Gorbunov and Rubakov 2008). At present, observations allow Ωb to be independently estimated for four cosmological epochs: (i) the epoch of Big Bang nucleosynthesis (zBBN ∼ 109 ; see, e.g., Steigman et al. 2007); (ii) the epoch of primordial recombination (zPR ≃ 1100; see, e.g., Ade et al. 2014); (iii) the epoch associated with the Lyα forest (z ∼ 2 ÷ 3; i.e., ∼10 Gyr ago; see, e.g., Rauch 1998; Hui et al. 2002); (iv) the present epoch (z = 0; see, e.g., Fukugita and Peebles 2004). For the processes at the epochs of Big Bang nucleosynthesis and primordial recombination, η is one of the key parameters determining their physics. For these epochs, the methods of estimating η, (i) comparing the observational data on the relative abundances of the primordial light elements (D, 4 He, 7 Li) with the predictions of the Big Bang nucleosynthesis theory and (ii) analyzing the CMB anisotropy, give the most accurate estimates of η to date that coincide, within the observational error limits: ηBBN = (6.0±0.4)×10−10 (Steigman 2007) and ηCMB = (6.05±0.07)×10−10 (Ade et al. 2014). This argues for the correctness of the adopted model of the Universe and for the validity of the standard physics used in theoretical calculations. However, it should be noted that at present, as the accuracy of observations Accepted by The Astrophysical Journal ELLERMAN BOMBS AT HIGH RESOLUTION III. SIMULTANEOUS OBSERVATIONS WITH IRIS AND SST G. J. M. Vissers1 , L. H. M. Rouppe van der Voort1 , R. J. Rutten2,1 , M. Carlsson1 , and B. De Pontieu3,1 1 Institute arXiv:1507.00435v1 [astro-ph.SR] 2 Jul 2015 of Theoretical Astrophysics, University of Oslo, P.O. Box 1029 Blindern, N-0315 Oslo, Norway; [email protected] 2 Lingezicht Astrophysics, ’t Oosteneind 9, 4158CA Deil, The Netherlands and 3 Lockheed Martin Solar and Astrophysics Laboratory, 3251 Hanover Street, Org. A021S, Bldg. 252, Palo Alto, CA 94304, USA Draft version Friday 3rd July, 2015 ABSTRACT Ellerman bombs are transient brightenings of the extended wings of the solar Balmer lines in emerging active regions. We describe their properties in the ultraviolet lines sampled by the Interface Region Imaging Spectrograph (IRIS), using simultaneous imaging spectroscopy in Hα with the Swedish 1m Solar Telescope (SST) and ultraviolet images from the Solar Dynamics Observatory for Ellerman bomb detection and identification. We select multiple co-observed Ellerman bombs for detailed analysis. The IRIS spectra strengthen the view that Ellerman bombs mark reconnection between bipolar kilogauss fluxtubes with the reconnection and the resulting bi-directional jet located within the solar photosphere and shielded by overlying chromospheric fibrils in the cores of strong lines. The spectra suggest that the reconnecting photospheric gas underneath is heated sufficiently to momentarily reach stages of ionization normally assigned to the transition region and the corona. We also analyze similar outburst phenomena that we classify as small flaring arch filaments and ascribe to higher-located reconnection. They have different morphology and produce hot arches in million-Kelvin diagnostics. Subject headings: Sun: activity – Sun: atmosphere – Sun: magnetic fields 1. INTRODUCTION Ellerman (1917) discovered intense short-lived brightenings of the extended wings of the Balmer Hα line at 6563 ˚ A that he called “solar hydrogen bombs”. They are called Ellerman bombs (henceforth EB) since McMath et al. (1960). For more detail we refer to the excellent summary by Georgoulis et al. (2002) and our more recent review of the extensive EB literature in Rutten et al. (2013). We discuss the subsequent EB literature below, but here point out the recent discovery by Peter et al. (2014) of very hot “bombs” in ultraviolet spectra from the Interface Region Imaging Spectrograph (IRIS, De Pontieu et al. 2014). The present paper addresses their suggestion that these bombs might have been EBs or similar to EBs. A major motivation to study EBs is that they supposedly mark locations of serpentine flux rope emergence in newly emerging active regions (e.g., Bernasconi et al. 2002; Pariat et al. 2004; Isobe et al. 2007; Archontis & Hood 2009; Pariat et al. 2009). Understanding their nature may therefore present a way to measure active region evolution, in particular the reconnective field topography evolution that eventually produces much larger solar outbursts. In this context, EBs should become useful as telltales of strong-field reconnection when well understood. In addition, the complex physics and spectrum formation of the EB phenomenon are of interest per s´e since EBs appear to be pockets of hot gas within the photosphere. The discovery of extremely hot IRIS bombs by Peter et al. (2014) that also appear to be photospheric enhances this interest. In our present series of EB analyses we employ high-quality imaging spectroscopy with the Swedish 1-m Solar Telescope (SST; Scharmer et al. 2003) to study EBs at unprecedented spatial, spectral, and temporal resolution. Paper I (Watanabe et al. 2011) established that EBs are a purely photospheric phenomenon. Paper II (Vissers et al. 2013) added evidence that EBs mark magnetic reconnection of strong opposite-polarity field concentrations in the low photosphere and discussed their appearance in 1700 ˚ A images from the Atmospheric Imaging Assembly (AIA; Lemen et al. 2012) of the Solar Dynamics Observatory (SDO). Let us morphologically define the three bomb-like phenomena that we discuss below, based on our inspections of dozens of such features in SST, SDO, and IRIS data. More detail on their recognition is given in Sect. 2. We define “Ellerman bombs” (EB) as substantial brightenings of the extended wings of Hα without core brightening that, at sufficient angular and temporal resolution, show definite rapid-flame morphology when viewed from aside as described in Paper I. EB Hα wing brightenings exceed those from much more ubiquitous magnetic concentrations that happen to also appear bright in the Hα wings (“pseudo-EBs”, Rutten et al. 2013). Next, we define “flaring arch filaments” (henceforth FAFs) as sudden fierce brightenings in AIA 1600 ˚ A image sequences that differ from the EB brightenings also seen in this AIA channel by appearing with shorter duration and more abrupt changes, having elongated morphology, and showing fast apparent brightness motion along filamentary strands. Because they are usually much less evident in AIA 1700 ˚ A images, their 1600 ˚ A appearance is likely due to brightening of the C iv doublet at 1548 and 1550 ˚ A in AIA’s 1600 ˚ A passband. Their filamentary morphology and rapid evolution suggest that these are heating events, likely reconnection, that take place along the fibrilar canopy seen e.g., at Hα line center, or eject heated matter along chromospheric field lines. Finally, we define “IRIS bombs” (henceforth IBs) following Peter et al. (2014) as ultraviolet brightenings with substantial emission in the Si iv lines observed by IRIS, and showing these with very wide and complex non- Astronomy & Astrophysics manuscript no. CaTcal˙v14 July 3, 2015 © ESO 2015 The Calcium Triplet metallicity calibration for galactic bulge stars. ⋆ S. V´asquez1,2 , M. Zoccali1,2 , V. Hill3 , O. A. Gonzalez4 , I. Saviane4 , M. Rejkuba5 , and G. Battaglia6,7 1 2 3 arXiv:1507.00425v1 [astro-ph.GA] 2 Jul 2015 4 5 6 7 Instituto de Astrof´ısica, Pontificia Universidad Cat´olica de Chile, Av. Vicu˜na Mackenna 4860, 782-0436 Macul, Santiago, Chile e-mail: [email protected] Millennium Institute of Astrophysics, Av. Vicu˜na Mackenna 4860, 782-0436 Macul, Santiago, Chile Laboratoire Lagrange (UMR7293), Universit´e de Nice Sophia Antipolis, CNRS, Observatoire de la Cˆote d’Azur, CS34229, 06304, Nice Cedex 04, France European Southern Observatory, Av. Alonso de Cordova 3107, Casilla 19, 19001, Santiago, Chile European Southern Observatory, Karl-Schwarzschild Strasse 2, D-85748 Garching, Germany Instituto de Astrof´ısica de Canarias, calle via L´actea s/n, 38205 San Cristobal de La Laguna, Tenerife, Spain Universidad de La Laguna, Dpto. Astrof´ısica, 38206 La Laguna, Tenerife, Spain Preprint online version: July 3, 2015 ABSTRACT Aims. We present a new calibration of the Calcium II Triplet equivalent widths versus [Fe/H], constructed upon K giant stars in the Galactic bulge. This calibration will be used to derive iron abundances for the targets of the GIBS survey, and in general it is especially suited for solar and supersolar metallicity giants, typical of external massive galaxies. Methods. About 150 bulge K giants were observed with the GIRAFFE spectrograph at VLT, both at resolution R∼20,000 and at R∼6,000. In the first case, the spectra allowed us to perform direct determination of Fe abundances from several unblended Fe lines, deriving what we call here high resolution [Fe/H] measurements. The low resolution spectra allowed us to measure equivalent widths of the two strongest lines of the near infrared Calcium II triplet at 8542 and 8662 Å. Results. By comparing the two measurements we derived a relation between Calcium equivalent widths and [Fe/H] that is linear over the metallicity range probed here, −1 <[Fe/H]< +0.7. By adding a small second order correction, based on literature globular cluster data, we derived the unique calibration equation [Fe/H]CaT = −3.150 + 0.432W ′ + 0.006W ′2 , with a rms dispersion of 0.197 dex, valid across the whole metallicity range −2.3 <[Fe/H]< +0.7. Key words. Stars: abundances – Galaxy: bulge – Techniques: spectroscopic 1. Introduction The Calcium II Triplet (CaT) at ∼8500 Å is one of the most widely used metallicity index, as well as an excellent feature to measure radial velocity at low spectral resolution. The three lines at λ8498, λ8542, λ8662 Å are so strong that they can be measured easily at low resolution and at relatively low signal to noise. In addition, their location in the near-infrared part of the spectrum is ideal to observe the brightest stars of any not too young stellar population, namely cool giants. CaT spectra of cool giants can be obtained with reasonable exposure time both for external galaxies in the local group, too far away to be observed at high spectral resolution, and for Milky Way stars in high extinction regions, such as the Galactic bulge. Obviously the popularity of the CaT spectral feature resides in how accurately it can be used to measure metallicities. Armandroff & Zinn (1988) first demonstrated that the equivalent widths (EWs) of CaT lines, in the integrated spectra of globular clusters (GCs), strongly correlated with the cluster metallicity [Fe/H]. A few years later, Olszewski et al. (1991) and Armandroff & Da Costa (1991) analyzed the behaviour of CaT lines in individual cluster stars. They noticed that the EWs of CaT lines show a dependence not only on metallicity, but also on absolute magnitude. They therefore introduced the use of “reduced equivalenth widths” (W ′ ), which corresponds to the sum ⋆ Based on observations taken with ESO telescopes at the La Silla Paranal Observatory under programme ID 385.B-0735(B). of some combination of the individual EWs, weighed by the difference between the star V magnitude and the magnitude of the Horizontal Branch in the same cluster (V − VHB ). Several empirical relations between the reduced EWs of CaT lines and the [Fe/H] abundance are present in the literature. Most of them used star clusters, for which [Fe/H] abundance could be derived in several ways, and not necessarily for the same stars for which CaT was measured. Among those, a very comprehensive one is the work of Rutledge et al. (1997) who derived CaT metallicities for 52 Galactic GCs in a homogeneous scale, covering the range −2 <[Fe/H]< −0.7. By comparing their scale with the classical Zinn & West (1984) metallicity scale, they found a nonlinear relation between the two. Conversely, a linear relation was found between the CaT metallicities by Rutledge et al. (1997) and the metallicities derived by Carretta & Gratton (1997). The latter are based on Fe lines, measured on high resolution spectra. Traditionally, the CaT metallicity calibration has been constructed based on RGB stars in globular (Cole et al. 2004; Warren & Cole 2009; Saviane et al. 2012, e.g.) or open clusters (Carrera et al. 2007, 2013) Open clusters allowed Carrera et al. to extend the metallicity range up to [Fe/H]∼+0.5, at the same time probing a younger age regime (13 Gyr<age<0.25 Gyr). The CaT EWs seem to be only weakly dependent on the age of the star, although only a few star clusters constrain the relation at high metallicity, and anyway old star clusters at supersolar metallicities are not available to set a robust constrain on the age dependance. 1 Draft version 2015.7.3.24 Preprint typeset using LATEX style emulateapj v. 05/12/14 PHYSICAL DUST MODELS FOR THE EXTINCTION TOWARD SUPERNOVA 2014J IN M82 Jian Gao1,2 , B. W. Jiang1 , Aigen Li2 , Jun Li1 , and Xiaofeng Wang3 arXiv:1507.00417v1 [astro-ph.HE] 2 Jul 2015 Draft version 2015.7.3.24 ABSTRACT Type Ia supernovae (SNe Ia) are powerful cosmological “standardizable candles” and the most precise distance indicators. However, a limiting factor in their use for precision cosmology rests on our ability to correct for the dust extinction toward them. SN 2014J in the starburst galaxy M82, the closest detected SN Ia in three decades, provides unparalleled opportunities to study the dust extinction toward an SN Ia. In order to derive the extinction as a function of wavelength, we model the color excesses toward SN 2014J, which are observationally derived over a wide wavelength range in terms of dust models consisting of a mixture of silicate and graphite. The resulting extinction laws steeply rise toward the far ultraviolet, even steeper than that of the Small Magellanic Cloud (SMC). We infer a visual extinction of AV ≈ 1.9 mag, a reddening of E(B − V ) ≈ 1.1 mag, and a totalto-selective extinction ratio of RV ≈ 1.7, consistent with that previously derived from photometric, spectroscopic, and polarimetric observations. The size distributions of the dust in the interstellar medium toward SN 2014J are skewed toward substantially smaller grains than that of the Milky Way and the SMC. Subject headings: dust, extinction — galaxies: ISM — galaxies: individual (Messier 82) — supernovae: individual (SN 2014J) 1. INTRODUCTION Type Ia supernovae (SNe Ia) are considered to be one of the most precise tools for determining astronomical distances (Howell 2011). Because of their high luminosity and relatively small dispersion at the maxima of their bolometric light curves, they are commonly utilized as cosmological “standardizable candles”. The accelerated expansion of the Universe and the presence of dark energy were discovered through SNe Ia used as standardizable candles (Riess et al. 1998; Perlmutter et al. 1999). The effectiveness of SNe Ia as distance indicators and standard candles is hampered by the systematic uncertainties related to their explosion mechanism and progenitor systems, and more importantly, the line-of-sight extinction. The distance d measured in parsec to a SN is lg d = 0.2 (mλ − Mλ + 5 − Aλ ), where mλ and Mλ are its apparent and absolute magnitudes at wavelength λ, and Aλ is the extinction. As it is not easy to directly measure Aλ , one often measures the color excess (or reddening) E(λ−V ) ≡ Aλ −AV , where AV is the extinction in the V-band (centered around 5500 ˚ A). SN reddening is often measured by comparing the observed SN colors to a zero-reddening locus. Cardelli et al. (1989; CCM) found that the Galactic extinction curves (or extinction laws) — the wave1 Department of Astronomy, Beijing Normal University, Beijing 100875, China; [email protected], [email protected] 2 Department of Physics and Astronomy, University of Missouri, Columbia, MO 65211, USA; [email protected] 3 Department of Physics, and Center for Astrophysics, Tsinghua University, Beijing 100084, China wang− [email protected] length dependencies of the extinction — can be closely parametrized by the total-to-selective extinction ratio RV ≡ AV /E(B − V ), where the B-band centers around 4400 ˚ A (also see Fitzpatrick 1999, hereafter FTZ). Astronomers often derive RV for SNe Ia by fitting the observed E(λ − V ) with the RV -based CCM formula. Once RV is determined, one can apply the CCM-formula (or some other parameterizations) to derive Aλ . However, we caution that the CCM- and FTZ-parameterizations have been derived for Galactic sightlines with 2 < RV < 5, and may not be valid for external galaxies. Note that the CCM formula is not even applicable to the Large and Small Magellanic Clouds (LMC, SMC; Gordon et al. 2003). SNe Ia are so rare that nearby SNe Ia (d < 5 Mpc) are detected only about once a decade. SN 2014J, discovered in the nearby starburst galaxy M82 at a distance of d ≈ 3.5 Mpc (Dalcanton et al. 2009), is the nearest SN Ia seen in the last three decades. Its proximity offers an unprecedented opportunity to study the extinction and reddening toward a SN Ia. The aim of this Letter is to derive RV and Aλ by fitting the reddening curve obtained by Amanullah et al. (2014) during the epoch range of [−5, +5] days around its peak brightness (§2) using the silicate-graphite model (§3). The results are presented in §3, discussed in §4, and summarized in §5. 2. COLOR-EXCESS CURVES OF SN 2014J Various studies have been carried out to determine the RV value for the sightline toward SN 2014J (e.g., see Amanullah et al. 2014; Foley et al. 2014; Goobar et al. 2014; Marion et al. 2015; Welty et al. 2014). More specifically, based on the UV to near-IR photometry of Mon. Not. R. Astron. Soc. 000, 1–23 (2013) Printed 3 July 2015 (MN LATEX style file v2.2) arXiv:1507.00413v1 [astro-ph.GA] 2 Jul 2015 Automated Kinematic Modelling of Warped Galaxy Discs in Large Hi Surveys: 3D Tilted Ring Fitting of HI Emission Cubes. P. Kamphuis1∗, G. I. G. J´ozsa2,3,4, S-.H. Oh5,6, K. Spekkens7 , N. Urbancic7, P. Serra1, B. S. Koribalski1, R.-J. Dettmar8. 1 CSIRO Astronomy & Space Science, Australia Telescope National Facility, P.O. Box 76, Epping, NSW 1710, Australia South Africa, Radio Astronomy Research Group, 3rd Floor, The Park, Park Road, Pinelands, 7405, South Africa 3 Rhodes University, Department of Physics and Electronics, Rhodes Centre for Radio Astronomy Techniques & Technologies, PO Box 94, Grahamstown, 6140, South Africa 4 Argelander-Institut f¨ ur Astronomie, Universit¨ at Bonn, Auf dem H¨ ugel 71, 53121 Bonn, Germany 5 International Centre for Radio Astronomy Research (ICRAR), Univ. of Western Australia, 35 Stirling Highway, Perth, WA 6009, Australia 6 ARC Centre of Excellence for All-sky Astrophysics (CAASTRO), 44-70 Rosehill Street, Redfern NSW 2016, Sydney, Australia 7 Department of Physics, Royal Military College of Canada, P.O. Box 17000, Station Forces, Kingston, Ontario K7K 7B4, Canada 8 Astronomisches Institut Ruhr-Universit¨ at Bochum, Universit¨ atstrasse 150, D-44801 Bochum, Germany 2 SKA ABSTRACT Kinematical parameterisations of disc galaxies, employing emission line observations, are indispensable tools for studying the formation and evolution of galaxies. Future large-scale Hi surveys will resolve the discs of many thousands of galaxies, allowing a statistical analysis of their disc and halo kinematics, mass distribution and dark matter content. Here we present an automated procedure which fits tilted-ring models to Hi data cubes of individual, well-resolved galaxies. The method builds on the 3D Tilted Ring Fitting Code (TiRiFiC) and is called FAT (Fully Automated TiRiFiC). To assess the accuracy of the code we apply it to a set of 52 artificial galaxies and 25 real galaxies from the Local Volume Hi Survey (LVHIS). Using LVHIS data, we compare our 3D modelling to the 2D modelling methods DiskFit and rotcur. A conservative result is that FAT accurately models the kinematics and the morphologies of galaxies with an extent of eight beams across the major axis in the inclination range 20◦ -90◦ without the need for priors such as disc inclination. When comparing to 2D methods we find that velocity fields cannot be used to determine inclinations in galaxies that are marginally resolved. We conclude that with the current code tilted-ring models can be produced in a fully automated fashion. This will be essential for future Hi surveys, with the Square Kilometre Array and its pathfinders, which will allow us to model the gas kinematics of many thousands of well-resolved galaxies. Performance studies of FAT close to our conservative limits, as well as the introduction of more parameterised models will open up the possibility to study even less resolved galaxies. Key words: galaxies: ISM, galaxies: kinematics and dynamics, galaxies: structure, methods: data analysis, surveys 1 INTRODUCTION The accurate description of the kinematics of galaxies is crucial to get insight into how they form and evolve during their ∗ E-mail: [email protected] c 2013 RAS lifetimes. The Doppler-shifted Hi line is one of the main tracers of these kinematics; Hi is ubiquitous, largely unaffected by absorption and often extends far further out than other probes. As such, parameterisation of the Hi distribution and dynamics has been done for several decades, mostly on an individual galaxy basis and in a highly interactive fashion. arXiv:1507.00373v1 [astro-ph.HE] 1 Jul 2015 Equations of state in the Hartle–Thorne model of neutron stars selecting acceptable variants of the resonant switch model of twin HF QPOs in the atoll source 4U 1636−53 Z. S t u c h l ´ı k, M. U r b a n e c, A. K o t r l o v a´ , G. T o¨ r o¨ k and K. G o l u c h o v a´ Institute of Physics, Faculty of Philosophy and Science, Silesian University in Opava, Bezruˇcovo n´am. 13, CZ-74601 Opava, Czech Republic e-mail: [email protected], [email protected] ABSTRACT The Resonant Switch (RS) model of twin high-frequency quasi-periodic oscillations (HF QPOs) observed in neutron star binary systems, based on switch of the twin oscillations at a resonant point, has been applied to the atoll source 4U 1636−53 under assumption that the neutron star exterior can be approximated by the Kerr geometry. Strong restrictions of the neutron star parameters M (mass) and a (spin) arise due to fitting the frequency pairs admitted by the RS model to the observed data in the regions related to the resonant points. The most precise variants of the RS model are those combining the relativistic precession frequency relations with their modifications. Here, the neutron star mass and spin estimates given by the RS model are confronted with a variety of equations of state (EoS) governing structure of neutron stars in the framework of the Hartle–Thorne theory of rotating neutron stars applied for the observationally given rotation frequency frot ∼ 580 Hz (or alternatively frot ∼ 290 Hz) of the neutron star at 4U 1636−53. It is shown that only two variants of the RS model based on the Kerr approximation are compatible with two EoS applied in the Hartle–Thorne theory for frot ∼ 580 Hz, while no variant of the RS model is compatible for frot ∼ 290 Hz. The two compatible variants of the RS model are those giving the best fits of the observational data. However, a self-consistency test by fitting the observational data to the RS model with oscillation frequencies governed by the Hartle–Thorne geometry described by three spacetime parameters M, a and (quadrupole moment) q related by the two available EoS puts strong restrictions. The test admits only one variant of the RS model of twin HF QPOs for the Hartle–Thorne theory with the Gandolfi et al. (2010) EoS predicting the parameters of the neutron star M ∼ 2.10 M⊙ , a ∼ 0.208, and q/a2 ∼ 1.77. Keywords: Accretion, accretion disks — Stars: neutron — X-rays: binaries 1 Introduction The high-frequency quasi-periodic oscillations (HF QPOs) in the Galactic Low Mass X-Ray Binaries (LMXBs) containing neutron (quark) stars are often demonstrated as two simultaneously observed pairs of peaks (twin peaks) in the Fourier power spectra corresponding to oscillations at the upper and lower frequencies (νU , νL ) that substantially change over time (even in one observational sequence). Most of the twin 1 Draft version July 3, 2015 Preprint typeset using LATEX style emulateapj v. 5/2/11 SIMULATOR OF GALAXY MILLIMETER/SUBMILLIMETER EMISSION (S´IGAME): THE [Cii] −SFR RELATIONSHIP OF MASSIVE Z=2 MAIN SEQUENCE GALAXIES Karen P. Olsen1 , Thomas R. Greve2 , Desika Narayanan3 , Robert Thompson4 , Sune Toft1 , and Christian Brinch5,6 arXiv:1507.00362v1 [astro-ph.GA] 1 Jul 2015 Draft version July 3, 2015 ABSTRACT ´ We present SIGAME simulations of the [Cii] 157.7 µm fine structure line emission from cosmological smoothed particle hydrodynamics (SPH) simulations of main sequence galaxies at z = 2. Using subgrid physics prescriptions the gas in our galaxy simulations is modelled as a multi-phased interstellar medium (ISM) comprised of molecular gas residing in the inner regions of giant molecular clouds, an atomic gas phase associated with photodissociation regions at the surface of the clouds, and a diffuse, fully ionized gas phase. Adopting a density profile of the clouds and taking into account heating by the local FUV radiation field and cosmic rays – both scaled by the local star formation rate density – we calculate the [Cii] emission from each of the aforementioned ISM phases using a large velocity gradient approach for each cloud, on resolved and global scales. The [Cii] emission peaks in the central (< ∼ 1 kpc) regions of our galaxies where the star formation is most intense, and we find that the majority (> ∼ 60%) of the emission in this region originates in the molecular gas phase. At larger galactocentric distances (> ∼ 2 kpc), the atomic gas is the main contributor to the [Cii] emission (> ∼ 80%), and at all radii the ionized gas provides a negligible amount (< ∼ 5%) to the [Cii] budget. Our simulations predict a log-linear relationship between the integrated [Cii] luminosity and star formation rate with a slope (0.80 ± 0.12) in agreement with observationally determined slopes (∼ 0.85 − 1.00) but with a ∼ 3× higher normalization than the observed z ∼ 0 relation. Subject headings: galaxies: high-redshift – galaxies: ISM – galaxies: star formation – ISM: lines and bands 1. INTRODUCTION Single ionized carbon (Cii) can be found throughout the interstellar medium (ISM) of galaxies where gas is exposed to UV radiation with energies above the ionization potential of neutral carbon (11.3 eV cf. 13.6 eV for hydrogen). Cii is found both in regions of ionized and neutral gas where, depending on the gas phase, its fine structure line [Cii] 2 P3/2 −2 P1/2 (λrest = 157.714 µm) is collisionally excited by electrons, Hi or H2 . The 2 P3/2 upper level lies 91 K (= hν/kB ) above the 2 P1/2 ground state and, over a large temperature range (∼ 20 − 8000 K), the critical density of [Cii] is only ∼ 5 − 44, ∼ 1600 − 3800 and ∼ 3300 − 7600 cm−3 for collisions with e− , Hi and H2 , respectively (Goldsmith et al. 2012). [Cii] is observed to be one of the strongest cooling lines of the ISM, with a line luminosity equivalent to ∼ 0.1 − 1% of the farinfrared (FIR) luminosity of galaxies (e.g., Stacey et al. 1991; Brauher et al. 2008; Casey et al. 2014). [email protected] 1 Dark Cosmology Centre, Niels Bohr Institute, University of Copenhagen, Juliane Maries Vej 30, DK-2100 Copenhagen, Denmark; [email protected] 2 Department of Physics and Astronomy, University College London, Gower Street, London WC1E 6BT, UK 3 Department of Physics and Astronomy, Haverford College, 370 W Lancaster Ave., Haverford, PA 19041, USA 4 University of the Western Cape, 7535 Bellville, Cape Town, South Africa 5 Centre for Star and Planet Formation (Starplan) and Niels Bohr Institute, University of Copenhagen, Juliane Maries Vej 30, DK-2100 Copenhagen, Denmark 6 DeIC, Technical University of Denmark, Building 309, DK2800 Kgs. Lyngby, Denmark Due to high atmospheric opacity at FIR wavelengths, observations of [Cii] in the local Universe must be done at high altitudes or in space. Indeed, the very first detections of [Cii] towards Galactic objects (Russell et al. 1980; Stacey et al. 1983; Kurtz et al. 1983) and other galaxies (Crawford et al. 1985; Stacey et al. 1991; Madden et al. 1992) were done with airborne observatories such as the NASA Lear Jet and the Kuiper Airborne Observatory. The advent of the Infrared Space Observatory (ISO) allowed for the first systematic [Cii] surveys of local galaxies (e.g., Malhotra et al. 1997; Luhman et al. 1998, 2003). Detections of [Cii] at high-z have also become feasible in recent years, with ground-based facilities (e.g., Maiolino et al. 2005, 2009; Hailey-Dunsheath et al. 2010; Stacey et al. 2010) and the Herschel Space Observatory (e.g., Gullberg et al. 2015). The Atacama Large Millimeter Array (ALMA), owing to its tremendous collecting area and high angular resolution, is now resolving [Cii] in high-z galaxies (De Breuck et al. 2014; Wang et al. 2013) and pushing [Cii] observations of highz galaxies to much lower luminosity than before (Ouchi et al. 2013; Maiolino et al. 2015; Capak et al. 2015). In spite of the observational successes, the interpretation of the [Cii] line as a diagnostic of the ISM and the star formation conditions in galaxies is complicated by the fact that the [Cii] emission can originate from different phases of the ISM. In our Galaxy, about 30 % of the total [Cii] emission is found to come from dense photo-dominated regions (PDRs), 25 % from cold Hi gas, 25 % from CO-dark H2 gas, and 20 % from ionized gas (Pineda et al. 2014). We expect these percentages to be different in other galaxies where high levels of star Mon. Not. R. Astron. Soc. 000, 1–5 (2015) Printed 3 July 2015 (MN LATEX style file v2.2) arXiv:1507.00351v1 [astro-ph.GA] 1 Jul 2015 Fading Features Found in the Kinematics of the Far-Reaching Milky Way Stellar Halo Sarah A. Bird1,2 1 ⋆ and Chris Flynn3 Key Laboratory for Research in Galaxies and Cosmology, Shanghai Astronomical Observatory, Chinese Academy of Sciences, 80 Nandan Road, Shanghai, 200030, China 2 Tuorla Observatory, Department of Physics and Astronomy, University of Turku, V¨ ais¨ al¨ antie 20, FI-21500 Kaarina, Finland 3 Centre for Astrophysics and Supercomputing, Swinburne University of Technology, Hawthorn, VIC, 3122, Australia Accepted 2015 June 26. Received 2015 June 25; in original form 2014 December 2 ABSTRACT We test the long-term kinematical stability of a Galactic stellar halo model, due to Kafle et al. (2012), who study the kinematics of approximately 5000 blue horizontal branch (BHB) stars in the Sloan Digital Sky Survey (SDSS). The velocity dispersion σ and anisotropy parameter β of the stars have been determined as functions of Galactocentric radius, over the range 6 < RGC < 25 kpc, and show a strong dip in the anisotropy profile at RGC ∼ 17 kpc. By directly integrating orbits of particles in a 3-D model of the Galactic potential with these characteristics, we show that the σ and β profiles quickly evolve on a time scale of a few × 10 Myr whereas the density ρ profile remains largely unaffected. We suggest that the feature is therefore transient. The origin of such features in the Galactic halo remains unclear. Key words: galaxies: individual: Milky Way – Galaxy: halo – Galaxy: kinematics and dynamics – stars: horizontal branch – stars: kinematics and dynamics. 1 INTRODUCTION Studying the Milky Way’s stellar halo is an important route to understanding galaxy formation, as the halo is such an old Galactic component. Intrinsically bright stars with easily measured radial velocities have been the usual means of doing so, with red giants and horizontal branch stars as typical tracers in such studies. Early studies of the stellar halo kinematics date to the 1950s, and focused on halo stars passing through the Solar neighbourhood, but it was not until the 1980s that large (& 100) samples of halo stars tens of kpc from the Sun began to be collected and analysed (see the reviews by Sandage (1986) and Helmi (2008)). Milky Way halo BHB stars from ∼ 5 to 50 kpc have been studied by Sommer-Larsen, Flynn & Christensen (1994). They used about 100 stars to develop a kinematical model of the outer Milky Way halo, with the surprising result that the orbits of stars in the far outer halo (> 20 kpc) appear to be much more tangential than radial. Flynn, Sommer-Larsen & Christensen (1996) used simulations of such stars orbiting in the Milky Way potential which showed such a distribution of halo orbits is stable over a Hubble time. Since then, numerous studies have added to the sample of BHB halo stars (Sommer-Larsen et al. 1997; Sirko et al. ⋆ E-mail: [email protected] 2004; Deason, Belokurov & Evans 2011; Deason et al. 2012) but show a wide spread in the resulting kinematical models for the outer stellar halo. Sommer-Larsen et al. (1997) analysed about 700 BHB stars, mainly within 20 kpc of the Sun, but also probing out to 50 kpc. They found that the outer stellar halo velocity dispersion (at ≈ 50 kpc) was quite “cold” (i.e. low velocity dispersion), nearing 100 km s−1 compared with the value at the sun ≃ 140 km s−1 . They concluded that outer halo orbits must be quite tangential (with a tangential velocity dispersion of about 150 km s−1 ), given the observed density distribution of halo stars and assumptions about the Milky Way’s dark matter distribution. On the other hand, Sirko et al. (2004) have advocated an isothermal outer halo (RGC & R⊙ ), in which all three components of the velocity dispersion are ≈ 100 km s−1 , based on ≈ 1200 BHB stars from SDSS. Thom et al. (2005) subsequently analysed 530 BHB stars with radial velocities and distances from the Hamburg/ESO survey, finding it difficult to discriminate between the simplest, isothermal kinematic models and anything more complex, and advocating further studies of the inner halo to help resolve the issue. Very distant BHB stars have recently been shown by Deason, Belokurov & Evans (2011) and Deason et al. (2012) to have very “cold” kinematics – low velocity dispersions of ≈ 50 − 60 km s−1 in the radial range 100 to 150 kpc. The density falloff in these regions is much steeper Mon. Not. R. Astron. Soc. 000, 1–17 (2015) Printed 3 July 2015 (MN LATEX style file v2.2) The formation history of massive cluster galaxies as revealed by CARLA arXiv:1507.00350v1 [astro-ph.GA] 1 Jul 2015 E. A. Cooke1? , N. A. Hatch1 , A. Rettura2,3 , D. Wylezalek4 , A. Galametz5 , D. Stern2 , M. Brodwin6 , S. I. Muldrew7 , O. Almaini1 , C. J. Conselice1 , P. R. Eisenhardt2 , W. G. Hartley8 , M. Jarvis9,10 , N. Seymour11 , S. A. Stanford12 1 School of Physics and Astronomy, University of Nottingham, University Park, Nottingham NG7 2RD, UK Propulsion Laboratory, California Institute of Technology, MS 169-234, Pasadena, CA 91109, USA 3 Infrared Processing and Analysis Center, California Institute of Technology, MS 220-6, Pasadena, CA 91125, USA 4 Department of Physics and Astronomy, Johns Hopkins University, 3400 N. Charles St, Baltimore, MD 21218, USA 5 Max-Planck-Institut fuer Extraterrestrische Physik, Giessenbachstrasse, D-85748 Garching, Germany 6 UMKC Department of Physics and Astronomy, 257 Flarsheim Hall, 5110 Rockhill Road, Kansas City, MO 64110, USA 7 Department of Physics and Astronomy, University of Leicester, University Road, Leicester LE1 7RH, UK 8 ETH Zurich, Institute for Astronomy, Wolfgang-Pauli-Strasse 27, 8093 Zurich, Switzerland 9 Astrophysics, University of Oxford, Denys Wilkinson Building, Keble Road, Oxford OX1 3RH, UK 10 Physics Department, University of the Western Cape, Bellville, South Africa 11 International Centre for Radio Astronomy Research, Curtin University, Perth, Australia 12 Physics Department, One Shields Avenue, University of California, Davis, CA 95616, USA 2 Jet Accepted 2015 June 23. Received 2015 May 28; in original form 2015 March 17 ABSTRACT We use a sample of 37 of the densest clusters and protoclusters across 1.3 6 z 6 3.2 from the Clusters Around Radio-Loud AGN (CARLA) survey to study the formation of massive cluster galaxies. We use optical i0 -band and infrared 3.6 µm and 4.5 µm images to statistically select sources within these protoclusters and measure their median observed colours; hi0 − [3.6]i. We find the abundance of massive galaxies within the protoclusters increases with decreasing redshift, suggesting these objects may form an evolutionary sequence, with the lower redshift clusters in the sample having similar properties to the descendants of the high redshift protoclusters. We find that the protocluster galaxies have an approximately unevolving observed-frame i0 − [3.6] colour across the examined redshift range. We compare the evolution of the hi0 − [3.6]i colour of massive cluster galaxies with simplistic galaxy formation models. Taking the full cluster population into account, we show that the formation of stars within the majority of massive cluster galaxies occurs over at least 2 Gyr, and peaks at z ∼ 2-3. From the median i0 − [3.6] colours we cannot determine the star formation histories of individual galaxies, but their star formation must have been rapidly terminated to produce the observed red colours. Finally, we show that massive galaxies at z > 2 must have assembled within 0.5 Gyr of them forming a significant fraction of their stars. This means that few massive galaxies in z > 2 protoclusters could have formed via dry mergers. Key words: galaxies: clusters: general ; galaxies: high-redshift ; galaxies: evolution ; galaxies: formation 1 INTRODUCTION In the local Universe, most massive cluster galaxies are old and have little-to-no ongoing star formation. They form a very homogenous, slowly-evolving population, exhibit? e-mail: [email protected] c 2015 RAS ing similar, red colours. When viewed in colour-magnitude space, these massive, old galaxies form a characteristic “red sequence”. Such red sequences of galaxies are nearly ubiquitous in low redshift clusters, and persist out to z ∼ 1.5 (e.g. Blakeslee et al. 2003; Holden et al. 2004; Mei et al. 2006; Eisenhardt et al. 2008). Red sequences have commonly been used to examine the formation history of massive cluster Astronomy & Astrophysics manuscript no. 4u1636_final July 3, 2015 c ESO 2015 Long-term quasi-periodicity of 4U 1636–536 resulting from accretion disc instability Mateusz Wi´sniewicz1 , Agnieszka Słowikowska1 , Dorota Gondek-Rosi´nska1 , Andrzej A. Zdziarski2 , and Agnieszka Janiuk3 1 2 July 3, 2015 ABSTRACT We present the results of a study of the low-mass X-ray binary 4U 1636–536. We have performed temporal analysis of all available RXTE/ASM, Swift/BAT and MAXI data. We have confirmed the previously discovered quasi-periodicity of ' 45 d present during ∼2004, however we found it continued to 2006. At other epochs, the quasi-periodicity is only transient, and the quasi-period, if present, drifts. We have then applied a time-dependent accretion disc model to the interval with the significant X-ray quasi-periodicity. For our best model, the period and the amplitude of the theoretical light curve agree well with that observed. The modelled quasi-periodicity is due to the hydrogen thermal-ionization instability occurring in outer regions of the accretion disc. The model parameters are the average mass accretion rate (estimated from the light curves), and the accretion disc viscosity parameters, α, for the hot and cold phases. Our best model gives relatively low values of αcold ' 0.01 and αhot ' 0.03. Key words. accretion, accretion discs – instabilities – stars: individual: (4U 1636–536, V801 Ara) – X-rays: binaries 1. Introduction 4U 1636–536 is a low-mass X-ray binary (LMXB) discovered by Willmore et al. (1974). The photometry of the optical counterpart (V801 Ara) shows a short orbital period of 3.79 h (Giles et al. 2002). The binary system consists of a late-type, lowmass (' 0.3–0.4 M ) donor, which transfers mass onto a neutron star (Fujimoto & Taam 1986; van Paradijs et al. 1990). Galloway et al. (2006) estimated the distance to 4U 1636–536 to be D = 6.0 ± 0.5 kpc from Eddington limited X-ray bursts, assuming the neutron star mass of 1.4 M and the stellar radius of 10 km. According to Casares et al. (2006), the mass function and mass ratio of 4U 1636–536 are f (M) = 0.76 ± 0.47 M and M2 /MNS ' 0.21–0.34, respectively, where MNS is the mass of the neutron star and M2 is the mass of the donor. They also estimated the inclination as i ' 36◦ –60◦ . The binary is a persistent X-ray source, although it shows significant flux variations on both long and short time scales. On time scales of hours, its flux varies by a factor of ∼2–3 (Hoffman et al. 1977; Ohashi et al. 1982; Breedon et al. 1986; Hasinger & van der Klis 1989). The presence of kHz quasi-periodic oscillations, which are also visible in the system during X-ray bursts, shows that the neutron star has been spun-up through accretion (Zhang et al. 1996; Strohmayer 1999). 4U 1636–536 has been monitored daily in the 1.3–12.2 keV energy range by the All Sky Monitor (ASM) on-board of the Rossi X-ray Timing Explorer (RXTE) from 1996 until 2011. During the first four years of RXTE/ASM observations (1996–2000) the source count rate was relatively stable at ∼ 15 cts s−1 . After 2000, it started to gradually decline and occasionally show a statistically significant quasi-periodic variability (Shih et al. 2005). Those authors reported the presence of a long-period, ' 47 d, 1996 Rate (cts s−1 ) arXiv:1507.00349v1 [astro-ph.HE] 1 Jul 2015 3 Institute of Astronomy, University of Zielona Góra, Szafrana 2, PL-65-516 Zielona Góra, Poland e-mail: [email protected] Centrum Astronomiczne im. M. Kopernika, Bartycka 18, PL-00-716 Warszawa, Poland Centre for Theoretical Physics, Polish Academy of Sciences, Al. Lotników 32/46, PL-02-668 Warsaw, Poland 1998 2000 2002 Year 2004 2006 2008 2010 2012 10 50000 51000 52000 53000 54000 MJD (days) 55000 56000 Fig. 1. The 50-d average RXTE/ASM light curve of 4U 1636–536 in the energy range of 1.3–12.2 keV from January 1996 to November 2011. quasi-periodic variability in the 2004 light curve. They suggested that the observed flux variability is caused by the variability of the accretion flow related to X-ray irradiation of the disc. In our paper, we study the variability of 4U 1636–536 taking into account the currently available data from three X-ray monitors, spanning almost 20 years (1996–2014). We interpret the data in terms of a disc instability model. In Sect. 2, we describe the X-ray data and perform their timing analysis. In Sect. 3, we present the theoretical model of evolution of an accretion disc around a neutron star used in the paper. We model the evolution Article number, page 1 of 7 Mon. Not. R. Astron. Soc. 000, ??–23 (2014) Printed 3 July 2015 (MN LATEX style file v2.2) arXiv:1507.00347v1 [astro-ph.GA] 1 Jul 2015 Biases and systematics in the observational derivation of galaxy properties: comparing different techniques on synthetic observations of simulated galaxies. Giovanni Guidi1, Cecilia Scannapieco1 and C. Jakob Walcher1 1 Leibniz-Institut f¨ ur Astrophysik Potsdam (AIP), An der Sternwarte 16, D-14482, Potsdam, Germany Accepted 3 July 2015 Received ...; in original form ... ABSTRACT We study the sources of biases and systematics in the derivation of galaxy properties of observational studies, focusing on stellar masses, star formation rates, gas/stellar metallicities, stellar ages and magnitudes/colors. We use hydrodynamical cosmological simulations of galaxy formation, for which the real quantities are known, and apply observational techniques to derive the observables. We also make an analysis of biases that are relevant for a proper comparison between simulations and observations. For our study, we post-process the simulation outputs to calculate the galaxies’ spectral energy distributions (SEDs) using Stellar Population Synthesis models and also generating the fully-consistent far UV-submillimeter wavelength SEDs with the radiative transfer code sunrise. We compared the direct results of simulations with the observationally-derived quantities obtained in various ways, and found that systematic differences in all studied galaxy properties appear, which are caused by: (1) purely observational biases (e.g. fiber size for single-fiber spectroscopic surveys), (2) the use of mass-weighted/luminosity-weighted quantities, with preferential sampling of more massive/luminous regions, (3) the different ways to construct the template of models when a fit to the spectra is performed, and (4) variations due to the use of different calibrations, most notably in the cases of the gas metallicities and star formation rates. Our results show that large differences, in some cases of more than an order of magnitude, can appear depending on the technique used to derive galaxy properties. Understanding these differences is of primary importance both for simulators, to allow a better judgement on similarities/differences with observations, and for observers, to allow a proper interpretation of the data which inevitably suffers from observational biases which vary from survey to survey. Key words: galaxies: formation - evolution - cosmology: theory - methods: SPH simulations - SPS models - radiative transfer 1 INTRODUCTION In recent years, large galaxy surveys such as the 2dFGRS (Two-degree-field Galaxy Redshift Survey, Colless 1999), SDSS (Sloan Digital Sky Survey, Abazajian et al. 2003) and 2MASS (Two Micron All-Sky Survey, Skrutskie et al. 2006), have opened up the possibility to statistically study the properties of galaxies in the Local Universe, revealing their great diversity: even for a narrow range in stellar mass, galaxies appear in a large variety of morphologies, gas fractions, star formation rates (SFRs) and chemical abundances. These observations have also allowed to identify important relations such as the mass-metallicity (Garnett & Shields 1987; Tremonti et al. 2004), and to measure the corresponding scatter which encodes relevant information on the galaxies’ evolution. These wealth of data give important insight c 2014 RAS on the process of galaxy formation and evolution, revealing the action of physical mechanisms occurring in galaxies, both internal – e.g. feedback, cooling – and in relation to larger-scale mechanisms – mergers, interactions, accretion. All these leave imprints on the shape of the spectral energy distributions (SEDs) which constitute the primary source of information of large galaxy surveys. In fact, in recent years it became possible to obtain the full SEDs of galaxies at wavelengths from the X-Ray to the radio. In particular for galaxy studies, wavelengths from the ultraviolet to the far infrared are the most relevant as they directly trace the spectrum coming from the stars and interstellar gas/dust, and are not affected by other processes (such as shocks, accretion onto compact objects, etc), unrelated to the stellar light. In addition to observations, numerical simulations Mon. Not. R. Astron. Soc. 000, 1–19 (2015) Printed 3 July 2015 (MN LATEX style file v2.2) Supernova-Driven Outflows in NGC 7552: A Comparison of H α and UV Tracers arXiv:1507.00346v1 [astro-ph.GA] 1 Jul 2015 Corey M. Wood,1? Christy A. Tremonti,1 Daniela Calzetti,2 Claus Leitherer,3 John Chisholm,1 and John S. Gallagher III1 1 Department of Astronomy, University of Wisconsin–Madison, 475 N. Charter St., Madison, WI 53706, USA of Astronomy, University of Massachusetts, Amherst, MA 01003, USA 3 Space Telescope Science Institute, 3700 San Martin Drive, Baltimore, MD 21218, USA 2 Department 3 July 2015 ABSTRACT We investigate the supernova-driven galactic wind of the barred spiral galaxy NGC 7552, using both ground-based optical nebular emission lines and far-ultraviolet absorption lines measured with the Hubble Space Telescope Cosmic Origins Spectrograph. We detect broad (∼ 300 km s−1 ) blueshifted (−40 km s−1 ) optical emission lines associated with the galaxy’s kpc-scale star-forming ring. The broad line kinematics and diagnostic line ratios suggest that the H α emission comes from clouds of high density gas entrained in a turbulent outflow. We compare the H α emission line profile to the UV absorption line profile measured along a coincident sight line and find significant differences. The maximum blueshift of the H αemitting gas is ∼ 290 km s−1 , whereas the UV line profile extends to blueshifts upwards of 1000 km s−1 . The mass outflow rate estimated from the UV is roughly nine times greater than that estimated from H α. We argue that the H α emission traces a cluster-scale outflow of dense, low velocity gas at the base of the large-scale wind. We suggest that UV absorption line measurements are therefore more reliable tracers of warm gas in starburst-driven outflows. Key words: galaxies: starburst – galaxies: individual: NGC 7552 – galaxies: evolution – ISM: jets and outflows 1 INTRODUCTION Feedback from massive stellar winds and supernova explosions has long been identified as a mechanism capable of injecting large amounts of energy into the local interstellar medium (ISM) of a galaxy, resulting in both the heating and potential removal of the gas in the form of a wind (Larson 1974). Supernovae-driven winds have myriad profound effects on galaxy evolution, influencing the shape of the galaxy luminosity function (Benson et al. 2003), the mass-metallicity relation (Finlator & Dav´e 2008), and the structure of galactic disks (Scannapieco et al. 2008). Such winds have been found to be “ubiquitous” in star-forming galaxies where star formation surface densities exceed ΣSF R ≈ 0.1 M yr−1 kpc−2 (Heckman 2002). Under these conditions, rapid star formation results in a large injection of mechanical energy into the local ISM of the galaxy by OB stars, Wolf-Rayet stars, and supernovae. Although galactic winds are commonly observed both locally and, increasingly, in the high-redshift universe (e.g., Veilleux et al. 2005; Steidel et al. 2010), it has been difficult to determine how much mass these winds remove from their host galaxies. The extent to which galactic winds affect on-going star formation de- ? E-mail: [email protected] c 2015 RAS pends highly on the ability of such winds to remove gas from their hosts, commonly parameterized as the mass loading factor η = M˙ out /M˙ ∗ , the rate of mass loss due to an outflow as a fraction of the global star formation rate. Measured mass loading factors are typically around η ∼ 1, but many of these measurements come with high uncertainties. Rupke et al. (2005) measure mass loading factors of η ≈ 0.01 – 1 in ∼ 45 starburst-dominated galaxies at z < 0.5. These measurements suffer from order-of-magnitude uncertainties due to large ionization corrections for Na I absorption lines. Bouch´e et al. (2012) measure η ∼ 2 with uncertainties of only a factor of 2 for five galaxies studied via background quasar absorption, but warn that it may be incorrect to compare outflows measured at large impact parameter to the current level of star formation. At higher redshift, Pettini et al. (2002) estimate η ∼ 1 in a single Lyman break galaxy at z = 2.73. Newman et al. (2012b) measure η ∼ 2 for high-ΣSF R systems at z ∼ 2, but these measurements suffer from quoted uncertainties of at least a factor of 3. The uncertainties are possibly much larger due to uncertainties in the electron density measurement because of low-S/N in the [S II] lines. More robust measurements of outflow masses and velocities will provide better constraints on mass loading factors. Mass loss measurements have typically been easier to perform in absorption-line studies, where the column density of the Mon. Not. R. Astron. Soc. 000, 1–15 (yyyy) Printed 3 July 2015 (MN LATEX style file v2.2) Predicted multiply-imaged X-ray AGNs in the XXL survey arXiv:1507.00345v1 [astro-ph.CO] 1 Jul 2015 F. Finet1,2⋆, A. Elyiv2,3,4, O. Melnyk2,5, O. Wertz2, C. Horellou6, J. Surdej2† 1 Aryabhatta Research Institute of Observational Sciences (ARIES), Manora Peak, Nainital-263 129, Uttarakhand (India) Astrophysics and Space Observations (AEOS), University of Li` ege, All´ ee du 6 Aoˆ ut, 17 (Sart Tilman, Bˆ at. B5c), 4000 Li` ege, Belgium 3 Main Astronomical Observatory, Academy of Sciences of Ukraine, 27 Akademika Zabolotnoho St., 03680 Kyiv, Ukraine 4 Dipartimento di Fisica e Astronomia, Universit` a di Bologna, Viale Berti Pichat 6/2, I-40127 Bologna, Italy 5 Astronomical Observatory, Kyiv National University, 3 Observatorna St., 04053 Kyiv, Ukraine 6 Dept.of Earth & Space Sciences, Chalmers University of Technology, Onsala Space Observatory, SE-439 92 Onsala, Sweden 2 Extragalactic Accepted yyyy Month dd. Received yyyy Month dd; in original form yyyy Month dd ABSTRACT We estimate the incidence of multiply-imaged AGNs among the optical counterparts of X-ray selected point-like sources in the XXL field. We also derive the expected statistical properties of this sample, such as the redshift distribution of the lensed sources and of the deflectors that lead to the formation of multiple images, modelling the deflectors using both spherical (SIS) and ellipsoidal (SIE) singular isothermal mass distributions. We further assume that the XXL survey sample has the same overall properties as the smaller XMM-COSMOS sample restricted to the same flux limits and taking into account the detection probability of the XXL survey. Among the X-ray sources with a flux in the [0.5 − 2] keV band larger than 3.0 × 10⁻¹⁵ erg cm−2 s−1 and with optical counterparts brighter than an r-band magnitude of 25, we expect ∼ 20 multiply-imaged sources. Out of these, ∼16 should be detected if the search is made among the seeing-limited images of the X-ray AGN optical counterparts and only one of them should be composed of more than two lensed images. Finally, we study the impact of the cosmological model on the expected fraction of lensed sources. Key words: Gravitational lensing statistics– AGNs – XXL survey – XMM-Newton 1 INTRODUCTION 1 The XXL survey , carried out by the space-based X-ray observatory XMM-Newton, spans over ∼ 2 × 25 square degrees with near 10 ks exposure in each field and is expected to lead to the detection of ∼ 25000 Active Galactic Nuclei (AGNs) down to a limiting flux 10−15 erg cm−2 s−1 in the [0.5 − 2] keV soft X-ray band (Pierre et al. 2015). These X-ray data are complemented by multi-wavelength data obtained with the Canada-France-Hawaii Telescope Legacy Survey (CFHTLS) and with the Blanco telescope (Blanco/South Pole Telescope (SPT) Cosmology Survey, BCS) in the (near-)optical u’, g, r, i and z bands, down to a limiting AB magnitude of ∼ 25. Beside the multi-band imaging of the XXL fields, there is a very large on-going effort to obtain optical spectra of XXL sources, through either the matching of existing survey catalogues or dedicated spectroscopic surveys. Among these spectroscopic data acquisition programmes, the VIMOS Public Extragalactic Redshift ⋆ E-mail:[email protected] † Also, Directeur de Recherche honoraire du F.R.S.-FNRS 1 http://ifru.cea.fr/xxl Survey (VIPERS, A.Guzzo & Le F`evre 2010) covers most of the northern field, the southern field being covered using the AAOmega multi-object spectrograph on the AngloAustralian Telescope, an instrument used for the Galaxy and mass assembly project (GAMA, Driver et al. 2009). The completeness of this multi-wavelength database over the entire XXL field provides a unique sample to search for multiply-imaged AGNs. We have thus initiated such a search among the optical counterparts of point-like sources in the soft X-ray band. Beside the scientific interest provided by each multiply-imaged source, the goal of this project is to construct a statistically clean sample of lensed sources that will be used, in combination with samples of multiplyimaged sources from other recent surveys, to independently constrain the cosmological model. The choice of the soft X-ray point-like sources is motivated by the higher sensitivity of XMM-Newton in this band. Furthermore, this spectral band should contain a larger fraction of type-I AGNs than the hard X-ray. On average, type-I AGNs with a detectable optical counterpart are expected to have a higher redshift than type-II AGNs (more absorbed in the visible and thus more difficult to detect in the optical Draft version July 3, 2015 Preprint typeset using LATEX style emulateapj v. 5/2/11 TURBULENT AMPLIFICATION AND STRUCTURE OF INTRACLUSTER MAGNETIC FIELD Andrey Beresnyak Nordita, KTH Royal Institute of Technology and Stockholm University, SE-10691 Stockholm, Sweden Francesco Miniati arXiv:1507.00342v1 [astro-ph.CO] 1 Jul 2015 Physics Dept., ETH Zurich, Wolfgang-Pauli-Strasse 27, CH-8093 Switzerland Draft version July 3, 2015 ABSTRACT We compare DNS calculations of homogeneous isotropic turbulence with the statistical properties of intra-cluster turbulence from the Matryoshka Run (Miniati 2014) and find remarkable similarities between their inertial ranges. This allowed us to use the time dependent statistical properties of intracluster turbulence to evaluate dynamo action in the intra-cluster medium, based on earlier results from numerically resolved nonlinear magneto-hydrodynamic turbulent dynamo (Beresnyak 2012). We argue that this approach is necessary (a) to properly normalize dynamo action to the available intra-cluster turbulent energy and (b) to overcome the limitations of low Re affecting current numerical models of the intra-cluster medium. We find that while the properties of intra-cluster magnetic field are largely insensitive to the value and origin of the seed field, the resulting values for the Alfv´en speed and the outer scale of the magnetic field are consistent with current observational estimates, basically confirming the idea that magnetic field in today’s galaxy clusters is a record of its past turbulent activity. Subject headings: cosmology: theory—magnetohydrodynamics—MHD dynamo 1. INTRODUCTION The hot intracluster medium (ICM) of galaxy clusters (GC) is well known to be magnetized from radio observations. These reveal both the occurrence of Faraday rotation effect on polarized radiation from background quasars (Clarke et al. 2001; Clarke 2004) and of diffuse synchrotron emission (Ferrari et al. 2008) from the ICM. Estimates of the magnetic field based on these observations range between a fraction and several µG. Measurements on the structural and spectral features are sparse and more difficult, but indicate steep power-laws below few tens of kpc (Laing et al. 2008; Kuchar & Enßlin 2011). For massive clusters, turbulence in the ICM is mainly driven by structure formation (Norman & Bryan 1999; Ryu et al. 2008; Vazza et al. 2011; Miniati 2014, 2015). The most important magnetic field amplification mechanism in the ICM is the small scale or fluctuation dynamo (SSD), operating on scales smaller than the turbulence outer scale. Kinematic regime of SSD, i.e. when the back reaction of the magnetic field on the flow is negligible, has been studied in great detail previously (Kazantsev 1968; Kraichnan & Nagarajan 1967; Kulsrud & Anderson 1992). In kinematic regime the magnetic energy grows exponentially, till the approximation breaks down, roughly in a dynamical time multiplied by Re−1/2 , where Re is an effective Reynolds number. The extremely hot and rarefied plasma of the cluster have very large collisional mean free paths, around λ ≈ 103 pc(n/3 × 10−3 cm−3 )−1 (T /10keV)3/2 , (1) at the same time, given the observable magnetic fields around 3 µG, the Larmor radius is smaller by many orders of magnitudes: rL ≈ 10−9 pc(T /10keV)(B/3µG)−1 . (2) Such situation, known as “collisionless plasma” is challenging from theoretical viewpoint, since nonlinear plasma effects are dominating the transport, which has been known since early Lab plasma experiments, when it became clear that collisional “classic transport” is grossly insufficient to explain cross field diffusion (see, e.g., Galeev & Sagdeev 1979). As a rule of thumb, the actual effective parallel mean free path is smaller than the one obtained by collisional formula, but larger than the Bohm estimate (λef f ∼ rL ). The search for this “mesoscale” for cluster conditions resulted in estimates for the mean free path of the proton in the ICM around 10−3 − 10−6 pc (Schekochihin & Cowley 2006; Beresnyak & Lazarian 2006; Schekochihin et al. 2008; Brunetti & Lazarian 2011). From these estimates we expect clusters to be turbulent with Reynolds numbers Re exceeding 1012 . Combining this with the above estimate of the kinematic SSD growth rates, for a dynamical time ∼ eddy turnover time ∼ 1 Gyr (Miniati 2014), we estimate that the exponentiation timescale will be smaller than 1 Gyr (Re)−1/2 ≈ 1 kyr. The remainder of this paper is organized as follows: in Section 2 we discuss the properties of nonlinear regime of the small-scale dynamo which is supposed to dominate during most of the cluster lifetime; in Section 3 we point to the inadequacy of current MHD cosmological simulations, as far as dynamo is concerned, and suggest a different approach; in Section 4 we describe new homogeneous dynamo simulations with intermittent driving; in Section 5 we explain our cosmological hydrodynamic model of the cluster; in Section 6 we combine the knowledge obtained in previous sections and analyze cluster simulations to derive the properties of the cluster magnetic fields; in Section 7 we discuss implications and compare with previous work. Astronomy & Astrophysics manuscript no. censors_peak_paper_aa_rv July 3, 2015 c ESO 2015 Cosmic downsizing of powerful radio galaxies to low radio luminosities (Research Note) E. E. Rigby1 , J. Argyle1, 2 , P. N. Best3 , D. Rosario4 and H. J. A. Röttgering1 1 2 3 arXiv:1507.00341v1 [astro-ph.GA] 1 Jul 2015 4 Leiden Observatory, Leiden University, P.O. Box 9513, 2300 RA Leiden, The Netherlands e-mail: [email protected] School of Physics and Astronomy, University of St Andrews, North Haugh, St Andrews, KY16 9SS, UK SUPA, Institute for Astronomy, Royal Observatory Edinburgh, Blackford Hill, Edinburgh EH9 3HJ, UK Max Planck Institute for Extraterrestrial Physics, Giessenbachstrasse 1, 85748 Garching, Germany July 3, 2015 ABSTRACT Aims. At bright radio powers (P1.4GHz > 1025 W/Hz) the space density of the most powerful sources peaks at higher redshift than that of their weaker counterparts. This paper establishes whether this luminosity–dependent evolution persists for sources an order of magnitude fainter than those previously studied, by measuring the steep–spectrum radio luminosity function (RLF) across the range 1024 < P1.4GHz < 1028 W/Hz, out to high redshift. Methods. A grid–based modelling method is used, in which no assumptions are made about the RLF shape and high–redshift behaviour. The inputs to the model are the same as in Rigby et al. (2011): redshift distributions from radio source samples, together with source counts and determinations of the local luminosity function. However, to improve coverage of the radio power vs. redshift plane at the lowest radio powers, a new faint radio sample is introduced. This covers 0.8 sq. deg., in the Subaru/XMM–Newton Deep Field, to a 1.4 GHz flux density limit of S 1.4GHz ≥ 100 µJy, with 99% redshift completeness. Results. The modelling results show that the previously seen high–redshift declines in space density persist to P1.4GHz < 1025 W/Hz. At P1.4GHz > 1026 W/Hz the redshift of the peak space density increases with luminosity, whilst at lower radio luminosities the position of the peak remains constant within the uncertainties. This ‘cosmic downsizing’ behaviour is found to be similar to that seen at optical wavelengths for quasars, and is interpreted as representing the transition from radiatively efficient to inefficient accretion modes in the steep–spectrum population. This conclusion is supported by constructing simple models for the space density evolution of these two different radio galaxy classes; these are able to successfully reproduce the observed variation in peak redshift. Key words. galaxies: active – galaxies: evolution – galaxies: high redshift 1. Introduction Radio–loud active galactic nuclei are a key component driving galaxy evolution; the feedback their expanding radio jets provide is essential for preventing large–scale cluster cooling flows and halting the growth of massive elliptical galaxies (e.g. Fabian et al. 2006; Best et al. 2006; Best et al. 2007; Croton et al. 2006; Bower et al. 2006). To understand the timescales upon which these processes occur, it is important to first understand the evolution of the radio luminosity function (RLF) to high–redshift. An early measurement of this came from Dunlop & Peacock (1990), who found increases in the space density of both flat and steep–spectrum radio AGN of two to three orders of magnitude, over that seen locally. They also saw the first indication of an expected higher redshift density decline at z ∼ 2.5, corresponding to the build–up of these objects in the early Universe. However, their work, and that of subsequent studies (e.g. Shaver et al. 1996; Jarvis et al. 2001; Waddington et al. 2001), lacked the necessary depth and volume needed to unambiguously measure this high–redshift behaviour. This situation improved with the development of the Combined EIS–NVSS Survey of Radio Sources (CENSORS; Best et al. 2003): a survey designed to maximise the coverage of steep– spectrum radio sources close to the high–redshift break in the RLF. Rigby et al. (2011, hereafter R11) used CENSORS, combined with additional radio source samples, source counts and determinations of the local RLF, to investigate the space density evolution of the P1.4GHz > 1025 W/Hz steep–spectrum population via grid–based modelling with no prior assumptions included about the high–redshift behaviour. This robustly identified the post–peak space density decline in the RLF, and found that this turnover appears to be luminosity–dependent; at lower radio powers (P1.4GHz = 1025−26 W/Hz) the space densities peak at z > ∼ 1, but the peak moves to higher redshift for the more lu27 minous objects (z > ∼ 3 for P1.4GHz > 10 W/Hz). A luminosity dependence in the position of the steep–spectrum RLF peak can be interpreted as a sign of ‘cosmic downsizing’, in which the most massive black holes form at earlier epochs than their less massive counterparts. This has also been seen for other AGN populations, selected at other radio, optical, far–infrared and X– ray wavelengths (e.g. De Zotti et al. 2010; Hasinger et al. 2005; Richards et al. 2005; McAlpine et al. 2013; Delvecchio et al. 2014), as well as reproduced in simulations of black hole growth (e.g. Fanidakis et al. 2012; Hirschmann et al. 2012, 2014). Steep–spectrum radio sources can be split into two distinct populations: typically powerful objects with ‘standard’ accretion of cold gas and likely to be merger driven (‘cold–mode’); and Article number, page 1 of 7 Draft version July 3, 2015 Preprint typeset using LATEX style emulateapj v. 5/2/11 ON THE [CII]-SFR RELATION IN HIGH REDSHIFT GALAXIES L. Vallini1 Dipartimento di Fisica e Astronomia, Universit´ a di Bologna, viale Berti Pichat 6/2, 40127 Bologna, Italy S. Gallerani, A. Ferrara2 , A. Pallottini, B. Yue arXiv:1507.00340v1 [astro-ph.GA] 1 Jul 2015 Scuola Normale Superiore, Piazza dei Cavalieri 7, 56126, Pisa, Italy Draft version July 3, 2015 ABSTRACT After two ALMA observing cycles, only a handful of [C II] 158 µm emission line searches in z > 6 galaxies have reported a positive detection, questioning the applicability of the local [C II]-SFR relation to high-z systems. To investigate this issue we use the Vallini et al. (2013, V13) model, based on high-resolution, radiative transfer cosmological simulations to predict the [C II] emission from the interstellar medium of a z ≈ 7 (halo mass Mh = 1.17 × 10¹¹ M ) galaxy. We improve the V13 model by including (a) a physically-motivated metallicity (Z) distribution of the gas, (b) the contribution of Photo-Dissociation Regions (PDRs), (c) the effects of Cosmic Microwave Background on the [C II] line luminosity. We study the relative contribution of diffuse neutral gas to the total [C II] emission (Fdiff /Ftot ) for different SFR and Z values. We find that the [C II] emission arises predominantly from PDRs: regardless of the galaxy properties, Fdiff /Ftot ≤ 10% since, at these early epochs, the CMB temperature approaches the spin temperature of the [C II] transition in the cold neutral medium (TCMB ∼ TsCNM ∼ 20 K). Our model predicts a high-z [C II]-SFR relation consistent with observations of local dwarf galaxies (0.02 < Z/Z < 0.5). The [C II] deficit suggested by actual data (LCII < 2.0 × 10⁷ L in BDF3299 at z ≈ 7.1) if confirmed by deeper ALMA observations, can be ascribed to negative stellar feedback disrupting molecular clouds around star formation sites. The deviation from the local [C II]-SFR would then imply a modified Kennicutt-Schmidt relation in z > 6 galaxies. Alternatively/in addition, the deficit might be explained by low gas metallicities (Z < 0.1 Z ). Subject headings: galaxies:high-redshift, galaxies:ism, cosmology:theory, submillimeter:ism, line:formation, cosmology:observations 1. INTRODUCTION The study and characterization of the interstellar medium (ISM) of galaxies that formed in the early Universe is entering a golden era thanks to the unprecedented capabilities of the Atacama Large Millimetersubmillimeter Array (ALMA). In particular, the 158 µm emission line due to the 2 P3/2 →2 P1/2 fine-structure transition of ionized carbon ([C II]), being the dominant coolant of the neutral diffuse ISM (Wolfire et al. 2003), is by far the brightest line in the far-infrared band (Stacey et al. 1991). In addition to the diffuse neutral gas, the [C II] line can be excited in other components of the interstellar medium such as high density photodissociation regions (PDRs), and in the diffuse ionized gas, where the main driver of the [C II] emissivity are the collisions with free e− . Although precisely assessing the relative contribution of the various gas phases to the total line emission might be difficult, [C II] line remains a unique tool to characterize the interstellar medium of galaxies in the Epoch of Reionization (z ∼ 6) (e.g Carilli & Walter 2013). Before the ALMA advent, the [C II] line from z > 4 was solely detected in galaxies with extreme star formation rates (≈1000 M yr−1 ) (e.g. Cox 1 2 Scuola Normale Superiore, Pisa, Italy Kavli IPMU (WPI), Todai Institutes for Advanced Study, the University of Tokyo et al. 2011; Carilli et al. 2013; Carniani et al. 2013; De Breuck et al. 2014), or in those hosting Active Galactic Nuclei (AGN) (e.g. Maiolino et al. 2005; Venemans et al. 2012; Gallerani et al. 2012; Cicone et al. 2015). In the first years of ALMA operations, the [C II] has been detected in a handful of galaxies at z ≈ 4.5 with modest star formation rates (50 − 300 M yr−1 ) (Carilli et al. 2013; Carniani et al. 2013; Williams et al. 2014; Riechers et al. 2014). Viceversa, other tentative searches of this line have failed in normal star-forming galaxies (NSFGs; SFR ≈10 M yr−1 ) at z > 6 (e.g. Walter et al. 2012; Kanekar et al. 2013; Gonz´alez-L´opez et al. 2014; Ouchi et al. 2013; Ota et al. 2014; Schaerer et al. 2015). These early results seem to be at odds with the correlation between the intensity of the [C II] line and the SFR found in local galaxies, thus questioning the applicability of this relation to high-z sources. Only very recently, three different ALMA campaigns targeting z ≈ 5 − 7 LAEs and LBGs have yielded [C II] detections: Maiolino et al. (2015) in the vicinity of BDF3299, a LAE at z ≈ 7.1, Capak et al. (2015) in a sample of LAEs at 5.1 < z < 5.7, and Willott et al. (2015) in two luminous LBGs at z ≈ 6 being in agreement with the [C II] luminosity expected from lower-z observations in star forming galaxies. In the nearby Universe, the [C II]-SFR relation holds for a wide range of galaxy types, ranging from metal poor dwarf galaxies, to starbursts, ultra-luminous in-


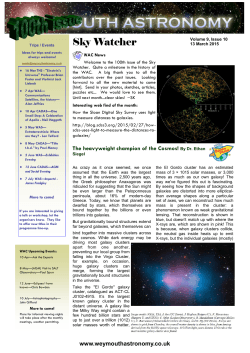


© Copyright 2026