
B - HKIVM
DISCLAIMER All contents included on this booklet, including text, graphics, logos, button icons, images, photos are the properties of the conference organisers or its content suppliers and protected by Hong Kong and international copyright laws. No part of this booklet may be reproduced in any form without prior written consent from the copyright owner. Commercial use or publication of any contents in this booklet is strictly prohibited without prior authorization from the conference organisers. Some text, graphics, logos, images, photos are published on the documentation in this booklet with the permission of the relevant copyright owners, other than the conference organisers. All rights reserved. Copyright © 2015 Table of Contents Welcome Messages --------------------------------------------------------------------------------Congratulatory Messages -----------------------------------------------------------------------Conference Programme -------------------------------------------------------------------------Day Chairpersons --------------------------------------------------------------------------------Keynote Speakers and Abstracts -------------------------------------------------------------Abstracts of Paper Presenters -----------------------------------------------------------------Full Papers of Paper Presenters Value Management: An Effective Innovation Management Tool for Strategic 1 5 10 12 13 16 27 Management of Technology in the Services Sector – Case of a VTI Arif SIKANDER (Australia) Discovering Values with the Design for Value Model and Reflection on a VE-Study for 34 a Shipping Company Hein B.A. de JONG (Netherlands) New movement of VA/VE in Japan 39 Hisaya YOKOTA (Japan) Using FAST as a Knowledge Management Tool on Fall Risk Assessment of Advanced 44 Shoring Bridge Construction Project Using Bayesian Network Transferring from Fault Tree Analysis Po-yi CHANG (Taiwan) The Importance of the “As-Is” and “Should-Be” Function Analysis in VA/VE Projects 60 Marc PAUWELS (Germany) Case Analysis for Determining the Characteristics of Value Engineering in the 66 Pre-Design Phase Hyun-jong LEE (South Korea) Enhancing Value in Public Construction Projects: The Malaysian Journey 73 Zuhaili MOHAMAD RAMLY (Malaysia) Applying the Value Index to Identify the Best Care and Attention Homes for the 78 Elderly Qi LIANG (Hong Kong) Evaluation Techniques of the Esteem Function 85 Kayo UCHIDA (Japan) How to Deal with a Multitude of Ideas at the Evaluation Phase in a VE Project Sebastian MEINDL (Germany) 91 Value Engineering (VE) Application in Malaysian Public Construction Projects: 97 Quantifying the Involvement of VE Study Application in Project Management (PM) Knowledge Areas Mukhzani ABD LATIF (Malaysia) Value Management - An Innovative Way to Solve the Conflict in Public Engagement 104 Jingyu YU (Hong Kong) Innovation Project Acceptance in an Emerging Market City 111 Yann TRUONG (France) Use VA/VE on Online to Offline (O2O) Cloud Learning Services Study - with an 116 Example of Xtiveco Cloud and App Ta-ming CHANG (Taiwan) TEAM – Nucleus of Value Methodology 121 Anil Kumar MUKHOPADHYAYA (India) Functional Approach as a Valuable Way of Collaboration between Japanese Style 129 Grass-Roots Innovation and that of Developing Countries Manabu SAWAGUCHI (Japan) Exploring Possibilities and Creating Sustaining Solutions, but which Approach to VM 134 Should I Use? Martyn R. PHILLIPS (Canada) Organizer: Hong Kong Institute of Value Management -------------------------------Organizer: SAVE International® ----------------------------------------------------------- 142 143 Acknowledgements ---------------------------------------------------- ------------------------ 144 Welcome Message from the President of HKIVM Dr. Mei-yung LEUNG President Hong Kong Institute of Value Management (HKIVM) This is the year of the 20th anniversary of Hong Kong Institute of Value Management. On behalf of the Council of HKIVM, I am honored and delighted to welcome you to this Joint HKIVM-SAVE International Conference being held from 8th to 9th May 2015. Yesterday, we also had a One-Day Workshop demonstrating all steps of the value methodology facilitated by James Bolton, President of SAVE International. Thank you James and I believe that those who attended enjoyed it. The Conference is jointly organized by HKIVM and SAVE International. This is the 12 th International Conference of HKIVM and the 4th Asian VE Conference of SAVE International. It aims at providing a platform and the opportunities for knowledge exchange among VM practitioners from all over the world. We are pleased that we now have speakers, presenters, delegates and guests coming from around the world, including Australia, Canada, China, France, Germany, Hong Kong, India, Japan, Korea, Malaysia, Netherlands, Singapore, Taiwan, and the U.S.A. The Conference theme is ‘Discover Hidden Value’. It wishes to call upon people to discover novel approaches to and new areas in the application of value management (VM). The program of the Conference is rich, covering topics from VM job plan and particular skills via successful cases to innovative applications and technologies, from Western to Eastern experience, from locally to internationally, from past review to future directions. So, please communicate freely, exchange ideas, re-acquaint with old friends, meet new friends, broaden VM knowledge, and enrich VM experience to create values for your future. Finally, on the behalf of HKIVM, I would like to thank all participants, the guest of honour, Ir. Dr. Christopher TO, keynote speakers, Mr. James BOLTON, Ir. Hung-leung CHENG and Ms. Ada FUNG, sponsors and supporting organizations for their support to the Conference making this viable. I also thank the conference organizing committee members and the council members for their effort in organizing the Conference. Let’s get the best out of the Conference, and make this a fruitful and valued year of the 20th anniversary of HKIVM. Dr. Mei-yung LEUNG President Hong Kong Institute of Value Management (HKIVM) 1 Welcome Message from the President of SAVE International® Mr. James D. BOLTON President SAVE International®, USA As the President of SAVE International, I would like to welcome you to the 4th Asian SAVE International® and the 12th Hong Kong Institute of Value Management (HKIVM) Joint Value Management International Conference being held at the Royal Plaza Hotel in Hong Kong from 8-9 May 2015. The theme of this conference is, “Discover Hidden Values” which reflects how utilizing the Value Methodology can unlock hidden value and reveal great ideas that were not originally obvious for many projects. It is our mutual aim to create awareness in the community of the global impact and of the benefits that can be derived from the proper application of the Value Methodology which is also referred to as Value Management, Value Engineering, Value Analysis, Value Planning and Value Control. Trying to discover what is hidden and focus on what we could create anew is a real reality which is very possible when employing the Value Methodology in a disciplined approach with the right cross-functional team. VM/VE is a powerful tool that can be used to create, discover and innovate new concepts by truly understanding the ‘Voice of the Customer’ requirements in terms of functions. When utilizing this methodology faithfully by a skilled value professional, tremendous business or financial improvements can be obtained thereby enhancing both customer and client value. I would personally like to congratulate HKIVM on their 20th anniversary as a technical professional Value Management society this year as this conference is highlighted with presentations from some of the best value practitioners globally as represented by their 10+ countries which they call home. Each has dedicated their time and energy to participate in this conference so during the networking breaks and social events, introduce yourself to them and seek to discover some of the hidden values which they are more than willing to share with you about the Value Methodology. Whether you are just starting your educational process in the Value Methodology or have been involved in it for many years, I am convinced if you take good notes, all of you will discover some hidden values from this conference that will enhance your knowledge in this unique field which uses function analysis to unlock innovative ideas thus improving value for your organization. I would especially like to thank the conference committee whom has worked tirelessly behind the scenes to ensure your experience at this conference is nothing less that spectacular, thus driving optimum value for your financial and personal commitment to attend this event. If it does not meet your level of satisfaction in any way, please let one of us know the issues so that we can improve the situation either now or in the future down the road at the next event. We too truly believe in ‘Voice of the Customer’ and your voice does matter to us so please let us hear the things you liked and the areas where we could have done better. The Value Methodology is also about continuous improvement and so seek to enjoy your experience at this event and share your ideas, goals, and dreams for the future. Again welcome and I look forward to personally meeting you at the conference this year. Mr. James D. BOLTON President SAVE International®, USA 2 Welcome Message from the Guest of Honour Ir. Dr. Christopher TO Executive Director Construction Industry Council On behalf of the Construction Industry Council, it gives me great pleasure to extend our heartiest congratulations to the Hong Kong Institute of Value Management (HKIVM) and SAVE International on their successful organisation of the Joint HKIVMSAVE International Conference 2015. Having been established in 1995, HKIVM is also celebrating the 20th Anniversary this year. The theme of the Conference is ‘Discover Hidden Values’. This is a timely topic and I am sure we will all gain a lot from the experience and insights that our illustrious speakers share with us. It would be fair to say that Hong Kong’s construction industry is at a stage of transformation where all of us, especially those at the top, must look at how we can work differently to achieve a breakthrough in productivity and competitiveness. Value Management (VM)/ Value Engineering (VE) is a powerful tool that can be used to develop innovative and holistic solutions to complex problems. I commend the HKIVM and SAVE International for developing a comprehensive programme of lectures and workshops on VM and VE. The Joint HKIVM-SAVE International Conference 2015 will provide an excellent opportunity to share with colleagues new concepts and developments in the field, while top specialists will update us with their extensive practical experiences that may prepare us for the challenges ahead. May I wish the Conference a great success. I hope you will have a rewarding weekend and an enjoyable stay in our vibrant city! Ir. Dr. Christopher TO Executive Director Construction Industry Council 3 Welcome Message from the Conference Director Ir. David YAU Conference Director Joint HKIVM-SAVE International Conference 2015 “Discover Hidden Values” has been adopted as the main title for HKIVM’s 12th International Conference. This year has a special meaning too as we have the honour to host the conference jointly with SAVE International as part of their 2015 Asian VE Conference whilst at the same time celebrating 20th Anniversary of HKIVM. We sincerely hope that this conference has helped you to discover hidden values in VM and VE! In these exciting times the conference is a forum for discussion of value management as a powerful methodology to innovate and create in international best practice. The major sections of the conference include: t*OOPWBUJWF7.5FDIOJRVFTBOE/FX%JSFDUJPOPG7.*OUFSOBUJPOBMMZ t%JTDPWFSJOH)JEEFO7BMVFTBOE,FZ4VDDFTTGVM'BDUPSTCZVTJOH7. t8FTUFSO&BTUFSO7."QQMJDBUJPOTBOE7.,OPXMFEHF t6TJOH7.JO1VCMJD&OHBHFNFOU The organization of a conference of this magnitude would not have been possible without the support and contributions of many individuals and organizations. The support from the Council of the HKIVM has been pivotal in the organization of this conference. We wish to express our gratitude to the SAVE International for being our partner and also Construction Industry Council, Hong Kong Housing Society and other sponsors and organizations for supporting this conference. Thanks are due to all the speakers for their careful preparation of the papers and the keynote speakers for their special support. We would like to thank all those involved in the day to day running of the organization work, including the Conference Committee, the Conference Secretariat (ICC Limited) and Mr. Chee-yoong CHAI for his work on the HKIVM Website. Ir. David YAU Conference Director Joint HKIVM-SAVE International Conference 2015 4 Congratulatory Message from the Secretary for Development Mr. Paul Mo-po CHAN Secretary for Development Development Bureau The Government of the Hong Kong Special Administrative Region I congratulate all participants of the Joint HKIVM-SAVE International Conference 2015. Enhancing Hong Kong’s competitiveness and improving our living environment require concerted efforts from the Government and trades to critically review where value could be further created. The Government strives to make the best use of public resources by delivering quality public works that bring about economic and social benefits. In the course of the city’s development we can discover hidden sources of wealth and value. The district of Kowloon East is such an example, and in addition to establishing the Energising Kowloon East office, the Government will use Kowloon East as a pilot area to spearhead initiatives in this direction. I look forward to receiving your innovative ideas and wish this event great success. Mr. Paul Mo-po CHAN Secretary for Development Development Bureau, The Government of the Hong Kong Special Administrative Region 5 Congratulatory Messages from the Past Presidents of HKIVM As a founder member of the HKIVM, it is with great pleasure to congratulate the current President, the Committee and all those involved in continuing the HKIVM tradition of bringing experienced and interesting VM speakers to Hong Kong. It is always a challenging task to seek and obtain firm commitments from very busy Value Management facilitators and Keynote speakers. My thanks also go to all the speakers for their interest in enhancing Value Management in Hong Kong and the Asian region. To the others behind the scenes who are essential to make the event a success, your assistance is greatly appreciated. Well done all. Mr. Anthony WILSON Past President (2000-2005), Hong Kong Institute of Value Management I wish to express my heartfelt congratulations to the HKIVM for its 20 th anniversary and it is a great privilege to be very closely associated with the development of this institution since its inception in 1995. I wish the Institute to go from strength to strength in the next 20 years and beyond. Prof. Geoffrey Q.P. SHEN Past President (2007-2011), Hong Kong Institute of Value Management My congratulation to HKIVM and all who have supported it over the past 20 years. Time has passed very quickly since the first conference at Excelsior Hotel and a lot has been achieved; not least the appreciation and practice of VM throughout the Hong Kong project community and the establishment of a highly capable group of VM facilitators. There has also been a regional influence with VM becoming the norm in Singapore and of growing importance in Malaysia within my own experience. Well-done HKIVM. Mr. Bryan CLIFFORD Past President (2011-2013), Hong Kong Institute of Value Management 6 Congratulatory Messages from the International VM Societies I was privileged to work with the first HKIVM President, Tony TOY, in setting up the HKIVM a number of years ago, and have been fortunate to speak at many of your conferences in the past. On behalf of the Board of Directors of the Institute of Value Management, Australia, I send you greetings and wish you a most successful and productive conference. Dr. Roy BARTON, PhD, FIVMA President, Institute of Value Management Australia (IVMA) On behalf of Korea Construction VE Research Institute (KCVE), I sincerely congratulate this Joint HKIVM-SAVE International Conference and the 20th anniversary of HKIVM. Through the constructive discussion on diverse issues related to “Discover Hidden Values” at this wonderful occasion, I hope that all participants including distinguished presenters, professional Value Engineers, and honorable guests, could pursue the better and excellent way to apply VE methodology to the industry. And I expect the continuing prosperity of HKIVM and the close cooperation of VE related associations and institutes all over the world, so that we can contribute to our society and mankind with the improved way to produce and/or serve. May all of you enjoy this wonderful conference! Dr. Chang-taek HYUN Chairman, Korea Construction VE Research Institute (KCVE) On behalf of Society of Japanese Value Engineering (SJVE), congratulations on the holding of the 12 th HKIVM International Conference and “The 4th Asian VE Conference” – organized jointly with SAVE International to be held on May 8th – 9th, 2015 in Hong Kong. I appreciate the conference organizers all the work they have done to provide the conference attendees with high quality technical programs. The conference theme: “Discover Hidden Values” is a very important key word to survive in the current global and highly competitive business world. This time, several attendees and speakers from Japan will be present. I hope they can contribute to the success of the conference and will take advantage of opportunities to exchange views and insights with other attendees coming from all over the world. Mr. Shiro KONDO President, Society of Japanese Value Engineering (SJVE) 7 Congratulatory Messages from the International VM Societies The Executive and Members of the Institute of Value Management in the United Kingdom, warmly congratulate HKIVM on your 20th Anniversary and we wish you every success with your joint conference with SAVE, their 4th Asian VE Conference on 8th and 9th May 2015 on the theme of “Discover Hidden Values” and for the future. Mr. Keith OWEN Chair, The Institute of Value Management, United Kingdom Congratulations to the Hong Kong Institute of Value Management (HKIVM) and the Society of American Value Engineers (SAVE) for this great joint conference initiative. The timing and location are excellent as Asia, the most populous region on the planet by far, regains its prominence in world affairs. The Institute of Value Management Australia (IVMA) wishes the HKIVM and SAVE a stimulating and successful conference. Mr. John BUSHELL, GDTM, FIVMA, MHKIVM Chair, Publications and Events Committee, Institue of Value Management Australia (IVMA) I am honored to have an opportunity to attend the 12 th HKIVM International Conference and The 4 th Asian VE Conference – organized jointly with SAVE International to be held on May 8th – 9th, 2015 in Hong Kong. As a native of Shanghai, China, and a value engineering practitioner based in Japan, I would like to play a role of go-between of China and Japan in promoting Value Engineering as a powerful problem solving tool. I look forward to meeting and exchanging views and insights with many conference attendees coming from all over the world. Mr. Xiao-lei HE, VEL Vice Chairman, Shanghai VE Promotion Committee 8 Congratulatory Messages from the International VM Societies It is my utmost pleasure to congratulate the 20th Anniversary of the Hong Kong Institute of Value Management, not only because of this very memorable occasion, but also because I was one of the founding members of the Institute. This is indeed a very proud moment for Institute. I recall in the early days, the founding Chairman of the Institute Mr. Tony TOY, with his enthusiasm and strong believe that the VM methodology could be a very effective tool to assist in project execution, spent many hours to collaborate with other VM practitioners to establish the HKIVM in 1995. He also attended formal training in Australia to become a qualified facilitator and personally practiced the methodology on many projects with various project developers including the public and private sectors. Although Mr. TOY passed away unexpectedly in 1999, I am very happy to see that the spirit that Mr. TOY created had been passing on from generation to generation of active Chairmen and executive committees of the Institute, maintaining many active events including Conferences, to attract new comers and the introduction of the methodology to the community at large to this date. At this time, I wish HKIVM every success in this very memorable 2015 20th Anniversary Conference and all the best in the future development of the Institute and the wider application of the methodology to all facets of the community. Mr. Ho-kin LI, FHKIVM VM Facilitator List A Happy 20th Birthday to HKIVM and Congratulations on hosting this year’s 4th Asian VE Conference and HKIVM’s 12th Conference. This event would make your founder Tony TOY very proud. Thanks to Patrick FONG and Geoffrey SHEN for being there at the beginning and on-going support. Your current President Mei-yung LEUNG informs me that in 2004 I was the first person from the USA to conduct a Module I Workshop in Hong Kong. It was her efforts that made that possible. To the participants of this year’s conference please enjoy and learn from the many professional speakers on the program. And also enjoy Hong Kong, the city that I call the “Concrete Jungle”. Mr. Jim RAINS, CVS®, FSAVE Chairman, Lawrence D. Miles Value Foundation Past President, SAVE International President, Advanced Value Group, LLC 9 Conference Programme Junior Ballroom I-II, Level 3, Royal Plaza Hotel Friday, 8 May 2015 Day Chairperson: Ms. Emma HARVEY Time Programme 08:30 – 09:00 Registration 09:00 – 09:15 Conference Opening Guest of Honour: Ir. Dr. Christopher TO Executive Director, Construction Industry Council, Hong Kong 09:15 – 10:00 Keynote Presentation New Trends in the Value Methodology Mr. James D. BOLTON President and Owner, Bolton Value Consulting, LLC President, SAVE International®, USA 10:00 – 11:15 Western & Eastern VM Applications Design Optimization via Value Management Mr. Anthony WILSON Past President, The Hong Kong Institute of Value Management, Hong Kong Value Management: An Effective Innovation Management Tool for Strategic Management of Technology in the Services Sector – Case of a VTI Dr. Arif SIKANDER Lecturer Management, School of Management and Governance, Murdoch University, Australia Discovering Values with the Design for Value Model and Reflection on a VE-Study for a Shipping Company Mr. Hein B.A. de JONG Partner, Value FM Value Engineers, The Netherlands Discussion 11:15 – 11:30 Tea Break 11:30 – 12:45 Explore Specific VM Knowledge New Movement of VA/VE in Japan Mr. Hisaya YOKOTA President and Chief Executive Officer, Functional Approach Institute Company Limited, Japan Using FAST as a Knowledge Management Tool on Fall Risk Assessment of Advanced Shoring Bridge Construction Project Using Bayesian Network Transferring from Fault Tree Analysis Dr. Po-yi CHANG General Manager, Marcus Consultant Company Ltd, Taiwan The Importance of the “As-Is” and “Should-Be” Function Analysis in VA/VE Projects Dr. Marc PAUWELS Co-President, Krehl & Partner, Germany Discussion 12:45 – 14:00 Lunch 14:00 – 14:30 Keynote Presentation Value Management - Getting the Best Value for Money Ir. Hung-leung CHENG Assistant Director / Projects and Development, Drainage Services Department, The Government of the HKSAR 14:30 – 15:30 VM in Asian Countries Case Analysis for Determining the Characteristics of Value Engineering in the Pre-Design Phase Mr. Hyun-jong LEE Department of Architectural Engineering, University of Seoul, Korea Think Big or Think Small? Property Developers’ Attitudes towards Value Management Ir. David YAU Director of Operations Department, Vanke Property (HK) Co. Ltd., Hong Kong Enhancing Value in Public Construction Projects: The Malaysian Journey Mr. Zuhaili MOHAMAD RAMLY Department of Quantity Surveying, Universiti Teknologi Malaysia, Malaysia Discussion 15:30 – 15:45 Tea Break 15:45 – 17:00 Discovering Hidden Values by VM Applying the Value Index to Identify the Best Care and Attention Homes for the Elderly Mr. Qi LIANG Department of Architecture and Civil Engineering, City University of Hong Kong, Hong Kong Evaluation Techniques of the Esteem Function Ms. Kayo UCHIDA Senior Researcher, Functional Approach Institute Company, Japan How to Deal with a Multitude of Ideas at the Evaluation Phase in a VE Project Mr. Sebastian MEINDL Co-President, Krehl & Partner, Germany 17:00 10 Discussion Closing of Day 1 Programme Conference Programme Junior Ballroom I-II, Level 3, Royal Plaza Hotel Saturday, 9 May 2015 Day Chairperson: Mr. James D. BOLTON Time Programme 08:30 – 09:00 Registration 09:00 – 10:00 Keynote Presentation Upholding Hong Kong Housing Authority's Core Values : Caring, Customer-Focused, Creative, Committed Ms. Ada FUNG, JP Deputy Director of Housing (Development & Construction), Hong Kong Housing Authority, Hong Kong 10:00 –11:00 VM in Public Engagement Value Engineering (VE) Application in Malaysian Public Construction Projects: Quantifying the Involvement of VE Study Application in Project Management (PM) Knowledge Areas Ir. Mukhzani ABD LATIF Senior Assistant Director, Value Management & Partnering Unit, Complex Project Management Branch, Public Works Department Malaysia, Malaysia Value Management – An Innovative Way to Solve the Conflict in Public Engagement Dr. Jingyu YU Lecturer, School of Civil Engineering, Hefei University of Technology, China Discussion 11:00 – 11:15 Tea Break 11:15 – 12:30 Innovative VM Techniques Reduction of Manufacturing Cost and Production Lead Time by Using the VE Methodology Consequently Mr. Axel Peter RIED, R.I.P. CEO, Ried Management Methods, Germany Innovation Project Acceptance in an Emerging Market City Dr. Yann TRUONG Associate Professor of Marketing and Strategy, ESC Rennes School of Business, France An Web-Based System, iVMi, for Function Analysis among Oversea Team Members Dr. Mei-yung LEUNG Associate Professor, Department of Architecture and Civil Engineering, City University of Hong Kong, Hong Kong Use VA/VE on Online to Offline (O2O) Cloud Learning Services Study - with an Example of Xtiveco Cloud and App Mr. Ta-ming CHANG Founder & CEO, ActiveBrainCapacityTech-Learning and Performance Inc., Taiwan Discussion 12:30 – 13:45 Lunch 13:45 – 14:45 Key Successful Factors in VM Workshop The What Why and How of the Value Methodology Prof. Geoffrey Q.P. SHEN Chair Professor of Construction Management and Associate Dean of Faculty of Construction and Environment, Department of Building and Real Estate, The Hong Kong Polytechnic University, Hong Kong TEAM – Nucleus of Value Methodology Mr. Anil Kumar MUKHOPADHYAYA Administrator, INVEST Certification Board, India Discussion 14:45 – 15:00 Tea Break 15:00 – 15:50 New Direction of VM Internationally Functional Approach as a Valuable Way of Collaboration between Japanese Style Grass-Roots Innovation and that of Developing Countries Dr. Manabu SAWAGUCHI Professor, Department of Business Design and Management, Waseda University, Japan Exploring Possibilities and Creating Sustaining Solutions, but which Approach to VM Should I Use? Mr. Martyn R. PHILLIPS Management Consultant, The Team Focus Consulting Group, Canada Discussion 15:50 – 16:35 International Panel: VM Evolution for Project Enhancement – Past, Present & Future Mr. James D. BOLTON (USA) Dr. Mei-yung LEUNG (Hong Kong) Prof. Geoffrey Q.P. SHEN (Hong Kong) Mr. Anthony WILSON (Hong Kong) and some other panellists 16:35 – 16:45 Conference Closing 18:00 – 20:30 Conference Dinner (By invitation and registration) Venue: Shanghai Min (Moko in Mong Kok) 11 Day Chairpersons Ms. Emma HARVEY Mr. James D. BOLTON Senior Associate Director, Head of Environment, Atkins, Hong Kong PE, CVS-Life, PVM, FSAVE President and Owner, Bolton Value Consulting, LLC President, SAVE International®, USA Emma has around 20 years' experience in the design and consultancy industry in Asia Pacific. She has a background in environmental consulting and qualified as a Value Management Facilitator in 2003. She has undertaken value management and risk management exercises on complex rail, civil engineering, industrial and building projects in Hong Kong, Mainland China, Johannesburg and Dubai. She was a Council Member of the HKIVM in 2004 and 2005 before moving to Shanghai where she worked until 2012. She was then transferred to Ho Chi Minh City for 2 years and returned to Hong Kong in 2014. 12 Jim BOLTON is a Certified Value Specialist-Life (CVSLife), a Professional in Value Management (PVM), a Fellow of SAVE International (FSAVE), and currently the President of SAVE International®. He is employed as President of Bolton Value Consulting, LLC (www. boltonvalueconsulting.com) established in August 2014 to support organizations whom are interested in improving the value they deliver to their customers. Previously, Jim was the Design for Value Global Lead for Whirlpool Corporation where he developed a global Value Engineering and Design for Manufacturing and Assembly process within that corporation which was embedded into their Product Development Process globally. He has conducted numerous Module I Workshops globally where he was the advisor and mentor for over 300 certified AVS practitioners and where he developed a professional team of Regional Value Managers in every region where Whirlpool conducts business. Jim was elected as President of SAVE International® in June 2013 after completing several previous 2-year assignments as Executive Vice President, Vice President of Global Affairs, and Vice President of Manufacturing for SAVE International. In addition, Jim served as a Director on the Miles Value Foundation from 2004-2009 and is a co-author of the Value Methodology Memory Jogger which is the Body of Knowledge for SAVE International®. Keynote Speaker and Abstract Mr. James D. BOLTON PE, CVS-Life, PVM, FSAVE President and Owner, Bolton Value Consulting, LLC President, SAVE International®, USA Jim BOLTON is a Certified Value Specialist-Life (CVS-Life), a Professional in Value Management (PVM), a Fellow of SAVE International (FSAVE), and currently the President of SAVE International®. He is employed as President of Bolton Value Consulting, LLC (www.boltonvalueconsulting.com) established in August 2014 to support organizations whom are interested in improving the value they deliver to their customers. Previously, Jim was the Design for Value Global Lead for Whirlpool Corporation where he developed a global Value Engineering and Design for Manufacturing and Assembly process within that corporation which was embedded into their Product Development Process globally. He has conducted numerous Module I Workshops globally where he was the advisor and mentor for over 300 certified AVS practitioners and where he developed a professional team of Regional Value Managers in every region where Whirlpool conducts business. Jim was elected as President of SAVE International® in June 2013 after completing several previous 2-year assignments as Executive Vice President, Vice President of Global Affairs, and Vice President of Manufacturing for SAVE International. In addition, Jim served as a Director on the Miles Value Foundation from 2004-2009 and is a co-author of the Value Methodology Memory Jogger which is the Body of Knowledge for SAVE International®. Keynote Presentation (Friday, 8 May 2015, 09:15-10:00) New Trends in the Value Methodology Over the years, many organizations have tried to find the secret tool to enhance value for their customers or clients and at the same time, retain the maximum earnings for the organization. They have tried Lean (sometimes called Lean Manufacturing or Lean Design), Classical Six Sigma, Design for Six Sigma, Design for Manufacturing and Assembly (DFMA), the Theory of Inventive Problem Solving (commonly called TRIZ), the Value Methodology (also called Value Analysis, Value Engineering or Value Management) and others. These organizations tend to start using a tool and after a few years when the success rate to accomplish their goals starts to decline, they start looking for the next most promising tool to financially revive their struggling organization. Few organizations today, have successfully been able to utilize many of these tools simultaneously in a winning combination to bring optimum success to their organization. This may be in part to the fact that they either didn’t have the right internally trained personnel with the right knowledge to develop such a combined program, or they depended upon an organization to come in and train them only on a new tool vs. training them on how to utilize that new tool with their existing tools. The purpose of this presentation will be to give a brief summary of the tools mentioned above, how they actually complement each other, and how they may be combined to ensure any organization receives the maximum value for their customers and clients. Some results from an organization that has been able to successfully combine at least four of these five major tools sets above will be shared. If your organization could use a financial boost to deliver improve results and improved customer or client value compared to your competition, then you will not want to miss this presentation. 13 Keynote Speaker and Abstract Ir. Hung-leung CHENG Assistant Director / Projects and Development, Drainage Services Department, The Government of the Hong Kong Special Administrative Region Ir. CHENG is a civil engineer by profession. He joined the Drainage Services Department in March 2011 and is currently the Assistant Director / Projects and Development of Drainage Services Department overseeing the development and implementation of capital works drainage and sewerage projects. After graduation from the University of Hong Kong in 1979, he received his engineering training in the then Public Works Department of the HKSARG. He was posted to the Transport Department (TD) and obtained his professional qualification in 1982. Since then, he had worked with TD for almost 30 years and was mainly involved in road safety and district traffic management work. Keynote Presentation (Friday, 8 May 2015, 14:00-14:30) Value Management - Getting the Best Value for Money Value Management (VM) in Hong Kong started in the 1990s. In 1996, a new Government Policy initiative was introduced, which stated that “we will improve value‐for‐money in public works contracts by undertaking VM studies on major public works projects to eliminate unnecessary costs while maintaining the necessary functions, quality and performance of the end products.” In 1998, a Steering Committee on VM was set up within the Works Departments issued the first Technical Circular advocating the use of the VM tool in public works projects. The current policy on the use of VM in public works projects requires that VM studies should be conducted for every major project with an estimated project cost exceeding HK$200 million (US$25.6 million). The Drainage Services Department (DSD) is one of the Works Departments undertaking VM studies to get the best value for money in the implementation of infrastructure projects. It echoes with the vision of DSD to provide worldclass wastewater and stormwater drainage services enabling the sustainable development of Hong Kong. DSD aims to improve these services in a cost-effective and environmentally responsible manner. In the past three years, DSD conducted VM workshops for ten sewerage and drainage projects during various stages and the total project cost reaches HK$38 billion (US$4.9 billion). The presentation shall share the results on the use of VM workshops as a tool to achieve the objective of getting value for money in some sewerage and drainage projects, and the benefits in terms of time, cost, quality of design solutions and promotion of innovation, etc. gained under the VM process. 14 Keynote Speaker and Abstract Ms. Ada FUNG, JP Registered Architect, FHKIA, RIBA, ASC, ACIArb, FCIOB, Hon FHKIPM, Hon FHKIBIM, Hon MHKCAC, FCInstCES, MHIREA, BEAM, Professional, APEC Architect, CGB(HK) Deputy Director of Housing (Development & Construction), Hong Kong Housing Authority, Hong Kong Ms. Ada FUNG, JP is an Architect by profession. She is an active member in the Architectural field as well as in the construction industry in Hong Kong. *O IFS DBSFFS BT %FQVUZ %JSFDUPS PG )PVTJOH TIF TVQFSWJTFT UIF %FWFMPQNFOU $POTUSVDUJPO %JWJTJPO PG UIF Housing Department, overseeing all facets of public housing development work in Hong Kong. Her duties cover project management, planning, design and contract management, as well as establishing operational policies on procurement, design, construction, quality, performance assessment, dispute resolution, research and development, safety and the environment. She also promotes partnering, value management, risk management, ethical integrity, site safety, corporate social responsibility, sustainable development, community engagement, green building and Building Information Modeling and product certification in the industry. She is the Immediate Past President of the Hong Kong Institute of Architects (2013 - 2014), Chairperson of the APEC Architect Monitoring Committee of Hong Kong (2012/13 - 2015/16), and past Chairperson of the Architects Registration Board (2010/11 - 2011/12). Keynote Presentation (Saturday, 9 May 2015, 09:00-10:00) Upholding Hong Kong Housing Authority's Core Values: Caring, Customer-Focused, Creative, Committed Through her speech on “Upholding Hong Kong Housing Authority’s Core Values: Caring, Customer-focused, Creative, Committed”, Ms. Fung will provide an overview of the caring culture adopted by Hong Kong Housing Authority (HA) in the life cycle of public housing development – from the caring of tenants, environment and workers, focusing on customers’ need, being creative with professional and technological input, to the commitment on sustainability and best value for society. The HA develops and implements a public housing programme to provide subsidized housing for people who cannot afford private housing. To cope with public demand, HA has been carrying out the vital task of producing large quantities of affordable quality public housing. The HA plans, designs, builds, manages and maintains different types of public housing in a high-rise, high density urban compact city, creating sustainable communities for humble citizens. To cope with sharp increase in production quantum and a host of complexities in terms of technical, legal, social, environmental and economic aspects for almost all new housing sites, HA has strong motivation in adopting innovative solutions to solve problems, delivering the quality and quantity of public housing under very tight resources, and embracing a people-centric approach throughout all stages of work. Safety and health for workforce, engaging the community in design, partnering with stakeholders are emphasized in the project management framework. The early engagement of community in the planning and design stage helps foster better understanding of essential functional requirements of each project, enabling us to provide a safe, green and healthy living environment for people of all ages and abilities in a harmonious society. Residents’ concerns, noise protection, passive design and social cohesion have been fully incorporated in the planning and design of estates. The use of innovative design and construction methodology further enhances the buildability and serviceability of public housing estates. Effective adoption of partnering and value management throughout all job stages has given rise to high customer satisfaction on the product whilst stakeholders interests are taken care of. Best value for money is secured with product quality and contented tenants. 15 Abstracts of Paper Presenters Friday, 8 May 2015 (10:00 – 11:15) Western & Eastern VM Applications Mr. Anthony WILSON Dr. Arif SIKANDER Past President, Hong Kong Institute of Value Management, Hong Kong Lecturer Management, School of Management and Governance, Murdoch University, Australia Tony worked as an architect in the private sector in the UK and Libya before coming to Hong Kong in 1981. He joined the HK Government and worked on all types of projects. He trained in VM in Australia under Roy Barton and continued the good work of Tony Toy to keep VM going in Hong Kong. He worked with AECOM on site at Ocean Park and then latterly with a developer, Chinachem Agencies. Now he provides free services for Sunbeam Children's Charity and does occasional consultancy work on systems and environmental advice. Design Optimization via Value Management What is it that you need to have at the start of the project to achieve a satisfactory conclusion? This is a fundamental question which needs to be asked often time and time again throughout the design process. The first inkling of a project is an idea. Someone, or a group, starts the whole process in motion. The expectations of the person/persons are often unclear; therefore to address this normally a Client Project Brief is produced. This is the best time to use Value Management (VM) to work with the Client to produce a document which clearly communicates and sets out the framework for the future. Once the design process commences, there are many new members of the design team working to produce the project. Sometimes the client team increases to include many end users who all have a say in the process. The feasibility design is produced, followed by scheme design, final design then detail design and documentation. Each stage should be carefully documented and ratified to make sure that the content is correct, on time and within budget. VM is the perfect way to do this. Things will not be perfect because there are many variables that come into play. A change of leader, new regulations, a change of scope, a budget problem, unforeseen site or political conditions are all typical examples of things that can occur to send designs into difficulty. The typical design process will be covered with a view to explaining the different viewpoints of the team and how VM can help them achieve a better final team orientated result. 16 Dr. Arif Sikander has an international experience in aviation, engineering, entrepreneurship and innovation, strategic technology management, value engineering, training, lecturing, business planning and H.R.M. He has a unique and rich combination of qualifications in engineering, business administration and education, holding a Master Degree in each. His PhD relates to strategic management of technology and innovation (STM). Dr. Arif has worked as an aircraft engineer in various countries of the world, and has taught aviation engineering, strategic management and engineering management in Brunei, UAE and Australia. He is currently at Murdoch University Australia and involved in teaching and research. Value Management: An Effective Innovation Management Tool for Strategic Management of Technology in the Services Sector - Case of a VTI The concept of Strategic technology management (STM) places technology in a strategic context. Value Management (VM) has assumed an important role in providing leadership and strategic growth to technology firms. Historically VM emphasized use of alternatives to reduce cost, promote innovation and enhance the performance of products. VM has moved beyond manufacturing and can be applied for strategic decision making in the services sector. It is envisaged the VM can be an effective tool for STM. A study conducted by the author in the East, revealed that the performance of firms is influenced by the type of strategies developed during the VM process. This result provided the motivation to explore if such strategies are relevant to the managers of the “services” sector and if their performance too is influenced by these adoptions. The results could contribute to the literature/management in developing a set of VM strategies which could be termed as “global” and applied to any sector and those termed as “unique” which are specific to firm/service sector. This paper attempts to present the results on that part of the study which deals with the relationship between the type of the managers/management (gender, qualification, age etc) and the application of developed strategies. A pilot-study undertaken in a SEA country, helped to refine the questionnaire before it was administered. The study sets the tone to open up discussions and research interest towards applying VM tools in the strategic management of technology in the education sector in a rapidly growing digital world. The type of managers/management revealed as part of this study has implications to the senior planners in the education sector in keeping pace with the technology age by providing valuable inputs to innovate, discover, evaluate and develop strategies to provide value to the stakeholders, decision makers and technology lecturers. Abstracts of Paper Presenters Friday, 8 May 2015 (11:30 – 12:45) ([SORUH6SHFLîF90.QRZOHGJH Mr. Hein B.A. de JONG Mr. Hisaya YOKOTA Partner, Value FM Value Engineers, The Netherlands 3UHVLGHQWDQG&KLHI([HFXWLYH2IîFHU Functional Approach Institute Company Limited, Japan Hein B.A. de Jong applies and facilitates Value Engineering in projects that require investments, using his knowledge of Systems Engineering, Contracting, Business Engineering and Knowledge Management. He has been working since 2010 for Value FM, the first independent Dutch Value Engineering Consultancy and 20 years before that as system engineer and project manager. Becoming and being a full time value manager now, is for Hein a logical consequence of his competences, experiences in engineering, project management and interests. Hein aims for good teamwork and integral design to achieve operational excellence, beauty, and profit, in all project phases from initiation, design, execution up to delivery. Discovering Values with the Design for 9DOXH0RGHODQG5HïHFWLRQRQD9(6WXG\ for a Shipping Company This article tells another amazing story of a value engineering study. It describes how the study is designed with help of the Design for Value model®, and shows its application in a VE-study for a shipping company. The key success drivers are generic and commonly known for successes of value engineering: sharing information, analysing functions, mutual understanding, group wise idea generation, iterative designing, and formulation of the next actions. The area of application and scale of this case are somewhat unusual: how can four ministries and a shipping company optimise the utilization of their 12 sea vessels and reduce that number? In the mean while some reorganisations occur and needs are changing rapidly in the coming years (e.g. internet, international databases, GPS controlled vessels). The study is shaped with the "design for value model", addressing topics that hide values until they are exposed: insight, organisation, and design. It resulted in some well-prepared VE-workshops in which participants (50 in this case) discover how to reduce the number of ships while improving performance for their business. The solution is found in cooperation, clever planning, time sharing and multipurpose vessels, reducing the need from 12 to 7 vessels in the coming years. That is a remarkable result! Hisaya Yokota is a Certified Value Specialist both by the SAVE International, USA and by the Society of Japanese Value Engineering and also is a Professional Engineer, Japan (P.E.Jp), certified by the Institution of Professional Engineers, Japan. He has been a leading VE Consultant over the past 18 years, having promoted the application of Design-phased VE to public works projects for the Ministry of Land, Infrastructure, Transport and Tourism, the Urban Renaissance Agency, Prefectures, Cities, Towns, and Villages, etc. He has conducted approximately 90 Design-phased VE Studies, creating a total savings of about 200 billion JPY in cost reductions. In 2010, after having worked as Director of the Value Engineering Center at Pacific Consultants Company Limited, he started the Functional Approach Institute Company Limited in Tokyo where as President and Chief Executive Officer, he offers business management strategies, project consulting services, and VE education. New Movement of VA/VE in Japan In Japan, VA/VE have gradually expanded their scope of application into many other industries from the traditional manufacturing and construction industry: particularly noteworthy is their application to the service industry. The main reason for this trend lies in the fact that Japan’s chief industries have become increasingly more service oriented, rather than manufacturing oriented. In fact, today’s Japan has seen its industrial structure become remarkably different from 50 years ago: currently, the service industry accounts for 65 percent of Japan’s GDP. In Japan today, it is the normal business practice in the service industry to apply VA/VE, just as the manufacturing industry did 50 years ago. In this paper, the author, as a leading expert, describes VA/VE application in the Japanese service industry – their current status, differences in their application between service and products, and four movements, respectively. 17 Abstracts of Paper Presenters Dr. Po-yi CHANG Dr. Marc PAUWELS General Manager, Marcus Consultant Company Ltd, Taiwan Co-President, Krehl & Partner, Germany Po-yi Chang, CVS LIFE, is the Asisan Cinference Director, SAVE Board Director of VMIT,. General Manager of Marcus Consultant Company. Dr. Chang graduated from Ohio State University BOEIPMEB1I%GSPN/BUJPOBM:VOMJO6OJWFSTJUZPG4DJFODF Technology . He is currently an assitant professor of National Chia Tung University and the 1st CVS who opens MOD I and QSPNPUFT 7& 53*; BQQMJDBUJPO BU 6OJWFSTJUJFT JO5BJXBO Dr. Chang has substanrially saved over 340 millions USD on the public works in Taiwan. He promoted VE methodology since 1992. Besides VE practices in Taiwan, Dr. Chang also conducted MOD I training for Abu Dahbi Policy, UAE and once served as the VM facilator for CP2M, Department of Finance, Singapore. He is certified as CVS by Certification Board, SAVE International in 1998. Using FAST as a Knowledge Management Tool on Fall Risk Assessment of Advanced Shoring Bridge Construction Project Using Bayesian Network Transferring from Fault Tree Analysis Functional Analysis Systematic Technique (FAST ), is an important knowledge management (KM) tool in Value engineering workshop. Accidents of bridge construction usually bring serious causalities. Among them, Fall is most common during bridge construction. Currently safety management on site is mainly relied on assessment of check tables. Yet, the assessment result is influenced by the ability and experience of the evaluator and not possible to achieve consistent and systematic assessment objective. Moreover, most critical factors that can prevent occurrence of accidents cannot be found from exiting safety management and assessment methods. This paper firstly applied Fault Tree (FT ) to explore systematically factors of fall occurrence during bridge construc tion and by top - down hierarchy analysis to understand the relationships of fall causes. Afterwards, a Bayesian Network, (BN) model is built by converting Fault Tree to assess the fall risk of bridge construction projects. Analyzing causes and the relationships of causes by BN to collect probability before event and calculate the probability of the entire event. Using the model to analyze and validate with the current bridge projects under construction, the results show that the results from Bayesian Network is consistent with conventional labor safety performance assessment. Therefore the ability to manage site safety of the model is proven. By improving assessment and understanding of the fall risk probability during construction, an appropriate prevention safety measurement strategy can be established and allocate resources on critical labor safety operations in early stage. The occurrence of bridge construction fall, casualty and financial loss thus can be reduced. Finally, we try to use FAST as a KM tool to integrate the results for future VE workshops. 18 %S.BSD1BVXFMTJTDPQSFTJEFOUPG,SFIM1BSUOFSJO(FSNBOZ the leading Value Management Consultant company in Germany. Since his start with VA/VE/VM in 1993, Dr. Pauwels performed hundreds of VM-related studies in Germany, whole Europe, USA, Mexico, Singapore, Saudi-Arabia and China and trained personally thousands of future VA/VE-specialists. In parallel to his work and since more than 14 years, Dr. Pauwels is president of the German Value Management Society, where he is – for instance - responsible for the development of technical guidelines and the annual German Conference of VA/VE. Dr. Pauwels holds the European Certificates of Professional for Value Management and Trainer for Value Management as well as the CVS certificate. He is a certified trainer for VM1 – VM3 and the MOD 1. The Importance of the “As-Is” and “ShouldBe” Function Analysis in VA/VE Projects The importance of Function Analysis in VA/VE workshops and projects has not to be explained to the VA/VE practitioners: it is clear. Getting rid of focusing on existing solutions of a product or process and focusing on its functions is essential in developing and optimizing products or processes. Over the 20 years of experience in VA/VE projects and having a deep insight into numerous performed VA/VE studies, the author has recognized that a lot of facilitators only focus on the “as-is” functions and as a consequence only on the “asis” functional cost. Unfortunately, with this procedure a very valuable part of function analysis is lost. The chance of getting the most optimized result is decreased. This paper wants to share the experience of using Function Analysis in its full functionality: “as-is” and “should-be”. What are the possibilities to define the “should-be” functional cost and what is the value for the project of having done this exercise? Abstracts of Paper Presenters Friday, 8 May 2015 (14:30 – 15:30) VM in Asian Countries Mr. Hyun-jong LEE Ir. David YAU Department of Architectural Engineering, University of Seoul, Korea Director of Operations Department, Vanke Property (HK) Co. Ltd., Hong Kong Case Analysis for Determining the Characteristics of Value Engineering in the Pre-Design Phase The earlier application of value engineering (VE) in project life cycle brings greater chance of improving its value. However, VE has generally been applied after schematic design phase due to the limitations of the early stage such as the lack of available information, the absence of formal VE process for planning/ schematic design phase, and so on. In order to establish the methodology for the practical pre-design phase VE, identifying the characteristics of the VE in pre-design phase is required through the actual VE application case performed in early stage. Thus, in this study, the actual VE case which was applied in pre-design phase is analyzed. The case was performed using Eco-Value Engineering Support System (EVE)1 which was built based on the existing design VE methodology. Through the case analysis, the characteristics of VE in pre-design phase are identified. The characteristics of VE application in pre-design phase proposed in this paper would be useful as the base data for the related research of VE application in early stage. In addition, it could be helpful to establish the VE methodology for pre-design phase. David is a chartered civil engineer with over 28 years’ experience in construction and project management in UK, HK and China. He is Director of Operations Department with Vanke Property (Hong Kong) Co. Ltd. to develop their Hong Kong and Singapore development portfolios. David is a Past President of HKIVM and currently is actively serving as: − Chairman of buildingSMART HK − Director of BEAM Society Limited − Professional Development Committee of BEAM Society − HKGBC’s BEAM Faculty − Reviews Standard Panel for ICE Chartered Professional Reviews − Assessment and Examination Committee of HKIBIM Previously, he also sat in several steering committees in studies conducted by Hong Kong Government’s Buildings Department, Electrical and Mechanical Services Department, Construction Industry Council (CIC). His other activities include: − Chairman of Waste Management Subgroup to Business Environment Council (2013) − CIC Task Force and Working Group on the Roadmap for BIM Implementation in HK (2013-2014) − Past Chairman of Autodesk Industries Advisory Board (20112013) Think Big or Think Small? Property Developers’ Attitudes towards Value Management Value Management is a structured, systematic and analytical process which seeks to achieve value for money by providing all the necessary functions at the lowest total cost consistent with required levels of quality and performance. To force clearcut and specific thinking, the Value Engineering Function Definition Technique requires that the functions of items being studied be defined by two words... an Active Verb and a Measurable Noun. From these, VM has been applied in projects of different developers. The author looks at case studies of how one developer may use VM at the initial and design stages of their developments to redefine the scope and save money and time by “thinking big”. Whilst another developer may be “thinking small” and concentrate on their product to provide an apartment fitting out cost limited to RMB 555 per square metre. However, considering the need to deliver about 160,000 units in 2015, the quality assurance, cost savings and benefits to customers are greatly amplified. 19 Abstracts of Paper Presenters Friday, 8 May 2015 (15:45 – 17:00) 'LVFRYHULQJ+LGGHQ9DOXHVE\90 Mr. Zuhaili MOHAMAD RAMLY Mr. Qi LIANG Department of Quantity Surveying, Universiti Teknologi Malaysia, Malaysia Department of Architecture and Civil Engineering, City University of Hong Kong, Hong Kong Zuhaili MOHAMAD RAMLY is a Ph.D. candidate at the Department of Building and Real Estate, The Hong Kong Polytechnic Universit y and an academic member of the Department of Quantity Surveying, Faculty of Built Environment, Universiti Teknologi Malaysia (UTM). He holds bachelor degree in quantity surveying and master degree in construction contract, both from UTM. He has been involved in teaching and professional training in the field of construction project management since 2008 in UTM and also other government agencies, client’s organizations and contractors. Prior joining UTM, he works in private sector with quantity surveying and construction cost consultant and has been involved in numbers of public and private projects. His area of interest is on value engineering and management, construction contract and procurement and organizational performance. His current doctoral research focuses on the performance management of value management implementation in the construction industry. Enhancing Value in Public Construction Projects: The Malaysian Journey There is a strong demand to improve the capacity and effectiveness of the construction industry. The evidence suggests that VM has become a powerful management tool to identify the best options for achieving a greater value for money. The issuance of EPU Circular No.3 in 2009 imposed mandatory VM as a management tool to achieve value for money for public projects amounting MYR 50 million and above. The purpose of this paper is to unveil the journey in institutionalizing VM in planning and implementation of public construction projects in Malaysia, with emphasis on exploring the achievements of VM workshops. Content analysis was conducted to investigate the level of applications, supported by case studies into five workshops. The case studies involved observations and semi-structured interviews with various stakeholders. To date, a total of 268 VA workshops were conducted, with the total estimated cost of MYR 70 billion for various projects such as healthcare, educational, industrial, and recreational. Next, the paper discusses three major aspects of the workshop’s outputs; the gross floor area model, the cost model, and the efficiency model. The outputs represent the optimization and value added achieved by the VA workshops to increase the likelihood of delivering values into public construction projects. The findings presented in this paper not only shed light on the current development of the VM applications but also provide the benchmarking data to improve future VM workshops. 20 Mr. LIANG has received his Bachelor ’s degree in Civil Engineering at the Southwest Jiaotong University in China, Master degree in Construction Project Management at City University of Hong Kong (CityU), and is currently undertaking his Ph.D. study at CityU. Mr. LIANG focuses his research on value management and cost management since his Master study, and has published several international publications on journal and conference. Mr. LIANG also has amassed practical experience. He has completed Value Management (VM) Module I and Module II training, and becomes an Associated Value Specialist (AVS) of the SAVE International. In addition, Mr. LIANG is the council member of Hong Kong Institute of Value Management (HKIVM), member and Assistant Secretary of Institute of Safety and Health Practitioners (ISHP), and committee member in Novus Group of Charted Institute of Building’s (Hong Kong branch). Applying the Value Index to Identify the Best Care and Attention Homes for the Elderly $BSFBOE"UUFOUJPO$" )PNFJTUIFNBKPSSFTJEFOUJBMDBSF service provider in Hong Kong for frail elderly persons. The FOWJSPONFOU PG UIF $" )PNF DBO BGGFDU JUT PDDVQBOUT wellbeing and quality of life (QoL). However, it is difficult for B$")PNFUPCFCPUIDPTUFGGFDUJWFBOEFGGJDJFOUJOUFSNT of ensuring high QoL. This paper sets out to identify the best $")PNFUISPVHILOPXMFEHFPGWBMVFNBOBHFNFOU5XP EJGGFSFOUUZQFTPG$")PNFTXFSFTUVEJFEBTXFMMBTUIFJS design, life cycle cost data, functions, value, and so forth. The GJOEJOHTTIPXUIBUUIFCBTJD$")PNFIBTBMPXFSDPTUQFS PDDVQBOUQFSNPOUIUIBOUIFJEFBM$")PNFBOEUIFJEFBM $")PNFIBEIJHIFS2P-TDPSFTJOBMMBTQFDUTFYDFQUTBGFUZ #ZDBMDVMBUJOHUIFWBMVFJOEFYXFGPVOEUIBUUIFCBTJD$" )PNF IBT B IJHIFS WBMVF JOEFY UIBO UIF JEFBM $" )PNF 5PPCUBJOUIFCFTU$")PNFUIFWBMVFJOEFYXBTVTFEUP JNQSPWFUIFEFTJHOPGUIFJEFBM$")PNFCZJEFOUJGZJOHUIF optimal number of maximum occupancy. Abstracts of Paper Presenters Ms. Kayo UCHIDA Mr. Sebastian MEINDL Senior Researcher, Functional Approach Institute Company, Japan Co-President, Krehl & Partner, Germany Kayo Uchida holds a Bachelor of Dental Science from Tokyo Medical and Dental University, Japan. She currently works as a dental hygienist and smile trainer. As a smile trainer, she has conducted numerous lectures and seminars throughout Japan, including the one for Ms. Universe Japan. She has also made many appearances on Japanese TV programs and in Japanese magazines-most notably, the one on the Japan Broadcasting Corporation’s TV program: Magic to be beautiful. Meanwhile, as a freelance dental hygienist, she has provided consultations for dental clinics throughout Japan. At the Functional Approach Institute Company Limited, she serves as a Functional Approach Consultant, applying VE to the dental industry for its improvement. Evaluation Techniques of the Esteem Function In this paper, the author shows several methods for analysis and evaluation of Esteem Functions and their incorporation into VE job plans. The author has developed a new evaluation method for Esteem Functions by building on the existing Sense VE, which has been practiced widely in Japan. So far, the author has found it difficult to deal with Esteem Functions: Unlike Use Functions, Esteem Functions cannot be quantified. The author has introduced original graphs as vital tools for familiarizing various industries with VE. The graphs shown in this paper will go a long way to applying VE to such fields as medicine and service, which commonly deal with Esteem Functions. Recently, VE has been applied to the non-manufacturing industries. However, VE has yet to be applied to the service sector. To let VE crack the confinement of manufacturing and get stages in the medicine and service sectors, it is essential to establish steady study, standardization, and evaluation methods for Esteem Functions. 4FCBTUJBO.FJOEMJTQSFTJEFOUPG,SFIM1BSUOFSJO(FSNBOZ a Value Management Consultant company that was founded in 1969 by Hermann Krehl, who is called the “German Father of Value Engineering”. Sebastian Meindl got in contact with VA/VE during his studies of mechanical engineering at the University of Siegen. After his studies he continued his work as research associate and did research on the methodology on mechanical design, mechatronics and computer aided techniques in mechanical engineering. In 2004, he joined Krehl 1BSUOFSBOETJODFIFJTPOFPGJUTQSFTJEFOUT*OQBSBMMFM to his work, Sebastian Meindl is also engaged at the German Value Management Society by working in several boards. He is also vice president of the Alumni Club of the department of mechanical engineering at the University of Siegen. Sebastian Meindl holds the European Certificates of Professional for Value Management and Trainer for Value Management. How to Deal with a Multitude of Ideas at the Evaluation Phase in a VE Project It is clear that Value Analysis and Value Engineering are the top methods in order to improve value of products and processes. Functional analysis delivers the gap between the ideal “shouldbe”-situation and the flawed “as-is”-situation. Showing this gap is crucial for finding hundreds of ideas. But a long list of ideas is not equal with a successful VA/VEproject. The “right” ideas have to be combined to feasible concepts. The value impact of those concepts can then be precisely predicted as well as the implementation efforts. This project stage is crucial to make the right suggestion for management decisions. In this paper, an approach to solve the problems with many ideas and actions, their value impacts and the way to condense the right ideas to a conclusive and feasible package of solutions is shown. Additionally, some substantial criteria in order to evaluate ideas and concepts will be discussed. The implementation of computer aided tools in order to support this project phase will be shown as well. This paper wants to share the experience of using the evaluation phase as part of the concept phase in order to show possible criteria, the procedure and substantiates the statements with practical examples. 21 Abstracts of Paper Presenters Saturday, 9 May 2015 (10:00 – 11:00) 90LQ3XEOLF(QJDJHPHQW Ir. Mukhzani ABD LATIF Dr. Jingyu YU Senior Assistant Director, Value Management & Partnering Unit, Complex Project Management Branch, Public Works Development Malaysia, Malaysia Lecturer, School of Civil Engineering, Hefei University of Technology, China Ir. Mukhzani Abd Latif is a Civil Engineer in Public Works Depar tment (PWD), Malaysia with the majority of his experiences is on roads and infrastruc ture’s projec t implementation. He graduated from Technology University of Malaysia (UTM) with Bachelor of Engineering (Civil) in 2001. Later in 2009, he furthers his study in Master of Project Management from the same University, with master project titled Establishment of Value Management Framework for Implementation in PWD, Malaysia Construction Projects. Since the establishment of Value Management Unit in PWD, Malaysia in 2011, he has involved in developing VM framework, work process towards institutionalizing VM in the organization, and facilitated several Value Engineering (VE) Studies for public construction projects. He is registered member of Board of Engineer Malaysia (BEM) and Institute of Value Management Malaysia (IVMM). Value Engineering (VE) Application in Malaysian Public Construction Projects: Quantifying the Involvement of VE Study Application in Project Management (PM) Knowledge Areas Application of Value Engineering (VE) does improves project management performance, and improves project value in significant perspectives, not limited to the traditional focus areas of time, cost and quality. However, the extensiveness of VE involvement in project performance has yet to be quantified. Thus, this paper intends to demonstrate and quantify the involvement of VE studies (at pre tender stage) in project management knowledge areas as outlined in Project Management Body of Knowledge (PMBOK). The Public Works Department of Malaysia (PWD) is responsible for the implementation of VE studies for public programmes and projects valued at MYR 50 million (USD 16 million) and above. PWD has developed a methodology known as Value Engineering Methodology Matrix or VEMM as mechanism to ensure effective facilitation of VE studies. VEMM provides guidance and in depth description of activities to be carried out at specific VE Study stages (Pre Lab Stage, Lab Stage and Post Lab Stages). The aim of VEMM is to provide uniformity and consistency in the facilitation of VE studies thus ensuring better study outcomes and improved project performance at pre tender stage. Using selected PWD VE case studies, the involvement of VE studies can be verified and quantified in relation to project management knowledge areas. The case studies demonstrated that VE studies has improved the management of PM knowledge areas, thus providing evidence of VE contribution to project performance at pre tender stage. 22 Dr. Yu is currently a lecturer in School of Civil Engineering, Hefei University of Technology. She has long been researching diligently in the areas of public engagement, stakeholder management, value management, and facilities management targeting elders’ quality of life. In line with the above research studies, she has participated in, supported, and successfully completed a number of research projects, which results in near 30 international publications in journal papers, conference papers, and so on, in the construction management and engineering fields. In addition to research abilities, Dr. Yu also affiliates with the construction industry. She played the role of secretary and treasurer in Novus of the Chartered Institute of Building (CIOB), council member of the Hong Kong Institute of Value Management and overseas secretary of the Institute of Value Management in Taiwan. Value Management - An Innovative Way to 6ROYHWKH&RQïLFWLQ3XEOLF(QJDJHPHQW Although public engagement in encouraged to be used in construction projects, it is still remaining inadequacy and controversial without the systematic and logic decision making project. As a team decision making process, value management (VM) is innovatively proposed to be adopted into the whole PE process for improving the project performance and increasing satisfaction of different stakeholders. This paper thus aims to investigate the impact of VM 6-phase job plan on the final PE performance by a case study. VM was applied to the PE process for a public housing project. The results indicated that the adoption of VM in PE was beneficial for managing conflict among stakeholders. Based on current finding, several recommendations were proposed to manage conflict and improve PE performance, including preparation of specific and sufficient information for the PE project before the workshops, analysis of stakeholder expectations from a functional perspective and dissemination of final designs and PE report in a timely manner and transparently, etc. Abstracts of Paper Presenters Saturday, 9 May 2015 (11:15 – 12:30) Innovative VM Techniques Mr. Axel Peter RIED, R.I.P. Dr. Yann TRUONG CEO, Ried Management Methods, Germany Associate Professor of Marketing and Strategy, ESC Rennes School of Business, France We regret to inform that Mr. Axel Peter Ried passed away on 20 March 2015. He will be greatly missed by the VM community. Mr. Axel Peter Ried studied in Germany, Switzerland and the U.S.A. He obtained a Masters Degree in Business Administration and Applied Psychology. He held a Masters Degree of Machine Engineering. During his early career, he worked as a Director of the Berlitz School of Chicago and as an Assistant VP of the Singer Corporation N.Y. In 1962, he started his technical consulting company. RMM-Ried Management Methods. In 1989, he founded a design and engineering company, Berner + Ried GmbH. Mr. Ried introduced Value Management, Value Analysis and Engineering in Europe starting in 1961. He applied VM/VA/VE in over thousand companies of all branches of industry. For more than 50 years, RMM trained over 400,000 managers in VM/VA/VE, and co-ordinated about 8,000 projects teams. Besides VM/VA/VE, Mr. Ried also was an expert in TQM and PM. Mr. Ried wrote many books on various subjects and presented numerous papers at international Value Management Conventions in Europe, the US, Japan, India, Malaysia, Singapore and China. Reduction of Manufacturing Cost and Production Lead Time by Using the VE Methodology Consequently Yann is Associate Professor of Marketing and Strategy at ESC Rennes School of Business. His research interests are in the fields of innovation management, business models, and the environmental performance of firms. His work has been published in journals such as Journal of Product Innovation Management, Journal of Business Research, Industrial Marketing Management, Technological Forecasting and Social $IBOHF3%.BOBHFNFOUBNPOHPUIFST Innovation Project Acceptance in an Emerging Market City This research introduces the notion of social value in innovative projects that have been implemented by a city office in an emerging country. The aim of this study was to explore the nature of social innovation and issue selling rhetoric in the development and acceptance of innovation projects in a city located in an emerging national market setting. Issue- selling was found to be socially accomplished through rhetoric in gaining acceptance of innovation projects, requiring social actors to disrupt pre-existing institutional logics. Contradictory logics are seen to represent an opportunity for issue-selling rhetoric to subvert, infiltrate and open up new logics to promote the city as an attractive business investment location through innovation project acceptance; transcending logics from its emerging market setting that promotes more negative perceptions. The study demonstrates a subtle and nuanced practice in the gaining of innovation project acceptance, extending industrial marketing literature on business networks and how orchestration and facilitation aids innovation within inter-organisational networks. Many international companies have the problem of too long production lead times and of substantial back logs of orders at the same time. Also high manufacturing cost is always an issue. The consequences are that customers will be unhappy and profit margins are shrinking. Value Engineering and its sophisticated techniques offer an excellent opportunity to meet the challenges of the problems described above. Intensive special VE training for effective task force teams make sure that all the potential of such projects can be used in its full extent. This paper describes the consequent application of VE to improve all process steps of an industrial production in order to reduce the normal lead time of today by 40% and the back log by 30%. Manufacturing cost was reduced by 24%. As a result customer satisfaction could be improved quite considerably and lost orders were almost reduced to zero. 23 Abstracts of Paper Presenters Dr. Mei-yung LEUNG Mr. Ta-ming CHANG Associate Professor, Department of Architecture and Civil Engineering, City University of Hong Kong, Hong Kong Founder & CEO, ActiveBrainCapacityTech-Learning and Performance Inc., Taiwan Dr. Leung has more than twenty years of practical/teaching experience in the construction industry/education and has participated in a number of prestigious construction projects in Hong Kong. She received a Tony Toy Memorial Award (i.e. the first prize) in 2002 issued by Hong Kong Institute of Value Management Limited, H.K. for her PhD thesis, an international award (Thomas D. Snodgrass Value Teaching Award) in June 2005 issued by the SAVE International 'The Value Society' in U.S.A., and an academic Best Award 2008 issued by the Miles Value Foundation in the U.S.A for her outstanding VM performance in HK and Mainland China. Dr. Leung is also a Certified Value Specialist of the SAVE International 'The Value Society' in USA , and a Qualified Facilitator (list A) of HKIVM in HK. She conducted a number of VM workshops for various large construction projects in H.K. and the U.S.A., and is the first qualified VM trainer in HK for formal VM training workshops (modules I and II) those recongised by the SAVE International in the U.S.A. Dr. Leung is a Fulbright HK senior Scholar visiting the Universities in the USA in 2014-15. She has attracted over HK$ 16 million as Investigator in professional and research grants including professional and governmental projects. Over hundred refereed journal and conference papers in construction engineering and management have been published or accepted for publishing. An Web-Based System, iVMi, for Function Analysis among Oversea Team Members Value Management has been widely employed in the industry all over the world, including Australia, Canada, China, Germany, Hong Kong, Japan, Korea, Malaysia, Netherlands, Singapore, Taiwan, United Kingdom, the U.S.A., etc. However, it is difficult to group all stakeholders together at the same time in the same place for conducting the value management workshop. The presentation demonstrates an application of the internet software in the identification of key functions and the establishment of a FAST diagram for a real construction project. The web-based value management system, entitled the iVMi (interactive Value Management internet), aims to facilitate function analysis among VM team members without the geographic and time limitation. The iVMi is beneficial to specify value, manage conflict, ensure participation, achieve commitment, and obtain feedback instantly among the participants in value management workshop. 24 Ta-Ming Chang, Richard is currently an education technology Specialist, since 2000 as a software instructor that has been in the training field. Be the Subject Matter Expert of digital learning industry in 2006, design and development materials, graduated Master of Educational Technology in 2010. He was the first 4C / ID-model (Complex Learning) empirical research in Taiwan, and founded ActiveBrainCapacitytech-Learning and Performance Inc. in 2012. He design the SIAO157, it's a learning activities like a serious game with Online to Offline (O2O). He is also an AVS, SAVE International Associate Value Specialist, and member of Value Management Institute of Taiwan. 8VH9$9(RQ2QOLQHWR2IïLQH22 Cloud Learning Services Study - with an Example of Xtiveco Cloud and App There are many innovations applied in the educational and learning industries, especially the mobilization and cloud computing. The center of the trend of innovations has been changing from using the applications of technology and information in the past to the applications of software and services, focusing on user-centered innovation rather than technology-centered ones. Based on the 4C/ID-model, this study designs the learning services process targeting at the interactions between learning and teaching. Embedded the model of activity design of the SIAO157, the process develops a high-quality cloud learning services that were popular among learners, incorporating the resources from experts and communities into the learning services process, and designing, establishing and evaluating the activities based on the Agile approach. Concurrently, the VA/VE development team follows the learning partnership, using VA/VE structure to innovate and optimize the eLearning services, consolidating team efforts on the process development and innovation. Although VA/VE has been very successful in the construction industry in Taiwan, such as the Taipei Metro, it has not been widely utilized in the small and medium-sized enterprises on the island. The applications of VA/VE have becoming a core business competency and the successful experience and results can be found in the stories of Samsung in Korea, and Hitachi in Japan, to name a few. The purpose of this study is to exemplify the development of the learning services, finding best learning service solution from VA/VE research. Abstracts of Paper Presenters Saturday, 9 May 2015 (13:45 – 14:45) .H\6XFFHVVIXO)DFWRUVLQ90:RUNVKRS Prof. Geoffrey Q.P. SHEN Chair Professor of Construction Management and Associate Dean of Faculty of Construction and Environment, Department of Building and Real Estate, The Hong Kong Polytechnic University, Hong Kong Geoffrey has a track record of academic and research leadership in value management and collaborative working in construction. He has led a large number of research projects with total funding over HK$30 million including five RGCCERG grants in a row since 2002/03, and has authored 180+ papers in academic and professional journals. He is member of the editorial boards of several leading journals, and has been invited to give keynote presentations in a number of international conferences. He also serves as the Chair of the Global Leadership Forum in Construction Engineering and Management Programs. Professionally, he is a Fellow of the Royal Institution of Chartered Surveyors (RICS) and the Hong Kong Institute of Value Management (HKIVM). As a certified Value Management Facilitator (List A) he has professionally designed and facilitated a number of value management and partnering workshops for many client organisations. He has also received the Presidential Citation Award from SAVE International in 2009 for his “energetic and engaging effort to enhance value research and education”. The What Why and How of the Value Methodology This paper introduces the underpinning principles of the value methodology which include function analysis, collaborative working, systematic approach, and system thinking; why they are so important in the value methodology and how these principles should be implemented in the application of the value methodology in the construction industry. Examples will be given to illustrate how the value methodology is applied in real life large and complex construction projects. The critical success factors for implementing the value methodology in construction projects will also be discussed. Mr. Anil Kumar MUKHOPADHYAYA $GPLQLVWUDWRU,19(67&HUWLîFDWLRQ Board, India Anil Kumar Mukhopadhyaya, CVS–Life,FINVEST;ACMA, is one of the pioneering Certified Value Specialists in India. He is also the author of the highly successful four books titled Value Engineering: Concepts, Techniques and Applications; Value Engineering Mastermind From Concepts to Value Engineering Certification, Function Analysis System Technique – A Stimulating Tool and Cost Engineering. Presently he is Administrator of INVEST Certification Board and also member of the Editorial Board of INVAVE, journal of Indian Value Engineering Society. He is a successful trainer nationally and internationally. He has been authorized to conduct Module I Workshop (Approval No.201503800) and Module II Seminar (Approval No. 201204901) by SAVE International, USA. TEAM - Nucleus of Value Methodology The concept of Value Methodology( VM) depends upon proper selection of Team. In the concept of VM, there are only three dimensions. Those are number of team members, multidiscipline and members should be knowledgeable to Value Methodology Concept. The experience of more than two decades in conducting various VM training programs, I have experienced that VM Team is finalized very casually, keeping in mind only three things mentioned above. The results which have been experienced in Module I workshop and also in subsequent VM case studies that the benefit is inadequate, which could have got even through any other initiatives. The weakness of the team is visible during the Creative Phase. After generating number of ideas, the ideas are grouped in four zones, based on two axis model of Perceived Performance (X-axis) and Perceived Acceptance (Y-axis). The four zones are, Zone A, Zone B, Zone C and Zone D. The ideas in Zone A are the obvious solutions which can be identified through any initiatives which are High Perceived Performance vis-a-vis High Perceived Acceptance. It has been observed that the present VM Team Structure also fall in that trap and feel happy thinking they have got breakthrough solutions. But the break through solution which is expected from VM Methodology can only be possible if Low Perceived Acceptance and Low Perceived Performance (Zone C) shift towards High Perceived Performance with Low Perceived Acceptance (Zone D) by applying knowledge and technical skill and can also be converted to High Perceived Performance and High Perceived Acceptance (Zone A) from Zone D through persuasive salesmanship. This is only possible if the Team Members are judicially selected. The present article is an attempt to develop Questionnaire, keeping in mind the traits like Entrepreneurship, Leadership, Innovation, Teamwork and Communication and select the team members based on An Aptitude Test. 25 Abstracts of Paper Presenters Saturday, 9 May 2015 (15:00 – 15:50) 1HZ'LUHFWLRQRI90,QWHUQDWLRQDOO\ Dr. Manabu SAWAGUCHI Mr. Martyn R. PHILLIPS Professor, Department of Business Design and Management, Waseda University, Japan Management Consultant, The Team Focus Consulting Group, Canada Manabu Sawaguchi graduated from Keio University in 1982. As a visiting researcher, he visited University of Michigan IOE (Industrial and Operations Engineering) in 1997. He received Dr. of Engineering from Waseda University in 2005. He has more than 25 years of experience in practical technology management, teaching, application and development both VE, QFD and TRIZ techniques as management consultant focusing on MOT (Management Of Technology) field. At the same time, he had worked as a professor at Waseda University until last March of 2015. Now, he is a guest professor at Waseda University from April of 2015, a board member at one of listed companies in Japan and an advisor at SJVE. Functional Approach as a Valuable Way of Collaboration between Japanese Style Grass-Roots Innovation and that of Developing Countries Japanese manufacturing technologies (“Monozukuri-gizyutsu” in Japanese) mainly have two strong points. One is the cuttingFEHFUFDIOPMPHJFTJO3%XIJDIMFBEUIFSJWBMDPNQBOJFTJO the developing countries. The second one is competitiveness in “Kaizen Activities” with the power of skilled workers at actual work sites (“Genba-ryoku” in Japanese) based on Management of Technologies (MOT) techniques (like IE,QC,VE and so on). The TUSFOHUIJO3%JTSFGFSSFEUPBTi3BEJDBM*OOPWBUJPOwBOEi,BJ[FO Activities” are called “Japanese style Grass-Roots Innovation (GRI),” which was named by Professor Fujimoto at University of Tokyo. In this paper, whether or not MOT techniques including VE can contribute to raise the level of GRI in the developing countries is illustrated by focusing on GRI and effectiveness of “Functional Approach (FA)” through case examples of Japanese style GRI. 26 Martyn is recognized as a world-class practitioner in risk, value and performance improving practices. He has worked in several different countries and diverse cultures throughout the world on group problem-solving, scheme optimisation and consensus-building. He also teaches advanced project and risk management methods, along with value and project assurance UFDIOJRVFTBOEUIF4"7&*OUFSOBUJPOBM.PEVMFT***7BMVF Methodology certification courses. )JTMFBEFSTIJQPGQSPCMFNTPMWJOHPQQPSUVOJUZFYQMPSBUJPOT has resulted in substantial savings of time, capital cost and whole life cost, with significant constructability / functionality / productivity enhancements, for a number of high profile, public and private sector programs, projects and services. Martyn has written several books on value improvement and assurance. Exploring Possibilities and Creating Sustaining Solutions, but which Approach to VM Should I Use? The term value management ( VM) conjures up various images in different jurisdictions. In general, VM provides a powerful process for identifying and testing opportunities to create sustaining solutions or improve overall program and project performance. This includes consensus building for concept identification and selection, functionality enhancement, schedule optimisation and cost (capital and life cycle) improvement. However there are quite widely varying interpretations of VM, - what it accomplishes and how. Acceptance and use of VM varies globally, for a variety of reasons, but perhaps especially due to inconsistent messaging from the VM community itself. All this tends to lead to confusion, especially amongst newcomers to VM, regarding expectations, timeframe, resource requirements, process and outcomes. Without a universally agreed, overall approach to VM it is possible that some value improvement opportunities remain hidden and hence unrealised. regarding expectations, timeframe, resource requirements, process and outcomes. Without a universally agreed, overall approach to VM it is possible that some value improvement opportunities remain hidden and hence unrealised. When a particular "brand" of VM has been introduced to a jurisdiction, the limitations of that brand are typically also assumed and the broader advantages of other VM approaches may well be forsaken. Perhaps it is not surprising that some influential, busy professionals and potential clients cannot be bothered to sift through the various explanations and outcomes of VM, and instead, opt for other means to accomplish their portfolio, program and project goals. A number of VM related standards now exist. Some are relatively simple and others detailed. A "one size fits all" approach for all situations and cultures would be fraught with pitfalls and likely lead to lost value. This paper stems from commonly practised value improvement methods and sets out a framework to encapsulate the various terminology for a potentially universal "road map" to conducting value management services - from initial program/ project conceptualisation through to the tightening of a detailed design and optimisation of a service that is in use. VALUE MANAGEMENT: AN EFFECTIVE INNOVATION MANAGEMENT TOOL FOR STRATEGIC MANAGEMENT OF TECHNOLOGY IN THE SERVICES SECTOR – CASE OF A VTI Dr Arif Sikander, Lecturer, School of Management and Governance, Murdoch University, Murdoch, Western Australia Abstract: The concept of Strategic technology management (STM) places technology in a strategic context. STM did not emerge as a distinct area of managerial and academic interests until late 1980s. The key managers may initiate efforts to gain access to newer technologies, but the question is whether the approach they adopt is strategic or a series of ad hoc decisions [Quinn,1988]. Value Management (VM) has assumed an important role in providing leadership and strategic growth to technology firms. Historically VM emphasized use of alternatives to reduce cost, promote innovation and enhance the performance of products. VM has moved beyond manufacturing and can be applied for strategic decision making in the services sector. It is envisaged the VM can be an effective tool for STM. It should help in generating creative ideas on the most appropriate technologies, examination of alternatives, evaluating the alternatives and developing a strategy. A study conducted by the author in the East, revealed that the performance of firms is influenced by the type of strategies developed during the VM process. This result provided the motivation to explore if such strategies are relevant to the managers of the “services” sector and if their performance too is influenced by these adoptions. There is dearth of similar studies in the literature. More importantly, in this age of technology, there is a dire need for management to understand and implement ideas not perceived before. The results could contribute to the literature/management in developing a set of VM strategies which could be termed as “global” and applied to any sector and those termed as “unique” which are specific to firm/service sector. In terms of the services sector, the nearest similarity to the technology intensive firms appear to be the vocational and technical institutions (VTI). The big study sought to identify and analyse the level of awareness of participants on strategy issues and the perception of departments (including those in the Ministries) about STM (and the inherent VM). This paper attempts to present the results on that part of the study which deals with the relationship between the type of the managers/management (gender, qualification, age etc) and the application of developed strategies. The participants included the staff and heads of departments at a technical college from an oil rich ASEAN country, the senior management at the college and the policy makers at the Department of Technical Education (DTE). The strategy and management data was desired from all the three groups. Data was collected through a questionnaire and analyzed using statistical techniques. A pilot-study helped to refine the questionnaire before it was administered. The study sets the tone to open up discussions and research interest towards applying VM tools in the strategic management of technology in the education sector in a rapidly growing digital world. The type of managers/management revealed as part of this study has implications to the senior planners in the education sector in keeping pace with the technology age by providing valuable inputs to innovate, discover, evaluate and develop strategies to provide value to the stakeholders, decision makers and technology lecturers. Keywords: Value, Value Management, Technology, Technology Strategy, Strategic Technology Management, Performance I. INTRODUCTION Technology Strategy (TS) is defined as the pattern of decisions, which sets technological goals and means for achieving these goals in relation to the business strategy and goals of the firm (Harrison and Samson (1997, p. 9). This is the content side of the strategy. On the other hand Technology Management (TM) is about the implementation of the strategy in order to improve performance of the firm. Strategic Technology Management (STM) integrates TS and TM to improve performance of firms. Value Management is about the use of resources in a wise manner so as to achieve production efficiencies, improve the performance of products and meet expectations of the stakeholders. It involves using technologies and innovation in the process of conversion of inputs to outputs. “Applying the principles of Technology Management can change the perception of Information Technology to that of a dynamic partner by changing the dialogue from one about commoditized unit costs to one of strategic growth, investments, and market capture” (Thorp, 2009). It happens when we make the shift from a cost-based culture to a performance-based culture – the basis of VM. VM is assumed to be based on a value strategy (VS). It appears thus, that we could evolve a new concept named Strategic Value Management (SVM) which is synonymous to STM and which integrates VS and VM. Both VS and VM could then be used as tools to measure SVM in firms/service organizations. Few researchers have analysed TS and TM and focused mainly on the firm and that too in the manufacturing sector. Henceforth we will talk about VS and VM and treat these concepts similar to TS and TM since value like performance of technology firms is ultimately expressed by business outcomes like revenue growth, market share, gross margins, customer satisfaction, etc. We need to explore and understand if these definitions are equally applicable to service organizations. There is a dire need to understand 27 the role value strategies play and the ways in which they are implemented in the technical education sector. Since VTIs are primarily service institutions, technology strategies must be embedded in their organization strategy. Due to rapid advances in modern technologies, VTIs, especially in developing countries, are assuming an important role. This realization has resulted in the establishment of new VTIs in both the government and private sectors and all are subject to intense competition, not only to secure more funds, but also to survive. A great contribution to the literature on value management would be to highlight the types of VM strategies being applied in the VTIs and their similarities/differences with those in the manufacturing sector. This study addresses this issue. II. LITERATURE REVIEW According to Thorp (2009) “the concept of value relies on the relationship between meeting the expectations of many differing stakeholders and the resources used in doing so. The aim of value management is to reconcile these differences…”. Technology investments on the other hand are about enabling business change and can bring enormous returns if managed properly. Yet, without effective governance and good management, there is an equally significant risk to destroy value (www.isaca.org/valit). The literature review focuses on the need for value management. Since the application of VM strategies (technology related) has traditionally been in the areas of business and manufacturing, it is necessary to explore and use them as a starting point for this research, which focuses mainly on the services sector. The changing and dynamic nature of economies, place pressure on governments to be receptive to such changes and develop policies to adopt such changes. All sectors of the economy need to be developed to achieve a balanced growth. There is thus a need for institutions to remain abreast with the technological changes taking place in and around the region and adopt them to reap their maximum benefit. There are four different technology induction categories, which would enable the fulfilment of these aspirations (Omar 1992, p.38). These are: 1. Those technologies, which facilitate the achievement of goals in basic necessaries of food, housing, education and civic interaction. 2. Technologies which help in improving quality of life through the provision of health and medical facilities, clean and safe environment, good education, and improved means of transport and communication. 3. Those technologies, which enable significant improvements in standard of living through enhanced production, international competitiveness, and employment creation (for matching a nation’s supply and demand of labour) 4. Technologies of the new age; that is, new and emerging technologies which enable a nation to move upwards into the class of technological advanced nations (industrialized or high tech nations). It can be expected that technology induction is equally applicable to the education sector (highlighted in italics above) and provides inspiration to conduct this study. The induction of technology would require a change in the structure of occupation of the work force. This could be met by implementing changes in the vocational and technical training so that the work force in this sector could face the challenges of the technology change. According to Omar (1992), the old theories on favourable exchange rates, cheap labour, plentiful resources and government intervention would not completely be valid in the age of technological change. These theories need to be reconsidered in the light of these changes, which bring new ways of creating national wealth as well as generating some new limitations. As discussed earlier, closely related to technology is the issue of quality (value). Godfrey and Kolesar(1988) defined quality as “how well a product or service performs its central function”. This quality definition could be included in technology to provide a performance measure for SVM. It is thus apparent that technology and quality both relate to products and services. If they are applied to firms, they should equally apply to services. According to Talonen and Hakkarainen (2008), in an education environment it would be worthwhile to explore if there exists a technology-andcompetence strategy. They suggest that the following questions need to be addressed: What are our pacing, key and base technological competences—now and in future? 28 Which technologies will be replaced and which technologies should we use? What are the sources of our technologies and competences (also make-or-buy)? The answers to these questions can provide us to determine the technology choice as part of the SVM process. This argument provides an opportunity for this research. Though it appears that this argument by the authors is inclined towards the manufacturing industries, it would be worthwhile to explore if there are responses to these questions in an educational environment which could help in determining if the sector has any VM strategy in place. III. RESEARCH QUESTION The key research question of this study is: Do different types of managers play a different role in the selection and implementation of appropriate VM strategies (SVM) in a VTI?. The management includes: the staff in the various departments of the technical college, the heads of departments at the college and the senior administrators of the college and the department of technical education. IV. RESEARCH METHODS The data for this study were obtained through a survey questionnaire. The survey questionnaire was pre-tested in a pilot study to assess the clarity of its direction and the questionnaire items. The final questionnaire developed after the pilot study had three versions - one for the heads of departments, one for the instructors and one for the administrators at the college and at the department of technical education. The possibility of integrating the dimensions for these participants in the same questionnaire was considered but was dropped after conducting the interviews during the pilot study. The reason for having different versions was that corporate level issues are not presented to instructors who have normally not come across them and also policies developed at the Ministry level sometimes never reach the heads of departments. The survey could have included all the teaching institutions, but only technical institutions were chosen because it was assumed, just as in the manufacturing sector, that technology-intensive institutions are more likely to have technology strategies and it is, therefore, easier to observe the relationships of interest. There are six vocational and technical institutions in this country. This study was restricted to the largest technical institution and to the department of technical education. Out of the 150 respondents surveyed, 10 were heads of departments, 103 were instructors and 37 were senior administrators at the college and at the Department of Technical Education. Five types of data as used by Herman (1998) were gathered for the study: individual's profile data, departmental profile data, technology data, operative environment data and technology policy (strategy and management) data. The data were gathered on five strategy and five management dimensions. Individual profile and department data were used to check for response bias and content validity. Technology data provided the existence of technology policies in the institution and the level of knowledge about technology of the respondents. Value Strategy (VS) Dimensions(Technology Focus) 1. Technology posture (firm's propensity to use technology proactively as a competitive weapon and a key-positioning factor). 2. Technology level (sophistication of the technology employed by the firm). 3. Product development intensity (number and rate of new product introductions). 4. Technology timing (firm's propensity to lead or follow competitors in introducing new products). 5. Manufacturing and process technology (degree to which new technology is incorporated into the firm's manufacturing plants and processes). Value Management (Technology Focus) (VM) 1. Technology awareness processes). Dimensions (firm's scanning 2. Technology acquisition (methods by which firms acquire technology). 3. Technology and product planning (formal planning processes that firms utilize to select and manage R&D programs). 4. R and D organization and management (methods firms employ to organize, empower and motivate research and development personnel). 29 5. R&D investment (methods by which firms fund R&D). Based on the suggestions of executives at the Department of Technical Education, the instructors, heads of departments and administrators at the college were given the questionnaire by the principal of the college. The executives at the Department of Technical Education received theirs through their research and development officer. There was no need for follow-up letters, as the response was very encouraging. V. HYPOTHESIS To investigate the various relationships between the factors of VS and VM dimensions and the demographics of the respondents the following hypothesis was proposed as part of this study. H1: Application of Value Management Strategies in an educational setting is correlated to the type of executives, heads and staff (in relation to qualification, age, etc) VII. DATA ANALYSIS The results showed that the majority of the instructors, heads of departments and the executives at the Department of Technical Education were quite senior in their specialist fields. The positions held by technical teachers start with Technical Assistant (TA) and move through Assistant Technical Instructor(ATI), Technical Instructor(TI), Senior Technical Instructor(STI), Education Officer(EO), Senior Education Officer(SEO), Assistant Director and finally Director. Amongst the staff who responded to the survey, the majority of them (67%) were either senior technical instructors or technical instructors. These two positions are achieved after at least five years service for locals and at least ten years for expatriates. The position of senior technical instructor in the case of expatriates is assigned to teachers having a Bachelor’s Degree and around 15 years of experience. Of the nine heads of departments who participated in this study, six (67%) were senior technical instructors and the remaining three were education officers. At the Department of Technical Education, eight out of 25 (32%) were senior education officers and six out of 25 (24%) were education officers. This figures indicated a high senior level of experience. Relationships between Background Variables and Extracted Factors The four VM technology related extracted factors included ‘R&D emphasis’, ‘technology awareness’, ‘market and technology planning’ and ‘foreign technology acquisition’ The three VM extracted factors included ‘R&D emphasis’, ‘market and technology planning’ and ‘foreign technology acquisition’. This section includes the analyses of relationships between the ‘extracted factors’ and background variables. There were a total of 32 items, 16 each for exploring the dimensions of value strategy and value management. Factor analysis revealed four factors each for VM and VS but in each case there was one significantly dominant factor. The dominant factor amongst the four VM factors was ‘R&D Emphasis’ having an eigen value of 6.49 whereas ‘Program Production and Timing Emphasis’ was the dominant factor amongst the TS factors having an eigen value of 7.29. The relationship between the background variables of gender, local/expatriate, qualification, industry experience, years last professional course completed, teaching experience, understanding of technology, understanding of quality and the department in which employed and each of the eight extracted factors is discussed in the following sections. A one-way analysis of variance (ANOVA) was performed with each of the VS and VM factors as the dependent variables and the background variables as the independent variables. Since Fscores are uncorrelated because varimax rotation was employed, it is appropriate to use univariate analysis of variance. Significance between the factors and background variables was tested at pvalues of 0.01 and 0.05. Homogeneity of Variance was tested using Levene’s statistics at 0.05 test level. Taking the mean of relevant variables, which loaded heavily on the factor, developed the VM extracted factors. These extracted factors, which comprised the mean values, were treated as continuous variables. The results show that there are three significant relationships between the background variable of department of the respondent with each of the two VS technology related factors namely: VS factor 1(Program production and timing emphasis) and VS factor 3(Program development intensity emphasis) at 0.05 level of significance. Levene’s test for homogeneity of variances was not significant for each ANOVA analysis of these factors and the background variable, hence posthoc analysis using Tukey HSD test was employed 30 to locate the sources of the differences. There were many significant mean differences at the 0.05 level. For factor1, building, design and construction department had the highest group mean indicating that this department valued production of new, low cost and flexible programs at the right time The mean differences between the various departments on VS factor3 were not very significant, however, language and communication department scored the highest group mean. It indicates that language department was inclined towards increasing the types of programs and improving them continuously. The significant relationships are summarized in Table 1 below: Table 1: ANOVA for VS Extracted Factors(significant relationships) Y X F value Significance VS Factor-1 Qualifications 3.215 0.010 VS Factor-1 Department 2.352 0.017 VS Factor-3 Department 2.149 0.029 VS Factor-4 Quality 2.429 0.025 The results show that there are three significant relationships between the background variable of department of the respondent with each of the three VM technology related factors namely: VM factor1 (R&D emphasis), VM factor3 (Market and technology planning) and VM Factor 4(Foreign technology acquisition emphasis) at 0.01 level of significance. Levene’s test for homogeneity of variances was not significant for each ANOVA analysis of these factors and the background variable, hence post-hoc analysis using Tukey HSD test was employed to locate the sources of the differences. There were many significant mean differences at the 0.05 level, however, in all the three cases, the building, design and construction department had the highest group mean indicating that this department valued R&D, market and technology planning and foreign technology acquisition. Emphasis on three of the four VM factors, indicated the inclination of this department towards value management. The significant relationships are summarized in Table 2 below: Table 2: ANOVA for VM Extracted Factors(Significant relationships) Y VM X F value Significance Local/expatriate 6.33 0.01 Department 2.59 0.009 Department 3.29 0.001 Department 2.77 0.006 Technology 2.52 0.02 Factor-4 VM Factor-1 VM Factor-3 VM Factor-4 VM Factor-4 definition The background variables were analysed after the data was entered in SPSS. Factor analysis was used to transform the variables into a new set of linear combinations called the principal components. The extraction using PCA for the technology strategy variables revealed that three components accounted for 71.3% of the total variance. The factors were named as: technology positioning, technology leadership and up-to-date plants and processes. The extraction using PCA for the VM variables revealed that four components accounted for 83.2% of the total variance. The factors were named as: strategic R&D, technology consciousness, formal planning and external technology acquisition Correlation analysis revealed the association of SRG with strategic R&D, technology positioning, capital investment and number of employees, and between capital investment and number of employees. VIII. LIMITATIONS OF THE STUDY To keep this study manageable, the effects of technology policies on performance were not explored. In determining the various factors affecting the management of technology, some exogenous variables like culture, financial structure and nature of courses offered were omitted. The study was also limited to one technical institution, albeit the biggest one, in terms of the courses offered and the number of staff employed. The study also used the items from prior research, which were evolved for manufacturing firms in a different cultural and technological environment. REFERENCES Chester, T. M. 2006. “A roadmap for IT leadership and the next ten years”. EDUCAUSE Quarterly, 29(2): 56-60. Clarke, K., Ford, D., Saren, M. (1989). Company technology strategy. R&D and Management, 19, 215-229. Claver, E., J. Llopis., G. Garcia, and H.Molina. 1998. “Organizational culture for innovation and new technological behaviour”. Journal of High Technology Management Research, 9(1) : 55-58. Dussage P., S. Hart, and B.R. Amanantsoa . 1992. Strategic Technology Management. John Wiley & Sons Friar F., and M. Horwitch. 1985. “The Emergence of Technology Strategy”. Technology in Society,7: 144. 31 Fredrick, B. 1993. Strategic Technology Management. New York: Mc Graw Hill. Gillespie, D.F., and D.S. Mileti. 1977. “Technology and the study of organizations: an overview and approach”. Academy of Management Review, 4(1): 7-16. Godfrey, A.B., and P.J. Kolesar. 1988. Role of Quality in achieving world class competitiveness. Global Competencies, New York. Grant, R.M. 1995. Contemporary Strategy Analysis: concepts, techniques, applications. Blackwell: Massachusetts-Cambridge. Herman, S. 1998. “Technology Strategies in the US Electronics industry”. Dissertation Abstract International, (UMI No. 9834862). Doctoral Dissertation, Portland State University, 1998. Harrison, N.J., Samson, D.A. (1997). International best practice in the adoption and management of new technology (p.9). Department of Industry, Science and Tourism, Canberra, Australia. Hugos, M., and J. Stenzel, 2007. “Managing for returns on IT investments.” In J. Stenzel (Ed.), CIO best practices: Enabling strategic value with information technology (p. 321). Hoboken, New Jersey: John Wiley & Sons, Inc. Kashiwaga, K. 1999. “Implementing TQM in Educational Institutions”. Proceedings of SEAMEO VOCTECH, Feb 99: 1-8. Omar, A.R. 1992. “Achieving the industrial targets of Vision-2020”. The Science and Technology Perspective, Prime Minister Department, Malaysia, 38-44. Pfeffer, J., and R.I. Sutton. 2006. “Evidence-based management”. Harvard Business Review, 84(1): 62-74. Probert, D.R., S.W. Jones, and M.J. Gregory. 1993. “The make or buy decision in the context of manufacturing strategy development”. Proceedings Institute of Mechanical Engineers, 207(B4): 241-250. Randolph, W. 1981. “Matching technology and the design of organizational units”. California Management Review, Summer. Sahlman, K., and H. Haaspasalo. 2009. “Elements of strategic management of technology: a conceptual framework of enterprise practice”. International Journal of Management and Enterprise Development, 7(3)” 319-330. Strassman, W.P. 1926. “The manufacturing experience of Mexico and Puerto Rico”. Technological Change and Economic Development. Thorp, J. 2009. “The information paradox: Realizing the Business Benefits of Information Technology”. McGraw-Hill Ryerson. Talonen, T., and K. Hakkarainen. 2008. “Strategies for driving R&D and technology development”. Research Technology Management. Val IT Framework for Business Technology Management. (www.isaca.org/valit) retrieved on 21Feb2015. Economic restructuring, technology transfer and human resource development. Toronto: Sage Publications. Virmani, B.R., and K. Rao. 1999. Economic restructuring, technology transfer and human resource development. Toronto: Sage Publications. Weiss, M. 2010. “An Evidence-Based Approach to Improving Chief Information Officer Performance”. Ph D dissertation University of North Carolina at Chapel Hill School of Information and Library Science. Chapel Hill. 32 33 DISCOVERING VALUES WITH THE DESIGN FOR VALUE MODEL AND REFLECTION ON A VE-STUDY FOR A SHIPPING COMPANY Hein B.A. de Jong Value Engineer Partner with Value FM ABSTRACT This article tells another amazing story of a value engineering study. It describes how the study is designed with help of the Design for Value model® , and shows its application in a VE-study for a shipping company. The key success drivers are generic and commonly known for successes of value engineering: sharing information, analysing functions, mutual understanding, group wise idea generation, iterative designing, and formulation of the next actions. The area of application and scale of this case are somewhat unusual: how can four ministries and a shipping company optimise the utilization of their 12 sea vessels and reduce that number? In the mean while some reorganisations occur and needs are changing rapidly in the coming years (e.g. internet, international databases, GPS controlled vessels). The study is shaped with the "design for value model", addressing topics that hide values until they are exposed: insight, organisation, and design. It resulted in some well-prepared VE-workshops in which participants (50 in this case) discover how to reduce the number of ships while improving performance for their business. The solution is found in cooperation, clever planning, time sharing and multipurpose vessels, reducing the need from 12 to 7 vessels in the coming years. That is a remarkable result! 1. THE CASE: SHIPPING COMPANY When four ministries have their own sea vessels (12 in total), it may occur that the utilization of each ship is not optimal. Why not? Because operating a ship is usually not the core business of a Ministry. For them, core functions are e.g. care for a healthy society, fight criminality and defence borders. The ministries involved are about Defence, Infrastructure, Economics and Justice. The ships are operated by the State Shipping Company and its task is to transport people and materials, optimize usage, lower cost, maintain and renew vessels if necessary, and innovate (change functionalities) when clients’ need dictate to do so. The relationships between the shipping company and ministries led to a low level of sharing strategic information about the ships. Or, in other words, the clients' changing needs were not explicit enough to feed the renewal program of the shipping company. The low degree of utilization (5% to 40%) and a lack of foresight in the near future (1 to 10years) made the shipping company decide to organize a value engineering study into the renewal program for the coming 10 years. Questions to be answered were: Is it possible to reduce the number of ships? What will the ships be used for in the near future? What are certainties and what are uncertainties? 34 2. DESIGN FOR VALUE (DV4) 2.1 Setting and overview The larger organisations become, the less agile they tend to be. They need a remarkable effort for selfpreservation and defined tasks, leaving less energy to focus on clients’ changing needs. within the project team may occur: there are so many stakeholders and they all look very important: “analysis paralysis”. This is often the case with ‘line infrastructure’ like roads and railroads, which are virtually never ending systems going through densely populated areas with many (system) users. However, there will always be some employees who see Value Engineering as a refreshing opportunity to renew the vision and to come in contact again with their clients. With such persons this VE-study started, and the D4V-model assisted by focussing on the three D4V pillars: Insight, Teamwork and Design. However, by applying Pareto's law, it is discovered that only a small part of the stakeholders generates the key requirements. An average of 20% of stakeholders generating 80% of the requirements is quite common. Didn’t we hear that before? This article describes the D4V-model incorporating the lessons learned and examples of the Shipping case. It shows where, why and how hidden values are discovered, one by one. 2.2: Insight 2.2.1 Insight in clients The first subject in the D4V-module Insight is focussed on the Stakeholders. Therefor a strategic stakeholder analysis is performed: who are the stakeholders, what are their stakes, their power to influence the outcome, their interests, and attitude towards the project? 2.2.2 Insight in Client Requirements The next action implied by the D4V-model is identifying the client requirements: what performance is it that the client really wants? It takes a good system engineer or value engineer to analyse the clients' documents and to hold interviews to discover the real client needs. There will be confusion on the client's side because their mind set differs from that of the value engineer, and because the value engineer uses unusual words like functions, performances, performers, systems, values and objects. Often the clients only have a relative small set of requirements that are really relevant to the project. Those have to be discovered. It depends on some factors if this 'client requirement'-discovery is performed during or prior to the plenary VEsessions, e.g. how easily does the client handle the VE- and SE-definitions, how well known are the stakeholders with each other, and how well known is the client with the topic of the VE-study itself (varying from very familiar to unknown and uninterested). If the investigation is performed before the plenary sessions, then sketches, FASTs and value profiles may be drawn in advance, but the required functions will always be reviewed by the whole VEteam during the plenary workshops. After such an investigation, some entanglement 35 2.2.3 Insight in costs Value Engineering stands out as a design method because of the continuous feedback during workshops within the triangle stakeholdersrequirements-costs; those time boxed loops are rarely seen in other design methods. This is where Pareto's law originates: 20% of the objects cause 80% of the costs. Value engineers often see as well that 20% of the requirements are accountable for 80% of the objects. In our case, it started with the insight that an average usage of the ships of less than 20% is very low and therefor expensive. 2.2.4 Insight, conclusion. 20% of the stakeholders are accountable for 80% of the system performance requirements 20% of those requirements are fulfilled by 80% of the objects (e.g. roads) 20% of the objects cause 80% of the costs It also often occurs that 10% up to 30% of the required funding for the cost, has no stakeholder that is willing to pay for it. This is often the starting point of a value engineering study. 2.3 Team@Work Team@work is the second pillar of the D4V-model. Besides the three types of Insights described before, there are three types of ‘team’ within a study. It is the people in the 1) project team who are doing a major part of the job. The team itself is embedded into a larger 2) organisation and may hire 3) experts. If all are set and ready, they can start the VEactivities. 2.3.1 Team@work: Organisation Usually, this is about the organisation that is the principal of the project. In our case: the shipping company. They are the organisation that embeds the project team. That organisation is designated by the stakeholders in a more or less formal way and asked for to deliver the project and often maintenance and operation as well. E.g. the shipping company is asked for to renew the fleet and do the upkeep and management of it, for the coming 20 years. This organisation remains when the project team is dismantled. It is therefore vital for the proper implementation to secure that e.g. client communication, system maintenance, fee collection, but also alterations into the system and disposal, can and will be performed by the Organisation. That may be part of the project teams' concern as well and certainly if the organisation is e.g. reorganising, or over manned. In our case, the alignment of project team and organisation took quite some effort and was very good to do to ensure a better degree of implementation after the VE-study. 2.3.2 Team@work: Project team The project team is often the team that organises the Value Engineering study. They have come to a point in their project where a VE-study is appropriate and hire a facilitator to design the VE-study. The project team discusses the setup with the facilitator who should be a temporary member of the team. Obviously, the discussion is about which 20% of the stakeholders (that cause most requirements) is invited? An important question is: on what level of detail are we yet?, and what echelons should be asked to join? Questions that are immediately followed by: how large groups can we handle? and will there be parallel or sequential sessions? (with days or weeks in between). Often a team is composed from various organisation levels and levels of skills, since VE-sessions focus on many abstraction levels in e.g. their function analyses, or issue analyses. And that raises the question if all necessary knowledge is gathered in the proposed value engineering team. In the VE on the shipping company, the project team consisted of the project manager, a technical manager and a stakeholder manager. They had been working on the project for about a year. The experts had to be found outside the team but within the organisation (generic fleet architect, costing). 2.3.3 Team@work: matter experts Finally, we look for the right people who have the expertise that is still missing in the team. Who has the knowledge, is he/she able to share it and which information is too sensitive to share with him? Is he willing to do his best to serve the organisations' mission? Are there no conflicts of interest (earlier or future involvement)? Can and will he be called in for the next actions (e.g. detail designs, or solve some issues)? 2.3.4 Team@work, conclusion Experienced value engineers will agree: a VE-study 36 enhances people, so the better the team right in the beginning, the better the final results will be. This type of workshop usually takes about two days. So the costs of people are actually irrelevant. You strive to get the best experts, architects or designers to give directions for probably many years of work. It will always be a secret if the best team was formed since there is no second chance nor reference. where? How often, where and when are fish to be counted? (by the way: that led to some innovative ideas already in this phase). And so on. 2.4.2. Design: Analysis Function analysis is the process of making a FAST or another graphical representation to show the main 2.4 Design Design is the third pillar in the D4V-model. Design consists of Information, Analyses, and Creativity. These are most commonly associated with value engineering. An explanation of each is given below. 2.4.1 Design: Information In the third pillar Design, information is about data on the system we are investing in, e.g. ships. We need information about their system functions, their relevance for the users, relation with maintenance and e.g. configuration changes. How much, how often, who, where and when. The How and Why are for the Analyses phase and are depicted in the FAST. Information was the subject where much effort was needed in the shipping VE-study. We saw an unexpected lack of information and became aware that the real clients' needs were unknown. The clients were obviously not capable of thinking nor communication in terms of functions and performances as needed for fleet renewal. Therefor the VE-workshops were delayed to gather the relevant information first within the ministries and e.g. the maintenance departments of the clients. Those pre-workshop meetings were about 2..4 hours each, consisting of the validation of a prepared FAST as they were thought to be correct by the project team, followed by the filling of a function performance specification. How many ships are to be visited for drugs and smugglers, which timing, and functions and some of their relationships. In our case, an important intervention was the title of the FAST: "Function analysis on Offering valuable services on sea with an optimum number of vessels. Focussing on tasks leading to a need for transport". For quite some employees this required explanation, although we thought we had made this clear. It wasn't. We made a FAST that barely fitted on a large A0-sized paper, consisting of number of small FASTs: for every of the eight identified processes we made one (sub-) fast. During the workshops the participants were presented for the first time the complete overview and were asked to validate it. They did so in mixed groups. Each group had the knowledge to explain the whole picture. The first reaction when they entered the rooms was "What is this"? but later on "We can now see the total picture". That implies they agreed with the title, and they started to see what the functions of "an optimum 37 number of vessels" are. That also made it clear to them that HOW it is done (by means of an optimum number of vessels) is actually a non-issue for them; “it just has to work”. To give them more insight in the HOW, the creativity phase was used, enabling them to explore areas that are not their ‘daily concerns’. The cost component was not extensively investigated, since the aim of the study was to have a far more efficient usage of the ships, which in its turn would lead to far lower costs anyhow. Besides, the financial system was redesigned and not yet ready to be used on the required levels. when pillars of the model are wobbly. If you look at the examples of the shipping company, you will realise the ‘wobbly pillars’ will decrease the effectiveness of the VE-study. If those pillars are identified and addressed properly, that effort will create tremendous added value. The success may be caused by understanding underlying relations of the model, e.g. relation of the system and its stakeholders, the costs and performances, or the planning of system usage and space requirements. Asking about those relations really challenges entrenched ideas and reveals indispensable data. And those are main functions of a VE-study. 2.4.3 Design: Creativity Good knowledge of the functions of a system is an excellent basis for creativity. Creativity is the third item in the pillar Design. It is enhanced by focussing on main costs of functions, on important issues and by identifying the main functions. Due to the long preparation time (it started months before the plenary workshops were held) many ideas were already thought of. There was even a large picture book with different kinds of vessels: small, large, single and multipurpose. However, the start of the creativity phase was like releasing the cover of a pressure cooker: some hundreds of ideas emerged. This was a remarkable change since the beginning (see §2.2: Insight). Due to the large group of participants and the fact that we were working on multiple abstraction levels, we divided the group in three groups of 15 people each: operations, vessel configuration and management. Half way day 1, groups were mixed and the creativity continued once more with "throttle open". Already by now it was clear some groups were advancing fast while others were still asking for more information.. On the second day people made scenarios, plans, plannings and designs. It was clear that all participants from the different ministries and other organisations were very well prepared now and willing to come up with solutions. In the end of the second and last day of the workshop, several configurations of a new fleet were presented, requiring 6 to 8 vessels with 2 or 3 multipurpose vessels, some mixed functions on 3 vessels, and the other single purpose vessels remain. It was up to the shipping company now to continue with these concepts, and to stimulate cooperative organisations to implement the new system. References and useful sources of information: Kelly, Male and Graham. Value Management of construction projects. 2004. ISBN 9780632051434 Taylor Models. See: the seven stages of the creative process on: www.mgtaylor.com/mgtaylor/glasbead/expmodel.htm www.value.fm 3. CONCLUSION We have rarely performed a VE-study where the three pillars of the D4V-model were well tuned right from the beginning. There are lots of hidden values 38 NEW MOVEMENTS OF VA/VE IN JAPAN HISAYA YOKOTA, CVS, P.E.JP, CMC President and Chief Executive Officer Functional Approach Institute Company Limited Tokyo, Japan ABSTRACT In Japan, VA/VE have gradually expanded their scope of application into many other industries from the traditional manufacturing and construction industry: particularly noteworthy is their application to the service industry. The main reason for this trend lies in the fact that Japan’s chief industries have become increasingly more service oriented, rather than manufacturing oriented. In fact, today’s Japan has seen its industrial structure become remarkably different from 50 years ago: currently, the service industry accounts for 65 percent of Japan’s GDP. In Japan today, it is the normal business practice in the service industry to apply VA/VE, just as the manufacturing industry did 50 years ago. In this paper, the author, as a leading expert, describes VA/VE application in the Japanese service industry – their current status, differences in their application between service and products, and four movements, respectively. INTRODUCTION Soon after Lawrence D. Miles developed VA, it rapidly spread in the manufacturing and construction industries worldwide. Japan was no exception; indeed, almost all of its automobile and electronics companies employed VA/VE. Over the past 50 years, the population of Japan has grown 1.5 times – from 85 million people to 126 million people. During the same period, its GDP has grown 500 times – from 1 trillion yen to 500 trillion yen. As a result, Japan, known as the world’s factory, achieved the world’s second highest GDP. This growth was in great part made possible by VA/VE. Since the early 1990s, however, this trend has changed dramatically, due to reduction in the manufacturing and construction industry and expansion in the service industry (Figure 1). Accordingly, Japan’s consumption trend has transformed itself from collective, mass consumption for conformity to individual, wide consumption for diversity. Amid such transition, people in the service industry have cast their attention to VA/VE: notably, the information technology, food service, and advertising industry. VA/VE have been the center of attention among Japan’s chief industries because they are the world’s best methods for improvement and problem-solving. However, traditional VA/VE should be modified for their application to the service industry because service has unique characteristics, different from those of products. FOUR CHARACTERISTICS OF SERVICE VE The author describes four characteristics of service as follows. Definition of Service In this paper, the word ‘service’ is defined as all that a customer experiences from a service provider – its people/employees and place/company: For example, treatment and hospitality. One should be aware that ‘service’ is by no means ‘mono’ or a tangible, product, but ‘koto’ or intangible, treatment and hospitality. The author follows this definition of ‘service’ as customers’ experience. In ‘service,’ there are the following four characteristics to consider: 1) It is intangible; 2) It cannot be stored and reproduced: 3) It is produced and provided simultaneously; and 4) It varies from customer to customer (Figure 2). 39 100% 90% 80% 70% 60% 50% 40% 30% 20% 10% 0% 36% The service industry The manufacturing and construction industry 23% The agriculture, forestry, and fisheries industry 41% The service industry 69% The manufacturing and construction industry 26% 5% 1949 2007 Figure 1: Japan’s GDP Product Service Tangibility Intangibility Persistence Perishability Heterochrony Simultaneity Homogeneity Heterogeneity Figure 2: Characteristics of service Function Improvement Cost Reduction Product Service Figure 3: Difference between Product and Service Intangibility: Service is intangible Service is intangible by nature: It has no form and one cannot touch it. There exist customers who seek this intangible service and pay for it. In contrast, products are tangible: They have a form and one can touch it. Therefore, it is clear to know what a product is. From these, there are the following points to consider when one deals with service: Clarify areas for improvement; Difficult to recognize; Esteem Function is enhanced when service is improved; 40 Cost is not the only resource that a customer consumes; More Value improvement is made when F is enhanced in V = F/C (Figure 3). Perishability: Service cannot be stored and reproduced One cannot keep and reproduce service, once it is offered to a customer. It is intangible and it disappears once a customer receives it. To disappear means to be perishable. Service cannot be mass-produced and stored, or cannot be produced in a convenient place and moved to a different place. Service is a ‘one-shot deal.’ Contrarily, products can be stored. They are still there after a customer has received them, and she/he can bring them home and can use them when necessary. Also, products can be manufactured in a suitable place and can be moved to a different place: One can control their production and quality. When there is any defect, it can be repaired and restored. From these, there are the following points to consider when one deals with service: The whole production process is revealed. Heterogeneity: Service varies from customer to customer Service varies among its receivers. Its performance depends largely on its receivers. According to their experience or expectation, customers’ satisfaction may go up or down. In short, service performance is unstable and varies. Conversely, products’ performance is stable regardless of their receivers. They can be produced as specified. Products’ receivers can check their performance beforehand. Customers can gain satisfaction by trusting their specifications. From these, there are the following points to consider when one deals with service: Its performance is up to its customers for their varying experience and knowledge; Its sufficiency level is not necessarily correlated with its customer’s satisfaction; It is largely up to its provider’s skills. FOUR NEW MOVEMENTS OF VA/VE Perishable and cannot be reproduced; Cannot be produced in advance; Cannot be stored or kept; Difficult to check if performance has been achieved. Simultaneity: Service is produced and provided simultaneously Service has simultaneity in its stages of production and provision. In other words, service is produced where a customer receives it: That is, it is both time and space specific. Because service is produced when a customer receives it, its whole production process is open to the receiver. Once it has been produced, it cannot be reversed. By comparison, products are produced and provided in different places. They are neither time nor space specific. They can be produced without their receivers, and their production process is not open to the receivers. In case there is any flaw in their production, products can be reproduced. From these, there are the following points to consider when one deals with service: Time and space specific; Produced together with a receiver/customer; ‘One-shot deal’: Cannot be reversed; Finally, the author describes four new movements of VA/VE applications to the Japanese service industry as follows: Concept of the Functional Approach The first movement is about the concept of the Functional Approach (hereinafter called FA). VA/VE have a long history of modifying and developing their application specifically to the manufacturing and construction industry. Consequently, their application has diverged away from other industries. People in the service industry would not initially accept VA/VE, as their names include the words ‘Analysis’ and ‘Engineering,’ which do not sound right for them; it takes a great amount of time for them to accept VA/VE. Considering this background, VA/VE experts in Japan have come to realize that they should go back to the original concept of the FA (Figure 4), as its founding father, Lawrence D. Miles, says that the effect of VA lies in the FA. In other words, VA/VE should be applied to the service industry on the basis of the FA as the VA/VE principle lies in the FA. This notion has brought about an FA consultant, an FA research institute, and several business books on FA. 41 Value Analysis Value Engineering Value Management … Functional Approach Figure 4: Concept of the FA Function, not the service itself. The Use Function of a product is to be put to the test at a time when its users use it after purchase. In contrast, the Esteem Function of service may be put to the test even before users purchase it: when its Esteem Function does not meet the users’ expectations, they will not become customers (Figure 5). In Japan, studies on Esteem Function are ongoing, with new techniques developed, and have resulted in the publication of three theses at the SAVE Value Summits. Understanding of Esteem Function The second movement is about the understanding of Esteem Function. VA/VE have dealt mainly in Use Function. Use Function is defined as a practical use or function for a product’s original use purpose; Users of a product want its Use Function, not the product itself. In the case of service, it is a little different. One should understand the Esteem Function of service. Esteem Function is defined as the effect or target of users’ feelings for service: Users of service want its Esteem Level Use Function Point of Sale Time Figure 5: Understanding of Esteem Function 4 Service 3 2 Product 1 F V+ V C Figure 6: Directions of Value improvement Directions of Value improvement The third movement is about the directions of 42 Value improvement. The basic formula to calculate the Value: V = F/C is very important. This very formula has made it possible to develop multiple Value improvement methods. These methods are used in the following three cases: when Cost changes; when Function changes; and when they both change. The good point of this formula is that one can check the improvement of Value at all times when Cost or Function change. One should improve Value when any improvement is needed (Figure 6). On the one hand, improvement for products requires their cost reduction, so Value has been improved by way of cost reduction. On the other hand, improvement for service usually requires Function improvement, so one should improve Value by way of Function improvement. In Japan there are increasingly cases where Value is improved by means of Function improvement. A formula to calculate economic effects has been developed and presented in panel discussions at the SJVE conferences. The formula has also proven effective in business management. Ingenuity exercised in developing service evaluation methods The forth movement is about ingenuity exercised in developing service evaluation methods. Service is both intangible and perishable. When it comes to evaluating service, its Esteem Function is often to be evaluated. This makes it extremely difficult to see if Value has really been improved. Esteem Function cannot be calculated easily. Thus, one needs to employ a technique to quantify the feelings of users who have received service: that is, ‘Like’ or ‘Don’t like’. ‘Good’ or ‘Bad’ cannot be used for service as they are used to evaluate Use Function for products. For a questionnaire for service users, ‘Like’ or ‘Don’t like’ should be asked. In Japan, the Kansei Analysis has been established to quantify the Esteem Function for service, and has been used in the fields of music and industrial design, or at VA/VE workshops. CONCLUSION In this paper, the author has described the following latest trends of VA/VE in Japan: The Japanese industrial changed markedly; structure has Service has unique characteristics, different from those of products; There are new developments and movements in VA/VE in Japan. It was 1997 when the author came to know VA/VE and felt infinite potential in its concept and effect. Then, he felt it was his mission to apply them to public works projects, and set the Japanese standards for VE ordering systems. Further, he came to realize that VA/VE should be applied to other industries besides the manufacturing and construction industry, and has studied them and accumulated their application cases. This paper contains the essence of his experience and knowledge, gained through such activities. The author would like to extend his appreciation to Lawrence D. Miles for the creation of such a superb concept as the FA and to the author's many mentors as well. REFERENCES 1. Hisaya Yokota (2008) For Whom are Public Works? A Value-added Facilitation Technique for Public Works, The 48th Annual Conference Proceedings, SAVE International, U.S.A. 2. Hisaya Yokota (2010) Functional Approach Introductory Book for Problem Solving, Discover Twenty-One, Japan 3. Hisaya Yokota (2011) Functional Approach to Corporate Management, The 44th Annual Conference Proceedings, SJVE, Japan 4. Kayo Uchida (2013) Application of Esteem Function Analysis and Evaluation to VE Studies, The 53th Annual Conference Proceedings, SAVE International, U.S.A. 5. Hisaya Yokota (2014) Two Successful Cases of VA/VE Application to Large-scale Organizations, The 54th Annual Conference Proceedings, SAVE International, U.S.A. 6. Hisaya Yokota (2014) The Esteem Function and VE for the Service Industry, The 3rd Value Engineering Asia Conference Proceedings, SAVE International and SJVE, Japan 7. Sayaka Uchimura (2014) A case of VE application in food service industry, The 47th Annual Conference Proceedings, SJVE, Japan 43 USING FAST AS A KNOWLEDGE MANAGEMENT TOOL ON FALL RISK ASSESSMENT OF ADVANCED SHORING BRIDGE CONSTRUCTION PROJECT USING BAYESIAN NETWORK TRANSFERRING FROM FAULT TREE ANALYSIS Dr .Ching Lung Liao Professor Department of Civil Engineering National Taiwan University Taiwan, And Ching-Shen Chen, AVS, PE Director Department of MRT Bureau of High Speed Rail, MOTC Taiwan And Dr. Po-yi Chang, CVS LIFE, MATRIZ Level 3 General Manager Marcus Consultant Company Ltd. Taiwan, And Dr. Tung-Tsan Chen, PE, MATRIZ Level 3 Associate Professor, Department of Civil Engineering and Engineering Management National Quemoy University Taiwan, ABSTRACT Functional Analysis Systematic Technique (FAST), is an important knowledge management (KM) tool in Value engineering workshop. Accidents of bridge construction usually brings serious causalities. Among them, Fall is most common during bridge construction. Currently safety management on site is mainly relied on assessment of check tables. Yet, the assessment result is influenced by the ability and experience of the evaluator and not possible to achieve consistent and systematic assessment objective. Moreover, most critical factors that can prevent occurrence of accidents can not be found from exiting safety management and assessment methods. This paper firstly applied Fault Tree (FT) to explore systematically factors of fall occurrence during bridge construction and by top-down hierarchy analysis to understand the relationships of fall causes. Afterwards, a Bayesian Network, (BN) model is built by converting Fault Tree to assess the fall risk of bridge construction projects. Analyzing causes and the relationships of causes by BN to collect probability before event and calculate the probability of the entire event. Using the model to analyze and validate with the current bridge projects under construction, the results show that the results from Bayesian Network is consistent with conventional labor safety performance assessment. Therefore the ability to manage site safety of the model is proven. By improving assessment and understanding of the fall risk probability during construction, an appropriate prevention safety measurement strategy can be established and allocate resources on critical labor safety operations in early stage. The occurrence of bridge construction fall, casualty and financial loss thus can be reduced. Finally, we try to use FAST as a KM tool to integrate the results for future VE workshops. 44 INTRODUCTION Construction industry plays an important leading role in major national projects. Site safety of construction industry and national development is closely correlated. Transportation facility, which is highly related to civic life, living environment and quality, plays an important role and is one of the major index of national development, thus a foundation of national development. A complete transportation network that enhances social benefits, saves time and creates lots of convenience, no matter high speed rail or highway system, relies heavily on the application of bridge. As modern technology grows, various new bridge construction methods are developed. However, the new constructed bridges are with splendid appearance and shape but complicated structure and hard to construct. Once the design is not appropriate, poor quality, unexpected appearance, excess cost and even site casualty might be occurred. Based on the above-mentioned problems, it is imperative to reduce the occupational accidents by finding out the defects encountered during existing bridge construction, try to build their correlation and analyze the probability of occupational injuries and casualties, further propose counter measurements for the reference of bridge constructers. The research analyzed the past ten years data from the Construction Knowledge Platform of Major Occupational Injuries & Casualties and found that fall is the major accident. Therefore, fall of the bridge construction is the major axis of the research. Our goal is to prevent the fall accidents during construction. Finally, we try to use functional analysis and FAST as a KM tool to integrate the results for future VE workshops and for the safety management of other construction projects . LITERATURE REVIEW This research adopts the deduction logic of Fault Tree to judge the event causes and the relationships among factors. Bayesian Network is applied to cope with the problem of sufficient data and calculate value of probability, therefore literature review are focused on Fault Tree, Bayesian Network, Fall Tree conversion to Bayesian Network , Bridge Construction and Functional Analysis Technique ( FAST). Fault Tree Analysis (FTA) is a technique that can effectively analyze the cause and effect relationship and probability of an event. However, some factors are fuzzy and include human errors. The occurrence probability is hard to assess accurately. Rodak and Sillima (2012). Fault trees (FT) integrated with probabilistic risk analysis (PRA) was applied on the management of underground water resources. Durga Rao (2009)applied traditional Fault Trees analysis on complicated engineering systems to assess the reliability and safety. A defined gate is added on the definition of Dynamic Fault Trees to simulate the complicated interactions. Chen (2005) proposed an analysis model integrated with FTA, Fuzzy Set ( FS ) and Analytical Hierarchy Process(AHP)to assess the risk of retaining wall excavation. Lai (2009) used Fuzzy Fault Tree Analysis to analyze the deteriorating factors of the bridge abutment. Several scholars and experts use Bayesian Network (BN) on educational tests such as Mislevy, Steinberg, and Almond (2002) and Mislevy, Almond, and Lukas (2003).The proposed “Evidence-Centered Design (ECD) Assessment Design” is based on the framework of BN as the diagnosis and analytical tool. The analysis is conducted through technical analysis of BN probability model combining with Test Reaction Theory Parameters Model to understand the feasibility of BN application on TASA. Construction industry encountered several uncertainty and risk on safety. Historical data is insufficient to cause some probabilities are unable to obtain correctly. Yang (2008) used Bayesian Network to combine objective experts’ opinions. Probability value of BN conditions are deducted through objective experts’ opinions. Yang’s research enables BN to be analyzed by more reliable probability in the following research. Functional analysis is the heart of Value Engineering, and the FAST diagram is used as the primary tool for functional analysis, helping a team to visualize the hierarchical functional relationships and focus their creative energy on finding better ways to accomplish a given function. Typically, some functions on the 45 FAST diagram are highlighted as promising areas for brainstorming (Lewis, 2001). Functional discussions for FAST diagramming require the involvement of every team member. The exercise is particularly helpful for integrating new team members, and gives them practice in thinking in terms of functions, while providing a complete overview of the entire problem. FAST diagramming also promotes an appreciation for the various aspects of a problem that must be considered, before devising a realistic solution(Parker, 1978). Adapting the ideas and expressions of others is accepted as one of the best creative techniques, and should be encouraged throughout the entire FAST diagramming process. Team members should be encouraged to engage in role-play to view the problem from different standpoints (Parker, 1978). STATISTICS CONSTRUCTION ACCIDENTS OF TAIWAN OCCUPATIONAL According to the occupational accidents cases from Ministry of Labor (200-2010), The occupational accident rate of construction industry is relative high as figure 1.. Moreover, examining the 88 accident cases for bridge engineering in the past 10 years from Ministry of Labor, we found that there are 97 casualties, 66 serious injuries and 5 minor injuries. Among the reported accidents, the most frequent occurred accidents, taking understructure for example, are the falling and rolling off (Table 1). Most of the accident occurring reasons might be environmental constraints, unsafe behavior of labor, human misconducts problems of mechanical equipment, lack of expenses and speed-up schedule etc. Among the reasons listed above, some safety procedures are not strictly complied or other unsafe conditions because of the speed-up schedule might cause accidents that might be supports of form work or steel collapse, falling of concrete mass when RC grounding or dismantle of supporting frames. These above-mentioned reasons usually cause major accidents including casualties and serious injuries, huge damage of machinery, materials loss and progress delay problems as well on safety aspect and economic aspect. METHODOLOGY & RESEARCH PROCESS This research uses fault tree analysis (FTA) to analyze the correlations of the falling/rolling off from bridge construction and the related operations of occupational accidents; Bayesian Network (BN) is then applied to calculate the probabilities of the related operations of occupational accidents. Building a BN is rather complicated because problems often occurred in its network structure. This paper firstly build FTA system, afterwards, convert into BN framework, finally experts' experiences are integrated into BN nodes and expressed by conditional probability table(CPT). The proposed conversion process of FTA and BN is depicted in details as figure 2 and in following secession, FAULT TREE ANALYSIS (FTA) Fault Tree Analysis (FTA) firstly assesses one specific unwanted event as the top event. A top-down approach is adopted to construct FTA. Starting from top event to the causes till the fundamental elements, the relationships among events and causes are defined and expressed by “AND” and “OR” logic gates. ( Bobbio et al. 1999; Xiao et al. 2008; Boudali, Dugan 2005; Bobbio et al. 2001; Marsh, Bearfield 2007; Qian et al. 2005; Franke et al. 2009). FTA is a qualitative or quantitative analysis of the drawbacks and weak points of a system, therefore FTA can be comprehensively applied on the reliability and safety tests and fault diagnosis decision model (Ebeling 1997; RAO 1992; O’connor 2002; Kales 2006). Through logic deduction, FTA is able to insight the improvement and maintenance of a system design. The event of the traditional FTA approach is assumed to be statistically independent and binary states that are failure and normal. BAYESIAN NETWORK (BN) Combining theory of probability and graphic theory, Bayesian Network (BN) includes node, links and conditional probability tables (CPTs) between nodes. BN is graphic probability model in which a set of random parameters and their associated relationships are expressed by a directed acyclic graphical model. BN has higher efficiency and deduction accuracy under uncertainty. BN is particular suitable for complicated systems and highly correlated elements (Qian et al. 2005; Doguc, 46 Ramirez- Marquez 2009; Bobbi et al. 1999; Xiao et al. 2008). In recent years, BN is widely applied on areas with high uncertainty or areas that interactively affected such as aids of diseases diagnosis, industrial design, financial investment, ecology, machine failure system, files filtering and factory planning under uncertainty etc (Qian et al. 2005; Doguc, Ramirez-Marquez 2009; Bobbi et al. 1999; Xiao et al. 2008). As stated above, there are 3 ways to build BN as follows: (1) Learn from vast amount of training data; (2) based on experiences of area experts; and (3)mixed of (1) & (2). Because of the data usability and constraints, the second method is usually used on the practical BN building. Despite of this, it is difficult to build the correlated relationships of nodes in a network merely relied the knowledge of engineers and experts. Therefore, several processes that convert Fault Tree to Bayesian Network are proposed (Bobbio et al. 1999; Xiao et al. 2008; Boudali, Dugan 2005; Bobbio et al. 2001; Marsh, Bearfield 2007; Qian et al. 2005; Franke et al. 2009). Normally, it is a one to one corresponding when using FT logic to convert BN ; In other word, the logic gates of FT are converted to corresponding physical nodes of BN. Nevertheless, the definitions of a BN node and a logic gate of a FT are discrepant. An event node of a BN is to express a variable of a problem definition and a logic gate of a FT is to describe the logic relationships between nodes. With respect to conversion of FT and BN, event nodes and logic gates should be processed separately. In the process of logic gate conversion, conditional probability table (CPT)of BN is equal to logic gate of FT, which should be analyzed by probability value is less than 2 states or more than 2 states. CONVERT FAULT TREE AS BAYESIAN NETWORK . The proposed converting process is divided as two parts, structure conversion and calculation of CPT. The fundamental steps of structure conversion include :(1) Direct conversion from events of Fault Tree and vertical connects to nodes and basic links of Bayesian Network (excluded logic gates); and (2)Inert supplementary links through knowledge of experts and engineers. Moreover, the calculation of CPT is conducted based on the logic gates of nodes. Each step is illustrated in details on the sections as follows : Structure Conversion The proposed method to convert BN from FT is based on previous applied technique (Qian et al. 2005; Xiao et al. 2008; Fenton, Neil 2004; Boudali, Dugan 2005; Enrique et al. 1997; Bobbi et al. 1999; Xiao et al. 2008). Top event, middle event and basic event of a Fault Tree reflects to the nodes of Bayesian Network. The basic arrows between nodes of BN are defined according to the events relationships of FT. Furthermore, some supplementary links with meanings are inserted into BN framework based on the opinions of experts. In summary, the process of converting FT into BN is depicted as follows: 1.All FT events including fundamental events, middle events and top event are corresponding to the nodes of BN. The redundant FT events are eliminated, which is only expressed by a BN node. 2.The relationships of links and nodes of BN are defined by the relationships of FT events. 3. If there are meaningful relationships within a BN structure, but are not well defined in a FT, arrows should be inserted into the fundamental BN to express the interactive relationships of nodes in a clear manner. Calculation of Conditional Probability Table (CPT) If a node has some father nodes in a BN or if there are some states of every father nodes and son nodes, then the structure of the CPT become rather complicated, for example, a son node has two father nodes and the number of their states is 5, and the number of CPT will expand to 53 (125). Besides, value of CPT is normally defined by the experiences of experts. A discrepancy of CPT value might be occurred, especially, the above mentioned complicated states of CPT. AgenaRisk software is used to deal with the above mentioned difficulties in the research process. Through parameter definition in the software and the weights of nodes defined by the experts, the probability value in the CPT can be calculated promptly. When using AgenaRisk to define the CPT, it is a key step to express function definitions in the software. There are two major logic gates, “ AND” & “OR”, in FT defined as follows: 47 At selection of expressing function items, if the corresponding logic gate of FT is “AND” , then the smallest is chosen, if the corresponding logic gate of FT is “OR”, the biggest is chosen. Through deduction and the consistency of Fault Tree analysis and Bayesian Network, the failure probability of the top event can be proved. In other word, assumed that there are two independent events A and B. Their top event is C. There are two states: A1 , B1and C1is normal, A2,B2 and C2 is failure state. Based on the assumption of independent event and “AND” logic gate of FT, the failure probability can be calculated as follows, P(C2 ) P( A2 B2 ) P( A2 ) P( B2 ) ..(1) Use concept of BN, the failure probability can be calculated .as: P(C2 ) C2 A1B1 A1 B1 C2 A1B2 A1 B2 C2 A2 B1 A2 B1 C2 A2 B2 A2 B2 0 A1 B1 0 A1 B2 0 A2 B1 1 A2 B2 P( A2 ) P( B2 ) Define the functions of the risk IDs of the Bayesian Network. Summarize the functions and then construct a FAST diagram to record the knowhow. Use FAST diagram as a knowledge management tool to carry on the lessoned learned. BAYESIAN NETWORK BASIS RISK ASSESSMENT ON FALLING OF BRIDGE PROJECT According to the proposed BN building process, a risk assessment model on falling of bridge project based on BN is developed. In order to gain better knowledge supports and model building, this research invite 36 experts to assess 97 questions based on their professional practical experiences. Besides, in order to validate the model, 4 bridge construction projects using advancing shoring method are selected to validate the model. Finally, the causes that sensitively influenced falling risk are assessed. Through sensitivity analysis and discussions, the detail model development is described as follows: …………………………………………..(2) According to the assumption of independent event and “OR” logic gate, the failure probability can be defined as follows: P(C2 ) P( A2 B2 ) P( A2 ) P( B2 ) P( A2 B2 ) 1 [(1 P( A2 )) (1 P( B2 ))] 1 P( A1 ) P( B1 ) CONSTRUCT FAULT TREE FRAMEWORK …………………………………………(3) Because most of the occupational accidents According to the concept of BN, the failure occurred at the bridge construction projects is probability can be deducted as: P(C ) C A B A B C A B A B C A B A B C A B A B “falling”, therefore “falling” is selected as the 0 A B 1 A B 1 A B 1 A B top event of fault tree in the research. Under A B A B A B the safety management domino theory (Heinrich 1 P( A ) P( B ) 1931), the causes of work falling accidents can ………………………………………………(4) be categorized as accident location and accident Compare(3)and(4), we can find that the condition, such as steel frame support work, top event probability of FTA and BN is the bridge deck structure and hoisting operation same. At AgenaRisk software, the selection of etc. , indirect causes such as unsafe behaviors, expressing function is according to the logic unsafe equipments and unsafe environments etc. gate of FT, then weights, that are the and fundamental causes such as inappropriate comprehensive opinions from experts on the safety plan, inappropriate environment contributions from father node to son nodes, are maintaining, insufficient safety training and decided and input. poor safety management etc. The weight range from 1 to 5. Weight 1 point Theses causes and top event are connected by represents the least influence of a father node to the logic gates as shown on figure 3.Take son node, weight 5 point represents the most falling accident of poor steel support operation influence. Once the above mentioned data are as example. Through expert interview and input into AgenaRisk, all CPT in BN can be literature review, the related works of the steel calculated promptly. Moreover, all probability support operation can provide more information of the top event and all middle nodes event as to enable a more detail analysis on the falling well can be deducted by AgenaRisk. accident event. There are 2 operations that might cause possible falling:(1)poor steel DEFINE FUNCTIONS OF BN ID AND support assembly and inappropriate forward CONSTRUCT FAST 2 2 1 1 1 1 1 1 2 2 1 1 1 1 2 1 2 2 2 2 1 1 2 2 2 2 1 2 1 2 2 2 2 2 2 2 1 48 movement; ( 2 ) Inappropriate dismantle of steel supports. The operation can be further decomposed as detail sub-operations as required. Moreover, the indirect causes that might cause falling events because of poor steel support operations will be analyzed in sequence. Finally, according to the domino theory and safety management concept (Jitwasinkul, Hadikusumo 2011; Lingard, Rowlinson 2005), the 4 basic reasons that cause occupational accident are as follows ︰ insufficient safety training, poor site environment management, poor safety and health management, inappropriate health and safety plan. Based on the records of occupational accident, safety theory and expert interview, the research assures the interactions of the fundamental reasons and indirect reasons in order to construct a whole fault tree. The completed fault tree of bridge construction project falling event is shown as figure 4 and Table 2 . CONVERTING FROM FAULT TREE TO BAYESIAN NETWORK Based on the conversion process stated in section 4, a Fault Tree diagram is converted to Bayesian Network, where the overlapped nodes are merged into one. Moreover, according to the data of expert experience, several meaningful supplementary links are added in the BN. A complete Bayesian Network is shown as Figure 5. Further analysis and exploration is as follows: CALCULATION OF CPT When a BN structure is building, AgenaRisk can be used to calculate conditional probability. The types for expressing functions are maximum risk value and the minimum risk value defined according to fault tree logic gate. Furthermore, the purpose of questionnaire is to collect the relative weight information of related father node and son node. Based on their practical experiences, 36 experts are invited to assess 97 questions. A statistic analysis is conducted based on their replies. Through input of above mentioned data, the conditional probabilities of the arrow lines of BN are calculated. Then, the fundamental cause probability along BN, ie before probability of BN, is assessed and keyed in into complete BN. Finally, after probability of BN nodes including top node and middle nodes can be deducted and calculated for analyzing the risk value of failure occurrence probability. ASSESSMENT OF BEFORE PROBABILITY As stated above, there are 4 obvious fundamental causes defined in the model. There are insufficient safety training, poor site safety management, poor safety and health management and inappropriate safety and health plan. In order to confirm the before probability of the causes, a safety measure of performance table was prepared, which is mainly prepared according to the important items of the safety performance check table, is established in the research. Every fundamental cause is listed in the table for further understanding. Through input before probability to BN, the falling risk probability of bridge construction project can be calculated and the important occurrence causes can be understood by means of this model. MODEL VALIDATION AND SENSIBILITY ANALYSIS The deducted result of BN is validated by the actual safety check records of 4 bridge construction projects in Taiwan. Sensibility analysis is conducted further to confirm the critical causes falling accidents of the bridge construction project. The result of the sensibility analysis can be the important reference of the future diagnosis and safety prevention strategy. MODEL VALIDATION The proposed Bayesian Network is validated from actual safety check records of 4 bridge construction projects and the results of after probability of top event of Bayesian Network. The basic information of the 4 bridge construction projects is shown as table 3 and of which the actual safety check record is concluded on table 4 . In the research process, the safety performance of every project is evaluated through the safety performance evaluation table. The before probabilities of the 4 fundamental causes are objective evaluation, then are input to AgenaRisk to deduct the after probabilities of the BN nodes. The comparisons of the BN model analysis results and the actual safety check records are shown in table 4. The findings of the results show that the ranking of the probabilities deducted from BN model is consistent with that of the actual safety check 49 records. The falling risk analyzed from BN of project 2 is 46.358% and that of project 4 is 45.471%. The risk percentage of the two projects are rather close, yet the difference of the actual safety record is only 4.28 points. A survey was conducted to scrutinize the monthly safety check records of the 4 bridge construction projects. The 1st project is actually an excellent project with excellent site safety management, no poor record on safety performance such as safety fines and possible occurrence events are lower than that of other 3 projects. On contrary, the raking last project is with worse safety management and the falling risk from BN model shows up to 81.264%. Through practical evaluation & validation on the 4 bridge construction projects, the result shows that the accuracy and adaptability of the proposed falling risk assessment BN model and proved the proposed model can be used as the falling risk assessing tool of bridge construction project applied advancing shoring method. SENSITIVITY ANALYSIS AND DISCUSSION To further examine the key causes of fall risk in the cantilever bridge construction projects, sensitivity analysis was performed and the key causes are summarized as follows. The most significant direct cause of falling is section blocks construction resulting in the fall and the lack of the safety facilities. Indirect cause include dangerous procedures or methods, improper behavior or posture, job-site environment disorder, unsafe equipment, poor self-management, no intermediate support, improper molding or operating. Finally, the root factors are safety and health planning. As shown on figure 6, Occupational accidents statistics of bridge construction shows that not using safety insurance policy or ignoring warning are the most major key causes of bridge construction whereas the occupational accident rate, which is 62%, of the bridge construction is the highest. The most sensitive indirect causes are not obeying working rules, non implementation of self management, without personal protection equipment, not actually fasten safety belt and string , wind inappropriate working environment etc. It explains that labor is working under inappropriate protection condition, which can easily lead to construction accidents. Based on the statistics of bridge construction occupational accidents, approximately half of the occupational accidents during bridge construction is because of inappropriate personal protection measurement as shown on figure 7. Finally, the most important factors are the fundamental management of labor safety and hygiene education and training, which play a vital role on prevention and reducing falling accident of bridge construction projects. To sum up, this model does not only assess the risk of falling accident of bridge construction site, but also confirm the major sensitive factors through sensitivity analysis. According to the above mentioned analysis, project manager may prepare safety prevention measures to reduce occurrence of falling accidents on bridge construction project site. Besides, falling risk assessment and sensitivity analysis enable us to allocate resources on key labor safety operations and thus substantial reduce the risk of falling accidents. FUTURE DEVELOPMENT The paper establishes an effective process to build falling risk assessment model based on Bayesian Network of bridge construction projects using advancing shoring method. The assessment model is based on problem domains and begin from the forming of fault tree. Convert fault tree to Bayesian Network, then obtain fundamental Bayesian Network. Besides, according to input of experts, the meaningful links between nodes are inserted into BN to complete the structure of BN. Finally, a logic converting method is developed to convert the logic gates of fault tree to the CPT of BN. A safety performance check table is constructed to assess objectively the before probability of fundamental causes. The BN theory results is validated on the 4 bridge construction projects in Taiwan. Through analysis and comparisons, it is found that result from BN analysis and the safety records of the 4 bridge construction projects is consistent. This implies that the converting process from multi states fault tree to Bayesian Network can effectively construct a real and accurate falling accident risk assessment model. Therefore, according to the assessment model and sensitivity analysis, site manager can decide 50 the safety prevention measurements and allocate resources in advance to obviously reduce the site falling accident risk. Despite of a good validation is already obtained on converting FT to BN, however, expert input is still required on links of nodes and CPT in using BN. Data provided by different experts will directly influence the accuracy and assessment quality of BN. Emphasis should be imposed on expert input in the future research. Besides, BN can learn from the raw data. If a complete and sound safety data is useable, then a subjective BN construction and parameters will be able to explore and built. Finally, other repeating occupational accidents in bridge construction projects such as collapsing, electricity shocks, hitting by falling objects etc might be applied BN extensively to cover a comprehensive safety diagonals, enhancing safety management and reducing site occupational accidents risk of bridge construction projects. INTEGRATE REACH FINDINGS WITH FUNCTIONAL ANALYSIS SYSTEMATIC TECHNIQUE A functional analysis was conducted on the risk ID of BN to define the functional requirements for solving the problems incurred by the risk ID. According the interviews of the site professional experts, there are two major categories of the risk ID: management aspect and technical aspect. As long as the site is well managed in a cautious and sound manner, the probability of the falling accident is relatively low. Therefore, the risk ID is further categorized as two groups: management and technical. The functional analysis of management ID is shown as table 2. Afterwards, a customer-oriented FAST of the management related risk ID was prepared by professional staff with site safety management experiences as figure 8. In the FAST, only primary functions are listed. The supporting functions such as " assure dependability". " assure convenience". " satisfy users" , and " enhance image" are not yet developed. As we know, the probability of every risk ID of the BN will be calculated by the software. The probability of every function defined can be allocated on table x1 and the FAST developed as figure 8 will be thus dimensioned with the probability of failure. The higher the failure probability is, the high priority the function improvement is. The research findings enable the site manager to identify the key functions to improve the site safety and prevent accidents. Figure 1 Fatalities per 1000 persons in construction industry and all industries (excluding deaths from occupational disease and traffic accidents), 2000–2010. 51 Table 1 Occupational accidents of the bridge Construction in Taiwan (2000–2010). Drowning Electri c shock Total 1 2 1 29 3% 7% 3% 100% Accidents Type Falling rolling Objects Falling Collapse Hit Number 17 2 6 Percentage 59% 7% 21% Figure 2 Transformation flow chart from FT to BN Figure 3 FT of falling accidents at cantilever bridge construction projects. 52 Figure 4 Overall FT of falling accidents of cantilever bridge construction projects.. T G2 G1 G3 F3 F1 D2 D1 E1 F5 F2 E2 F4 D3 D5 D4 C10 C11 C12 C14 C1 C2 C6 C8 C7 C4 C5 C9 C13 C3 C15 B11 D6 B6 B16 B10 B8 B7 B14 B2 B13 B17 B12 B1 B3 A2 A1 A4 A3 Figure 5 BN of falling accidents at cantilever bridge construction projects. Figure 6 Unsafe behaviors of occupational accidents of bridge construction projects. Figure 7 Unsafe conditions of occupational accidents of bridge construction projects. 53 How Why Guide working routes 2 Reduce accidents Prevent errors Alarm workers Facilitate vertical movements Facilitate access Identify locations Move workers Support workers Prevent collisions Assure clearance Control lift crane operation Protect workers Secure procedures Inspect procedures Train workers Hold workers Communic ate message Buffer falling force Prevent fallings Improve devices Figure 8 Safety Improvement FAST Diagram Table 2: Codes and definition of overall FT of falling accidents. Agena risk id Influence T Falling Risk of bridge construction projects G1 Falling caused by pier column poor construction G2 Falling caused by section deck poor construction G3 Improper lifting operation F1 Improper support steel frame assembles, uncoordinated body movement C4 C5 C6 C7 C8 C9 C10 C11 No safety belt and ring Strong wind improper working environment Improper safety equipment Worker climbing on hanging objects No safe net No guide wire installed No installation of boundary falling prevent railing Safety belt not fastened 54 F2 Incorrectly scaffolding dismantling F3 Poor form work F4 Improper concrete grouting F5 Improper pre-stress operation E1 Operation error of steel wire rope E2 Collision of hanging material D1 Operation error of pier top D2 Improper installation of supports D3 Operation error of main frame installation D4 Improper dismantle of main frame D5 Operation error of carane D6 No guide wire C1 No safety belt C2 Block of up and down passage C3 Improper operation of working vehicle A1 Poor H/S training A2 Poor environmental maintenance A3 Poor H/S planning A4 Poor H/S management C12 C13 C14 C15 B1 B2 B3 B6 B7 B8 B10 B11 B12 B13 B14 B16 B17 Workers stand behind jack No intermediate supports Improper instruction of lifting operation Operation errors of operator Poor control process incorrect operation process Dangerous process or method Improper behavior or gesture Not obeying working rules Error operation Site disorder Material disorder No safety device Unsafe devices No personal protective equipment Fail to implement self-management Lack of safety labeling Table 3 Basic information of five cantilever bridge construction projects Length Project No. Size (Span) Period (days) Cost (NT$) 1 1350 m 27 505 216,000,000 2 1989 m 39 733 253,500,000 3 1128 m 24 450 216,000,000 4 1785 m (51*35) 35 675 309,050,000 Construction method Advancing shoring method Advancing shoring method Advancing shoring method Advancing shoring method Table 4 Comparison between BN and real site assessment. Project No. Falling Risks from BN (%) Risk rank by Real site assessment BN Rank (score) 1 30.096 4 2 46.358 2 3 81.264 1 4 45.471 3 4 (89.65) 2 (82.34) 1 (76.06) 3 (86.62) Table 5 Management related Risk ID Agena risk id Category Influence Function Analysis 55 T G1 Management Falling Risk of bridge construction projects Falling caused by pier column poor construction Management G3 Improper lifting operation Management F2 E2 Incorrectly scaffolding dismantling Management Collision of hanging material Management D5 Operation error of carane Management D6 No guide wire Management C1 No safety belt Management C2 Block of up and down passage Management C3 Improper operation of working vehicle Management C4 No safety belt and ring Management Strong wind improper working environment C5 Management C6 C7 Worker climbing on hanging objects Management C8 C10 No safet net Management Management No guide wire installed No installation of boundary falling prevent railing Management C11 support structure Support workers Assure clearance Stabilize structure Alarm workers Secure lifting objects Protect workers Dismantle components Identify components Secure procedure Protect workers prevent collision Protect materials Identify components Secure procedure Protect workers Confirm lift crane operation secure procedure Guide working routie Protect workers Protect workers Buffer falling forces Move workers Facilate vertical movement Protect workers Control working vehicles operation protect workers Prevent falling Protect workers Buffer falling forces Hold workers Resist wind protect workers Improper safety equipment Management C9 Reduce accidents Safety blet not fastened protect workers Facilitate access Inspect procedure Protect workers Protect workers Buffer falling forces Hold workers Guide working routie Protect workers Protect workers Buffer falling forces Hold workers Protect workers Buffer falling forces Hold workers Inspect procedure Train workers 56 C12 C14 Management Management Workers stand behind jack Improper instruction of lifting operation Material disorder Protect workers Inspect procedure Communicate message Train workers Inspect procedure Train workers Prevent errors Inspect procedure Train workers Prevent errors Inspect procedure Train workers Prevent errors Inspect procedure Train workers Prevent errors Improve procedure Inspect procedure Train workers Prevent errors Improve procedure Inspect procedure Train workers Prevent errors Improve procedure Inspect procedure Train workers Prevent errors Improve procedure Inspect procedure Train workers Inspect procedure Train workers No safety device protect workers Unsafe devices Prevent errors protect workers Prevent errors Management C15 Operation errors of operator B1 Management Pooer control process B2 Management incorrect operation process B3 Management Dangerous process or method Management B6 B7 Improper behavior or gesture Management Not obeying working rules Management B8 B10 Error operation Management Management B11 B12 Management Site disorder Management B13 Improve devices B14 Management No personal protective equipment protect workers Fail to implement self-management Prevent errors Inspect procedures protect workers Prevent errors Management B16 Inspect procedures B17 Management Lack of safety labeling CONCLUSIONS According the features of FAST mentioned by protect workers Prevent errors Inspect procedures Alarm workers Jerry Kaufman (Kaufman, 2002), the FAST developed in the paper enable helps prioritize activities, determines where to set objectives, 57 probes process vulnerabilities, outlines policies and procedures and selects functions for brainstorming. In addition to the features above, FAST in figure 8 can work as a functional bench marking to record and summarize the knowledge of site expertise and dimensioned the functions with the probabilities calculated on BN derived from fault tree and the questionnaires replied by site professions. A customized FAST will be dimensioned and a quick diagnosis can be made on a site to prepare the counter measurement safety improvement plan and thus reduce the site accidents. REFERENCES 1. Bobbio, A., Portinale, L., Minichino, M., Ciancamerla, E., “Comparing fault trees and bayesian networks for dependability analysis, ” Lecture Notes in Computer Science, Computer Safety, Reliability and Security Vol. 1698: pp. 310-322 (1999). 2. Bobbio, A., Prauzy, A., Minichino, M.,“Improving the analysis of dependable systems by mapping fault tree into bayesian network,” Reliability Engineering and System Safety, Vol. 71, No. 3, pp. 249-260 (2001). 3. Boudali, H., Dugan, J.B., “A discrete-time bayesian network reliability modeling and analysis framework,” Reliability Engineering & System Safety Vol. 87, No.3, pp. 337-349 (2005). 4. Doguc, O., Ramirez-Marquez, J. E.,“An efficient fault diagnosis method for complex system reliability”, in Proc. of the 7th Annual conference on System Engineering Research 2009, Session 12 – Systems Assessment & Assurance (2009). 5. Durga Rao, K., Gopika, V., Sanyasi Rao, V.V.S., Kushwaha, H.S., Verma, A.K., Srividya, A.,“Dynamic fault tree analysis using Monte Carlo simulation in probabilistic safety assessment”, Reliability Engineering and System Safety ,Vol. 94,pp.872–883 (2009). 6. Ebeling, C. E., “McGraw-Hill, ”An Introduction To Reliability and Maintainability Engineering. 1st Ed., Inc., New York. pp. 486 (1997). 7. Enrique, C., Jose, M.G., Ali, S.H., “Expert Systems and Probabilistic Network Models”. , Springer-Verlag,1st Ed. New York., pp.605 (1997). 8. Fenton, N., Neil, M., “Combining evidence in risk analysis using bayesian network,”Safety Critical Systems Club Newsletter, Vol. 14, No. 1, pp. 1-6 (2004). 9. Franke, U., Flores, W.R., Johnson, P., “Enterprise architecture dependency analysis using fault trees and bayesian networks,” in Proc. 42nd Annual Simulation Symposium (ANSS 2009), San Diego, CA, pp. 209-216 (2009). 10. Heinrich, H .W., “Industrial Accident Prevention,” 4th Ed., New York,(1931). 11. Jitwasinkul, B.; Hadikusumo, B.H.W. Identification of Important organizational factors influencing safety work behaviours in construction projects, Journal of Civil Engineering and Management Vol.17, No.4,pp.520-528(2011). 12. doi:10.3846/13923730.2011.604538 13. Kales, P., Reliability for Technology, Engineering, and Management. Taiwan ed. Pearson Education Taiwan Ltd., Taipei. pp. 392 (2006). 14. Lingard, H.; Rowlinson, S.,“Occupational Health and Safety in Construction Project Management”. 1st Ed. Spon Press, London. pp.440(2005). 15. Marsh, W., Bearfield, G., “Representing parameterised fault trees using bayesian networks,” Computer Safety, reliability, and Security, Lecture Notes in Computer Science. 4680/2007, pp. 120-133 (2007). 16. Mislevy, R.J., Almond, R.G., Lukas, J. F, A brief introduction to evidence-centered design, pp.8-19(2003). 17. Mislevy, R.J., Almond, R.G.,& Steinberg, L.S., Enhancing the design and delivery of assessment systems: A four-process architecture, Journal of Technology, Learning, and Assessment, Vol.1, No.5, PP.1-66(2002). 18. O’connor, Patrick D.T. Practical Reliability Engineering. 4th Ed. John Wiley & Sons, Inc., New York, pp. 513 (2002). 19. Qian, G., Zhong, S., Cao, L., “Bayesian network based on a fault tree and its application in diesel engine fault diagnosis,” in Proc. of the International Society for Optical Engineering. Chongqing, China, pp. 60421P-1-60421P-6 (2005). 20. RAO, S.S., Reliability-Based Design. 1st Ed. McGraw-Hill, Inc., New York, pp. 569 58 (1992). 21. Rodak, C., Silliman, S.,“Probabilistic risk analysis and fault trees: Initial discussion of application to identification of risk at a wellhead”, Advances in Water Resources ,Vol.36,pp.133–145(2012). 22. Xiao, L., Haijun, L., Lin, L., “Building method of diagnostic model of bayesian networks based on fault tree” in Proc.of the International Society for Optical Engineering, Beijing, pp. 71272c-1-71272c6(2008). 23. Chen, Y. Z. ” Fuzzy Fault Tree Analysis of Bridge Pier Deterioration”, Mater Thesis, National Cheng Kung University, Tainan( 2009). 24. Chen, F. M., “The Risk Analysis of the Building Retained Excavation Accident ” ,Mater Thesis, Mater Thesis, National Kaohsiung University of Applied Sciences,Kaohsiung (2005). 25. Kaufman, J.J, “MOD II Course:Managing Value Management”, MOD II training material, Denver, USA (2002). 26. Parker, D., 1998, Value Engineering Theory, 3rd edition, The Lawrence D. Miles Value Foundation, Washington, D.C. 27. Lewis, J., “Using treemaps to tie QFD and 6 sigma concepts to function analysis,” SAVE Proceeding, 254 – 275 (2001). 59 THE IMPORTANCE OF THE “AS-IS” AND “SHOULD-BE” FUNCTION ANALYSIS IN VA/VE PROJECTS Marc Pauwels, Ph. D. President Krehl & Partner GmbH & Co. KG Karlsruhe Germany ABSTRACT The importance of Function Analysis in VA/VE workshops and projects has not to be explained to the VA/VE practitioners: it is clear. Getting rid of focusing on existing solutions of a product or process and focusing on its functions is essential in developing and optimizing products or processes. Over the 20 years of experience in VA/VE projects and having a deep insight into numerous performed VA/VE studies, the author has recognized that a lot of facilitators only focus on the “as-is” functions and as a consequence only on the “as-is” functional cost. Unfortunately, with this procedure a very valuable part of function analysis is lost. The chance of getting the most optimized result is decreased. This paper wants to share the experience of using Function Analysis in its full functionality: “as-is” and “should-be”. What are the possibilities to define the “should-be” functional cost and what is the value for the project of having done this exercise? These are the questions that will be answered by this paper. THE FUNCTION ANALYSIS – GENERAL REMARKS What are the functions of Function Analysis? This could be a good starting point of this paper and the answer should be given by all VA/VE practitioners. Here is a short list: • Promote understanding (of product or process) • Create (same level of) knowledge • Support communication (within the team) • Support learning process • Recognize importance (of functions) • Encourage motivation In the opinion of the author, the journey is the reward and not the final result, a FAST diagram or a function tree. This function structure can only be the final, graphical result of the Function Analysis, but never the only targeted outcome of it. With this knowledge in mind, it is essential to perform the function analysis by the team and never have it done by the facilitator or a team member offline. STARTING SITUATION Function Analysis is a very important part in VA/VE studies – workshops and projects. Besides the structured procedure with the VA/VE job plan, the cross-functional teamwork and the specific focus on creativity, the Function Analysis is the backbone of every VA/VE study. A VA/VE study without Function Analysis is not a VA/VE study! But what are the essentials of Function Analysis and how can it be improved? What is the benefit of the full Function Analysis, i.e. the “as-is” situation as well as the “should-be” situation? Figure 1 shows the underlying principle of finding new solutions by abstraction – the use of function analysis. 60 Solution (subjective) Function/effect (objective) Recognise, what is X X‘ 1 2 Describe, what should be Creative action 3 Evaluation Figure 1: Finding new solutions by abstraction – Function Analysis The direct path from an existing solution X to an optimized solution X’ is not easy: the creator of this solution knows all details about it and as the “father” of this solution he always tends to defend his “baby”. This is not a sign of bad character or not showing professional behavior, it is only pure natural behavior of human beings. Here is the benefit of function analysis. The team has not to discuss about the existing solution anymore, but about its functions. First step in function analysis is the question: “What is the object doing?” The team shall recognize the current situation – the “as-is” situation. But the second step and so also the second question must not be forgotten: “What shall the object do?” The team has to describe the desired situation – the “should-be” situation. It is possible that the existing solution carries functions that are not necessary anymore for the new, targeted situation. Or it is possible that there are some functions missing for the targeted situation. Both possibilities are given. Very often, the discussion of these two questions and their answers lead to important findings for the projects. On this basis, the creativity phase and later on the evaluation of all ideas can start. THE IMPORTANCE OF “AS-IS” AND “SHOULD-BE” SITUATION Unfortunately, a lot of VA/VE studies do not know the “should-be” situation. The only function tree or FAST diagram is built for the “as-is” situation. Why is it a problem? Here we can differentiate two scenarios: a) VA on an existing object b) VE on a new, to be developed object Scenario a) The object, e.g. a product, has been in the market since years and now it has to be optimized for the next years of its life time. The product fulfills some functions, as they have been planned several years ago. But are all of these functions still necessary? Did the real life showed that some of these functions have not been that important, not to say unnecessary? On the other hand, are there some functions missing, as the real life went on and also the competition launched new products with new features and so also functions? Trying to answer these questions on the basis of the existing solution can be very hard and directly touches the subjective and personal opinion of individuals. Therefore the team has to answer these questions on the basis of the functions. Scenario b) In this scenario, the team tends to describe only the “should-be” situation, but without thinking on the existing functions. The team’s statement is that there is no existing object and as a consequence, no function analysis can be performed. In the author’s opinion, this is not 100% true: There may be no existing object, but there is always an existing situation! If, several years ago, there was no GPS for cars, there have been maps. If there is no LED for headlamps in cars, there are XENON headlamps. To start from the existing situation for describing the functions is crucial to specify the “should-be” functions of this object. Otherwise, no advantage, no development can be visualized to support the team in its work. The setup of both functional structures can also show in a perfect way the freedom for the team in the project. Looking at a function tree, the functions gets more and more solutionorientated coming from the left to the right. As a consequence, in a project with a high degree of freedom, a lot functions on the right side of a function tree will not show up anymore in the should-be function analysis, as they have been dependent on the existing solution – the “as-is” situation. 61 Picture 1 shows a standard hole puncher (only as an example – no real project background) and figure 2 shows it’s “as-is” and “should-be” function tree. At first glance, the “should-be” function tree is much smaller than the “as-is” function tree. This is due to the fact that the project has a high degree of freedom for the new product and therefore the team removed all functions that are solution dependent. As an example, the function in the last column “Activate lever” only exists, because the existing solution has a lever that activates the 2 punchs that produce the hole. If the hole would be produced by laser cutting, there would be no produce perforation punch hole => how <= why move punch transform movement increase force need for a lever and the punchs. Picture 1: Example of a standard hole puncher (Photo by Pauwels) activate lever guide punch produce counterforce reset mechanism manage blanks collect blanks release blanks spread blanks give protection protect user squeeze finger protect product prevent limit sheets allow service protect environment allow positioning give info produce noise protect table support recycling show punch center limit edge distance guide sheets show fill level Give service instructions give design => how produce perforation <= why produce hole manage waste give protection protect user protect product protect environment position sheets position sheets in x position sheets in y give info give design Figure 2: “As-is” (left) and “Should-be” (right) function tree of a hole puncher This example is of course an extreme one. And very often this degree of freedom is not given in the projects. But anyhow, the distinction of the 2 different situations leads to important findings within the team – and that’s what function analysis wants to support. Looking at the “as-is” function tree in figure 2, some functions attract attention: “squeeze finger” and “produce noise”. Are these really functions of a hole puncher? Of 62 lever lever link axis punch washer spring guide rivet blank collector die plate assembly Sum Functional cost as-is THE FUNCTIONAL COSTS $ $ $ $ $ $ $ $ $ $ $ $ 30 15 10 25 5 30 60 5 30 25 65 300 $ 12 $ 6 $ 20 $ 5 $ 5 $ 30 $ 40 $ 4 $ 15 $ 7 $ 6 $ 45 $ 5 $ 169 $ 31 56% 10% $ 5 $ 13 $ 4 $ 12 $ 1 $ 5 $ 3 $ 10 $ 53 18% Give design Give info Allow positioning Give protection Manage blanks Cost as-is Components Punch hole course not the intended one, but the existing puncher offers these functions as it is easily possible to hurt the user’s fingers and the puncher is squeaking! So these 2 functions are “unwanted functions”. Of course, these unwanted functions must be avoided in the new product and therefore they must not show up anymore in the “should-be” function tree. Or they have to be transformed into positive description like “protect user” and “avoid noise”. Also this is an effect of having both function trees – it leads again to findings within the team and support the understanding of the product. $ 5 $ 8 $ 2 $ 3 $ 5 $ 5 $ 5 $ 7 $ 2 $ 5 $ 15 $ 10 $ 22 5% 3% 7% Picture 2: As-is functional cost of a hole puncher Setting up the function tree or the FAST diagram is not the only task within Function Analysis: The team also has to establish the functional costs of the existing object and it also has to define the functional costs of the targeted situation of the object. The advantages are as follows: Detachment from looking at component costs Identification of the main costs in relation to the object’s functions Calculation of cost goals and determining the target costs respectively Easier comparison of cost effectiveness ratios (benchmarking) Description of the available rationalizing potentials Evaluation of the value of each function Establishing the “As-is” functional costs is more or less known and - once the team gets familiar with the process – not so difficult. A matrix has to be built up with the functions on one side and the components of the product on the other side. Working with a function tree gives the advantage to choose one specific level of functions for this exercise. In the author’s opinion, the first level of functions is the best one to start with. From component perspective it is also best to cluster all positions of the bill of material (BOM) to some reasonable subgroups. In the end, the matrix should not exceed too much a 10 by 10 matrix. Picture 2 shows this matrix for the hole puncher. The finding is that “Punch Hole” is the most expensive function – for a hole puncher not the most surprising fact. But “Give Protection” comes on the 2nd rank and “Manage blanks” on the 3rd rank. So, the team has not to concentrate on “Give protection”, “Allow positioning”, “Give info” and “Give design”. At least not for reaching the target of reducing costs. Again, at this point most of the functional cost analyses are finished. But what about the customer perspective on the cost distribution? How he would spend his money on the different functions? These questions will be answered by the “should-be” analysis. The starting point of the “should-be” functional cost analysis is the decision attributes of the customers for the product. The decision attributes are around 5 – 15 criteria, with which the customer decides for a specific product. For a hole puncher, the decision attributes could be: Timeless design Pleasant surface feel Known brand (quality) Low operating force Small footprint High stability Good finishing Low weight Intuitive handling Easy positioning of sheet Effective collection of blanks The team decides on the importance of the different criteria, e.g. by a paired comparison, 63 6 6 6 3 3 3 3 1 6 1 1 Picture 3: “should-be” matrix of a hole puncher If a function is highly linked to several decisions attributes means that this function is important to the customer. And if a function is important for a customer, the customer pays for this function. With this hypothesis, the team can evaluate the “should-be” functional costs. This is shown in picture 4. Picture 5 shows the direct comparison of “as-is” Decision attributes Timeless design Pleasant surface feel Known brand (quality) Low operating force Small footprint High stability Good finishing Low weight Intuitive handling Easy positioning of sheet Effective collection of blanks 7 8 12 13 2 15 14 1 13 18 7 Should-be functional cost 42 0 72 78 6 15 84 1 78 0 0 376 21,6% Give design 3 0 3 0 0 0 1 0 6 3 3 Give infi 1 0 3 1 1 1 3 0 6 6 0 Position sheets Give design 1 0 6 3 0 3 3 0 6 0 0 Give protection Give infi 3 0 1 0 1 0 3 0 3 0 6 Manage waste Position sheets 6 0 6 6 3 1 6 1 6 0 0 Produce hole Give protection 7 8 12 13 2 15 14 1 13 18 7 Decision attributes Timeless design Pleasant surface feel Known brand (quality) Low operating force Small footprint High stability Good finishing Low weight Intuitive handling Easy positioning of sheet Effective collection of blanks 9: High influence Manage waste 6: Medium influence Produce hole 3: Low influence Importance 0: No influence at all and “should-be” functional cost, i.e. the actual cost distribution in the current product and the cost distribution as the customer would choose for. This comparison will evoke discussions and reflections within the team. Why the customer would spend his money in that way and what are the consequences for the project? As an example: the customer would spend more money on “Allow positioning”: currently, it is very difficult to position the sheet in a correct way. To find the center of the paper, the user has to fold it. This is not comfortable at all and can cause a wrong punching. Therefore, the customer would spend more money to have more comfort and accuracy. Importance and sets up the matrix with the decision attributes and the functions. This matrix is shown in picture 3. The numbers at the cross overs stand for the degree of interdependence of decision attribute and function: 21 7 7 21 42 0 0 0 0 48 12 72 36 36 72 0 39 13 0 39 2 0 2 0 6 0 45 15 0 45 42 42 42 14 42 0 0 0 0 1 39 78 78 78 78 0 0 108 54 18 42 0 0 21 7 158 283 301 224 398 9,1% 16,3% 17,3% 12,9% 22,9% Picture 4: should-be functional cost of a hole puncher Picture 5: Comparison of “as-is” and “should-be” functional cost of a hole puncher 64 CONCLUSION Function Analysis is the most important methodological part in VA/VE studies. This is acknowledged by all VA/VE practitioners. The full effect of this function analysis is only developing with the full use of it, i.e. the usage of “as-is” and “should-be” situation. The team members will get additional perspectives on the VA/VE study, improve the understanding of the product or process and improve the communication in the cross-functional team. All these are pre-requisites for a successful project or workshop. 65 CASE ANALYSIS FOR DETERMINING THE CHARACTERISTICS OF VALUE ENGINEERING IN THE PRE-DESIGN PHASE Hyun-Jong Lee Ph. D. Candidate Department of Architectural Engineering University of Seoul Korea Zheng-Xun Jin Ph. D. Candidate Department of Architectural Engineering University of Seoul Korea Jong-Hyeob Kim Ph. D. Candidate Department of Architectural Engineering University of Seoul Korea And Chang-Taek Hyun Professor Department of Architectural Engineering University of Seoul & Chairman Korea Construction VE Research Institute Korea ABSTRACT The earlier application of value engineering (VE) in project life cycle brings greater chance of improving its value. However, VE has generally been applied after schematic design phase due to the limitations of the early stage such as the lack of available information, the absence of formal VE process for planning/schematic design phase, and so on. In order to establish the methodology for the practical pre-design phase VE, identifying the characteristics of the VE in pre-design phase is required through the actual VE application case performed in early stage. Thus, in this study, the actual VE case which was applied in pre-design phase is analyzed. The case was performed using Eco-Value Engineering Support System (EVE)1 which was built based on the existing design VE methodology. Through the case analysis, the characteristics of VE in pre-design phase are identified. The characteristics of VE application in pre-design phase proposed in this paper would be useful as the base data for the related research of VE application in early stage. In addition, it could be helpful to establish the VE methodology for pre-design phase. INTRODUCTION VE analysis has so far been performed mainly after the schematic design phase, where the process is relatively well established, and the acquisition of information is easy. In the case of the VE technique, however, the faster the application period within the life cycle is, the greater the opportunities for value enhancement. Therefore, there is a need to exert efforts to perform VE in the early stage of the project. 66 Towards this end, it is necessary to identify the characteristics of pre-design VE by performing VE in the early stage of the project. In this regard, the researchers sought to derive the characteristics of VE in the pre-design phase by analyzing the pre-phase VE performance results of 00 Complex Transfer Center using the Eco Value Engineering Support System (EVE), and based on this, attempted to discuss the characteristics differentiated from those in the schematic design and design development phases. LITERATURE REVIEW Characteristics of Pre-Design VE In construction projects, the term pre-design is used differently to mean “architectural programming,” “architectural planning,” “project planning,” “brief,” and “conceptual planning”(Koo, J. S., 2010). The pre-design phase is the stage where information is not further embodied compared to the design phase, and where planning information about the facilities does not exist, especially in the early planning stage. The following Table 1 shows a comparison of the characteristics of the pre-design-phase and the design phase (Hyun, C., 2015). Table 1.Characteristics of Information Obtained by Phase Category Pre-Design Phase Information about facilities Conceptual plan Information about space details Required rooms, area, etc. Degree of relative concretization of information Fair Design Phase Design information Detailed rooms, area, performance, etc. Good VE Characteristics As for the VE technique, the improvement potential and the scale of the costs and efforts required for the improvement vary depending on the application period. As described in [Figure 1], the cost of savings from VE proposals gradually increases, and the costs required for the implementation of VE proposals continue to decrease in the early stage of the project(Dell’Isolla, 1997). Therefore, as VE is applied to the early stage of a project, the improvement effects become more obvious. Kelly and Male(1993) proposed the planning phase (10% design) as the optimal period of VE applications, and the time immediately after the completion of the schematic design (35% design) as the next best thing. VE proposals in the planning phase are not actively implemented, however, due to government restrictions such as the difficulty of data procurement and the uncertainty of costs. Figure 1: Potential savings from VE applications EVE: Eco Value Engineering Support System EVE Support System, which is a partial module of i-PgMIS(Intelligent-Program Management Information System), has a Webbased configuration as an eco-friendly VE system based on the existing design VE methodologies. EVE reflects the size of the project and its characteristics by stage, and divides the modes, thereby allowing a more efficient business work progress. In addition, the UI was configured through improvements by collecting opinions from working-level technicians to conduct research for ease of use for VE experts. Besides that, it was made to facilitate the analysis of AHP, LCC, and easy and convenient access to VE (Kang, S., 2013). 67 Figure 2: EVE main screen As shown in Figure 2, the main functions of EVE consist of the seven phases of the VE Job Plan (information phase, function analysis phase, creative phase, evaluation phase, development phase, and presentation phase). In addition, the “execution function,” which can show the determination of whether or not to execute and the VE comprehensive results, is added. The following Table 2 shows EVE’s support functions by VE phase. Table 2.Main Support Functions by EVE Phase Phase Information Phase Function analysis phase Support Function Project overview and VE goals VE-performing organization VE performance schedule Function definition Function summary Rough evaluation of functions Creative phase Idea generation Evaluation phase Idea embodiment Developme Progress status Model analysis Target selection Function evaluation Improvement target functions Rough evaluation of ideas Detailed evaluation of ideas Cost analysis nt phase Overview Performance analysis Status of proposal results Presentatio n phase Selection of proposals Execution phase Execution management Status of comprehensive results Report of comprehensi ve results PRE-DESIGN VE CASE ANALYSIS VE Case Overview VE case analysis of 00 Complex Transfer Center was done to determine the characteristics of VE in the pre-design phase. In the VE case of 00 Complex Transfer Center, an EVE system was developed to make information sharing convenient. DB storage and cost/performance analysis was applied. The information of the project provided in pre-design phase is shown in [Table 3], and a schematic drawing is included. Table 3. 00 Complex Transfer Center Project Overview Division Project Overview Location Use Busan, South Korea Complex Transfer Center Land area 31,485.70 ㎡ Building area 15,846.05 ㎡ Total floor area 118,412.74 ㎡ Building coverage ratio Floor area ratio Building size Maximum height No. of parking vehicles 50.33% 259.73% 15 stories aboveground 79.30 823 *The floor area ratio, building coverage ratio, and total floor area were set based on the Korean standards. In the VE case, the existing VE job plan and analysis methodologies were equally applied, but VE/LCC was performed with the pre-design decisions and outcomes as analysis targets, considering the pre-design phase. 68 VE Performance Using EVE In this case, the VE performance was systematically managed by utilizing the EVE system. The content below shows a part of the main results from the VE case using the EVE system. Figure 5: Performance analysis results by work type Figure 3: VE goal setting As shown in Figure 3, the basic information of the project was entered, and goals such as the cost savings of VE, function improvement, and value enhancement were set. Parallel to the VE progress period, the information generated in the function analysis phase (function definition, function summary, evaluation of functions, etc.), creative phase (idea generation, rough evaluation of ideas, etc.), and evaluation phase(idea embodiment, evaluation of ideas, etc.) was reflected in the system, and the development phase was carried out based on the entered information. With respect to the performance analysis results by work type, the difference in performance before and after the improvement can be identified through the status of the comprehensive results. In addition, the EVE system is equipped with multiple functions, such as the FAST diagram and AHP, thereby providing convenience in performing VE. Pre-Design VE Performance Results The pre-design VE performance results of 00 Complex Transfer Center showed that a total of 383 ideas were generated from the creative phase to the presentation phase, and 181 ideas were selected as alternatives. The selected alternatives can be classified into six work types (construction, structure, machinery, electricity, engineering works, and transportation), and of these, 82 ideas were finally proposed as the improvements. Table 4.Selection of Alternatives by Work Type, and Number of Improvements Total Construction Structure Machinery Electricity Engineering works Design review In the development phase, the cost reduction/increase in the amount of improvements was estimated by utilizing the cost analysis function, and LCC(Life Cycle Cost) analysis was conducted with the items available to calculate the maintenance costs. Performance improvement Figure 4: Cost analysis item and LCC analysis Cost reduction Division Alter-native selection Improvements 133 12 11 7 16 1 3 1 12 5 3 20 9 3 3 48 10 11 7 7 - 1 - 1 69 11 181 21 1 22 4 39 5 82 Table 5.VE Performance Results (Initial Investment Costs) Unit: USD1,000 VE performance results 13,372.2 247.4 384.9 8 2,813.1 0 174.2 77.4 16,185.4 247.5 559 85.5 0 91.5 91.5 0 14,012.5 300 3,456.2 300 17,468.9 Sum total 247.5 2,084.9 294.5 -91.5 - -91.5 -300 - -300 10,556.5 13,935.6 24,492.1 In addition, three improvement proposals to enhance the revenue were proposed according to the specialty of project use and the characteristics of the pre-design phase. The contents of the proposals are shown in Table 7. Table 7.VE Proposal and LCC Analysis Unit: USD1,000 As shown in Table 5, the cost savings from the VE proposals after the improvement was determined to be about $14,012,500, and the cost spend on performance improvement, about $3,456,200. Thus, the initial investment cost improvement effects through pre-design VE cost analysis totaled $17,468,900. Of the 82 VE proposals, 13 cases were selected as the items that can be made the bases of the analysis of the maintenance costs. Through LCC analysis, the maintenance cost savings for 30 years from the 13 proposals were calculated to be about $13,935,600 at the current prices. Accordingly, a total amount of $24,492,100 could be saved in terms of LCC. Table 6.VE Proposal and LCC Analysis Unit: USD1,000 Maintenance cost savings Total Cost Analysis Initial investment cost savings Work Type 10,559.1 11,697.6 22,256.7 Amount of Revenue No. Names of proposals VE performance results= |cost reduction| + |performance improvement| Construction 1874.2 363.8 1 2 3 Reduce the ratio for neighborhood facilities and increase the business facilities Install an electric bulletin board for advertisements in the outer walls(1-4 floors) Install a road shop in connection with the back alley on the first floor Immutable value Performance improvement Construction Structure Machinery Electricity Engineering works Transportation Sum total 247.5 210.7 -69.3 Cost Analysis Cost reduction Work Type Structure Machinery Electricity Engineering works Transportation Present value Transportation Sum total 1,594 2,689 7,881 14,220 8,324 14,038 17,799 30,947 The increased amount resulting from the revenue proposals was estimated to be $17,799,000 at the current prices. DISCUSSION The 00 Complex Center VE case analyzed in this study has specialty of building use, but it did not have a significant effect on the analysis of the characteristics of VE in the pre-design phase. The method of VE in the pre-design phase 70 was conducted differently from that in the schematic design/design development phase in many details, starting from the target selection process. In the process of tuning these details, the four characteristics below of VE in the predesign phase were derived. Difficulty of cost estimation In estimating the cost by applying the construction cost per area, cost estimation becomes difficult due to the adjustment of details. Uncertainty of alternatives 1. There arises an item in which the range of alternatives is large, and cost reduction and performance enhancement are both included. 2. The content of the original plan is generalized and poses a difficulty in terms of confirmation. Emergence of revenue enhancement item In the past, ideas were classified into the categories of cost reduction and performance enhancement, but revenue increase occurred. Design review item There exists an item that can provide help in the design in the same way as do the review items in construction that arise from the VE performance in the action design phase. For the activation of VE in the pre-design phase, there is a need to conduct a further study on the four above-mentioned characteristics, or to establish a reference system. In this regard, the present study presented the directionality of the further study or utilization method for the characteristics, as below. Difficulty of cost estimation Establish criteria for cost estimation by securing a DB that includes the ratios by facility type and main work type. Uncertainty of alternatives 1. Establish criteria for a range of ideas (core function consolidation – cost reduction, advancement of finishing materials– and performance enhancement). 2. Use the method of assuming the execution plan (existing case) of a similar project as the original plan. Emergence of revenue enhancement item Establish criteria for the idea classification system required for VE in the pre-design phase, which includes revenue enhancement. Design review item Establish criteria for the adoption of a design review item through consultation with the architect. CONCLUSIONS As for the VE technique, the faster the application period within the life cycle is, the greater the opportunities for value enhancement. As there exist limitations, however, such as lack of available information on the initial stage of the project and absence of processes, VE performance has been done mainly after the schematic design phases. For VE performance in the pre-design phase, it is necessary to identify the characteristics of VE in the predesign phase through actual VE performance in the early stage of the project. In this regard, the present study derived the characteristics of VE in the pre-design phase by conducting an analysis of the actual pre-design VE case. In addition, it discussed the utilization methods and directionality of further studies on the derived characteristics to lay the basis for the activation of future pre-design VE. The characteristics of VE in the pre-design phase presented in this study can be utilized as basic data in the research related to the future VE performance in the early stage of a project. In addition, the findings of this study are expected to provide help in the construction of a predesign-phase VE methodology. REFERENCES 1. Dell’Isolla, A. J. (1997) Value Engineering: P ractical Applications for Design, Construction, Maintenance & Operation, R.S. Means, Kingstone. 2. Hyun, C., Kim J., and Son, M., (2005). Multidimensional Quality Model for Value Engineeri 71 ng in Planning Phase of Public Construction Pro gram, Korean journal of construction engineerin g and management, 14(6) 3. Kang, S., Kim J., Jung, M., Hyun, C., and Ha n, S., (2013). Development of an Eco-Value En gineering Support System, ICCEPM, 2013 4. Kelly, J., and Male, S., (1993). Value Manag ement in Design and Construction: The Econom ic Management of Project, E&F N Spon 5. Koo, J. S. (2010). Function Analysis of VE in Planning Phase of Mixed-Use Development, M aster’s Thesis, University of Seoul, Seoul 72 ENHANCING VALUE IN PUBLIC CONSTRUCTION PROJECTS: THE MALAYSIAN JOURNEY Zuhaili MOHAMAD RAMLY1 1 Tutor Department of Quantity Surveying, Universiti Teknologi Malaysia, Malaysia Geoffrey Qiping SHEN2, Ann Tit Wan YU3 2 Chair Professor, 3Associate Professor Department of Building and Real Estate, Hong Kong Polytechnic University, Hong Kong Rosmawati ZAHARI4, Johari EMBY5 4 Assistant Director, 5Deputy Director Value Management Section, Economic Planning Unit Prime Minister’s Department, Malaysia ABSTRACT INTRODUCTION There is a strong demand to improve the capacity and effectiveness of the construction industry. The evidence suggests that VM has become a powerful management tool to identify the best options for achieving a greater value for money. The issuance of EPU Circular No.3 in 2009 imposed mandatory VM as a management tool to achieve value for money for public projects amounting MYR 50 million and above. The purpose of this paper is to unveil the journey in institutionalizing VM in planning and implementation of public construction projects in Malaysia, with emphasis on exploring the achievements of VM workshops. Content analysis was conducted to investigate the level of applications, supported by case studies into five workshops. The case studies involved observations and semi-structured interviews with various stakeholders. To date, a total of 268 VA workshops were conducted, with the total estimated cost of MYR 70 billion for various projects such as healthcare, educational, industrial, and recreational. Next, the paper discusses three major aspects of the workshop’s outputs; the gross floor area model, the cost model, and the efficiency model. The outputs represent the optimization and value added achieved by the VA workshops to increase the likelihood of delivering values into public construction projects. The findings presented in this paper not only shed light on the current development of the VM applications but also provide the benchmarking data to improve future VM workshops. The construction industry development is complex and multidimensional where it’s involved various interrelated and multifaceted components (Ofori, 2000). Ofori further argued that the impact of globalization may affect the development of the industry to meet the economic demand for infrastructures and facilities. Hence, there is a strong demand to improve the capacity and effectiveness of the industry with unrelenting challenges on issues such on productivity, quality, and efficiency in dealing with limited resources and labor forces (Ibrahim et al. 2010). The evidence suggests that Value Management (VM) has become a powerful management tool that is proactive, creative, problem-solving or problem-seeking service that maximizes the functional value of a project by using structured, team-oriented exercises with reference to the client’s value system (Male et al. 1998). Another essential point, Fong (2003) claimed that VM may improve accountability, feasibility and thoroughness of a project and achieve greater value for money in project implementation. The purpose of this paper is to unveil the journey in institutionalizing VM in planning and the implementation of public construction projects in Malaysia. The purpose is achieved by emphasizing and exploring the achievements of VM workshops. Content analysis was conducted to investigate the level of 73 applications, supported by case studies into five workshops. The case studies involved observations and semi-structured interviews with various stakeholders. The findings shared in this paper are part of research to develop a performance management framework for VM implementation in the construction industry. The framework could benefit stakeholders through performance benchmarking and promoting a learning organization culture. PUBLIC CONSTRUCTION AND VM IN MALAYSIA PROJECTS Capital funding is crucial in developing infrastructure that caters to the needs and ensures the wellbeing of the citizenry. However, scarcity of funds has always been the major challenge for the government. With a steady GDP growth of 5.7% in the past five years, Malaysia spent an average of MYR 49.2 billion annually for development expenditures, which accounted for an average of 20% of annual budgetary allocation. The development of VM within the construction industries of other countries such as the USA, UK, and Australia was supported by each government through public driven projects. Building off this example, VM was introduced by the Malaysian government as part of its initiative to increase the transparency of the public project execution. More importantly, VM enables the government to manage and control capital funding efficiently. However, practices between countries vary and reflect social and cultural differences, as well as project delivery systems. Within public projects in Malaysia, Mohamad Ramly et al. (2015) reported that VM is applied in three stages: value assessment (VA), value engineering (VE), and value review (VR), at different interventions into the project cycle that is applicable to any project of MYR 50 million or more as specified in the Economic Planning Unit (EPU) Circular No.3, 2009. To complement, VM implementation guidelines were published in 2011 to provide detailed guidance to all stakeholders (EPU, 2011). Two special units were also formalized to oversee the implementations of VM within the EPU and the Public Works Department (PWD). The government had the supported by key players such as the Institute of Value Management Malaysia (IVMM) and the Construction Industry Development Board (CIDB) that were working in together in organizing a series of training venues and conferences to disseminate knowledge about VM theory and practices. A total of 268 VA workshops with the estimated cost of MYR 70 billion have been conducted so far for various projects such as healthcare, educational, industrial, and recreational. However, the case studies described in this paper involved five VA workshops. Each VA workshop aimed to finalize the project’s scope and estimated cost in order for the government to allocate necessary funding for each project. A VA workshop is conducted in six phases: information, function analysis, creativity, evaluation, development, and presentation and lasts for five days (40 hours) as per SAVE VM job plan (SAVE, 2007). All major stakeholders are invited to participate in the workshop, and includes the client, end users, implementing agency, technical departments, local authority, and consultants as well as the contractor (if they have been appointed). PROJECTS PROFILE Project one (P1) involved the development of tertiary education facilities for 1200 students by adopting a compact design concept to deal with constraints on the site topography. Project two (P2) is the redevelopment of an aging commercial complex to increase the comfort level and overcome the problem of high maintenance costs. Project three (P3) is the development of a 76-bed district hospital to overcome the shortage of hospital beds within the localities with substantial estimated costs to cater for upgrading surrounding infrastructure facilities. Project four (P4) involved the development of an indoor cycling facility to support development programs for cycling athletes and to host international championships. The construction methods and technology were identified as critical issues because the facilities will be the first of its kind 74 in the region. Finally, project five (P5) involved the development of a manufacturing hub for small and medium size enterprises. Uniquely as compared to others, the proposal for this project has obtained planning permission and building plans have been approved by the local authority. FINDINGS AND DISCUSSIONS Data were collected through self-observations and were reaffirmed based on the outputs of each workshop. Three quantitative variables that can provide definite comparison were used to compare the accomplishment of each workshop and are described as follows and summarized in Table 1: Gross Floor Area (GFA) model A significant reduction of the GFA was identified in P4 at 66.3% while the GFA for P5 remains. Other projects, P2, P1, and P3 have a reduction of GFA at 35.9%, 27.4%, and 14.7% respectively. Significant reduction in P4 was achieved through consolidation between all stakeholders into the schedule of area (SOA) prepared by the design architect. Input and justifications from the end users helped the workshop to scrutinize the SOA based on the identified functions of each provided area. Although the GFA was reduced significantly, the workshop believed that the remaining floor area can serve the basic functions with necessary secondary functions to ensure the functionality of the facilities. It was the same observations for the other workshops of P1, P2, and P3. The SOA in each project was revisited based on the agreed project’s functions identified during the function analysis. As an example, the number of meeting rooms provided in P1 was reduced as the workshop found that the demands of usage are not that high. Hence, the concept of sharing facilities was encouraged to maximize the utilization. P3 adopted the same concept where the staff facilities will be shared by two medical wards and located at a strategic location. Meanwhile, the detailed designs for P5 were completed prior to the workshop and obtained approval from the local authority. Hence, the workshop decided to not revisit the SOA as it may force the team to submit another application to the LA for the approval. Cost Model Estimated cost for P1 and P4 were reduced significantly at 50.7% and 50.4% respectively. Meanwhile, P2 and P5 recorded an acceptable reduction of 15.9% and 8.1% respectively. In contrast to the others, only P3 showed an increase of 2.2% of estimated cost after the workshop. It was observed that the significant reduction of P1 was due to major changes in the overall concept design, going from a scattered design to a compact design. The new compact design primarily focused on a single academic building with several support buildings. As such, the major costs for infrastructure works were avoided. Meanwhile, a significant reduction of the GFA for P4 as previously discussed contributed to a lower estimated cost. This is because the cost estimate was prepared based on the GFA during the initial design stage. The revised project’s scope, after the information phase of the workshop for P3, caused an increase in the estimated cost. The original scope was reinstated and includes the staff quarters and associated works. The workshop was informed by the mechanical and electrical engineering consultant that the insertion of staff quarters may affect not only the GFA, but also the associated cost of mechanical and electrical works, as well as the infrastructure works. Although reinstatement of the quarters has caused an increased GFA and the cost, the overall estimated cost was balanced by the reduction of floor area when the workshop found that the medical planner overestimated the allowance for a circulation area. Efficiency model Based on the total time spent during the creativity phase recorded during the observations, it was found that each workshop spent an average of 540 minutes for idea generation with an exception for P5. P2 was found to be the most efficient in idea generation when the participants spent at least 5.3 minutes per generated idea, and 7.8 minutes 75 per evaluated idea. Meanwhile, P5 seemed to be less efficient with 8.2 minutes per generated idea and 12.9 minutes per evaluated idea, probably due to the smallest number of participants of the workshop. Of note is that the generated ideas refer to all ideas suggested by the participants during the given time while evaluated ideas refer to the finalized list of ideas after consolidation to remove any duplicated ideas. The finding may suggest that the higher number of participants may increase the number of ideas to be generated, evaluated, and recommended. Meanwhile, recommended ideas refer to the ideas that were collectively agreed upon and recommended by all participants for implementation into the project. All recommended ideas have been evaluated through consolidation and supported by their implication to the value in financial or nonfinancial form. P1 achieved the best performance at 12.4 minutes per recommended idea, followed by P2 (17.8 minutes/idea), P5 (25.7 minutes/idea), and P3 (27.5 minutes/idea). P4 spent the most time at 36.2 minutes per recommended idea. Apart from that, the quantity and quality of the ideas may be reflected by several factors such as the credibility of the participants, the total number of participants, availability of the information, and workshop facilitation provided by the facilitators. In addition, the brainstorming technique adopted during the creativity phase allowed the participants to contribute any ideas without any judgments from the other participants. CONSLUSIONS In this paper, practices of VM in planning and implementation of public construction projects in Malaysia was presented. Although it was quite recently introduced in late 2009, there were strong demands and its applications have increased significantly to comply with the circular. This paper is also showcasing how VM has been institutionalized within public organizations to meet the increasing demand for the growth of the country despite the scarcity of public funding. This paper explored in detail the accomplishment of VM applications based on three quantitative variables that provide definite comparison. The findings suggest that VM has provided more decision space for the project team to revisit the design and to scrutinize the provision of floor area in performing its intended functions. Changes in floor area have a positive relationship with cost, where reduction in floor area will reduce the estimated cost although this will not always be the case. As for the efficiency, it was found that VM offers a good platform for stakeholders to put their minds together for realizing the project and achieving the intended objectives. The findings also enlighten the importance of teamwork and facilitation by the facilitators to get the best out of the time spent during the creativity phase. In addition, the findings also enable the performance benchmarking to improve future workshops. Hence, it can be concluded that the workshop outputs have positively contributed to the value optimization and value added to the projects. Meanwhile, furthers works have been carried out by measuring and evaluating the overall performance of VM implementations within the public projects in Malaysia. In addition, the challenges in implementing VM were identified to enable the stakeholders to understand the critical issues that they are facing at this time and for the improvement in near future. ACKNOWLEDGMENTS The work described in this paper is part of the first author’s Ph.D. research. The authors would like to thank the Value Management Section of Economic Planning Unit, Prime Minister’s Department of Malaysia and all participants of the workshops that have formed a big part of this research. 76 REFERENCES 1. Economic Planning Unit. (2011), ‘Panduan Perlaksanaan Pengurusan Nilai Dalam Program/Projek Kerajaan’, Putrajaya: Economic Planning Unit. 2. Fong, P.S.W. (2003). “Knowledge creation in multidisciplinary project teams: an empirical study of the process and their dynamic interrelationships.” International Journal of Project Management, 21(7), 479486. 3. Ibrahim, M. A., Roy, M.H., Ahmed, Z.U., Imtiaz, G. (2010). “Analyzing the dynamic of the global construction industry: past, present, and future.” Benchmarking: An International Journal, 17(2), 232-252. 4. Male, S., Kelly, J., Fernie, S., Grongvist, M., and Bowles, G. (1998). The value management benchmark: Research result of an international benchmarking study, Variable Thomas Telford, London 5. Mohamad Ramly, Z., Shen, G., and Yu, A. (2015). “Critical success factors for value management workshops in Malaysia.” Journal of Management in Engineering, 31(2), 05014015. 6. Ofori, G. (2000). “Globalization and construction industry development: research opportunities.” Construction Management and Economics, 18, 257-262. 7. SAVE International (2007). Value methodology standard and body of knowledge, SAVE International, Ohio, USA. P1 P2 P3 P4 P5 Differences of GFA (m2) (10,240.35) (8,549.92) (2,903.00) (19,900.00) (0.00) Differences (27.4%) (35.9%) (14.7%) (66.3%) 0.0% GFA MODEL COST MODEL Differences of cost (MYR) (152,913,500.00 (10,024,655.00) 3,291,340.00 (79,355,555.00) (3,792,339.00 Differences (%) (50.7%) ) (15.9%) 2.2% (50.4%) (8.1%) ) EFFICIENCY MODEL Generated ideas 82 107 87 69 22 Evaluated ideas 45 73 44 34 14 Recommended ideas 45 32 20 13 7 Total time 560 min 570 min 550 min 470 min 180 min Generated ideas 6.8 min/idea 5.3 min/idea 6.3 min/idea 6.8 min/idea 8.2 min/idea Evaluated ideas 12.4 min/idea 7.8 min/idea 12.5 min/idea 13.8 min/idea 12.9 min/idea Recommended ideas 12.4 min/idea 17.8 min/idea 27.5 min/idea 36.2 min/idea 25.7 min/idea Efficiency rate Table 1: Comparison of findings between five case studies 77 y APPLYING THE VALUE INDEX TO IDENTIFY THE BEST CARE AND ATTENTION HOMES FOR THE ELDERLY Mei-yung Leung1, Qi LIANG2 1 Associate Professor, Department of Architecture and Civil Engineering, City University of Hong Kong, Tat Chee Avenue, Kowloon Tong, Hong Kong; [email protected], (852)3442-7142 2 Ph.D. candidate, Department of Architecture and Civil Engineering, City University of Hong Kong, Tat Chee Avenue, Kowloon Tong, Hong Kong; [email protected], (852)2194-2641 ABSTRACT: Care and Attention (C&A) Home is the major residential care service provider in Hong Kong for frail elderly persons. The environment of the C&A Home can affect its occupants’ wellbeing and quality of life (QoL). However, it is difficult for a C&A Home to be both cost effective and efficient in terms of ensuring high QoL. This paper sets out to identify the best C&A Home through knowledge of value management. Two different types of C&A Homes were studied, as well as their design, life cycle cost data, functions, value, and so forth. The findings show that the basic C&A Home has a lower cost per occupant per month than the ideal C&A Home, and the ideal C&A Home had higher QoL scores in all aspects except safety. By calculating the value index, we found that the basic C&A Home has a higher value index than the ideal C&A Home. To obtain the best C&A Home, the value index was used to improve the design of the ideal C&A Home by identifying the optimal number of maximum occupancy. Keywords: C&A Home; Elderly; Life cycle cost; Quality of Life (QoL); Value Index INTRODUCTION In Hong Kong, an increasing number of frail elderly are being sent to live in Care and Attention Homes (C&A Homes). For the elderly, their wellbeing and quality of life (QoL) are closely related to their physical living environment (Liu et al. 2009), and the quality of the living environment depends on the number of resources invested in it (Rickard et al. 2002). It is difficult to achieve both cost effectiveness and a high QoL for elderly residents. Value Management (VM) has been applied extensively to public construction projects and has been able to save on cost and time, as well as ensure quality (Fong et al. 1998). Through a systematic multidisciplinary team decision-making process, VM practitioners are able to determine the best value of a construction project in terms of cost effectiveness, time efficiency, constructability, and so forth (Norton and McElligott 1995). This study aims to apply the value index to identify the C&A Home with the best value for the elderly. Quality of Life QoL, as a social science term, provides an evaluation or measurement of the wellbeing of a person’s daily life (Mollenkopf and Walker 2007). In fact, WHO’s QoL index lists six domains of QoL: physical health, psychological health, level of independence, social 78 y relationships, environment, and spirituality/religion/personal beliefs (World Health Organization 1997). The six domains cover a wide range of aspects of an individual’s daily life: energy, quality of sleep, happiness, self-satisfaction, safety, and so forth. An acceptable QoL constitutes the highest level of health outcomes that start with biological and physiological factors and develop through symptoms, functional states, and general health perceptions (Patrick and Erickson 1993). Value Index for C&A Home Elderly persons of differing ages and health conditions have different requirements for their living environments, and their living environment can affect their QoL (Leung et al. 2012). In general, elderly individuals living in C&A Homes with good facilities in terms of space, security, and so forth, have higher QoL index scores (Leung et al. 2013) but also incur the great financial costs. Hence, it is difficult to find the best C&A Home that will minimize cost but maximize QoL. Due to elderly occupant’s unique needs, the cost of a C&A Home is different from the cost of a normal residential building. Hence, in the current study, the life cycle cost (LCC) of a C&A Home is taken into account—this includes initial, operational, maintenance, and disposal costs (Woodward 1997). Value Management (VM) includes six systematic stages job plan: the information stage, the function analysis stage, the creative stage, the evaluation stage, the development stage, and the presentation stage (SAVE 2007). To identify the value of a C&A Home for the elderly, a value index was applied to the current study. The value index was derived from the basic VM equation (i.e., Value = Function or Worth/Cost; Kaufman 1998). The value index is expressed as a number: 1) a value index greater than 1 is defined as good value; 2) a value index less than 1 indicates a poor value; 3) a higher value index corresponds to a better value. In order to determine the best value, two types of C&A Homes are studied. Because the C&A Home is constructed to improve the elderly’s QoL, the QoL score was considered to be reflective of the worth of the C&A home, and according to the LCC, the cost of the C&A home should include initial, operational, maintenance, and replacement costs. RESEARCH METHOD In order to determine the best C&A Home for the elderly in terms of both cost and QoL, two different C&A Home options were studied, namely basic and ideal C&A Homes. The main differences between the two C&A Homes were the size of the living areas, the quality of the facilities, and the number of total occupants. The basic C&A Home can accommodate a maximum of 80 occupants, while the ideal C&A Home can only accommodate a maximum of 36 occupants. Following figure 1 shows the layout of the two types of C&A Homes. There are more cabinets in the basic C&A Home than in the ideal C&A Home, which reduces living space, blocks natural lighting, and obstructs daily activities. In addition, unlike the ideal C&A Home, the basic C&A Home does not provide occupants with tables and chairs. The functionality of the basic C&A Home is thus poorer than the ideal C&A Home. As for the quality of the facilities, the basic C&A Home is also poorer than the ideal C&A Home. 79 y For instance, the basic C&A Home does not include user-friendly light switches (e.g., small buttons) or an appropriate air conditioning system. Extra cabinets (a) Basic C&A Home Obstruct view Enjoy reading. Open space (b) Ideal C&A Home Figure 1 Layout of C&A Home Measurement To identify the worth of the C&A Home, a questionnaire was designed and administered among elderly occupants to evaluate their QoL. Participants were required to respond to specific questions about their QoL using a 5-point Likert-type scale ranging from 1 (very uncomfortable/not at all) to 5 (very comfortable/strongly agree). A total of 100 questionnaires were distributed to the elderly. Out of the 100 questionnaires, 69 were returned, giving a response rate of 69%. Based on the annual cost report of the C&A Home, LCC data were collected and recorded according to a standardized accounting format. The LCC data were regrouped according to their facility components, so that the relationship between function and cost could be easily established. RESULTS Cost Data The LCC for the two C&A Homes has been divided into three groups according to their FM component, including cost resulting from space management, cost resulting from building services, and cost resulting from operation and supporting services (see Table 1). Table 1 Life Cycle Cost for Two Types of C&A Home (HK$1,000) Cost component Basic (80 occupants) Ideal (36 occupants) IC OC MC RC IC OC MC RC Space management 2,594 0 54 52 2,851 0 58 57 Building services 780 466 66 63 780 464 70 68 Supporting services 0 10,327 0 0 0 7,036 0 0 Sub cost (PV) ,374 10,793 120 115 3,631 7,500 128 125 Sub cost person/month (PV)=PV/12*No. occupants 3.51 11.24 0.13 0.12 8.41 17.36 0.30 0.29 15.00 26.35 Cost person/month (PV)= ∑ 𝑆𝑢𝑏 𝑐𝑜𝑠𝑡 (𝑃𝑉) Note: IC=Initial cost; OC=Operation cost; MC=Maintenance cost; RC=Replacement cost. For annual cost, the initial cost (IC) and operation cost (OC) were calculated on a 50-year basis; the maintenance cost (MC) and replacement cost (RC) were calculated on a 10-year basis. 80 y Table 1 shows the present value of the costs in the two C&A Homes, including the initial cost, operational cost, maintenance cost, and replacement cost. The total annual cost of the two C&A Homes ranges from HK$14,402,000 for the basic house to HK$11,384,000 for the ideal house. However, the two types of C&A Home can accommodate a different number of occupants (i.e., basic with 80 occupants and ideal with 36 occupants). For ease of comparison, the cost per occupant per month is also calculated. It was found that the cost per occupant per month for the basic house was HK$15,000, and for the ideal house it was HK$26,350. Elderly QoL To calculate the value index, it is necessary to determine the worth of the C&A Home. Because the function of the C&A Home is to accommodate elderly occupants and ensure their QoL, this study views the QoL score as equivalent to the worth of the C&A Home. To collect data on QoL, we administered a questionnaire. The results of the survey show that the ideal house has higher QoL scores than the basic house in the majority of the QoL aspects including energy (3.56 and 2.78, respectively), sleep (3.67 and 3.06, respectively), happiness (3.56 and 3.00, respectively), self-satisfaction (3.60 and 3.00, respectively), and overall QoL (3.25 and 3.19, respectively). However, the ideal house had a lower safety score than the basic house (3.24 and 3.67, respectively). Value Index The value index can be calculated after determining the cost data of the C&A Homes and QoL scores. The four parts of the LCC and the total LCC were taken into account when calculating the value index for the C&A Homes. Because the QoL is measured using the 5point Likert-type scale, it is too small to compare to the cost data. Hence, for the purpose of comparison, the QoL score is scaled up 1,000 times. The results are presented in the following table (Table 2). Table 2 Value Index for Two Types of C&A Home Cost Basic house QoL IC OC MC RC Total Energy 0.79 0.25 21.38 23.17 0.19 Sleep 0.87 0.27 23.54 25.50 0.20 Happy 0.85 0.27 23.08 25.00 0.20 SS 0.85 0.27 23.08 25.00 0.20 Safety 1.05 0.33 28.23 30.58 0.24 Overall 0.91 0.28 24.54 26.58 0.21 IC 0.42 0.44 0.42 0.43 0.39 0.39 OC 0.21 0.21 0.21 0.21 0.19 0.19 Ideal house MC RC 11.87 12.28 12.23 12.66 11.87 12.28 12.00 12.41 10.80 11.17 10.83 11.21 Total 0.14 0.14 0.14 0.14 0.12 0.12 Note: IC=Initial cost; OC=Operation cost; MC=Maintenance cost; RC=Replacement cost; SS=Self-satisfaction 𝑄𝑜𝐿 𝑠𝑜𝑐𝑟𝑒 Value index = 𝐶𝑜𝑠𝑡 𝑝𝑒𝑟𝑠𝑜𝑛/𝑚𝑜𝑛𝑡ℎ(𝑝𝑣) According to the definition off value index, a higher value index indicates better value for the C&A Home. Table 2 reveals that the ideal house has a lower value index than the basic house in all aspects of QoL based on the calculation using all costs (i.e., initial cost, operational cost, maintenance cost, replacement cost, and total cost), including energy, sleep, happiness, self-satisfaction, safety, and overall QoL. 81 y DISCUSSION In general, the LCC for the basic house is a bit higher than that for the ideal house (HK$14,402,000 and HK$11,384,000, respectively), with each accommodating a maximum of 80 and 36 occupants, respectively. The difference in the total number of occupants leads to a significant difference in the cost per occupant between the basic house and the ideal house (HK$15,000 and HK$26,350, respectively). The QoL score reflects that elderly persons in the ideal house have higher QoL scores in several aspects, including energy, sleep, happiness, self-satisfaction, and overall QoL, compared to those in the basic house. The greatest difference in QoL scores between the ideal house and the basic house is in energy. This is likely because the ideal home’s better facilities and living environment allow the elderly occupant to easily recover from daily physical and emotional energy expenditure (Cooper et al. 2009). However, by calculating the value index, it was determined that the basic house has a higher value than the ideal house in all QoL aspects. This indicates that the improvement in QoL by living in the ideal house is too small to justify the additional cost for its construction. The biggest difference in the value index between the basic house and the ideal house is in the maintenance cost and replacement cost. RECOMMENDATIONS The current study found that the ideal C&A Home can lead to higher QoL scores in almost all aspects. However, due to its small maximum occupancy, the ideal C&A Home has a lower value than the basic C&A Home in terms of the value index. One way to improve the ideal house is to increase its maximum occupancy. Using the value index as a benchmark, it is possible to calculate the recommended maximum occupancy for the ideal C&A Home. The improved ideal C&A Home should have higher QoL scores than the basic C&A Home, as well as a higher value index. The ideal C&A Home has higher overall QoL scores than the basic C&A Home (3.25 and 3.19, respectively), while it has a lower value index than the basic C&A Home (0.12 and 0.21, respectively). According to the formula for the value index (value index = QoL score/cost per occupant per month), the improved cost per occupant per month can be easily calculated: cost per occupant per month (improved ideal C&A Home) = QoL (ideal C&A Home) / value index (basic C&A Home). Then, dividing the total cost of the ideal C&A Home (HK$948,667) by the improved cost per occupant per month (HK$15,282), we obtain the optimized number of occupants for the improved ideal house. The calculation shows that as long as the improved ideal C&A Home can accommodate 62 occupants, it can simultaneously have a higher QoL score and value index. CONCLUSION The C&A Home is constructed and operated to accommodate the elderly and ensure their 82 y wellbeing and QoL. The quality of the facilities, size of the living areas, management practices, and so forth can affect QoL and are closely related to the cost. The current study aimed to identify the best C&A Home in terms of both QoL and cost through the application of the value index. Two types of C&A Home were studied, as well as their occupant capacity, LCC data, occupants’ QoL, and so forth. The findings showed that the basic C&A Home had a higher total cost and a lower cost per occupant per month when compared to the ideal C&A Home. Occupants of the ideal C&A Home had higher QoL scores. The value index showed that the basic C&A Home had a higher value than the ideal C&A Home in terms of cost and QoL scores. To obtain the best C&A Home, it was recommended that the ideal C&A Home design be improved to increase its maximum capacity. The optimal number of occupants for the ideal C&A Home was determined based on the value index. Other recommendations are also made for improving the C&A Home. ACKNOWLEDGEMENT The work described in this paper was fully supported by a grant from the Research Grants Council of the Hong Kong Special Administrative Region, China (Project No. City U 115210). REFERENCES Cooper, C.L., Goswami, U., Sahakian, B.J. (2009) Mental Capital and Wellbeing. Oxford: Wiley-Blackwell. Ellegant, H., Bushman, D.O. (2000) Value Management: Changing the conversation - A SAVE approved Module I Course. U.S.A.: Howard Ellegant Associates. Fong, P.S.W, Shen, G.Q.P, Chiu, E.W.I, Ho, C.M.f (1998) Application of Value Management in the Construction Industry in Hong Kong. Hong Kong: The Hong Kong Polytechnic University. Kaufman, J.J. (1998) Value Management. Grisp Publication Inc. Kelly, J., Male, S., Graham, D. (2004) Value Management of Construction Projects. Oxford: Blackwell Science Ltd. Liu, C.W., Everingham, J.A., Warburton, J., Cuthill, M., Bartlett, H. (2009) What makes a community age-friendly: a review of international literature. Australasian Journal on Ageing, 28(3), 116-121. Leung, M.Y., Yu, J.Y., Yu, S.W. (2012) Investigating key components of the facilities management of residential care and attention homes. Facilities, 30(13/14), 611-629. Leung, M.Y., Chan, Y.S.I., Olomolaiye, P. (2013) Relationships between facility management, risks and health of elderly in care and attention homes. Facilities, 31 (13/14), 659 – 680. Leung, M.Y., Yu, J.Y., Chen, D.Y., Yuan, T. (2014) A case study exploring FM components for elderly in care and attention homes using post occupancy evaluation. Facilities, 32(11/12), 685-708. 83 y Mollenkopf, H., Walker, A. (2007) Quality of Life in Old Age: International and Multidisciplinary Perspectives. Springer. Patrick, D.L., Erickson, P. (1993) Health Status and Health Policy: Quality of Life in Health Care Evaluation and Resource Allocation. New York: Oxford University Press. Rickard, C., Trieman, N., Torres-Gonzalez, F., Laviana, M., Maestro, J.C., Moreno-Kustner, B., Comas-Herrear, A., Emmett, C. (2002) Residential care for mentally ill people in Andalusia and London – A comparison of care environments, users’ attitudes and cost of care. Journal of Mental Health, 11(3), 327-337. SAVE (2007) Value Standard and Body of Knowledge. Retrieved from: http://www.Valueeng. Org/about_vmstandard.php, viewed on July 10, 2012. Woodward, D.G. (1997) Life cycle costing—theory, information acquisition and application. International Journal of Project Management, 15(6), 335-344. World Health Organization (1997) WHOQOL-Measuring Quality of Life. Retrieved from: http://www.who.int/mental_health/media/68.pdf, viewed on October 10, 2013. 84 Evaluation Techniques of the Esteem Function KAYO UCHIDA FA Consultant Functional Approach Institute Company Limited ,Tokyo, JAPAN ABSTRACT In this paper, the author shows several methods for analysis and evaluation of Esteem Functions and their incorporation into VE job plans. The author has developed a new evaluation method for Esteem Functions by building on the existing Sense VE, which has been practiced widely in Japan. So far, the author has found it difficult to deal with Esteem Functions: Unlike Use Functions, Esteem Functions cannot be quantified. The author has introduced original graphs as vital tools for familiarizing various industries with VE. The graphs shown in this paper will go a long way to applying VE to such fields as medicine and service, which commonly deal with Esteem Functions. Recently, VE has been applied to the nonmanufacturing industries. However, VE has yet to be applied to the service sector. To let VE crack the confinement of manufacturing and get stages in the medicine and service sectors, it is essential to establish steady study, standardization, and evaluation methods for Esteem Functions. INTRODUCTION As a VE consultant/dental hygienist, the author have participated in the start-ups and renovations of private dental clinics, and conducted drawing-in activities for them throughout Japan. The vast majority of dental hygienists in Japan work full-time; freelancers such as the author account for no more than 5% of the total. While there are various improvement methods in the dental service industry, VE is not among them. This paper presents how the author devised Sense VE Sheets and its on-site use in the medicine and service sector. VALUE ENGINEERING IN JAPANESE MEDICAL SERVICES THE In Japan, dental practitioners are currently under a tough climate with more dentists or dental clinics than necessary, resulting in cutthroat competitions among themselves. There are 68,000 of them, topping the number of ubiquitous convenience stores by 20,000, which is said to be “many”. In the Tokyo metropolitan area, for example, one clinic per day goes out of business. The ailment is attributed in part to the difficulty in drawing patients. In the sphere of Japan’s medical services, most people still think dental clinics to be places for “pain relief” rather than “health maintenance” or “preventive care”. This competition-stricken industry wanting something to change the current situation is the one that benefits the most from VE introduction. It seems that the inadequate evaluation of Esteem Functions has rendered VE underutilized. What it takes to raise its awareness is prominence of the fact “VE works”, that is, “It boosts values.” Since any new methods need to be not only effective but also efficient, the author has newly developed techniques to analyze senses by adding two novel analysis methods such as introduction of original graphs and sheets to the existing Sense VE. Sense Value Analysis Sense Classification VE AND ONE’S SENSE Sense VE The medical and service industries are highly dependent on one’s senses. In Japan, there is a VE called Sense VE, whose purpose is to apply VE to one’s senses. The greatest advantage of using Sense VE is that it enables us to evaluate Esteem Functions. The major problem with Esteem Functions lays in the fact that they are difficult to embody before they are quantified and evaluated. The merits of this method are as follows: ・ Analysis of the questionnaire gives clear 85 pictures of what problems Users have and what improvements they call for; ・ Organizing and visualizing Users’ latent demand on the Interest Tree Chart facilitates comprehension; ・ User’s interest level can be quantified. Procedure 1) Conduct a questionnaire by VE; 2) Draw up an Interest Tree Chart; 3) Work out measures to improve favorability; 4) Draw up an Improvement Check List. Range” as the difference between the maximum tolerable value and the minimum tolerable value of parameters for each sense item. Thus, Esteem Functions can be quantified. Procedure 1. Draw Users’ interest by Sense VE (Figure 1); 2. Specify items to improve; 3. Questionnaire; 4. Graph Analysis; 5. Analysis When employing Sense VE, we have a questionnaire as follows: Use questionnaire sheets; Conduct in open-ended answer styles The following are the advantages of adopting questionnaires: Understand Users’ demand directly from them; Know what Users think the advantages and disadvantages of the things of interest are; Know Users’ Comfort and Discomfort; Measure Users’ interest level Quantification of VE The application of Sense VE enables us to enhance repeatability of requirement for Esteem Functions, but there are still some shortcomings in its quantification and evaluation. The use of the existing Sense VE was nothing more than a platform for improvement. It is difficult to evaluate unquantifiable Esteem Functions whereas Use Functions can be described by using quantifiable objects. Development of methods for quantification and/or evaluation of Esteem Functions is called for. SENSE VALUE ANALYSIS Outline The author found that “Users’ Senses can be measured if one knows their range”. There is a difference in people’s senses and their range. Senses such as Users’ experience and feeling are considered relative and they vary from User to User. For example, “five minutes” is a fixed period of time at any place on the globe, but people have different senses of “five minutes”, depending on how they spend it or where they are. Evaluation in Sense Value Analysis is made feasible by quantifying Esteem Functions. To this end, the author has defined “Sensitivity Figure 1:Interest Tree Chart Case Analysis Carry out using Sense VE, giving priorities to highly ranked items. In the following case, the author chose Dental Check-up and Cleaning as the subject to study. Shown below is the question the author asked. “Assume that you are here for a Dental Checkup and Cleaning for every three months. ” Cleaning would be very comfortable with no pains. Within how many minutes do you feel it is short for Cleaning? Or how many minutes do you feel it is long for Cleaning?’ From this questionnaire, the author drew the following two parameters: Minimum tolerable time (Minimum Value) Maximum tolerable time (Maximum Value) To analyze variability and relationships among each sense datum obtained from the above questionnaire, the author drew up the graph (Figure 2), where the horizontal axis denotes sample values (cleaning time), and the vertical axis is shared by the percentage of people questioned who expressed their satisfaction (shown by the bars) and that of those who gave each of the Maximum Value (the solid line) and 86 the Minimum Value (the dotted line). Take 22 minutes’ cleaning time for example, 37% of the people questioned felt it to be too short, and 10% of them, too long. The intersection of the two lines gives the following information: Sample values that have high satisfaction ratings; Variability of satisfaction ratings The range of sample values with high satisfaction ratings is obtained from the horizontal axis, and the variability of satisfaction ratings from the vertical axis. For example, the range of cleaning time with which 50% or more of the people questioned are satisfied is from 22 minutes to 29 minutes, in which range the satisfaction ratings assume various values. The samples, 23 and 24 minutes have the mode, which is only 63% of satisfaction rating. The graphs for this application can be categorized into the following three types: Satisfactory Type: Graphs having no intersection of lines (Figure 3); Average Type: Graphs with the intersection sitting below the 30% line (Figure 4); Unsatisfactory Type: Graphs with the intersection sitting above the 30% line (Figure 5) The author has found the following tendencies: The lower the intersection is, the less dispersion of parameter values there is; The higher the lines are, the more dispersion of parameter values there is. The author has found the following two facts by comparing these three types of graphs: 1. The longer the bars are, the better; 2. The fewer the bars are, the better. The Average Type satisfies the both; the Unsatisfactory Type needs improvement. By this method, the author has successfully quantified Esteem Functions, which was so far an abstract concept. In this case of “Time for Dental Check-up and Cleaning”, the author evaluated Esteem Function “sensory time.” Its graph shows that the intersection appears below the 30% line, which means it is “Average Type”. Thus, it can be concluded that the cleaning time cited for this case satisfies roughly a half of all people. Figure 2:Cleaning Time Sense Classification Outline In order to make use of what have been obtained from Sense Value Analysis and Sensibility Value Analysis in the form of brief sheets for on-site use, the author has come up with the Sense Classification method whose objectives are as follows: Narrow the gap between senses of Users (patients) and those of Providers (management); For Providers to know what have been done and what to do in terms of senses. Procedure 1) Pick eight items that depend on senses; 2) Determine nine levels; 3) Draw up sheets based on the above 1) and 2); 4) Fill out the sheets and make radar charts. Case Analysis The eight essential sense items for dental clinics are as follows (See: Figure1). Cleanliness・Safety・Affinity・Refreshfulness ・ Poshness ・ Trustworthiness ・ Superiority Feeling・Open Feeling About each of the eight items, one’s sense for it was evaluated by the scale of nine. Senses are invisible; therefore it is difficult to express their levels in terms of letters or words. 87 Figure 3: Satisfactory Type Figure 4: Average Type Figure 5: Unsatisfactory Type Then the author introduced pictures and/or photographs for direct ratings. The following are the pictures the author used to depict “Open Feeling.” Since one’s senses are likely to be affected by his/her own experience, it is crucial to utilize these visual gimmicks to preclude personal biases of the one questioned. The author prepared Sense Classification Sheet (Figure 6) for the eight sense items, and filled it out for the clinic the author worked on, based on the given nine levels as shown in Figure 7. There was more to do. To offset subjective judgments, it was necessary to know deviation from average values and get the picture of the overall balance. To this end, the author drew up the Sense Classification Radar Chart (Figure 8), corresponding to the Sense Classification Sheet. On this chart, instead of the median “5”, the author set “7” as the “average”, as it was the minimum desirable value. For some clinics that specialize in particular fields, it may not be necessary to pursue a well-rounded chart. Some sense items, however, such as cleanliness, safety and trustworthiness must be at high levels at medical service providers. The Sense Classification Radar Chart goes a long way when providing consultation to the client (manager) to review their practice to check if they are on the right track and give them some advice. Figure 7: Sense Classification Sheet Figure 8: Sense Classification Radar Chart APPLICATION OF SENSE VE Incorporation of Sense VE into VE Procedures The author proposes that VE be incorporated into the existing VE procedures. The flow varies with the methods of analysis (See Figure 9). 88 Sense Value Analysis Definition of Function Sense VE Evaluation of Function VE Procedure Information Collection on VE Objects Cost Analysis by Function Sense Value Analysis Evaluation of Function Sense Classification Definition of Function Sorting out of Function Selection of Object Categories Proposal of Solution Brainstorming Overall Evaluation Materialization Detailed Evaluation Sense Classification Figure 9: Incorporation of Sense VE into VE Procedures FUTURE OUTLOOK The analysis method that the author has developed can help improve Value by quantifying and evaluating Esteem Functions. One can use this method to understand things relatively and can apply it to other VE studies. Furthermore, Sense Classification can quantify senses enabling one to provide on-site consultation to his/her clients. The devised sheets and charts are universally applicable to any VE activities involving Esteem Function analysis. deemed difficult to quantify; VE that was introduced to the Japanese dental service industry; Findings of ways to remedy the shortcomings of the existing Sense VE The author has developed an unprecedented method of quantifying Esteem Functions. The author hopes that VE will be introduced to many other industries such as the service sector, adopting the graphs and sheets she devised. Indeed, VE has changed her own work attitude. With the use of VE, the author has found her work much easier. Her next mission is to introduce VE in the Japanese medical services, to begin with, where very few people know what VE is. They can benefit greatly from VE application. REFERENCES 1. Preference-based Design Study Forum (1992) Techniques to Create Attractive Space and Products, Japan 2. Research Material by The Society of Japanese Value (1995) Sense VE Engineering, Japan 3. Koji Yamamoto (1997) Target Cost Management and Value Engineering for Sensitivity, Osaka Prefecture University Economics Study, Japan 4. Hirohiko Asano (2001) The Practical Guide to Preference-based Design, Kaibundo , Japan 5. Ichirou Ueno (2007) VE Handbook, SJVE, Japan 6. Hisaya Yokota (2008) One-up Problem Solver: An Invitation to the Functional Approach for Switching Your Gear, Discover Twenty-One, Japan CONCLUSION One’s senses are too personal to be convincing when conducting consultation. In this paper, the author has presented the following: An analysis method for Esteem Functions and its flow; An evaluation method for quantifying Esteem Functions which are subject to human feeling and atmosphere and are 89 Figure 7: Sense Classification Sheet Figure 8: Sense Classification Radar Chart Sense Value Analysis Definition of Function Sense VE Evaluation of Function VE Procedure Information Collection on VE Objects Cost Analysis by Function Sense Value Analysis Evaluation of Function Sense Classification Definition of Function Sorting out of Function Selection of Object Categories Proposal of Solution Brainstorming Overall Evaluation Materialization Detailed Evaluation Sense Classification Figure 9: Incorporation of Sense VE into VE Procedures 90 HOW TO DEAL WITH A MULTITUDE OF IDEAS AT THE EVALUATION PHASE IN A VE PROJECT Dipl.-Ing. Sebastian Meindl, PVM, TVM President Krehl & Partner GmbH & Co. KG Karlsruhe Germany ABSTRACT PRESENT SITUATION It is clear that Value Analysis and Value Engineering are the top methods in order to improve value of products and processes. Functional analysis delivers the gap between the ideal “should-be”-situation and the flawed “as-is”-situation. Showing this gap is crucial for finding hundreds of ideas. But a long list of ideas is not equal with a successful VA/VE-project. The “right” ideas have to be combined to feasible concepts. The value impact of those concepts can then be precisely predicted as well as the implementation efforts. This project stage is crucial to make the right suggestion for management decisions. As every VA/VE-specialist knows, the functional analysis is the core element of the Value Methodologies. With this powerful approach and in combination with the other system elements like cross functional teamwork, holistic thinking, neutral moderation and methods for finding new ideas this is one of the most effective and efficient ways of being creative. Very often, VA/VE-Workshops end up with a long list of ideas, often only partly evaluated. In fact, this is a big task for the project team to implement the ideas without having a plan to make the right decisions by picking the “right” ideas. So, at every VA/VEWorkshop it is very helpful to have a method for clustering ideas and measures to reasonable packages to be implemented in the next project stage. In this paper, an approach to solve the problems with many ideas and actions, their value impacts and the way to condense the right ideas to a conclusive and feasible package of solutions is shown. Additionally, some substantial criteria in order to evaluate ideas and concepts will be discussed. The implementation of computer aided tools in order to support this project phase will be shown as well. This paper wants to share the experience of using the evaluation phase as part of the concept phase in order to show possible criteria, the procedure and substantiates the statements with practical examples. TYPICAL OUTCOMES CREATION PHASE OF THE The outcomes of the creative sessions are, depending on the project tasks, hundreds of ideas and measures to be evaluated and in case of “surviving” the evaluation phase to be implemented later on. At this stage, the project team very often realizes that some of the ideas and measures are not compatible, or even worse, they mutually exclude each other. That means, that the predicted total value impact (e.g. cost reduction, functional improvement etc.) is not possible anymore. There are no decision criteria in order to choose the “right” ideas. This 91 inefficient process has to be supported by appropriate methodological support. GOOD PRACTICES IN EVALUATION OF IDEAS At the end of the evaluation phase in each VA/VE-Project, at least an estimation of the value impacts has to be executed. For instance, value impacts can be: Decrease in manufacturing costs Increase in functionality (more-)fulfilling of customer needs Reduction in capital expenditure (Capex) from the customers perspective Reduction in operational expenditure (Opex) from the customers perspective Increase of total customer value by having at least one or even more “positive” value impacts. … A reliable estimation can be sufficient in some projects, but a detailed calculation based on e.g. the bill of materials (BOM) and/or routings gives the project team a very good feeling on the value impact on every single action item. Next important evaluation step is the evaluation of possible risks. As well, risks may appear in very different circumstances, e.g. Risk of technical feasibility/practicability Risk of unexpected implementation effort Risk of hindered or impossible manufacturing Risk of hindered or impossible assembly Risk of hindered or impossible commissioning/start-up … Thereby, those risks often can only be cleared in the implementation phase. But it is important to know about the risks before trying to implement the assigned ideas. Furthermore, it is necessary to evaluate the capital expenditures for implementing the ideas and measures. Typical fields of such investments for instance may be: Costs for Tooling Costs for Molds Costs for fixtures Costs for machines Costs for industrial facilities Costs for Buildings, building facilities etc. … Those costs can have a character of capital expenditure and may have to be depreciated during the lifetime of the equipment. This depreciation period of course has to be suitable to the lifetime of the VA/VE-object itself. The next important step is evaluation of the effort in order to engineer the new ideas and measures to realizable solutions. That means, the hours, days, weeks, month or probably years of work of design engineers, draftsmen, industrial engineers, purchasers and all other involved departments related to that specific VA/VE project have to be estimated in order to calculate the return on investment on each single idea/measure/action item. Last but even most important evaluation is the assignment of risks with respect to full or partly acceptance of the measure by the customer. There are many types of effects of ideas and measures out of the customer´s perspective. On the one hand, there can be a significant design change without any influence on customer´s demand. On the other hand, slightly and from engineering´s point of view absolutely minor changes may lead to a complete denial of this solution by the customer. For instance, in plant engineering and construction, customers willing to buy a new plant additionally to an existing plant show only limited acceptance to different solutions (even if they are cheaper or better) because they are very sensitive in implementing new technology. Reasons for that may be justified by having less educational effort on the human resources or in other cases just in order to use the same spare parts. 92 BUILDING OF FEASIBLE CONCEPTS BY CONDENSING IDEAS AND MEASURES In order to build a feasible concept out of the existing ideas at this stage of the project, at first the criteria have to be defined. Those criteria are individual in every project and they depend strongly on the specific project goals. Building concepts in that particular case means to combine ideas and measures in the sense of the given task. Therefore, it is important to combine only those ideas and measures which fit to the concept and, which is even more important, are not concurring to other ideas in that concept. At this stage the project team has to work very accurately and needs concentrated attention of all team members. Concepts in that sense can be created by using very different criteria. Those criteria can be developed in direct relation to the project tasks. They can also depend from specific circumstances related to the company´s current situation. Typically, one main indicator reaches an extreme value, either a minimum or a maximum. Examples for such criteria can be e.g.: Minimal time to market Minimal Realization efforts Maximal cost reduction Maximal increase in customer value Adaptation on specific customer groups or customer demands … Those concepts give the project team information on different possible solutions and their specific efforts, value impacts and risks. That means, the “real” cost reduction achieved by a VA/VE-Workshop can be calculated not before at least one concept was built. But also, the implementation efforts (and in many cases additionally the necessary man power), capital expenditure and risks can be evaluated in total. But generating those concepts is not an easy job. As earlier mentioned, the project team has to put his highest attention on this project stage. Errors made at this project stage may lead to wrong decisions. So every conclusion as an outcome of this project stage has to be doublechecked. Often, incompatibilities in combining ideas can be found right now. Typically, there may be lot of dependencies between lots of ideas. Those dependencies have to be considered as well. Some dependencies will arise not before having a closer look on the concepts. That also makes this project stage that important. At building the concepts, not only full attention of the cross-functional working team is necessary. It is also highly important that team members of all involved departments are attending those workshop sessions in order to bring their specific knowledge for optimum results. Even the importance of team members of sales department is evident. This is the last (and most important) chance to bring the things in the right direction. The outcome of the concept phase is at least a suggestion for the management. The management (here: task setter of the project) has to decide about the progress of the project work. So, all suggestions to the management have to be well prepared and clear reasonable and transparent At least, the result must show that there is absolutely no doubt on the suggestions the project team made by presenting the possible concept solutions COMPUTER AIDED TOOLS IN ORDER TO SUPPORT CONCEPT BUILDING In order to support the project team in building concepts there are lot of possibilities. A very common solution could be a spreadsheet. Krehl & Partner uses Microsoft Excel® spreadsheets since years, permanently improving. But still, an extreme attention by all team members is needed because of possible interdependencies between single ideas and measures. A typical spreadsheet in order to build concepts is shown in Figure 1. The ideas (Column “Idea”) are assigned to the specific functions (Column “Function”) of the VA/VE-object. In a rough evaluation just after the finding of ideas, all ideas were assigned to a specific level, e.g. “D: detail idea”, “K: conceptual idea”, “N: non feasible”. All conceptual and detail ideas are evaluated concerning their value impacts, e.g. 93 cost reduction and/or capital expenditure or realization efforts. Then, the ideas can be assigned to the different conceptual approaches showed in the columns “Concept 1” up to “Concept 4”. A very easy spreadsheet operation shows total cost reduction impact and efforts. Additional rows can be used for evaluating risks and other criteria. The assignment of responsibilities (e.g. team members responsible for further actions) can be done here as well. Table 1: Table of ideas and “concept columns” Further improvements on software tools supporting this fundamental project stage are possible with even more powerful tools. Based on a SQL-Database, the VA/VE-Software VEMaster can handle this process step as well. With having a real database with free definable assignments between single ideas, an even real powerful tool can be used supporting this project stage. At this time, this functionality is being realized in the software. Figure 2 shows a screenshot of the database software VE-Master. Here, the value impacts of each idea can be typed in. All those values can be used for the evaluation of concepts in a later project stage. Table 2: Value Impact Data Fields in VE-Master 94 PRACTICAL EXMPLES (REAL CASE STUDIES) Example 1: Value Engineering in plant engineering and construction Table 3: Example of four possible concepts in comparison In this particular project, four possible concepts have been defined: Concept “Quick Win” contains all ideas and measures with very low realization effort and realization time. Not all ideas and measures will find acceptance by the customer. Concept “100% Customer Acceptance” contains all ideas which can be realized without touching the fulfillment of the customer demands. Concept “realistic concept” contains all ideas which are technically feasible, have strong impact in decreasing costs, but may have to be explained to customer very well. Concept “maximum concept” contains all ideas and measures compatible to each, but with no respect on possible violation of customer demands. It shows only the upper edge of possible cost reduction. In the real project, the “realistic concept” was chosen for realization. Example 2: Comparison of different concepts concerning cost reduction, value improvement, pay back-period and Gross Margin 95 Table 4: Comparison of different concepts concerning cost reduction, value improvement, payback-period and Gross Margin Figure 4 shows the different concepts developed in a project in order to reduce manufacturing costs on a PLC. Actually, the Concept 1 was chosen to implement immediately in order to get maximum cost reduction by not touching the total customer value. The payback period by 1.4 months is very little, so that there is no doubt to implement this concept. Additionally, concept 4a was chosen to implement intermediate-term in order to push the project by increasing the customer value significantly and reducing the costs significantly as well compared to the today´s solution. This is the concept to secure the product´s future. REFERENCES 1. DIN73: 69920: Wertanalyse. Beut-Verlag, Berlin, Köln, 1973 2. DIN87: 69920: Wertanalyse. Beuth-Verlag, Brlin, Köln, 1987 3. EU95: Value Management Handbook. European Commission, Luxemburg 1995 4. EN97: DIN EN 12973 Ausgabe 1998-01: Value Management; Deutsche Fassung, prEN 12973: 1997 5. BOR10: BME Value Day 2010 Presentation “Value Management in Automation business” by Axel Borcherding CONCLUSIONS Building suitable concepts out of ideas and measures is a crucial step in VA/VE-project. The project team has to be very attentively while building those concepts. Once the concepts are made, the total value impacts of the solutions can be predicted exactly. The comparison between possible concept solutions is a good tool for making decisions on management level. Software-support for this project stage is indispensable. Spreadsheet operations can support most projects, but the more complex the projects are, even better software solutions will be helpful. Further development on such software is being done by VA/VE-Software specialists. 96 VALUE ENGINEERING (VE) APPLICATION IN MALAYSIAN PUBLIC CONSTRUCTION PROJECTS: QUANTIFYING THE INVOLVEMENT OF VE STUDY APPLICATION IN PROJECT MANAGEMENT (PM) KNOWLEDGE AREAS Abd Latif, Mukhzani Senior Assistant Director, Value Management Unit, Complex Project Management Division, Integrated Asset Planning Branch, Public Works Department, Malaysia And Ghazali, Zawidatul Asma Senior Principal Assistant Director, Head of Value Management Unit, Complex Project Management Division, Integrated Asset Planning Branch, Public Works Department Malaysia ABSTRACT Application of Value Engineering (VE) does improves project management performance, and improves project value in significant perspectives, not limited to the traditional focus areas of time, cost and quality. However, the extensiveness of VE involvement in project performance has yet to be quantified. Thus, this paper intends to demonstrate and quantify the involvement of VE studies (at pre tender stage) in project management knowledge areas as outlined in Project Management Body of Knowledge (PMBOK). The Public Works Department of Malaysia (PWD) is responsible for the implementation of VE studies for public programmes and projects valued at MYR 50 million (USD 16 million) and above. PWD has developed a methodology known as Value Engineering Methodology Matrix or VEMM as mechanism to ensure effective facilitation of VE studies. VEMM provides guidance and in depth description of activities to be carried out at specific VE Study stages (Pre Lab Stage, Lab Stage and Post Lab Stages). The aim of VEMM is to provide uniformity and consistency in the facilitation of VE studies thus ensuring better study outcomes and improved project performance at pre tender stage. Using selected PWD VE case studies, the involvement of VE studies can be verified and quantified in relation to project management knowledge areas. The case studies demonstrated that VE studies has improved the management of PM knowledge areas, thus providing evidence of VE contribution to project performance at pre tender stage. INTRODUCTION Integrating Value Management (VM) application in Project Management (PM) practice does helps the client/project manager to the understand and further explore values of the project as VM approach provide gain in lead time and knowledge in making decisions (Thiry, 1997). Early application of VM will ensure project started in the right direction, and repeated applications help to refine the project’s direction based on new or changed information (SAVE, 2007). VM supports PM practice particularly in managing and controlling the project time, cost and quality within the context of project functionality (Kelly and Male, 1993). Therefore, generally the application of VM in projects ensured better business decisions as VM using systematic and analytical process, improves projects, products and services as 97 objective and requirements are clearly defined, increases effectiveness as VM improves communication and staff developments as VM using team work approach (Che Mat, 2002 and British Standard, 2003). VALUE MANAGEMENT IN MALAYSIAN PUBLIC PROJECTS In order to achieve value for money for public projects, Malaysia Government through the Economic Planning Unit (EPU), Prime Minister Department in 2009 has issued a circular on requiring implementation of VM Studies for public programs and projects valued at MYR 50 million (USD 16 million) and above (EPU, 2009). The requirement is mandatory and failure to implement it may result the programs/projects approval rejected. In 2011, EPU has launched Value Management Implementation Guide in Government Programs and Project (EPU, 2011) with the purpose of further clarifying the process of VM implementation in public projects. The VM Guide has set three (3) major VM study interventions at various stages of project life cycle, as follows: activities to be carried out at specific VE Study stages ie Pre Lab Stage, Lab Stage and Post Lab Stage. VEMM is developed as a matrix tabulation to coordinate important elements as follows: Activities to be conducted at various stages Tasks required for each activity Responsible parties for activities/tasks Recommended tools & techniques to be used Expected outputs for activities Tables 1.0 summarize the overall activities and tasks involved in VE Study stages. VM Study Stages Activities Tasks 5 8 Information Phase 10 22 Function Phase 3 8 Creative Phase 2 4 Evaluation Phase 3 5 Development Phase 6 12 Presentation Phase 3 3 5 16 37 78 Pre Lab Lab Stage Post Lab 1. Value Assessment at Strategic Planning Stage 2. Value Engineering at Design Stage 3. Value Review at Operation Stage Table 1.0: Overall activities and tasks described in VEMM In relation to study interventions, the VM Guide also determined the responsible agencies to lead the respective VM studies. PROJECT MANAGEMENT KNOWLEDGE AREAS BY PROJECT MANAGEMENT BODY OF KNOWLEDGE (PMBOK) VALUE ENGINEERING METHODOLOGY MATRIX (VEMM) PMBOK 4th Edition by Project Management Institute (PMI, 2008) USA, has outlined nine (9) knowledge areas of project management practice. The knowledge areas comprises four (4) core functions (scope management, quality management, time management and cost management), four (4) facilitating functions (human resources management, procurement management, risk management and communication management) and project integration management (Thiry, 1997). The Public Works Department (PWD) of Malaysia as the technical agency of Malaysia Government is responsible for implementation of VE studies in public projects. As such, to ensure effective facilitation of the VE studies, PWD has developed a methodology known as Value Engineering Methodology Matrix or VEMM. The aim of VEMM is to provide uniformity and consistency in the facilitation of VE studies thus ensuring better study outcomes and improved project performance. It provides guidance and in depth description of key Total PMBOK 4th Edition also described five (5) project management process groups ie; Initiating, Planning, Executing, Monitoring & 98 Controlling and Closing, with a total of 42 processes. These processes represent the required activities for the specific process PM Knowledge Areas Integration (6 processes) Process Groups Initiating Develop Project Charter Time (6 processes) Cost (3 processes) Quality (3 processes) Develop Project Management Plan Plan Quality Human Resources (HR) (4 processes) (5 processes) Planning Executing Monitoring & Controlling Closing Direct and Manage Project Execution Monitor and Control Project Work Perform Integrated Change Control Close Project or Phase Collect Requirement Define Scope Create WBS Define Activities Sequence Activities Estimate Activity Resources Estimate Activity Durations Develop Schedule Estimate Costs Determine Budget Scope (5 processes) Communication groups in relation to the respective knowledge areas as summarized in Table 2.0 Develop HR Plan Identify Stakeholders Plan Communications Risk (6 processes) Plan Risk Management Identify Risks Perform Qualitative Risk Analysis Perform Quantitative Risk Analysis Plan Risk Responses Procurement (4 processes) Plan Procurements Verify Scope Control Scope Control Schedule Control Costs Perform Quality Assurance Acquire Project Team Develop Project Team Manage Project Team Distribute Information Manage Stakeholders Expectations Perform Quality Control Report Performance Monitor and Control Risks Conduct Procurements Administer Procurements Close Procurements Table 2.0: Mapping of Project Management Processes to Process Groups and Knowledge Areas (Adapted from PMBOK 4th Edition, PMI 2008) 99 QUANTIFYING THE INVOLVEMENT OF VE APPLICATION IN PM KNOWLEDGE AREAS Four (4) VE case studies were selected for the purpose of verifying and quantifying the involvement of VE Studies implementation in PM Knowledge Areas. VEMM was applied in VE studies implementation of the projects. To provide representation of project uniqueness, various projects of different background have been considered for evaluation. Listed below is the overview of the selected VE case studies. Design Level: Achievements: Cost Avoidance: components Detail Design and initials BQ Design redundancies removed (optimization of bridge & traffic management components); Design improvement (optimization no of bridge spans, land acquisition), Cost optimization and Construction Prioritization 1.51% from original cost estimate Evaluation of VE Case Studies against Project Management (PM) Knowledge Areas VE Case Study 1 Project Type: VE Study Scope: Design Level: Achievements: Cost Avoidance: A Dedicated Ramp (Structure) Most elements and selected components Schematic Design and initials Bills of Quantities (BQ) Validation of project functions with design options; and Cost optimization 0.17% from original cost estimates VE Case Study 2 Project Type: VE Study Scope: Design Level: Achievements: Cost Avoidance: A Vocational Institute All spaces; selected elements & components Schematic Design and initials BQ Compact building design and layout; Better functional facility (user process improved); Design improvement and Cost optimization 10.72% from original cost estimate VE Case Study 3 Project Type: VE Study Scope: Design Level: Achievements: Cost Increase : A Fishery School (Agricultural College) All spaces; selected elements & components Schematic Design and initials BQ Compact building design and layout; Better functional facility (user process improved); Design improvement and Cost optimization 6.14% from original cost estimate VE Case Study 4 Project Type: VE Study Scope: Flyovers at Junctions (Structure) Most elements and selected In an effort to quantify the involvement of VE activities in the PM knowledge areas, a study was carried out by mapping out the VEMM activities and tasks applied in the VE case studies against the PM processes listed in Table 2.0. Equal marks/weightage is given to each PM processes. The VE studies were conducted at design stage prior to tender process. Results of the evaluation process are shown in Table 3.0. Meanwhile, Figure 2.0 and 3.0 represents the involvement of VE studies in individuals and overall PM Knowledge Areas. PM Knowledge Areas Integration (6 processes) Scope (5 processes) Time (6 processes) Cost (3 processes) Quality (3 processes) HR (4 processes) Communications (5 processes) Risk (6 processes) Procurement (4 processes) Total 42 processes Relevancy of VEMM Activities/Tasks Case Case Case Case Study 1 Study 2 Study 3 Study 4 3/6 3/6 3/6 3/6 4/5 3/5 3/5 4/5 5/6 5/6 5/6 5/6 3/3 2/3 2/3 2/3 2/3 2/3 2/3 2/3 2/4 2/4 2/4 2/4 4/5 4/5 4/5 4/5 4/6 4/6 4/6 5/6 1/4 1/4 1/4 1/4 28/42 26/42 26/42 28/42 Table 3.0: Involvement of VE Studies Application in PM Knowledge Area 100 High involvement of PM Knowledge Areas Figure 2.0: Involvement of VE Studies in PM Knowledge Areas (by individual PM Knowledge Areas) Minimum Involvement Figure 3.0: Involvement of VE Studies in PM Knowledge Areas (by overall PM Knowledge Areas) 101 DISCUSSION OF RESULT Case Study 4 From the analysis, it is shown that VE activities have contributed significantly to the management of six (6) PM Knowledge Areas in the case studies as follows: Scope management Time management Cost management Quality management Communication management Risk management The implementation of VE in the case studies has helped to improve the management of the above knowledge areas, thus contributing to better project management at pre tender stage. Table 4.0 highlights the impacts of VE activities to project performance at pre tender stage. VE Case Study Case Study 1 Case Study 2 Case Study 3 Impacts to Project Performance Better design options and improved project scope (against project functions) Client value system explicitly defined and considered Better project cost for budget approval Enhanced communication among the project team members Risks register developed to mitigate project risks Compact building design and layout proposed to match the set project cost Improved facility functions inline with user requirements Client value system explicitly defined and considered Enhanced communication among the project team members Risks register developed to mitigate project risks Improved building design and layout proposed to match the set project cost Improved facility functions in line with user requirements Better project cost estimates Client value system explicitly defined and considered Enhanced communication among the project team members Risks register developed to mitigate project risks Better project scope and implementation (construction) prioritization proposed as construction prioritization carried out to match the cost limitation Client value system explicitly defined and considered Enhanced communication among the project team members Risks register developed to mitigate project risks Table 4.0: Project Performance Impacts CONCLUSION This paper has demonstrated that the involvement of VE studies can be verified and quantified in relation to project management knowledge areas. It has also provided evidence to support the notion that the implementation of VE studies in projects does improves the management of PM knowledge areas and the overall project management. Further to that, the result has shown that application of VEMM in VE study facilitation provided consistent evidence of improvement to the respective PM Knowledge Areas. Hence, proving that VM is an effective tool to enhance project value through effective project management application. ACKNOWLEDGEMENTS Sincere appreciation extended to co-author Mdm Zawidatul Asma, all Directors Ir Mohd Daud, Ir Nazari and Ir Ramli. Greatest thanks to all VM Unit team members for their continuous support given; Sharifah Muna, Rohanis, Muhammad Fahmi, Syamsul Kamal, Rezal, Hanida, Nazariah and Zuraida; friends and families. REFERENCES 1. 2. Thiry, M. (1997) A Framework for Value Management Practice, Project Management Institute (PMI) Kelly, J. and Male, S. (1993) Value Management in Design and Construction, The Economic Management of Projects, Taylor and Francis, Oxon, UK. 47-50 102 3. 4. 5. 6. 7. 8. 9. BS EN12973:2000 (2003). Value Management. London, British Standard Che Mat, M.M (2002). Value Management: Principles and Applications. Petaling Jaya, Prentice Hall, 2002 SAVE (2007) The International Value Standard and Body of Knowledge, SAVE International EPU (Economic Planning Unit), (2009). Value Management Implementation Guideline No. 3/2009, Malaysian Prime Minister’s Department, Putrajaya, Malaysia EPU (Economic Planning Unit) VM Guide, (2011). Value Management Implementation Guide in Government Programmes / Projects, Malaysian Prime Minister’s Department, Putrajaya, Malaysia PWD (Public Works Department),(2103) Value Engineering Application Guidelines for Public Projects, Malaysian Public Works Department, Kuala Lumpur, Malaysia PMI (Project Management Institue) (2008) Project Management Body of Knowledge (PMBOK) 4th Edition, Newton Square 103 VM – An Innovative Way to Solve the Conflict in Public Engagement Jingyu YU1, Mei-yung LEUNG2 Abstract Although public engagement in encouraged to be used in construction projects, it is still remaining inadequacy and controversial without the systematic and logic decision making project. As a team decision making process, value management (VM) is innovatively proposed to be adopted into the whole PE process for improving the project performance and increasing satisfaction of different stakeholders. This paper thus aims to investigate the impact of VM 6-phase job plan on the final PE performance by a case study. VM was applied to the PE process for a public housing project. The results indicated that the adoption of VM in PE was beneficial for managing conflict among stakeholders. Based on current finding, several recommendations were proposed to manage conflict and improve PE performance, including preparation of specific and sufficient information for the PE project before the workshops, analysis of stakeholder expectations from a functional perspective and dissemination of final designs and PE report in a timely manner and transparently, etc. Key words: Conflict, Job Plan, Public Engagement, Value Management INTRODUCTION Public engagement (PE) has emerged as a prerequisite of establishing a democratic society, and it has increasingly been adopted in well-developed countries. In recent years, PE has been encouraged by the Hong Kong Government, especially in the areas of urban planning, mega-construction projects and policy making (HKSAR Policy Address, 2009). Hong Kong citizens are increasingly aware of how their needs and desires can be satisfied through government policies. However, the engagement process is still remaining inadequacy and controversial. The systematic and logic decision making process for PE is still missing (Gregory and Miller, 1998). As a result, the public may perceive PE as a cynical or manipulative exercise, and, if it is not conducted appropriately, discussions and suggestions could be gone down the drain. Hence, value management (VM) is proposed to be adopted into the whole PE process for improving the project performance and increasing satisfaction of different stakeholders. This paper aims to investigate the feasibility of the adoption of VM into PE by a case study. 1 2 Lecturer, School of Civil Engineering, Hefei University of Technology, Tunxi Road, Hefei, China; email: [email protected]. Associate Professor, Department of Architecture and Civil Engineering, City University of Hong Kong, Tat Chee Avenue, Kowloon Tong, Hong Kong; email: [email protected]. - 104 - VM JOB PLAN INPUBLIC ENGAGEMENT As a team decision making process, VM is expected to be beneficial for the applying into the PE process (Leung and Yu, 2014). The formal VM workshop stage involves six phases, including information, analysis, creativity, evaluation, development and presentation (SAVE 2007). Besides the VM workshop, pre-workshop and post-workshop activities are also conducted to prepare the project information and follow up the workshop results. As the systematic team decision making process, the adoption of VM job plan into PE will be conducted sequentially. Pre-workshop activities: PE organizers prepare project information. Appropriate stakeholders are also identified and selected before the workshop. Information phase: PE organizers clarify project requirements and identify key issues. All participants share their interests and concerns of the project. Function analysis phase: Function analysis techniques are applied to analyze the logical relationship of project objectives and functions. Creativity phase: The PE organizers employ creative techniques to encourage stakeholders generating ideas for the project. Evaluation phase: Stakeholders in the workshop assess the generated ideas with both quantitative and qualitative techniques. Development phase: Stakeholders select a shortlist of alternatives and develop proposals /action plans for further implementation. Presentation phase: In the end of the workshop, stakeholders are invited to summarize the results of group discussion in the workshop. Post-workshop activities: PE organizers follow up the action plan proposed by the VM workshop. CONFLICT MANAGEMENT IN PUBLIC ENGAGEMENT Due to multiple stakeholder involvement, conflict is inevitable in the PE process (Leung et al. 2005). In the beginning of PE activities, stakeholders are encouraged to express their opinions and conflict can be stimulated by VM techniques such as information sharing techniques, FAST diagram and brainstorming. Conflict level is assumed to be increased in the early phases of VM job plan, such as pre-workshop, information, function analysis and creativity phases. Once the conflicts are exposed in the workshop process, they must be resolved by selecting the appropriate ideas in the evaluation and development phases. Conflict between different stakeholders is hypothesized to be reduced in the evaluation phase, development phase, presentation phase and post-workshop phase. Hence, by application of VM 6-phase job plan, conflict is assumed to be stimulated in the information, function analysis and creativity phases and resolved in the evaluation, development, presentation phases (see Figure 1). - 105 - Conflict Pre-workshop Information Function analysis Creativity Evaluation Development Presentation Post-workshop VM Job Plan Phases Figure 1 Conceptual Model of VM Job Plan and Conflict Management in PE Process RESEARCH METHODOLOGY A case study was conducted to examine the adoption of VM in PE process for the public housing project. Eight interviewees were selected from different stakeholder disciplines including the governmental departments, construction professionals, interest groups and local residents. To ensure the reliability of the data, all interviewees were required participating at least one PE workshop or focus group discussion. The personal interviews were conducted with each interviewee being assigned by the same structured framework. The design of the interview questions needed to be indirect and informative questions and ensured the objective attitude (Dillon et al., 1994). All qualitative data were collected by simultaneous noting-taking, tape recording and were further analyzed by the systematic contextual analysis. CASE STUDY The selected project is a public housing redevelopment project. The original estate was the last estate included in the Comprehensive Redevelopment Programme launched in 1988. Most residents had lived in the original estate for over 30 years and had actively engaged in the redevelopment of the public housing project. PE in the public housing case lasted for nine years (from 2000 to 2009) from planning to final operation stage. Multiple stakeholders with different requirements were involved, such as the architects and engineers of the governmental departments, social workers in non-governmental organizations, district council members, local residents, the media, external professionals and volunteers. - 106 - Qualitative data were coded and the causal relationships between VM job plan and conflict in public housing project were illustrated in Table 1. In the planning stage, conflict between the government and original residents were identified by a large-scale survey. The government initiated the redevelopment of the public housing project and planned to relocate the original residents to another district near to the old Hong Kong airport. However, original residents strongly disapproved the arrangement suggested by the government. Table 1 Causal Relationships in Public Housing Project VM Job Plan Pre-workshop Information sharing Analysis Creativity Evaluation Development Presentation Post-workshop Stakeholder Behaviors The government proposed to relocate local residents. Local residents disapproved the governmental arrangement. Social workers conducted a survey to identify residents’ requirement, e.g., local settlement and better living environment. The government distributed PE posters. Stakeholders review project information and express opinions. Conflicting views are exposed. Stakeholders consider project constraints, different expectations and identify specific project objectives. Stakeholders generate creative ideas and express their suggestions. The generated ideas are sometimes opposite each other. Stakeholders identify feasible ideas, e.g., shuttle flits, grab rails, seating benches, etc. The government studied the feasibility of selected ideas. The government integrated feasible ideas into the design scheme. Social workers explained the initial design to local residents. Stakeholders accepted the design scheme. Stakeholders monitor the project progress. Conflict Management Conflict ↑ Conflict ↑ Conflict ↑ Conflict ↑ Conflict ↓ Conflict ↓ Conflict Conflict ↓ ↓ At the design stage, the governmental department organized a series of briefings and workshops and a heritage exhibition. Through PE activities, several techniques were used to express stakeholder opinions and review project information in the information sharing phase. At first, the government “understood the needs and desires through collecting their opinions, such as maintaining local shops and food stalls, increasing natural ventilation, providing elder-friendly facilities” (Local residents). Local residents who were old neighbours valued the collective memories and the feelings of the neighbourhood (Local residents). Sometimes, the views were conflicting, e.g., some residents wanted to keep local cafés, whereas others concerned about the hygiene of the environment (Interest groups). Following the information sharing phase, analysis phase was conducted to specify project objectives and identify major requirements of local residents. All participants in PE activities considered the project constraints and opportunities as well as the varied expectations of stakeholders in the analysis phase. It was remarkable to note that stakeholders only analyzed information collected in the - 107 - information sharing phase. During the analysis phase, different expectations and project constraints were discussed, which might be attributed to the increase of conflict level among stakeholders. Although conflict is increased, analysis phase helped stakeholders identify comment interests which requested local settlement. In PE workshops, the PE organizers used brainstorming techniques and encouraged the generation of ideas. As end-users, local residents raised many ideas based on their daily life, particularly for the elderly living in the estate (Construction professionals). After collecting the opinions of residents, the government staff studied the feasibility of these ideas and combined similar ideas (Interest groups). Normally, the governmental department “invited consultants to assess the feasibility of ideas generated in the early workshops and integrated those ideas into several layout and master plans” (Government officers). The government staff with the help of social workers explained the feasibility study to local residents. Then residents were asked to evaluate the better proposal for further implementation in the subsequent workshops and briefings (Construction professionals). Based on the results of PE workshops, the architects from the government department integrated selected ideas into the design scheme and showed the design scheme to local residents and relevant parties (Interest groups). Stakeholders engaged in PE process accepted the design scheme and supported the project implementation (Interest groups). As a result, the government department finalized the project design which had fulfilled major requirements of residents (Government officers). Most of the local residents were satisfied with the project design and supported the implementation of the project. RECOMMENDATIONS The findings strengthen that VM job plan phases can be applied into PE process and manage stakeholder conflict. It is strongly recommended to adopt the systematic and logical VM job plan into PE decision making process. It is also encouraged to well prepare project information including project background, project constrains, major issues and initial project design at least two weeks before PE activities in order to allow sufficient time for the public to understand the situation. The results indicated that the adoption of analysis phase help to increase conflict among stakeholders, analyze project information and specify major requirement and project objectives. In consideration of the benefits of analysis phase, it is encouraged to use analysis techniques, especially function analysis techniques (e.g., function identification and FAST diagram) in PE activities to analyze different expectations from the function perspective, manage conflict and identify specific project objectives (Leung et al. 2014). In creativity phase, various techniques and rules are suggested to be used, such as brainstorming, emphasis on quantity, no judgment and exchanging of team members - 108 - (Leung et al., 2012). The PE organizers are recommended to be more open-minded to use stakeholder opinions and make necessary revision on action plan according to reasonable and feasible public opinions. Moreover, it is suggested to emphasize the impact of presentation phase by dissemination of PE report. The PE report should be published on multi-media to inform stakeholders. CONCLUSION To positively respond to all challenges of PE, construction professionals and academics still seek ideal PE processes. However, there is still little guidance about how to produce meaningful PE. Therefore, the current study proposes to adopt the systematic VM job plan into PE team decision making process and investigates the relationships between VM job plan phases and stakeholder conflict in PE by a case study. A public housing project was selected and eight interviews were conducted to explore their actual experiences in PE process. The qualitative results indicated that the application of VM job plan was beneficial for conflict management in PE decision making process. To manage stakeholder conflict improve PE performance, it is strongly recommended to adopt systematic VM into PE decision making process. It is also suggested to prepare project information at least two weeks before PE activities, use various techniques to share specific information and analyze stakeholder expectations functionally, revise action plan based on stakeholder opinions, and distribute PE report in a timely manner. Moreover, to better understand the practical application of the VM into PE decision making process, further large scale studies are recommended to examine the causal relationships between VM job plan and conflict management and final PE performance. ACKNOWLEDGEMENT The work described in this paper was fully supported by a grant from the Research Grants Council of the Hong Kong Special Administrative Region, China (Project No. City U 114512). REFERENCES Dell’Isola, A. J. (1997) Value Engineering: Practical Applications – for Design, Construction, Maintenance & Operations, Kingston, Mass: R.S. Means Company. Gregory, J. and Miller, S. (1998) Science in Public Communication, Culture, and Credibility, New York: Plenum Trade. HKSAR Policy Address, (2009) The 2008-09 Policy Address – Embracing New Challenges. Available at: http://www.policyaddress.gov.hk/08-09/policy.html. - 109 - Leung, M.Y., Yu, J. (2012) A Comparison of the Decision-Making Processes Involved in Public Engagement Practices and Value Management Practices in Hong Kong, International Conference Value Engineering and Management, 6-7 December 2012, HK: The Hong Kong Polytechnic University. Leung, M.Y., Yu, J. (2014) Value Methodology in Public Engagement for Construction Development Projects. Built Environment Project and Asset Management, 4(1), 55-70. Leung M.Y., Yu J.Y., Chan Y.S. (2014) A focus group study to explore critical factors of public engagement process for mega development projects. Construction Engineering and Management, 140(3), 04013061. Leung, M.Y., Yu, J., Liang, Q. (2013) Improving Public Engagement in Construction Development Projects from a Stakeholder’s Perspective. Journal of Construction Engineering and Management, 139(11), 04013019. SAVE (2007) Value standard and body of knowledge, retrieved from http://www.value-eng.org/about_vmstandard.php. - 110 - INNOVATION PROJECT ACCEPTANCE IN AN EMERGING MARKET CITY Professor Mark Palmer Queen's University Belfast Room 02.039 Riddel Hall 185 Stranmillis Road Belfast Northern Ireland | UK | BT9 5EE [email protected] Dr. Yann Truong ESC Rennes School of Business 2 rue Robert d'Arbrissel 35065 Rennes Cedex FRANCE [email protected] Dr. Geoff Simmons Queen's University Belfast Room 02.039 Riddel Hall 185 Stranmillis Road Belfast Northern Ireland | UK | BT9 5EE [email protected] Jorge Esteban Diez Giraldo MBA Student ESC Rennes School of Business 2 rue Robert d'Arbrissel 35065 Rennes Cedex FRANCE [email protected] ABSTRACT This research introduces the notion of social value in innovative projects that have been implemented by a city office in an emerging country. The aim of this study was to explore the nature of social innovation and issue selling rhetoric in the development and acceptance of innovation projects in a city located in an emerging national market setting. Issue- selling was found to be socially accomplished through rhetoric in gaining acceptance of innovation projects, requiring social actors to disrupt pre-existing institutional logics. Contradictory logics are seen to represent an opportunity for issueselling rhetoric to subvert, infiltrate and open up new logics to promote the city as an attractive business investment location through innovation project acceptance; transcending logics from its emerging market setting that promotes more negative perceptions. The study demonstrates a subtle and nuanced practice in the gaining of innovation project acceptance, extending industrial marketing literature on business networks and how orchestration and facilitation aids innovation within inter-organisational networks. INTRODUCTION The aim of this study is to explore the notion of social value through innovative projects in a city located in an emerging country. We investigate how the city of Medellin in Colombia created value around social projects and managed the acceptance of these projects by the local population. The main idea is that social value is not automatically accepted by the local population but needs to be managed and sold as a mainstream service, even though the promoter of the projects are governmental organizations. The study objectives are twofold. First, to develop an understanding of the nature of social innovation and issue- selling rhetoric that socially accomplishes innovation projects for a city located in a challenging emerging market. Second, to show how issue-selling rhetoric simultaneously disrupts and empowers institutional logics in the city. The city in question is Medellín in Colombia, with an approach towards innovation projects that resulted in it being awarded in 2012 the title ‘Innovative City of the Year’ by the Wall 111 Street Journal. We sought to understand how the various innovation projects ‘got off the ground’, in the context of a city administration promoting it as a place for businesses to locate and do business in an emerging national market. Critical to this was how issue- selling rhetoric transformed institutional logics in the city to enable the acceptance of innovation projects (Rodríguez-Pose & Storper, 2006; Rodríguez-Pose, 2013). The challenge of gaining acceptance of city-based innovation projects was expected to be particularly difficult in an emerging national market such as Colombia, where there is a chronic shortage of resources and inadequate infrastructure (Ramani, SadreGhazi & Duysters, 2012; Descubes, Timsit, Truong, 2013). As Rodríguez-Pose (2010: 367) explains “there are significant differences in the formal and informal institutional structure among territories and in the way these institutions operate and function.” LITERATURE REVIEW Innovation projects, i.e. projects that target the adaptation or development of new products, services, or processes (Woodman et al., 1993), invariably face the challenge of how to win acceptance (Simmons, Palmer, & Truong, 2013; Yang, Su, & Fam, 2012). The role that is played by innovation projects presents an interesting, but overlooked, area with regards to cities as industrial markets. Cities can be represented as industrial markets, in their promotion as attractive places that organizations should locate and do business (Eriksson & Lehtimäki, 2001). A particularly interesting question, and a key focus of this study, is how innovation projects gain acceptance in cities that are located within an emerging national market setting. This is particularly pertinent, when cities as industrial markets attempt to promote themselves as attractive business investment locations through innovation project acceptance; transcending their emerging market settings that can promote more negative perceptions. Hitherto, studies suggest that in order for a city to win acceptance for an innovation project it will need to develop legitimacy with a range of actors (Eriksson & Lehtimäki, 2001). Cities located in emerging markets are likely to be particularly challenged in gaining innovation project acceptance (see for e.g. RodríguezPose, & Storper, 2006; Rodríguez-Pose, 2013). This is because the outcomes associated are not fully known before the process, and cannot be reliably assessed after the delivery of the project (Rodríguez-Pose, 2013). The condition is known as causal ambiguity, where the transformation process of inputs into desired outcomes is socially complex, tacit, and specific to institutional conditions (Lee, & Zhou, 2012). Furthermore, Amin and Thrift (1995) highlight the condition and influence of ‘institutional thickness’ in emerging markets, which is the combination of features, including: The presence of many institutions; interinstitutional interaction; a culture of collective representation; identification with common industrial purpose; and shared norms and values which serve to constitute the ‘social atmosphere’ of a particular locality (Amin and Thrift, 1995, p. 104). In the context of India, Iyer et al. (2012) show that, despite weak infrastructure, resource shortages, and other challenges that restrict growth in emerging economies, institutions remain vital as a way for dealing with causal ambiguity in brokering and promoting innovation. This assumes that innovation project acceptance requires engagement and brokering with a range of different actors such as investors, architects, citizen groups, planners, property developers, suppliers, financial institutions and politicians (Rodríguez-Pose, 2013). METHODOLOGY The aim of this study is to explore the nature of issue- selling rhetoric in the development and acceptance of innovation projects in a city located in an emerging national market setting. In order to address this, the research adopted a grounded theory approach (Glaser & Strauss, 1967). The research setting of Medellín in Colombia was chosen for this study, reflecting the assumptions of Gibbert, Ruigrok & Wicki (2008) that this particular city would offer theoretically rich case material in line with meeting the research aim. Medellín is located in the north-western mountains of Colombia, an emerging Latin American economy with an average economic growth rate of 4.1% in the past 4 years and a total GDP of $369.6 billion 112 in 20121. The city of 2.2 million inhabitants, has recently gained international recognition for having undergone a transformation from being a violent city in the 1980s and 90s to considerably reducing homicide rates by nearly 80% in 20 years, and significantly improving the quality of life of its residents through major changes to its institutional fabric, a series of urban interventions including public libraries, kinder gardens, recreation spaces and innovative solutions to public transportation in hillside neighbourhoods (featuring an aerial cable car system and outdoor escalators up steep hills to provide greater mobility to the poorer suburban population). These achievements were acknowledged in 2013 by the Wall Street Journal, Citi and the Urban Land Institute by deeming Medellín “Innovative City of the Year” for its innovative approach to use existing technologies to deliver benefits to the most vulnerable population and hence accomplish a social transformation. FINDINGS AND DISCUSSION The objective of this research was to explore the value creation process through several social innovation projects in an emerging market. More particularly, we focused on the issue of selling the value to the local population by investigating the rhetoric that the city official used to promote the projects. Previous work has considered the effects of relationship learning and absorptive capacity on innovation performance in industrial markets (Chen, Lin and Chang, 2009). While this study focused on the Taiwanese manufacturing industry, less is known regarding cities as industrial markets and their efforts to be viewed as innovative and therefore attractive locations for business investment. A particular challenge highlighted by this study is that in order for a city to win acceptance for an innovation project it will need to develop legitimacy with a range of actors (Eriksson & Lehtimäki, 2001). Cities located in emerging markets are likely to be particularly challenged in gaining innovation 1 Data from World Bank http://data.worldbank.org/indicator/NY.GDP.MKT P.KD.ZG project acceptance from this perspective (see for e.g. Rodríguez-Pose, & Storper, 2006; Rodríguez-Pose, 2013). In this paper we conducted a study of successful large-scale innovation projects in Medellín located in Colombia. The findings extend Araujo and Easton’s (2012) business network analysis salient in cases of innovation, when actors attempt to bring about their particular versions of the future facing acute problems of uncertainty. Issue- selling is shown to be socially accomplished through rhetoric, as Medellín attempted to gain acceptance of innovation projects under conditions of uncertainty due to the emerging national market setting; requiring social actors to disrupt pre-existing institutional logics. promote itself as an attractive industrial market. A series of rhetorical strategies deployed by actors were identified, transforming the institutional logics that provided symbolic frameworks and meaning for promoting innovation projects. This, in turn, promoted Medellín as an innovative and dynamic location for businesses to invest within the emerging national market of Colombia, often seen as presenting significant challenges for potential business investment decisions. Rao and Giorgi (2006: 272) explain that those actors, “seeking to re-institutionalize a social field skilfully use or undermine pre-existing logics in the field” must play a double-edged role: they deinstitutionalize existing beliefs, norms, and values embodied in extant social structures and establish new structures that instantiate new beliefs, norms, and values. Specifically, we found that actors using issue- selling rhetoric attempted at one level to disrupt pre-existing institutional logics in the city of Medellín, that were reflective of challenges faced by business investors in the wider emerging national market setting of Colombia. This was through initiatives attempting to: trigger dissonance with the dominant logic of the black market, often seen as a major challenge for businesses thinking of investing in emerging markets; disrupt the existing emerging market logic through a call for a more ‘cosmopolitan ethic’, to replace local affiliations and attachments, especially in relation to the cartels; disrupt the existing state logic with a ‘‘business’’ logic that framed the innovation project as having a concern for the careful management of cost 113 and time and representing a city highly efficient in service delivery and by extension an attractive place to do business. At another level, the issue- selling rhetoric sought to resonate with new beliefs, norms and standards of practice for Medellín, which diverged from those typically associated with the wider emerging national market setting of Colombia. This was through initiatives attempting to: highlight compliance by Medellín with progressive cosmopolitanism through choices pertaining to local attachments; reassert the authority of the virtues of entrepreneurial activity beyond the dominant black market logic; get buy-in to the wider goals of creating an innovative city through creating more equality in terms of access to marketplace resources particularly for disadvantaged communities. POLICY IMPLICATIONS Understanding issue- selling rhetoric provides policy guidelines on how to improve innovation project acceptability for cities as industrial markets located in emerging market settings. These guidelines may help to overcome setbacks such as innovation project termination, failure, or how innovation projects can gain acceptance after a setback that negatively affects the initial issue- selling rhetoric. Our analysis, case complemented by the case study of Medellín in Colombia, demonstrates that policy makers need to not only work on innovation project acceptance, but also on navigating, negotiating and transforming institutional logics. Issue- selling rhetoric effectively supports innovation project champions that are focused on promoting the attractiveness of their cities as industrial markets for businesses to invest. When tasked with gaining innovation project acceptance in a city located in an emerging market, and the challenges accompanying that, a noteworthy implication is how ‘thick institutions’ matter. The imperative for policy makers is to focus on ‘promotion’, ‘generating awareness’ and ‘orchestrating innovation networks’ to diffuse ideas relating to the innovation project. Equally important, however, is the way that actors must engage in the collaborative institutional work of disrupting, reshaping and rebuilding the institutional thickness in their emerging market cities. To disrupt pre-existing dominant institutional logics, the case study of Medellín in Colombia demonstrates that in order to win acceptance of innovation projects within a challenging emerging market setting, issue-selling rhetoric strategies need to understand and be specifically tailored to the local (i.e. drugdealing and cartels) and regional placebounded (i.e. Antioqueño's DNA) institutional logics, to make the most of the interruption and intervention of the innovation project. Almost counterintuitively, it requires policy makers to ensure that innovation projects ‘stick’ in the most socially and economically deprived city areas. At the same time, the transformative issue-selling rhetoric must be deployed by policy makers to marshal, empower and galvanise the various actors towards ensuring the city as an industrial market transcends the challenges associated with the emerging national market setting. Policy makers can use the study findings to reflect upon the role of signature innovation projects in that regard. Measures such as economic cost-benefit analysis and its associated rhetoric is only a small part of winning innovation project acceptance in cities attempting to be attractive industrial markets. More than that, issue-selling rhetoric requires an indepth understanding of local conditions and the extant institutional circumstances of the locale, particularly when set against conditions reflective of the wider emerging national market. It is through understanding the institutional arrangements and the associated features of social interaction, such as networks, norms and trust, that co-ordination and cooperation for innovation project acceptance can be achieved across a city. 114 Issue-selling rhetoric is embedded in or implied in interactions that deal with the uncertainties and ambiguities of the innovation project set against challenges emanating from the emerging market setting. REFERENCES Amin, & A. & Thrift, N. (s.f.). Globalization, institutional thickness and the local economy. In Managing Cities: The New Urban Context. Araujo, & L. & Easton, G. (2012). Temporality in business networks: The role of narratives and management technologies. Industrial Marketing Management, 41, 312-318. Chen, J-S. Tsou, H-T. & Ching, & R.K.H. (2011). Co-production and its effects on service innovation. Industrial Marketing Management, 40 (8), 13311346. Descubes, I., Timsit, & J. P., & Truong, Y. (2013). Social Innovation in Emerging Economies: A Resource‐Based View Perspective. Strategic Change, 22 (78), 503-510. Eriksson, & P. & Lehtimäki, H. (2001). Strategy Rhetoric in City Management: How the Presumptions of Classic Strategic Management Live on? Scandinavian Journal of Management, 17 (2), 201-224. Gibbert M. & Ruigrok, W. (2010). The ‘what’ and ‘how’ of case study rigor: Three strategies based on published work. Organizational Research Methods, 13 (4), 710-737. Iyer, G. R., LaPlaca, P. J., & Sharma, A. (2006). Innovation and new product introductions in emerging markets: strategic recommendations for the Indian market. Industrial Marketing Management, 35, 373-382. Lee, R., & Zhou, K. (2012). Is product imitation good for firm performance? An examination of product imitation types and contingency factors. Journal of International Marketing, 20, 1-16. Ramani, S., SadreGhazi, S., & Duysters, G. (2012). On the diffusion of toilets as bottom of the pyramid innovation: Lessons from sanitation entrepreneurs. Technological Forecasting and Social Change, 79 (4), 676-687. Rao, H., & Giorgi, S. (2006). Code-Breaking: How institutional entrepreneurs exploit existing logics to generate institutional change. Research in Organizational Behavior, 27, 269-304. Rodríguez-Pose, A., & Storper, M. (2006). Better rules or stronger communities? On the social foundations of institutional change and its economic effects. Economic geography, 82 (1). pp. Rogers, E. (2003). Diffusion of innovations (4th ed.). New York: The Free Press. Simmons, G., Palmer, M., & Truong, Y. (2013). Inscribing value on business model innovations: Insights from industrial projects commercializing disruptive digital innovations. Industrial Marketing Management, 42 (5), 744-754. Yang, Z., Su, C., & Fam, K.-S. (2012). Dealing with institutional distances in international marketing channels: governance strategies that engender legitimacy and efficiency. Journal of Marketing, 76, 41-55. 115 USE VA/VE ON ONLINE TO OFFLINE (O2O) CLOUD LEARNING SERVICES STUDY WITH AN EXAMPLE OF XTIVECO CLOUD AND APP Mr. T. M. Chang Mr. S. F. Wang Chief Executive Officer, ActiveBrainCapacitytech Inc, Associate Value Specialist, Taiwan Director of Management Services, ActiveBrainCapacitytech Inc. Associate Value Specialist, Taiwan ABSTRACT There are many innovations applied in the educational and learning industries, especially the mobilization and cloud computing. The center of the trend of innovations has been changing from using the applications of technology and information in the past to the applications of software and services, focusing on user-centered innovation rather than technology-centered ones. Based on the 4C/IDmodel, this study designs the learning services process targeting at the interactions between learning and teaching. Embedded the model of activity design of the SIAO157, the process develops a high-quality cloud learning services that were popular among learners, incorporating the resources from experts and communities into the learning services process, and designing, establishing and evaluating the activities based on the Agile approach. Concurrently, the VA/VE development team follows the learning partnership, using VA/VE structure to innovate and optimize the eLearning services, consolidating team efforts on the process development and innovation. Although VA/VE has been very successful in the construction industry in Taiwan, such as the Taipei Metro, it has not been widely utilized in the small and medium-sized enterprises on the island. The applications of VA/VE have becoming a core business competency and the successful experience and results can be found in the stories of Samsung in Korea, and Hitachi in Japan, to name a few. The purpose of this study is to exemplify the development of the learning services, finding best learning service solution from VA/VE research. TECHNOLOGY INNOVATION ON TEACHING AND LEARNING When learners face challenges during learning, under the time pressure and the target of completion, they strive to fully utilize their own knowledge and experiences for numerous trial and errors, seek external challenges and/or, reading relevant books or searching for references, asking questions to instructors, experts or friends. It would bring out the best performance on learning new knowledge and acquiring information when learning dealing with questions. Take learning to ride a bike for example. It is a problem-oriented complex learning in the 4C/ID-model; including (1) The learner understands the learning task or problem solving related to bikes. (2) The instructor helps learner to ride a bike with relevant resources and supports. (3) The instructor provides immediate feedback when any mistakes in the learning process. (4) If the learner would like to be familiar with the riding skills, more practices are needed. Those supports or resources can be found from peers or communities. INTRODUCTION 116 There are four key elements of 4C/ID-model includes learning tasks, supportive information, just-in-time information and part-task practice. The model focuses on the performance of learning in learning tasks. It evaluates learners’ outcomes, encourages learners to utilize the supports they obtain in order to solve the learning tasks for presenting their competency and performance (Merriënboer & Kirschner, 2007; Chang, 2010). Based on the 4C/ID-model as the framework, Chang develops the learning activities integrating the elements of gamifications and communities, and the learning activities are called SIAO157. There are three stages in the SIAO157 learning activities: (1) Preparation: needs analysis, design and establishment and tools and disposition. (2) Development: brainstorming and dialogues, design thinking and self-talking, substantial conversation and thinking challenge, and formative evaluation, (3) Implementation: problem solving practice and summative evaluation. Using problem solving as a learning strategy is changing the center of teaching and learning. Instructors provide authentic questions to learners in a holistic approach for learners to consolidate their known knowledge and experiences. When learners encounter the questions they cannot handle, they would actively seek outside resources and supports under the external pressures and internal motivations. In order to widen the linkage between learners and experts and communities, it is suggested to take advantage the internet and technology. In addition to obtain the information prepared by instructors in advance, learners can actively utilize their own competencies, and coordinate the content they are learning to solve the problems raised during learning. There are four dialogues to strengthen individual learning in the situations of obtaining resources or seeking supports: (1) raising questions to instructors or experts, (2) Peers’ discussions and brainstorming, (3) selfreflection and the feedback from actions, and (4) providing feedback to new comers in the communities. The four dialogues integrate the environment of classroom learning and problem solving on internet. The principles of Holistic approach and Four Dialogues elaborates learners are required to participate in learning, and then instructors’ job are not just only articulating the content. The needs transfer from learnercentered to assisting learners continuously to the holistic approach and bring out the four dialogues, focusing on the learning environment construction of knowledge-action integration. It can transfer from systematically recording the details of learning and teaching to building up the framework of the data-driven eLearning in the future (Chang, 2013). CLOUD LEARNING SERVICES As the architecture of cloud computing is developing increasingly, many industries gradually move their information system to cloud for operation. The new services models of cloud computing include the Infrastructure as a Service (IaaS), Platform as a Service (PaaS) and Software as a Service (SaaS). The application of using information technology in digital learning also provides many opportunities and barriers to entry. For example, the significant variances between peak times and off-peak times on digital learning can modulate automatically through the cloud platform to optimize the efficiency and effectiveness of the information system, and saving costs. The wide range of applications on cloud computing creates more added value for technology innovations, establishing the usercentered learning services. In addition, building up the framework of “Three Screens and a Cloud” on internet put the data-driven services into practice (Dawson, S., & Siemens, G, 2014), making the value of educational innovations more of wisdom and humanity. The technologyoriented digital learning has been transferred to the learning services with the focus on user experience, and avoiding the technologycentered in educational innovations falls in a quandary. In order to be differentiate from the training aided or supportive systematic plans based on normal technology innovations, innovative cloud learning services should focused on the strategy of begin with the end in mind. That means constructing a learning services promoting talent development fitting for the needs of future learning trends under the continuous evaluation and learning transferring efficiency. Users of the system include instructors, learners, teaching assistant and 117 managements. The content of the cloud services in educational technology innovations do no focus on content digitalization only. approaches easier and feasible. To conclude, there are rooms for learning analysis in digital time as it plays a key role in diversified and personalized teaching. Thus, there are more and more efforts from research and development. It is believed there will be many products or services being developed based on data and analysis (Bomas, 2015). LEARNING SERVICES CASE STUDY The five specific education challenges by the Office of Educational Technology, U.S Department of Education (2012) specified the synergy of learning and teaching requires planning in advance and careful data collections and applications. Based on the design of SIAO157 on the cloud, the study transfers the interactions of asking questions and providing answers into pleasure gamification, with the process evaluation techniques of quantification learning performance criterion and the advantages of cloud computing to construct the innovative learning services based on big data, for widespread usages of personal mobile devices. Digital learning on technology innovations do not mean digitalization only, and it can be emerged in various learning situations, focused on user-centered learning services. Garner also mentioned businesses such as research communities, digital content developers or publishers have been put their attention on the subject of analyzing learning data. Also, according to a research by Kennisnet in the Netherlands showed teachers did not have efficient time to record students’ learning progress, therefore cannot provide supports for individual students. Moreover, learners did not fully understand their own development and progress. Through analyzing and collecting learning data, students’ progress, motivations and degrees can be disclosed to assist the individual support. Today’s technology of cloud computing makes the aforementioned VA/VE FAST is a structure innovation method (Borza, J. 2011), the VA/VE study team members have team leader, coordinator, and owner, human resource, instructor, learner, teaching assistants, the study will develop three learning services FAST diagram, First is the SIAO157 (Micro Learning), Second is the Xtiveco Cloud & App past version (Holistic Beta Learning), Xtiveco means X + Active + ecosystem First and Second could implement five steps in the classroom, (1)Instruction, (2)Team work & Discuss, (3)Solving problem on APP, (4)Request supports and resources, (5)Evaluation. Third is the Clouds & App new version. (O2O Cloud Learning). Based on the five specific education challenges by the Office of Educational Technology, U.S Department of Education, the twenty check items have been developed, each one has five points. 1. Making Sure Learning Resources Promote Deeper Learning. (30 pts) 1.1 Check the terminal learning objectives and mission. 1.2 Check the learning task library and digital materials. 1.3 Check the accountable of team members’ learning. 1.4 Check the plan of learning programs and risk. 1.5 Could provide holistic and dialogue. 1.6 Could provide well design learning UI/UX. 2. Building Adaptive Learning Systems That Support Personalized Learning. (20 pts) 2.1 Could provide well individualized learning task issues. 2.2 Could provide well individualized learning resources. 2.3 Could provide well individualized learning support. 2.4 Could provide well design adaptive learning UI/UX. 118 3. Combining Data to Create Support Systems More Responsive to Student Needs. (20 pts) 3.1 Could provide well learning resources and support. 3.2 Could provide well learning service any time for request. 3.3 Could provide resources and support on time. 3.4 Could provide well design learning resources and support UI/UX. 4. Improving the Content and Process of Assessment with Technology. (20 pts) 4.1 Could provide well quantitative UI/UX of continued evaluation to instruction. 4.2 Could provide well quantitative UI/UX of continued evaluation to material development. 4.3 Could provide well quantitative UI/UX of continued evaluation to training program. 4.4 Could record well to learning interactive. 5. Finding Appropriate Learning Resources and Making Informed Choices (10 pts) 5.1 Could provide well quantitative UI/UX of learning analysis. 5.2 Could provide well quantitative UI/UX of learning guide. WHY? HOW? WHEN? Engage Smart Training Continues Evaluation Continues Learning Evaluate Outcome Provide Awards Implement Instruction Engage Learning Smart Find Terminal Object Design & Development Content Train Trainer Implement Class Implement SIAO157 Engage Training Performance Implement Workshop Train Inner Subject Matter Expert CAUSED BY OR AT THE SAME TIME AS Create Content Create Instruction Slide Evaluate Learner Create Learning Task SCOPE OF PROBLEM UNDER STUDY FAST DIAGRAM FOR MICRO LEARNING WHY? HOW? WHEN? Find Business Goal Apply Data Analysis Continues Evaluation Continues Learning Develop Xtiveco Cloud & App Engage Talent CAUSED BY OR AT THE SAME TIME AS Find Compentency Gap Train Trainer Identity Terminal Object Train Inner Subject Matter Expert Plan Training Program Design & Development Content Implement Training Program Provide O2O Learning Service Cloud Implement Instruction Implement Workshop Implement Online Conference Implement Online Discuss Group Implement SIAO157 Create Content Create Instruction Slide Evaluate Result Provide Awards Engage Work Smarter Evaluate Employee Create Learning Task Evaluate Inner Subject Matter Expert Evaluate Content Engage High Performance Trainer SCOPE OF PROBLEM UNDER STUDY FAST DIAGRAM FOR XTIVECO O2O CLOUD LEARNING SERVICE 119 THE RESULTS After the VA/VE team develops the O2O learning services FAST diagram, utilizing the How-Why thinking logic on each functional item, strengthen the confirmation of the needs on cloud services. This approach on need analysis is surely better than normal brainstorming. The study also presents the differences and positions of technology innovation between online learning and classroom offline learning environments, and brings the attention on what should be especially aware when developing cloud learning services. The functions has been raising 22 points in O2O learning services, comparing with the previous version of Holistic Beta Learning, and it is raising 45 points comparing with Micro Learning, it could implement all criterions. transferring the development of the online and offline learning services focused on user experience to user-oriented FAST can help on the design of user experience. REFERENCES 1. 2. 3. 4. Micro Holistic Beta O2O 5. Deeper Learning. (30 pts) 15 18 22 6. Personalized Learning. (20 pts) 10 15 18 Responsive Needs. (20 pts) 0 10 15 Assessment & Improving. (20 pts) 5 10 15 Resources & Choices. (10 pts) 0 0 5 Total (100 pts) 30 53 75 Case Study Criterion 7. CONCLUSION In the process of FAST analyzing for nearly 20 items on O2O cloud services, it is found that the items for both learners and instructors may be too many and not easy to be interpreted. According to FAST, the functional items should be limited to 15 to 20. The study can develop the FAST according to learners and instructors’ needs, or take the recommendations of the five specific education challenges issued by the Office of Educational Technology, U.S Department of Education (2012) to proceed the FAST analysis on each item. In addition, 8. 9. Borza, J. (2011). FAST Diagrams: The Foundation for Creating Effective Function Models. Ko, Chen-Nan. (2015). How to do enterprise training plan? Retrieved 4/2, 2015, from http://goo.gl/CHf86c Erwin Bomas. (2015) Infographic Learning Analytics. Retrieved 4/3, 2015 from http://goo.gl/JIVJHW Madan, D., Pant, A., Kumar, S., & Arora, A. (2012). E-learning based on Cloud Computing. International Journal of Advanced Research in Computer Science and Software Engineering, 2(2). Merriënboer, J. J. G. v., & Kirschner, P. A. (2007). Ten steps to complex learning : a systematic approach to four-component instructional design. Routledge Chang, Ta-Ming. (2010). Using complex learning instructional design in classroom teaching and online teaching of learning effects study. Tamkang University Education Technology Department, Taipei. Chang, Ta-Ming. (2013). Apply experts' and groups' wisdom in an innovation of the digitallearning.2013 TELDAP International Conference, Poster No.23 UNODC. (2014). Systematic Approach to Training. Retrieved 4/2, 2015, from http://www.unodc.org/pdf/india/publicatio ns/guide_for_Trainers/03_systematicappro achtotraining.pdf U.S. Department of Education Office of Educational Technology (2012). Expanding Evidence Approaches for Learning in a Digital World. 120 TEAM – NUCLEUS OF VALUE METHODOLOGY Anil Kumar Mukhopadhyaya, Certified Value Specialist -Life ABSTRACT (No.Ab004) The concept of Value Methodology(VM) depends upon proper selection of Team. In the concept of VM, there are only three dimensions. Those are number of team members, multidiscipline and members should be knowledgeable to Value Methodology Concept. The experience of more than two decades in conducting various VM training programs, I have experienced that VM Team is finalized very casually, keeping in mind only three things mentioned above. The result which have been experienced in Module I workshop and also in subsequent VM case studies that the benefit is inadequate, which could have got even through any other initiatives. The weakness of the team is visible during the Creative Phase. After generating number of ideas, the ideas are grouped in four zones, based on two axis model of Perceived Performance (X-axis) and Perceived Acceptance (Y-axis). The four zones are, Zone A, Zone B, Zone C and Zone D. The ideas in Zone A are the obvious solutions which can be identified through any initiatives which are High Perceived Performance vis-a-vis High Perceived Acceptance. It has been observed that the present VM Team Structure also fall in that trap and feel happy thinking they have got breakthrough solutions. But the break through solution which is expected from VM Methodology can only be possible if Low Perceived Acceptance and Low Perceived Performance (Zone C) shift towards High Perceived Performance with Low Perceived Acceptance (Zone D) by applying knowledge and technical skill and can also be converted to High Perceived Performance and High Perceived Acceptance (Zone A) from Zone D through persuasive salesmanship.. This is only possible if the Team Members are judicially selected. The present article is an attempt to develop Questionnaire, keeping in mind the traits like Entrepreneurship, Leadership, Innovation, Teamwork and Communication and select the team members based on An Aptitude Test. 1.0 INTRODUCTION The main pillar of Value Methodology (VM) is Job Plan. The VM is just like a garland and the phases are beads. Each phase is considered as a process. The process should have an Output and an Input. One of the Outputs of the Orientation Phase is The TEAM. The team should be a multidiscipline team in order to avoid one track mind. The number of team member should be five to seven depending upon the project, the discipline the team members are chosen. If the VM project is Building a School, the team members should be as below: Architecture Parents Financial Consultant Principal Civil Engineer Mechanical Engineer Electrical Engineer 2.0 Team Analysis In Value Methodology, the Team has three dimensions. They are Multidiscipline Optimum Number Knowledgeable about the Concept (Most of the Members) “Most of the members” is used because if at least one member is not knowledgeable of the Value Methodology, he may be a good contributor of the process. This is only possible if that person has a questioning attitude. Hence, selection of this member is also vital. 3.0 Function Analysis and FAST The Function Analysis is the Heart of Value Methodology. It is the team members who are creative and innovative can extract maximum 121 out of this initiative. The following comments will clarify the point. Why-How Logic is the heart and meat of this creative technique. (Charles W. Bytheway) “--- a great many people think we’re crazy. That is much better protection than any patent.” (Charles F. Kettering ) “ – a research engineer told me he thought I was crazy when I was teaching him my creative technique.” (Charles W. Bytheway) “The FAST diagram clarifies a problem and pinpoints the area to apply creativity” Richard J Parker 5. Ignore what you have experienced or learned in school. It is clear from the above quotations that members should be crazy with this Methodology. Hence, Team members should be judiciously selected to achieve Breakthrough Solutions. 11. Consider how physical and life sciences would perform the function. 4.0 Creativity and Innovation The take away from Function Phase is the identification of Functions which are on the Critical Path and need full attention to improve upon by with creative and innovative ideas. The Creative phase has two dimensions, they are Quantity of ideas Quality of ideas. 4.1 Quality of Ideas through Brainstorming I want to elaborate the procedure developed by Charles W, Bytheway for Quantity Generation through Brainstorming Session which one of the very widely used by Value Methodologist. 1. Every idea or suggestion is to be recorded 2. No criticizing of anyone’s ideas or suggestion is allowed. As a reminder of this rule, I like to have everyone write “I will not criticize” on a full sheet of paper and then crumble the paper and put it in their pocket or keep it in one hand while the brainstorming session is taking place. 3. Divorce yourself from the present project 4. Play different roles as you think of the function 6. Present silly or ridiculous ways of doing things. 7. Disregard standards and traditions. 8. Hitchhiking on other ideas is allowed. 9. Improvements encouraged. to ideas presented are 10. Omit anyone from your group who might be intimidating, if possible. 12. Consider primitive and mass-production methods. Out of the twelve points suggested by Charles W. Bytheway, Sr. No. 4, 6 and 12 need some creative bend of mind. This is also an indication that members should be selected with certain criteria and not nominated. 4.2 Quality of Ideas The generation of ideas when completed and accepted by all the team members, then there is the time for qualitative assessment of the ideas. The ideas can be placed in two dimensional graph as suggested by Muthiah Kasi. These dimensions are 1. Perceived Performance (X-Axis) 2. Perceived Acceptance (Y-Axis) And both the axis are divided into Low, Neutral and High. The graph is presented as below: High Zone B Zone A 24,25 ( R) Neutral Zone C 1,2,3 (S) 17,18,19.30 (S) 1,2 (R) 3, 7, 8 (S) 9,13,20(S) 16,23 (S) Zone D 26,29 (S) Perceived Performance 14,15 (R ) 27,28 ( R) 21,22 (S) 10,11,12 ( R) 4,5,6 ( R) Neutral Low Perceived Performance High There thirty ideas were generated and each idea was evaluated based on the following keys 122 Key S R1 R2 DS Decision Selected Violates Constraint Beyond the scope of the project Design Suggestion It has been observed that the ideas fall in the Zone A are mostly obvious improvement ideas which can be visible through any other initiative. It is clear that these ideas are not those ideas which are expected by the management for a breakthrough solution. Here is the requirement of Dedicated, Crazy and Innovative Team members. To get the break through solution, some idea of Zone C may move to Zone D after applying knowledge and technical skill. Similarly ideas from Zone D may move up during presentation by applying persuasive salesmanship. It can be projected in the following graph. High Zone B that is forty-eight in total. All the questions are to be answered within strictly ten minutes. The questions sets are as below: Creation and innovation Quiz: How to select Team Member having Creative and Innovative potential? Please read the following statements and check one of the columns opposite to indicate whether they always, often, sometimes, rarely, or never apply to your personality, your problem-solving approach or your company / organization. Zone A Ideas may move up again during presentation by applying persuasive salesmanship Neutral Zone C Perceived Performance Low Zone D Ideas may move after applying knowledge & skills Neutral High Perceived Performance 5.0 Selection Criteria for Team Members The team members should be based on three criteria. They are, A. Personality B. Problem Solving Attitude. C. Work Environment Against each criteria, a number of questions have been developed. Each potential member who wants to become a member of the Value Engineering Team should go through this exercise. The exercise will be under the supervision of one Certified Value Specialist (CVS). 6.0 Questionnaires for Criteria The questions in each criteria is sixteen number 123 A. Personality Sl. 1 Description I lack confidence in myself 2 I value criticism 3 I am afraid of being different from others My parents encouraged me to be creative I am uncomfortable with ambiguity I like new faces/places I need a strong sense of order in my life I believe that “daydreaming” is worthwhile I feel uneasy with people who show their feelings I enjoy playing a role 4 5 6 7 8 9 10 11 12 13 14 15 16 Always Often Sometimes Rarely Never Score I achieve most when I follow procedures I rely on my feelings to guide me I like to be known as dependable I like to be with freethinking people I am reactive rather than proactive I like looking far ahead A= B. Problem-solving Approach Sl. 1 Description Always Often Sometimes Rarely Never Score When faced with a problem, I jump to conclusion 2 When a problem arises, I am objective and analytical You need all the facts to make a decision 3 4 “Gut-feel” works for me 124 5 6 7 8 9 10 11 12 13 14 15 16 I rely on my past knowledge of similar problem I hate on working on or with details. Completed staff work is the secret of success Figures and statistics give a biased picture Problems should be approached in the same way I am seen as an original problem-solver I have difficulty defining problems I used disciplined problemsolving techniques I get depressed if a problem seems too difficult When others don’t take decisions, I will-if I can I like to read instructions before starting something new I believe the decisionmaking process is creative. B= C. Work Environment Sl. 1 2 3 4 5 6 Description Always Often Sometimes Rarely Never Score People in my organization think that their way is best Around here, creativity is considered as the key to survival My authority limits are strictly defined Worthwhile ideas from anywhere are accepted here. Time for creativity thinking is limited in this organization Competition between employees / depts. is seen as healthy 125 7 I could describe my organization as cosy and cooperative 8 In this organization we like to identify problems Around here, if you’re creative, you’re a “dreamer” In this organization, creative people are given “space” Organizational procedures kill ideas. I can talk freely about my ideas without them being stolen I will be stopped from suggesting new solutions Around here, good ideas can be sold regardless of results New ideas must be justified with a lot of paperwork Innovation is encouraged in this organization 9 10 11 12 13 14 15 16 C= 7.0 How to Score 8.0 How to Evaluate Score The CVS person will find the score of each candidate based on the method suggested below: Score each answer by writing the appropriate number of points in the ‘SCORE’ column next to it. Give yourself points as follows: All Odd numbered questions (1,3,5,7,9, etc) should be scored: Never = 5 Points Rarely = 4 Points Sometimes = 3 Points Often = 2 Points Always = 1 Points All even numbered questions (2,4,6,8,10 etc) should be scored Never = 1 Point Rarely = 2 Points Sometimes = 3 Points Often = 4 Points Always = 5 Points Once the score for each answer is tabulated, simply add up the total score for each of the three sections; A (Personality), B (Problem Solving Approach) and C (Work Environment). Lastly, add up A+B+C to get the final score of Creative and Innovative Potential. The interpretation of the points will be based on the following Table. 126 9.0 INTERPRETITION OF THE SCORE Interpretation of the score on individual A 16-37 Your creative potential is being stilled by some of your feelings about yourself and you will be surprised how much of it will be related once you give yourself “permission” to be creative. 38-59 You have quite a lot of creative potential within you but parts of your personality are preventing you from expressing it. You need to work at relaxing and at asking yourself “What have I got to lose?” This will help remove / reduce the blockages. 60-80 Your personality predisposes you to be a highly creative person and you will be available resources to others in the creative process. 16-37 Your problem-solving style tends to be “by the book” and lacks creativity. Practice relaxing, forgetting some of the “rules” and open your mind to new ideas and methods. 38-59 Your approach to problem- solving is sometimes too rigid and may result in uncreative decisions which rely too much on past solutions to similar problems. Try letting go and discover your potential for being creative! 60-80 You have an open, creative approach to problem-solving with a lot to offer to others. You should take advantage of every opportunity to create an adventurous and questioning sprit around you. 16-37 Your working environment does not encourage creative thinking. Look at your scores for A and B. If they are on the high side, then, you’re sure to feel frustrated. What are you going to do about it? 38-59 It’s sometime difficult to be creative in your working environment. If you high score for A and B, then use some of your potential to change the environment from within. If not, may you fit nicely! 60-80 You work in an ideal environment for a creative person. However, if you have low A and B scores, then you should be working at developing your potential. No one is going to prevent you from contributing new ideas. 48-111 By now you will have realized that we all have an enormous potential to be creative- if only it is given the chance to be released. So stop your creativity being stifled by yourself or others. Just release it! 112-176 You have good creative potential very close to the surface of your conscious mind, but it is being back by either PERSONALITY B Problem-Solving Approach C Work Environment A+B+C 127 yourself, your approach to problem-solving or your working environment. You can change any or all three- so, what are you waiting for?! Creative & Innovative Potential 177-240 You seem to be a highly creative person with lots of potential. Continue to exercise your talent by seeking new ways of using it at home, in your hobbies and, of course, on the job. 10.0 Selection of Members for the Value Study Two types of Team is suggested to participate in the Value study. They are 1. High Potential of Creative and Innovative members Those members who score between 177 - 240 will be placed in this Team 2. Fencer to High Potential of Creative and Innovative Those members who scores between 160 - 192 will be placed in this Team 11.0 Conclusion In the present Global market a breakthrough solution is the call of the day. This can be achieved by resorting to Value Methodology. In order to get high return by using Value Methodology, the most important is the Team. While following inter disciplinary structure with certain optimum size, it really out of focus regarding the real potential of Team Members. And these team members are the nucleus of the whole process. This article tried to focus on how to select team members based on their potential. Any improvement in the concept will be highly recognized. 12.0 References 1. Value Engineering Theory by Donald E. Parker, for The Lawrence D. Miles Value Foundation. 2. Value Engineering- Concept, Techniques and Applications by Anil Kumar Mukhopadhyaya, Response Books, A Division of SAGE Publications. 3. FAST Creativity & innovation by Charles W. Bytheway, , J Ross Publishing Inc. 4. Function Approach to Transportation Projects, A guide to Value Engineering by Muthiah Kasi, iUniverse, INC 5. The Creative manager’s Pocket Book by John Townsend & Jacques Favier, Research Press. 128 FUNCTIONAL APPROACH AS A VALUABLE WAY OF COLLABORATION BETWEEN JAPANESE STYLE GRASS-ROOTS INNOVATION AND THAT OF DEVELOPING COUNTRIES Dr. Manabu. Sawaguchi Guest Professor Department of Business Design and Management Waseda University Japan ABSTRACT Japanese manufacturing technologies (“Monozukuri-gizyutsu” in Japanese) mainly have two strong points. One is the cutting-edge technologies in R&D which lead the rival companies in the developing countries. The second one is competitiveness in “Kaizen Activities” with the power of skilled workers at actual work sites (“Genba-ryoku” in Japanese) based on Management of Technologies (MOT) techniques (like IE,QC,VE and so on). The strength in R&D is referred to as “Radical Innovation” and “Kaizen Activities” are called “Japanese style Grass-Roots Innovation (GRI),” which was named by Professor Fujimoto at University of Tokyo. In this paper, whether or not MOT techniques including VE can contribute to raise the level of GRI in the developing countries is illustrated by focusing on GRI and effectiveness of “Functional Approach (FA)” through case examples of Japanese style GRI. INTRODUCTION Up to the present time after World War II, the Japanese manufacturing technologies (or “Monozukuri-gizyutsu” in Japanese) have been competitive in the international market thanks to a good balance between the leading cuttingedge technologies and the “Kaizen Activities”. The former is generally called “Radical Innovation (RI)” used particularly in R&D by the manufacturers. The latter is recently defined as “Grass-Roots Innovation (GRI)”. The Japanese style GRI (Js-GRI) is based on the power of skilled workers at actual production sites (“Genba-ryoku” in Japanese) combined with the techniques of Management of Technologies (MOT) such as IE, QC, and VE. In this paper, the focus is placed on Japanese manufacturing technologies, Js-GRI, in particular, to illustrate its beneficial effects for the stable supply of products and services if it is modified for the developing countries, which can be called “Developing countries’ GRI (DcGRI). Js-GRI is also highly effective at the time of implementing the so-called “Reverse Innovation.” In addition, for promoting the collaborations between Js-GRI and Dc-GRI, Functional Analysis (FA) plays a critical role as an effective tool of design thinking, which will be mentioned later. TRANSITION OF JAPANESE MANUFACTURING TECHNOLOGIES AND THE FEATURES OF MAIN MOT TECHNIQUES From the standpoint of “Kaizen Activities” supporting Js-GRI, the development of Japan’s manufacturing industry from 1960’s to 1990’s can be divided into three stages. The first stage started from the 1960’s, when Japan entered a high-growth period. In the home appliance industry, black and white TV sets, washing machines and refrigerators, termed as “three sacred treasures,” became widely available among the ordinary people as the result of their high-quality and low-cost production. This was the time when the majority people in Japan came to feel like belonging to the middle class. The 1960’s was also characterized by the fact that QC was introduced initially as SQC and implemented in the Japanese manufacturing industry. SQC was then evolved into the Japanese original TQC. The point is, through the “Kaizen Activities” based on QC, not only 129 managers but also workers on the production floor understood the importance of product quality and that was how the “Genba-ryoku” was improved dramatically during this period as a unique culture among the Japanese enterprises. Together with QC, standardization of operation was also implemented at production sites. IE techniques, therefore, were widely spread during this time. After the oil crisis (1973), Japan adopted the floating exchange rate policy, and entered a stable growth period. This era is the second stage. Due to the floating exchange rate, the Japanese currency suddenly became stronger. Under the situation, further cost reduction and additional value creation became the urgent issues for manufacturers to maintain their competitiveness. That’s why VE was widely adopted in many Japanese firms (especially the automobile and other export-oriented manufacturing industries). VE was not limited to shapes but focused on functions of the products for lowering the cost by changing their designs. For example, according to a survey report on major Japanese companies in 1987, their VE use rate reached 87% for their main products. Judging from that, VE was widely implemented in Japan’s manufacturing industry by 19871. In other words, from the 1960’s to the 1980’s was the period for the Japanese manufacturing industry as a whole to have cultivated the basic skills of Js-GRI through “Kaizen Activities” based on the strength of skilled workers at production sites. On the contrary, after 1990 (following the collapse of the economic bubble in Japan), Japanese manufacturing industry entered the era of RI aiming at creating more innovative products based on the "front runner strategy". As RI is not the main subject of this paper, it is not touched upon in detail. However, from the viewpoint of MOT techniques, design approach is getting more important, development design VE (or QFD) and TRIZ are drawing more attention recently. That is to say, now is the time the future prediction thinking is required from the planning stage of next generation products. Table 1 shows the features of main MOT techniques mentioned above. QUESTIONNAIRE SURVEY ON THE UTILIZATION OF MAIN MOT TECHNIQUES IN EAST JAPAN RAILWAY COMPANY EAST JAPAN RAILWAY COMPANY (called “JR-EAST” hereafter,) which is used as a case example of the domestic manufacturing industry (as it does train car manufacturing and building construction) as well as the service industry. JR- Table 1: The Features of Main MOT Techniques (IE.QC,VE and TRIZ) IE Characteristics Appearance pursuing Main Theme Main Methods QC Cause pursuing VE Function pursuing TRIZ Contradiction resolution Operation standardization on production site, etc. Quality management of mass production, etc. Cost reduction based on product design changes, etc. Solution of antinomy in product (EX. Performance VS sound, etc.), etc. ●Method study 【ECRS】 ⇒ Make operation improvement by elimination, combination, rearrangement and simplification 【Principles of motion economy】 ⇒Improve operations by ①Two hands action, ② Reduced motion elements, ③Reduced movement distance, ④ Reduced fatigue ●Operation test (not included in the study) ●Seven QC tools 【Checksheet】 ⇒Define uniform business quality using inspection checksheet and data collection checksheet 【Cause and Effect Diagram】 ⇒“Cause and Effect Diagram(CED)” is the chart showing the relationship between the cause and effect regarding intended problem. ●Seven new QC tools (not included in the study) ●Functional analysis in VE 【Definition of function】 ⇒Express the functions of object products or parts through a combination of verb and noun in the form of article ●Creativity stage in VE 【Function oriented idea generation】 ⇒Conduct idea creation with the defined functions. (e.g. refrigerator function: maintain food freshness ; how to make idea creation in order to achieve the function? ●Classical TRIZ 【Contradiction Matrix&40 Principles】 As the abstract view of the issue, pay attention to technical contradictions (the opposite that improving index A will deteriorate index B), and then solve it through the inventive principles (total 40 principles). 【Physical Contradiction and Separation Principles】 As the abstract view of the issue, pay attention to physical contradiction (when index A is at objective# 1, positive direction is needed; when it’s at objective# 2, it shall be converted into the opposite state in the negative direction), and solve with separation rules (space, time. whole and part or situation ) Current status affirmation (at the premise of current shape of existing product) Current status denial (pay Mixed current status affirmation more attention to function and denial of existing product than its current state) Characteristics Current status affirmation (at the premise of current shape of existing product) 130 EAST recently began to consider the future penetration into the international market. To this end, “one day training program” was conducted by the author of this paper at JREAST for introduction and simple exercises of several easy-to-use methods of MOT techniques (IE, QC, VE and TRIZ) in 2012. The objective of this training was to enhance the overall competitive power of the company by improving its “on-site employees’ problemsolving ability (Genba-ryoku)”. After conducting this training program several times, the questionnaire survey regarding easy-to-use methods of MOT techniques was conducted. The result is shown below. The quantity of responses was 152 (seminar participants). Fig.1 Q1: Methods You would like to Use in Future Kaizen Activities (multiple answers allowed) Fig.1 shows the result of “Q1: Methods you would like to use in your future Kaizen activities (multiple answers allowed).” Judging from that, the selection rates of the methods in the IE field were high as a whole. Above all, however, the highest choice was [Definition of functions and Function-oriented idea generation (95 persons: selection rate was 63%)]. It showed that the methods in VE were attracting a lot of attention among the employees. With regard to “Q2: Based on effectiveness and usefulness for the workplace improvement activities, what would be the priority order of use among the seven methods?” The collected result of first priority method is shown in Fig. 2. Fig.2 Q2: The first priority method to be used 70 73 The number of respondents was approximately distributed evenly between those engaged in the service field (70 votes) and the technical field (73 votes) in the company. As was found in Fig. 2, regardless of their field of work, the VE method [Definition of functions and function-oriented idea generation] gained the second highest votes, 41votes in total, only next to ECRS (47 votes in total). This showed that the innovative improvement activities by making a breakthrough based on functional approach were highly supported by them. Over the last 30 some years, JR-EAST has been sustaining and improving their technical skills through “Kaizen Activities” by making full use of QC methods (mainly the QC seven tools). Due to this background, the priority for QC was low as methods to be used for their future improvement activities (see Fig.1and 2). Regarding the TRIZ field, the employees were interested in it to some extent (see Fig.1), although it was not popular enough to be used in their improvement activities right then, maybe due to the fact that TRIZ is difficult to learn compared to other management techniques. What was found in this survey was the fact that the use of MOT techniques in JREAST was beyond the QC-based “Kaizen Activities” and extended to IE, VE and TRIZ, and functional analysis in VE was highly supported by them. DIFFERENCE IN PERCEPTION ON DAILY USE EQUIPMENT BETWEEN PEOPLE OF JAPAN AND DEVELOPING COUNTRIES In this chapter, three essentially necessary items in our daily life such as toilets and their accessories are used as case examples and analyzed from the function-oriented viewpoint, 131 to illustrate difference in perception of function achievement between people of Japan and of the developing countries. All of these case studies were based on what the author of this paper experienced, and the pictures were taken by him. Fig. 3 shows Case Example 1, A toilet in a fancy restaurant building in Singapore, which is a developed country. The picture in Fig.3 was taken in 2014. Fig.3. Case Example 1 in Singapore Although it is not same toilet described right side, in order to image intended unit of it, the picture is shown. Fig.5.Case Example 3 in Japan RF FC Evaluation Comments Get a wash Use Function Excellence We have a wash comfortably because of shower . Clean Use up Function after Excellence It’s very easy to clean up because of good usability. Comf Esteem ort Function user while doing Good We feel comfortable because of cleanliness, even tight space. Controller for shower By matching the Japanese sensitivity, the majority of Japanese people are believed to feel comfortable with this toilet even in such a tight space. However, some non-Japanese passengers may think a shower toilet in an air plane is an excessive service. The print of seal material Required Function (RF) Function’s Category(FC) Evaluation based on Japanese sensitivity Comments from the average Japanese user Have a piss Use Function Average We basically have a piss. Comfort user while doing Esteem Function Not so good We don’t feel comfortable because of dirty lavatory pan. From the VE point of view, use function was achieved, but esteem function was not good enough as the sealing was not neatly finished. Case Example 2 is shown in Fig.4. Fig.4. Case Example 2 in Taiwan Toilet-paper holder RF FC Get a wash Use Average Function Evaluation Comments We usually have a wash. Clean up Use Not so good after Function It’s very hard to clean up because of bad usability of paper holder. Comfort user while doing We feel comfortable while doing. However….. Esteem Good Function This case shows a toilet in the bathroom in a standard class hotel room (a three-star hotel) in Taiwan. Although it looked like a typical clean toilet, it was not easy to use because of the inconvenient position of the paper holder. This was a case of non-user-oriented design”. Frankly speaking, a similar case like this can be rarely found nowadays even in cheap hotels in Japan. Fig.5 shows Case Example 3, a shower toilet in one of the Japanese air carriers. This shower toilet is available not only in the business class but also in the economy class of international flights. The picture was taken during a flight from Hong Kong to Haneda, Japan in 2014 (see Fig.5). THE CASE EXAMPLES OF JAPNESESTYELE GRI AND THAT OF DEVELOPING COUNTRIES’ Japanese railway companies including JREAST mentioned earlier have worked hard for activating their organizations and achieved “the world's best punctuality of operation.” In Japan, one-minute or more behind the schedule is defined as a train delay, while in other developed countries, it is five minutes or more in Belgium, 15 minutes or more in France and Germany2. This example clearly shows that the quality standard for train operation service has reached to an extremely high level in Japan. To achieve that, not only cutting-edge technologies but also MOT techniques must have made a substantial contribution to generate a high level of improvement (“kaizen”) capability. Case Example 4 shown in Fig.6 is a restroom in “NEW TOHOKU SHINKANSEN (a new bullet train for northern regions)” of JR-EAST. It makes users feel comfortable like in the air plane shower toilet mentioned earlier. Both of the equipment in these case examples were developed based on “Human (user)–centered design”. In fact, the proto-type of this restroom was developed in a project which focused on Product Planning VE with TRIZ for a decade or so3. The picture (see Fig.6) was taken in 2015. 132 Fig.6.Case Example 4, Restroom in “NEW TOHOKU SHINKANSEN” Explanation drawing design”. Fig.8 Case Example 6, Non-electric refrigerator in India clay Usability: Excellent Cleanliness: Excellent Habitability: Excellent Barrier-free :Excellent Hand rail(1) for disability person and elderly Lavatory with a shower Roll paper feeder Hand rail(2) for disability person and elderly A garbage bucket Toilet seat bumper with heating system Clean floor Case Example 5 (see Fig.7) is a direction board on a Shinkansen platform, showing seat numbers of the Shinkansen car for passengers to be able to find their seats easily. A meticulous service like this is an example of manifestation of the “Japanese Kaizen spirit”. However, some may say that it is an excessive service like in the example of an air plane shower toilet. Fig.7.Case Example 5-The direction board on a “SHINKANSEN” platform Forward deck 1E 2E 3E 4E・・・・・・・・18E 19E 20E 1D 2E 3E 4E・・・・・・・・18D 19D 20D 1C 2C 3C 4C・・・・・・・・18C 19C 20C 1B 2B 3B 4B ・・・・・・・・18B 19B 20B 1A 2A 3A 4A・・・・・・・・18A 19A 20A -Platform sideYou are here For Shin-Osaka Direction of movement In the meantime, Case Example 6 shown in Fig.8 is a “Non-electric clay refrigerator” invented by one of the “GR-Innovators” in India. Mr. Prajapati repeated a number of experiments with the soil samples collected from all over India, developed a type of moisture retention soil which was hard to break, and completed the clay refrigerator4. This refrigerator does not require electricity and cools down by circulating water inside. This is an example of Indian style GRI (Ins-GRI), that is, one of Dc-GRI. If GRI like this case is combined with Js-GRI which is capable of realizing high quality production with reasonable cost, the resulted Dc-GRI will enable mass production with ensured quality. The Case Examples 3 to 5 demonstrates the fact that the function-oriented thinking is an effective way to practice and improve the “human-centered For example, defining required functions of non-electric clay refrigerators from the Japanese viewpoint will help improve their values to be suited for customers in the developed countries, which will be a “new reverse innovation”. CONCLUSION In order to promote new reverse innovation, several obstacles need to be overcome. The assumed obstacles are described below. ● Compared with developed countries like Japan, skilled workers are not sufficiently available at production sites in developing countries. ● Local companies in developing countries generally don’t have employee education system like Japanese companies. ● The gap between Japan and developing countries in consumer awareness of product quality needs to be addressed. These challenges need to be tackled by taking necessary measures. ACKNOWLEDGMENT This work was supported by JSPS KAKENHI Grant Number 26350439 REFERENCES 1. Masayasu Tanaka (1987) Theory &Practice of Target Costing, Choukeizai-sya [in Japanese] 2.ROM INTERNATIONAL(2013), Nihon no sokojikara,Kade-syobou [ in Japanese] 3.Keiji Inoue (2013), TRIZ application case example 3 ,Standardization and Quality Control,vol.66 No.2,pp.37-44. 4. Design For Freedom http://d4f.asia/#wrapper 133 EXPLORING POSSIBILITIES AND CREATING SUSTAINING SOLUTIONS, BUT WHICH APPROACH TO VM SHOULD I USE? Martyn R. PHILLIPS Management Consultants, The Team Focus Consulting Group, Canada ABSTRACT The term value management (VM) conjures up various images in different jurisdictions. In general, VM provides a powerful process for identifying and testing opportunities to create sustaining solutions or improve overall program and project performance. This includes consensus building for concept identification and selection, functionality enhancement, schedule optimisation and cost (capital and life cycle) improvement. However there are quite widely varying interpretations of VM, - what it accomplishes and how. Acceptance and use of VM varies globally, for a variety of reasons, but perhaps especially due to inconsistent messaging from the VM community itself. All this tends to lead to confusion, especially amongst newcomers to VM, regarding expectations, timeframe, resource requirements, process and outcomes. Without a universally agreed, overall approach to VM it is possible that some value improvement opportunities remain hidden and hence unrealised. regarding expectations, timeframe, resource requirements, process and outcomes. Without a universally agreed, overall approach to VM it is possible that some value improvement opportunities remain hidden and hence unrealised. When a particular "brand" of VM has been introduced to a jurisdiction, the limitations of that brand are typically also assumed and the broader advantages of other VM approaches may well be forsaken. Perhaps it is not surprising that some influential, busy professionals and potential clients cannot be bothered to sift through the various explanations and outcomes of VM, and instead, opt for other means to accomplish their portfolio, program and project goals. A number of VM related standards now exist. Some are relatively simple and others detailed. A "one size fits all" approach for all situations and cultures would be fraught with pitfalls and likely lead to lost value. This paper stems from commonly practised value improvement methods and sets out a framework to encapsulate the various terminology for a potentially universal "road map" to conducting value management services - from initial program/project conceptualisation through to the tightening of a detailed design and optimisation of a service that is in use. BACKGROUND Half a century ago, I started work in the construction industry. At that time I had only just heard of the then 20-year value engineering process and was discouraged strongly by my older colleagues from pursuing it. All those years ago, we just "got the job done", whatever it was and whatever was needed - as did a myriad of professionals who for centuries went before us. I had a slide rule and logarithmic tables as calculating instruments to work with. We didn't get expensive desktop calculators until later and handheld electronic calculators until much later. I became involved with computers when punch cards had to be developed at least 24 hours ahead of obtaining the computerized output. Nowadays we have the BIM (building information modeling) system that replaces many of the older activities that used to take so long to accomplish. One thing that has not changed is that there are still misconceptions and confusion about value management and value engineering. So how much have we advanced in 70 years on our "value" journey, and how can we improve the image and acceptance of value engineering / management? What lessons have we learned? 134 For sure we have a greater demand for stakeholder consultation, but we do have streamlined communications. However despite electronic communications, it feels to me that we have ever-increasing bureaucracy and delays to routinely deal with. VM is very effective at cutting through such delays. NEED Today we can certainly expect continual change and that if we each try to remain in our comfortable micro-environments we will be left behind. As compared with days gone by, we are privileged today to have a vast arsenal of tools and techniques at our disposal for the management of virtually anything -typically faster, better and cheaper. Yet, the adage (comedian Meskimen's law) "there is never enough time to do it right the first time, but there is always time to do it over" still seems to be particularly apt in the management of programs and projects. Several management tools purporting to compete with VM are on offer. Despite the advance in calculating and measurement instruments, in some ways there is not all that much that is truly new on the management front. There have long been project procedures and a variety of decisionenabling tools available (such as life cycle costing, critical path schedules, earned value management, risk analysis and value engineering). Whether or not they were used both extensively and effectively is another matter. This following seeks to provide a simple overview in order to clarify the multi-faceted situation regarding various VM approaches. FROM VALUE ENGINEERING TO VALUE MANAGEMENT There are many definitions related to value and value management. A quick search on the internet will reveal a whole host of descriptions related to the management of value. The Value Methodology, which is at the root of value analysis, value engineering and value management, was rolled out in the mid1940s. In the beginning the process was called value analysis. According to the Canadian Society of Value Analysis, "value analysis is a systematic and function-based approach to improving the value of products, projects, or processes. Value analysis uses a combination of creative and analytical techniques to identify alternative ways to achieve objectives. Value analysis is undertaken in a workshop setting, by an interdisciplinary team representing various perspectives of the project, process, product, organization or other subject being studied. The value analysis workshop follows a structured multi-phase process, the Value Analysis Job Plan, and is led by a qualified value analysis facilitator". By the mid-1950s the term value engineering was coined. I possess an original hard copy of the proceedings1 of a 1966 conference on value engineering One paper on value engineering and management (as applied in the manufacturing industry) describes a value engineering program duration of 18 months. There is also a relevant, very telling sentence: "Is it any wonder, when the Value Engineer arrives on the scene, the Project Manager's first reaction may be here comes somebody else to generate changes and compound the problems I already have". So why, 50 years later, do we hear and feel similar messaging today? By 1996 in the United States, Public Law 104106 SEC. 4306. Value Engineering For Federal Agencies required (Sec 36) Value Engineering: "(a) In General.--Each executive agency shall establish and maintain cost-effective value engineering procedures and processes. (b) Definition.--As used in this section, the term `value engineering' means an analysis of the functions of a program, project, system, product, item of equipment, building, facility, service, or supply of an executive agency, performed by qualified agency or contractor personnel, directed at improving performance, reliability, quality, safety, and life cycle costs.'' Today, SAVE International uses the term Value Methodology which is defined as "a systematic and structured approach for improving projects, products, and processes". The Miles Value Foundation defines the Value Methodology as "a systematic and structured approach that seeks to improve the value of a project, product or service by providing the necessary functions to meet the required performance at the lowest cost". An early 135 version of the Project Management Body of Knowledge used the definition "value engineering is a creative approach used to optimize life-cycle costs, save time, increase profits, improve quality, expand market share, solve problems and/or use resources more effectively". Along the way, the term value management came into being. In 1966, the then UK Ministry of Technology founded the Value Engineering Association. From this the Institute of Value Management was formed in 1971 and now states: "Value management is concerned with improving and sustaining a desirable balance between the wants and needs of stakeholders and the resources needed to satisfy them. Stakeholder value judgements vary, and VM reconciles differing priorities to deliver best value for all stakeholders." The Institute of Value Management Australia states: "Value management is an essential, critical planning and review process which is distinctively different because of its structure of using a prescribed 'Work Plan' and its analytical focus to achieve best value or, where appropriate, best value for money". The Hong Kong Institute of Value Management early literature stated that "value management is a structured, systematic and analytical process which seeks to achieve value for money by providing all the necessary functions at the lowest cost consistent with required levels of quality and performance." The website currently states that value management is "a philosophy, together with its associated tools and techniques, emphasizes the need to consider function and cost in a structured and systematic way, as part of any strategic decision process". The European Standard on Value Management EN 12973-2000: "VM is a style of management, particularly dedicated to motivating people, developing skills and promoting synergies and innovation, with the aim of maximising the overall performance of an organisation. It is a structured, team based, analytical and creative process for developing innovative solutions to complex problems. It seeks to realize sustainable, value for money solutions that reflect the needs of the organisation and its key stakeholders". WHAT IS THE DIFFERENCE BETWEEN VE AND VM? To some jurisdictions, the terms value analysis, value engineering and value management are synonymous. Most practitioners seem to agree that value analysis and value engineering are the same process. My own preference is to separate value analysis as the rearward looking process that evaluates the current situation or “base case”. Value engineering would then be the creative and testing process for improving that previously analysed base case. Similarly, there is no universally agreed distinction between value engineering and value management. Over the years, the image of value engineering has suffered somewhat as a result of poor practice and cost-cutting that has not maintained required functionality. Perhaps to a lesser extent, this image has been applied to value management. A distinction between the two terms tends to be that value management applies to the "softer" upfront, relatively qualitative, applications to strategic planning, needs assessment and concept definition. By the same token, value engineering may be seen as application of the Value Methodology process to the “harder”, quantitative applications of concept development and design. This then would beg the question, which term would apply to the improvement of a project when it has passed from construction and commissioning to routine operation over the longer term. Perhaps that application could be called value control. Note that the definitions listed above show a shifting trend from "hard" to "soft" application. However all of the associated applications revolve around a common workshop process. In practice the workshop is the main focus rather than a framework for the continuing application of value checks and balances (except in the example provided in Figure 1). Despite the fact that risk and value are inextricably linked, it is not obvious if the above authorities deal with risk and value as associated entities, and, as a result these factors tend to be treated in a relatively disjointed manner. A further purported distinction between value management and value engineering is that the 136 former tends to have a larger number of workshop participants (e.g. 30 to 40 persons), whereas value engineering may only have say, 6 to 8 participants. I have never conducted a value engineering workshop with such few numbers, but I have conducted many successful value engineering workshops with very large numbers of participants. So categorisation based on limited hearsay can be quite erroneous. As well as such distinctions as discussed above, there are also the considerations of how the standard value workshop process is applied differently in the manufacturing, construction, services and offshore, etc., sectors. An argument advanced against workshops of more than 1 or 2 days is that a) people are too busy and b) the cost of facility rental is prohibitive. I would counter with a) if the job is worth doing it should be done well, and, b) particularly now that we have such extensive communication tools available, why do we need so many people to be face-to-face for a long period of time? Let's use today's technology to maximum advantage! Of course there are several other definitions, as well as varying process steps, offered by other standards and organisations, as well as ostensibly parallel processes.. None of the foregoing should be confused with earned value management, which is a process for monitoring and controlling project costs, schedule and scope. A further set of "value" tools is the "Value Improving Practices" (VIPs) used mainly in the oil, gas and petrochemicals processing field. Value engineering is one of the many VIPS, which are typically applied through short duration workshops. Value Improving Practices are out-of-the-ordinary practices used to improve project performance, and they are primarily used during the Front-End Loading (FEL) of a project. BIGGER PICTURE Several attempts have been made to standardize a VM approach, but due to a widely varying focus of applications and to cultural differences to problem-solving and consensus building, it is likely that, for the sake of clarity and completeness, standardization efforts will have to settle for a compendium of agreed VM approaches. After all, who is to say definitively and authoritatively which is the best approach for all applications? The overall aim of VM/VE is, usually, to develop stakeholder consensus on how to optimize life cycle value. Differently focusing VM may be applied very effectively during the following stages: • Strategic Direction (to optimize a portfolio; develop a business case and master plan) • Concept Definition (for the most appropriate concepts to deliver a program of improved services) • Projects Delivery (design & procurement optimization, schedule acceleration and project rescue) • Systems Optimization (for in-service process, productivity gains and benefitcost enhancement). There exists a conundrum of perspectives of what truly constitutes VM/VE. At a senior management level VM may refer to value management as being the holistic management of an enterprise's, or a region's, management. In the financial services sector, value management tends to be related to investment strategies. As a practitioner of value and risk management in a number of countries worldwide, I encounter differing client expectations of what and particularly how the VM/VE process will deliver. This dichotomy is typified by the following factors and disparity of approaches: • Overall process to manage value across the organization, a program or a project Vs an "intervention" or one (/two)-time review to improve an ongoing development effort • Depth Vs breadth of application • Quick and easy process Vs in depth analysis, development and followthrough • VM as a tool Vs VM as a guidance / monitoring and controlling process • Short workshops with many participants Vs long workshops with restricted number of participants • Soft, feel-good workshop facilitation Vs results demanding, hard workshop facilitation. 137 Moving on to a broader plain, I have said, for many years, that we send out mixed messages when we talk about value management. Would you conduct just a slice of project management and then declare that project management had taken place satisfactorily? Why then do we condone the use of a slice of process for managing value to be described as value management - when it clearly does not (and cannot) in itself manage value? Logically, the management of value requires a broad and long term view of portfolios, programs and projects. Management of interfaces, wider communications and succinct reporting, as well as dealing with “fuzziness” and uncertainty are areas for particular attention. The fundamental issues of project need, scope, exclusions, values, priorities, constraints, organization, roles, responsibilities and control procedures should be addressed early, with a robust framework in place to ensure strategic performance alignment and delivery to plan. A value management workshop is a very useful exercise within the context of an overall, value assuring framework. We have an incredibly powerful tool, but collectively we dumb it down to sell it and then use it in a truncated manner and wonder why other people are not as excited about it as we are. Further, we hear criticism of those who do have the fortitude to do it properly, as being oldStage of Application fashioned, or lucky to have a client who allowed a full process to take place. It is not luck, but foresight! CHANGING FOCUS OVER TIME Exploring possibilities and creating sustaining solutions, but which version of VM should I use? Depending on the outcome(s) expected, a reasonable answer is that following most of the recognised VM standards will suffice - as long sufficient time and diligence is invested in all aspects of the process. A better answer would be to expand VM activities to provide a comprehensive framework to guide the complete management of value of a program or project, rather than being used for one (or two) time application. Descriptions of the stages and example outcomes are provided in Table 1. The appropriate use of various value improving tools and techniques is used at milestone applications. The Value Methodology is a primary choice for many such applications. The emphasis may vary within the various Value Methodology phases to suit particular situations and required outcomes. The starting point is a new or updated value management or assurance plan, and, a mini-workshop assessment of the current situation and expectations. Example of Required Outcomes Focus: EXECUTIVE REPORTING All Demonstration to higher management and stakeholders that anticipated business returns are being obtained. Resolution of emerging program or project significant value and risk problems. Focus: SEARCHING FOR BEST VALUE 1. Business Program Alignment / Re-alignment Needs Analysis & Scoping Agreed stakeholder needs and definition of program / project scope. Consensus development on stakeholders' key issues Strategic Planning Agreed, tested and unambiguous business strategies, criteria & clear implications prior to start of asset planning & design. Business risks identification and mitigation strategy 2. Program and Project Development 138 Stage of Application Example of Required Outcomes “Menu” of project options, relative cost-benefits, performance standards, affordability, potential risk areas, liabilities, uncertainties & sensitivities (to data accuracy, projections, etc.) Consensus and confirmation of best value outline design, phasing and strategies for implementation, contracting & risk management. Implementation/constructability improvement together with elimination of unnecessary cost, while maintaining or enhancing functionality Verification of project requirements and capability to perform as specified. Force fitting of an “over-budget” project; creation and analysis of alternative proposals Concept/ Feasibility Functional Design Detailed Design Contract / Sub contract Awards 3. Work Value Optimisation In Service Post occupancy review and project enhancements Program Optimization & Turnaround Analysis and improvement of operational performance. Completion of feedback loop to strategic planning process as part of an overall “expert” system and continuous improvement Table 1. Continuing Application of VM Techniques The conference presentation depicts an example of the key activities required for a single value assessment / improvement review. The duration of activities may be spread over weeks or even months, or compressed such that the elapsed time from initiation to presentation of a draft output report is just 6 - 8 (very rushed) days. For complex and large programs or projects, this timeframe might only address a key part, such that additional applications would be required. The degree of emphasis on individual phases may vary depending on the type and stage of development of the program or project. For success, all steps need to be addressed. The building of stakeholder consensus requires "soak time" and therefore even a 5-day workshop requires follow-up communication, fine-tuning, confirmation and formal acceptance. When VM is applied as a continuing process, the diagnostic activities will only need to be updated to the latest situation. In that case, a VM review can be conducted in a shorter timeframe. • • • • • • • The following are issues that I have noticed, especially when competing commercially for facilitation of value improving commissions: Misunderstanding by various persons that VM is able to actually manage the value of a program or project • Over-emphasis on workshop activities and lack of appropriate allowance for preparatory and follow-through activities Varying expectations of 6-8 workshop full-time team members Vs 30+ workshop (sometimes part-time) attendees Disproportionate emphasis and time allocation for "favorite" phases of the VM job plan, leading to a corresponding lack of attention to some other phases Duplication of resources (and lack of cross-fertilization of outcomes) required for VM activities and other specialized management techniques conducted around a similar time period Lack of readily available information, especially that describing performance expectations and the business case Expectation of a "blow-by-blow" report of VM activities Vs a simple, outcomesfocused, management style report (which I find to be entirely adequate). Lack of facilitator involvement after the workshop report has been submitted Lack of costed function-logic diagrams and the common mis-step of requiring development of cost models and then developing function-logic diagrams which also need to be costed in what is 139 usually an "impossible" timeframe. You may say "so what!" to these issues. But the significance is that there are extremely high expectations built up prior to a workshop and servicing these expectations requires skill, time and effort for the facilitation team. HOLISTIC APPROACH REQUIRED Executives need reliable processes to ensure that their organization’s current efforts and proposed changes are truly cost-effective and meet corporate objectives. They, and other senior stakeholders, expect regular and succinct reports to indicate that portfolios, programs and projects will realistically: • yield best value and return-on-investment • be delivered within the specified timeframe and allocated budget • satisfy health, safety, social and environmental requirements. The VM technique and related tools fit right across the program and project development process. Rather than continuing in isolation from other methods, I contend that we should collaborate and advance a holistic, integrated approach that better supports the need of senior management and other stakeholders. Some large organisations now use a process of value assurance. For some, it is just traditional value engineering or value management under a new name. Others however plan, monitor and control value of their portfolios, programs and projects in a holistic fashion. I have presented a number of papers2-7 in the past on the subject. Within many of the value management and value engineering ranks, there seems to be a reluctance to move on from promoting the more typical isolated value workshops approach. Essentially, the process of managing for best value is more effective when fully integrated with project management life cycle such that: Stakeholders in general seek assurance such that i. program/project functions and value portfolios, programs and projects remain viable metrics are established and referenced in terms of: from the outset of the program/project • business aims (benefits, scope and costs) for the duration of the program/project • alignment of business strategy, programs & life projects to maximize corporate performance ii. a combined value and risk approach for • user requirements (availability, proactive application between specified serviceability, operability, reliability and milestones is incorporated within the compliance capabilities) original program/project plan • technical merit (feasibility and fitness-foriii. a higher level, performance assurance purpose) approach is used to guide, monitor and • enabling of key approvals & adjust an organization's portfolios, stakeholder endorsements programs and projects from an • certification of best value; executive perspective. authorizations for expenditure made iv. integrated but separately accessible with full and deserved confidence levels of information regarding the • supply chain capabilities and management of value are applicable at compatibilities the working level and at senior • likelihood of meeting forecast targets executive level • in-service continuing effectiveness and v. inclusion of a change management and financial efficiency; preserved value. monitoring plan. Project management attempts to formalize, define and constrain that which can sometimes be quite vague or ambiguous. There is a need to reconcile the conflicting aims of: • users trying to retain flexibility of options, and, • implementers requiring certainty of scope, data, schedule, cost, etc. CONCLUSION Each value standard has its own particular viewpoint developed with due regard to local circumstances. As well, there is plethora of websites that offer their (often ill-informed) opinions on value management and value engineering. Despite application of project management techniques, project still go awry 140 and value is lost. For example a business case is an input to project initiation and it refers to needs and how the needs are addressed. However, an inadequate business case can lead to poor scope definition, which results in rework, cost increase, schedule delays and general stakeholder dissatisfaction are indicative of lost value. Answer: bring in the VM team? Essentially, the methods advanced revolve around a multi-stage, multi-stakeholder workshop process. Typically, traditional value management (or value engineering), is applied through the Value Methodology as an intervention for options identification or improvement of a project. Although it is a very potent process, the Value Methodology is most effective when applied as a continuing and integral part of project initiation & subsequent development. It is the author's opinion that the term value management, as commonly used, is a misnomer and therefore misleading. After all, how can one or two quick workshops manage a whole program or project development process? Not surprisingly, some would-be clients may perceive this and consequently shy away from using the process. Other would-be clients are perhaps intimidated by what might emerge from the process and also decline to use it. The key is for the "value profession" to stop competing with itself and to promote an overarching process within which a wide variety of value improving tools and techniques can complement each other. Further, it makes eminent sense integrate of value and risk management applications during the program and project development activities. The initial project management plan should include a value and risk management plan. Individual applications of a value improving process typically are not anchored within a governance framework. An over-arching value (assurance), oversight approach enables stakeholders to check the ongoing “health” of a project and its ability to adapt to internal and external factors, which may have adverse impact on a project's outcomes. A value file (containing essential business and functional performance parameters) is developed at the start of the project and is maintained throughout the project life. The elements of a holistic, value assurance approach should be embedded within the organization's procedures. Well-conducted VM can be a guiding light within effective program and project governance. For VM to be effective, it must communicate well at the boardroom level. Without an integrated, well executed, value improving process, it may be expected that some value will remain hidden and consequently lost to shareholders and other stakeholders. Can the now 70-year old value profession rise to the occasion, shake off its shackles and get away from its more-recent oneshot, quick-fix image? ACKNOWLEDGEMENTS 1. C.P. Smith, (1966) Value Engineering and Management: Partners for Profit, LTV Aerospace Corporation, Vought Aeronautics Division. Proceedings of the 1966 National Convention, Society of American Value Engineers, Miami Beach, Florida, US: 2. Phillips, Martyn R. (2003) Sharpening the Performance Edge: Project Delivery Enhancement through Value Assurance, Hong Kong Institute of Value Management International Conference. 3. Phillips, Martyn R. (2005) Value Managing the Whole Performance Improvement Cycle, Hong Kong Institute of Value Management International Conference 4. Phillips, Martyn R. (2008) From Value Management to Value Assurance, Hong Kong Institute of Value Management International Conference 5. Martyn R. Phillips and Shamsi B. Shishevan. (2010) "Closing the Performance Gap" series of books, especially "In Search of Value, Closing the Performance Gap with Value Assurance: Overview" and "An Introduction to Value Assurance" 6. Phillips, Martyn and Shishevan Shamsi (2013) Driving Best Value Portfolios, Program and Projects through the Application of Value Assurance. SAVE International Value Summit, Washington, DC, US. 7. Phillips, Martyn and Shishevan Shamsi (2014) Integrating Project and Value Management for Greater Performance Gains, SAVE International Value Summit, Chicago. 141 Organizer: Hong Kong Institute of Value Management +RQJ .RQJ ,QVWLWXWH RI 9DOXH 0DQDJHPHQW /LPLWHG +.,90 ZDV IRUPDOO\ HVWDEOLVKHG LQ +.,90 LV D QRQSURILW PDNLQJ RUJDQLVDWLRQ GHGLFDWHG WR WKH SURPRWLRQ RI WKH XVH RI 9DOXH 0DQDJHPHQWLQ+RQJ.RQJ9DOXH 0DQDJHPHQW 90 DV D SKLORVRSK\ WRJHWKHU ZLWK LWV DVVRFLDWHG WRROV DQG WHFKQLTXHV HPSKDVL]HV WKH QHHG WR FRQVLGHU IXQFWLRQ DQG FRVW LQ D VWUXFWXUHG DQGV\VWHPDWLFZD\DVSDUWRIDQ\ VWUDWHJLF GHFLVLRQ SURFHVV 2YHU WKH SDVW \HDUV WKH +.,90 KDV KRVWHG PRUH WKDQ WHQ LQWHUQDWLRQDO FRQIHUHQFHV FRQGXFWHG D QXPEHU RI YDOXH WUDLQLQJ ZRUNVKRSV LWV PHPEHUV KDYH FRQGXFWHG KXQGUHGV RI KLJKO\ VXFFHVVIXO 90 VWXGLHV IRU ERWK SXEOLF DQG SULYDWH FRQVWUXFWLRQ LQGXVWU\FOLHQWVDQGUHJXODUO\SXEOLVKHGWKH1HZVOHWWHU ! " # $ % & & ' ( ) * + , 7KH,QVWLWXWHZLOORUJDQL]HDFWLYLWLHVRIYDULRXVNLQGVWRSURYLGHLWVPHPEHUV ZLWKRSSRUWXQLWLHVIRUVKDULQJNQRZOHGJHDQGH[SHULHQFHRQUHJXODUEDVLVLQFOXGLQJ &3'SURJUDPVVHPLQDUV900RGXOH,DQG0RGXOH,,WUDLQLQJSURJUDPVHWF 0HPEHUV RI WKH ,QVWLWXWH ZLOO UHFHLYH 1HZVOHWWHUV ZKLFK DUH SXEOLVKHG E\ WKH ,QVWLWXWH RQUHJXODUEDVLV 7KH ,QVWLWXWH PDLQWDLQV OLVWV RI 9DOXH 0DQDJHPHQW )DFLOLWDWRUV IRU SXEOLF DQG SULYDWH FOLHQWV LQ +RQJ .RQJ DQG RYHUVHDV 9DOXH PDQDJHPHQW IDFLOLWDWRUV ZKR ZDQW WR EH OLVWHG 0867%(PHPEHUVRIWKH,QVWLWXWH - . / % 0 1 2 3 2 - 4 $ $ ( 7KH ,QVWLWXWH DOVR PDLQWDLQVD OLVW RI HOLJLEOH IXOOPHPEHUVZKRZDQWWRKDYHWKHRSSRUWXQLW\WRFRIDFLOLWDWHZRUNVKRSVWREHFRPH OLVWHG)DFLOLWDWRUVHYHQWXDOO\ ,I PHPEHUV ZDQW WR FRQGXFW ZRUNVKRS DQGRU VHPLQDU WKH ,QVWLWXWHFDQDQQRXQFHWKHUHOHYDQWLQIRUPDWLRQIRUIUHHRQLWVZHEVLWH 7KH,QVWLWXWHRIIHUVLWVPHPEHUVGLVFRXQWHGUHJLVWUDWLRQIHHVIRUHYHQWV RUJDQL]HGE\WKH,QVWLWXWHVXFKDVFRQIHUHQFHVVHPLQDUVWUDLQLQJVHWF Organizer: SAVE International® 4"7&*OUFSOBUJPOBM¥JTUIFQSFNJFSJOUFSOBUJPOBM TPDJFUZEFWPUFEUPBEWBODJOHBOEQSPNPUJOHUIF7BMVF .FUIPEPMPHZ"MTPLOPXOBTWBMVFFOHJOFFSJOHWBMVF BOBMZTJTBOEWBMVFNBOBHFNFOUUIFQSPDFTTDBO EFDSFBTFDPTUTJODSFBTFQSPmUTJNQSPWFRVBMJUZBOE QFSGPSNBODFBOEFOIBODFDVTUPNFSTBUJTGBDUJPOPO QSPKFDUTQSPDFTTFTBOEQSPEVDUT 7BMVFBOEJOOPWBUJPOBSFOFFEFEJOUPEBZTTDBSDF NPOFZXPSME5PmOEBOEUBLFBEWBOUBHFPGUIFNCPUI HPWFSONFOUTBOEQSJWBUFJOEVTUSZVTFBSFNBSLBCMF QSPDFTTLOPXOBTUIF7BMVF.FUIPEPMPHZ5IFQSP DFTTDBOPQUJNJ[FQSPKFDUTQSPDFTTFTBOEQSPEVDU 4"7&7BMVF4VNNJUBUUFOEFFTWJFXWBMVFFOHJOFFSJOHQSPKFDU EFWFMPQNFOUJOTJHOJmDBOUXBZT5ISPVHIWBMVFFOHJ QPTUFS OFFSJOHDPNQBOJFTBOEHPWFSONFOUBHFODJFTSFHV MBSMZEFDSFBTFDPTUTJODSFBTFQSPmUTJNQSPWFRVBMJUZBOEQFSGPSNBODFBOEFOIBODFDVTUPNFSTBUJTGBDUJPO .&.#&34)*1#&/&'*54 130.05*0/4"7&XPSLTIBSEUPJOGPSNBOEFEVDBUF CVTJOFTTBOEHPWFSONFOUBCPVUUIFUSFNFOEPVTCFO FmUTPGQSPQFSMZBQQMJFEWBMVFFOIBODJOHNFUIPET "%70$"$:4"7&XPSLTIBSEUPJOGPSNBOEFEVDBUF HPWFSONFOUBHFODJFTBOETUBOEBSETPSHBOJ[BUJPOT BCPVUUIFUSFNFOEPVTCFOFmUTPGSFHVMBUJPOTUIBU SFRVJSFWBMVFFOIBODJOHNFUIPETBTGBDJMJUBUFECZ DFSUJmFEWBMVFQSBDUJUJPOFST8IBUIBT4"7&EPOFGPS UIFQSPGFTTJPO *OnVFODFEUIFSFJTTVBODFPG0.#$JSDVMBS "SFRVJSJOHWBMVFFOHJOFFSJOHPOGFEFSBM QSPKFDUT 1SFTFOUBUJPOEFMJWFSFEBU4"7&7BMVF4VNNJU$IJDBHP*MMJOPJT $IBJSFEUIF"45.TVCDPNNJUUFFGPSUIFVQEBUFPGUIF&7BMVF&OHJOFFSJOH4UBOEBSE &NCBSLFEVQPOBNBTTQSPNPUJPOPG7&UPPWFSHPWFSONFOUFNQMPZFFT 1SPNPUFE7&UPMFHJTMBUJWFPGmDJBMTBOEUSBOTQPSUBUJPOEFQBSUNFOUEFDJTJPONBLFST $&35*'*$"5*0/4"7&TDFSUJmDBUJPOQSPHSBNJTSFD PHOJ[FEHMPCBMMZBTUIFTUBOEBSEGPSDPNQFUFODFJO UIFQSBDUJDFPGWBMVFFOHJOFFSJOH &%6$"5*0/4"7&PGGFSTBWBSJFUZPGPOMJOFBOEJO QFSTPOFEVDBUJPOBMPQQPSUVOJUJFTGPSQSBDUJUJPOFSTUP JNQSPWFUIFJSTLJMMTBOELOPXMFEHF1SJNBSZBNPOH UIFNJTUIFBOOVBM4"7&7BMVF4VNNJU Acknowledgements The Conference Committee would like to extend their sincere thanks to the following Sponsors, Supporting Organizations, Government Bureau and Departments, individuals for their unfailing support and generous contribution towards the success of the Joint HKIVM-SAVE International Conference 2015: Sponsors Gold Sponsor: Construction Industry Council Silver Sponsor: Hong Kong Housing Society Bronze Sponsor: KC Tang Consultants Limited Beria Consultants Limited JCP Consultancy International Limited 0WF"SVQ1BSUOFST)POH,POH-JNJUFE 6XSSRUWLQJ2UJDQL]DWLRQV Architectural Services Department, The Government of the HKSAR Civil Engineering and Development Department, The Government of the HKSAR Drainage Services Department, The Government of the HKSAR Highways Department, The Government of the HKSAR Water Supplies Department, The Government of the HKSAR Hong Kong Housing Authority Department of Building and Real Estate, The Hong Kong Polytechnic University Centre for Innovation in Construction and Infrastructure Development, The University of Hong Kong Department of Real Estate and Construction, The University of Hong Kong The Chartered Institute of Building (Hong Kong) The Hong Kong Institute of Architects Hong Kong Institute of Construction Managers The Hong Kong Institute of Engineers Hong Kong Institute of Project Management The Hong Kong Institute of Surveyors Hong Kong Mediation Centre Royal Institution of Chartered Surveyors *RYHUQPHQW%XUHDX'HSDUWPHQWV Development Bureau, The Government of the HKSAR Electrical and Mechanical Services Department, The Government of the HKSAR Environment Protection Department, The Government of the HKSAR Housing Department, The Government of the HKSAR &RQIHUHQFH&RPPLWWHHDQG+.,90&RXQFLO0HPEHUV Ir. David YAU (Conference Director) Dr. Mei-yung LEUNG Mr. Paco TSANG Ir. Elise CHAN Ir. Lillian L.Y. CHAN Mr. Chee-yoong CHAI Mr. K.T. CHAU Mr. Qi LIANG Cr. Sr. Chi-wang TANG Sr. Ki-cheung TANG Mr. Ricky WONG Sr. Thomas Yu-on WONG We are indebted to all the speakers and paper presenters for giving us their time and sharing their wisdom with the conference participants.
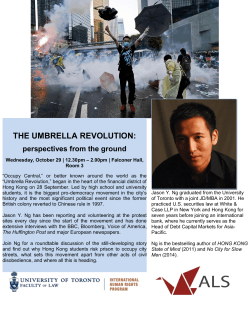
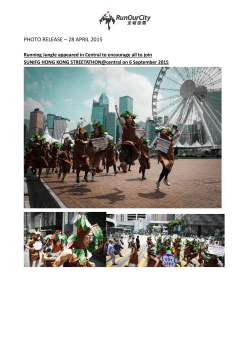
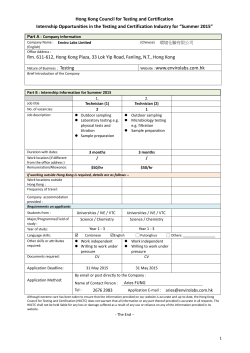
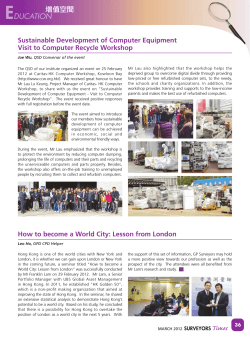
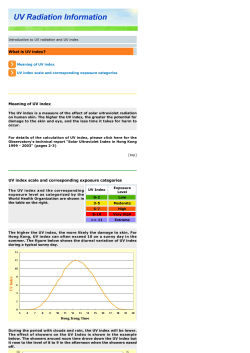
© Copyright 2026