
Integrated Modeling of Manufacturing Safety Interventions Planning
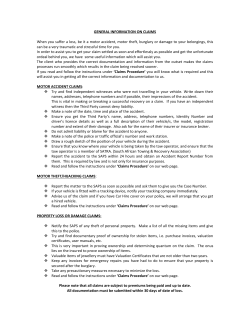
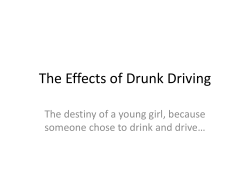
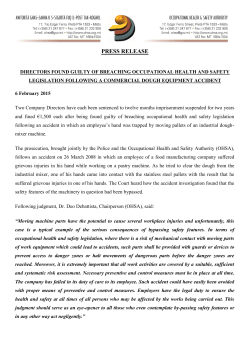
International Conference on Aeronautical And Manufacturing Engineering (ICAAME’2015) March 14-15, 2015 Dubai (UAE) Integrated Modeling of Manufacturing Safety Interventions Planning and Management K.A. Adebiyi and A.O. Ajayeoba Abstract--Research on safety planning and management has revealed that focusing one safety intervention programme; and use of lagging measures for safety evaluation is not sufficient. This study proposed an integrated model for safety intervention progamme management using system dynamics and combinatorial approaches. Combinatorial analysis was used to determine possible safety strategies while system dynamic software STELLA (version 10.0.3) was used to determine the interactive effects of these strategies on the safety interventions parameters. Factory accidents and preventions were the measures. A typical manufacturing company in Nigeria was thus used for demonstration. fatalities still plague the industry and absolute safety of humans and property remains an illusion. Recently there had been an emergence of a variety of manufacturing safety research focusing on topics such as safety competency, accident statistics, design for safety, and safety culture. One of the ways of reducing accident or improving safety is through the use leading evaluation methods of safety interventions and as a result, many modern manufacturing industries have utilized knowledge in engineering to develop intelligent decision supporting systems for improving and strengthening their safety systems. Among these are artificial neural network [ANN], genetic algorithms [GA] and fuzzy logic [FL] and system dynamics [SD] [10], [17] – [19]. However, the cost of safety interventions is perceived to be expensive, and that is one of the reasons the management tends to run away from it. Perhaps the development of an agreeable leading measure is the main challenge. Based on previous research efforts [19 and 20], this study aims to develop a safety management and planning tool that [1] identifies potential safety interventions strategies, [2] dynamically linked the strategies and hazardous conditions that implement prevention system effectively, and [3] improves workers and management perception of visualizing safety as investment. It therefore focused on the use of possible combinations of interventions that will minimize cost but improve safety using systems dynamics which has repeatedly been demonstrated to be an effective analytical tool in a wide range of situations both in academic research and in industrial practice [11]. Index Terms—Safety strategy, combinatorial analysis, dynamic model, safety system I. INTRODUCTION Occupational injuries as well as workplace accidents continue to be a challenge worldwide [1] and their impacts are so great that consequences in high-risk industries may be catastrophic [2 and 3]. Their effects are seen in loss of equipment, lives, productive hours, raw materials, capital, as well as high compensational cost and emotional losses [4] – [9]. Safety and health protection have become a major positive factor in favour of economic growth and productivity and one area in which the concern for safety is growing rapidly is the manufacturing industries [10] and [11]. Many recent studies advocated that safety and health functions should be integrated into the activities of the industries to increase the chances of reaching safety goals in manufacturing industries and that health and safety protection of the employees during work should be considered as one of management routine activities [3]. There are many approaches to improve workforce safety in manufacturing, amongst which are ergonomics, safety incentive program [SIP], behavior change and culture change approach, building information modeling [BIM], adaptive management, Foucauldian approach and safety climate [12] – [16]. Despite the persistent endeavours to promote manufacturing safety, II. METHODOLOGY Twenty manufacturing companies with organized safety programmes were critically examined. A combination of data vetting, personnel interviews, physical participation and dynamic group modeling, simulation and retrospective statistical data gathering and analysis was employed to identify accident causing factors and safety interventions which are classified by [17] into Personal Protective Equipments (PPE), Training, Incentives/Motivation, Guarding, Accident Investigation and Awareness Creation. According to [20] the number of strategies Nsjk in alternative jk in safety period s is given as: CT K.A. Adebiyi and A.O. Ajayeoba, are Department of Mechanical Engineering, Ladoke Akintola University of Technology, Ogbomoso, Nigeria http://dx.doi.org/10.15242/IAE.IAE0315210 jk 4 N sj' jk 1 jk 4 jk 1 l C p m l C h Applying system dynamics rules (17) the causal loop and; stocks and flow diagrams for manufacturing safety 46 International Conference on Aeronautical And Manufacturing Engineering (ICAAME’2015) March 14-15, 2015 Dubai (UAE) system was developed using Stella System Software as shown in Fig. 1 and 2 The required models for factory accidents prevented accident (Yt), are determined from the the causal loop and the stock and flows delineation. X t Yt - X p Dynamic (Xt) and results of diagrams qf y t qf y t ht 1 1 ht 1 1 X o Yt X p Pk 1 qf Yt t Y o qf Yt t programme (1979-1990) and safety programme (19992012) data were collected from production, clinic, safety and personnel departments of the establishment through vetting of records, structured questionnaire, and personal interaction with heads of units and departments. The data on the occurrence of accidents before safety programme were collected from the clinic and personnel units.. The collected data were used to estimate the following safety system model parameters: budgeting factor for safety programme, potential accident, total man-hours of workforce, accident proneness factor, prevention time lag, accident causing factor, and proportion of prevented accidents class n as presented in Tables 2. Table 1 summarizes the data of the case study organization. Two sets of factory data: pre–safety Fig. 1: Causal Loop Diagram of Manufacturing Safety Programme http://dx.doi.org/10.15242/IAE.IAE0315210 47 International Conference on Aeronautical And Manufacturing Engineering (ICAAME’2015) March 14-15, 2015 Dubai (UAE) Fig. 2: Simplified Stock Flow Diagram of Manufacturing Safety Programme TABLE I SUMMARY OF THE CASE STUDY DATA Size of workforce [Persons] 145 Number of shifts 2 Working hours per day 16 Number of working days/year 241 days Production Capacity of the plant Size of manufacturing equipment (Heavy Light duty duty/light duty) Identified types hazards Work at Height, Body traps in moving machine parts, enclosed surfaces, machinery related accident Level of expertise of the workers Intermediate Type of Equipment Majorly semi-automatic Safety Certification Health & Safety (OHSAS 18001), Environment (ISO 14001) Welfare and Compensation Package Effective TABLE II ESTIMATES OF MODEL PARAMETERS S/N 1 Safety System Input Parameters Budgeting factor for safety programme Symbol 2 3 4 5 6 7 Potential accident Total man-hours of workforce Accident Proneness Factor Prevention Time lag Accident causing factor Proportion of Prevented Accidents n Xp q: f: T h Nn III. different intervention activities; PPE, Training and Accident Investigation, as the cost effective strategy to fulfill the 10% reduction target. However, it shows that there is a gradual reduction in accident per year from the beginning of the first year to the end of the 3rd quarter of the 6th year, reducing the DISCUSSION OF RESULTS The successful simulation run, at 0.6 proportion of budget (P) and 10% reduction target (T) as shown in Fig. 3, the safety programme chooses strategy 3, which is a combination of 3 http://dx.doi.org/10.15242/IAE.IAE0315210 Estimated values 103728 [Naira/ Accident] 89 Accidents 561660 man-hours 1.585 e-4 Q[MHR]-1 0.25 [Year] 0.083 [T-1] Fatal [0.01]; Serious [0.11]; Minor [0.26]; and Trivial wounds [0.62], respectively 48 International Conference on Aeronautical And Manufacturing Engineering (ICAAME’2015) March 14-15, 2015 Dubai (UAE) accident from 0 to 8 and no accident was reduced again till the middle of the 8th year when reduction started till the last quarter of the same year when the 10% target reduction was achieved Similarly, as the accident is prevented, factory accidents reduce. Meanwhile, the graph of prevented accidents shows an exponential growth while that of the experienced display the random nature of accidents (periodic up and down number of accidents). Also, the number of accident started from 89 being the presafety accident and remained constant over the first 6 months of strategy implementation. This is not to say that the strategy was redundant over the first 6 months and had no effect, rather this period will be a period of evolving a safety climate that will plunge into significant safety gains on the long run. There was a sharp decline in the number of accident within the first 4 years of safety strategy implementation with accident reducing by 8 within this period (from 89 to 81). A much slower trend is observed over the next 3years and 9 months; between the 4th and the 7.75th year of safety strategy implementation. Given the accident reduction target and implementation level, the number of accidents remained constant from the beginning of the last quarter of the 8 th year to the 12th year of the simulation period with a potential factory accident being at 80. This constant trend was set to continue except investment is made on the safety programme, the investment will however bring about a further reduction in quantity of accident witnessed. For safety managers, it will interest them to know the year of redundancy of their safety programme. This can be read off from the graph of the factory hazardous condition (FC) over the simulation period (Fig. 4), which is 3years and 3 months i.e. from the third quarter of the 8 th year to the 12th year. IV. Fig. 3: Simulation run of prevented accidents and factory accidents at P = 0.6 and T = 10% prevented and potential accidents. Fig. 4: Simulation run of factory hazardous condition at P = 0.6 and T = 10%. REFERENCES CONCLUSION [1] Kines P., Andersen D., Andersen L.P. Nielsen K. and Pedersen L. (2013) Improving safety in small enterprises through an integrated safety management intervention. Journal of Safety Research 44, 87–95 [2] Lind S. (2008) Types and sources of fatal and severe non-fatal accidents in industrial maintenance. International Journal of Industrial Ergonomics 38, 927–933. [3] Ciarapica F.E. and Giacchetta G. (2009) Classification and prediction of occupational injury risk using soft computing techniques: An Italian study. Safety Science. 47, 36–49. [4] Mattila, V.M, Parkkari, J., Korpela, H. and Pihlajamaki, H. (2006). Hospitalization for Injuries among Finnish conscripts in 1990 – 1999. Accident Analysis and Prevention 38, 99-104. [5] Perez-Floriano L.R. and Gonzalez J.A. (2007) Risk, safety and culture in Brazil and Argentina: the case of TransInc Corporation. International Journal of Manpower 28. 5. 403-417. [6] Health and Safety Executive (HSS) (2013). Health and safety statistics 2012/13. www.hse.gov.uk [7] Ma Q. and Yuan J. (2009) Exploratory study on safety climate in Chinese manufacturing enterprises. Safety Science. 47, 1043–1046. [8] Payne S. C., Bergman M. E., Beus J. M., Rodriguez J. M. and Henning J. B. (2009) Safety climate: Leading or lagging indicator of safety outcomes? Journal of Loss Prevention in the Process Industries 22, 735– 739. [9] Bureau of Labor Statistics (BLS) (2013). News. National Census of Fatal Occupational Injuries in 2012. http://www.bls.gov/iif/oshcfoi1.htm [10] Martorell S., Sanchez A., Carlos S. and Serradell V. (2004) Alternatives and challenges in optimizing industrial safety using genetic algorithms. Reliability Engineering and System Safety. 86, 25–38. An integrated dynamic model for manufacturing safety programme was developed in terms of pre-safety accident level (Xp), budgeting factor (β), proportion of budget (P), effectiveness factor (µk), Factory workforce (q), Accident proneness factor(f), Prevented Accidents (Yt), Accident causation probability () and Proportion of prevented accidents(Nn). The developed models provide an interactive interface which serves as a useful tool for predicting and achieving factory accident, prevented accident, setting and achieving accident reduction targets and identifying various combinations of safety activities that can fulfill their targets. ACKNOWLEDGMENT The authors acknowledge the support of Tertiary Education Trust Fund (TETFUND) grant for implementation of this research work.. http://dx.doi.org/10.15242/IAE.IAE0315210 49 International Conference on Aeronautical And Manufacturing Engineering (ICAAME’2015) March 14-15, 2015 Dubai (UAE) [11] Charles-Owaba O. E and Adebiyi K. A. (2006) ―The Development Safety Programme Simulator‖ Journal of Modelling in Management UK, 1 (3) 270 – 290 [12] Nielsen K. J., Kines P., Pedersen L. M., Andersen L.P., Andersen D. R., (2015) A multi-case study of the implementation of an integrated approach to safety in small enterprises. Safety Science. 71, 142–150. [13] Zhang S., Sulankivi K., Kiviniemi M., Romo I, Eastman C. M. and Teizer J. (2015) BIM-based fall hazard identification and prevention in construction safety planning Safety Science. 72. 31–45. [14] Eklöf M., Törner M and Pousette A, (2014) Organizational and socialpsychological conditions in healthcare and their importance for patient and staff safety. A critical incident study among doctors and nurses. Safety Science. 70, 211–221. [15] Reiman T., Rollenhagen C., Pietikäinen E and Heikkilä J. (2015) Principles of adaptive management in complex safety–critical organizations. Safety Science. 71, 80–92. [16] Henriqson E, Schuler B, Winsen R. V. and Dekker S. W. A , (2014) The constitution and effects of safety culture as an object in the discourse of accident prevention: A Foucauldian approach. Safety Science. 70, 465–476. [17] Adebiyi K. A., Charles-Owaba O.E. and Waheed M.A. (2007) Safety performance evaluation models: a review. Disaster Prevention and Management, an International Journal, 16, 2, 178 – 187 [18] Kurd Z., Kelly T. and Austin J. (2007) Developing artificial neural networks for safety critical systems. Neural Computing and Applications. 16, 11 – 19. [19] Wang K.J. and Lin Y.S. (2007). Resource allocation by genetic algorithm with fuzzy inference. Expert Systems with Applications. 33. 1025–1035. [20] Adebiyi K.A. and Onawumi A.S. (2014)‖ A Bi – Objective Modeling of Manufacturing Safety Planning and Management‖ Industrial Engineering Letters 4 (9) 27 – 35. Professor Kazeem Adekunle Adebiyi is Professor of Occupational Safety in the Department of Mechanical Engineering, LadokeAkintola University of Technology, Ogbomoso, Nigeria. He obtained MSc and Ph.D. in Industrial Engineering from University of Ibadan, Ibadan. His research interest areas include Statistical Methods in Safety Intervention Performance Evaluation; Business Decision-Making Aspects of Safety and Health; Occupational Safety and Risk Engineering; Ergonomics/Human Factors Engineering; and Quantitative Modelling of Occupational Safety System. To this end, Professor Adebiyi has over 80 publications both in national and international journals and has attended conferences widely. He is a member of several professional bodies, prominent are: Corporate Member Nigerian Society of Engineers, Registered Engineer (COREN), Corporate Member, Nigerian Institute of Engineering Management etc. Professor Adebiyi has held various administrative and management positions. He is happily married and blessed with children. Engr. AJAYEOBA Abiola Olufemi is a Lecturer in the Department of Mechanical Engineering of Ladoke Akintola University of Technology, Ogbomoso. He obtainedM.Sc in Mechanical Engineering from Obafemi Awolowo University, Ile Ife, Nigeria, and currently a doctoral student researching in the area of Ergonomics and Safety Engineering.He had authored and co-authored a few number of articles in reputable national and international journals, conferences proceedings and books. http://dx.doi.org/10.15242/IAE.IAE0315210 50


© Copyright 2026