
State of California California Environmental Protection Agency AIR RESOURCES BOARD AND
State of California California Environmental Protection Agency Air Resources Board Alan C. Lloyd, Ph.D. Chairman AIR RESOURCES BOARD AND OFFICE OF ENVIRONMENTAL HEALTH HAZARD ASSESSMENT Office of Environmental Health Hazard Assessment Joan E. Denton, Ph.D. Director STAFF REPORT Adequacy of California Ambient Air Quality Standards: Children’s Environmental Health Protection Act November 2, 2000 Acknowledgements: This report was prepared with the assistance and support of Joann Myhre, Marlena Elliott, and Steve Mara. In addition, we acknowledge the insightful review and recommendations of the Air Quality Advisory Committee. We also extend our thanks to Rachel Broadwin, OEHHA’s Contract Manager for the pollutant reviews, and coordinator of the Air Quality Advisory Committee meeting, and to Kendra Frazier, OEHHA Contract Coordinator for the pollutant reviews. Principal Authors: Office of Environmental Health Hazard Assessment Bart Ostro, Ph.D. Michael Lipsett, M.D. California Air Resources Board Norman Kado, Ph.D. Deborah Drechsler, Ph.D. Contributing Authors: Stephen Brown, Ph.D. Nehzat Motallebi, Ph.D. Barbara Weller, Ph.D. Reviewers: Bart Croes, P.E., Chief, Research Division Michael Scheible, Deputy Executive Officer, ARB Dane Westerdahl John Batchelder Disclaimer: This report has been reviewed by the staff of the Air Resources Board and the Office of Environmental Health Hazard Assessment, and reviewed by the Air Quality Advisory Committee. Mention of trade names or commercial products does not constitute endorsement or recommendation for their use. To obtain this document in an alternative format, please contact the Air Resources Board ADA Coordinator at (916) 322-4505, TDD (916) 324-9531, or (800) 700-8326 for TDD calls from outside the Sacramento area. This report is available for viewing or downloading from the Air Resources Board Internet site, http://www.arb.ca.gov//ch/ceh.htm. 2 TABLE OF CONTENTS 1. Executive Summary ....................................................................................................8 2. Environmental Protection of Children ........................................................................10 2.1 Summary and Requirements of Children’s Environmental Health Protection Act .........................................................................................11 2.2 Ambient Air Quality Standards ...........................................................................12 3. Exposure to Air Pollutants .........................................................................................17 3.1 Introduction ........................................................................................................17 3.2 Ambient Air Quality ............................................................................................17 3.3 Ambient Air Quality Summaries .........................................................................17 3.4 Pollutant Sources in California ...........................................................................20 3.5 Monitoring..........................................................................................................20 3.6 Indoor and Personal Exposure...........................................................................21 4. OEHHA Summary of Air Pollutant Assessments .......................................................23 4.1 Summary and Guidelines for Evaluation ............................................................23 4.2 Summaries of Air Pollutant Assessments...........................................................26 4.2.1 4.2.2 4.2.3 4.2.4 4.2.5 4.2.6 4.2.7 4.2.8 PM10.........................................................................................................26 Sulfates ............................................................................................ 30 Ozone .............................................................................................. 34 Nitrogen Dioxide .............................................................................. 41 Lead ................................................................................................. 47 Hydrogen Sulfide ............................................................................. 50 Carbon Monoxide............................................................................. 54 Sulfur Dioxide................................................................................... 58 5. Recommendations on the Prioritization of Review and Revision ...............................65 Appendix A. SB25 Legislation Appendix B. Children’s Health Studies in California Appendix C. ARB Pollutant Summaries Appendix D. Contractor Reports 3 PM10 and Sulfates Ozone Nitrogen Dioxide Carbon Monoxide Hydrogen Sulfide Lead Sulfur Dioxide Appendix E. AQAC and Public Comments 4 LIST OF TABLES Table 2.2.4-1 California Ambient Air Quality Standards and the Primary Health Basis of the Standard.......................................................................... 12 Table 3.3-1 Maximum Value and Days Exceeding the California Ambient Air Quality Standards for 1999 ................................................................. 15 Table 3.6-1 Percent Time Spent In Different Environments ................................... 19 5 LIST OF FIGURES Figure C.3-1 Figure C.3-2 Figure C.3-3 Figure C.3-4 Figure C.3-5 Figure C.3-6 Figure C.4-1 Figure C.4-2 Figure C.5-1 Figure C.5-2 Figure C.6-1 Figure C.6-2 Figure C.7-1 Figure C.7-2 Figure C.8-1 Figure C.8-2 Figure C.9-1 Figure C.10-1 Figure C.10-2 Figure C.10-3 Table C11-1 Maximum 24-hour peak indicator for Statewide PM10 (mg/m3) ...........C-4 Maximum 24-hour peak indicator for Statewide PM10 (mg/m3), not including Great Valley Basin sites ......................................................C-4 Maximum 24-hour peak indicator for Statewide PM10 (mg/m3), not including Great Basin Valley, Mojave Desert, and Salton Sea sites ............................................................................................C-5 Maximum annual geometric mean concentrations of PM10, not including the Great Basin Valley sites (mg/m3) ....................................C-5 Maximum annual geometric mean concentrations of PM10, not including the Great Basin Valley, Mojave Desert, and Salton Sea sites (mg/m3)................................................................................C-6 Emissions (tons/day) and sources of PM10, projected through 2020......................................................................................C-6 Maximum concentration for sulfates (mg/m3). All statewide sites .......C-7 Maximum concentration for sulfates not including the China Lake site (mg/m3) ................................................................................C-8 Maximum 1-hour peak indicator for statewide ozone concentrations from 1980 through 1999 (ppm)...........................................................C-9 Emissions (tons/day) and sources of reactive organic gases (ROG) that form ozone, projected through 2020............................................C-9 Maximum 1-hour peak indicator concentrations for nitrogen dioxide (ppm) ...................................................................................C-10 Emissions (tons/day) and sources of nitrogen dioxide, projected through 2020....................................................................................C-11 Maximum 8-hour peak indicator carbon monoxide (ppm) .................C-12 Emissions (tons/day) and sources for carbon monoxide, projected through 2020 ....................................................................C-12 Maximum 1-hour peak indicator for hydrogen sulfide (ppm), including Trona ...............................................................................................C-13 Maximum 1-hour peak indicator for hydrogen sulfide (ppm), not including the Trona site ....................................................................C-14 Maximum 30-day average statewide lead concentrations (mg/m3) ....C-15 Maximum 1-hour peak indicator for sulfur dioxide (ppm). Note that in 1985 a new site opened in Nipomo (San Luis Obispo County), near a petroleum reprocessing plant ...........................................................C-16 Maximum 24-hour peak indicator for sulfur dioxide (ppm) ................C-16 Emissions (tons/day) and sources of sulfur dioxide (SO2), projected through 2020....................................................................................C-17 Residential Concentrations of Criteria Pollutants Recent California Studies.............................................................................................C-18 6 GLOSSARY OF TERMS AAQS Ambient Air Quality Standards AQAC ARB Air Quality Advisory Committee California Air Resources Board CAD Coronary Artery Disease Cal/EPA California Environmental Protection Agency CO Carbon Monoxide COHb Carboxyhemoglobin H2S Hydrogen Sulfide H2SO4 3 Sulfuric Acid mg/m milligrams per cubic meter of air NO2 Nitrogen Dioxide NOx Oxides of Nitrogen OCHP Office of Children’s Health Protection (U.S. EPA) OEHHA Office of Environmental Health Hazard Assessment Pb Lead PM Particulate Matter PM2.5 ppb Particulate matter equal to or less than 2.5 microns aerodynamic diameter Particulate matter equal to or less than 10 microns aerodynamic diameter parts per billion ppm parts per million ROG Reactive Organic Gases SO2 Sulfur Dioxide SO4 Sulfate SOx Oxides of Sulfur TAC Toxic Air Contaminants TOG Total Organic Gases TSP Total Suspended Particles U.S. EPA United States Environmental Protection Agency mg/m3 Micrograms per cubic meter of air PM10 7 1. Executive Summary Under the Children’s Environmental Health Protection Act (SB 25, authored by Senator Martha Escutia), the California Air Resources Board (ARB), in consultation with the Office of Environmental Health Hazard Assessment (OEHHA), is required, no later than December 31, 2000, to “review all existing health-based ambient air quality standards to determine whether, based on public health, scientific literature, and exposure pattern data, the standards adequately protect the health of the public, including infants and children, with an adequate margin of safety” (California Health & Safety Code section 39606(d)(1); see Appendix A) . This initial review is intended to: (1) examine the health protectiveness of each of the standards and (2) set priorities for more extensive review and possible revision of those standards not considered sufficiently protective of public health, especially with respect to infants and children. The initial Children’s Environmental Health Protection Act assessments were accomplished through critical reviews of recent health effects literature on each pollutant. The critical reviews were performed by well-recognized experts on each of the specific pollutants, including consultants from academia as well as from the staff of OEHHA. The pollutants reviewed are particulate matter with an aerometric diameter 10 microns or less in diameter, sulfates, ozone, nitrogen dioxide, carbon monoxide, hydrogen sulfide, sulfur dioxide, and lead. The standards for these pollutants are set forth in the Table of Standards in section 70200 of the California Code of Regulations, and are presented in Table 2.2.4-1 of this report, on page 14. Five factors were considered in assessing the standards’ health protectiveness and the need for further review: (1) The extent of the evidence of effects reported to occur at or near the existing ambient air quality standard. (2) The nature and severity of those effects. (3) The magnitude of risk of effects anticipated to occur when ambient (outdoor) levels are at or near the level of the existing standard. (4) Any evidence indicating that children may be more susceptible to effects than adults. (5) The degree of outdoor exposure in California relative to the level of the standard. The critical reviews indicate that health effects may occur in infants, children, and other potentially susceptible subgroups exposed to pollutants at or near levels corresponding to several existing California ambient air quality standards. Based on these factors, the pollutants fell into two tiers, the first representing greater potential risks to public health at the concentrations of the current air quality standards. The first tier includes particulate matter less than 10 microns in aerodynamic diameter (PM10), ozone, and nitrogen dioxide, with the recommended review priority in that order. Although California also has a separate standard for sulfates, this class of pollutants represents a subset of particulate matter, and should therefore be considered in conjunction with PM10. Recent scientific publications suggest that health effects may occur when ambient levels of these pollutants are at or near the current State ambient air quality standards. Key evidence for ranking these pollutants into the first tier is discussed below. Recent epidemiological literature on PM10 suggests the potential for health effects in infants and children, including mortality, reduced birth weight, premature birth, 8 asthma exacerbation, and acute respiratory infections. Epidemiological studies suggest that increased mortality and hospital admissions among the elderly and those with chronic heart and lung diseases may also be associated with exposure to PM10. Almost everyone in California is exposed to levels at or above the current State PM10 standard during parts of the year. The review of PM10 should include an assessment of the sulfate standard as well, since sulfates are a component of particulate matter. Epidemiological studies suggest effects of ozone exposure on lung function, asthma exacerbation, and other indices of acute respiratory morbidity in children and adults at ozone levels lower than the current State standard. A large segment of California’s population is exposed to levels at or above the current State standard, primarily during daylight hours in the summer. Several recent controlled exposure studies suggest indirect effects of nitrogen dioxide on allergic asthmatics (i.e., it may enhance the response to airborne allergens) when exposure levels are quite close to the existing standard. Allergy is a prominent feature of most childhood asthma and it is possible that there could be an impact on children. California has been in attainment of the ambient air quality standard for nitrogen dioxide since 1995; however, levels close to the standard are occasionally recorded at some sites. The second tier includes lead, carbon monoxide, hydrogen sulfide, and sulfur dioxide. Exposure to lead has significant effects on the development of children’s nervous systems, including impacts on intelligence and behavior. The scientific literature indicates that exposure to an airborne lead level at the current State standard would not be protective of the health of infants and children, and lead is currently listed pursuant to Health and Safety Code section 39657 as a Toxic Air Contaminant (TAC) with no safe threshold. However, exposures to levels of concern occur in a relatively small segment of the population since the statewide average lead level is well below the ambient air quality standard. Since there are few areas of the State where ambient lead is a concern, and since it will be regulated through the TAC control program, the review of the ambient air quality standard for lead is a low priority and it was not placed into the first tier. Evidence from controlled exposure studies suggests that the existing State ambient air quality standards for carbon monoxide, hydrogen sulfide, and sulfur dioxide are reasonably health protective. However, some evidence from observational epidemiological studies suggests the potential for adverse health effects related to carbon monoxide and sulfur dioxide, including increased risks of hospitalization and premature mortality in the general population at relatively low ambient levels. In contrast, there is little evidence for effects in infants and children. Epidemiological studies suggesting effects attributable to these pollutants are complicated by their correlation with other traffic-related pollutants. Epidemiological studies of health effects associated with exposure to carbon monoxide are likely to be based on ambient measurements that bear little relationship to individual exposures. Moreover, for hydrogen sulfide and sulfur dioxide, ambient levels are very low relative to the standard throughout most of the State. In addition, the hydrogen sulfide standard received a lower priority for review since it is intended primarily to prevent odor annoyance and associated symptoms, outcomes that are clearly not as serious as those associated with pollutants ranked in the first tier. The prioritization of the criteria air pollutants in the second tier is subject to change, based on scientific evidence available at the time. 9 Our recommendations were presented for review and comment at public workshops on September 19, 2000, in Sacramento and on September 26, 2000, in Los Angeles. A public meeting of the Air Quality Advisory Committee (AQAC), OEHHA’s external scientific peer review group for health-based ambient air quality standards, was held on October 12 and 13, 2000 in Oakland. (Further details are available at the ARB website (http://www.arb.ca.gov/ch/ceh/workshops.htm or by calling Joann Myhre at 916-327-2997). Transcripts of the AQAC meeting are available on the OEHHA website (http://oehha.org/air/toxic_contaminants/AQAC1.html) The AQAC has generally endorsed the recommendations provided in this report. The provisions of the Children’s Environmental Health Protection Act require that review of the highest priority pollutant be completed by December 31, 2002. Review of other pollutants found to be insufficiently protective of public health with an adequate margin of safety will take place at the rate of one per year thereafter. Written comments on the recommended order for review of the ambient air quality standards may be addressed to Dr. Bart Ostro, Ph.D., Chief, Air Pollution Epidemiology Unit, Office of Environmental Health Hazard Assessment, 1515 Clay St., 16th Floor, Oakland, CA 94612 ([email protected], 510 622-3150), or to Bart Croes, P.E., Chief, Research Division, Air Resources Board, PO Box 2815, Sacramento, CA 95612-2815 ([email protected], 916-323-4519) prior to, or at the Air Resources Board public hearing, scheduled for December 7 and 8, 2000. 10 2. 2.1 Act Environmental Protection of Children Summary and Requirements of Children’s Environmental Health Protection The Children’s Environmental Health Protection Act, (SB 25,authored by Senator Martha Escutia, Stats. 1999, Ch. 731, set forth in Appendix A) was approved by the Governor on October 7, 1999. The bill requires the California Air Resources Board (ARB), in consultation with the Office of Environmental Health Hazard Assessment (OEHHA), to review all existing health-based State Ambient Air Quality Standards (AAQS) by December 31, 2000, to determine whether the standards protect the health of the public, including infants and children, with an adequate margin of safety. This report provides the ARB with information and recommendations to make this determination. If there is uncertainty about the health-protectiveness provided by a standard or standards, the highest priority air quality standard must be revised no later than December 31, 2002. Following the revision of the highest priority standard, the ARB is directed to review, and if necessary, revise any additional standards where health protection, particularly for infants and children, may not be sufficient. Such reviews shall be completed at the rate of one standard per year. Any revision to a health-based standard will be based on the recommendation of OEHHA. Further, OEHHA is to take into account exposure patterns, special susceptibilities, and interaction of multiple pollutants on infants and children, including the interaction of criteria pollutants with toxic air contaminants, in making its recommendations. To assist in reviewing the adequacy of the State’s health-based ambient air quality standards, OEHHA entered into an interagency agreement with the University of California, Irvine, which developed agreements with recognized experts on particulate matter (PM), sulfate (SO4), ozone (O3), nitrogen oxides (NOx), carbon monoxide (CO), and sulfur dioxide (SO2). Each prepared a literature review assessing whether their assigned California ambient air quality standard provided an adequate margin of safety with respect to infants and children. The pollutant reviews were conducted by the following researchers: • Carbon monoxide - Michael Kleinman, Ph.D., University of California at Irvine • Nitrogen dioxide - Mark Frampton, M.D., University of Rochester Medical Center • Ozone clinical studies - John Balmes, M.D., University of California, San Francisco • Ozone epidemiology studies - Ira Tager, M.D., University of California, Berkeley • Particulate matter and sulfates - George Thurston, Sc.D., New York University • Sulfur dioxide - Jane Koenig, Ph.D., University of Washington OEHHA reviewed hydrogen sulfide (H2S) and lead. OEHHA and ARB used these reviews and other scientific information in the assessment of the healthprotectiveness of the standards and the setting of priorities for possible revision. This report was available for review and comment at two public workshops (September 19, 2000 in Sacramento and September 26, 2000 in Los Angeles) and at a meeting of the 11 Air Quality Advisory Committee, OEHHA’s external peer review group for health-based ambient air quality standards (October 12 and 13, 2000, in Berkeley). The Children’s Environmental Health Protection Act further requires OEHHA, in consultation with the ARB, to establish by July 1, 2001, a list of five toxic air contaminants (TACs) that may cause illness especially to infants and children. The bill requires the ARB to review and, if appropriate, revise any control measures for TACs to reduce exposure to those toxic compounds (Health and Safety Code section 39669.5). The Children’s Environmental Health Protection Act also creates the Children’s Environmental Health Center within the California Environmental Protection Agency to advise the Secretary for Environmental Protection and the Governor on matters within the jurisdiction of the agency relating to environmental health and environmental protection as it relates to children (Health and Safety Code section 900). The Children’s Environmental Health Protection Act requires the ARB to expand its existing monitoring program in six communities around the State which are in nonattainment areas, and to conduct special monitoring to better assess children’s exposure to air pollutants (Health and Safety Code section 39617.5). The ARB is to use this information to evaluate the adequacy of the current monitoring network for assessing children’s exposure to air pollutants. The initial tasks of the Children’s Environmental Health Protection Act are to review the health-protectiveness of the standards and to set priorities for more extensive review and revision of those standards considered insufficiently protective of public health. This report addresses these initial tasks. The background information, the legal authority for setting ambient air quality standards, information on exposure to air pollutants, review of health-based information, and the basis for recommendations for priority standards to review is presented herein. 2.2 Ambient Air Quality Standards 2.2.1 Definition of Ambient Air Quality Standard An “Ambient Air Quality Standard” (AAQS) represents the legal definition of clean air by specifying concentrations and durations of air pollutants that reflect the relationship between the intensity and composition of air pollutantion to undesirable effects (see Health and Safety Code section 39014). The AAQS’s establish the maximum allowable levels of air pollutants. 2.2.2 National Ambient Air Quality Standards Two provisions (sections 108 and 109 of the Federal Clean Air Act (42 USC section 7401 et seq.) govern the establishment, review, and revision of National Ambient Air Quality Standards (NAAQS). Section 108 directs the U.S. Environmental Protection Agency (U.S. EPA) to list pollutants that may reasonably be anticipated to endanger public health or welfare and to issue air quality criteria for them, hence the name “criteria air pollutants” to characterize those air pollutants for which there are ambient air quality standards. The air quality criteria (“Criteria Documents”) are to reflect the latest scientific information useful in indicating the kind and extent of all exposure related effects on public health and welfare that may be expected from the presence of the pollutant in ambient air. Section 109 directs U.S. EPA to establish “primary” (health-based) and “secondary” (welfare-based) NAAQS for pollutants listed under section 108 and based 12 upon the information contained in the “Criteria Documents”. More information on the NAAQS can be obtained at the U.S. EPA website at: http:/www.epa.gov.oar/oaqps/. The Federal Clean Air Act also permits the states to adopt additional or more stringent air quality standards when they are needed to address local problems (see Clean Air Act section 116). California has vigorously exercised this option. California Ambient Air Quality Standards were established by the ARB in 1969, prior to the establishment of NAAQS. California’s ability to set its own ambient air quality standards allows the State to respond more rapidly to new information regarding the effects of air pollutants on public health and welfare. It also allows the State to address situations and pollutants important or unique to California, but not as important or relevant to the national perspective. An example which illustrates California’s timely response to new scientific evidence is the State ozone standard of 0.09 ppm, averaged over one hour, which was set in 1987. The ARB acted to protect public health from injury to the respiratory system. The NAAQS of 0.12 ppm averaged over one hour was established in 1971 and not revised until 1997. The revised standard of 0.08 ppm for eight hours is pending review by the U.S. Supreme Court. Moreover, for some California standards, either the pollutant or the circumstances of exposure are not a nationwide problem. For example, the Lake Tahoe Air Basin carbon monoxide standard of 6 ppm for 8-hours is more protective than the general standard of 9 ppm for 8-hours because the high altitude of the area worsens the effect of carbon monoxide on the many visitors to this region. 2.2.3 State Ambient Air Quality Standards California Health and Safety Code section 39606(b) authorizes the ARB to adopt standards for ambient air quality “in consideration of public health, safety, and welfare, including but not limited to health, illness, irritation to the senses, aesthetic value, interference with visibility, and the effects of air pollution on the economy”. The objective of ambient air quality standards is to provide a basis for preventing or abating adverse health or welfare effects of air pollution (title 17, California Code of Regulations (Cal Code Regs.) section 70101). Ambient air quality standards establish the maximum allowable levels of air pollutants deemed to be healthy. However, standards should not be interpreted as permitting, encouraging, or condoning the degradation of present air quality that is superior to that stipulated in the standards. The ambient air quality standards adopted by the Air Resources Board are to be achieved and maintained by rules and regulations – primarily emission limitations- established by the regional and local air pollution control and air quality management districts for stationary sources such as industrial smoke stacks, and by the State Board for vehicular (mobile) sources (ie., generally Health and Safety Code sections 39002, 40000, and 40001). OEHHA provides detailed analyses of the available health information for each criteria pollutant, and in conjunction with the Air Quality Advisory Committee (AQAC), OEHHA’s peer review body, provides health recommendations for the standards (Health and Safety Code sections 39606 (a) and (b)). The current California Ambient Air Quality Standards and their health bases are set forth in 17 Cal. Code Regs. section 70200, and are summarized in Table 2.2.4-1. During the adoption of a State AAQS, a number of factors are evaluated and reviewed by the ARB, OEHHA, AQAC, and the public. An important underlying premise of the AAQS evaluation process is to assure that sensitive sub-populations are protected 13 from exposures to levels of pollutants that may cause adverse health effects. For example, the one-hour standard for SO2 of 0.25 ppm was adopted to protect exercising individuals with asthma. The standards for carbon monoxide (CO) in California were adopted to protect sensitive individuals with cardiovascular disease. Although many of the studies that were instrumental in supporting ambient air quality standards have incorporated sensitive sub-populations in their analyses, most have not specifically included infants or children. California has been in the forefront of studies involving the health effects on children exposed to air pollutants. Examples of these studies conducted in California are summarized in Appendix A. 14 Table 2.2.4-1. California Ambient Air Quality Standards and the primary health basis of the standard. Pollutant 1 Ozone Averaging Time Concentration 1 Hour 0.09 ppm 3 (180 mg/m ) (O3) 2 Health Effects Basis of Standard Short-term exposures: Human clinical studies decreases in lung function, and lung inflammation that are indicative of lung injury. Altered lung structure and changes in immune defense systems in animals. Long-term exposures: Community health (epidemiological) studies – Decrease in lung function in chronically exposed people. Animal studies - Altered lung connective tissue metabolism and altered pulmonary morphology. 30 mg/m 3 Epidemiological studies – Seasonal declines in lung function, especially in children. 24 Hour 50 mg/m 3 Epidemiological studies – Excess deaths from short-term exposures and exacerbation of symptoms in sensitive patients with respiratory disease. 8 Hour 9.0 ppm Respirable Annual Particulate Geometric Mean Matter (PM10) Carbon Monoxide 3 (10 mg/m ) (CO) 1 Hour 20 ppm (23 mg/m3 8 Hour (Lake Tahoe) Nitrogen Dioxide 1-Hour 6 ppm 3 (7 mg/m ) 0.25 ppm (470 mg/m ) 3 (NO2) Human clinical studies – Chest pain (angina) in heart patients (decreased time before onset of angina in exercising heart patients). Decreased tolerance to exercise in persons with circulatory and lung disease. Impairment of central nervous system functions. Possible increased risk to fetuses. Human clinical studies – Combined effects of altitude and CO resulting in increased angina in exercising heart patients. Human clinical studies – Potential to aggravate chronic respiratory disease and respiratory symptoms in sensitive groups. Animal studies – Lung irritation and damage. Changes in lung cells (including cells associated with allergic and inflammatory responses) and biochemistry. Reacts in the atmosphere to form ozone and acid rain. Lead (Pb) 30 days Average 1.5 mg/m 3 Epidemiological studies – Increased accumulation of lead in the body. Impairment of blood formation and nerve conduction. 15 Pollutant 1 Sulfur Dioxide Averaging Time Concentration 24 Hour 0.04 ppm 3 (105 mg/m ) (SO2) 1 Hour 0.25 ppm (655 mg/m ) 3 Sulfates Health Effects Basis of Standard Epidemiological studies – Increased incidence of lung disease and symptoms, decreased lung function, and increased risk of death Human clinical studies – Bronchoconstriction (the narrowing of airways) in asthmatics accompanied by symptoms including wheezing, shortness of breath, and chest tightness during exercise or physical activity. 24 Hour 25 mg/m3 Epidemiological studies – Decrease in lung function, aggravation of asthmatic symptoms, aggravation of heart and lung diseases. 1 Hour 0.03 ppm Human clinical study - Odor nuisance (rotten egg smell). Limits, but does not prevent, odor nuisance. (SO4) Hydrogen Sulfide 2 (42 mg/m ) (H2S) 1. California standards for O3, CO (except Lake Tahoe), SO2 (1 and 24 hour), NO2, and PM10 are values that are not to be exceeded. California ambient air quality standards are listed in the Table of Standards in section 70200 of the California Code of Regulations. 2. Concentration expressed first in units in which it was promulgated. Equivalent units given in parentheses are based upon a reference temperature of 25 degrees C and a reference pressure of 760 mm of mercury. Most measurements established at 1,013.2 millibar; ppm in this table refers to ppm by volume, or micromoles of pollutant per mole of gas. 3 16 3. Exposure to Air Pollutants 3.1 Introduction Exposure to air pollutants occurs when we breath the air around us. Important factors that determine the degree of exposure are “when”, “where”, and “how long” air pollutants are inhaled. Individual behavior of where we are during the day can influence our exposure and can be different for children and adults. For example, during the summer and midday when certain air pollutant concentrations are at their seasonal and daily high, children may spend a longer time outdoors than adults. During the school year, the majority of school age children spend most of their time in the classroom, childcare facility, and on the playground. Children also participate in sports activities after school. Susceptible sub-population groups such as the elderly with medical conditions often stay inside their homes. Since exposure to air pollutants can take place throughout the day in any environment and can cause adverse health effects at certain levels, the airborne concentrations of these pollutants are routinely measured throughout the State. To provide an introduction to air quality issues and an overview of air pollutant concentrations in California, we discuss in the following sections information on ambient air quality, pollutant sources in California, monitoring, and indoor and personal exposure. 3.2 Ambient Air Quality Outdoor (ambient) air pollutant concentrations are measured in the State over time intervals that are pertinent to protect the public from potential adverse health effects. For example, a one-hour average concentration for SO2 was adopted to protect sensitive individuals with asthma. This monitoring, or regular measurement of pollutants in community air, allows determination of the quality of the air we breathe, and further allows determination of which geographic areas within California are meeting (in compliance with) the standards. If an area is not in compliance, the monitoring information will show by how much and how frequently the standards have been exceeded. Each year, more than ten million air quality measurements are collected from over 200 monitoring sites located throughout California and are stored in a comprehensive database maintained by the ARB called ADAM (Aerometric Data Analysis and Management). ADAM is capable of processing interactive data queries of the entire California database in several formats, including the four highest values and number of days above the standards for O3, PM10, fine particles, CO, SO2 and NO2. ADAM can be accessed at: www.arb.ca.gov./adam. A summary of air pollutant concentrations and days exceeding the State standard are described in the next section. 3.3 Ambient Air Quality Summaries Summaries of selected California ambient air quality data for major populated air districts are presented for 1999 in Table 3.3-1. The maximum concentrations of air pollutants, and the number days exceeding the standards, are provided for each district. PM10 has the greatest number of days exceeding the 24-hour standard of 50 mg/m3. For example, the South Coast district exceeded the standard for 258 days during 1999, and the San Joaquin Valley district exceeded the standard for 174 days. The maximum 24 17 hour average PM10 concentration recorded for each of these districts was 183 mg/m3. The South Coast, San Joaquin Valley, and San Diego districts had maximum PM10 annual geometric mean concentrations of approximately 65, 50, and 48 mg/m3, respectively, all of which exceeded the annual standard of 30 mg/m3. The Bay Area Air Quality Management District and Lake County (not shown in Table 3.3-1) did not exceed the annual PM10 standard for 1999. Statewide, there are a number of days each year during which the ozone concentration exceeds the standard (0.09 ppm for 1 hour). For example, the South Coast district exceeded the standard for 111 days, and the San Joaquin district exceeded the standard for 122 days. The maximum 1 hour concentration for ozone recorded in the South Coast district was 0.174 ppm. Nitrogen dioxide, sulfate, and sulfur dioxide, generally do not exceed the standard, and were not exceeded in 1999. Los Angeles County and Calexico each had several exceedances of the CO standard. Information on air quality including statewide trends, emissions, and sources for each pollutant spanning the period from 1980 through 1999 are summarized in Appendix B of this report. Additional information regarding air quality data can be reviewed at the ARB worldwide website at: http://www.arb.ca.gov/aqd/aqd.htm 18 Table 3.3-1. Maximum value and days exceeding the California Ambient Air Quality Standards for 1999 a District South Coast San Joaquin Valley San Diego Sacramento Metro (County) San Francisco Bay Area Ozone NO2 1-hr standard = 0.09 ppm Max Days 1-hr Exceeding 1-hr standard = 0.25 ppm Max Days 1-hr Exceeding 111 122 27 40 20 0.174 0.155 0.124 0.160 0.156 SO4 c PM10 24-hour standard = m g/m District South Coast San Joaquin Valley San Diego Sacramento Metro (County) San Francisco Bay Area 1 0 0 0 0 0.307b 0.108 0.172 0.110 0.128 25 24-hour standard = 3 50 Max 24-hr Days Exceeding Max 24-hr Days Exceeding d 30 m g/m Max Geo Mean 14.5 7.7 16.0 7.6 8.3 0 0 0 0 0 183 183 121 141 114 258 174 126 66 36 64.9 50.3 47.5 23.7 25.4 m g/m SO2 District South Coast San Joaquin Valley San Diego Sacramento Metro (County) San Francisco Bay Area 1-hr standard = 0.25 ppm Max Days 1-hr Exceeding 0.09 0.01 0.08 0.03 0.10 24-hour standard = 0.04 ppm Max Days 24-hr Exceeding 0 0 0 0 0 0.019 0.006 0.017 0.014 0.038 0 0 0 0 0 CO District Lake Tahoe (8-hr standard = 6 ppm) South Coast San Joaquin Valley San Diego Sacramento Metro (County) San Francisco Bay Area a b c d annual standard = 3 3 1-hr standard = 20 ppm Max Days 1-hr Exceeding 8-hr standard = 9.0 ppm Max Days 8-hr Exceeding 3.2 0 2.4 0 19.0 11.9 9.9 7.7 9.0 0 0 0 0 0 11.2 7.8 6.0 6.6 6.3 11 0 0 0 0 http://www.arb.ca.gov/aqd This value is considered an extreme event and does not affect attainment status. S O 4 data is from 1998 and is based on total suspended particulates. Calculated days above the standard. 19 3.4 Pollutant Sources in California Air pollutants can be classified as being directly emitted from sources (referred to as “primary air pollutants”), or formed in the atmosphere by chemical reactions between sunlight and the compounds directly emitted from sources (referred to as “secondary air pollutants”). Examples of air pollutants that are directly emitted include CO, NOx, SOX, and PM. An example of an air pollutant that is formed in the atmosphere is ozone, the formation of which involves a complex set of chemical reactions between hydrocarbons, oxides of nitrogen, and sunlight. The peak level of ozone is detected near midday, for example, and reflects the timing of these concentration-dependent photochemical reactions. There are also chemical reactions that take place during the night in the absence of sunlight-dependent chemistry. The typical smog in Los Angeles and other metropolitan areas is a complex mixture of primary and secondary air pollutants. Primary pollutant sources in California can be classified into four major categories: • Stationary - fixed-site establishments such as those having emission stacks. • Area – widespread sources such as road dust, consumer products, and landfills. • Mobile – cars, trucks, trains, boats, etc. • Natural – windblown dust, wildfires and other non-anthropogenic sources. • To estimate the sources and quantities of air pollutants, the ARB, in cooperation with local air pollution control districts and industry, maintains an emission inventory of California emission sources. Total amounts of air pollutants that are emitted (usually reported as tons per day) from specific source types are calculated. Emission values for individual air pollutants and their sources are presented in Appendix C. Emissions data are important in an air pollution control program. Developing statewide, regional, and neighborhood emissions inventories identifies the sources contributing to air pollution, quantifies the mass emissions for each source type, and provides information concerning the public’s exposure to air pollution. Additional information regarding air pollutant sources and emissions in California can be reviewed at the ARB worldwide website at: http://www.arb.ca.gov/emisinv/eib.htm. 3.5 Monitoring Monitoring for ambient air quality includes measurement of airborne pollutant concentrations that results in development of a long-term database. The instrumentation used for monitoring is generally placed near locations where people live and work, but also can be placed near emission sources. Some of the important factors to consider when monitoring include: 1) the population exposed to the specific air pollutant, 2) the frequency of monitoring in relation to the averaging time of the standard, and 3) the placement of the monitoring instrumentation consistent with the monitoring objective. The latter is especially important with respect to measuring exposure to infants, children and other susceptible populations. Additional information of the ARB monitoring program or monitoring information as it specifically relates to the Children’s Environmental Health Protection Act can be accessed on the worldwide web at: www.arb.ca.gov/ch/ceh.htm. 20 3.6 Indoor and Personal Exposure Indoor exposures to air pollutants are important in assessing health risks because we spend considerable amounts of time indoors and the concentration of pollutants indoors can be higher or lower than ambient levels. The results of studies of adults and children in California and the percent time spent in various locations are summarized in Table 3.6.1. Children (0-11 years old) spend approximately 86% of their time in indoor environments (including activities of sleeping, eating, classroom learning, and playing, for example), and spend a greater time outdoors than adults. About 70% of the total time that these children spend outdoors occurs between noon and 8 p.m. The home environment is especially important for sensitive groups of the population, such as infants, toddlers, and the elderly because they spend a substantial portion of their time indoors at home. For many pollutants, indoor levels are elevated due to sources located indoors, the trapping effect of buildings, and re-emission, re-suspension, or reactivity of pollutants previously emitted into the indoor environment. Important indoor sources for air pollutants include combustion appliances such as gas stoves and space heaters that emit CO, NO2, and PM10. Personal exposure to air pollutants is the measurement of concentrations near a person’s breathing zone over a certain period of time, and is an indicator of individual exposure to pollutants. Individual activities and behavior may elevate exposure relative to levels typically measured at established monitoring sites. This is a consideration when evaluating exposures to air pollutants for susceptible populations including infants and children, and is further addressed in the Children’s Environmental Health Protection Act. Table 3.6-1. Percent time spent in different environments 1 (Californians, population averages) 1 Infants 0-2 years Children 3-5 years Children 6-11 years Adolescents and Adults (12 and older) Indoors at Home 85% 76% 71% 62% Other Indoor 4% 9% 12% 25% Inside Vehicles 4% 5% 4% 7% Outdoors 6% 10% 13% 6% From: Wiley et al., 1991; Jenkins et al., 1992. 21 References Jenkins, PL, Phillips, TJ, Mulberg, EJ, and Hui, SP. 1992. "Activity Patterns of Californians: Use of and Proximity to Indoor Pollutant Sources," Atmospheric Environment, vol. 26A, no. 12, pp. 2141-2148. Wiley, JA, Robinson, JP, Cheng, YT, Piazza, T, Stork, L, Pladsen, K, 1991. Study of Children’s Activity Patterns, final report to the California Air Resources Board, contract no. A733-149, September 1991. 22 4. OEHHA Summary of Air Pollutant Assessments 4.1 Summary and Guidelines for Evaluation 4.1.1 Summary Under The Children’s Environmental Health Protection Act, the California Air Resources Board (ARB), in consultation with the Office of Environmental Health Hazard Assessment (OEHHA), is required by December 31, 2000, to “review all existing health-based ambient air quality standards to determine whether, based on public health, scientific literature, and exposure pattern data, the standards adequately protect the health of the public, including infants and children, with an adequate margin of safety" (Health & Safety Code section 39606(d)(1)). To assist the ARB in fulfilling this legislative mandate, OEHHA has undertaken a critical literature review for the pollutants governed by health-based ambient air quality standards: carbon monoxide, hydrogen sulfide, lead, nitrogen dioxide, ozone, sulfur dioxide, particulate matter (measured as PM10, or particulate matter with mean aerodynamic diameter less than 10 microns), and sulfates. This initial review was intended to: (1) examine the health-protectiveness of each of the standards, and (2) prioritize for more extensive review and revision those standards considered insufficiently protective of public health, including infants and children. Our review indicates that health effects may occur in infants, children, and other potentially susceptible subgroups exposed to several pollutants at or near levels corresponding to existing California ambient air quality standards. We categorized the pollutants into two tiers, based on our assessment of potential risks to public health. The first tier includes PM10, ozone, and nitrogen dioxide. Although California also has a separate standard for sulfates, this class of pollutants represents a subset of particulate matter, and should therefore be considered in conjunction with PM10. The second tier is comprised of pollutants for which there is weaker and more uncertain evidence that exposures at or near the levels of the current California ambient standards may cause adverse effects in the most susceptible populations, or which are adequately controlled under other regulatory programs. This pollutant group includes lead, carbon monoxide, sulfur dioxide, and hydrogen sulfide. Based on the evidence for effects that may occur with exposures at or near the levels of the current standards, the severity of the effects, the degree of current exposure, and the possible effects on children, OEHHA staff believe that PM10 should be prioritized as the first pollutant to be reviewed for possible revision. 4.1.2 Guidelines for Assessing Health Protectiveness of Ambient Air Quality Standards and for Prioritization of Review Bearing in mind that the overarching goal of this review has been to protect public health, particularly for infants and children, this section provides a description of the criteria used by OEHHA staff in making these assessments, as well as judgments for prioritization. The specific information utilized during this process included the following: (1) the extent of the evidence of effects reported to occur at or near the existing ambient air quality standard; (2) the nature and severity of those effects; (3) the level of risk of effects anticipated at or near the level of the existing standard; (4) whether there is evidence indicating that infants and/or children may be more susceptible than adults; and (5) the degree of exposure in California relative to the level of the standard. These are described in greater detail below. With respect to the initial assessment of the standards’ health-protectiveness, the principal focus was on guidelines (1), (2) and (4), while all five factors entered into decisions regarding priority for 23 further review and revision. During this initial SB25 review, OEHHA staff found that several ambient pollutant standards were candidates for more extensive evaluation. In each instance, research findings suggested the potential for the occurrence of adverse health effects among sensitive populations, including infants and children, in relation to exposures that might occur at or near the level(s) of the existing standard(s). 4.1.2.1 Evidence of effects reported at or near the existing standard The primary consideration in this review by OEHHA staff has been whether there is evidence of effects reported in either animal or human studies when exposures to the pollutant of concern have been at or near the existing California ambient air quality standard for that pollutant. In general, we accorded greater weight to studies involving humans (controlled exposures and epidemiological investigations) than to toxicological studies of experimental animals. Pollutants governed by ambient air quality standards typically have been extensively studied for their effects in humans, unlike the pollutants designated as toxic air contaminants. We also examined the quality and quantity of data indicating that there might be an inadequate margin of safety to protect against the occurrence of adverse effects. As a starting point for this review, OEHHA obtained assessments of the scientific literature from several experts (see Appendix D). All other things being equal, the more extensive the database suggesting the potential for adverse health effects from exposure to a given pollutant at the level of the current standard, the higher the priority that pollutant received. 4.1.2.2 Nature and severity of effects This aspect of the process involved consideration of the severity of the adverse effects associated with various pollutant exposures. All of the pollutants subject to ambient standards in California are capable of causing severe injury and death from high-level exposures. However, our review focused on adverse effects likely to occur upon exposure to concentrations at or near existing standards or current ambient concentrations. Such exposures have been linked with a spectrum of effects ranging from premature mortality (PM10) to odor annoyance and discomfort (H2S). Decisions about the severity of effects are clear-cut at the extremes, but are less so for intermediate outcomes, such as increased daily reporting of asthma symptoms versus, for example, small decrements in lung growth in nonasthmatic children. Reversibility of effect also entered into these deliberations. In assessing the severity of effects, we were guided in part by the recent revision of the American Thoracic Society’s position paper on “What Constitutes an Adverse Health Effect from Air Pollution?” (Samet et al., 2000). Ultimately, however, decisions regarding the relative weighting of the severity of “intermediate” health impacts was a matter of informed, professional judgement. Clearly, those exposures considered to contribute to premature mortality would be given higher priority than those thought to increase the risk of rhinitis. 4.1.2.3 Magnitude of risk anticipated at the level of the current standard Another criterion relied upon by OEHHA staff was the magnitude of risk expected if people were exposed to a given pollutant at the level of the existing standard. This represents two factors -- the anticipated increment in the level of risk and the background risk faced by the general population or an identifiable susceptible subpopulation. The greater the magnitude of risk (represented in epidemiological studies, for example, by the relative risk), the higher the ranking that pollutant would theoretically receive. However, if the background or baseline level of occurrence of that outcome were extremely uncommon, this would tend to decrease the priority assigned to that pollutant. In general, this criterion played less of a role than the others, because the levels of risk for the relevant effects of most of the pollutants examined were generally of similar magnitude. 24 4.1.2.4 Evidence indicating that children may be more susceptible than adults Evidence of susceptibility in children was also an important factor considered in this review, consistent with one of the principal objectives of SB 25, that is, the protection of the health of children and infants. Therefore, our review placed particular focus on both the exposure patterns and potential susceptibility of children to the pollutants under study. In evaluating the toxicological and epidemiological evidence, the existence of studies suggesting potential effects on infants and children would tend to result in a higher priority for a given pollutant. 4.1.2.5 Degree of exposure relative to the level of the standard Recent air quality monitoring data also played an important role in this review. Widespread exposures occurring at or near the current standard for any candidate pollutant were given greater priority weighting than ambient concentrations well below the standard. To the extent that current State ambient concentrations already provide a de facto margin of safety for any pollutant, even if the corresponding standard itself does not, that pollutant was given a lower priority ranking. Lead provides an illustrative example. Though we considered the neurodevelopmental effects of lead in young children to be serious adverse outcomes at the level of the existing standard, current exposures in most of California are nearly an order of magnitude lower than the standard, largely because of highly successful control measures implemented years ago, including the elimination of leaded gasoline as a conventional motor vehicle fuel. Information on current and historical ambient concentrations can be obtained at the ARB website (http://www.arb.ca.gov/aqd/aqd.htm). The above factors were applied as guidelines, not rigid criteria, in arriving at the assessments of health-protectiveness and the priorities for more extensive review. Given the time constraints on this process, OEHHA staff believed that a formal, decision-analytical framework was neither feasible nor likely to have produced markedly different results. As is true of all aspects of this report, OEHHA’s recommendations regarding priorities for more extensive review have been subject to peer review of outside experts. References Samet J, Buist S, Bascom R, Garcia J, Lipsett M, Mauderly J, Mannino D, Rand C, Romieu I, Utell M, et al (2000). What constitutes an adverse health effect of air pollution? Am J Respir Crit Care Med 161(2 part 1): 665-673 25 4.2 Summaries of Air Pollutant Assessments 4.2.1 4.2.1.1 PM10 Summary The review of the scientific literature on PM10 (particulate matter less than 10 microns in diameter) indicates that adverse health effects resulting from exposure to ambient PM10 could occur when ambient concentrations are near or below the current State standards of 30 mg/m3 (annual average) and 50 mg/m3 (24-hour average). PM10 is a heterogeneous mix consisting of both fine particles (PM2.5 or particles less than 2.5 microns in diameter) and coarse particles (2.5 to 10 microns in diameter). Fine particles result from fuel combustion (from motor vehicles, power generation, and industrial facilities), residential fireplaces and wood stoves, and agricultural burning. They can also be formed in the atmosphere from gases such as sulfur dioxide, nitrogen dioxide and volatile organic compounds. Coarse particles are generally emitted from sources such as windblown dust, unpaved roads, materials handling, and crushing and grinding operations. The PM10 standard is often exceeded throughout the State. The review suggests several factors that may render children and infants more susceptible to PM10, including a greater amount of time spent outdoors, greater activity levels and breathing rates, higher doses per body weight and lung surface area, and potential irreversible effects on children’s developing lungs. A large body of epidemiological studies indicates an association between current ambient concentrations of PM10 and a suite of adverse outcomes including changes in lung function, respiratory symptoms, asthma exacerbation, doctor visits, emergency room visits, hospital admissions, and premature mortality. The more severe outcomes are experienced primarily by the elderly and by people with pre-existing chronic heart or lung disease. However, several epidemiological studies suggest that children under age 5, and possibly under age 1, may also experience adverse responses from exposure to PM10. Studies have found association between PM10 and changes in lung function, asthma, respiratory symptoms, doctor visits, and premature mortality in this subgroup. A threshold concentration, below which no effects are observed, has not been demonstrated for these outcomes. The precise particle size(s) and biologically active constituents within PM10 are uncertain. Therefore, the review of the PM10 standard, which is assigned a high priority, should also examine the effects of subspecies such as fine and coarse particles. 4.2.1.2 Review of the health assessment Beginning with the London smog episodes in the 1950s, the quantification of adverse health effects of particulate matter (PM) have been well documented, with evidence provided primarily from the epidemiological literature, as summarized by the U.S. Environmental Protection Agency (U.S. EPA, 1995, 1998). Over the last decade, over 100 studies have been published suggesting associations between various measures of PM and a large suite of adverse outcomes. Many of these studies indicate that the elderly and those with chronic heart and lung conditions are particularly susceptible to PM10. However, there is evidence to suggest that children may constitute another group that is particularly vulnerable to exposure to ambient PM10. Specifically, children spend more time outdoors and are more active than adults. When indoors, children’s personal exposures to PM10 appears to be more than twice as high as that of adults, possibly due to the “personal cloud” effect (Janssen et al., 1998). Lung deposition of PM10 (in mg/day) may be slightly lower for children under age 14 relative to older adolescents and adults, but is higher when adjusted for body weight and lung surface 26 area. Finally, there is limited experimental and epidemiological information suggesting that the early post-neonatal period of lung development is a time of high susceptibility for irreversible effects on lung growth associated with injury from exposure to environmental toxicants. This may be because this period is a time of rapid development of the respiratory system. There is a large body of literature on the effects of particle exposure in animal models. This work has aided our understanding of the size distribution, composition, and deposition patterns that contribute to the injury observed with particle exposure. Epidemiological studies have reported associations of PM10 or other measures of PM with premature mortality, hospital admissions for cardiovascular and respiratory conditions, emergency room and unscheduled physician visits, asthma exacerbation, respiratory symptoms and reductions in lung function. The long-term mean concentrations in a number of these studies have been below the current State annual average standard of 30 mg/m3 PM10. For example, in its last review of the Federal PM standard, the U.S. EPA (1996) used three different approaches to help determine possible cutpoints, or levels of concern in PM concentrations: the lower limit of detection, the minimum mean concentration, and the visual interpretation. Though they indicate there is little evidence of a threshold from a population exposure point of view, these approaches point to a range of 20 to 40 mg/m3 PM10 based on short-term exposure studies, and 24 to 32 mg/m3 based on long-term exposure studies. For example, recently Schwartz (2000) reported an association between PM10 and mortality among persons 65 years of age and older in 10 U.S. cities collecting daily PM10 concentrations. Mean PM10 over an eight-year period ranged from 27 to 41 mg/m3. Among the many epidemiological studies published on PM10 health effects, several demonstrate effects at lower levels. For example, associations between PM10 and hospital admissions for respiratory disease have been reported at ambient concentrations near the current California annual average standard including Schwartz (1995) in Tacoma (mean 24-hr average PM10 concentration = 36 mg/m3), Schwartz (1994) in Minneapolis (mean 24-hr average PM10 concentration = 36 mg/m3) and Bremner et al. (1999) in London (mean 24-hr average PM10 concentration = 29 mg/m3). Associations between cardiovascular hospital admissions and relatively low concentrations of PM10 were reported by Schwartz (1999) for eight U.S. counties. Sheppard et al. (1999) reported an association between asthma hospital admissions and PM10 in Seattle (mean 24-hr average PM10 concentration = 27 mg/m3). Associations between PM10 and adult asthma symptoms at relatively low ambient concentrations have been reported by Ostro et al. (1991) in Denver (mean 24-hr average PM10 concentration = 22 mg/m3). Finally, associations between low concentrations of PM10 and decrements in lung function have been reported by Timonen and Pekkanen (1997) and Vedal et al. (1998) in Finland (mean 24-hr average PM10 concentration = 18 mg/m3), and British Columbia (median 24-hr average PM10 concentration = 22 mg/m3), respectively. The studies cited above relating PM10 to increased mortality and hospital admissions primarily reflect effects on the elderly or people with chronic heart or lung conditions. However, they may also include, to a lesser extent, impacts on children and infants, as well. Studies specifically involving children below age 14 suggest small reductions in lung function, exacerbation of asthma, and increased medical or hospital visits associated with PM10 or PM in general (U.S. EPA, 1998). For example, among studies conducted using U.S. data, short-term exposure to PM10 has been associated with asthma exacerbation in Los Angeles (Ostro et al., 1995), cough among non-asthmatic children (Schwartz et al., 1994), and lung function (Hoek et al., 1998). In addition, several studies have reported effects on children resulting from chronic exposure to PM. For example, in a study conducted in southern 27 California, associations have been reported between PM10 and both measures of lung function and exacerbation of asthma in children (Peters et al, 1999; McConnell et al., 1999). Long-term exposure to PM10 has also been associated with both decrements in lung function and increased bronchitis in children (Raizenne et al., 1996; Dockery et al., 1989). In addition, both time-series using short-term exposure and cross-sectional studies incorporating longer-term exposure demonstrate associations between PM and adverse outcomes in young children and infants. Most of these time-series studies, indicating a mortality effect, have been conducted outside of the United States in cities such as Mexico City and Bangkok, Thailand, which have mean and peak concentrations of PM much higher than those observed in the U.S. Cross-sectional studies of the impact of PM on infant health have also been conducted primarily on data from outside the U.S. and include effects such as infant mortality, low birth weight and gestational age, and sudden infant death syndrome. As for the other outcomes listed above, no study has provided evidence of a threshold concentration below which these outcomes would not occur. Taken together, the available evidence suggests that significant adverse health effects may occur among both children and adults when ambient PM10 concentrations are at or near the current State standards. This conclusion is based primarily on the results of numerous epidemiological studies conducted throughout the world, which (despite local differences in pollutant sources and co-pollutants) produce a picture of remarkable consistency. However, the role of particle size and the identification of the biologically active constituents of PM10 are unknown, as are the biological mechanisms of action. In addition, the chemical and size distributions in California are quite different from those found in other parts of the U.S. During a formal review of the standard, these issues will be examined. References Bremner SA, Anderson HR, Atkinson RW et al. (1999) Short-term associations between outdoor air pollution and mortality in London 1992-4. Occup Environ Med 56:237-244. Dockery DW (1989), Speizer FE, Stram DO, Ware JH, Spengler JD, Ferris BG, Jr. (1989) Effects of inhalable particles on respiratory health of children. Am Rev Respir Dis 139:587 594. Janssen NA, Hoek G, Brunekreef B, Harssema H, Mensink I, Zuidhof A. (1998). Personal sampling of particles in adults: relation among personal, indoor, and outdoor air concentrations. Am J Epidemiol 147(6): 537-47. Hoek G, Dockery DW, Pope A, Neas L, Roemer W, Brunekreef B. (1998) Associations between PM10 and decrements in peak expiratory flow rates in children: reanalysis of data from five panel studies. Eur Respir J 11:1307-1311. McConnell R, Berhane K, Gilliland F, London SJ, Vora H, Avol E, Gauderman WJ, Margolis HG, Lurmann F, Thomas DC, Peters JM. (1999) Air pollution and bronchitic symptoms in southern California children with asthma. Environ. Health Perspect. 107: 757-760. Ostro B, Lipsett M, Mann J Braxton-Owens H, White MC (1995) Air pollution and asthma exacerbation among African-American children in Los Angeles. Inhal Tox 7:711-722. Ostro BD, Lipsett MJ, Weiner MB, Selner JC (1991) Asthmatic responses to airborne acid aerosols. Am J Public Health 81:694-702. 28 Peters JM, Avol E, Gauderman WJ, Linn WS, Navidi W, London SJ, Margolis H, Rappaport E, Vora H, Gong H Jr, Thomas DC. (1999) A study of twelve Southern California communities with differing levels and types of air pollution: II. Effects on pulmonary function. Am J Respir Crit Care Med 159:768-775. Raizenne M, Neas LM, Damokosh AI, Dockery DW, Spengler JD, Koutrakis P, Ware JH, Speizer FE (1996) Health effects of acid aerosols on North American children: pulmonary function. Environ Health Perspect 104:506-514. Schwartz J (1994) PM10, ozone, and hospital admissions for the elderly in Minneapolis, MN. Arch Environ Health 49:366-374. Schwartz J (1995) Short-term fluctuations in air pollution and hospital admissions of the elderly for respiratory disease. Thorax 50:531-538. Schwartz J (1999) Air pollution and hospital admissions for heart disease in eight U.S. counties. Epidemiology 10:17-22. Schwartz, J (2000) The distributed lag between air pollution and daily deaths. Epidemiol 11:320-326. Schwartz J, Dockery DW, Neas LM et al. (1994) Acute effects of summer air pollution on respiratory symptom reporting in children. Am J Respir Crit Care Med 150:1234-12421. Sheppard L, Levy D, Norris G et al. (1999) Effects of ambient air pollution on nonelderly asthma hospital admissions in Seattle, Washington 1987-1994. Epidemiology 10:23-30. Timonen KL, Pekkanen J (1997) Air pollution and respiratory health among children with asthmatic or cough symptoms. Am J Respir Crit Care Med 156:546-552. U.S. EPA (1995). Air Quality Criteria for Particulate Matter (Draft). EPA/600/AP-95/001. U.S. Environmental Protection Agency. Washington, DC 20460 (Apr). U.S. EPA (1996) Review of the National Ambient Air Quality Standards for Particulate Matter: Policy Assessment of Scientific and Technical Information. OAQPS Staff Paper. EPA 452\R-96-013. Research Triangle Park, NC (July) U.S. EPA (1998). Air Quality Criteria for Particulate Matter. EPA/600/P-99/002. Environmental Protection Agency. Washington, DC 20460 (Oct). U.S. Vedal S, Petkau J, White R, Blair J (1998) Acute effects of ambient inhalable particles in asthmatic and nonasthmatic children. Am J Respir Crit Care Med 157:1034-1043. 29 4.2.2 4.2.2.1 Sulfates Summary The review of the scientific literature on sulfates indicates that clinically significant effects may occur when ambient sulfate concentrations are below the current State standard of 25 mg/m3 (24-hour average). The review suggests several factors that may render children more susceptible to sulfates, including greater amounts of time spent outdoors and greater activity levels. Many epidemiological studies suggest that children may experience adverse responses from exposure to current ambient concentrations of sulfates, including changes in lung function, respiratory symptoms, asthma exacerbation, hospital admissions, and premature mortality. In addition, since sulfates are constituents of PM10 and the fine particulate mode (i.e., particulate matter < 2.5 microns in diameter), the health effects attributed to exposure to these measures of particulate matter may also be applicable to sulfates (See section 4.2.1). A threshold for these effects has not been demonstrated for sulfates. Since sulfates are a subspecies of PM10, the sulfate standard should be reviewed along with the PM10 standard and afforded a high priority. 4.2.2.2 Review of the health assessment Sulfates are generally defined as the atmospherically transformed products of sulfur dioxide, including strong acids and sulfate salts. Although both clinical and epidemiological studies have been conducted on sulfates, the strongest evidence of an effect is provided by several dozen epidemiological studies suggesting an association between sulfates, broadly defined, and several adverse health outcomes. However, the sulfate ion itself may not be a causal factor in these associations since ambient sulfate concentrations are a measure of several compounds, including strong acids such as sulfuric acid and, more commonly, ammonium bisulfate. These acidic aerosols are often represented in epidemiological studies by strong acid hydrogen ion (H+). Generally, controlled clinical studies of various sulfates have not detected significant respiratory effects at concentrations near the current ambient standard. However, there is evidence from these studies to indicate that, at high concentrations, strong acids produce functional and structural changes in the human respiratory system, including decrements in lung function, slowing of mucociliary clearance, increased airway responsiveness and respiratory symptoms (Lippmann and Thurston, 1996). These studies indicate that healthy subjects experience only modest changes in respiratory mechanics following single exposures to sulfuric acid at levels orders of magnitude (500 – 1,000 mg/m3) above the current standard. Asthmatics appear to be more sensitive than healthy subjects to the effects of acid aerosols, but the effective dose (concentration x duration x ventilation rate) differs widely among available studies. Generally, asthmatic subjects experience modest bronchoconstriction after exposure to 400 – 1000 mg/m3 of sulfuric acid. In addition, there is some evidence that adolescent asthmatics may be more sensitive than adults. For example, mild bronchoconstriction was reported after short exposures to as low as 68 mg/m3 sulfuric acid in exercising adolescent asthmatics and 90 mg/m3 in exercising adult asthmatics, although other researchers have not found effects at such low levels of exposure. Several studies have failed to find effects in asthmatics (U.S. EPA, 1996). Available epidemiological evidence for sulfates suggests associations with premature mortality, primarily among the elderly and those with chronic heart or lung disease, from both daily (Schwartz et al., 1996; Gwynn et al, 2000) and long-term (over several years) exposure (Dockery et al., 1993; Pope et al., 1995). The mean ambient sulfate concentrations in the two 30 short-term exposures were both around 6 mg/m3, while the mean concentrations in the two multi-city long-term studies ranged from 5 to 13 mg/m3 and 4 to 24 mg/m3, respectively. Associations have been reported between sulfates and hospital admissions for respiratory disease (Gwynn et al, 2000; Thurston et al., 1994; Burnett et al. 1994), asthma exacerbation in children and nonasthmatic respiratory symptoms (Ostro 1990; Ostro et al., 1991), and bronchitis in children (Dockery et al., 1996). In all of these cases, the mean 24-hr sulfate concentration was well below 25 mg/m3. Since sulfate is included within the fine particulate mode (i.e., < 2.5 microns in diameter or PM2.5), the health effects attributed to exposure to PM2.5 mass may be extended to sulfates, unless only the nonsulfate portion of PM2.5 is biologically active. In many parts of the country, sulfates appear to constitute 50% of the PM2.5 mass. PM2.5 has only recently been monitored on a regular basis, but typically is highly correlated with PM10. This relationship and the fact that more of the smaller particles will penetrate into the deep lung, have led many to speculate that the health effects associated with PM10 in epidemiological studies may be driven by PM2.5 (U.S. EPA, 1996b). Thus, potential effects of sulfates may be inferred not only from those studies in which these substances have been directly measured, but also from studies using PM2.5 (and indirectly, from those studies using PM10) as the particulate exposure metric. There is also a wide array of adverse health outcomes attributed to PM2.5, which may have implications for exposure to sulfates. Among the more severe outcomes is premature mortality from both short-term (Schwartz et al., 1996) and long-term exposure (Pope et al., 1995; Dockery et al., 1993). For cities included in these studies, the annual average of PM2.5 ranged from 9 to 34 mg/m3. Again, these findings apply primarily, although not exclusively, to the elderly and those with chronic heart or lung conditions. PM2.5 has also been directly associated with increased respiratory symptoms and decreased lung function (U.S. EPA, 1996b). The mean PM2.5 concentration for these studies ranged from 11 to 30 mg/m3. In a study conducted in Santa Clara County, California, Fairley (1999) found associations between PM2.5 and mortality at a mean concentration of 13 mg/m3. Among the morbidity effects, an association between PM2.5 and emergency room visits for children was reported for Seattle, with a mean PM2.5 concentration of 12 mg/m3 (Norris et al, 1999). It is unclear why epidemiological studies appear to find several different adverse effects associated with exposure to current ambient concentrations of sulfates, while human clinical studies fail to find such effects. This may be a result of self-selection in the clinical studies as well as deliberate exclusion of potentially susceptible subjects, such as poorly controlled asthmatics, young children, and individuals with severe heart or lung disease. In addition, the effective doses used in the clinical studies may be insufficient to trigger a response in the (basically healthy) or the studies may be underpowered. It may also be the case that in epidemiologic studies sulfates are only a surrogate for some other, correlated component of PM10. There is also evidence for an interactive effect of sulfates and other pollutants. For example, in a toxicological study of rats exposed to a concentration mixture of ozone and sulfuric acid-coated carbon particles (0.2 ppm, and 50 mg/m3, respectively), Kleinman et al. (1999) found that exposure to ozone and sulfuric acid-coated particles generated an inflammatory response that was greater than the response to either pollutant alone. In addition, in a human chamber experiment with asthmatic subjects, Frampton et al. (1995) found that prior exposure to 100 mg/m3 sulfuric acid aerosol may enhance the subsequent 31 response to ozone (at 0.08 ppm) in adult asthmatics. Though the relevance of these studies to effects that might occur at current ambient conditions is uncertain, they suggest that exposure to sulfuric acid (and possibly other sulfates) may heighten the impact of subsequent exposure to other pollutants. Taken together, the available evidence from sulfate studies, as well as those using PM2.5 mass as the measure of exposure to PM, suggests the possibility of significant health effects below the current State standard for sulfates. However, since sulfates are a component of both PM2.5 and PM10, the necessity for an independent sulfate standard in California should be examined within the context of the review of the PM10 standard, which may have implications for establishing a standard for smaller sized particles such as PM2.5. An appropriately designed PM standard should provide protection from exposure to sulfates, as well. References Burnett, RT, Dales RE, Raizenne ME, Krewski D, Summers PW, Roberts GR, Raad-Young M, Dann T, Brook J (1994) Effects of low ambient levels of ozone and sulfates on the frequency of respiratory admissions to Ontario hospitals. Environ Res 65:172-94. Dockery, DW., Pope, III, CA., Xu, X., Spengler, JD, Ware, JH, Fay, ME, Ferris, Jr., BG. And Speizer, F.E. (1993). An association between air pollution and mortality in six U.S. cities. N. Engl. J. Med. 329: 753-1759. Dockery DW; Cunningham J.; Damokosh AI.; Neas, L. M.; Spengler, J. D.; Koutrakis, P.; Ware, J. H.; Raizenne, M.; Speizer, F. E. (1996) Health effects of acid aerosols on North American children: respiratory symptoms. Environ. Health Perspect: 1996 May;104(5):500 5. Fairley D (1999) Daily mortality and air pollution in Santa Clara County, California: 1989-1996. Environ Health Perspect 107:637-641. Gwynn RC, Burnett RT, Thurston GD. A time-series analysis of acidic particulate matter and daily mortality and morbidity in the Buffalo, New York, region. Environ Health Perspect. 2000 Feb;108(2):125-33. Kleinman MT, Mautz WJ, Bjarnason S. (1999) Adaptive and Non-adaptive Responses in Rats Exposed to Ozone, Alone and in Mixtures, with Acidic Aerosols. Inhal Toxicol. 1999;11:249-264. Lippmann M, Thurston GD (1996). Sulfate concentrations as an indicator of ambient particulate matter air pollution for health risk evaluations. J Expos Anal Environ Epidemiol 6(2):123-146. Norris G, Young-Pong SN, Koenig JQ, Larson TV, Sheppard L, Stout JW. (1999) An association between fine particles and asthma emergency department visits for children in Seattle. Environ. Health Perspect. 107:489-493. Ostro, B.D. (1990). Associations between morbidity and alternative measures of particulate matter. Risk Anal. 10: 421-427. Ostro BD, Lipsett MJ, Wiener MB, Selner JC (1991). Asthmatic response to airborne acid aerosols. Am J Public Health 81:694-702. 32 Pope CA III, Thun MJ, Namboodiri M, Dockery DW, Evans JS, Speizer FE, Heath CW Jr. (1995). "Particulate air pollution is a predictor of mortality in a prospective study of U.S. adults." Am. J. Respir. Crit. Care Med. 151:669-674. Schwartz J; Dockery DW, Neas LM. (1996) Is daily mortality associated specifically with fine particles? J. Air Waste Manage. Assoc. 46: 927-939. Schwartz, J (2000) The distributed lag between air pollution and daily deaths. Epidemiol 11:320-326. Thurston GD, Ito K, Hayes CG, Bates DV, Lippmann M. (1994). "Respiratory hospital admissions and summertime haze air pollution in Toronto, Ontario: Consideration of the role of acid aerosols." Environ. Res. 65: 271-290. U.S. EPA (1996a) Air Quality Criteria for Particulate Matter. EPA/600/P-95/001cF. Office of Research and Development, Washington, DC. April. U.S. EPA (1996b) Review of the National Ambient Air Quality Standards for Particulate Matter: Policy Assessment of Scientific and Technical Information. OAQPS Staff Paper. EPA 452\R-96-013. Research Triangle Park, NC (July) U.S. EPA (1998). Air Quality Criteria for Particulate Matter. EPA/600/P-99/002. U.S. Environmental Protection Agency. Washington, DC 20460 (Oct). 33 4.2.3 4.2.3.1 Ozone Summary The review of the scientific literature on ozone indicates the potential for biologically significant effects when exposure concentrations are at or below 0.09 ppm (the current State standard (1-hr average)). The review suggests several factors that may render children and young adolescents more susceptible to ozone exposure, including activity and exposure patterns, higher doses per unit of body weight and lung surface area, and the potential for effects on lung growth and development. Controlled exposure studies, which have mainly been conducted with adult subjects, indicate that multi-hour ozone exposures at concentrations as low as 0.08 ppm have resulted in significant transient decreases in lung function, increases in respiratory symptoms and airway responsiveness, as well as cellular and biochemical evidence of airway injury and inflammation. Epidemiological studies suggest effects on lung function, asthma exacerbations, increased use of hospital emergency departments, and other indicators of acute respiratory morbidity in adults and children at ozone concentrations lower than 0.09 ppm. Several recent studies also suggest potential long term effects on lung function related to cumulative lifetime exposure to ozone, though how these findings may relate to daily average exposures is unknown. A large fraction of California’s population resides in areas in which ozone concentrations occur at or above the current State standard, primarily during daylight hours in the summer. Based on a considered assessment of these factors, the ozone ambient air quality standard was prioritized to the first tier of review. 4.2.3.2 Review of the health assessment The California ozone standard is based primarily on controlled human exposure studies and epidemiological investigations, with some supportive evidence from animal toxicology experiments. Therefore, for the purposes of the SB25 review, OEHHA has focused on research involving human subjects exposed to ozone in controlled settings, in field studies, and in epidemiological investigations. Since 1987, several controlled exposure studies in adults published by U.S. EPA investigators document effects of multi-hour (6.6 hr) exposures on lung function, respiratory symptoms, airway responsiveness, and inflammation at ozone concentrations as low as 0.08 ppm (Folinsbee et al. 1988, 1994; Horstman et al. 1990; McDonnell et al 1991). At each concentration, there was a progressive decrease in lung function during the exposure, measured as FEV1 (forced expiratory volume in one second), with statistically significant mean decrements at the end of the exposures of 7 - 8%, 5 - 11%, and 13% for 0.08, 0.10 and 0.12 ppm, respectively (there were 2 experiments using 0.08 and 0.10 ppm ozone). Some individuals showed declines as great as 50%. There is no specific FEV1 cut-point demarcating what constitutes a physiologically significant decrement in lung function; however, historically FEV1 decrements greater than 10% have been considered adverse, particularly when coupled with respiratory symptoms (U.S. EPA, 1996). The proportions of subjects with decreases in FEV1 > 10% in all the U.S. EPA multi-hour exposure experiments were 26%, 31%, and 46% after exposures to 0.08, 0.10 and 0.12 ppm, respectively (Folinsbee et al. 1994). Moreover, there were significant increases in respiratory symptoms (cough, chest tightness) and in airway responsiveness (a measure of the lung’s reactivity to a variety of irritants) after exposure to each concentration as well. In an experiment involving young adult males (aged 18-35), significant increases in the quantities of a variety of cellular and biochemical markers of airway injury and inflammation were identified in bronchoalveolar lavage fluid collected 18 hours after a 6.6-hr exposure to either 0.08 or 0.10 ppm ozone (Devlin et al. 1991). 34 These U.S. EPA studies were intended to mimic exposures likely to be experienced by outdoor workers and convincingly demonstrated the importance of exposure duration in the elicitation of ozone-related effects. The acute toxicity of ozone appears to be due to the shortterm cumulative dose (or “effective dose”) inhaled, which is roughly proportionate to the product of the ozone concentration, the exposure duration and the subjects’ ventilation or breathing rate. Earlier studies had involved exposure durations of one or two hours and, even though subjects in several experiments sustained high ventilation rates, no compelling evidence of lung function changes or symptoms had been demonstrated below 0.12 ppm ozone, which was somewhat at variance with the epidemiological results. There is considerable inter-individual variability in responsiveness (lung function and symptoms) to ozone, with up to 25-30% of study populations experiencing markedly greater effects than other subjects. For a given dose of ozone, inter-subject differences in FEV1 decrements may be 10-fold or greater. These results are highly reproducible over periods from 3 weeks to 14 months, which suggests the existence of an intrinsic responsiveness to ozone (McDonnell 1985; Gliner 1983). The degree of ozone responsiveness, as measured by lung function changes, does not correspond to the extent of ozone-related inflammation (Aris 1993; Balmes 1996). Although the determinants of individual ozone susceptibility are not well understood, increasing age and current cigarette smoking seem to blunt ozone’s acute effects (McDonnell 1993; Drechsler 1989; Frampton 1997). Ozone’s effects on asthma are addressed below. There are several lines of evidence suggesting that children may constitute a potentially vulnerable subpopulation with respect to ozone toxicity, most of which relate to their spending more time outdoors engaged in vigorous activities than older adolescents and adults (Wiley et al. 1991; see also section 3.6, above). Moreover, for any given level of activity, children (more so than infants) will have a greater breathing rate, and therefore a greater dose of ozone delivered to the lung on a weight basis than will adults (See Figure 1 of Tager and Balmes 2000, Appendix C to this review). Thus, because of both exposure patterns and respiratory physiology, children are more likely to receive proportionately greater exposure to ozone than adults. Although almost all of the controlled exposure studies of ozone toxicity conducted since 1987 have involved adults, there is no reason to think that the results of these studies should not be extended to children as well. Therefore, to the extent that children may be subject to prolonged exposures to ozone concentrations comparable to those used in the above controlled exposure investigations, they may well be at risk for decrements in lung function, respiratory symptoms, increased airway responsiveness, and respiratory tract inflammation. Two field studies conducted in Germany found evidence of inflammation of the upper respiratory tract in approximately 200 children, with statistically significant increases in markers of inflammation when the daily half-hour maximum was > 0.09 ppm ozone compared with days when the daily half-hour maximum was < 0.07 ppm (Frischer et al. 1993; Kopp et al. 1999). Several investigations have also reported that, for a given ozone concentration, children appear to be less likely to report symptoms than adults, suggesting that they may be less aware or able to recognize somatic warnings to curtail exposure. In addition, there is reason to believe, based on animal experiments, that repeated episodes of injury and inflammation may lead to long-term damage to the developing respiratory tract, there is as yet no compelling evidence of this in humans, two recent studies provide some support for this proposition (Kunzli 1998; Galizia 1999; see below). 35 Since 1987, the results of two controlled exposure studies have been published involving adolescents (including some subjects with mild asthma) (Koenig 1987, 1988). The lowest exposure concentration used was 0.12 ppm for either 30 minutes or one hour. In one study there was no effect on lung function in either the asthmatics or the nonasthmatics, while in the other there was a statistically significant decrease in one measure of lung function related to the caliber of the small airways. In neither case was there evidence that the adolescents were differentially susceptible to the bronchoconstrictive effects of ozone than adults, which was consistent with earlier work addressed in the 1987 review of the California ambient ozone standard. In 1996, the U.S. EPA undertook an exhaustive review of the epidemiological literature on ozone, and based on its evaluation of all the evidence, articulated the following: “Children who are active outdoors... appear to be the at-risk population group examined with the highest percentage and number of individuals exposed to O3 concentrations at and above which there is evidence of health effects, particularly for 8-hour average exposures at moderate O3 concentrations > 0.08 ppm.” (US EPA 1996). More recent studies indicate potential effects may also occur at concentrations lower than 0.08 ppm. Recent field studies suggest potential thresholds of between 0.04 and 0.08 ppm (1-hr average) for effects on lung function in children exercising for 1 hour on a treadmill in Mexico City (Castillejos et al. 1995 - see figure 4 in Tager and Balmes 2000, Appendix D to this review). Similarly, in an epidemiological study of lung function of children in Taiwan, ozone had a significant effect on lung function, but only when one-hour peaks exceeded 0.06 ppm (Chen et al. 1999). In a study of adult hikers in New Hampshire, where the 1-hour ozone maximum concentration did not exceed 0.074 ppm, Korrick et al (1998) reported similar relationships between ozone levels and lung function, with an apparent threshold at an ozone concentration between 0.04 and 0.055 ppm, (see figure 5 in Tager and Balmes 2000, in Appendix C to this review). Other studies of lung function in women in Virginia and in berrypickers in British Columbia, as well as emergency room visits for asthma in New Brunswick, Canada, also suggest population-level effects of ozone when 1-hour ambient concentrations are lower than 0.09 ppm (Stieb et al. 1996, Naeher et al. 1999, Brauer et al. 1996). Cross-sectional epidemiological data from the Children’s Health Study in 12 southern California communities suggest no effect of average 1-hr peak ozone on a variety of chronic respiratory symptoms or on most measures of lung function, except for peak expiratory flow (PEFR) and maximum mid-expiratory flow (FEF25-75). However, two recent studies of college freshmen at U.C. Berkeley and at Yale both suggest that increasing lifetime exposure to ozone may permanently affect lung function, particularly in measurements of flows governed by the dimensions of the small airways (Kunzli et al. 1998; Galizia et al. 1999). While these latter two studies provide evidence consistent with ozone dosimetry studies and the sites of ozonerelated lung injury in experimental animals, they need to be confirmed with larger studies before drawing any causal inferences. Moreover, assuming the existence of a causal relationship, it is not clear whether the observed decrements in lung function may have been due to peak concentrations higher than the reported mean ozone levels, to the cumulative lifetime ozone dose regardless of peak exposures, or to some other measure of exposure. Autopsies of young adults in Los Angeles who died from violent injuries suggest the presence of chronic lung (centriacinar) inflammation, even in nonsmokers, providing circumstantial 36 histological evidence supporting the findings of lung function decrements in college students (Sherwin et al. 1998, 2000). Asthma is a disease characterized by chronic inflammation of the airways, with episodic exacerbation of symptoms and decreased lung function. In controlled exposure studies, adult asthmatics appear to be more susceptible to the inflammatory effects of lowlevel ozone than nonasthmatics (Basha et al 1994; Scannell et al. 1996). Several studies suggest that short (1-hour) ozone exposure at concentrations of 0.12 ppm or higher can render allergic adult asthmatics more susceptible to allergen exposure, though these results are not entirely consistent (Molfino et al. 1991; Ball et al. 1996). Some controlled exposure studies, as well as several field studies, suggest that there may be some interaction between ozone and other pollutants at low ambient concentrations; however, in general, most studies do not show effects greater than those attributable to ozone alone (Koenig et al. 1990, 1994; Linn et al 1995, 1997). There appears to be evidence for a variety of health effects of exposure to ambient ozone at concentrations lower than the current State standard of 0.09 ppm, although these appear to be related to exposures lasting longer than one hour, the averaging time of the standard. On the other hand, exposure durations greater than one hour are routine in urban and suburban areas. Multi-hour controlled exposure studies using ozone concentrations as low as 0.08 ppm indicate progressive adverse effects on the lung (respiratory symptoms, decreased lung function, increased airway responsiveness, and evidence of intra-pulmonary inflammation) with increasing duration of exposure. In these multi-hour investigations, the effects observed at 0.08 ppm were of lesser magnitude than those seen at 0.12 ppm; nevertheless, similar effects may be expected to occur at lower exposure concentrations of similar or greater durations. Moreover, in the controlled exposure studies the subjects are selfselected and generally do not include substantial numbers of “susceptible” individuals whose experience might be captured in epidemiological investigations (e.g., asthmatics who are experiencing a flare-up of their condition). While clinical studies have been inconclusive, epidemiological studies suggest that effects may occur at ambient ozone concentrations below 0.09 ppm. Nevertheless, even though in these studies the results have typically been presented in terms of peak one-hour averages, the exposures experienced by the study subjects are likely to have exceeded one hour. Most of the acute effects observed are thought to be related to the cumulative short-term dose of ozone inhaled over the course of the day, with some carry-over from prior days’ exposures. The effects most consistently reported at low ambient concentrations in the epidemiological studies include decrements in several measures of lung function. In the absence of symptoms, the biological significance of such effects on lung function is uncertain. Chronic effects on lung function, such as those suggested in the reports by Kunzli et al. (1998) and Galizia et al. (1999), would clearly be important from a public health standpoint; however, the relationships between short-term responses and chronic changes require further study. References Aris RM, Christian D, Hearne PQ, Kerr K, Finkbeiner WE, Balmes JR. Ozone-induced airway inflammation in human subjects as determined by airway lavage and biopsy. Am Rev Respir Dis 1993;148:1363-1372. Ball BA, Folinsbee LJ, Peden DB, Kehrl HR. Allergen bronchoprovocation of patients with mild asthma after ozone exposure. J Allergy Clin Immunol 1996;98:563-72. 37 Balmes JR, Chen LL, Scannel C, Tager I, Christian D et al. Ozone-induced decrements in FEV1 and FVC do not correlate with measures of inflammation. Am J Respir Crit Care Med 1996;153: 904-909. Brauer M, Blair J, Vedal S. Effect of ambient ozone exposure on lung function in farm workers. Am J Respir Crit Care Med 1996;154(4 Pt 1):981-7. Castillejos M, Gold DR, Damokosh AI, Serrano P, Allen G, McDonnell WF, et al. Acute effects of ozone on the pulmonary function of exercising schoolchildren from Mexico City. Am J Respir Crit Care Med 1995;152(5 Pt 1):1501-7. Chen PC, Lai YM, Chan CC, Hwang JS, Yang CY, Wang JD. Short-term effect of ozone on the pulmonary function of children in primary school. Environ Health Perspect 1999;107:921-5. Devlin R, McDonnell W, Mann R, Becker S, House D, Schreinemachers D, et al. Exposure of humans to ambient levels of ozone for 6.6 hours causes cellular and biochemical changes in the lung. Am J Respir Cell Mol Biol 1991;4:72-. Drechsler-Parks DM, Bedi JF, Horvath SM. Pulmonary function responses of young and older adults to mixtures of O3, NO2, and PAN. Toxicol Ind Health 1989;5:505-517 Folinsbee L, McDonnell W, Horstman D. Pulmonary function and symptom responses after 6.6 hour exposure to 0.12 ppm ozone with moderate exercise. J Air Poll Control Assoc 1988;38:28-35. Folinsbee LJ, Horstman DH, Kehrl HR, Harder S, Abdul-Salaam S, Ives PJ. Respiratory responses to repeated prolonged exposure to 0.12 ppm ozone. Am J Respir Crit Care Med 1994;149:98-105. Frampton MW, Morrow PE, Torres A, Cox C, Voter KZ, Utell MJ. Ozone responsiveness in smokers and nonsmokers. Am J Respir Crit Care Med 1997;155:116-121. Frischer TM, Kuehr J, Pullwitt A, Meinert R, Forster J, Studnicka M, et al. Ambient ozone causes upper airways inflammation in children. Am Rev Respir Dis 1993;148(4 Pt 1):961 4. Galizia A, Kinney PL. Long-term residence in areas of high ozone: associations with respiratory health in a nationwide sample of nonsmoking young adults. Environ Health Perspect 1999;107:675-9. Gliner JA, Horvath SM, Folinsbee LJ. Pre-exposure to low ozone concentrations does not diminish the pulmonary function response on exposure to higher ozone concentrations. Am Rev Respir Dis 1983;127:51-55. Horstman DH, Folinsbee LJ, Ives PJ, Abdul-Salaam S, McDonnell WF. Ozone concentration and pulmonary response relationships for 6.6-hour exposures with five hours of moderate exercise to 0.08, 0.10 and 0.12 ppm. Am Rev Respir Dis 1990;142:1156-63. Kinney PL, Nilsen DM, Lippmann M, Brescia M, Gordon T, McGovern T, et al. Biomarkers of lung inflammation in recreational joggers exposed to ozone. Am J Respir Crit Care Med 1996;154:1430-35. 38 Kinney PL, Thurston GD, Raizenne M. The effects of ambient ozone on lung function in children: a reanalysis of six summer camp studies. Environ Health Perspect 1996;104:170 4. Koenig JQ, Covert DS, Hanley QS, van Belle G, Pierson WE. Prior exposure to ozone potentiates subsequent response to sulfur dioxide in adolescent asthmatic subjects. Am Rev Respir Dis 1990;141:377-80. Koenig JQ, Covert DS, Marshall SG, Van Belle G, Pierson WE. The effects of ozone and nitrogen dioxide on pulmonary function in healthy and in asthmatic adolescents. Am Rev Respir Dis 1987;136:1152-7. Koenig JQ, Covert DS, Pierson WE, Hanley QS, Rebolledo V, Dumler K, et al. Oxidant and acid aerosol exposure in healthy subjects and subjects with asthma. Part I: Effects of oxidants, combined with sulfuric or nitric acid, on the pulmonary function of adolescents with asthma. Health Effects Institute Research Report 1994(70):1-36. Koenig JQ, Covert DS, Smith MS, van Belle G, Pierson WE. The pulmonary effects of ozone and nitrogen dioxide alone and combined in healthy and asthmatic adolescent subjects. Toxicol Industr Health 1988;4:521-32. Kopp MV, Ulmer C, Ihorst G, Seydewitz HH, Frischer T, Forster J, et al. Upper airway inflammation in children exposed to ambient ozone and potential signs of adaptation. Eur Respir J 1999;14:854-61. Korrick SA, Neas LM, Dockery DW, Gold DR, Allen GA, Hill LB, et al. Effects of ozone and other pollutants on the pulmonary function of adult hikers. Environ Health Perspect 1998;106:93-9. Kunzli N, Lurmann F, Segal M, Ngo L, Balmes J, Tager IB. Reliablility of life-time residential history and activity measures as elements of cumulative ambient ozone exposure assessment. J Exp Anal Environ Epidemiol 1996;(In press). Linn WS, Anderson KR, Shamoo DA, Edwards SA, Webb TL, Hackney JD, et al. Controlled exposures of young asthmatics to mixed oxidant gases and acid aerosol. Am J Respir Crit Care Med 1995;152:885-91. Linn WS, Gong H, Jr., Shamoo DA, Anderson KR, Avol EL. Chamber exposures of children to mixed ozone, sulfur dioxide, and sulfuric acid. Arch Environ Health 1997;52:179-87. McDonnell WF, Horstman DH, Abdul-Salaam S, House DE. Reproducibility of individual responses to ozone exposure. Am Rev Respir Dis 1985;131:36-40. McDonnell WF, Kehrl HR, Abdul-Salaam S, Ives PJ, Folinsbee LJ, Devlin RB, et al. Respiratory response of humans exposed to low levels of ozone for 6.6 hours. Arch Environ Health 1991;46:145-50. McDonnell WF, Muller KE, Bromberg PA, Shy CM. Predictors of individual differences in acute response to ozone exposure. Am Rev Respir Dis 1993;147:818-825. Molfino N, Wright SC, Katz I, Tarlo S, Silverman F, McClean PA, et al. Effect of low concentration of ozone on inhaled allergen responses in asthmatic subjects. Lancet 1991;338:199-203. 39 Naeher LP, Holford TR, Beckett WS, Belanger K, Triche EW, Bracken MB, et al. Healthy women's PEF variations with ambient summer concentrations of PM10, PM2.5, SO4=2-, H+, and O3. Am J Respir Crit Care Med 1999;160:117-25. Sherwin RP, Richter V, Everson RB, Richters A. Chronic glandular bronchitis in young individuals residing in a metropolitan area. Virchows Arch 1998; 433: 341-348. Stieb DM, Burnett RT, Beveridge RC, Brook JR. Association between ozone and asthma emergency department visits in Saint John, New Brunswick, Canada. Environ Health Perspect 1996;104:1354-60. Tager IB, Balmes JR. Review of California’s Air Quality Standards for Children’s Health Considerations –Ozone. Prepared for the California Office of Environmental Health Hazard Assessment. August 2000. U.S. Environmental Protection Agency. National Ambient Air Quality Standards for Ozone: Proposed Decision. Washington, D.C; 1996 Nov. 29, 1996. Report No.: 40 CFR Part 50. Wiley JA, Robinson JP, Cheng Y-T, Piazza T, Stork L, Pladsen K. Study of Children's Activity Patterns: Final Report. Sacramento: California Air Resources Board; 1991 A733-149 September, 1991. Report No.: A733-149. 40 4.2.4 4.2.4.1 Nitrogen Dioxide Summary Controlled exposure studies of human volunteers generally fail to show effects of exposure to NO2 at or below the current California standard of 0.25 ppm. However, recent studies suggest that exposure to NO2 at concentrations only slightly above 0.25 ppm enhances bronchial or airway responses to challenge with common aeroallergens in subjects with allergic asthma. NO2 exposure could therefore render asthmatics more susceptible to effects from other environmental exposures. Epidemiological studies have reported relationships between both outdoor and indoor NO2 concentrations and a variety of adverse health outcomes, including decrements in lung function, increased risks of respiratory symptoms and illness, exacerbation of asthma, especially in children, and increased risks of daily mortality. However, in many of the epidemiological studies an independent role of NO2 cannot be determined, because of high covariation between NO2 and other pollutants, or because the investigators did not adjust for the effects of important confounders (especially different measures of particulate matter), or both. NO2 may represent a marker for exposure to traffic emissions generally or to combustion-related pollution, or may play an etiologic role in the observed health effects. Though recent trends suggest nearly complete statewide compliance with the current California NO2 ambient air quality standard, the results of some of the recent clinical and epidemiological studies suggest that examination of the basis for the standard is warranted. Based on our consideration of the relevant evidence, notably the potential impacts on asthmatic childhood, the NO2 standard was allocated to the first tier of review. 4.2.4.2 Review of Health Assessment NO2 is produced by high-temperature combustion, particularly of fossil fuels. The primary sources for NO2 include diesel and gasoline-powered engines, as well as industrial point sources, especially power plants. Local urban concentrations of NO2 are related to traffic density; therefore, people working or residing near busy streets, as well as individuals driving in heavy traffic, may be exposed to higher concentrations of NO2 than those indicated by regional air quality monitors. It is important to recognize that outdoor NO2 levels can contribute a substantial fraction of indoor concentrations, up to 50% according to one estimate (Marbury et al., 1988). There is little convincing evidence that exposure of healthy volunteers to NO2 at levels as high as 4.0 ppm is associated with effects on lung function alterations or respiratory symptoms. (See Frampton 2000, Appendix D to this review). NO2 exposures in the range of 1.5-2.0 ppm cause small but significant increases in airway responsiveness in healthy individuals; this effect can be observed in asthmatics at lower exposure concentrations (Mohsenin 1988). Other studies indicate that exposure to NO2 at concentrations well above the ambient standard (2.0 ppm and above) may cause a modest inflammatory response and alterations of lymphocyte subsets in peripheral blood as well as in the airways (Azadniv 1998; Blomberg 1997, 1999; Sandström 1991, 1992). Repeated exposures using 2.0 ppm NO2 appear to result in persistent mild airway inflammation (Blomberg 1999). In contrast, exposure using 0.30 ppm NO2 produced no detectable inflammation in healthy subjects, or in subjects with asthma or chronic obstructive pulmonary disease (COPD) (Vagaggini 1996). Some animal studies seem to show effects on immune function at exposure concentrations near the standard (Richters 1988, 1989). However, overall the clinical studies provide little evidence for effects on lung function, airway inflammation, or host defense 41 impairment in healthy subjects at outdoor ambient exposure concentrations (See Frampton 2000, Appendix D to this review). Among asthmatic study subjects, exposure to as little as 0.10 to 0.60 ppm NO2 has been reported to enhance airway responsiveness but has not typically resulted in increased symptoms or decrements in lung function. However, the numerous studies examining changes in airway responsiveness have been somewhat inconsistent (See Frampton, 2000, Appendix D to this review, and California Air Resources Board 1995). The results of one early study that reported an effect at 0.10 ppm could not be replicated in subsequent investigations (Orehek 1976). The inter-study discrepancies are likely to be related to differences in baseline disease severity of the subjects and differences in study protocols (exposure durations and concentrations, intensity of exercise, methods of assessing airway responsiveness). Although few of these studies have found any immediate symptoms or changes in lung function after low-level NO2 exposures, one implication of increased airway responsiveness is that asthmatics may be rendered more susceptible to the effects of exposure to aeroallergens or to other respiratory irritants. Overall, based on the data from controlled exposure studies, shortterm exposures to NO2 at outdoor ambient concentrations are unlikely to significantly alter lung function or non-specific airway responsiveness in most people with mild asthma. However, outdoor NO2 augments indoor NO2 concentrations, which may reach peak levels that are clinically important for some adults and children with asthma. In addition, several recent investigations indicate that controlled exposures to NO2 at concentrations as low as 0.26 ppm for 30 minutes can enhance the response of allergic asthmatics to subsequent challenge with common inhaled allergens (Tunnicliff 1994; Strand 1997; See Table 3 of Frampton (2000) in Appendix C). These studies are reasonably consistent with each other and with the studies noted above, as well as with animal studies conducted at higher concentrations, and suggest that low-level NO2 may be important in augmenting the expression of allergic asthma. Epidemiological studies have also examined the potential health impacts of both acute and chronic exposures to NO2. There have been numerous investigations examining the relationship of indoor NO2 concentrations or gas stove use to respiratory illness and lung function in adults and children. While these are useful in assessing the potential impacts of NO2 exposure, they are not informative in evaluating the health-protectiveness of the ambient standard. Many studies examining the impact of ambient pollutants have not identified effects of NO2 independent of those of other pollutants. In particular, NO2 often tends to be so highly correlated with one or more measures of particulate matter, carbon monoxide, or both, that the multicollinearity precludes analytical isolation of the effects of NO2. Measurement error of NO2 or other pollutants compounds this problem, as inaccurate measurements will affect interpollutant correlations and make it difficult to control for confounding in the analysis. Some have hypothesized that NO2 may serve as an indicator for a complex mixture of traffic-related pollutants, notably fine particles. However, several studies have noted effects of NO2 independent of other pollutants, as listed below. Ambient NO2 levels have been linked with daily mortality, though many studies show no association (e.g., Zmirou 1996, Ostro 1996). In a cohort of patients with chronic obstructive pulmonary disease in Barcelona, significant associations were reported for daily mortality and 1-hour maximum NO2 as well as 24 hour average NO2 (Garcia-Aymerich et al. 2000). In a Brazilian study of air pollution and mortality among children < age 5, Saldiva et al. (1994) reported that NO2, but not PM10, ozone, SO2, or CO, was associated with an increased risk of mortality. In this study, the mean NO2 (NOx) level was 0.127 ppm. In a more recent study in 42 Sao Paulo, Pereira et al. (1998) found that the strongest single-pollutant predictor of intrauterine mortality was NO2 (see Figure 2 in Frampton (2000) in Appendix D). Peters and colleagues (Peters et al. 2000) reported that ambient NO2 levels in Boston were better predictors of cardiac arrhythmias in subjects with heart disease than were two measures of particles (PM2.5 or black carbon). As in many other epidemiological studies, NO2 may represent a general indicator for local traffic-related pollution. However, the data are also consistent with toxicity related to NO2 as a component of the ambient pollutant mixture. Time-series studies have identified other linkages with ambient NO2 and adverse health events. Associations have been observed in several studies between ambient NO2 levels and emergency visits for asthma in Spain (Tenias et al. 1998), Israel (Garty et al. 1998), and Santa Clara County, California (Lipsett et al. 1997). At least one study suggests the existence of stronger associations between daily air pollution levels (including NO2) and the occurrence of physician visits for asthma and other lower respiratory conditions in children compared with those in adults (Hajat 1999). In a Swiss time-series study of daily respiratory symptoms in children, NO2 exposures were estimated using passive samplers placed outside the residence location and inside in the room where the child spent the most time (BraunFahrlander et al., 1992). Neither indoor nor outdoor NO2 concentration was associated with symptom incidence; however, symptom duration was associated with outdoor NO2 concentrations, supporting the idea that NO2 serves as an indicator for other correlated ambient pollutants. Several studies of the chronic effects of air pollution suggest a potential role for NO2 in relation to children’s lung growth as well as to respiratory symptoms in adults and children; however, the strong correlations of NO2 concentrations with ambient particulate matter make causal inference problematic. For instance, McConnell et al (McConnell et al. 1999), reporting data from the Southern California Children’s Health Study, found positive associations between several indices of air pollution, including NO2, and respiratory symptoms in children with asthma. The strongest association was with NO2 (See Figure 1 in Frampton (2000), in Appendix D to this review). No association was seen for children without asthma. However, particles, NO2, and acids were too highly correlated to allow estimation of individual pollutant effects. Outdoor NO2 (one-week average), but not NO2 measured with personal monitors, was significantly associated with the prevalence of atopy and rhinitis in 9-year-old children in Düsseldorf (Krämer et al. 2000). These results also suggest that a NO2 may be serving as a surrogate for the ambient pollutant mix. The Swiss Study on Air Pollution and Lung Disease in Adults examined the long-term effects of air pollution exposure in a cross-sectional and longitudinal study of 8 areas in Switzerland. Significant associations were observed between symptoms (chronic phlegm, chronic cough, breathlessness at rest, dyspnea on exertion) and both NO2 and particles, while NO2 was also associated with lower lung function indices (FVC and FEV1) (Zemp et al., 1999). However, as NO2 concentrations were strongly correlated with PM10 levels (r = 0.91), the roles of specific pollutants in the observed associations could not be ascertained. In summary, though the clinical studies are somewhat inconsistent in their results, several key recent investigations suggest that at near-ambient levels, NO2 may potentiate the response to aeroallergens in allergic asthmatics. The epidemiological evidence suggests that exposure to traffic or combustion-related pollutants is associated with a variety of adverse health outcomes in adults and children, and that measurements of ambient NO2 may be a good atmospheric marker of exposure. As part of the mixture of outdoor pollutants, NO2 may play a role in causing the observed health effects. In view of the results of recent research, 43 more extensive review and analysis of the literature on NO2 in relation to the current California ambient standard should be considered. References Azadniv M, Utell MJ, Morrow PE, Gibb FR, Nichols J, Roberts NJ Jr, Speers DM, Torres A, Tsai Y, Abraham MK, Voter KZ, Frampton MW (1998). Effects of nitrogen dioxide exposure on human host defense. Inhalation Toxicol. 10:585-602. Blomberg A, Krishna MT, Bocchino V, Biscione GL, Shute JK, Kelly F, Frew AJ, Holgate ST, Sandstrom T. (1997). The inflammatory effects of 2 ppm NO2 on the airways of healthy subjects. Am J Respir Crit Care Med. 156:418-424. Blomberg A, Krishna MT, Helleday R, Soderberg M, Ledin MC, Kelly FJ, Frew AJ, Holgate ST, Sandstrom T. (1999). Persistent airway inflammation but accommodated antioxidant and lung function responses after repeated daily exposure to nitrogen dioxide. Am J Respir Crit Care Med. 159:536-543. Braun-Fahrlander C, Ackermann-Liebrich U, Schwartz J, Gnehm HP, Rutishauser M, Wanner HU. (1992). Air pollution and respiratory symptoms in preschool children. Am Rev Respir Dis. 145:42-47. Castellsague J, Sunyer J, Sáez M, Antó JM. (1995). Short-term association between air pollution and emergency room visits for asthma in Barcelona. Thorax. 50:1051-1056. Frampton M (2000) Nitrogen dioxide: evaluation of current California air quality standards with respect to protection of children. Prepared for the Office of Environmental Health Hazard Assessment. [in Appendix D to this review] Garcia-Aymerich J, Tobias A, Anto JM, Sunyer J. (2000). Air pollution and mortality in a cohort of patients with chronic obstructive pulmonary disease: a time series analysis. J Epidemiol Community Health. 54:73-4. Garty BZ, Kosman E, Ganor E, Berger V, Garty L, Wietzen T, Waisman Y, Mimouni M, Waisel Y. (1998). Emergency room visits of asthmatic children, relation to air pollution, weather, and airborne allergens. Annals of Allergy, Asthma, & Immunol. 81:563-570. Hajat S, Haines A, Goubet SA, Atkinson RW, Anderson HR. (1999). Association of air pollution with daily GP consultations for asthma and other lower respiratory conditions in London. Thorax. 54:597-605. Krämer U, Koch T, Ranft U, Ring J, Behrendt H. (2000). Traffic-related air pollution is associated with atopy in children living in urban areas. Epidemiology 11:64-70. Kuraitis KV, Richters A. (1989). Spleen cellularity shifts from the inhalation of 0.25-0.35 ppm nitrogen dioxide. J Environ Pathol Toxicol. 9:1-11. Lipsett M, Hurley S, Ostro B. (1997). Air pollution and emergency room visits for asthma in Santa Clara County, California. Environ Health Perspect. 105:216-222. Marbury MC, Harlos DP, Samet JM, Spengler JD. (1988). Indoor residential NO2 concentrations in Albuquerque, New Mexico. J Air Poll Contr Assoc. 38:392-398. 44 McConnell R, Berhane K, Gilliland F, London SJ, Vora H, Avol E, Gauderman WJ, Margolis HG, Lurmann F, Thomas DC, Peters JM. (1999). Air pollution and bronchitic symptoms in Southern California children with asthma. Environ Health Perspect. 107:757-760. Mohsenin V. (1987). Airway responses to nitrogen dioxide in asthmatic subjects. J Toxicol Environ Health. 22:371-380. Mohsenin V. (1988). Airway responses to 2.0 ppm nitrogen dioxide in normal subjects. Arch Environ Health. 43:242-246. Orehek J, Massari JP, Gayrard P, Grimaud C, Charpin J. (1976). Effect of short-term, lowlevel nitrogen dioxide exposure on bronchial sensitivity of asthmatic patients. J Clin Invest. 57:301-307. Ostro B, Sanchez JM, Aranda C, Eskeland GS (1996). Air pollution and mortality: Results from a study in Santiago, Chile. J Exp Anal Environ Epidemiol 6(1): 97-114. Pereira LAA, Loomis D, Conceicao GMS, Braga ALF, Arcas RM, Kishi HS, Singer JM, Bohm GM, Saldiva PHN. (1998). Association between air pollution and intrauterine mortality in Sao Paulo, Brazil. Environ Health Perspect. 106:325-329. Peters A, Liu E, Verrier RL, Schwartz J, Gold DR, Mittleman M, Baliff J, Oh JA, Allen G, Monahan K, Dockery DW (2000). Air pollution and incidence of cardiac arrhythmia. Epidemiology. 11:11-17. Postlethwait EM, Langford SD, Bidani A. (1990). Reactive absorption of nitrogen dioxide by pulmonary epithelial lining fluid. J Appl Physiol. 68:594-603 Richters A, Damji KS. (1988). Changes in T-lymphocyte subpopulations and natural killer cells following exposure to ambient levels of nitrogen dioxide. J Toxicol Environ Health. 25:247 256. Richters A, Richters V. (1989). Nitrogen dioxide (NO2) inhalation, formation of microthrombi in lungs and cancer metastasis. Journal of Environmental Pathology and Toxicology. 9:45 51. Saldiva PHN, Lichtenfels AJFC, Paiva PSO, Barone IA, Martins MA, Massad E, Pereira JCR, Xavier VP, Singer JM, Bohm GM. (1994). Association between air pollution and mortality due to respiratory diseases in children in Sao Paulo, Brazil: a preliminary report. Environ Res. 65:218-225. Sandström T, Ledin MC, Thomasson L, Helleday R, Stjernberg N. (1992). Reductions in lymphocyte subpopulations after repeated exposure to 1.5 ppm nitrogen dioxide. Br J Ind Med. 49:850-854. Sandström T, Stjernberg N, Eklund A, Ledin MC, Kolmodin-Hedman B, Lindstrom K, Rosenhall L, Angstrom T. (1991). Inflammatory cell response in bronchoalveolar lavage fluid after nitrogen dioxide exposure of healthy subjects: a dose-response study. Eur Respir J. 4:332-339. Strand V, Rak S, Svartengren M, Bylin G. (1997). Nitrogen dioxide exposure enhances asthmatic reaction to inhaled allergen in subjects with asthma. Am J Respir Crit Care Med. 155:881-887. 45 Tenias JM, Ballester F, Rivera ML. (1998). Association between hospital emergency visits for asthma and air pollution in Valencia, Spain. Occup Environ Med. 55:541-547. Tunnicliffe WS, Burge PS, Ayres JG. (1994). Effect of domestic concentrations of nitrogen dioxide on airway responses to inhaled allergen in asthmatic patients. Lancet. 344:1733 1736 Vagaggini B, Paggiaro PL, Giannini D, Franco AD, Cianchetti S, Carnevali S, Taccola M, Bacci E, Bancalari L, Dente FL, Giuntini C. (1996) Effect of short-term NO2 exposure on induced sputum in normal, asthmatic and COPD subjects. Eur Respir J 9:1852-7 Zmirou D, Barumandzadeh T, Balducci F, Ritter P, Laham G, Ghilardi J-P. (1996) Short-term effects of air pollution on mortality in the city of Lyon, France, 1985-90. J Epidemiol Comm Health 50 (suppl 1):S30-S35. 46 4.2.5 4.2.5.1 Lead Summary The review and analysis of the scientific literature indicates that exposure to an airborne lead concentrations at the current State standard of 1.5 mg/m3 (30-day average) would not be protective of the health of children and infants. Specifically, an increase in ambient lead from current concentrations to the level of the standard could be expected to drive blood lead levels of an additional 40% of 1- and 2-year old children to exceed 10 mg/dL, the level of concern specified by the U.S. Centers for Disease Control and Prevention (CDC). At this blood lead level, there is consistent evidence from several well-conducted prospective cohort studies that demonstrate an association between blood lead and several adverse neurological outcomes in children, including decreases in IQ. Even an increase in airborne lead to an ambient concentration of 0.50 mg/m3 would theoretically result in an additional 10% of children having blood lead concentrations above the CDC level of concern. However, lead is currently listed as a Toxic Air Contaminant (TAC) and statewide average ambient air exposures to lead are about an order of magnitude lower than the standard. Therefore, review of the lead standard for possible revision was given a lower level of priority. 4.2.5.2 Review of the health assessment The adverse health effects of lead are well documented, with evidence provided from the toxicological, clinical and epidemiological literature, as summarized by the U.S. Environmental Protection Agency (U.S. EPA, 1986, 1990), the Agency for Toxic Substances and Disease Registry (ATSDR, 1990) the National Research Council (NRC, 1993), and the California Office of Environmental Health Hazard Assessment (OEHHA, 1997). Children are more vulnerable than adults when exposed to lead partly because they: (1) have hand-to mouth behaviors that result in more ingestion of lead in soil and dust (This is relevant since lead emitted into the air will increase lead concentrations in soil.); (2) absorb substantially more lead from the gut than adults, especially children below 2 years of age; (3) have a faster metabolic rate, resulting in a proportionately greater daily intake of lead through food; (4) have a less developed blood-brain barrier and therefore greater neurological sensitivity; (5) have a faster resting inhalation rate; and (6) have a rapidly developing nervous system. Furthermore, children from economically disadvantaged backgrounds are especially vulnerable because they are more likely to have diets deficient in elements that suppress lead absorption, such as iron and calcium (OEHHA, 1997). At current ambient concentrations, air lead contributes to about 5 to 18% of total blood lead. Increases in air lead from current statewide average ambient concentrations of around 0.06 mg/m3 to a concentration of 0.50 mg/m3 would increase the contribution of air lead to blood lead to about 50% (OEHHA, 1997). Unlike many other pollutants, the health effects associated with exposure to lead have been quantitatively tied to measures of the pollutant found in the blood. Therefore, to assess the impact of any given airborne lead concentration, one must first determine the relation between air lead and blood lead, and then blood lead with the adverse health effect. There is substantial evidence linking air lead and blood lead concentrations from both clinical and epidemiological studies. Population-based studies include the effect of changes in ambient air on the deposition, accumulation and exposure from other environmental pathways (e.g., soil and dust) as well, so the total impact of lead can be estimated. Quantitative assessment of the association between air lead and blood lead have been conducted by both U.S. EPA (1989) and OEHHA (1997) using three different models: (1) disaggregate (pathway specific); (2) aggregate (all pathways combined); and (3) integrated biokinetic. The results are consistent and provide a reasonable range for estimating the effects of air lead on blood lead. 47 The scientific evidence suggests that lead exposure is associated with neurological effects in children and infants, resulting in diminished measures of intelligence such as IQ, short-term memory loss, reading and spelling underachievement, impairment of visual motor functioning, disruptive classroom behavior, and impaired reaction time (NRC, 1993). These findings are based on both cross-sectional and prospective studies of human populations. In these studies, effects have been noted at blood lead levels of 10 to 20 mg/dL and lower. Reviewing this body of evidence, the CDC identified 10 mg/dL as a “level of concern.” and recommended the initiation of community-wide childhood lead poisoning prevention activities when children in a community have blood lead levels between 10 and 14 µg/dL. Thus, it is reasonable to estimate, as an indicator of the protectiveness of the standard, the increase in the proportion of children that will move above 10 mg/dL as ambient lead increases above current concentrations. While there have been substantial decreases in average blood lead levels over the last 15 years, mostly associated with the reduction of lead in gasoline (Pirkle et al., 1994), there are still many children in California with blood lead levels above 10 µg/dL (OEHHA, 1997). Since there are no population-based blood lead data that are both specific to and representative of California, it is reasonable to assume that the results of a national probability sample – the National Health and Nutrition Examination Survey (NHANES III) - are representative of children in California. These results were used as a starting point to estimate the impact of changes in air lead on the percent of 1- and 2-year olds that will move above a blood lead level of 10 mg/dL. Sensitivity analyses conducted with alternative geometric means and geometric standard deviations (which describe the spread of a log normally-distributed exposure like blood lead), demonstrated that the results were robust. At the baseline average ambient air lead level existing when the NHANES III was undertaken of 0.055 mg/m3, about 5.9% of young children had blood lead levels above 10 mg/dL. This baseline includes lead exposure from all media including air, dust, soil, paint, water and diet. At an air lead concentration equivalent to the current ambient standard of 1.5 mg/m3, more than 45% of children aged 1 and 2 would be expected to have blood lead levels above the CDC guideline of 10 mg/dL. For African-American children, who have much higher baseline blood lead levels, the percent moving above 10 mg/dL in any of these scenarios would be much greater. 48 References Agency for Toxic Substances and Disease Registry (ATSDR) (1990). Toxicological profile for lead. United States Public Health Service. Atlanta, GA. National Research Council (1993). Measuring lead exposure in infants, children, and other sensitive populations. National Academy Press, Washington, D.C. Office of Environmental Health Hazard Assessment (OEHHA) (1997). airborne inorganic lead, Oakland, CA. March. Health effects of Pirkle JL, Brody DJ, Gunter EW, Kramer RA, Paschal DC, Flegal KM, and Matte TD (1994). The decline in blood lead levels in the United States: The National Health and Nutrition Examination Surveys (NHANES). J Am Med Assoc 272:284-291. U.S. Environmental Protection Agency (U.S. EPA) (1986). Air Quality Criteria for Lead. Environmental Criteria and Assessment Office, Office of Research and Development, Research Triangle Park, N.C. EPA 600/8-83-028 a-f, June 1986. U.S. Environmental Protection Agency (U.S. EPA) (1989). Evaluation of the Potential Carcinogenicity of Lead and Lead Compounds: In Support of Reportable Quantity Adjustments Pursuant to CERCLA (Comprehensive Environmental Response, Compensation and Liability Act) section 102 EPA/600/8-89-045A. Office of Health and Environmental Assessment, Washington, DC. NTIS PB89-181366. 49 4.2.6 4.2.6.1 Hydrogen Sulfide Summary There is little recent published literature relevant to the ambient air quality standard for hydrogen sulfide (H2S) of 30 ppb (1-hr average). Although at high concentrations, H2S is an asphyxiant and has been associated with industrial fatalities, its principal effects at ambient levels are odor annoyance, sometimes accompanied by symptoms of headache and nausea. The ambient standard was originally set in 1969 to protect against odor annoyance, based on a small study of adults’ H2S odor perception thresholds. A report prepared for the Air Resources Board in 1985 indicated that, at the level of the current ambient standard, approximately 40% of adults would be likely to be annoyed by the odor of H2S. Young adults and children are likely to be more sensitive with suspect to the odor perception and annoyance than older adults. In light of recent guidance from the American Thoracic Society (Samet et al. 2000), such annoyance should be considered an adverse effect from exposure to air pollution. The H2S standard was allocated to the second tier because there is little exposure in California and because the health impacts related to low-level exposures to H2S are not as serious as those identified for the other criteria pollutants. Nevertheless, consideration should be given to revising the ambient standard at some future date. 4.2.6.2 Review of H2S Health Effects Assessment The principal sources of H2S in California are geothermal power plants, petroleum and natural gas production and refining, and sewage. Schools located near industrial sources of H2S have been subject to accidental releases of this compound, resulting in the implementation of emergency protection measures, including “shelter-in-place.” Most of what is known about the toxicity of H2S has come from industrial accidents or studies involving exposure concentrations orders of magnitude above the current ambient standard. The biochemical mechanism of action of H2S is similar to that of cyanide. Interestingly, however, small quantities of H2S are also produced endogenously, and may be important in modulating neurotransmission. Effects associated with exposure to 50 ppm and above include conjunctivitis and eye pain, respiratory tract irritation, pulmonary edema and sudden death (Spiers and Finnegan, 1986; ACGIH 1992; NIOSH 1977). Several controlled experiments of healthy adult volunteers (total n = 86) at concentrations of 2.5 to 10 ppm are somewhat inconsistent. Bhambhani and Singh (1985, 1991) showed that at exposure concentrations of 2.5 and 5 ppm H2S, study subjects experienced coughing and throat irritation, as well as impaired lactate metabolism and oxygen uptake in the blood. In two subsequent reports, Bhambhani et al. (1994, 1996) reported no significant increase in symptoms or changes in a variety of respiratory and cardiovascular parameters in subjects exposed to either 5 or 10 ppm H2S. One other controlled exposure study of 10 mild asthmatics to 2 ppm for 30 minutes showed no significant changes in several measures of lung function, though 2 subjects experienced increases in specific airway resistance (Sraw) in excess of 30%. All subjects reported detecting a “very unpleasant” odor, to which they “rapidly” adapted (Jappinen et al. 1990). These small controlled studies were all conducted using exposure concentrations at or near the occupational exposure limit (20 ppm ceiling), which is over two orders of magnitude higher than the 1-hour ambient standard for H2S. It should be noted that olfactory fatigue is common with relatively high levels of exposure and can prevent workers from recognizing continuing exposure to H2S. 50 The H2S ambient standard was originally established in 1969 by the former State Department of Public Health to protect against odor annoyance, and was based on rounding of the geometric mean odor threshold of 29 ppb (range = 12 - 69 ppb; geometric SD = 5 ppb) measured in adults (California State Department of Public Health 1969). In a report prepared for the Air Resources Board, Amoore (1985) reviewed 26 published studies (not including the California Department of Public Health study), which reported average odor detection thresholds for H2S ranging from 0.07 to 1400 ppb H2S. In this review, the geometric mean was 8 ppb, approximately ¼ the level of the standard. Earlier work indicated that olfactory sensitivity declines with age (Venstrom et al 1968). In his 1985 report to the ARB, Amoore indicated that an average 18-year old would be predicted to have an odor perception threshold of 4 ppb, while a 62-year-old would have a threshold of 16 ppb. Recent work suggests that nine-year-olds may not be as sensitive as 15 year-olds in odor identification (Koelega 1994); however, this may be partly explained by the results of another study in which children aged 8 – 14 had an odor sensitivity similar to that of young adults, but appeared not have the knowledge to identify odors by name (Cain et al. 1995). Exposure to high concentrations of unpleasant odorants can cause annoyance as well as symptoms of headache and nausea (Amoore 1985; Reynolds and Kauper 1984). Several studies have examined the ratio of annoyance threshold to odor detection threshold for a variety of odorants (Winneke 1975; Winneke and Kastka 1977; Hellman and Small 1974; Adams et al. 1968; and NCASI 1971); the geometric mean of these ratios is five. If the mean detection concentration for H2S is 8 ppb, the mean theoretical odor annoyance threshold would therefore be 40 ppb. At the level of the current ambient standard, approximately 40% of adults would likely be annoyed by the odor of H2S (Amoore 1985). In a semi-quantitative “reality test” of this theoretical construct, Reynolds and Kauper (1984) reported that ambient concentrations of 30 ppb H2S from geyser emissions have resulted in odor complaints and reports of nausea and headache in the general population. In an epidemiological study of a Finnish community exposed to pulp mill emissions (H2S and methyl mercaptan), odds ratios for several symptoms among children were elevated (cough, nasal symptoms, eye symptoms, and headache), though none was statistically significant (Jaakkola 1990, Marttila 1994). To prevent odor nuisance from H2S, the World Health Organization recommends a more stringent ceiling of 5 ppb, 30-minute average (WHO 1981). Several studies have examined the reproductive and developmental toxicity of H2S in experimental animals using exposure concentrations up to 3 orders of magnitude higher than the current ambient standard. All but one of these studies showed no biologically significant effects, suggesting that toxicological investigations of similar outcomes in experimental animals using lower concentrations more relevant to the ambient standard are unlikely to be informative. The sole exception might be the study by Hannah and Roth (1990), which examined the impacts of H2S exposure on developing neurons in rat brains. The authors reported that maternal exposure to 20 and 50 ppm resulted in severe alterations in neuron growth and development. The American Thoracic Society has recently indicated that symptom-related impairment of quality of life resulting from exposure to air pollution should be deemed an adverse health effect (Samet et al. 2000). In view of this, the distinction that is sometimes made between odor annoyance and an adverse health effect should no longer be drawn, at least from a standard-setting perspective. In view of the observation that exposure to H2S at the level of the current standard is likely to elicit odor annoyance and accompanying 51 symptoms in a large percentage of people so exposed, consideration should be given to revision of the ambient standard. However, symptoms related to H2S exposure are generally not as serious as those linked with the Tier 1 pollutants. In addition, H2S exposures near the level of the ambient standard are relatively uncommon compared with the Tier 1 pollutants. There fore, H2S was relegated to Tier 2. As the primary symptoms associated with environmental exposures to this pollutant are nausea and headache, consideration should be given to its potential to aggravate similar symptoms occurring in, for instance, pregnant women or patients undergoing cancer chemotherapy. In any future revision of the standard, however, the principal difficulty that will be faced by OEHHA and ARB is the dearth of research on the impacts of this toxicant at exposure concentrations near the level of the ambient standard. References Adams DF, Young FA, Lahr RA. (1968). Evaluation of odor perception threshold test facility. TAPPI 51(13):62A-67A. American Conference of Governmental Industrial Hygienists (ACGIH). Documentation of the Threshold Limit Values and Biological Exposure Indices. (1991) 6th ed. Vol II. Cincinnati: ACGIH. p. 786-788. Amoore JE. (1985). The perception of hydrogen sulfide odor in relation to setting an ambient standard. Olfacto-Labs, Berkeley, CA: prepared for the California Air Resources Board. Cain WS, Stevens JC, Nickou CM, Giles A, Johnston I, Garcia-Medina MR. (1995). Life-span development of odor identification, learning, and olfactory sensitivity. Perception 24(12):1457-1472. California State Department of Public Health. Recommended Ambient Air Quality Standards. (Statewide standards applicable to all California Air Basins). (1969);HS-3. Bhambhani Y, Burnham R, Snydmiller G, MacLean I, Martin T. (1994). Comparative physiological responses of exercising men and women to 5 ppm hydrogen sulfide exposure. Am Ind Hyg Assoc J 55(11):1030-5 Bhambhani Y, and Singh M. (1985). Effects of hydrogen sulphide on selected metabolic and cardio-respiratory variables during rest and exercise. Report submitted to Alberta Worker’s Health and Safety and Compensation. June, 1985. Bhambhani Y, and Singh M. (1991). Physiological effects of hydrogen sulfide inhalation during exercise in healthy men. J. Appl. Physiol. 71:1872-1877. Bhambhani Y, Burnham R, Snydmiller G, MacLean I, Lovlin R. (1996). Effects of 10-ppm hydrogen sulfide inhalation on pulmonary function in healthy men and women. J. Occup. Environ. Med. 38(10):1012-1017. Hannah RS, and Roth SH. (1991). Chronic exposure to low concentrations of hydrogen sulfide produces abnormal growth in developing cerebral Purkinje cells. Neurosci. Lett. 122(2):225-228. Hellman TM, Small FH. (1974). Characterization of the odor properties of 101 petrochemicals using sensory methods. J. Air Pollut. Control Assoc. 24:979-982. 52 Jaakkola JJ, Vilkka V, Marttila O, Jappinen P, Haahtela T. (1990). The South Karelia Air Pollution Study. The effects of malodorous sulfur compounds from pulp mills on respiratory and other symptoms. Am Rev Respir Dis 142(6 Pt 1):1344-50. Jappinen P, Vilkka V, Marttila O, Haahtela T. (1990). Exposure to hydrogen sulphide and respiratory function. Br. J. Ind. Med. 47(12):824-828. Koelega HS. (1994). Prepubescent children may have specific deficits in olfactory sensitivity. Percept. Mot. Skills 78(1):191-199. Marttila O, Jaakkola JJ, Vilkka V, Jappinen P, Haahtela T. (1994). The South Karelia Air Pollution Study: the effects of malodorous sulfur compounds from pulp mills on respiratory and other symptoms in children. Environ. Res. 66(2):152-9 NCASI. (1971). Evaluation of the use of humans in measuring the effectiveness of odor control technology at the source. Atmospheric Quality Improvement Technical Bulletin No. 56. New York: National Council of Paper Industry for Air and Steam Improvement. National Institute for Occupational Safety and Health. Criteria for a recommended standard. Occupational exposure to hydrogen sulfide (1977) DHEW. (NIOSH) #77-158. Cincinnati (OH): National Institute for Occupational Safety and Health; 1977. OEHHA. (2000). Office of Environmental Health Hazard Assessment. Air Toxics Hot Spots Program Risk Assessment Guidelines. Part III. Technical Support Document for the Determination of Noncancer Chronic Reference Exposure Levels. Available on-line at http://www.oehha.ca.gov Reynolds R L, Kauper RL. (1984). Review of the State of California Ambient Air Quality Standard for Hydrogen Sulfide (H2S). Lakeport (CA): Lake County Air Quality Management District; 1984. Samet J, Buist S, Bascom R, Garcia J, Lipsett M, Mauderly J, Mannino D, Rand C, Romieu I, Utell M, et al (2000). What constitutes an adverse health effect of air pollution? Am J Respir Crit Care Med 161(2 part 1):665-673 Spiers M, Finnegan OC. (1986). Near death due to inhalation of slurry tank gases. Ulster Med Soc 55(2):181-183. Venstrom P, Amoore JE. (1968). Olfactory threshold in relation to age, sex or smoking. J Food Sci 33:264-265. Winneke G, Kastka J. Odor pollution and odor annoyance reactions in industrial areas of the Rhine-Ruhr region. In: Olfaction and Taste VI. J Le Magnen, P MacLeod, editors. pp. 471 479. London: Information Retrieved; (1977). (WHO) World Health Organization. (1981). Hydrogen sulfide. Environmental Health Criteria No. 19. Geneva: WHO. 53 4.2.7 4.2.7.1 Carbon Monoxide Summary There are several State standards for CO, including 20 ppm for one hour, 9 ppm for eight hours, and 6 ppm for eight hours in the Lake Tahoe basin. The standards for CO are based on the critical endpoint of exacerbation of pre-existing coronary artery disease (CAD) among susceptible individuals. Justification of this standard rests upon a substantial body of peer-reviewed literature, and in particular on several controlled human exposure studies. Review and analysis of the current scientific literature on CO indicates that a reasonable margin of safety for the current ambient air quality standard continues to exist in terms of protection against exacerbation of CAD among susceptible adults. Other health endpoints, including fetotoxic effects as well as adult mortality and hospitalization for cardiovascular disease, have been associated with ambient CO in epidemiological analyses. However, considerable uncertainties exist in these studies due to potential confounders and the large exposure measurement error related to use of fixed site monitors for CO. Based on the above findings, there is only weak evidence that the current California ambient CO standards may not be protective against adverse effects of infants, children or other potentially susceptible populations. Therefore, review of the carbon monoxide standard for possible revision was given a lower level of priority. 4.2.7.2 Review of the health assessment CO is a colorless, odorless gas with no substantial warning properties. It is produced by various combustion processes, including motor vehicles, fireplaces, home furnaces and heaters, numerous industries, and burning cigarettes. Individuals in motor vehicles are at the greatest risk from ambient CO exposure, followed by pedestrians, bicyclists and joggers in the proximity of roadways, and roadworkers (U.S. EPA, 2000). CO acts in the body as a “chemical asphyxiant” by interfering with the transportation of oxygen by hemoglobin molecules found in red blood cells. Critical targets of CO are those organs with a high metabolic oxygen demand and limited metabolic reserve. These include the nervous system, heart, and the developing fetus. Characterizing exposure to and assessing the risk of CO is helped by the availability of an excellent biomarker of exposure: carboxyhemoglobin (or COHb). Experimental studies looking at biological effects in both animals and humans can tailor exposures to achieve target COHb levels, which in turn provide a common denominator for describing “internal exposure.” Toxicokinetic modeling is utilized with a variety of assumptions in order to predict the relationship between ambient exposure and COHb levels. The current California ambient air quality standard for CO is based on the critical endpoint of exacerbation of pre-existing CAD among susceptible individuals. Justification of this standard rests upon a substantial body of peer-reviewed literature, and in particular on several controlled human exposure studies. Most important of these are two showing a decrease in exercise tolerance among CAD patients exposed to CO experimentally. One study showed a decreased exercise time to both angina (chest pain caused by insufficient oxygen delivery to the heart muscle) and electrocardiographic abnormalities among CAD patients exposed to CO (Allred, 1989). Another study showed a similar decrease for the endpoint of single and multiple premature ventricular contractions (PVCs), a potentially dangerous cardiac rhythm abnormality (Sheps, 1990). Together these two studies – and several that preceded them – suggest that relatively low COHb levels (e.g., 2.0 to 2.5% for exercise-induced angina, and 6% for PVCs) may impair oxygen delivery to the heart of CAD 54 patients in clinically important ways. Using these studies, together with toxicokinetic calculations presented at the time of the last CO Criteria Air Pollutant Review (1991), OEHHA scientists concluded that the current ambient air quality standards adequately protect the most vulnerable segment of the public – CAD patients. Specifically, the current ambient air quality standards for CO are intended to keep COHb levels well below 2.1% to protect these individuals. Other health endpoints considered at the time of the last review, but not designated as critical for standard-setting purposes, were: 1) neurobehavioral impairment, and 2) prenatal effects (in particular, intrauterine growth retardation or IUGR). At the time of that review, no convincing evidence could be found for neurobehavioral impairment with COHb levels below approximately 10-20% in human volunteers (Benignus et al., 1990), nor for perinatal effects with maternal COHb levels below approximately 16% in experimental animals (Singh and Scott, 1984). IUGR / low birthweight has been observed among the offspring of human mothers with lower COHb levels, but these are smokers who were also exposed to a variety of other toxic agents in cigarette smoke (Mactutus, 1989). Since the above review, several new research findings – including publications pertaining to children and/or fetuses – have appeared in the scientific literature. In addition, a major review was recently published by the US Environmental Protection Agency (U. S. EPA, 2000) looking at the adequacy of the current national ambient air quality standards for CO (25 ppm for one hour and 9 ppm for eight hours). US EPA concluded that their standards – likewise based upon the protection of individuals with CAD – continue to be adequately protective, and that the intervening literature on the subject did not support a change in the standards. Most of the newer literature pertaining to CO exposure in humans has been epidemiological in nature, and has several methodological shortcomings. Two recent studies cited in the accompanying literature review (Kleinman, 2000) examined neonatal birth weight as a function of ambient CO levels recorded at the air monitoring station located closest to the mother’s residence (Alderman et al., 1987; Ritz and Yu, 1999). In the first study, conducted in Denver, the authors found no association between imputed CO exposure and birth weight. In the second study (conducted in Los Angeles), the authors concluded that the likelihood of a full-term neonate having low birth weight was significantly elevated if the 3-month average of nearest CO measurements exceeded 5.5 ppm. These latter results were reportedly unaffected by adjustment for a number of potential confounders, including commuting habits of the mother, sex of the child, level of prenatal care, and age, ethnicity, and education of the mother. However, because of issues related to potential confounders and measurement error, the study can only be viewed as suggestive. Specifically, the authors were unable to control for a number of potential confounders, including maternal nutrition, prior adverse pregnancy outcomes, occupational exposures, and personal (or passive) smoking. Perhaps more importantly, classification of CO exposure by sampling results at the nearest air pollution monitoring station is problematic, since CO – perhaps more than any other criteria air pollutant – tends to show sharp concentration gradients over relatively short distances, with proximity to major roadways being an important variable. As indicated by the U.S. EPA (U.S. EPA, 2000), there is poor correlation between personal exposure and ambient CO as measured at fixedsite monitors due to personal mobility, and the spatial and temporal variability of CO measurements. Thus, there may also be significant misclassification, possibly non-random, of exposure in these studies. 55 This same problem of measurement error exists for a series of epidemiological studies of adults showing associations between CO and both daily mortality and cardiovascularrelated hospital admissions. Among the mortality studies in the U.S. finding an association with daily mortality are Kinney and Ozkaynak (1991) in Los Angeles County. However, in that study and in many other similar studies, the traffic-related pollutants – CO, NO2, and particulate matter – were highly correlated (r ~ 0.8), so a separate effect of CO is impossible to discern. Among other U.S. studies examining CO, Ito et al. (1996) in Chicago, Kelsall et al. (1997) in Philadelphia and Fairley (1999) in Santa Clara County, failed to find any association between CO and mortality. In studies using data from outside the U.S., the results for CO are mixed (U.S. EPA, 2000). Associations between CO and hospitalization for cardiovascular disease have been reported by Morris et al. (1995) and Schwartz (1999). However, the Morris et al. study did not include measures of particulate matter, despite the large body of evidence associating exposure to this pollutant with hospitalization. In discussing the positive findings for CO at levels much lower than that observed in toxicological investigations, Schwartz (1999) suggests two possible explanations. First, he suggests that the CO effects may be occurring among a part of the population with concurrent respiratory and cardiovascular illness; individuals who are not typically studied in controlled exposure settings. Second, CO may be serving as a marker for traffic-related pollutants, including volatile and semivolatile organic aerosols. The U.S. EPA did not find compelling toxicological evidence of biological plausibility for the associations reported in epidemiological studies, specifically between current low-level ambient CO and mortality and hospitalization (U.S. EPA, 2000). In fact, the EPA indicates that a CO concentration of 100 ppm or higher would be needed to obtain a 5% COHb level. The low levels of ambient CO found in urban area (typically < 5.0 ppm average daily 1-hour maximum) would be projected to increase COHb levels by barely detectable amounts (U.S. EPA, 2000). Therefore, it is challenging to reconcile these findings resulting from such small changes in CO on pathophysiological grounds. Another study suggesting CO-induced decrements in video game performance with COHb levels in the 2-4% range also has potential methodological limitations. Specifically, the study employed a small number of subjects (n= 9), and was single (rather than double) blinded (Insogna and Warren, 1994). Thus, these discrepant results cannot, by themselves, challenge the larger body of literature that suggests that neurobehavioral effects occur at much higher COHb levels. In summary, there is no evidence in the peer-reviewed scientific literature to challenge the place of CAD in susceptible individuals as the critical health endpoint for CO standardsetting. Notwithstanding this observation, significant uncertainties exist regarding the epidemiological studies that report associations between ambient CO measurements and various adverse outcomes, such as birthweight, mortality and hospitalization. These epidemiological studies may not only be subject to differential measurement error, but also generally cannot control for potential impacts of highly correlated traffic-related pollutants, especially PM10 and PM2.5. Based on these findings, there is only weak evidence that the current California ambient CO standards may not be protective against adverse effects in the most susceptible populations. In this instance, older adults with serious chronic disease represent a more susceptible population than infants and children, so that a standard protective of individuals with heart disease will also be protective of infants and children. 56 References Alderman BW, Baron AE, Savitz DA. (1987) Maternal exposure to neighborhood carbon monoxide and risk of low birth weight. Public Health Rep 102:410-414. Allred EN, Bleecker ER , Chaitman BR, Dahms TE, Gottlieb SO, Hackney JD, Pagano M, Selvester RH, Walden SM, Warren J. (1989) Short-term effects of carbon monoxide exposure on the exercise performance of subjects with coronary artery disease. N Engl J Med 321:1426-1432. Benignus VA, Muller KE, Malott CM. (1990) Dose-effects functions for carboxyhemoglobin and behavior. Neurotoxicol Teratol 12, 111-118. Insogna S, Warren CA. (1984) The effect of carbon monoxide on psychomotor function. In: Trends in Ergonomics/Human Factors I. A. Mital, Ed. Amsterdam: Elsevier/North Holland. Kleinman MT. (2000) Carbon monoxide: evaluation of current California air quality standards with respect to protection of children. Prepared for the Office of Environmental Health Hazard Assessment. Mactutus CF. (1989) Developmental neurotoxicity of nicotine, carbon monoxide, and other tobacco smoke constituents, Ann N Y Acad Sci, 562, 105-122. Sheps DS, Herbst MC, Hinderliter AL, Adams KF, Ekelund LG, O'Neil JJ, Goldstein GM, Bromberg PA, Dalton JL, Ballenger MN, Davis SM, Koch GG. (1990) Production of arrhythmias by elevated carboxyhemoglobin in patients with coronary artery disease. Ann Intern Med, 113, 343-351. Singh J, Scott LH. (1984), "Threshold for carbon monoxide induced fetotoxicity," Teratology, 30, 253-257. US Environmental Protection Agency (2000), Air Quality Criteria for Carbon Monoxide. Washington, DC: USEPA, Office of Research and Development. 57 4.2.8 4.2.8.1 Sulfur Dioxide Summary California has two Ambient Air Quality Standards for SO2, which are intended to protect different sets of potentially susceptible subpopulations. The short-term standard (0.25 ppm, 1 hr average) is based on the results of controlled exposure studies, and is intended to protect exercising asthmatics against effects of acute exposure. The longer-term standard (0.04 ppm, 24-hr average) is based on the results of epidemiological studies, and is intended to protect not only asthmatics, but also individuals at risk for exacerbation of other chronic lung or heart diseases, as well as children and the elderly. Many asthmatic subjects exposed briefly in controlled settings to low levels of SO2 have demonstrated increased respiratory symptoms such as shortness of breath, coughing and wheezing, and decrements in lung function. By virtue of their activity patterns and generally greater ventilation rates, children may receive greater exposures to SO2 than adults (Wiley et al. 1991; see also section 3.6, above); therefore active asthmatic children may represent a particularly susceptible subgroup. There is evidence that some nonasthmatic individuals with allergies and airway hyperresponsiveness may also be susceptible to bronchoconstriction induced by short-term exposure to SO2. Controlled exposure studies suggest consistent effects (changes in lung function and increased lower respiratory symptoms) in vigorously exercising asthmatics at exposure concentrations of 0.40 ppm and above. Changes in airway caliber unaccompanied by any symptoms have been observed at concentrations of 0.10 to 0.25 ppm in studies using mouthpiece exposures, a method of SO2 administration that bypasses normal anatomic defenses. Epidemiological studies have examined a variety of outcomes in relation to ambient SO2 concentrations, specifically daily mortality, increases in hospital admissions for cardiac and respiratory causes, asthma exacerbations, decrements in children’s lung function, and increased risks for other respiratory symptoms and illness. In many epidemiological studies that purport to show an SO2 effect, there is substantial covariation of SO2 with ambient particles or other pollutants, so that an independent effect of SO2 cannot be identified. However, several studies appear to demonstrate associations of adverse health outcomes with ambient SO2 levels, when measured ambient concentrations were near the current 24 hour California standard. Based on these findings, there is some evidence that the current California ambient SO2 standards may not be protective against adverse effects in the most susceptible populations. Coupled with the evidence that SO2 levels in California are generally very low, these standards were assigned to the second tier for review. 4.2.8.2. Review of the health assessment Sulfur dioxide is a highly irritating, colorless, soluble gas with a pungent odor and taste. In contact with water it forms sulfurous acid, which accounts for its significant respiratory tract irritancy. Principal sources of SO2 include paper and pulp mills, coal-fired power plants, refineries, smelters, and food processing facilities. In ambient air, sulfur dioxide is slowly oxidized to sulfur trioxide, which, because of its strong affinity for water, is rapidly hydrated to form sulfuric acid (H2SO4) (World Health Organization 1987). The indirect health impacts of 58 SO2 mediated through exposure to H2SO4 and other acid aerosol derivatives are reviewed in the assessment of sulfates, not in this section. The prevalence of enhanced susceptibility to the bronchoconstrictive effects of SO2 has been estimated to be about 5.4% among adults aged 20-44 years in Europe (Nowak et al, 1997). The population subgroups with the greatest response to SO2 at low levels include primarily asthmatics and some individuals with allergies and airway hyperresponsiveness (Linn 1987, Sheppard 1980, 1981, Koenig 1981, 1998; Horstman 1986). Even among asthmatics there is wide variability in SO2 susceptibility: one investigation of adult asthmatics suggests a seven-fold range of lung function responses to fixed levels of SO2 exposures (Horstman 1986). Low humidity and exercise (or voluntary hyperventilation) augment the responses observed in asthmatics (Sheppard 1981, 1984, Bethel 1984, Linn 1983, 1985). Pre-exposure to a low concentration of ozone (0.12 ppm) for 45 minutes potentiates the bronchoconstrictive effect of an otherwise subthreshold dose of SO2 (0.10 ppm) in adolescent asthmatics, suggesting the possibility of interactions with other pollutants in urban environments (Koenig 1990). With moderate exercise or voluntary rapid breathing, lower respiratory symptoms and/or effects on lung function have been consistently observed in asthmatics after short (several minutes) exposures to SO2 concentrations of 0.4 - 0.5 ppm and above, and in some cases in the range of 0.2-0.3 ppm (California Air Resources Board 1994). Though many asthmatics experience exercise-induced bronchospasm, controlled exposure studies adjust for this phenomenon by comparing the effects observed in asthmatics exercising in clean air with effects seen when they are exercising during an SO2 exposure. In experimental settings, SO2-induced bronchospasm in asthmatics often appears to be reversible within a half-hour even without treatment; however, a number of study subjects have required rescue bronchodilator administration. Pre-treatment with a variety of asthma medications can blunt the effects of SO2 exposure (Koenig 1987; Gong 1996). Two controlled studies have reported SO2-related effects on lung function using an exposure concentration of 0.10 ppm (Koenig 1990, Trenga 2000). In both of these studies, SO2 was administered via a mouthpiece, which completely bypasses the nose. At rest most (80-85%) people breathe through the nose, which filters out most inhaled SO2, preventing its passage to sensitive irritant receptors at and below the larynx (Speizer et al, 1966, Frank et al. 1969). With exercise, people begin oronasal breathing, at which point about 60% of inhaled air passes through the nose, declining to 40% at very high ventilation rates (Ninimaa 1981). The mouth and throat cannot scrub SO2 as efficiently as the nose; therefore, breathing through the mouth alone, as was done in these and several other controlled exposure studies, increases the penetration of SO2 into the lungs substantially beyond that which would happen in real life in most individuals. Mouthpiece exposure was also used in one of the two studies that reported an SO2-related effect on specific airway resistance (SRaw – a measure of the caliber of the airways and possibly the larynx) at 0.25 ppm (Sheppard 1981). The only other controlled study that reported an effect at 0.25 ppm was unable to replicate this result using a higher workload and ventilation rate (Bethel et al. 1985). While mouthpiece administration of SO2 represents and unnatural mode of exposure, many asthmatics also have allergies that can contribute to nasal congestion and increased mouth-breathing. Thus, SO2 penetration to the lungs during mouthpiece exposures may be representative of what some, but not most, individuals would experience with unencumbered ambient exposures to this pollutant. One expert has opined that lower airway exposure to SO2 administered by mouthpiece at rest may be equivalent to that experienced by exercising 59 children exposed to similar ambient concentrations (M.T. Kleinman, personal communication, October 12, 2000). There has been little research into the determinants of SO2 susceptibility: one pilot study found that there were no differences in results of lung function testing or nasal lavage in black versus white adult asthmatics exposed to SO2 in a controlled setting (Heath 1994). In another study of mild and moderate/severe asthmatics, the latter group manifested somewhat greater SO2-induced bronchoconstriction; however, because the more severe asthmatics started with less functional reserve, such exposures in real life could produce effects that are more severe clinically (Linn 1987; California Air Resources Board 1994). Nonasthmatic adolescents (and possibly individuals in other age groups) with allergy and airway hyperresponsiveness (as manifested by exercise-induced bronchospasm) may also constitute an SO2-susceptible subgroup (Koenig 1998). However, there have been no direct comparisons of the relative age-related susceptibility to SO2 (Koenig 1998). Increased ambient SO2 concentrations have been linked epidemiologically with acute morbidity and mortality as well. In the London smog episode of 1952 and several other major events, excess morbidity and mortality were clearly associated with the air pollution mixture, though the relative etiologic roles of particulate matter, SO2, aerosol acidity, or other unmeasured pollutant(s) cannot be delineated. Numerous other time-series analyses conducted since the mid-1980s suggest associations of several adverse outcomes with SO2, as well as with airborne particles, aerosol acidity, and other pollutants, though the associations with SO2 are often inconsistent or not statistically significant. Outcomes linked with SO2 include modest decrements in children’s lung function, increased risks of respiratory symptoms, hospital admissions for cardiac and respiratory illness, and increased daily mortality. (California Air Resources Board 1991; Dockery 1982; Charpin 1988; Derrienic 1989; Hatzakis 1986; Spix 1993; Dab 1996; Peters 1996; Touloumi 1996; Schwartz 1995; Burnett 1999; Ballester 1996; Wong 1999). Some of these associations between ambient SO2 and adverse health outcomes have been reported when 24-hour SO2 averages were near the range of the current California ambient standard (0.04 ppm, 24-hr average). In many analyses that included particles or ozone as well as SO2 in the regression models, the SO2 effect diminishes substantially or is no longer associated with the health outcome (Spix; 1993 Schwartz 1995; Burnett 1999, Schwartz and Dockery 1992). This would suggest that the apparent SO2 effect may in some cases be due to covariation with particles or other pollutants. In other analyses, however, there appear to be effects related to SO2 but not particles, indicating that the explanation is not so simple (Charpin 1988; Hatzakis 1986). The series of recent articles from the APHEA study (Air Pollution and Health: a European Approach) suggest small, but significant SO2-related effects on mortality and hospital admissions (Sunyer 1996; Katsouyanni 1997; Vigotti 1996). Interestingly, however, SO2 related effects appear weaker in Central Europe, where SO2 levels are generally higher than in the Western European cities studied (Zmirou 1998). In addition, many of the European studies did not utilize some of the more sophisticated statistical techniques that are considered stateof-the-art to control for both long- and short-term trends in the data. Some studies suggest greater magnitudes of association between SO2 and adverse outcomes in children than adults (Hajat 1999). Several recent time-series studies also suggest an effect of ambient SO2 on exacerbations of asthmatic symptoms or changes in lung function in children (Segala 1999; Chew 1999; Timonen and Pekkanen 1997). Other recent publications also suggest potential linkages between ambient SO2 levels and adverse pregnancy outcomes (Rogers 2000, Wang 1999). 60 These epidemiological studies suggest that children and those with pre-existing respiratory and cardiac conditions (including asthma) may be particularly susceptible to the effects of exposure to ambient air pollution mixtures that include SO2. However, there are no animal toxicology studies at such low concentrations that can provide a framework for understanding how SO2, per se, could cause the effects observed in the epidemiological studies. Controlled human exposure studies using higher-than-ambient SO2 concentrations suggest a linkage with a modest degree of inflammation of the lower and upper respiratory tract (Sandström 1989; Bechtold 1993). In any case, there is insufficient information to provide a mechanistic explanation for direct SO2-related associations observed at low ambient concentrations. In addition to any possible direct toxic effects of SO2, it is possible that this substance is an indicator for a complex mixture of pollutants, including acid sulfates, other particles, or unmeasured pollutants. In summary, recent reports suggest that the current ambient standards of SO2 may not provide an adequate margin of safety for potentially susceptible subpopulations, which include exercising asthmatics (1-hr standard), as well as children and those with pre-existing respiratory and cardiac conditions (24-hr standard). However, because of long-standing pollution control measures, concentrations of SO2 monitored throughout California are generally well below the levels of the ambient air quality standards. Therefore, this pollutant was assigned to the second tier for review. References Anderson HR; Ponce de Leon A; Bland JM; Bower JS; Strachan DP (1996) Air pollution and daily mortality in London: 1987-92 BMJ 16;312(7032):665-9 Ballester F; Corella D; Perez-Hoyos S; Hervas A (1996) Air pollution and mortality in Valencia, Spain: a study using the APHEA methodology. J Epidemiol Community Health 50(5):527 33 Balmes JR, Fine JM, Sheppard D. (1987) Symptomatic bronchoconstriction after short-term inhalation of sulfur dioxide. Am Rev Respir Dis 136:1117-1121. Bechtold WE, Waide JJ, Sandstrom T, Stjenberg, N, McBride D, Koenig, J. Chang IY, Henderson RE. (1993) Biological markers of exposure to SO~: S-sulfonates in nasal lavage. J Expo Anal Environ Epidemiol 3:371-382. Bethel RA, Sheppard D, Epstein J, Tam E, Nadel JA, Boushey HA. (1984) Interaction of sulfur dioxide and cold dry air in causing bronchoconstriction in asthmatic subjects. J Appl Physiol 57:419-423. Burnett RT, Smith-Doiron M, Steib D, Cakmak S, Brook JR. (1999) Effects of particulate and gaseous air pollution on cardiorespiratory hospitalizations. Arch Environ Health 54:130 139. California Air Resources Board (1994) Review of the one-hour ambient air quality standard for sulfur dioxide. Staff report. Sacramento, CA. December. California Air Resources Board (1991) Review of the 24-hour ambient air quality standard for sulfur dioxide. Staff report. Sacramento, CA. August. 61 Charpin D, Kleisbauer JP, Fondarai J, Graland B, Viala A, Gouezo F. (1988) Respiratory symptoms and air pollution changes in children: the Gardanne coal-basin study. Arch Environ Health 43:22-27. Chew FT, Goh DYT, Oo1 BC, Saharom R, Hui JKS, Lee BW. (1999) Association of ambient air pollution levels with acute asthma exacerbation among children in Singapore. Allergy 54:320-329. Dab W, Medina S, Quenel P, Le Moullec Y, Le Tertre A et al. (1996) Short term respiratory health effects of ambient air pollution: results of the APHEA project in Paris. J Epidemiol Comm Health 50(suppl 1):S42-S46. Derrienic F, Richardson S, Mollie A, Lalloch J. (1989) Short-term effects of sulphur dioxide pollution on mortality in two French cities. Int J Epidemiol 18:186-197. Dockery DW, Ware JH, Ferris BG, Speizer FE, Cook NR, Herman SM. (1982) Change in pulmonary function in children associated with air pollution episodes. J Air Pollut Control Assoc 32:937-942. Field PI, Simmul R, Bell SC, Allen DH, Berend N. (1996) Evidence for opioid modulation and generation of prostaglandins in sulphur dioxide (SO2)-induced bronchoconstriction. Thorax 51:159-163. Frank NR, Yoder RE, Brain JD, Yokoyama E. (1969) SO2 absorption by the mouth and nose under conditions of varying concentration and flow. Arch Environ Health 18:315-322. Garcia-Aymerich J; Tobias A; Anto JM; Sunyer J. (2000) Air pollution and mortality in a cohort of patients with chronic obstructive pulmonary disease: a time series analysis. J Epidemiol Community Health 54(1):73-4 Gong H, Linn WS, Shamoo DA et al. (1996) Effect of inhaled salmeterol on sulfur dioxideinduced bronchoconstriction in asthmatic subjects. Chest 110:1229-1235. Hajat S, Haines A, Goubet SA, Atkinson RW, Anderson HRE. (1999) Association of air pollution with daily GP consultations for asthma and other lower respiratory conditions in London. Thorax 54:597-605. Hatzakis A, Katsouyanni K, Kalandidi A, Day N, Trichopoulos D. (1986) Short-term effects of air pollution on mortality in Athens. Int J Epidemiol 15:73-81. Heath SK, Koenig JQ, Morgan MS, Checkoway H, Hanley QS, Rebolledo V. (1994) Effects of sulfur dioxide exposure on African-American and Caucasian asthmatics. Environ Res 66:1 11. Horstman D, Roger LJ, Kehrl H. Hazucha M. (1986) Airway sensitivity of asthmatics to sulfur dioxide. Toxicol Ind Health 2:289-298. Katsouyanni K; Touloumi G; Spix C; Schwartz J. (1997) Short-term effects of ambient sulphur dioxide and particulate matter on mortality in 12 European cities: results from time series data from the APHEA project. Air Pollution and Health: a European Approach. Public Health Rev 25(1):7-18; discussion 19-28 Kelsall JE; Samet JM; Zeger SL; Xu J (1997) Air pollution and mortality in Philadelphia, 1974 1988 Am J Epidemiol Nov 1;146(9):750-62 62 Koenig JQ. (1998)The role of air pollutants in adolescent asthma. Immunol Clin N Amer 18:61-74. Koenig JQ, Covert DS, Hanley QS, Van Belle G, Pierson WE.(1990) Prior exposure to ozone potentiates subsequent response to sulfur dioxide in adolescent asthmatic subjects. Am Rev Respir Dis 141:377-380. Koenig JQ, Marshall SG, Horike M et al. (1987) The effects of albuterol on SO2-induced bronchoconstriction in allergic adolescents. J Allergy Clin Immunol 79:54-58. Koenig JQ, Pierson WE, Horike M, Frank R. (1981) Effects of SO2 plus NaCl aerosol combined with moderate exercise on pulmonary function in asthmatic adolescents. Environ Res 25:340-348. Linn WS, Avol EL, Peng RC, Shamoo DA, Hackney JD. (1987) Replicated dose-response study of sulfur dioxide effects in normal, atopic, and asthmatic volunteers. Am Rev Respir Dis 136:1127-1134. Linn WS, Shamoo DA, Anderson KR, Whynot JD, Avol EL, Hackney JD. (1985) Effects of heat and humidity on the responses of exercising asthmatics to sulfur dioxide exposure. Am Rev Respir Dis 131:221-225. Linn WS, Venet TG, Shamoo DA, et al.(1983) Respiratory effects of sulfur dioxide in heavily exercising asthmatics. Am Rev Respir Dis 127:278-283. Niinimaa V, Cole P, Mintz S, Shepard RJ. (1981) Oronasal distribution of respiratory airflow. Respir Physiol 43:69-75 Nowak D, Jorres R, Berger J, Claussen M, Magnussen H. (1997) Airway responsiveness to sulfur dioxide in an adult population sample. Am J Respir Crit Care Med 156:1151-1156. Peters A, Goldstein IF, Beyer U, Franke K, Heinrich J et al. (1996) Acute health effects of exposure to high levels of air pollution in Eastern Europe. Am J Epidemiol 144:570-581. Rogers JF, Thompson SJ, Addy CL, McKeown RE, Cowen DJ, Decoufle P. (2000) Association of very low birth weight with exposures to environmental sulfur dioxide and total suspended particulates. Am J Epidemiol 151:602-613. Rossi G; Vigotti MA; Zanobetti A; Repetto F; Gianelle V; Schwartz J (1999) Air pollution and cause-specific mortality in Milan, Italy, 1980-1989. Arch Environ Health 54(3):158-64 Schwartz J. (1995) Short term fluctuations in air pollution and hospital admissions of the elderly for respiratory disease. Thorax 50:531-538. Sandström T, Stjernberg N, Andersson M-C, Kolomodifl-Hedman B, Lundgren R, Rosenhall L, Angstrom T. (1989) Cell response in bronchoalveolar lavage fluid after exposure to sulfur dioxide: A time response study. Am Rev Respir Dis 140: 1828-1831. Segala C. (1999) Health effects of urban outdoor air pollution in children. Current epidemiological data. Ped Pulmonol 18(suppl):6-8 Sheppard D, Saisho A, Nadel JA, Boushey HA. (1981) Exercise increases sulfur dioxideinduced bronchoconstriction in asthmatic subjects. Am Rev Respir Dis 123:486-491. 63 Sheppard D, Eschenbacher WL, Boushey HA, Bethel RA. (1984) Magnitude of the interaction between the bronchomotor effects of sulfur dioxide and those of dry (cold) air. Am Rev Respir Dis 130:52-55. Sheppard D, Wong WS, Uehara CF. Nadel JA, Boushey HA. (1980) Lower threshold and greater bronchomotor responsiveness of asthmatic subjects to sulfur dioxide. Am Rev Respir Dis 122:873-878. Speizer FE, Frank NR. (1966) The uptake and release of SO2 by the human nose. Arch Environ Health 12:725-728. Spix C, Heinrich J, Dockery D, Schwartz J, Vilksch G et al. (1993) Air pollution and daily mortality in Erfurt, East Germany. Environ Health Perspect 101:518-526. Sunyer J; Castellsague J; Saez M; Tobias A; Anto JM. (1996) Air pollution and mortality in Barcelona. J Epidemiol Community Health 50 Suppl 1:s76-80 Timonen KL, Pekkanen J. (1997) Air pollution and respiratory health among children with asthmatic or cough symptoms. Am J Respir Crit Care Med 156:546-552. Touloumi G, Samoli E, Katsouyanni K. (1996) Daily mortality and “winter type” air pollution in Athens, Greece - a time series analysis within the APHEA project. J Epidemiol Comm Health 50(suppl 1):S47-S51. Trenga CA, Koenig JQ, Williams PV. (2000) Dietary antioxidants and ozone-induced bronchial hyperresponsiveness in adults with asthma. Arch Environ Health (in press) Vigotti MA; Rossi G; Bisanti L, Zanobetti A, Schwartz J. (1996) Short term effects of urban air pollution on respiratory health in Milan, Italy, 1980-89. J Epidemiol Community Health 50 Suppl 1:s71-5 Wang X, Ding H, Ryan L, Xu X. (1997) Association between air pollution and low birth weight: A community-based study. Environ Health Perspect 107: 514-520. Wiley JA, Robinson JP, Cheng Y-T, Piazza T, Stork L, Pladsen K. Study of Children's Activity Patterns: Final Report. Sacramento: California Air Resources Board; 1991 A733-149 September, 1991. Report No.: A733-149. World Health Organization. (1987) Air quality guidelines for Europe. Copenhagen: WHO Regional Publications, European Series No. 23. Wong TW; Lau TS; Yu TS; Neller A; Wong SL; Tam W; Pang SW (1999) Air pollution and hospital admissions for respiratory and cardiovascular diseases in Hong Kong. Occup Environ Med 56(10):679-83. Zmirou D; Schwartz J; Saez M; Zanobetti A Wojtyniak B; Touloumi G; Spix C; Ponce de Leon A; Le Moullec Y Bacharova L; Schouten J; Ponka A; Katsouyanni K (1998) Time-series analysis of air pollution and cause-specific mortality. Epidemiology (5):495-503. 64 5. OEHHA Recommendations on the Prioritization of Review and Revision Recent evidence summarized in the preceding sections indicates that health effects may occur in infants, children, and other potentially susceptible subgroups exposed to pollutants at or near levels corresponding to several existing California ambient air quality standards. The quality and quantity of the evidence varied by pollutant. As indicated in section 4.1.2, five factors were involved in prioritizing the ambient standards for more extensive review: (1) The extent of evidence of effects reported to occur at or near the existing ambient air quality standard. (2) The nature and severity of those effects. (3) The level of risk of effects anticipated to occur when ambient concentrations are at or near the level of the existing standard. (4) Any evidence indicating that children may be more susceptible to effects than adults. (6) The degree of outdoor exposure in California relative to the level of the standard. Based on OEHHA staff’s application of these factors, the criteria air pollutant standards were categorized into two tiers, with the first tier representing greater potential risks to public health. The first tier includes PM10, ozone, and nitrogen dioxide with the recommended review priority in that order. Although California has a separate standard for sulfates, this class of pollutants represents a subset of PM, and should therefore be considered in conjunction with PM10. Key evidence for ranking these pollutants into the first tier is discussed below. There is substantial evidence of health effects associated with ambient PM10 levels at and possibly below the current State 24-hour and annual standards. These effects range from transient decrements in lung function to severe outcomes, including premature mortality and hospitalization for cardiovascular or pulmonary disease. In addition, the literature suggests the potential for significant health effects occurring in infants and children, including mortality, reduced birth weight, premature birth, asthma exacerbation, and acute respiratory infections. While the levels of risks when ambient concentrations of PM are at or near the standard are of similar magnitude to those of other pollutants, almost everyone in California is exposed at times to levels at or above the current State standard during parts of the year. Epidemiological studies suggest effects of ozone exposure on lung function, asthma exacerbation, and other indices of acute respiratory morbidity in adults and children at ozone levels lower than the current State standard. Controlled studies involving multi-hour exposures also suggest the potential for respiratory symptoms, lung function decrements, airway inflammation and hyper-responsiveness when ambient concentrations are at or near the level of the current ozone standard. A large fraction of California’s population resides in areas in which ozone concentrations occur at or above the current State standard, primarily during daylight hours in the summer. Several recent controlled exposure studies suggest that nitrogen dioxide exposures quite close to the existing ambient standard may enhance the response of allergic asthmatics to airborne allergens. Most childhood asthma has an allergic component, which suggests that ambient NO2 may exert an indirect effect on children. Although California has met the ambient 65 air quality standard for nitrogen dioxide since 1996, levels close to the standard are occasionally recorded at some sites. The second tier includes lead, carbon monoxide, hydrogen sulfide, and sulfur dioxide. Exposure to lead can affect the development of children’s nervous systems, including impacts on intelligence and behavior. Exposure to airborne lead at a level corresponding to the current State standard would not be protective of the health of infants and children, and lead is currently listed as a Toxic Air Contaminant (TAC) with no safe threshold. However, throughout most of California, ambient air exposures to lead are about an order of magnitude lower than the standard. Since there are few areas of the State where ambient lead represents an ongoing public health concern, the review of the ambient air quality standard for lead was placed in the second tier. Evidence from controlled exposure studies suggests that the existing State ambient air quality standards for carbon monoxide and sulfur dioxide are reasonably health protective. However, some evidence from observational epidemiological studies suggests the potential for adverse health effects related to carbon monoxide and sulfur dioxide, including increased risks of hospitalization and premature mortality in the general population at relatively low ambient levels. In contrast, there is little evidence for effects in infants and children. Epidemiological studies suggesting adverse effects attributable to these pollutants are complicated by their correlation with other traffic-related pollutants. Environmental epidemiological studies of health effects associated with exposure to carbon monoxide are likely to be based on ambient measurements that bear little resemblance to individual exposures. Moreover, for hydrogen sulfide and sulfur dioxide, ambient levels are very low relative to the standard throughout most of the State. In addition, the hydrogen sulfide standard received a lower priority for review since it is intended primarily to prevent odor annoyance and associated symptoms, outcomes that are clearly not as serious as those associated with pollutants ranked in the first tier. The prioritization of the ambient standards into first and second tiers may be revised in light of comments from the public and new scientific evidence. Nevertheless, at this juncture, OEHHA staff members believe that the weight of the evidence currently favors the designation of particulate matter as the highest priority pollutant class for review. 66


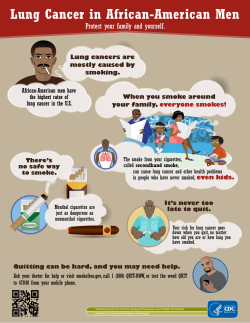


© Copyright 2026