
1 - icnaf
INTERNATIONAL COMMISSION
FOR THE
NORTHWEST ATLANTIC FISHERIES
RESEARCH BULLETIN
NUMBER 9
Issued from the Headquarters of the Commission
Dartmouth, N. S., Canada
1972
Contents
PARSONS, L. S. Use of Meristic Characters and a Discriminant Function for Classifying Springand Autumn-Spawning Atlantic Herring
5
CARROTHERS, P. J. G., and T. J. FOULKES. Measured Towing Characteristics of Canadian East
Coast Otter Trawls
11
BA R INOV, A. A., and V. A. BRYANTSEV. A Volumetric Statistical
Scotia Shelf and Georges Bank Water Masses
Ls Anal y sis of the Nova
21
LEAR, W.11. Food and Feeding of Atlantic Salmon in Coastal Areas and Over Oceanic. Depths
97
V1NOGRADOV, V. 1. Studies of the Food Habits of Silver and Red Hake in the Northwest
Atlantic Area, 1965-67
41
ILALLIDAY, R. G. The Fishery on the Southern Gulf of St. Lawrence Cod Stock, 1960-70
51
POPE, J. G. An Investigation of the Accuracy of Virtual Population Analysis Using Cohort
Analysi••65
PIN HORN, A. T. Virtual Population Assessment of St.Pierre Bank-Newfoundland South Coast
Cod Stock (ICNAF Subdivision 3Ps)
75
COLTON, JOHN B., Jr. Short-Term Variations in Estimates of Chlorophyll Abundance
8I
OLDH AM, W. S. Biology of Scotian Shelf Cusk, Brosnte brosme
85
HODDER, V. M. The Fecundity of herring in Some Parts of the Newfoundland Area
99
ZUKOWSKI, C. Growth and Mortality of Atlantic Argentine, Argentina silus A scanius, on the
Nova Scotia Banks
109
II Al ,LIDA Y, R. G. A Yield Assessment of the Eastern Scotian Shelf Cod Stock Complex
117
Instructions to Authors
125
Use of Meristic Characters and a Discriminant Function
for Classifying Spring-and Autumn-Spawning
Atlantic Herring
By L. S. Parsons'
Abstract
From 79 to 91 percent of individual spring- and autumn- spawning Atlantic herring were correctly classified to their
respective spawning groups by the use of a linear discriminant function based on three meristic characters — pectoral and
anal fin rays and gill rakers. These discriminant function analyses demonstrate that the spring- and autumn-spawning
components of the Southwest Newfoundland-southern Gulf of St. Lawrence herring stock complex constitute distinct
breeding populations, the amount of interchange between spawning groups being slight.
Introduction
The herring concentrations which overwinter in
the fiords of southwestern Newfoundland from late
November to April and support an intensive winter purse
seine fishery consist of two spawning groups, autumn
spawners comprising two-thirds of the population, spring
spawners the remainder (Hodder, 1970; Hodder and
Parsons, MS, 1970; 1971). Studies on this herring stock
complex have revealed significant meristic differences
between spring- and autumn-spawning herring (Parsons
and Hodder, 1971a). Mean numbers of gill rakers and of
pectoral, anal and dorsal fin rays are all higher for
autumn spawners than for spring spawners, with gill
raker and pectoral fin-ray numbers exhibiting the
greatest degree of difference between spawning groups.
Several Canadian investigators who have studied
the vertebral counts of herring in the western North
Atlantic have found no significant difference between
the mean vertebral numbers of spring and autumn
spawners (Jean, 1956; Day, 1957; Tibbo, 1957; Parsons
and Hodder, 1971a). From similarities in mean vertebral
numbers and head length of spring- and autumnspawning herring at Grande Riviere, Quebec, Jean
(1956) concluded that each spawning population was a
mixture of fish hatched in the spring and fish hatched in
the autumn. However, the distinct differences in mean
numbers of fin rays and gill rakers found by Parsons and
Hodder (1971a) indicate that spring- and autumnspawning herring belong to relatively distinct breeding
populations.
To further evalute the use of meristic characters as
indices for racial separation, it is necessary to consider
several characters simultaneously. Fisher (1936) derived
the linear discriminant function, a multivariate statistical
technique for classifying individuals to one of two
populations. This technique has been widely used in
recent years for discriminating between racial groups
(Hill, 1959; Fukuhara et at, 1962; Kilambi, MS, 1965;
Anas and Murai, 1969). Basically this method involves
reducing a set of counts or measurements from an
individual to a single value by which the individual can
be classified as being from one group or the other.
Detailed discussions of the statistical techniques employed in the construction of a discriminant function are
given by Fisher (1936), Mahalanobis (1936), Rao
(1952), Fukuhara at at, (1962) and Andersen (1966).
This paper applies the technique of discriminant
function analysis to herring meristic data for spring and
autumn spawners and assesses the usefulness of such
data for classifying individual herring to their respective
spawning groups.
Materials and Methods
The samples used in this study were taken at
random from the landings of purse sciners which
obtained their catches along southwestern Newfoundland and in the vicinity of the Bird Rocks, just north of
the Magdalen Islands (Table 1).
Stage of maturity was determined by gross
examination of gonads using the various stages of
gonadal development as adopted by ICNAF in 1964
(ICNAF, 1964). Immature specimens have not been
included in the data analyses. Since there was little
change in gonadal development during the period under
consideration (November-April), each of the adults
could be assigned to one of two categories on the basis
' Fisheries Research Board of Canada, Biological Station, St. John's, Newfoundland.
6
ICN A F RESEARCH BULLETIN NUMBER 9, 1972
TABLE I. Date and locality of capture arid maturity condition of herring samples used in this study.
Maturity condition
Sample
No.
2
3
4
6
8
9
10
Date of
capture
Locality
1969
22 Nov.
25 Nov.
25 Nov.
29 Nov.
30 Nov.
I Dec.
I Dec.
4 Dec.
5 Dec.
12 Dec.
Burgeo, Southwest Nfld.
Burgeo, Southwest Nfld.
White Bear Bay, Southwest Nfld.
Cape ',attune, Southwest Nfld.
Bay de Vieux, Southwest Nfld.
White Bear Bay, Southwest Nfld.
Burgeo, Southwest Nfld.
La Poile Bay, Southwest Nfld.
White Bear Bay, Southwest Nfld.
Burgeo, Southwest Nfld.
Immature
1
1
1
4
II
12
13
14
15
16
17
18
19
20
1 Nov.
2 Nov.
2 Nov.
8 Nov,
9 Nov.
17 Nov.
17 Nov.
17 Nov.
17 Nov.
17 Nov.
Magdalen Islands
Magdalen Islands
Magdalen Islands
Magdalen Islands
Magdalen Islands
Magdalen Islands
Magdalen Islands
Magdalen Islands
Magdalen Islands
Magdalen Islands
4
6
5
1
3
1
20
21
22
21 Jan.
28 Jan.
La Poile Bay, Southwest Nfld.
La Poile Bay, Southwest Nfld.
Spring
spawners
Autumn
spawners
Total
10
I1
13
9
14
14
25
10
22
II
40
38
37
41
35
36
25
39
27
39
50
50
50
50
50
50
50
50
50
50
139
357
500
11
10
11
14
14
6
14
10
10
12
39
36
33
31
36
43
33
40
39
38
50
50
50
50
50
50
50
50
50
50
112
368
500
16
26
34
24
50
50
100
42
23
24
1970
1 Apr.
1 Apr.
Grand Bay, Southwest Nfld.
Pigeon Island, Southwest Nfld.
16
19
34
31
50
50
35
65
100
of gonadal development. Those with well-developed
gonads (Stage IV) were designated as spring spawners
and those showing little if any gonad development
(Stage VIII) were classed as autumn spawners.
IBM 1130 computer (Pienaar and Thomson, MS. 1967)
as modified by F. J. Sandeman of the St. John's
Biological Station.
Meristic counts were determined as described by
Parsons and Hodder (1971a). Three meristic characters
were used in the discriminant function analyses
— pectoral arid anal fin rays and gill rakers on the lower
branch (hypobranchial and ceratobranch ial) of the first
left gill arch. The few damaged specimens for which
meristic data were incomplete were not included in these
analyses. Discriminant analyses were made with the
Multiple Discriminant Analysis Program (DESCH) for the
Results
Analyses of variance showed no significant (P >
0.05) meristic variation between samples within each
major period and area for either spring or autumn
spawners. Arithmetic regression coefficients of mcristic
number on total length did not differ significantly. (P >
0.05) from the null hypothesis; hence, length was not
considered to be a source of variation.
7
PARSONS: CLASSIFYING SPRING- AND AUTUMN-SPAWNING ATLANTIC HERRING
A linear discriminant function was computed for
131 spring spawners and 343 autumn spawners from
southwestern Newfoundland taken during late November-early December 1969. Means and differences between means of the two spawning groups are given in
Table 2. The discriminant function for these data is
classified as autumn spawners. An analysis of variance
revealed that differences between the two spawning
groups were significant at less than the 0.001 level
(F 3 ,4 7 0 129.34).
The variance of Y is D 2 and is given by
Y = 0.9157X, + 0.3420X 2 + 0.2110X3
D2
In this equation X,, X2 and X3 represent the numbers
of pectoral and anal fin rays and gill rakers respectively.
TABLE 2. Means and differences between means for autumn
and spring spawners from southwestern Newfoundland (November-December 1969).
Character
Mean for
autumn
spawners
Mean for
spring
spawners
Difference
Pectoral fin rays (Xi)
18.571
17.183
1.388
Anal fin rays (X2)
18.149
17.595
0.554
Gill rakers (X3)
49.163
47.573
1.590
The estimated mean values of the coefficients of
the discriminant function for the spring spawners (Y5)
and the autumn spawners (Y u ) were determined by
substituting X i , the mean numbers of each of the three
meristic characters for each spawning group, into the
function. The values of Y, and Ya were 31.792 and
33.588 respectively. Therefore, in discriminating between the two spawning groups, those fish with a value
of Y less than 32.690 are classified as spring spawners
and those with values of Y more than 32.690 are
= 15d1 +1 2 d 2 +13d3
where I I , 1 2 and / 3 are the coefficients of the
discriminant function and d 1 , d 2 and d 3 are the
differences between the estimated population means of
the three characters (Table 2). The probability of
correctly assigning an individual fish to its respective
spawning group is equal to the probability that a normal
deviate with mean zero and standard deviation of 1 will
be less than or equal to '/2D (Rao, 1952). Since D 2 in
this instance is 1.796, the probability of misclassification
is approximately 25.2%. This error of classification
would be the proportion of spring spawners having Y
values less than 32.690 and the proportion of autumn
spawners having Y values more than 32.690.
This discriminant function was then used to
classify individual fish in the original samples from
which the function was derived and also to classify
individuals in January 1969 and April 1970 samples
from southwestern Newfoundland and November 1969
samples from the Magdalen Islands area. The resulting
frequencies and percentages of Y values above and below
the critical value 32.690 (Y o ) are shown in Table 3. The
percentages of misclassification of autumn spawners in
the January 1969 and April 1970 samples from
southwestern Newfoundland and the November 1969
samples from Magdalen Islands were in close agreement
TABLE 3. Frequency and percentage of the values (Y) of the discriminant function above and below the critical value 32.690 (Y 0 ) for
autumn and spring spawners from southwestern Newfoundland and Magdalen Islands.
Classification matrix
Percent
Frequency
Locality and
time of capture
Spawning'
group
Y > 1702
<11 , 3
Total
Y > Yo 2
Y < Yo'
Southwestern Nfld.
(Nov.-Dec. 1969)°
Autumn
Spring
287
18
56
113
343
131
83.7
13.7
16.3
86.3
Southwestern Nfld.
(Jan. 1969)
Autumn
Spring
47
8
11
34
58
42
81.0
19.0
19.0
81.0
Southwestern Nfld.
(Apr. 1970)
Autumn
Spring
56
7
9
27
65
34
86.2
20.6
13.8
79.4
Magdalen Islands
(Nov. 1969)
Autumn
Spring
290
10
70
98
360
108
80.6
9.3
19.4
90.7
' Based on gonad maturity. 2 Classified as autumn spawners. 3 Classified as spring spawners. °Source data for discriminant function.
8
ICNAF RESEARCH BULLETIN NUMBER 9, 1972
with the percentage of misclassification of the southwestern Newfoundland autumn spawners used in the
construction of the discriminant function. Percentages
of misclassification of spring spawners in the January
1969 and April 1970 southwestern Newfoundland
samples were very similar to that resulting from
classification of the southwestern Newfoundland spring
spawners upon which the function was based. The
percentage of misclassification for Magdalen Islands
spring spawners (9.3%) was even less than for those from
southwestern Newfoundland.
The actual errors of misclassification for both
spawning groups were in all instances less than the 25.2%
average error of misclassification inherent to the
function. Percentages of correct classification range from
80.6 to 86.2% for autumn spawners and from 79.4 to
90.7% for spring spawners.
Discussion
Meristic characters exhibit plasticity under the
influence of environmental factors, especially temperature, during the incubation period and early larval
life (Schmidt, 1921; Vladykov, 1934; Lining, 1944;
Lindsey, 1954; Barlow, 1961). Hempel and Blaxter
(1961) demonstrated that the myotome count of
Atlantic herring is determined before hatching and that
vertebral number is modified by incubation temperature.
However, Barlow (1961) cites several studies which have
shown a genetic as well as a phenotypic basis for meristic
characters in various fish species. Differences in the
mean numbers of fins rays of spring- and autumnspawning Atlantic herring appear to be related to water
temperatures during early development and to differences in developmental rates of spring- and autumnhatched larvae (Parsons and Hodder, 1971a). Autumnhatched larvae develop during a period of declining
water temperatures in the autumn; spring-hatched larvae
develop during a period of increasing water temperatures. Thus temperatures at the time of fin ray
fixation, which apparently occurs during the larval stage
(Lebour, 1921; Thing, 1944; Blaxter, 1962), are higher
for spring-hatched than for autumn-hatched larvae.
Autumn-hatched larvae have a longer period of development than spring-hatched larvae (Jean, 1956) and,
hence, would be expected to have higher mean fin ray
numbers than spring-hatched larvae.
Blaxter (1958) presented evidence which suggests
that the difference in spawning season between the two
groups is genetical and is based on different responses to
the environment. In an earlier paper Blaxter (1956)
reported that under experimental conditions springspawned eggs were markedly inviable at autumn spawning temperatures. He concluded that in typical springand autumn-spawning herring groups reproductive
isolation exists, although a slight amount of interchange
probably occurs, and suggested that spring- and autumnspawning herring may be referred to as different sibling
species, using the main criterion of difference in
breeding season.
The results of the discriminant function analyses
reported here support the conclusion of Parsons and
Hodder (1971a) that the spring- and autumn spawning
components of the herring stock complex which
migrates eastward from the southern Gulf of St.
Lawrence in the autumn to overwintering areas along
southwestern Newfoundland and westward again into
the Gulf in the spring (Hodder and Parsons, NIS, 1970;
1971; Hodder and Winters, MS, 1970; Winters, 1970;
Parsons and Hodder, 1971b) are not members of a
homogeneous group but constitute distinct breeding
populations which developed at different times of the
year under different environmental conditions. From 79
to 91% of individual spring and autumn spawners can be
correctly classified to their respective spawning groups
by the use of a linear discriminant function based on
three meristic characters. This clearly demonstrates that
the vast majority of autumn spawners are the progeny of
herring which spawned in the autumn and spring
spawners of herring which spawned in the spring. The
amount of interchange between the two spawning
groups is probably slight.
Acknowledgements
The author is indebted to Messrs E. J. Sandeman
and W. 11. Lear for assistance in computer programming,
Messrs C. 1. Barbour, R. Chanlk, and R. Sullivan who
assisted in the examination of the specimens and Mr V.
M. Hodder who read the manuscript and offered
suggestions for improvement.
PARSONS: CLASSIFYING SPRING- AND AUTUMN-SPAWNING ATLANTIC HERRING
References
ANAS, R. E., and S. MURAI. 1969. Use of scale characters and a
discriminant function for classifying sockeye salmon
(Oncorhynehus nerka) by continent of origin. Bull. int. N.
Pacif. Fish. Comm., 26: 157-192.
ANDERSEN, K. P. 1966. Classification of lnopidae by means of
principal components and discriminant functions. Galathea
Rept., 8: 77-90.
BARLOW, G. W. 1961. Causes and significance of morphological
variation in fishes. Syst. Zool., 10(3): 105-117.
BLAXTER, J.H.S. 1956. Herring rearing - II. The effect of
temperature and other factors on development. Mar. Res.,
No. 5, 19p.
1958. The racial problem in herring from the viewpoint
of recent physiological, evolutionary and genetical theory.
Rapp. Cons. Explor. Mer, 143 (II): 10-19.
1962. Herring rearing - IV. Rearing beyond the
yolk-sac stage. Mar. Res., No. 1, 18 p.
DAY, L. R. 1957. Populations of herring in the southern Gulf of
St. Lawrence. Bull. Fish. Res. Bd. Canada, 111: 121-137.
FISHER, R. A. 1936. The use of multiple measurements in
toxonomic problems. Ann. Eugen., 7(2): 179-188.
FUKUHARA, F. M., S. MURAL J. J. LaLONNE, and A.
SRIBHIBHADH. 1962. Continental origin of red salmon as
determined from morphological characters. Bull. int. N.
Pacif. Fish. Comm., 8: 15-109.
HEMPEL, G., and J.H.S. BLAXTER. 1961. The experimental
modification of meristic characters in herring (Clupea
harengus L.). J. Cons., 26: 336-346.
HILL, D. R. 1959. Some uses of statistical analysis in classifying
races of American shad (Alosa sapidissima). Fish. Bull.,
U.S., 147: 269-286.
HODDER, V. M. 1970. Recent developments in the Newfoundland herring fishery. Fish. Res. Bd. Canada, Biol. Sta. St.
John's, Nfld., Circ., 18: 1-19.
HODDER, V. M., and L. S. PARSONS. MS , 1970. A
comparative study of herring taken at Magdalen Islands and
along southwestern Newfoundland during the 1969 autumn
fishery. Anna. Meet. int. Comm. Northw. Atlant. Fish.
1970, Res. Doc. No. 77. Serial No. 2425 (mimeographed).
1971. Comparison of certain biological characteristics of
herring from Magdalen Islands and southwestern Newfoundland. Res. Bull. Mt. Comm. Northw. Atlant. Fish.,
No. 8, p. 59-65.
HODDER, V. M., and G. H. WINTERS. MS , 1970. Preliminary
results of herring tagging in southwestern Newfoundland,
March 1970. Annu. Meet. int. Comm. Northw. Atlant. Fish.
1970, Res. Doc. No. 89, Serial No. 2440 (mimeographed).
9
ICNAF. 1964. Report of Standing Committee on Research and
Statistics. App. I. Report of ad hoc group on herring and
other pelagic fish. /nt. Comm. Northw. Atlant. Fish.
Red book 1964, Part I: 23-30.
JEAN, Y. 1956. A study of spring. and fall-spawning herring at
Grande Riviere, Bay of Chaleur, Quebec. Contr. Dept.
Fish., Quebec, No. 49, 76 p.
KILAMBI, V. R. MS, 1965. Heterogeneity among three
spawning populations of the surf smelt, Hypomesus
pretiosus (Girard) in the State of Washington. Ph.D. Thesis.
University of Washington.
LEBOUR, M. V. 1921. The larval and post-larval stages of the
pilchard, sprat and herring from the Plymouth District. J.
mar. biol. Ass. U.K., 12(3): 427-457, 12 figs.
LINDSEY, C. C. 1954. Temperature-controlled meristic
variation in the paradise fish Macropodus opercularis (L.).
Canad. J. Zoot, 32: 87-98.
MAHALANOBIS, P. C. 1936. On the generalized distances in
statistics. Proc. Nat. Inst. Sci. India, 2(1): 49-55.
PARSONS, L. S., and V. M. HODDER. 1971n. Meristic
differences between spring- and autumn-spawning Atlantic
herring (Clupea harengus harengus L.) from southwestern
Newfoundland. J. Fish. Res. Rd. Canada, 28: 553-558.
19716. Variation in the incidence of larval nematodes in
herring from Canadian Atlantic waters. Res. Bull. int.
Comm. Northw. Atlant. Fish., No. 8, p. 5-14.
PIENA AR, L. V., and J. A. THOMSON. MS , 1967. A program
for multiple discriminant function (FORTRAN 1130).
Fish. Res. Bd. Canada, Tech. Rept., No. 40, 32 p.
RAO, R. C. 1952. Advanced statistical methods in biometric
research. John Wiley and Sons, Inc., New York, 390 p.
SCHMIDT, J. 1921. Racial investigations. VII. Annual fluctuations of racial characters in Zoarces viviparus L. C. R. Lab.
Carlsberg, 14: 1.24.
TANING, A. V. 1944. Experiments on meristic and other
characters in fishes. I. On the influence of temperature on
some meristic characters in sea-trout and the fixationperiod of these characters. Medd. Kamm. Fisk. Havunders0g., 11(3): 1-66.
TIBBO, S. N. 1957. Herring of the Chaleur Bay area. Bull. Fish.
Res. Bd. Canada, 111: 85-102.
VLADYKOV, V. D. 1934. Environmental and taxonomic
characters of fishes. Trans. R. Canad. Inst., 20: 99-140.
WINTERS, G. H. 1970. Preliminary results of herring tagging in
southwest Newfoundland coastal waters, 1970. Fish. Res.
Bd. Canada, Biol. Sta. St. John's, Nfld., Circ., 18: 20-24.
Measured Towing Characteristics of Canadian
East Coast Otter Trawls
By P. J. G. Garrothers and T. J. Foulkes
Abstract
Nine different commercial types of groundfish trawls in 15 different riggings have been measured by recording
instruments over a wide range of towing speeds during special experimental tows.
The dependence of headline height, wing spread, total trawl drag, and average warp tension on the speed of the trawl
through the water is presented graphically, and some of the more obvious functional trends are discussed.
The Trawl Research Program
The purpose of the major fishing gear engineering
research program at the Fisheries Research Board of
Canada Biological Station, St. Andrews, New Brunswick,
is to establish verified engineering principles for the
rational design of groundfish otter trawls such as are
used by the Canadian fisheries in the Northwest
Atlantic. The first phase of the program was the
development of suitable, specialized instrumentation, as
described by Carrothers (1968) for measuring pertinent
variables in full-scale trawls while under tow. The second
phase of the program was to take measurements with
typical commercial trawls under experimental conditions
at sea. The data so acquired have been subjected to
primary reduction and have been reported in detail by
Carrothers et. al., 1969. The third phase of the program,
now under way, is the analysis of these data, including
the extension of information available from them
through recognized engineering principles.
was calculated from the hydrodynamic or stagnation
pressure as measured by a recording pitotmeter
suspended in the mouth of the trawl from near the
centre of the headline.
The range of the data points about these curves is,
on the average: headline height ± 0.5 ft, wing spread ±
2.0 ft, total drag force ± 500 lb, average warp tension ±
300 lb. The data points were not scattered randomly
about the given curves, but tended to be concentrated in
discrete curves for different tows, indicating that some
factor in addition to speed through water was affecting
the variable being measured. This was particularly true
of headline height.
In general, as a result of ocean currents, the speed of
the trawl through the water was different from the speed
of the vessel through the water and from the speed of tow
relative to the sea floor. The plots against trawl speed
through the water gave the most consistent results and,
hence, are presented here. The other speeds plus the ocean
currents near the surface and near the sea floor were measured and will be included in the detailed analysis.
Preliminary Results
The purpose of this paper is to present a summary
of the most salient features of Canadian otter trawl
behaviour as revealed by these experimental data. The
attached charts give curves for the total drag force at the
towing block (in pounds divided by 100), the average of
the two warp tensions (in pounds divided by 100), the
distance between the two wing tips (in feet), and the
height of the centre of the headline above the sea floor
(in feet multiplied by 10), all plotted against the speed
of the trawl through the water in knots. The trawl speed
Most of the measurements were taken on Sable
Island Bank, Western Bank, Emerald Bank, and in
Northumberland Strait between Prince Edward Island
and Cape Breton Island, under relatively good
conditions. Sites were selected to have relatively smooth
and level sea floor for a radius of about 5 miles, and
experiments were conducted in relatively good weather
to avoid excessive data fluctuations from vessel motion.
Generally, the codend was left open to avoid variations
resulting from accumulating catch and to improve the
reproducibility of the data.
' Fisheries Research Board of Canada, Biological Station, St. Andrews, New Brunswick.
12
ICNAF RESEARCH BULLETIN NUMBER 9, 1972
Headline Height
In all but one case, the height of the headline
above the sea floor is seen to decrease with increasing
trawl speed. This correlation was also observed by Crewe
(1964) in British trawls and is a result of the changing
balance of forces on the headline. Generally, the
hydrodynamic forces, including drag of the headline,
floats, etc., increase approximately as the square of the
towing speed through the water. On the other hand, the
hydrostatic lift (buoyancy) of the floats remains
essentially constant, independent of the towing speed.
Thus, because the headline is towed by its ends from
points near the sea floor, as speed is increased in the
absence of increase in lift force, the increasing drag
force, acting sternward on the headline, forces the centre
of the headline aft and down. Obviously, the desired
towing speed must be taken into account when selecting
the number of floats, higher speeds requiring more floats
for the same headline height. This trend applies only to
the range of conditions encountered while the
measurements were being taken; the effect of added
flotation decreases as the amount of flotation present
and the towing speed are increased.
Wing Spread
Generally, the transvere distance between the two
wing tips (wing spread) is seen to remain essentially
constant with changing towing speed. By contrast with
the constant hydrostatic lift force from the floats, the
spreading force from the doors is predominantly
hydrodynamic in nature, increasing approximately as the
square of the towing speed through the water. Thus, as
the drag force increases with increasing speed, the ratio
between the spreading force and the drag force, and
hence also the wing spread, remain essentially constant.
Trawl Drag
The total drag of British trawls was reported by
Crewe (1964) to increase essentially linearly with
increase in speed. However, our data from Canadian
trawls consistently show a curvilinear relationship. The
drag of a trawl may be described by the expression
I)
C D • A • (0.5 p V2)
Where D = total drag of the trawl in pounds,
A = effective hydrodynamic area of the trawl
in square feet,
p=
mass density of sea water
= 1.99 lb-sect / ft4
(SG •-= 1.026 ; y = 64 lb-f/ft3
ft/sec 2)
= 32.17
V = towing speed in relation to the water in
feet per second (1 knot = 1.688 ft/sec),
0.5 p V 2 = q = hydrodynamic or stagnation pressure in
pounds per square foot,
CD = dimensionless drag coefficient, characteristic of a particular trawl but generally
dependent on the towing speed and on
the particular shape assumed by the
trawl in the water.
Crewe (1964) used the frontal area of his trawl as the
effective hydrodynamic area (A) and considered the drag
coefficient (CD ) to be essentially constant within his
range of experimental conditions. The linear relationship
between the trawl drag (D) and the towing speed (V)
then implies that the frontal area of the trawl varies
inversely as the towing speed. The Canadian data agree
with this concept in a very general way, e.g., at constant
wing spread, the headline height vs speed curve is
concave upward and slopes down to the right (rectangular hyperbola). However, contrary to Crewe, the
Canadian drag vs speed data are persistently curvilinear,
and generally the curves extrapolate to the V = 0 axis at
some finite drag, i.e., they arc not of the form D = kV2
where k a constant. This implies that the drag coefficient
( CD ) is not constant but assumes higher values at lower
towing speeds — a trend in common with most
submerged objects at relatively low Reynold's numbers.
The selection of the frontal area of the trawl as the
"characteristic" hydrodynamic area ( A ) should also be
questioned further, even though changes in frontal area
help to explain apparent anomalies in the drag vs speed
relationship. The hydrodynamic drag of a trawl is caused
primarily by inertial pressure forces exerted by the water
on the various solid parts of the trawl; but the frontal
area of a trawl is by no means solid. At constant frontal
area, trawl drag at a given towing speed is changed by
changes in the ratio of twine thickness to mesh size or
by changes in the taper rates, causing corresponding
changes in the value of the drag coefficient (C D ) when
the frontal area is taken as the hydrodynamic area. Also,
the frontal area of a given trawl varies during the course
of a tow and would have to he monitored continuously
in order to be useful. Modern hydrodynamic theory for
screens uses the plane area of the screen as the
hydrodynamic area, but if this were done for trawl
netting, the drag coefficient (CD ) would become very
much a function of the angle of attack of the water onto
the netting. The solid area of the knots and mesh bars
13
CORROTHERS AND FOULKES: MEASURED TOWING CHARACTERISTICS OF OTTER TRAWLS
projected onto the plane of the netting and the frontal
area of floats, etc. are constant and measureable for any
given trawl, but if these areas are totalled for the
effective hydrodynamic area (A), then known hydrodynamic interference between various trawl components
would cause the drag coefficient (C D ) to be very much a
function of the particular shape assumed by the trawl
under various towing conditions. The selection of the
most useful hydrodynamic area (A) will have to await a
deeper understanding of the fluid mechanics of netting.
Trawl Type
Yankee 36
Material
Laid Polythene
Footrope
16 in, Rollers
Brid l
6rou nd Warps
120 rt
Boo •
4.1 a 7.5 ft. 700 lb
Towi ng Warps
450 ft
Dep t h
145 It
Test Date
Sept. 1965
160
ISO
40
130
120
120
110
110
100
100
Warp Tensions
Headline xeignt a 10 (f )
The average of the tensions in the two warps is
greater than half the total drag of the trawl because two
other force components, in addition to trawl drag,
contribute to the tensions in the warps. These other
components originate in the spreading forces exerted
transversely by the doors and in the downward force
exerted by the weight of the warps in the water and by
part of the weight of the doors as the warps try to lift
them off the sea floor. The total drag is the only force
from the trawl which must he overcome by the
propulsion of the vessel. The warp tension, which is the
vector sum of the drag force, the spreading force, and
the weight force, is the stress which determines the
required strength of the warps, towing block, gallows,
etc.
90
90
80
80
70
TO
60
60
50
50
40
40
Wingspread (ft)
3C
30
Total Dra9/100 (1h)
2C
20
Warn Tension/100 11.
.2),
IC
10
0
I
2
3
Trawl speed throe h water
Yankee 35
Trawl Type
Yankee 41-5
Material
Laid Polythene
Material
Laid Polythene
rooftops
4 in. Discs
Footrope
7 in. Discs
Bridles
Grou nd Warps
180 ft
Door s
4,5 a 10.0 ft. 1600 lb
Towi 19 Warps
Dept h
710 rt
Test Date
Aug.
160
Grou nd Warps
90 ft
Door s
3.5 a 6.5 ft, 450 lb
Towi ng Warps
450 ft
Dept h
144 ft
Test Dots
Sept. 1965
ISO
140
n
5
(Kno s/
Fig. 2
Trawl Type
Brid
4
30 ft
160
150
216 ft
140
1966
130
130
120
120
120
120
110
110
110
110
100
100
100
100
0
90
90
80
80
90
9
80
Headline Height x 1
BO
Headline Height it 1
(ft
70
TO
60
60
TO
70
60
In tat
50
50
Par
...„
Oren/100
( It )
.....
60
50
50
wingspread (ft)
40
30
20
10
0
Wingspread (ft)
40
40
30
30
alarn
Total Drag/100 (lb)
_warp Tenslon/100 1 1 )
2
3
Trawl speed through water
Fig. 1
4
(Knots)
5
20
20
10
10
0
0
Ten a
40
I on / 1 00 (1
1111
I
30
20
10
0
2
3
Trawl speed through water
Fig. 3
4
(Knots)
5
14
ICNAF RESEARCH BULLETIN NUMBER 9, 1972
Specific Functional Trends
The Yankee 35 trawl (52-ft headline, 76-ft
footrope) and the Yankee 36 trawl (60-ft headline, 80-ft
footrope) of Figs. I and 2 are essentially the same
except that the Yankee 36 has longer wings and, in this
case, is fitted with heavier footrope and doors and with
longer ground warps. The higher headline of the Yankee
36 trawl probably results from the longer wings. The
wing spread of the Yankee 36 trawl was the wider of the
two, in spite of the longer ground warps, both because
of the longer wings and because of the larger doors. The
greater drag of the Yankee 36 can be expected from the
larger doors and heavier footrope and, to some extent,
from the longer wings.
Trawl Typo
Yankee 41-5
Material
Braided Polythene
Footrope
21 in. Rollers
Grid
160
Grou Teri Warps
180 ft
Doer
4.5 x 10.5 ft, 1705 lb
Towi ng Warps
919 ft
Deg 11
328 ft
Test Date
Sept.
A
1968
NM
re
120
110
Headline Melon( x li
....r
100
90
Total Oral/100 0
60
TO
The data in Figs. 3, 4, and 5 are for three Yankee
41-5 trawls (79-ft headline, 100-ft footrope) in which
the most pronounced difference was the weight of the
footrope. The wing spread of the three trawls is
remarkably consistent. The progressively higher headline
with successively heavier footrope is probably caused by
the bosom of the footrope being pushed aft with respect
to the wing tips by the increased drag, providing slack in
the netting and allowing the headline to rise. The trawl
for Fig. 5 also had somewhat more flotation in the
bosom, lifting the headline even further. Warp tensions
and total drag are expectedly higher with heavier
60
h
Warp Tension/100
50
Sp r Baer
40
0
2
3
Trawl speed through water
Braided Polythene
Footrope
Grid
Grou nd Warps
18 in. Rollers
Footrope
21 In. Rollers
60
180 ft
Grid
Oro nd Warps
120 ft
Door II
4.5 x 10.0 ft, 1600 lh
ISO
Dooi
4.5 0 10.5 f2. 1700 lb
Towi im Warps
710 ft. 998 ft
Towi
Dept h
215 ft. 284 ft
Dept h
327 ft
Test Dote
Aug.
Test Date
Sept.968
4
90
A
ri
■moss
80
70
Total Drag/100 (lb)
60
F
Na
50
Wingspread
40
(ft)
Warn Tension
0
50
40
5
0
1 02
Warps
60
50
919 ft
A
40
30
20
120
41
Headl 1 ne Hei o ht ii 13 (ft)
hi
60
(Knots)
30
Headline Height a u
70
Fig. 5
Yankee 41-5
10
60
10
Material
110
90
10
Trawl Type
100
100
20
Laid Polythene
20
120
110
20
Yankee 41-5
120
130
30
Material
40
140
30
Trawl Typ e
1966
150
110
10
00
100
90
90
60
80
80
70
70
70
60
60
00
90
Total
Dra g /100 (lb)
60
Warn Tension/100 (15)
50
50
SO
Vino Spread
(ft)
40
40
40
30
30
30
20
20
20
20
10
10
10
10
0
0
30
0
I
2
3
Trawl s p eed through water
Fig. 4
4
(Knots)
5
0
I
2
3
4
Trawl speed through water Knots)
Fig. 6
5
15
CARROTHERS AND FOULKES: MEASURED TOWING CHARACTERISTICS OF OTTER TRAWLS
footrope. Changing the depth and correspondingly
changing the warp length for the trawl in Fig. 4 made no
noticeable difference to its towing characteristics.
The data in Figs. 5 and 6 are for the same trawl
except that the ground warps were shorter for Fig. 6.
The shorter ground warps expectedly extended the
spread of the wings, but the higher headline is a little
harder to explain. It is possible that the wider wing
spread shifted the division of load on the wing bridles
toward the upper bridles or that the greater tension in
the shorter ground warps reduced sag, thereby raising
the forward ends of the wing bridles and elevating the
whole headline, or it is possible that the wider spread permitted a greater hydrodynamic lift on the netting and/or
headline. The warp tensions and total drag are, if anything,
decreased by using the shorter ground warps, despite the
associated increase in frontal area of the trawl.
The data in Fig. 7 are for the same trawl as those
in Figs. 5 and 6 except that the 30-ft bridles have been
replaced by shorter bridles, Danleno butterflies, and
bobbins. The total distance from the wing tips to the
doors is essentially the same in the trawl for Fig. 7 as in
the trawl for Fig. 6. Unfortunately, the wing-spread
meter was riot functioning with the Danleno gear. The
headline was noticeably lower with the Danleno gear
than with either of the trawls with wing bridles, showing
the advantage of bridles, even as short as 30 ft, when
towing on smooth sea floor. The Danleno gear also
increased the total drag and the tensions in the warps; at
the same engine speed the trawl with the Danleno gear
towed more slowly than the trawls with wing bridle gear.
The data in Fig. 8 are for a Yankee 41-5 trawl
made of bitumen-treated nylon netting which is slightly
heavy in sea water (weight in sea water a: 9.3 lb/100 lb
weight in air) compared with the polyethylene netting,
which is slightly buoyant (residual buoyant force in sea
water a 6.8 lb/100 lb weight of netting in air), used in
all the trawls so far reported. For Fig. 8: the doors were
the same size as for Figs. 5 and 6, larger than for Fig. 4,
and heavier than for all three; the footrope was about
the same as for Fig. 4 and lighter than for Figs. 5 and 6;
and the ground warps were shorter than for all three.
Unfortunately, the headline height meter was inoperative on the nylon trawl. The wing spread was about the
same as in Figs. 4 and 5; the tendency for shorter ground
warps and larger doors to increase wing spread was
off-set by the greater drag of the trawl-net itself. The
greater total drag of the nylon trawl is in part due to the
heavier doors and in part to the netting.
Trawl Type
Yankee 41-5
Trawl Type
Yankee 41-5
Material
Braided Polythene
Material
Treated Laid Nylon
Footrope
21 In. Rollers
Grid
.., ., .,.
Grou nd Warps
138 ft
Door
Towi ng Warps
4.5 a 10.5
919 ft
Dept h
328 ft
Test Dote
Sept. 1968
1700 lb
/
Footrope
18 In. Rollers
160
Brid --
-- . _
ISO
Grou nd Warps 90 ft
4.5 a 10.5 ft, 1800 lb
Door S
140
Dept
160
150
'fowl ng Warps 671 ft
220 ft
Oct. 1965
Test Date
n
140
130
130
120
120
120
110
110
110
100
100
MO
90
90
90
90
80
80
80
120
Total
Dra9/100 (lk)
110
100
Headline Hein
13 (ft)
80
Total Oran//00 (It)
70
70
60
60
60
50
50
50
70
70
/
Warn Tension/1HO (11))
60
50
Wingspread (ft)
40
40
30
30
40
30
40
Warp Tension/Ind (15)
30
20
20
20
20
10
10
10
10
0
0
0
I
2
3
Trawl speed through water
Fig. 7
4
(3110
5
0
2
3
Trawl speed through water
Fig. 8
4
(Woo
0
5
16
ICNAF RESEARCH BULLETIN NUMBER 9, 1972
Figures 9 and 10 vis-a-vis Figs. 11 and 12 compare a
Yankee 41 trawl (79-ft headline, 100-ft footrope) made
from bitumen-treated, iso-tactic polypropylene, multifilament (Ulstron) netting with a similar trawl made
from the usual, high-density polyethylene netting. The
treated-Ulstron netting was slightly less buoyant
(residual buoyant force in sea water = 5.7 lb/100 lb
weight of netting in air) than the polyethylene netting.
Both trawls were measured while being towed in two
different rigs. In both rigs, the treated-Ulstron trawl had
about 15% more flotation on the headline than did the
polyethylene trawl. With rectangular doors, the total
drags of the two trawls are very similar, but for some
reason the treated-Ulstron trawl displays a narrower
wing spread. The higher headline of the treated-Ulstron
trawl results from this narrower wing spread and the
greater flotation. With slotted, oval doors, the wing
spreads of the two trawls are very similar, but the
treated-Ulstron trawl has lower total drag. Apparently
the lower total drag is a reflection of lower netting drag
which, combined with the greater flotation, results in
the higher headline. The higher headline of the
treated-Ulstron trawl at the same wing spread as the
polythene trawl gives a larger frontal area in association
with lower drag, once more contradicting the functional
dependence of drag on frontal area claimed by Crewe
(1964). The treated-Ulstron trawl behaves much more
like a polyethylene trawl than does the treated nylon
trawl (Fig. 8), even though the nylon netting and the
Ulstron netting are very similar in general appearance.
Figures 9 and 11 vis-a-vis Figs. 10 and 12 compare
the behaviour of the usual rectangular trawl doors with
single-slot oval doors on the same Yankee 41 trawls. The
oval doors were smaller (30 sq ft vs 43 sq ft) and lighter
(1,430 lb vs 1,600 lb) than the rectangular doors. With
this size disadvantage, the oval doors produced a
narrower wing spread, although this wing spread was
similar to that reported in Figs. 3 to 6 for Yankee 41-5
trawls with rectangular doors. The wing spreads reported
for the rectangular doors in Figs. 9 and 11, particularly
with the polyethylene trawl, are exceptionally wide.
Associated with the narrower wing spread when using
the oval doors is the expected higher headline. Of
particular interest is the shape of curves for wing spread
and headline height when using the oval doors. The
correlation between wing spread and headline height is
sustained through the serpentine shape of both sets of
curves, with the increased drag at higher speeds
superimposing a downward trend on the headline height
curves. This serpentine shape probably results from the
lift (spreading force)/drag characteristics of the oval
doors, which apparently pass through a minimum at
about 3.8 knots and result in an unusual increase in wing
spread with increase in spreed above this point. This
change in lift/drag ratio with towing speed may be a
function of the heel angle of the doors, in which case the
Trawl Type
Material
Foot. as
firm
Ora nd Warps
Doe re
Tow i ng Warps
Dept h
Test Dots
Yankee 41
Laia Polythene
18 i n. Roll ers
160
190 ft
4.5 0 4.5 ft. 1600 lb
10 00 ft
321
July, 1961
110
100
Headline Mel ght 4 1
90
80
Total Drag/100 ( 1 b
70
1 ng Spread ( ft)
50
40
30
140
130
V
120
60
150
Harp Tens ion/100 (I
20
ti'n
ra
n
120
10
00
_
90
MI/
IA
Er
A
modlirthria
80
70
60
an
a
50
40
30
20
10
10
0
1
2
3
4
Trawl speed through voter (IC no e)
5
0
Fig. 9
Trawl Type
Material
Footrope
Brie
Grou nd Warps
Doo s
Towi rig Warps
Dap t h
Test Date
Yankee 4
1
Laid Polythene
18 i n. Rollers
160
180 ft
4.8 a 8.0 ft Oval (06 7.1430
.1430
1000 ft. 1150 ft
330 ft
duly. 1961
150
140
130
120
110
100
Headline Height a la
90
0
70
60
Total Drag/100 11)
50
Wing Spread (f t )
40
30
20
Corp repo nn/100 11
nr
41111,
►AI
AU
I
All A
120
10
100
90
80
70
60
IIIIIIIES
50
Mil
40
30
20
10
0
TO
2
3
4
Trawl speed through water ( K no s)
Fig. 10
5
0
17
CARROTHERS AND FOULKES: MEASURED TOWING CHARACTERISTICS OF OTTER TRAWLS
Trawl Type
Yankee 41
Trawl Type
Skagen
Material
Treated Laid Ulstron
Material
Braided Polythene
Footrope
Rounded
Footro p e
18 in. Rollers
Brid
—
..
Gro 0d Wa rp s 180 ft
Dow $
4.5 . 9.5 ft.
Towi ng Warps
1000 ft,
1600 lb
1002 ft
Dept h
327 ft
Test
July. 1967
Dote
Brid l
MO
160
Grou rid Warps
ISO
10.0
Door •
4.5 .
Towi ng Warps
710 ft
Dep
140
180 ft
h
ft.
1600 lb
150
220 ft
Test Date
Aug.
140
1966
/
130
130
120
120
120
120
110
110
110
110
MO
100
IOC
90
90
80
60
TO
TO
100
Headline Height x 1
90
Alill
WA
80
Total Ora
70
9/100 llb
r MI
60
50
xt g Spread In/
40
Warp Tension/100 l
30
Irlir
rr
Or
PIN
60
60
50
50
40
40
-
10
Trawl speed through water
Treated Laid Ulstron
Footrope
18 in. Rollers
Brid es
Grou nd Warps
40 .,
Door I
Towi ig warp,
Dept n
Test Date
Warp Teeslon7100 (lb
Ara
10
10
1(
C
0
1
2
3
b
50
■
40
,
=■
M.
VA
Trawl Type
Granton
Material
Laid Polythene
Footrope
Bridl ..
31 in. Rollers
Grou nd Warps
Door s
20 ft
4.5 x 10.5 ft. 1700 lb
Towi 1g Warps
919 ft
Dept h
326 ft
Test Date
Sept. 1980
,, .,
total Or
I/
b/
60
50
RIOT Spread lftl
si
i
Warp Tenslon7100 ( .
1
ALr
rip-
..., Pr.
3
Trawl speed through water
Fig. 12
4
(Kno el
110
00
100
A
140
■
30
120
■110
Total Drag/100
VA■
210
90
90
GO
130
70
70
60
60
100
90
60
r
,
III■
IlAal
Pr
50
70
6C
5C
9i nt Se read l't(
tO
2
10
50
20
0
120
150
F
Warp gensignilOg(1.)
40
30
20
ISO
Headline We
V
70
(Knots/
Fig. 13
120
80
5
4
Trawl speed through water
(Knots)
4.8 0 BA ft Oval (8118), 1430
1150 ft. 1000 ft
330 ft
July. 1967
90
3(
2(
100 ft
100
4(
20
60
Read/lne Height
5(
All
Ping Spread CO)
30
110
6(
20
41
Yankee
Material
70
or
lIbl
Fig. 11
Trawl Type
BC
30
5
4
3
7
ST
30
n
2
9C
I
Total Ora17100
20
0
Headline Height a I)
5
40
40
4C
30
30
3C
20
20
2C
10
10
IC
0
0
r
I
2
3
Trawl speed through water
Fig. 14
4
(Knots)
5
18
1CNAF RESEARCH BULLETIN NUMBER 9, 1972
speed for minimum lift/drag ratio will be a function of
the scope ratio (warp length/trawl depth) of the towing
warps.
Figure 13 gives data for a Skagen (vinge) trawl
(82-ft headline, 116-ft footrope) which is sometimes
used, lightly rigged, on sandy sea floor. There is
considerably more netting in the Skagen trawl than in
the Yankee 41 trawl, which probably accounts for the
similar drag characteristics despite the lighter footrope.
The headline of the Skagen trawl is only slightly longer
than that of the Yankee 41 and the wing spread is very
similar. The Skagen footrope, then, must fish in a deeper
"catenary" than does the Yankee 41 footrope. The effect of the longer headline and longer and lighter footrope of the Skagen trawl to increase wing spread is
probably being offset by the longer wing bridles. Despite
these longer wing bridles and longer wing lines, the headline of the Skagen trawl was not appreciably higher than
that of the Yankee 41 trawls. The m es hes of the Skagen
trawl must have been more closed than those in the
Yankee 41 trawls, contributing somewhat to the drag.
wing spread; the Atlantic Western 111 trawl should be
fitted with larger doors than were used for Fig. 15. Even
with this abnormally narrow wing spread, the Atlantic
Western III trawl had a larger frontal area than either the
Granton trawl or the Yankee 41 trawl. This large frontal
area of the Atlantic Western Ill trawl results in a drag
coefficient smaller than that for the Granton trawl and
similar to that found with the Yankee 41 trawls.
Trawl Type
Atlantic Wester n
Material
Braided Polythene
Footrop•
21 in. Rollers
Figure 15 gives data for the Atlantic Western III
trawl (79-ft headline, 115-ft footrope) specificially
designed by W. W. Johnson for the Canadian east coast
fisheries. This is a 4-side-seam net, and the advantage of
this side panels and long wing lines is obvious in the
notably higher headline. This is a big trawl, fitted with a
heavy footrope, and had a drag similar to that of the
Granton trawl but greater than that of the Yankee 41.
This greater drag probably accounts for the narrower
pA
Brid
Brae od Warps 150 ft
4.5 x 10.0
Doe
rz,
Teat Data
Peadlthe Height
220 ft
Aug. 1966
120
110
Total 0 ag/100 (
90
70
60
50
90
30
W.,
Warp Tension
Spread (ft)
Er
10
2
3
150
140
130
120
110
100
90
80
70
60
50
1.
l..1.
pri
.irdliaMi
20
0
Ali
Are
i
. EN1
iaWI
100
160
10
n■
1600 1
Tow ng Warps 710 ft
Dept h
BO
Figure 14 gives data for a Granton trawl (79-ft
headline, 120-ft footrope) such as is being used by some
of the larger Canadian vessels. This trawl contains quite a
bit more netting than the Yankee 41 trawls so naturally
produces more drag. However, the wing spreads and the
headline heights are very similar in both types of trawl;
the Granton trawl has more drag than the Yankee 41
trawls despite a similar frontal area. The similar wing
spread despite the longer footrope of the Granton trawl
probably results from its greater drag. The headline
height of the Granton trawl is probably more restricted
by the shorter wing lines (4 ft) than is the headline
height of the Yankee 41 trawls (6-10 ft wing lines).
Some of the commercial vessels are using longer wing
bridles (up to 90 ft) than were used for Fig. 14.
however, the gain in headline height normally realized
with longer wing bridles is lost in this trawl because of
the short wing lines. The reason for the increase in
headline height with increase in towing speed in not
apparent. This trend is opposite to that for all other
trawls studied and opposite to the findings of Crewe,
1964 for the Granton trawl, however, it is consistent
with the decrease in wing spread with increasing towing
speed.
III
4
5
90
30
20
10
0
Trawl speed through water (Knots)
Fig. 15
Conclusions
Undoubtedly these general observations, based on
an examination of the attached summary of data from
an extensive engineering study of Canadian Northwest
Atlantic groundfish otter trawls, leave many questions
unanswered. It is hoped that a more detailed analysis of
the basic data will reveal more extensive and more
specific conclusions at some future date, but it is
believed that this more general presentation is of some
value at the present time.
Acknowledgements
Sincere appreciation is expressed for the very
considerable financial assistance rendered by the Industrial Development Branch of the Canadian Department
of Fisheries and Forestry during the instrumentation and
experimental phases of this project.
CARROTHERS AND FOULKES: MEASURED TOWING CHARACTERISTICS OF OTTER TRAWLS
References
CARROTHERS, P. J. G. 1968. Instrumentation for the
engineering study of otter trawls. Bull. Fish. Res. Bd.
Canada, No. 163.
19
CARROTHERS, P.J.G., T.J. FOULKES, M.P. CONNORS, and
A. G. WALKER. 1969. Data on the engineering performance of Canadian east coast groundfish otter trawls. Fish.
Res. Bd. Canada, Tech. Rep., No. 125.
CREWE, P. R. 1964. Some of the general engineering principles
of trawl gear design. Mod. Fish. Gear World, No. 2, p.
165-180.
A Volumetric Statistical T- S Analysis of the Nova Scotia
Shelf and Georges Bank Water Masses
B y A. A. Barinov l and V. A. Bryantsev'
Abstract
Using the method of volumetric statistical T-S analysis, the Nova Scotia Shelf and Georges Bank waters were
analyzed for winter and summer periods in greater detail than similar analysis by other authors.
Two T-S diagrams are obtained for the two main seasons with the following values: water volumes by T-S classes,
sizes of 0.5° and 0.1% 0 ; water volumes by the three main water masses; total water volume in the area; heat and salt
reserve; mean values of temperature and salinity. The analysis showed that the upper intermediate layer (inshore and
Labrador waters) makes up from 76% in summer to 86% in winter of the total volume. The bottom waters decrease in
volume during winter, and their heat and salt density drops down. This phenomenon may be associated with the local
seasonal transformation, but the suggestion of the effect of the changes in the Gulf Stream outlay cannot be ignored.
Introduction
For the purpose of fisheries prognosis on the Nova
Scotia Shelf and the Georges Bank it is necessary to
know the disposition and characteristics of the main
water masses which were studied earlier (Bryantsev,
1963), and also to have information on the quantitative
relations between them.
To obtain the volumes of the main water masses,
to see their quantitative correlation, and, consequently,
to estimate the significance of each of them in the
formation of the local thermohaline structure — all this
is made possible by a volumetric statistical T-S analysis.
This method was used for the analysis of the water
masses in the World Ocean, in the Atlantic (Montgomery, 1958; Wright and Worthington, 1970), Indian
(Pollak, 1958), and Pacific (Cochrane, 1958) Oceans, in
the Arabian and Red Seas (Dubrovin, 1965) and in the
seas of Indonesia (Nefediev, 1961).
However, the authors of the above-mentioned
publications used for their analysis only a small number
of stations (Nefediev — 158 stations for the seas of
Indonesia; Dubrovin — 33 stations for the Arabian and
10 for Red Seas; Cochrane — 150 stations for the Pacific
Ocean) and excluded the upper 200-m-water layer which
is subject to sharp seasonal changes in temperature.
Also, the above authors made their analyses for
one season only (Dubrovin, 1965), or completely
disregarded the season.
The uniqueness of the present paper lies in the fact
that we have analyzed the previously excluded upper
200-m layer in an area with an extremely complex
bottom configuration for the two main seasons, winter
and summer, using a great number of stations and the
smallest unit area.
Materials and Methods
It is known that the Nova Scotia Shelf and
Georges Bank are characterized by a rather complex
bottom configuration, with the depths varying both by
area and by fishing squares (Fig. 1). Therefore, in
estimating the volumes, a square of the fishing grid was
taken for a unit area having sides of 20' of latitude and
30' of longitude. Since the area of the square increases
from south to north from 1420 to 1577 km 2 , an average
value of 1500 km 2 was taken. In case of a sharp
heterogeneity of bottom configuration, i.e., with the
depth variations within the square of 50 to 100 and
more meters, the square was divided into parts of 1/3 to
2/3 (1/3, 1/2, 2/3) of the square area. For a vertical unit
of the volume measurement the depth of 1 m was used.
For the analysis all hydrological stations made by
AtlantNIRO were used through the period 1961-66 for
the two main seasons: winter (January, February,
March) and summer (July, August, September). Total
number of stations was 1,153, with 374 of them
occupied in winter and 779 in summer.
' Atlantic Research Institute of Marine Fisheries and Oceanography (ATLANTNIRO), 5 Dmitry Donskoy Street, Kalingrad, USSR.
22
1CNAE RESEARCH BULLETIN NUMBER 9, 1972
1
65
5
".67111, SS&
EMIL
pot
dOorwa- 1 \ ck std111111
:Aar , , F, ' tali= °
y pm
4
G.
111111r
*SA
MEE -
AilliMMINIMMIll
1111111111111111111Whill '
ANE
■41111611111/11111111111Ercg
lielisminn
11111
1111101P11111
1E1 '00
■iliffillillilliamol
rn 11111111111111
A Ail II
4A1i il
Illb.,
-
t ----
a 111111111111
II
Illr
Iii EINIIPIIMIS
111111111119.
-i Ill
illtilitIMIIM
11111111111M■
OfillillailliEMENIE
44'
42'
talli
AI
t MM11111111
O
Fig. 1. The Nova Scotia Shelf and Georges Bank study
Temperature and salinity data were averaged in
each square or its part for all 6 years and, thus, were
reduced to one T-S curve. In some cases where data were
lacking (winter), the same TS curve was applied to the
adjoining square or parts of the square which are
homogeneous in bottom configuration and hydrological
conditions.
T-S curve fields were divided into classes of 0.5° in
temperature and 0.1 0/„,, in salinity. In each class, layer
thickness was determined in meters as a part of the TS
curve cut off the class boundaries. Product of that value
multiplied by the area of the square or that of its part to
which T-S curve was applied is the water volume for the
corresponding temperature and salinity.
The final results of the volumetric statistical TS
analysis are given in two 'C-S diagrams for summer (Fig.
area (depth in m).
2) and winter (Fig. 3) periods. They show water volumes
in km3.
Results
According to general anaylsis of the water masses
(Bryantsev, 1963) the whole water column on the Nova
Scotia Shelf and Georges Bank regions may be divided
into three main water masses:
3)
surface waters of low salinity or inshore waters;
intermediate cold waters or Labrador waters;
warm bottom waters and those of high salinity.
Boundaries are determined by the 32.5% 0 isohaline separating the inshore and Labrador waters, and
23
BARINOV AND BRYANTSEV: NOVA SCOTIA SHELF AND GEORGES BANK WATER MASSES
also computed the values of the total heat reserve in
kg-cal X 10 12 (with regard to the specific heat of the
waters in the area which is 0.94 cal/g), reserve of heat
and that of salt in tons, mean temperature and mean
salinity. The dotted line on the diagrams shows the
volume equal to 75% of the total, the dashed line — that
of 50%, and the regular one shows the classes with a
maximum volume by three divided grounds.
the 33.5°/„ a separating the Labrador and bottom waters.
The diagrams show the lines corresponding to these
salinity values (Figs. 2 and 3).
As a result of the statistical TS analysis we
obtained the following estimates: water volumes by T-S
classes, water volumes by three main water masses, and
the total volume of the water masses (Figs. 2 and 3).
Also obtained are data on the relative quantity of waters
of certain temperature and salinity in percentage with a
histogram as an illustration. Apart from that, there were
35"
Si.
51
31.
Three characteristic layers are well traced on the
T-S diagrams by disposition of the volumes, the
8
19
0
%,
3
,,
.33
‘,.
€.•
,
s.
33 ‘ O
•
v
v
3.: v 4- 0 uUe e e
0
17
9 o 0 9 o o 0 v o ,> , o 0
4
V
00
U
4 4, e 0 v
uu
V
u,u,u,`
ou
,o
u
o 0 o es
c 0 o , o e .3 a- •■., 0., ,,,,. 4,' n. S 1.7 sl 0 v v. 9 • o 9 0 o e■ \ 0,3
16 .• 0
,! 0
0
V33 .3.04 33,3o u .2*VO40e ' 00 00 V 343 4, c 5' 00 61..' V
a
0u0 0 0
o o, ‘ 3 3
3 03 u
4,,,,,, 41 .0 00 7,0 0o 140000 e 43 3:
15 333,04330e oe 0040'0 • 400 V 4' 0, ,0 •3v
0
0 0 0' .+09
03 ' 0
3 4, .3 3 3 3 3 o 0 s•oss% o 300,3
34
e • e 0+1 0 5 0 ,, • s, ,■! 0 o, t 0 oe 03003.
7,7 ,,
330 4343 o 420 b44:,, . o o 0 0 #02.2cxy k, 0 • 000 • a • ,1 0 0000
V 0 ., 3 • • 3" 03 003 13 .„ o ,
0.'
.0 9 .. 0 ..., ;,,,,,,,
3o 0 0 .3 , „
•„
0 w 33Vov 0.43032,vv0/04,413,3242,0102,u 0390 33*
t t if I ,s I S
1 77 0 0 77 V 77 0 0•
o e 0 .., ioo.ot,nte ,.e 0 J . +
0 0 0 Q ,}R0.•
s i+ 1 4230 j3„. „ 3 3
s, o v s, 0
es...........
..,
9
0.
,9'ie
,
0e,
'7'070 7,110 77 o .
0Y ". Ve 000 e 0 V 0300 4346. 1;4,24E-960 . V 0 00 e 3 3 ,! 0 0.. te 0 51 V v 0 0 0 a 0001/2et`
1
■
■
I
s
0
,
9009
0
o o I 0 . , i, a
I
Ok
i.'
c
0
Y4}
eo,,, 3333.34 o v * 43 43223 0"e 42 034
0000 033003 00 0 .0 I
51.: Q 0 4 a V c. 0 V 'e , 0
V '3 v V C 00 • V' 0 V * 04'7 ,2 V '9?„:30
0
7 1 17
000
0
2
.
021
2
ii
x
0
vo ve 00 . 0.0c 0 .0?-22 :2 a 2 .0,00 0 a .0
e
3 3 b 3 . 3 o 0 30
ON. O* 401,1 40 33 46 o a 3, 0 3 .3 03000
'0 7' .77 7 .7 77 1.7 117 '77 .c # >U
0
f
,0
w
0
t
o
■
,...
s
0
0
0
0 0 V V 044 4 o 0 4' 042 Ods•*140 :4 • T`t. ,•` 0 0 • • 0 0 ‘
e
3
o4 V C 1 o s• S' . II7 .0 0 47 e4 .4, 4:t^ 14200 41 V 2° 63 •6 1 00 c 030 0 t` (1:' .56 03 3p
C 03.4 .34,3, 4 34. 0321.0 ‘ Cr0,Cv142:0}2',
..,22 0 0 ,9 .0 s 0 0 * # 0 0 ,,se`,#) # 0 I I 0
t
07
1
.71
1
7.
7
7
44
7
7
47
7
077
7
0
0
F
e
<1
4.40
4
, • 4.
01
60 O .3 o 4, v ,. 0430 0.3 2 3, 4 •.-.1.3
0 0 0 0 0, ... 0 . ?..• i40 s...'•.0.u'l:$
rot10 0, 0 eo: 020 i 0 0 1.0
c,,' .3. a 00 . e 3 66-1o,'1/21;*” .;
0V
' ' ' ‘ IV 26
430 0 o c a 0 V 43 .0U,0
V 40 41:0 • L
0 4.
i••
o „ „ o a 0 43 043 4, rsio oh acHe
a
a,
'a
;l
, 3 o „ 3 o ., a 000 .2 304,0003e
0,
0 O -3 v 4 3 v v t3 44 033 40, • • ot oot
1 00r 0
.4 , , 0 0 0 n 0 .1.■ ."Le 31#0.'",
•■rs
yo
4' 77 7777 911 oleo psto
•1
' 0 0 0 0 00 + 0 97 I.' /V 0410
4
0020
'• v 0 ■ ` ,0 -1u •o so sooft o & .0.,r3 P 6'
0,
3.
3
, 3 v 0 e 0,- 091 2, e 2'
216 03 433 43013, 0
•0
0002V
",04"eA03e0t21W090
'' '' + 7 3 2 1-2401 2 0 0 3‘' 3v 3, s++0 V 0 o 0 o
4,0 033
I
v'
.
3° a. -1 ° a ..
...
....,--.:...../...o., .....
- - ---■
0...,..ttla17:':z-,vz..slogr.g«.2-'-e9-.,-2gaVmrf°R.""
. r. u. .1,.; .. .......,....„--_-.
— — — —...o
.....
--------611_
15585
61- ,..,..,—,... 1totairs_.74z-az,
MAlza4.:.1--zgg- ^ zatz-n!".Etar,24:,1-75-eitt—
2z
° 17
38
31
E.5 .„1:
--- a .°''ggr;
a -....-..
...4° ° 1Bazg..,flawgZezig.-92g's3s ...
6-Eta'S...
^ au244 °:
.. ..,-..n-...2L•4732,
a' e .. a. . 2.4" 4. ° = e ° - g .... F.,
. 7.•
,°°
°4° ,-..........°2
-Mr.423$28/4Pt34°,32:9X2gr,r.c......1.2,C........39.-see”-X4,
4341173,2
9636173
X f•T
17 147
000
3 0
43
o
too
,
0o , ,
o,
3, 0 0 3 4 0 3 00 0 o , 0
17
u V 0 ,1 17
uv
0 +' %
‘,
ti
0 0 ,■ 0 o
% ,, o v ,L.
o
v V • 0 o 0 v 0 I' o 3,30 ,± 0
0
0 0 ,0 01,,,
at/
2912615
Ins
113 0,..
143 034
61 0,61
153034
314,1
1504
1714
234 Om
4411
473 Oa
Rs 0,4
54 0,I1
145,144
175341
326,209
322.14s
333,9 Oa
41931,1
355.1
814s
9614
940,s
12846
26133
43363
46123
46113
54144
71 1215,7
613313 76693
Skis 13 64935
60911.7 10711
559.1
1133 13 100743
110,24 25103
6713 lj 67923
19902.1 16983
139121
99It5 23
939s 23
9961!7
146126
1 469, ke
1941,1 5, 3
13.3.6 6,4
14403 63
130.1 63
15789 63
76177
11611.4
77193
77243
68934
144143
123163
11654
131913
111436
116173
4 41 100912
19234 53 67103
1329,1 33 40623
link
AI
11713
15933
13753
611.5
MI
33 9478.1
4,2 25063
3,3 1615,s
1 3 4154
19,3
445 4u
6,5 0,19 -1,5
'I<.4
x
4'
1196 126,9
Fig. 2. Volumetric statistical T-S diagram for the Nova Scotia Shelf and Georges Bank regions (summer).
`7
rroa
00 I' =6,68
g•II! S = 32,3
24
ICNAF RESEARCH BULLETIN NUMBER 9, 1972
30,1
32.3
341
%
10
7
14.0 0.53 5724
234.4 0 sl 1161.;
0134
346,t 0.
I91(1 24 5140 0
Ste.,
tag
350,, , A, I0%4
029,0
2 Ms
4 11[s 0.4 4314
3 St, 5,, 1R
3 tH s tt 'Si,., H
WA 11,8 1M4
• SA,
4 tits 0.5 51t,3
1.513.8 73 /115,6
111It 54 4551
IAA
_1674
I
243.4 0.7 _I71,s
141.s 0l -145,
6
5
2
0
2
z
ri
II
Is
,,,
497 3 IG g
.
V.P.0.4.1;;; c
133
070
.9 III
7
..
T = 2,11
15 MA
,”11"-""
II N
41 s
41.,:,
flt i il i allEEtt- 52ta
g- 51i=iff§
e=r1•Assnassmvass.
434•
ES
...
iiiE
1
n.:.
1761114.0
3 =32,6e
1 167 2t7.
_H-1-111111=1—
Fig. 3. Volumetric statistical TS diagram from the Nova Scotia Shelf and Georges Bank regions (winter).
character of volumes distribution by TS classes confirming the correctness of the preliminary approtionment of the water masses. Zones of 75 and 50% of
volume have configuration of 'l'-S curves characteristic
for the given area in summer and winter periods.
Classes of maximum volume constitute a nucleus
of the corresponding water mass limited by the
above-mentioned salinity values. T-S diagram for the
winter period suggests that the surface and intermediate
waters constitute a general cold surface layer as a result
of the autumn-winter convection, although judging by a
typical winter T-S curve we should formally separate the
two water masses. These are really somewhat different
not only in salinity, but also in the disposition of classes
of maximum volumes — 989.8 and 1022.8 km 3 (Fig. 3).
In the boundary area between the intermediate layer and
the warm bottom waters, Fig. 3 also shows a trace of
another class with the largest volume, as compared with
other classes surrounding it (235.2 km3 ). This fact
indicates the presence of two modifications of the
bottom water masses and gives evidence that it would be
more correct to use the 33.3°/ 0° isohaline as a lower
boundary of the Labrador water masses.
Estimates of the total water volumes for summer
and winter differ by 675.5 kin 3 (Table
25
BARINOV AND BRYANTSEV: NOVA SCOTIA SHELF AND GEORGES BANK WATER MASSES
TABLE L Volumes of water masses in the Nova Scotia Shelf
and Georges Bank regions.
4)
Water masses
Summer
Winter
Summer - winter
volume
variations
( 3)
13,585
14,087
8,741
15,517
15,020
5,200
+ 1,932
+ 933
- 3,541
Total
36,413
35,738
-
Volume, km3
676
This difference is the result of errors in the
processing of T-S curves. As we can see, the difference is
insignificant (about 2% of the total volume). With regard
to this fact, we may distribute this "discrepancy"
between all the waters proportionally without any great
damage to the preciseness. Table 2 presents the ultimate
results: values of the three main water masses, their
correlation and changes from summer to winter.
TABLE 2. Volumes of water masses in the Nova Scotia Shelf and Georges Bank
regions after distribution of the "discrepancy".
Summer
Water masse
Winter
Volume, km 3%
Volume, km 3%
Summer - winter
volume
variations
( 3)
13,459
13,956
8,680
37.3
38.7
24.0
15,664
12,162
5,249
415
42,0
14.5
2,205
1,206
- 3,411
Total
36,075
100.0
36,075
100.0
0000
+
Discussion
Based on the results given in Table 2 we may draw
the following conclusions:
3)
The most significant changes are observed in the
volume of the warm bottom waters of oceanic
origin which penetrate into the area in question
through the deep-water troughs and canyons.
Their volume decreases from summer to winter
from 8,660 km 3 to 5,249 km 3 , that is, from 24 to
14% of the total volume.
The Labrador and inshore waters in both seasons
are approximately equal in volume and constitute
the main part of the total water volume in the
region - 76% in summer and 86% in winter.
Changes in the correlation of the water volumes
from summer to winter may be a result of the
seasonal transformation which causes in winter a
decrease of the warm bottom waters and an
increase of volume of the cold upper layer which is
intensively mixed and consists of the surface and
Labrador waters. However, we cannot ignore a
suggestion of more intensive inflow of the bottom
waters in summer period that may displace other
within the region under survey.
The increase in the inflow of the bottom waters
from the ocean in summer period may be
associated with the seasonal changes in the Gulf
Stream outlay. Evidently, this fact also accounts
for increase of average salinity of the bottom
waters in summer. This phenomenon is demonstrated in Table 3 which gives mean salinity values
for each water mass obtained in the analysis.
TABLE 3. Mean salinity values of the water masses in the Nova
Scotia Shelf and Georges Bank region.
Mean salinity, 0/00 Summer-winter variations
of the mean
salinity,°/on
Water masses Summer Winter
(3)
32.01
32.92
34.12
32.05
32.88
33.85
+ 0.04
- 0.04
- 0.27
Total
32.87
32.66
- 0.21
It is rather notable that the total mean salinity in
the layer of the surface and Labrador waters does not
change from summer to winter. After the autumn-winter
convection and the wind mixing, the salinity of the
surface layer somewhat increases, while the waters of the
intermediate layer decrease their salinity to an equal
degree. Similarly, the bottom waters in winter not only
decrease in volume, but also obtain a lower mean
salinity. The latter may indicate a decrease in inflow of
the bottom waters from the ocean in winter period.
References
BRYANTSEV, V. A. 1963. Water masses of the Nova Scotia
shelf. Trudy A flantNIRO, X.
DUBRO \TIN, B. 1. 1965. Volumetric statistical analysis of the
water masses in the Arabian and Red Seas. Okeanologiya, v.
V. 4.
NEFED1EV, V. P. 1961. Deep-water masses of the Indonesia
seas. Okeanologiya, v. 1, 1.
COCHRANE, I. D. 1958. The frequency distribution of
characteristics in the Pacific Ocean. Deep-Sea Research,
Vol. 5, No. 2.
MONTGOMERY, R. B. 1958. Water characteristics of Atlantic
Ocean and of World Ocean. Mid, Vol. 5, No. 2.
POLLAK, M. I. 1958. Frequency distribution of potentional
temperatures and salinities in the Indian Ocean. Mid, Vol.
5, No. 2.
WRIGHT, W. R., and L. V. WORTHINGTON. 1970. The water
masses of the North Atlantic Ocean. A volumetric
consensous of temperature and salinity. American Geographical Society Serial Atlas of the Marine Environment.
Folio No. 19.
Food and Feeding of Atlantic Salmon in Coastal
Areas and Over Oceanic Depths
B y W. H.
Lear
Abstract
Examination of the contents of 2,350 stomachs from coastal areas and over oceanic depths of the Northwest
Atlantic Ocean suggests that Atlantic salmon, Salina solar L., feed almost continuously and fairly intensively while at sea
and cease feeding as they approach the estuaries of their home river. Main items of diet were capelin, launce, herring,
Paralepis coregonoides borealis, amphipods, and euphausiids.
Introduction
Very little information is available on the food and
feeding of Atlantic salmon, SaImo solar, in the open
ocean. Templeman (1967) on the basis of 10 stomachs
examined in the Labrador Sea during 18 July to 23
August 1965 found that the salmon were feeding mainly
on Arctic squid, Gonatus fabricii, and Notolepis rissoi
krOyeri. On the West Greenland Banks salmon were
feeding mainly on capelin, Ma(lotus villosus, and launce,
Ammodytes sp., during 5-16 August 1965. During
March-April, salmon were feeding mainly on Paralepis
coregonoides, lantern fishes, amphipods, Arctic squid,
and pelagic fish in the Labrador Sea and over oceanic
depths east of the Grand Bank, Flemish Cap, and
Northeast Newfoundland Shelf (Templeman, 1968).
In coastal areas such as in the Baltic, salmon are
known to feed mainly on sprat, Clupea sprattus; herring,
Clupea harengus; launce, Ammodytes lanceolatus;
stickleback, Gasterosteus sp.; cod, Gadus morhua; and
Belone belone with smaller quantities of amphipods and
shrimps (Thurow, 1966; Christensen, 1961; Chrzan,
1970). Dahl (1918) found that grilse caught near the
Skagerrak contained herring, capelin, and small amounts
of euphausiids while one stomach was full of pelagic
amphipods, Parathemisto. Hansen (1965) reported that
salmon close to the Greenland coast in autumn ate
mainly euphausiids and capelin with some launce. Blair
(1965) examined the stomachs of 919 grilse and older
salmon in Bay of Islands during June-July 1942. Of
these, 127 contained food items maily capelin and
launce with small amounts of shrimp, smelt, Osmerus
mortlar; cod, herring, and brook trout, Salve?inns
fontinalis. Lindsay and Thompson (1932) report that
capelin and launce were found in the stomachs of
salmon examined during the spring of 1931 in White
Bay, Newfoundland.
Kendall (1935) examined stomachs of salmon
which were returning from sea in the estuaries of the
Penobscot and Saint John River in New Brunswick. In
most instances he found that the stomachs were empty
but in some Penobscot fish smelts were found and in a
few of the Saint John River fish, medium-sized alewives,
Alosa pseudoharengus, were found.
Power (1969) examined the stomachs of 300 adult
salmon entering the rivers in Ungava Bay, none of which
contained any food. Two salmon taken in Whale River
had unidentified fish remains in the lower intestine. A
kelt which had spawned as a grilse in Whale River had
sawflies and simulium larvae in its stomach prior to its
arrival in the sea indicating that it had fed while in fresh
water.
Keenleyside (1962) observed that adult salmon did
not feed during the daytime in the Miramichi River, New
Brunswick.
Jones (1959) stated that sexually maturing salmon
generally cease feeding even before entering fresh water
from the sea.
Methods
The salmon stomachs (2,350) examined in this
investigation were collected during research vessel cruises
of the A. T. Cameron during August-October 1969 and
1970 and during May 1971 using surface driftnets at a
' Fisheries Research Board of Canada, Biological Station, St. John's, Newfoundland.
28
1CNAF RESEARCH BULLETIN NUMBER 9, 1972
depth of 3 m; adult returns of tagged North American
smolts recaptured along the West Greenland coast from
Frederiksdal to Godhavn (Fig. 1), routine commercial
sampling in West Greenland, Newfoundland and Labrador coastal areas, routine parasite investigations of
Atlantic salmon at Carleton, Saint John River, and in the
Miramichi, and during a driftnet tagging cruise of the
research vessel Marinus in the Miramichi esturary.
they were first examined for internal parasites. The
stomachs were then cut open by the author and the
contents, if any, separated by species and weighed in
grams to the nearest tenth.
The research samples and tagged fish returns were
weighed in kilograms to the nearest hundredth and were
measured to the nearest millimeter. The commercial
samples were weighed in kilograms to the nearest tenth
and were measured to the nearest whole centimeter.
The complete viscera were frozen and subsequently thawed out at the Biological Station where
1)111.1
Salmon length (cm),
Empty
1 mdriitified material
Fish remains
I Ind./died invertebrates
Bird feather
Lepe op hlia eons salmonis
Terrestrial maces
Plant material
Clupen hoer ngus harengus
.11osa pseudohorengus
.14allouss
°minusmordar
al or
ghrn.arious areas and al different seasons, 1968-71, showing weight of food (g) and number of occurrence.
26 June
2 July/70
55-86
- (110)
...
81,1(19)
Miramichi
12 June
9July/70
49-103
- (291)
14.0(5)
1.7(1)
...
149.6(4)
97.1(1)
.,
,
191.4(1)
...
...
i
rn fsh
Porolepis sp.
...
0.1(1)
..
...
1736,8(45)
117.7(6)
...
Port aux
Basques
20 May 15 June/70
63-90
St. John's,
Nfld.
8 lute
14 June/69
(1)
(10)
6)5:2414)
2.6(1)
...
...
...
0.1(1)
237.3(3)
377.4(43)
,•
•
Bnt
inn
24 June •
1970.71
- (45)
104.0(19)
•
St. Anthony
26 June 6 July/70
52.85
(3)
•
9.0(2)
Packs Fir.
6July •
25 July/70
54417
- (70)
5,8(4)
•
0.2(2)
•
0.2(1)
6099.1(67)
5122)3(59)
17419,3(172)
10652)7(96)
19.8(1)
3795,6(127)
29.0(2)
••
43.1(11)
30.9(2)
3.0 I)I
444(1)
602.3(70)
...
...
25,0(3)
7,2(4)
56.5(4)
..
2048.8(68)
2210 8(47)
178.2411)
67.2(1)
3.1(1)
9.1(4)
1,1(4)
3.4(3)
1.4(1)
0.4(1)
Coltunrulus micraps
Wmoreplialin scorpioideg
12(1)
598(1)
23.3(7)
Spiroiella helicula
Bons fobricii
Rob( haete worm
A mplupod
huphansild
Serkenos arch,.
- (20)
364.4(117)
29.5(4)
•
Sebasfrs mecums
4konundreagonus
Cyr/opfen), lompus
Reinhard iius hippog/osscades
Clam shell.
10 Sept
/ Nov 1969-70
58.100
.. ,
1 7(3)
4mmodytes sp.
Sc,,: bee scombrus
inarhichas lupus
Lumpenus moculatus
- (182)
...
21.9(14)
..
I.
Puralepis coregonoffirsborealis
Notolepts rissoi krpyrri
Gas terosteus aculeotus
Gadus morhun
goreogodus saido
Carleton
15 June •
16 June/70
66113
pu run the s) All length groups
237,6(5)
3 3(1)
1.7(1)
144.0(12)
0.6(2)
0-5(1)
30.7(6)
0,1(1)
0.1(1)
0 1(1)
4.5(3)
163.5(36)
529.2(86)
Paciphava tardo
Total salmon (It/maths examined (No )
Total round )(eight of salmon
whose stomachs wen examined (kg)
I otal fad in SIOMM (g)
Total food ( g ) Per kg of calm°.
and weight
Average weight of food (g) per
salmon examined
Coriddlon la, tor
(at(ght in hole of empty shell.
b urrage weight of St, Johns_almon 1)0
144
6131.45
40.57
298
1277.80
207.1
250
1457.48
1885.4
92
75
406.60
4182.1
300 00 15
7711,0
0,6
0.2
1.3
10.3
25.7
22
1.10
0.7
1.17
7.5
1.14
45.5
1.14
102.8
268
104
R2
I I 11,90
23917.0
350.90
10764.5
341.70
338.7
89.24
1.17
weights al thr combined samples from Port aux Basques and lionavist
234
885.00
5534.R
30.7
1,0
6.3
103.5
1.12
4.1
1.08
217
1.18
29
LEAR: FOOD AND FEEDING OF ATLANTIC SALMON
Results
Atlantic salmon fed at different intensities and on
a wide variety of organisms in the various areas
considered (Table 1). There was also a considerable
amount of variation between areas in the amount of
food per kilogram of salmon round weight (0.2 to 30.7
grams) and in the amount of food per salmon examined
(0.7 to 103.5 grams) (Table 1). In addition to this there
1119 414"111
I Sept
10 No,
1908.70
37.90
ICNAF "IC'
21 A ag
4 Nov
I 908-70
52-102
IS Ang
I Nov,
1969-70
509.8
I A ug 20 (h I.
1909-70
52-00
(31)
..
19 1.1) 12)
17.5(6)
...
-(31)
309.692)
332.94 04)
..
...
- (0)
...
132.7(19)
12.4(2)
...
-(4)
...
275.4437)
24.5(4)
. .
Davis
Shad
5 Sept 0 Sept./711
0480
-(2)
Labrador
Sea
6 Sepl
4 (6 I.
1909.70
67-88
Lab Sea
NE MEd
Shelf
I 1 Mao .
24310.4971
44-11.0
_00)
-(7)
0.2( 1)
153(443)
0.1( I )
01(1)
...
371(14)
. • •
7.9(1)
745.2(31)
40.1148((85)
7.5(1)
1111149)20)
was a great deal of variation with length in amount of
food per kilogram of salmon (Fig. 2) and per salmon
examined (Fig. 3). The condition factors also varied a
great deal between areas (1.08 to 1.18) (Table 1) and
between 10 cm length groups (0.98 to 1.27) (Tables
2-7). The condition factors for salmon from the Saint
John River, New Brunswick, displayed the greatest
variation with length (1.07 to 1.26) while those from
ICNAF Divisions 1B and 1E-F displayed the least (1.03
to 1.07 and 1.05 to 1.10 respectively).
. . .
.. .
•
42.2(5)
234.244)
11160.7(57)
231)9(3)
10.2.9(4)
100.811(95)
34.1(1)
257 1427)
332-2(12)
..
4:14.0(39)
...
1043.3(29)
104.6(8)
. ..
13 2( I )
81.9(2)
511(1:)
12.8(1)
20.212)
8.2(4)
. •
2.0(I)
97.500)
0.& 1)
225.9(61)
222.3416)
I x4143)
100.1(41)
120.0(35)
04
171
572 911
2768.6
I 7(1)
47:111420)
47 4911 I
080.44
6740.9
180.7)1
1900.0
48
70
10.11
10.2
1.00
22.9
1.15
30.0
1.12
12.1(3)
953.1(04)
413.1440)
127
352.65
4005.8
111
108
0.1(
5
71.7(1)
0.1(1)
57
...
361k 1 I )
.. •
59.615)
1.445)
1.2(1)
5.61)
85
322.00
1810.1
Total
1908-71
Percent
by
44113
weight
-(031)
710.7(130)
1791.9(307)
80.8( 18)
11.1(1)
0.242)
1.70)
0 .43)
07098(78)
97.1(1)
489855(041)
117.7(0)
476.2(44)
25.0(3)
194445(52)
104.6(8)
0.9(7)
133 2)10)
110.0(3)
7510.44400)
67.241)
3.10)
21.9(5)
21190)
11.6(7)
1.4(1)
0 4(1)
1.2(1)
83.1(8)
2.0(1)
2371(5)
1313(27)
24.5(12)
2288.9(298)
1330.0(236)
I 2(1)
5.7(1)
0.14
001
0.18
(1.10
10.28
009
<0.01
0.03
0.03
0.02
<0.0
<0.0
<0.0
0.1
<0.0
0.3
0.18
0.0:1
3.13
1.83
<0.01
aol
2350
9340.44
73105.2
20.40
232.0
200.38
013.5
II .4
3-I
5.7
78
I 011
1.08
21.6
I.11
31.1
1.17
1.02
2.45
0.42
<0.01
<0.01
<0.01
<11.01
9.18
0.13
07.01
0.10
0.03
0.03
2.60
99.98
Ibidn3 tried material
Fldr
16dd/99016d invertebrate,
Bird feather
deprophiheirun mInponis
'1' erre4trial insects
Ilan( Material
(Auger hare)un harrngus
Mona psrudoloarennonnn,
AI alloiLIN rillosus
(Agnew, morning,
I Aler. lids
Pargems sp.
Puredeprn conepmoides borealis
Noinelepis anion degyrei
casirrogrus under Ws
Godu4 morhun
tioreogadun saute
Ammodytes op.
Scombrescombrus
Annarh(chan lupus
turnpenus mandarin
Sebagins marinas
Cottuneuiux nuerops
Alyorocephalus scorpioides
Agonusderagonus
bun Pn4
Iternhardaux hippoglossoides
Clam shella
Simrat4.41a hrlitina
CyclopIrrun
Gontrius Jab:deli
Polychar Iv worm
A mphipod
44uphausiid
Argosies urcticus
Pa:nigher, lardu
Total salmon stomachs examined (No.)
Total round weight of salmon
whose stomachs were examined (kg)
Total food In slum adhs (9)
Total food (g) per kg of salmon
round weight
Average weight of food (g) per
salmon examined
Condition factor
30
ICNAF RESEARCH BULLETIN NUMBER 9, 1972
76°
72°
70°
Ll
I
68°
54°
66°
52°
n"
50°
42°
I -33r°
40°
38-
T
36°
Aty
70°
4'70°
68°
GREENLAND
66°
164'
62°-
e
28•t,
'66411.1
•
3
W4
Cape Chidley'n
—162°
.3.,
E
3
Frederiksdal
60°
C'Tr.
—60°
Cape Farewell
•
U1
58°
F
V
13
- 58°
•
Coastline -----100 fall,
--- 200 loth
1000fath -
56°
30
—156°
•
5
54°_
-54°
o
9
0°\e•'.\cb
be`c.c•sd°
2,,s,
so°
52°
54
52°
0.
50°
.
Anth ony
,.
€4,,,
3 ti
„7,_-- 1 0 4
if
-
' • 1 2,,,,
r
48'
252
,--'?
46° -
r--/ ---v
Q°
,•
t--
-.------
-
7
Carleton .e.,_73
-•2 1400 trec :,- 920' ---,
N RE UINNSW2%
B
K98 ,
79
--ijp,_
L--i-;_ --''
St.John 2-- ero
„w5,14 ,4 -'0,Si.„0----
NFLD
•
14
C: Pre 9v I st°
",
4,6,0
50°
ce^ fr•
48°
St John's
,75
Oi
ci°
46°
VPS
44°
C5?")
76
38-°— 36°
Fig. 1. Area map showing sampling stations, number of stomachs sampled in each locality and place names mentioned in
the text. Closed triangles indicate positions from which stomach samples were obtained during May 1971.
31
LEAR: FOOD AND FEEDING OF ATLANTIC SALMON
50 b
40
Labrador Sea NE Nfld Shelf (spring)
4
40-99 50-59 60 69 70 1-79 80 j.-89 90 j:99 100-109 110419 50-59 60-69 7079 80 E 99 90-99 100-109
LENGTH (Cm)
Fig. 2. Average weight of food (g) per kilogram of salmon round weight by 10 cm length
groups for different areas.
220 I200.
180-160-
,6)
90-49 50 59 60-69 70-79 80-89 9099 100-110 110-119 50-59 60-69 70-79 80-89 90-99 100009
LENGTH (Cm)
Fig. 3. Average weight of food (g) per salmon examined by 10 cm length groups for
different areas.
32
ICNAF RESEARCH BULLETIN NUMBER 9, 1972
ABLE 2. Stomach contents of Atlantic salmon caught in various areas and at different seasons, 1968-71, showing weight of food (g) and number of oceurniners On
parentheses). Length group (40-59 em).
Salmon length (cm):
Empty
Unidentified material
Fish remains
Unidentified invertebrates
Terrestrial insects
Mallotus oillosus
Lantern fish
Amrnodytes sp.
Spiro fella helicina
Polychaete worm
Amphipod
Euphausiid
St. John, N.B.
30 June2 July )70
55-58
Miramiehi
12 June9 July /70
49-56
- (3)
- (34)
Bonavista
8 June24 June
197071
49-59
Pack's 11r.
24 July25 July /70
5457
- (2)
...
...
...
...
1710.7(34)
...
11/(4)
- (5)
..
0.1(1)
..
- (4)
...
1.1(1)
5.6(2)
.
Si Anthony
26 June6 July /70
52-59
...
„
1.7(1)
...
3159.4(50)
...
4.6(1)
ICNAF "1719
23 Sept..
I Oct.
1969-70
58
IUN A F"10`
16 Sept.26 Oct.
1969-711
57-59
- (0)
- (1)
...
07(1)
„ .
...
37.9(3)
...
t 2A( 2)
...
29.5(2)
...
7.7(2)
20.6(1)
43(2)
2 3(2)
0.7(1)
19.9(3)
Total salmon stomachs examined (No.)
Total round weight of salmon
whose stomachs were examined (kg)
Total food in stomachs (g)
'total food in stomachs (g) per kg
of salmon round weight
Average weight of food (g) per
sahnon examined
Condition factor
5
35
55
37
9.75
5.6
7
4
4
54.90
1.7
105.30
3165.1
7320
1742.3
14.00
0.8
8.29
70.9
0.6
0.0
30.1
23.8
0.1
7-16
59
1.1
1.09
0.0
1.10
57.5
1.17
47.1
1.12
0.1
126
17.7
1.06
11.6
1.00
I A 1-7IU 3 Stomach contents of Atlantic salmon caught in various areas and at different seasons, 1968 71, showing weight of food (g) and tium wr of 0 currene
Length group (6049 cm).
Salmon length (cm):
Empty
i side ntitird material
Fish remains
Unidentified invertebrates
topeophilkeous saimono
Ci•peo harm/gu y hare/ism:
Mallows odlosu g
Lantern fish
Paralopiregonotdes
s co
borealis
Notolemsrissoi krOyen
Miramichi
16 June9 July/70
Carleton
15 June170
Port aux
Basques
22 May.
15 June/70
Bonavista
8 June24 June
1970-71
Si Anthony
27 June6 July/70
Pack's 11r.
8 July25 July/7(1
ICNAE "IA"
10 Sept.I Nov.
1969-70
62-69
62-69
66-69
63-69
61-69
6069
61.69
60-00
- (4)
...
2.0(2)
„
(29)
...
0.6(1)
...
(8)
..
2.2(3)
...
- (2)
- (1)
- ( 8)
..
0.6(1)
...
76.2(4)
...
...
94.1(4)
...
- (6)
...
10.5(5)
..
.
370 3(5)
1209 8(11)
..
7.4(3)
1.2(1)
„
1376.9(12)
.
19.8( I )
at .nonce caught in hole of empty dam shell.
( I 3)
239x2(6.5)
271 2(3)
0 2(2)
2070 2(8:2)
.
.
.
3 6( I )
.. .
373 5(15)
Boreogadot
Total sidmon stomachs examined (No.)
Total round weight of salmon
whose stomachs were examined (kg)
Total food in stomachs (g)
'NW loud in stomachs (g) per kg
of salmon round weight
Average weight of food (g) per
minion examined
Condition factor
parenlheses5
St. John, N.B.
26 June2 July/70
feadusmorhsn
saida
/Immodytes sp.
Inarlochas luPoi
Lumpe nos Ina( &ala•
Se/votes mormin
Co/tune/due towrope
1/yonocepha/us w orpioldes
Rionha•dttui toppoglosoodes
Clam shell'
Gonaths fabru n
Polmhaete worm
Amphipod
Fuphausiel
Posiplonia fordo
7.94
14.5
. _
47.3(2)
„
44.4( I )
331 2( I. IS
3.1(1)
5.1(2)
07(1)
2 9(2)
I.4 I)
15191)
..
...
17.4(2)
0.61)
...
0.1(1)
0
30
IS
21
0.1(1)
26
14
11
1 5(3)
118.2(29)
3241(61)
..
157
21.65
2.1
105.70
0.6
49.36
78.4
71.50
492.5
88.70
1637.9
39.10
1378.1
35.50
61.9
506.12
3160.3
0.1
0.0
1.6
6.9
18.5
35.2
III
6.2
0.4
126
0.0
1-14
5.2
1.08
215
1.12
630
1.12
98.4
1.09
59
1.10
20.1
33
LEAR: FOOD AND FEEDING OF ATLANTIC SALMON
Lab. Sea
NE Nfld.
Shelf
17 May.
ICNAF "IC"
I Sept_.
30 Oct,
1968-70
ICNAF "]D"
16 Aug.
10 Oct.
1969-70
ICNAF b I.E.F"
I Aug.16 Oct.
196970
Labrador
Sea
30 Sept.,
4 Oct./71
24 May /70
Total
1968.71
Percent
by
52-59
56-59
52-59
57-59
4455
44-59
weight
- (58)
(0)
- (I)
- ( I)
43,5(17)
...
,.,
105.2(19)
4.7(1)
0.2(1)
45.1(4)
12.6(1)
...
12.6(14
...1.7(1)
5498.3(124)
70.2(7)
128.9(4)
15.6(2)
8.4(1)
7.2(1)
...
132.5(24)
3.5(1)
13.8(3)
0.7(1)
„.
..
0.6(1)
...
.„
...
240.1(25)
30.2(3)
119,4(9)
63.46)
90.9(15)
0.5(2)
31,9(5)
35.1(4)
- (2)
...
13,0(3)
- (5)
43.5(17)
34.7(5)
.. ,
:161.7(24)
.,.
78.8(11)
„
08(1)
1.242)
0,5(1)
28.48
282,7
23.22
253.9
78.13
521.0
215
4
2
IS
I1
36
5.69
43.8
14.9
28.6
6.7
10.9
9.9
1,8
1.16
23.1
1.07
18.8
1.04
:1.7
1.05
11.0
1.12
ICNAF "IC"
24 Aug,4 Nov.
1968-70
611.69
60-69
-- (19)
...
148.6(24)
17.5(6)
(21)
279.4(67)
250.8(40)
...
7.9(1)
586.2(22)
.. ,
3687.8(147)
„ .
108.9(2)
..
.
..
.
629.7(37)
...
. . .
ICNAF "ID"
15 Aug.I Nov.
1969-70
60-69
- (6)
...
91.0(14)
8.4(1)
...
..
795.9(72)
. „
128(1)
652.020)
„ .
..
.
34.1(1)
243.7(24)
...
61-69
61-69
- (2)
...
228.9(32)
11.9(3)
„.
- (0)
(9)
...
24.1(7)
- ( I)
„.
49.7(13)
. , .
...
1828,6(53)
. . .
...
. . .
222.9(2)
7.5(1)
20,0(3)
86.4(3)
„.
...
1324
...
I)
81.9(2)
49.11( I I )
...
...
0.2( I)
8.2(4)
...
...
198.0(19)
297.1(13)
48.9(3)
.. ,
.. _
.
...
28(1)
...
0.8(I)
178.6(43)
211:X37)
1.2(2)
162.8(37)
126.9(33)
I It
231
16.6
1.07
Lab. Sea,
NE Nfld.
Shelf
17 May24 May/71
61669
..
56
Labrador
Sea
6 Sept.40c1.
196970
6069
...
0,5(2)
336.81
1893.5
Davis
Strait
5 Sept./70
„ .
95.0(3)
.
ICNAF "IE-F"
6 Aug..
26 Oct.
1969-70
413.00
6141.7
4,10
7.4
7.7
ICNAF "113"
I Sept..
10 Nov.
1068/0
.,
.
6711,91
5412 6
8.1
23 4
1.13
...
1.7(1)
379.9(20)
2.0(6)
48
13430
1113.4
10.5
29.4
1.11
...
12.4(3)
775.9(52)
286,8(34)
1114
285 97
3297 3
11 .5
31.7
1.06
76.8(11)
61(1)
2
6.00
223.0
...
0.1(1)
...
13.4(4)
...
13.4(17)
...
5.7(I)
28
29
85.50
216 9
37.2
1 115
1.12
0.71
1.71
0.21
0.03
89.52
0.25
2.16
0.01
0.01
3.91
1.48
7.7
1.08
89 33
626 2
100.00
Total
196871
Percent
by
60-69
weight
- (129)
1.141
279.467)
5.31
1056.8(2 I I)
0.33
66.0(13)
<0.01
0.2(2)
1.90
378.2(6)
II 589.2(360) 58.24
1.10
218.0(22)
4.07
310.3(23)
48.9(3)
0.25
0.08
16.8(2)
0.58
116.0(3)
2515.0(206) 12.64
3.1( I)
0.02
0.09
18.6(3)
1.4(4)
0.01
0.06
11.1(6)
0.01
1.4(1)
0.08
15.0(2)
2.0(1)
0.01
92.2(IS)
0.46
20.6(10)
0.10
8.43
1676.4(202)
955.44174)
4.80
5.7(1)
0.03
836
2526.45
19897.7
7.0
7.9
21.6
106
23.8
100110
Empty
Unidentified material
Fish remains
Unidentified invertebrates
Terrestrial insects
Mallon), ',Moans
Lantern fish
4 mmodyteg sp.
Spinach(' helicata
Po/yehacte worm
Amphipod
Euphausiid
Total salmon stomachs examined (No.)
Total round weight of salmon
whose stomachs were examined (kg)
Total food in stomachs (g)
Total fond in stomachs (g) per kg
of salmon round weight
Average weight of food (g) per
salmon examined
Condition factor
Empty
I I Seidl( ied material
Fish remains
Unidentified invertebrate
topeoplahrirus sahnoais
Cl p. harengus harengus
Italloins Viii0SUA
Lantern fish
Paralepis coregonoides borealis
NosobTrt Tits. layer,
Cadus rnorhua
Boreogadus said()
Anpnodytes sp.
Atuehirhas lupus
lumpenus maeulatus
Sebastex mania.
Cot:uncut. microps
If yospeephalus sporpioides
Remhordtius
hippoglossoides
Clam shell'
Gonotux foibrieu
Polyeharte worm
Amphipod
Euphausiid
Pasiphara Innla
Total salmon stomach, examined (No.)
Total ronnd weight of salmon
whose stomachs were examined (kg)
Total food in slum achs (g)
Total food in stomachs ( g ) per kg
of salmon round weight
Average weight of food ( g ) per
salmon examined
Condition factor
34
ICNAF RESEARCH BULLETIN NUMBER 9, 1972
TABLE 4 Stomach contents of Atlantic salmon caught in various arras and at different seasons, 1968-71, showing weight of food (g) and number of ma en
Length group (70-79 cm).
Salmon length (ern):
(in parentheses).
St. John, Nth.
26 June2 July/70
Aliramichi
12 June9 July/70
Carleton
15 Juno16 June/70
Port aux
Basques
22 May15 June/70
Bonavista
8 June19 lone
1970-71
St. Anthony
26 June6 July(70
Pack's 11r.
6 July25 Jul y /70
12 Sept.27 Oct.
1969-7(1
70-79
70.79
70.79
70-79
70-79
70-79
70-79
7079
Empty
Unidentified material
Fish remains
Ilindentlfied invertebrates
Bird feather
Plant material
Clupro harermus harengus
Atom. pseurloharengus
..11allolus rillosus
Ovm.crus mordax
Lantern 11,11
Paralepi• sp.
Parodepa, orrgonoldes borcniis
Noodeprs dam( k Oyer(
Caslerosleus ezrulealur
Godus morhua
Ammodytes sp.
Lummums macultilus
Sehastes marinus
Gillum ulur mirrops
Agorms decagonus
Cycloprus
te lumpus
Reinhurthius hippoglorsoidrs
Spiratella helieina
Conniusfabremi
Polych.lete worm
Amphipod
Euphamild
Nei-riles areliens
- (8:1)
, ..
69.0(13)
(203)
Total salmon stomachs examined (Nu.)
Total round weight of salmon
whose stomachs were examined (kg)
Total food in stomachs (g)
Total food in stomachs (g) per kg
of salmon round weight
Average weight of food (g) per
salmon examined
Condition factor
106
204
48130
237.4
915.60
2.4
2.4(1)
- (96)
...
16(2)
0.1(1)
...
63.9(2)
97.1(1)
...
1286.3(28)
1177(6)
...
07(1)
(8)
...
57,8(11)
2.6(1))
...
0.1(1)
1718(2)
14511,5(23)
... ,
.. .
210(3)
- (311)
...
49.5(9)
...
.„
...
4055.0(47)
...
10282.7(87)
...
...
519(3)
126.3(8)
.. .
2.6(2)
(0)
78(1)
- (48)
...
0.0( I)
...
...
...
63203(81)
..
26.0(1)
29.9(6)
30.9(2)
1.2(1)
3.3(1)
17(1)
2.2(5)
133
590.89
1410.0
...
106.9(9)
11.5(1))
, ..
...
2:16.9(4)
.. .
.- 0.(2)
...
...
0.1(1)
.. ,
54
0.1(1)
64
151
43
292.00
3330.6
661.35
146251
18180
6392.8
0.5
0.0
2.4
11.4
22.1
2.2
107
0.0
1.12
10.6
1.06
52.0
1.14
96.9
1.09
318
148.7
1.05
84,2(19)
1.311)
...
...
1356.0(32)
„ ,
59.1(1)
(5)
23780
268.5
1.1
58
1,110
• • •
2063(19)
3.3(2)
0.4(3)
0141)
0.441)
„.
7.11(4)
...
113(7)
1780(22)
59
26081
18515
7,1
314
7.17
TABLE 5. Shimach contents of Atlantic salmon caught in various areas and at different seasons 1968-71 showing weights of food (g) and number of occu
parentheses). Length group (811.89 cm).
St. John, N.B.
26 June.
2 July /70
Salmon length (cm))
Empty
1 nucleoli1rd material
Fi11 remainsCiupea harengni g mengui
Vallolus villosus
Paralepts toregonoides borealis
Garbrrosieus or ulraius
Codas morlma
4mmorlytes sp.
Scombe r seambrus
Sebastes marinus
Reinhardtins hippoglossoides
Amphipod
Eughativild
Total salmon stomachs examined (No.)
Total round weight of salmon
whose stomachs were examined (kg)
'total food in stomachs (g)
Total food in stomachs (g)
per kg of salmon round weight
Average weight of food (g)
per salmon examined
Condition factor
80-86
(20)
...
4.5(2)
857(2)
. . .
Miramichi
18 June.
5 July /70
80-89
- (23)
..
11,0(3)
191 .1( I )
, , .
1.0(2)
Carleton
15 June1 6 June /70
Port aux
Basques
20 May4 June /70
Honavista
8 June.
24 June
1970-71
St, Anthony
26 J une 6 July /70
80.89
80-88
80-89
811-115
- (44)
...
170(8)
...
295.7(9)
. . .
1.6(2)
(0)
...
631(1)
113.9(4)
„,
. . .
1219(6)
, , .
67,2(1)
-
(4)
...
419(3)
1321 A(12)
2434.4(18)
. . .
1.6(1)
02(1)
27
63
(9)
...
4.5( I )
:0( )
I 5(1)
„.
0.50 )
..
4142)
6
29
10
I0
42125
317.3
3130
322.0
195.40
3802.3
5180
1251.3
5410
4.5
1.0
1.1
0.7
9.1
19.5
22.8
OA
5.0
113
53.7
1.03
131.1
115
-( I )
...
141(2)
31.6(3)
180.80
202.4
75
1.16
80-88
1236.8(9)
16475
158.6
5.9
1.09
ICNAF "IA"
12 Sept_
16 (let
1969-70
80-87
(0)
10.0( I )
...
19.7(1)
27
Pack's Harbour
8 July23 July 170
1251
099
0.5
0.911
9
6305
259.1
41
208
1.14
35
LEAR: FOOD AND FEEDING OF ATLANTIC SALMON
18 Au g ,.
12 Oct./70
Davis
Strait
S Sept./70
Labrador
Sea
6 Sept.40.1_
1969-70
Lab. Sea,
NE Nfld.
Shelf
I4 Nay24 May/71
Total
1968-71
Percent
by
70-71
70-75
70-73
70-76
70-79
70-79
weight
. (0)
...
10.1(1)
4.2(1)
.. ,
- (0)
- (1)
- (5)
...
13.5(6)
...
- (497)
17.0(5)
429.3(108)
8.2(4)
0.1(1)
0.2(2)
4317.2(53)
97.1(1)
21488.9(232)
117.7(6)
242.6(2))
25.0(3)
996.9(26)
55,7(5)
3.3(3)
108.8(6)
2355.3(105)
3.3(2)
0.4(3)
0.5(1)
0.4(1)
1.2(1)
67,6(5)
236.9(4)
42.1(1))
3.3(1)
319.0(62)
285.5(43)
1.2(1)
0.05
1.37
0.03
< 0.01
< 0.01
13.83
0.31
68.82
0.38
0.78
0.08
3.19
0.18
0.01
0.35
7.54
0.01
< (1.01
< 0.01
< 0.01
< 0.01
0.22
0.76
0.13
0.0/
1.02
0.91
<0.01
ICNAF "18"
I Sept.Nov.
196870
ICNAF "IC"
.11 Aug.12 Oct.
1968-70
ICNAF 'A ID"
24 Aug.6 Sept,
1969-70
70-79
70-77
- (10)
...
25.7(13)
., .
(3)
16.8(4)
8.1(2)
. ,.
.. .
253.7(9)
. ..
138.9(3)
1.4(I)
. . .
_ . .
. . .
. . .
.,
243.5(4)
9
7.9(1)
.. .
375.015)
..
245(2)
- (5)
0,2( I)
97.6(28)
0.1(1)
0.1(1)
...
...
I)
15.0(1)
...
245.8(9)
.. .
.
18.7(5)
0.9(1)
0.6(1)
45
18
178.21
594,1
72.80
390.5
5,4
3.3
13.2
1.05
21.7
1.09
30.01)
. „
40.2(2)
94.7(1)
...
71.7(2)
...
15.5(25)
0.9(3)
1.2(1)
25
50
964
215.38
1156.5
4242d15
31224,7
2
6
14.93
183.8
25.80
301.1
8.70
9.0
98.98
389.2
12.3
14.8
1.0
3.9
6:15
1.19
1968-70
ICNAF '' ID"
30 Sept. 169
27 Aug.27 Sept.
1969
81117
80-07
88
82-86
(I11
...
196(3)
...
30.5(2)
123.3(2)
. „
55.7(3)
..
(0
29.1(4)
393(I)
...
315.6(5)
„.
(I))
7
8
I
232.2
52.83
416.8
8.25
1118.9
332
1.05
531
1.18
7.4
23.1
1.10
32.4
Davis
Strait
6 Sept. /70
Labrador
Sea
10 Sept.3 Oct.
1969-70
ITb. Sea
NE Nfld.
Shelf
19 May23 May/71
Total
1968-71
80
81 .88
80
80-89
- (0)
- (107)
29.444)
171.1(25)
1662.0(16)
4732.1(56)
137.3(3)
5.6(1)
7.6(2)
245.0(15)
67.2(1)
20.0(1)
0.5(1)
51.1(7)
4.8(4)
( I)
II1
- (2)
/ ..
1.6(1)
...
...
12.0(1)
6.19 I )
. . .
0.2( I )
0.1(1)
79
54
,. .
211.0(1))
.
1.20)
5.5
15.6
1.06
18(1)
31,92)
.
2.1(2)
...
4.5
1.10
,.
911,0(1)
.
. .
4
46.0
1.07
. .
23.4(7)
. . .
ICNAF "IL'
22 Sept.Oct.
1968-70
ICNAF - Dr
It Sept.-
227.6(19)
...
734.2(15)
55.7(5)
...
1.3(1)
102.5(10)
„.
37.1(13)
67(7)
.. ,
.
17.9(1)
I
12.40
44.7
13.2
3.6
108.9
1.21
22.4
1.05
2
2
11.80
0.0
11.66
13.6
0.0
00
1.2
90
LI I
0.0
0.98
6.11
1.14
5.70
0.0
99.98
5.4
:15.0
Total salmon stomachs examined (No.)
Total round weight of salmon
whose stomachs were examined (kg)
Total food in stomachs (g)
Total food in stomachs (g) pee kg
of salmon round weight
Average weight of food (g) per
salmon examined
Condition factor
Percent
by
weight
0.41
2.40
23.30
66.33
1.92
0.08
all
3.43
094
0.28
0.01
0.72
11.07
204
1318.91
7133.7
Empty
Unidentified material
Fish remains
Unidentified invertebrates
Bird feather
Plant material
Clupea harengus harengus
Ana pseudoharmigus
Mallotus villosus
Osmerus mordox
Lantern fish
Parolepis sp.
Paralepis coregonoides borealis
Notolepi., rissoi krOyeri
Casterosteus oruleatus
Gaging morhua
Ammodytes sp.
Lumperms maculotus
&bastes marinas
Cottunnalus mkrops
..4gorms decagonus
Cyclopterus lurnpus
Reinhardtiug hippoglossoides
SpEratella helkirut
Conatus fablkii
Polyehaete worm
Amphipod
Eophausiid
Sergestn aret In
100.01)
Empty
Unidentified material
Fish remains
Clupeo herigns
ar
hareogys
Ala/lotus villosus
Paralepis toregonoides borealis
Gasterostous oculealus
Cadus morhua
Ammodytes sp.
Scomber scombrus
Sebastes marirms
Iteinhardtins hiPP.e.ssoid"s
Amphipod
Euphausiid
Total salmon stommhs examined (No.)
Total round weight of salmon
whose stomachs were examined (kg)
Total food in stomachs (g)
Total food in stomachs (g)
per kg of salmon round weight
Average weight of food (g)
per salmon examined
Condition factor
36
ICNAF RESEARCH BULLETIN NUMBER 9, 1972
In the Saint John River estuary, Miramichi River
estuary, and near Carleton, Quebec, 74-100% of the
stomachs examined were empty (Fig. 4). The main food
items in terms of volume were capelin, Mallotus uillosus;
unidentified (digested) fish remains, Atlantic herring,
Clupea harengus harengus; smelt, Osmerus rnordax;
mackerel, Scornber scornbrus; and stickleback, Gasterosteus aculeatus; (Table 1, Fig. 4). The salmon had
very high condition factors (1.10 to 1.17).
coastal areas of Newfoundland and Labrador, the
percentage of empty salmon stomachs ranged from 0 to
28 (Fig. 4).
Along the coast of West Greenland from Disko
Island to Frederiksdal, most of the stomachs contained
food, the main items of diet being capelin, launce,
amphipods, cuphausiids, unidentified (digested) fish
remains and some Paralepis coregonoides borealis (Fig.
4). The condition factors for salmon of all lengths
combined along the West Greenland coast were fairly
high ranging from 1.08 to 1.18 (Table 1).
In the coastal areas of Newfoundland, most of the
stomachs contained food mainly capelin, herring, and
launce, Ammodytes sp. The condition factors were high
ranging from 1.12 to 1.17.
In the Davis Strait and Labrador Sea during
August-November, feeding was fairly intensive with most
of the stomachs containing food, mainly Paralepis
coregonoides borealis, lantern fish, Arctic squid,
Gonatus fabricii; amphipods, and unidentified fish
remains. The condition factors (1.08 to 1.17) are in the
same range as those for the West Greenland coastal
waters.
In the Pack's Harbour area of Labrador, 85% of
the stomachs were empty. The main food items in terms
of volume were pteropods, Spiratella helicina; launce,
baby Atlantic, cod, Gadus morhua; and capelin. The
condition factors decreased with the length of the
salmon from 1.12 for the 50-59 cm group to 0.99 for
the 80-89 cm length group (Tables 2-5). In the combined
T A ME 6. Stomach contents of Atlantic saline
Length group (90.99 cm).
Salmon length (cm):
Empty
Fish remains
Plant material
flu ff. 99rdodur
Mellows uillemus
rnmodyter sp.
A mphipod
Nfiramichl
18 June
1970
Carleton
15 June16 June
1970
90
91499
- (I)
(28)
1.1(1)
...
is
Port aux
Basques
15 Ju
1970
lionayista
8 June.
22 June
1970-71
29 Sept.15 Oct.
1969-70
90
90.95
91-92
90
90-99
- (I)
1.0(1)
...
352.4(3)
333.0(3)
...
- (0)
26.9( I )
0.2(1)
...
143.1(3)
20.8(2)
- (0)
0.5(1)
1.141)
- (30)
29.5(4)
0.2(1)
352.4(3)
554.7( I 0)
57.8(3)
1141)
7.511
2.3
428.85
996.4
- (0)
78.44)
37. 0( 1 )
Total salmon stomachs examined (No.)
Total round weight of salmon whose
stomachs were examined (kg)
Total food in stomachs (g)
Total food in stomachs (g)
per kg of salmon round weight
Average weight of food (g)
per salmon examined
Condition factor
ons 1968.71 show log weights of foods (g) and number of ocro
fight In various areas nd at different
7
4
9.00
0.0
307.10
79.7
7.80
37.0
61.15
686.4
36.30
191.0
0.0
0.3
41
112
0.0
1 23
1.16
37.0
1.07
98.1
1.14
33
Noverntwr
1968
Percent
loy
weight
2.96
11.112
35.37
55.67
5.80
0.111
47
0.3
47.8
1.17
Total
1968-71
2.3
1.03
2.3
100.00
•
37
LEAR: FOOD AND FEEDING OF ATLANTIC SALMON
sCopelin
Lantern
Launce
Herring
DEuphausiids
c borealis
fish
9 Other species
Amphipods
sts
Empty
ST JOHN, MIRAMACHI, CARLETON
100,
80 60
40 20 t
PORT AUX BASQUES, BONAVISTA, ST ANTHONY, PACKS HARBOUR
ICNAF DIVISIONS IA, IB,IC,ID,IE F
60
40
cc
1st
a_
20
70
DAVIS STRAIT, LABRADOR SEA (AUTO
5
00 r
80
60 r
40
20
7\s/N`f
\v/%7
2 '49 ? 7 ./
A
LABRADOR SEA, NE NFLD SHELF (SPRING)
C
k
I
7
O
6
0,
0)
CO
CT
OD
CD
Of
0)
6 6
in
6,
6
r o.
o
O —
r--
0)
01
0=
4,79a-7
0 2
ot ch
m
en
us to ho
O 6 o
o oo
0
gl
N.
o
CO
LENGTH (CM)
Fig.
Percentage by weight of various food items in the stomachs of Atlantic salmon
from various areas by 10 cm length groups. Percentage empty are shown on the
right. Numbers indicate the number of stomachs examined in each length group
and area.
38
ABLE
ICNAF RESEARCH BULLETIN NUMBER 9, 1972
fff tomarl
of Atlantic salmon aught cr
n arc111/www )Length W rung ( 100 110 1,1
Miramichi
18 June 170
103
Salmon let Ail
F m ph
- (I)
1 (fief salmon xturnat lc examined (No_)
I ntal round weight ot salmon whose
flomai lix were f xamined (kg)
iota' loud in xtomai (g)
1 oial loads stoma
(g)
r kg of xalmon round weight
A reragt wrrglrt of loud (g)
per xalm fin examined
I on& lion tailor
ue areas
and
ent seasons 1969-70 showing weights of food (g) and
Carleton
15 J uncx
16 June /70
ICN Alf "I A"
14 Oel.C20
101-113
100
— (6)
UJ
ICNAF
I Oct /69
102
ber
occur wines (in
Total
1969-70
Permit
be
weight
100.113
( I)
10)
0
6
11.80
0.0
04.118
0.0
10.43
0.0
11.77
00
118.88
0.11
0.0
0.0
0.0
0.0
UL
11.0
1.011
0.0
1.15
0.0
1.04
0.0
1.11
0.0
In the Labrador Sea and off the Northeast
Newfoundland Shelf during May 1971, 77-100% of the
salmon stomachs contained food (Fig. 4). The main
items of diet were Paralepis coregonoides borealis,
lantern fish, amphipods, fish remains, and Notolepis
rissoi krOyeri (Table 1). The condition factor for all
lengths combined was 1.11 and ranged from 1.06 to
1.19 between 10 cm length groups.
Discussion
It is obvious from this investigation that Atlantic
salmon cease to feed when they enter the estuary of
their home river, since most of the food found in the
stomachs at this time was almost all partially digested
except for a few terrestrial insects and sticklebacks which
had apparently just been eaten before the salmon were
caught. These results agree with those of Power (1969);
Kendall (1935); Jones (1959); and Keenleyside (1962).
In the Newfoundland coastal areas salmon eat a
considerable volume of food during May-July and the
amount eaten per salmon generally increases with each
10 cr11 increase in length. The amount of food per kg of
salmon round weight also increases up to 79 cm but then
decreases with increasing length. The main food items
are capelin, launce, and herring at this time of year. Blair
(1965) and Lindsay and Thompson (1932) reported that
the main food items were capelin and launce. The large
amounts of food in the stomachs at this time are
reflected in the high condition factors especially for the
Bonavista area (1.17).
In the Pack's Harbour area, 85% of the stomachs
examined were empty. This was probably because of a
lack of capelin and herring in the area since a report on
cod investigations in this area states that during August
1970 no capelin, herring, or mackerel had been seen up
((00
to 10 August. It is also probable that many of these
salmon had ceased feeding as they may have been
enroute to home rivers such as the North, Eagle, and
Paradise rivers in Sandwich Ray and the Sand Hill River
in Table Bay. The main items of diet in terms of volume
were pteropods, Spiratella helicina.
In the West Greenland coastal areas, salmon were
feeding almost continuously but less intensively than in
the Newfoundland coastal areas of Bonavista and St.
Anthony (Figs. 1 and 2) but at about the same intensity
as at Port aux Basques. In ICNAF Division IA (mainly
Disko Bay) salmon stomachs contained a wide range of
food items but mainly capelin, launce, unidentified
(digested) fish remains, amphipods, euphausiids with
smaller amounts of Greenland halibut fry, Reinhardtius
hippoglossoides; daubed shanny, Lumpenus maculatus;
striped wolffish fry, Anarhichas lupus; redfish fry,
Sebastes marinas; polar sculpin, Cottuneulus microps;
and Arctic sculpin, Myoxocephalus scorpioides. In
Division 1B mainly over the shallow banks off Holsteinsborg, specimens of Paralepis coregonoides borealis were
found in 4 of 171 stomachs examined. The large
amounts of capelin, launce, and euphausiids agree with
the results of Hansen (1965) but also of importance in
the stomachs at this time are amphipods.
In the Davis Strait Paralepis coregonoides borealis
was the main species occurring in the three stomachs
which contained food.
In the Labrador Sea during August—November
Paralepis eoregonoides borealis account for the largest
volume of food eaten and Arctic squid, Gonatus fabricii,
next in importance. These large amounts of Arctic squid
were also found by Templeman (1967) in this area but
during this investigation the paralepidids were found
only in the 1970 samples from West Greenland and
Labrador Sea during August-November with none being
found in those for 1968 and 1969.
LEAR: FOOD AND FEEDING OF ATLANTIC SALMON
In the Labrador Sea and off the Northeast
Newfoundland Shelf during May 1971 the main food
items were Paralepis coregonoides borealis, lantern fish,
fish remains, and Notolepis rissoi krgyeri. Feeding was
intensive with only 8% of the stomachs being empty.
The condition factor (1.08) is high compared to that for
the same area during April 1971 (0.97) (unpublished
data) and suggests that the salmon increase their feeding
intensity during April-May in the south Labrador Sea
and off the Northeast Newfoundland Shelf.
It is to be noted that although condition factors
fluctuate from area to area, all have a value above 1
when all the length groups are combined and only in
three areas (St. Anthony, Pack's Harbour and the
Labrador Sea) for the 80-89 cm length group do the
values decrease below 1. This would tend to indicate
that the salmon, while at sea, are feeding almost
continuously and fairly intensively.
Acknowledgments
I am indebted to Dr A. W. May and Mr J. II.
C. Pippy for making available to me stomachs of
salmon collected during the course of some of their
field trips.
References
BLAIR, A. A. 1965. Bay of Islands and Humber River
Atlantic salmon investigations. J. Fish. Res. Bd. Canada,
22 (2): 599-620.
39
CHRISTENSEN, 0. 1961. Preliminary results of an investigation on the food of Baltic Salmon. ICES, Salmon and
Trout Committee, C. M., Doc. No. 93, 6 p. (mimeographed).
CHRZAN, F. 1960. Results of investigations on the food of
the salmon and sea trout off the Polish Baltic coasts.
ICES, Salmon and Trout Committee, CM., Doc. No. 70,
4 p. (mimeographed).
DAHL, K. 1918. Salmon and trout: A Handbook. Salmon Trout
Ass. London, p. 1-107.
HANSEN, P. M. 1965. Report on recaptures in Greenland
waters of salmon tagged in rivers in America and
Europe. Int. Comm. Northw. Atlant. Fish. Redbook
1965, Part III, p. 194-201.
JONES, J. W. 1959. The salmon. Collins, London. 192 p.
KEENLEYSIDE, M. H. A. 1962. Skin-diving observations of
Atlantic salmon and brooktrout in the Miramichi River,
New Brunswick. J. Fish. Res. Bd. Canada, 19(4): 625-634.
KENDALL, W. C. 1935. The fishes of New England. The
salmon family. Part 2 — the salmons. Hem. Boston Soc.
nat. Hist., 9 (1): 1-166.
LINDSAY, S. T., and H. THOMPSON. 1932. Biology of the
salmon (Salmo solar L.) taken in Newfoundland waters
in 1931. Rep. Newfoundland Fish. Res. Comm., 1 (2):
1-80.
POWER, G. 1969. The salmon of Ungava Bay. Arctic Inst.
North America, Tech. Paper No. 22, 72 p.
TEMPLEMAN, W. 1967. Atlantic salmon from the Labrador Sea
and off West Greenland, taken during A. T. Cameron cruise,
July-August 1965. Res. Bull. int. Comm. Northw. Atlant.
Fish., No. 4, p. 5-40.
1968. Distribution and characteristics of Atlantic
salmon over oceanic depths and on the bank and shelf slope
areas off Newfoundland, March-May, 1966. Res. Bull. int.
Comm. Northw. Atlant. Fish., No. 5, p. 62-85.
THUROW, F. 1966. Beitraege zur Biologic and Bestandkunde
des Atlantischen Lachses (Salmo solar L.) in der Ostsee.
Ber. dtsch. Komm. Meeresforsch., 18(3/4): 223-379.
(Transl. from German by Fish. Res. Bd. Canada Trans'.
Set No. 1211, 1969).
Studies of the Food Habits of Silver and Red Hake
in the Northwest Atlantic Area, 1965-67
By V. I. Vinogradov'
Abstract
The present paper contains the results of the studies of the food habits of silver hake, Merluccius bilinearis (Mitchell),
and red hake, Urophycis chuss Walbaum, conducted in 1965-67 on the Scotian Shelf, Georges Bank, and on the Shelf
south of New England from Cape Cod to Cape Hatteras (Figs. 1 and 2). Data obtained from more than 48,000 stomachs
showed differences in the feeding patterns of both male and female silver and red hakes by size-groups and in the
composition of food-species by areas and season. Coefficients of food similarity between silver and red hake were
calculated. Food competition between these species would seem to be very light.
Introduction
Feeding patterns and food relationships are often
the factors determining the behaviour and distribution
of fish during their whole life history. Because of their
abundance in the Northwest Atlantic, silver and red hake
are of particular interest for their feeding relationships.
Nevertheless, the food and feeding of these species has
been practically ignored until recently. Limited information is available in works by Bigelow and Schroeder
(1953), Schaefer (1960), Sauskan (1966), and Rikhter
(1968).
Since 1965 AtlantNIRO has been collecting
material for the investigation of feeding patterns and the
competition for food of these two species. The present
paper summarizes the available material and attempts to
fill in some of the existing gaps.
Material and Methods
The present paper is based on data collected
during studies of the food habits and feeding of silver
hake and red hake in 1965-67. Generally, samples
consisted of 100 specimens of each species. The amounts
of food in each stomach was recorded in four categories:
0 — empty; 1 — partly full; 2 — half full; 3 — full; and 4
— overfilled. Food items in the stomachs were identified
in the laboratory and sometimes at sea. Quantitative
analysis of the material was limited to determining the
frequency of occurrence (percentage) of the food items
by counting the number of stomachs in which each food
item was found. Only stomachs containing food were
used to estimate this frequency of occurrence. Rate of
feeding was determined by the degree of fullness of the
stomachs examined, while the proportion of feeding
specimens was determined from the total number of
stomachs analyzed. Regurgitated stomachs were not
included. Food items of silver and red hake were
compared using a method of comparison of frequencies
of occurrence of food organisms which was suggested by
Yanulov (1963) in his studies of feeding of redfish
(men tells and marinus) arid of cod from the Newfoundland and Labrador areas. His method calculated a
coefficient of food similarity between the two hakes
species,
CFS
n X 100
where N is the sum of the highest percentages of
frequency of occurrence of food organisms for the
compared species, and n is the sum of the lowest
percentages of frequency of occurrence of the general
food components. According to this formula, with
complete difference in the food composition of
stomachs of the two species compared, the CFS will be
0, whereas with complete similarity it will be 100.
A total of 48,001 stomachs, 42,515 from silver
hake and 5,486 from red hake, from ICNAF Statistical
Subarea 6 and 1CNAF Divisions 4W, 4X, and 5Z were
examined. Of the total number of stomachs examined,
16,597 from silver hake and 2,013 from red hake
contained food items.
' Atlantic Research Institute of Marine Fisheries and Oceanography (ATLANTNIRO), 5 Dmitry Donskoy Street, Kaliningrad, USSR.
42
ICNAF RESEARCH BULLETIN NUMBER 9, 1972
36°
38°
40°
42°
Fig. 1. Sampling areas in the studies of silver hake feeding.
42°
40°
750
70°
65)
Fig. 2. Sampling areas in the studies of red hake feeding.
Results
Food of silver hake
a) by species composition of food items
Table 1 shows that 59 species of invertebrates and
fishes were found in the stomachs. Among them were 24
species of each of fishes and crustaceans, 3 species of
molluscs (mostly squids), 3 echinoderms and 5 other
species. Of the 59 species, 41 were typical plank tonic
and bathypelagie species, 18 were benthic or more or
less related to bottom.
VINOGRADOV: FOOD HABITS OF SILVER AND RED HAKE
43
TABLE I. List of food organisms found in the stomachs of silver hake, (± very seldom, -1-4- seldom, ±1-1- often, I I I I very often).
Pelecypoda
Phaeophyta
27. Nucula tennis (Montagu)
Fucus sp.
Cephalopoda
Polychaeta
Tomopteris sp.
-1*
Copepoda
CaDnus finmarchieus (Gunnerus)
Calanus hyperboreus Krslyer
Centropages typicus Kr8yer
28. Blex illecebrosus (Lesueur)
29. Loligo peali Lesueur
Chaetognatha
1 1 1
1
-FE
Sagitta elegans Verrill
Sagitta serratodentata Krohn
Eukrohnia hamata M8bius
Thoracica
Asteroidea
Balanus eburneus Leach
Leptasterias groenlandica (Liitken)
Mysidacea
Ophiuroidea
Mysis sp.
Gorgonocephalus arcticus Leach
Hy periidea
Hyperia galba (Montagu)
Themisto rompressa Goes
Themisto libellula Mandt
-HP
III
*HE
Echinoidea
Echinarachnius parma (Lamarck)
Pisces
Gammaridea
"Unidentified"
Euphausiacea
Meganyctiphanes norvegica (M. Sars)
Thysanoessa inermis (KrOyer)
Thysanoessa raschii (M. Sars)
Thysanoessa longicaudata (Krdyer)
Namatoscelis megalops (G.O. Sars)
Decapoda
Pandalus montagui Leach
Pandalus borealis Kr8yer
Crago septemspinosus (Say)
Homarus americanus Milne-Edwards
Panulirus argus (Latreille)
Pagurus acadianus Benedict
Pagurus longicarpus Say
Cancer irroratus Say
Cancer borealis Stimpson
Panopeus (7)
Invertebrates had the greater number of species
represented (34) in the stomachs (57.6%). Almost all of
them were widely spread, eurihathic mass organisms.
Etrumeus sadina (Mitchill)
Clupea harengus harengus Linnaeus
Alosa pseudoharengus (Wilson)
Alosa aestivalis (Mitchill)
Anchor, mitchilli (Valenciennes)
Mallotus villosus (Muller)
Argentina silus Asemius
Ceratoscopelus maderensis (Lowe)
Aethoproro (Diaphus) effulgens Goode and Bean
Myctophum affine (LMken)
Maurolicus muelleri (Gmelin)
Scomberesox saunas (Walbaum)
Merluccius bilinearis (Mitchill)
Urophycis chuss (Walbaum)
Hippoglossoides platessoides (Fabricius)
Limanda ferruginea (Storer)
Citharichthys arctifrons Goode
Paralepis sp.
54. Scomber scombrus Linnaeus
55, Paprilus (Poronotus) triacanthus (Peck)
Stenotomus chrysops Linnaeus
Sebastes marina (Linnaeus)
Ammodytes americanus De Kay
Macrozoarces americanus (Block and Schneider)
Twenty-four species, of which 12 were fishes,
occurred often or very often, while the rest occurred
rarely.
44
ICNAF RESEARCH BULLETIN NUMBER 9, 1972
Vertebrates were represented by 24 fishes with
anchovy, herring, hakes, argentines, mackerel, and sand
lance being most common in stomachs.
Invertebrates were mainly represented by both
number of species and in frequency of occurrence. The
bulk were euphausiids (62% by frequency of occurrence)
TABLE 2. Percentage occurrence of food items in stomachs of silver hake of various size-groups in ICNAF Subareas 4, 5, and in
Statistical Subarea 6 in 1965-67. Figures in the numerator are for females, in the denominator for males.
Length groups (cm)
21
Food items
Copepods
Euphausiids
2.6
69.5
21-25
0.9
67.0
59.5
Amphipods
Shrimp
16.7
2.1
1-4
Herring
41-45
46-50
1.1
0.5
0.5
0.1
0.1
64.9
68.0
56.3
65.4
41.7
62.1
26.4
4.7
50
Total
numbers
(%)
118
0.71
54
1.2
1.4
2.5
3.8
2.4
2.6
2.2
2.2
1.5
434
2.61
6.0
5.7
5.3
4.6
5.9
7.3
3.8
2.2
4.7
58
5.48
0.1
0.1
0.1
0.1
0.1
0.1
1.1
0.8
1.2
1.1
2.0
1.0
4.4
3.4
8.2
5.4
5.6
4.5
2.8
1.5
1.4
0.7
3.4
1.1
0.1
0.03
0.5
0.1
1.1
2.2
0.10
0.7
0.5
3.5
2.8
14.0
7.1
13.7
3.8
1.5
1.1
1.0
0.4
0.6
0.6
2.2
14
4.4
6.3
8.7
151
0.91
Squid
5.9
36-40
65.5
69.4
1.7
Anchovy
31-35
79.2
11.3
13.1
Benthic
organisms
26-30
1.7
88.2
2.4
Sand lance
4.3
10319
62.18
14
0.08
14.1
266
1.60
494
2.98
7.8
21.7
52
0.30
1001
6.08
Silver hake
2.8
0.8
Other fishes
6.7
1.2
1.7
6.3
6.0
3.9
7.6
6.9
9.5
8.1
24.0
10.5
45.1
54.7
65.3
1521
9.18
Summary
percentage
of fishes
9.5
14.3
3.4
13.8
13.2
5.9
16.6
12.9
26.1
41.7
17.3
56.6
68.8
95.7
17.3
3219
19.39
Food
remnants
11.2
11.3
13.1
10.6
10.2
8.1
5.9
8.3
9.1
6.6
6.2
6.0
17.2
4.4
6.2
Number of
stomachs
with food
36
106
84
58
1229
1317
17
3078
4205
3844
1408
917
29
182
64
1318
7.94
23
16597
V IN OGRADOV FOOD HABITS OF SILVER AND RED HAKE
45
obtained (Table 2). Immature silver hake were not larger
than 28 cm and had fed mainly on euphausiids (70-90%
by frequency of occurrence).
with Meganyctiphanes norvegica and Thysanassa
inermis, the main food item (Table 2).
b) by size groups and sex of silver hake
Mature specimens had fed on almost all groups of
food items. However, the bulk of their food was
euphausiids whose occurrence increased with size of
The data were analyzed according to size-groups
for silver hake. A clear picture of the qualitative changes
in the food composition with size of silver hake was
TABLE 3. Percentage occurrence of food groups in the stomachs of silver hake, by months in ICNAF Divisions 4W, 5Z, and in
Statistical Subarea 6 in 1965-67.
Food groups
Jan
Feb
Mar
April
June
July
Aug
Sept
Oct
Nov
0.3
77.8
8.0
0.1
67.0
10.7
-
68.1
45.4
27.3
-
92.1
78.8
12.0
57.0
31.0
-
3.2
19.5
0.1
0.2
7.0
3.3
-
1.0
May
Dec
Division 4W
Copepods
Euphausiids
Amphipods
Shrimp
Benthic
organisms
Anchovy
Squid
Herring
Sand lance
Silver hake
Unidentified
fishes
-
-
-
-
-
52.0
-
0.7
-
-
2.0
2.3
-
-
10.7
1.0
-
25.8
-
_
-
46.0
11.2
15.3
4.9
11.0
0.8
28.7
66.8
35.6
22.5
42.0
31,6
9.5
4.7
1.7
-
66.2
4.5
12.0
67.1
66.2
17.3
6.2
33.8
0.9
0.2
47.6
0.2
1.8
56.4
0.5
2.8
2.7
13.2
50.8
47.5
29.9
Division 5Z
Copepods
Euphausiids
Amphipods
Shrimp
Benthic
organisms
Anchovy
Squid
Herring
Sand lance
Silver hake
Unidentified
fishes
60.0
-
40.0
10.4
79.7
0.5
9.4
5.7
81.7
2.9
4.8
60.3
11.8
0.3
1.3
0.3
0.4
2.8
1.8
0.3
0.9
0.3
1.6
8.4
19.3
33.9
9.2
15.3
26.7
Statistical Subarea 6
Copepods
Euphausiids
Amphipods
Shrimp
Benthic
organisms
Anchovy
Squid
Herring
Sand lance
Silver hake
Unidentified
fishes
24.7
1.4
2.5
13.5
78.7
77.5
0.8
77.4
0.6
-
0.5
2.9
3.9
0.5
5.0
11.5
0.3
100.0
81.8
0.6
16.6
18.2
10.8
76.4
0.3
6.7
8.3
0.3
8.9
1.0
1.0
58.9
13.2
4.0
45.5
22.2
-
11.5
15.3
-
43.3
46
ICNAF RESEARCH BULLETIN NUMBER 9, 1972
silver hake, up to a length of 35 cm. At this size the
silver hake had fed intensively on fishes. The smaller
size-groups at the beginning fed on lantern fish, young
fish and then changed to mature fish of various species.
The occurrence of euphausiids in the stomachs of the
older silver hake decreased sharply, while the other food
groups disappeared entirely and were substituted by
shrimps and squids.
The main food of silver hake larger than 40 cm
was fishes. Judging from their frequency of occurrence
in silver hake males of increasing length, euphausiids
were the most common in silver hake stomachs, then
fishes and squids. Percentage of occurrence of fish food
items in the stomachs of males of all size-groups
remained constant, while that of euphausiids varied from
59.5 to 69.4%. Of the fishes, the silver hake males fed on
anchovy and young fish, including young hake. Euphausiids and fishes, being the main food-groups, were
always present in the silver hake ration.
In the feeding of the silver hake female, four
food-groups were well represented: euphausiids, fish,
shrimp, and squid. Proportion of fish and squid in
stomachs of females increased with length of the silver
hake, while the frequency of occurrence of euphausiids
and shrimp decreased. Silver hake females of maximum
size fed exclusively on fishes.
c) by areas and seasons
Analysis of silver hake feeding by area and season
shows considerable change in the qualitative composition of food items. Two food-groups, euphausiids and
fish, are present in all the areas and seasons (Table 3).
Silver hake feed most intensively in the springsummer and autumn periods. Reduction in the feeding
rate on Georges Bank in summer is associated with
spawning. In late summer and in autumn another rise in
feeding rate is observed. In winter the feeding rate drops
in all areas, except in the Hudson Canyon area where
silver hake feed intensively even in winter. This fact was
also noted by Rikhter (1968).
As stated above, the basic food of silver hake in all
areas under study are fishes and euphausiids. No
significant differences were observed in the feeding on
fish and euphausiids, except on the Scotian Shelf where
euphausiids were the highly dominant food item.
Differences in feeding throughout a year are due to
variations from area to area in the species composition
of the fish food and the rate of feeding. On the Scotian
Shelf the maximum feeding intensity occurs in the
spring months on sand lance, argentine, lantern fish and
young silver hake. On Georges Bank the maximum rate
of feeding occurs in the autumn months on herring,
mackerel, young silver hake and lantern fish. It is
possible that the difference in frequency of occurrence
of the food-groups in stomachs from all areas is
determined by the availability of the various food-groups
and by their density spatially and seasonally. However,
euphausiids and fishes are the most available and thus
the main food items for silver hake.
Food of red hake
by species composition of the red hake food
Table 4 shows that a total of 56 species of
invertebrates and fishes were found in the red hake
stomachs. There were 19 species of fishes, 18 crustaceans, 9 molluscs, and 8 echinoderms species.
Only 8 invertebrates and 8 fishes were typically
pelagic and bathypelagic. The other 40 species (71.4%)
were benthic or closely related to the bottom. Invertebrates were dominant in the feeding by number of
species (36, 64.2%). Of the 56 species, 27 were found
often or very often in red hake stomachs, while the rest
were rare. The most common food fishes were Atlantic
herring, silver hake, yellowtail flounder, butterfish,
mailed sculpin, and haddock which constitute 16% of
the total.
The main food of red hake were two species,
Themisto compressa and Gammaridea (Talorchestia)
longicornis, of Amphipoda (frequency of occurrence,
42%). Less common are squid (6.1%), shrimp (6.0%),
and decapods, euphausiids, molluscs, polychaetes, and
echinoderms.
by size-groups and sex of red hake
Young immature red hake below 25 cm in length
fed mostly on amphipod crustaceans (Table 5). Hake
from 26 to 40 cm fed on all the listed food-groups. The
main food-group was amphipods, followed by the fishes,
squids, shrimp, and other decapods. With increasing
length red hake, similar to silver hake, tends to become
ichtyophagos and the largest size-group (51-55 cm) had
fed on three food-groups: fish (57.2% in frequency of
occurrence), squid, and amphipods. Analysis of feeding
by size-groups indicates that there were no great
differences in the qualitative composition of food,
except that smaller hake fed on smaller organisms and
larger hake on larger organisms.
For male and female fish in the same size-group,
amphipods and shrimp were dominant in the male
stomachs, while squid and decapods were dominant in
female stomachs.
c) by areas and seasons
The intensity of feeding throughout the whole
area of distribution increased in spring during prespawning and post-spawning periods. It reached a peak
VINOGRADOV: FOOD HABITS OF SILVER AND RED HAKE
47
TABLE 4. List of food organisms found in the stomachs of red hake (+ very seldom, ++ seldom, ++ often, I I I I very often).
Phacophyta
1
Incas sp.
-HF
-I-H-F
Thoracica
3. Lepas hilli Leach
4. Balanus eburneus Gould
-1-1-I-F
-HF
Gastropoda
Polychaeta
2. Aphrodite aculeata Linnaeus
Pecten islandicus (Muller)
Placopecten magellanicus (Gmelin)
25. Mytilus edulis Linnaeus
26. Corithiopsis sp.
27. Nassa sp.
-FP
Cephalopoda
-H1 1 1 1
28. Bier illecebrosus Lesueur
29. Loligo pealii Lesueur
1-1-F
-1-H1
Amphipoda
5. Them isto compressa Goes
6. Them isto lihellula Mandt
7. Gammaridea (Talorchestia) longicornis (Say)
1111
+++
1 1 1 1
Euphausiacea
Meganyctiphanes norvegica (M. Sara)
Thysanoessa raschii (NI. Sars)
10. Thysanoessa longicaudata (KrOyer)
1 1 1 1
-HHF
Natantia
+4*HP
1111
1 1 1 1
-1-1-
Stomatopoda
20. Squilla empusa Say
-HP
Pelecypoda
21. Nucula tenuisulcata (Couthouy)
22. Nucula proximo (Say)
Ophiuroidea
-I-H-HE
37. Echinarachius parma (Lamarck)
1111
Pisces
Anomura
15. Pagunss acadianus (Benedict)
16. Pagurus longicarpus Say
17. Cancer irroratus Say
18. Cancer borealis Stimpson
19. Panopeus (?)
-H-HE
-HF
-HHF
Echinoidea
IIII
*HE
Reptantia
13. Homarus americanus Milne-Edwards
14. Panulirus argils (Latreille)
30. Ctenodiscus crispatus (Retzius)
Pentagonaster granularis (0.F. Muller)
Henricia sanguinolanta (0.F. Muller)
33. Leptasterias groenlandica (Lutken)
34. Gorgonocephalus arcticus Leach
Amphiura denticulata Koehler
Ophiura robustra Ayres
Decapoda
Pandalus montagui Leach
Pandalus borealis Kntiyer
Asteroidea
-H-F
-H-F
38. Myxine glutinosa Linnaeus
Clupea harengus harengus Linnaeus
Alosa pseudoharengus (Wilson)
Brevoortia tyrannus (Latrobe)
Merluccius bilinearis Machin
43. Lepophidium cervinum Goode and Bean
44. Limanda ferruginea (Storer)
45. Pseudopleuronectes americanus (Walbaum)
46. Scomber scombrus Linnaeus
Paprilus (Poronetus) triacantlus (Peck)
Triglops ommatistius Gilbert
Myoxocephalus scorpius Linnaeus
Aspidophoroides monopterygius (Bloch)
Cyclopterus lumpus Linnaeus
Prionotus carolinus (Linnaeus)
Tautogolabrus adspersus (Walbaum)
Tautoga onitis (Linnaeus)
55. Ammodytes americanus De Kay
56. Melanogrammus aeglefinus (Linnaeus)
1 1 1
-11+
IIII
*HI+
-H1 1 1 1
-HP
-H-HE
111
48
ICNAF RESEARCH BULLETIN NUMBER 9, 1972
TABLE 5. Percentage occurrence of food items in the stomachs of red hake, by size-groups in ICNAF Subarea 5 and
Statistical Subarea 6, in 1956-67. Figures in the numerator are for females, in the denominator for males.
Length groups (cm)
Food groups
26-30
31-35
36-40
41-45
1.4
4.5
4.1
4.2
2.8
5.4
3.4
5.0
-
62.5
69.1
45.0
43.9
38.6
44.5
37.1
41.9
27.3
35.8
40.5
50.0
6.2
5.6
10.0
3.7
6.6
6.0
5.4
6.9
4.4
2.1
50.0
119
5.90
2.0
0.4
2.2
1.0
0.6
0.8
2.1
22
1.10
4.0
4.0
3.9
3.5
7.7
6.9
7.6
7.1
2J
98
0.5
2.0
1.7
1.2
1.2
0.8
6.3
8.5
0.5
1.4
1.0
1.8
3.3
6.2
2.8
7.0
3.7
5.8
4.7
5.9
3.4
14.6
7.1
12.8
14.3
123
16.10
Summary
percentage
of fishes
10.4
4.2
12.0
11.0
15.6
14.6
23.0
14.6
27.9
28.6
21.3
57.2
329
16.30
Food remnants
10.4
14.1
14.5
27.2
20.0
20.7
11.9
18.0
6.9
14.3
10.6
Number of
stomachs
with food
500
71
207
246
360
398
335
118
158
14
47
2
Euphausiids
Amphipods
Shrimp
Polychaetes
Decapods
4.3
2.8
Molluscs
Other benthic
organisms
Squid
by mid-autumn (October) and decreased sharply in
winter.
In June, the food of red hake from the northwest
slopes of Georges Bank consisted almost entirely of all
the listed food-groups, except for euphausiids (Table 6).
Feeding rate was 2.3. Late in autumn (November) the
consumption of amphipods increased sharply, while in
winter the variety of food-groups increased, but the
average amount of food in the stomach declined sharply.
In autumn, the feeding rate reached 3.5, while in winter
it was reduced to almost zero.
46-50
51-55
Total
numbers (ie)
21-25
76
3.80
28.5
837
41.85
4.90
36
1.80
20
0.95
346
17.30
7
2013
On the southern slopes of Georges Bank, the main
food of red hake in spring and summer was amphipods,
fishes, squid, and decapods (mainly Cancer and Pagurus)
(Table 6).
In the same period on Nantucket Shoals and on
the slopes of the Shelf, red hake fed on the same
organisms as they do on the slopes of Georges Bank.
However, in autumn crabs, brittlestars, and euphausiids
were the main food. In winter, the variety of food items
increased, while the feeding rate declined. In the Hudson
Canyon area, the feeding rate is also low, the variety of
49
VINOGRADOV: FOOD HABITS OF SILVER AND RED HAKE
TABLE 6. Percentage occurrence of food grou p s in red hake stomachs by months in ICNAF Subarea 5 and Statistical Subarea 6 in
1965-67.
Food groups
Jan
Feb
Mar
April
June
May
July
Aug
Sept
Oct
Nov
Dec
1.7
53.7
6.6
3.4
0.6
6.4
4.7
80.9
6.5
1.9
0.3
4.7
-
4.5
2.3
20.8
1.0
Subdivision 5Ze1
Euphausiids
Amphipods
Shrimp
Decapods
Polychaetes
Molluscs
Benthic
organisms
Squid
Fishes
-
-
-
-
-
-
-
-
-
-
-
-
-
-
33.2
38.4
1.0
-
-
-
-
-
9.3
18.1
-
-
-
-
-
71.6
12.6
-
Subdivision 5Ze2
Euphausiids
Amphipods
Shrimp
Decapods
Polychaetes
-
-
Molluscs
Benthic
organisms
Squid
Fishes
47.1
2.4
6.2
1.2
-
-
4.8
38.3
-
4.8
0.7
30.0
1.9
-
27.4
26.4
5.5
0.2
15.7
28.1
0.9
5.7
61.5
1.9
11.3
27.5
22.0
28.5
-
-
-
15.8
-
-
-
-
-
57.4
Ll
4.6
4.6
2.3
13.5
26.5
-
Subdivision 5Zw
Euphausiids
Amphipods
Shrimp
Decapods
Polychaetes
-
Molluscs
-
Benthic
organisms
Squid
Fishes
-
-
-
-
-
50.0
-
-
-
-
-
-
-
-
50.0
5.2
44.0
4.1
6.8
-
-
30.0
-
-
0.5
13.2
26.2
-
-
-
-
-
-
-
-
-
50.8
-
19.2
6.5
64.7
1.8
4.7
5.6
2.8
6.5
7.4
Statistical Subarea 6
Euphausiids
Amphipods
Shrimp
Decapods
Polychaetes
Molluscs
Benthic
organisms
Squid
Fishes
31.0
38.4
10.2
7.3
5.8
72.8
-
21.3
49.2
13.3
24.7
3.6
-
1.7
-
30.0
7.3
7.3
27.2
1.7
5.3
7.5
2.3
32.1
-
-
-
_
-
-
-
-
-
-
-
-
-
50
ICNAF RESEARCH BULLETIN NUMBER 9, 1972
food items is high, with benthic organisms (polychaetes,
molluscs, and brittlestars) constituting a significant
percentage.
The feeding rate in silver hake reached its
maximum in the spring, decreased in the summer
due to the spawning to a minimum in winter.
Comparison of feeding of silver hake and red hake
Immature red hake fed on amphipods. At maturity
the proportion of bottom crustaceans, henthos
and fish in its ration increased.
Coefficients of food similarity (CIS) between
silver hake and red hake were found to be as low as 13.1
in ICNAF Subdivision 5Ze 1 , through 28.3 for SZe2,
23.3 for 5Zw, to 30.1 for ICNAF Statistical Division 6A,
suggesting that competition for food is not a serious
limiting factor in the production of silver and red hake
stocks.
The main food of silver and red hake in the
summer-autumn period on Georges Bank was fish,
shrimp, and euphausiids. In the winter-spring period on
Nantucket Sound in the Hudson Canyon area, in
addition to the above-mentioned food organisms, squid,
fish, and amphipods were common in the stomachs of
both species. Since, in winter both species have
decreased their feeding rate and increased their variety
of food items, the chances for competition for food arc
very small. From April the food spectrum of red hake
and, particularly, of silver hake narrows considerably
but, by that time, a feeding migration of both species
has already begun.
6.
The feeding patterns of silver and red hake overlap
insignificantly and the chance of food competition
between them in most of the area is very small.
References
BIGELOW, H. B., and W. C. SCHROEDER. 1953. Fishes of the
Gulf of Maine. Fish. Bull., U.S., Vol. 53, No. 74,
Washington.
GOODE, G. B. 1884 1 . The silver hake and the merluccio. In:
The fisheries and fishery industries of the United States.
Section I Natural history of useful aquatic animals. U.S.
Comm. Fish and Fisheries. Gov't. Printing Office, Washington 240-243.
JENSEN, A. C., and R. L. FRITZ. 1960. 1 Observations on the
stomach contents of the silver hake. Trans. Amer. Fish.
Soc., 89(2): 239-240.
MUSICK, J. A. 1969 1 . The comparative biology of two
American Atlantic hakes, Urophycis chuss and U. tennis
(Pisces, Gadidae). Ph.D. thesis, Harvard University, Cambridge, Mass.
NICOLS, J. T., and C. M. BREDER, Jr. 1927 1 . The marine
fishes of New York and southern New England. Zoologica,
9: 163-164.
RIKHTER, V. A.
Summary
Euphausiids and fish were the main food for silver
hake.
Immature silver hake fed mostly on euphausiids,
and with increased size, change gradually from a
crustacean diet to fish. The feeding pattern of
older silver hake was nectophagos.
Silver hake males of 35 cm length were abundant,
of 36-40 cm few and above 40 cm in length were
absent in the catches. The pattern of feeding in
males and females of these size-groups was
virtually the same. Females above 40 cm in length
were exclusively ichtyophagos.
1968. Some features in behaviour and
distribution of silver hake from the West Atlantic in spring.
Ryb. Khoz., No. 11, Moscow.
SAUSKAN, V. I. 1966. Biological basis of the fishery for silver
hake (Merluccius bilinearis, Mitchell) and taxonomy of the
Atlantic species, Genus Merluccius. Thesis for Master's
Degree, Kaliningrad.
SCHAEFER, R. R. 1960. A study of the growth and feeding
habits of the whiting or silver hake, Merluccius bilinearis
(Mitchell) of the New York Bight. N.Y. Fish Game J., Vol.
7, No. 2.
YANIlLOV, K. P. 1963. Pattern of feeding of redfish (Sebastes
mentella Travin) in Newfoundland and Labrador waters.
Vop. Mhtiot, Vol.3, iss. 4(29), Moscow, Also Annu. Meet.
int. Comm. Northw. Atlant. Fish. 1961. Res. Doc. No. 62,
Serial No. 1005.
1 References not read by the author.
The Fishery on the Southern Gulf of St. Lawrence
Cod Stock, 1960-70
By R. G. Halliday
Abstract
Landings from the southern Gulf of St. Lawrence cod stock declined from 110,000 tons in 1956 to 41,000 tons in
1967, then rose to 64,000 tons by 1970. In 1960-70, numbers landed varied between 26 million and 49 million fish. They
had an average length of 5256 cm and most were between 40 cm and 70 cm. Modal age was normally age 5 or age 6.
Substantial changes in growth rate resulted in decreasing mean length at age from 1960 to 1963 and increasing mean length
at age from 1965 to 1969, which resulted in recruitment at a younger age in more recent years. Catch-per-unit-effort of
otter trawlers declined from 1962 to 1966 and increased from 1966 to 1970. Variations in population number and biomass
estimated from cohort analysis agreed well with those of catch-per-unit-effort. Fishing mortality varied among years and
age-groups due to substantial changes in the intensity and nature of the fishery, averaging F = 0.43 for fully recruited
age-groups in 1960-68. The mortality rate of those age-groups in which the mortality is generated mainly by trawl and line
gear, ages 7-10, was correlated with the fishing effort of those gears.
Introduction
The southern Gulf of St. Lawrence cod population
is migratory, spending the summer months in the
Magdalen Shallows region (ICNAF Division 4T) and
migrating to overwinter in deep water off Cape Breton
Island (ICNAF Subdivision 4Vn and southeastern
Division 4T) (Martin and Jean, 1964; McCracken, 1959;
McKenzie, 1956).
In the 1940's, landings ranged from 30,000 to
50,000 metric tons when this stock was fished solely by
Canada, mainly by hand-line and long-line gear. In the
early 1950's, because both Canadian and foreign otter
trawlers entered the fishery, landings increased rapidly,
reaching 110,000 metric tons in 1956. Landings subsequently declined to about 60,000 metric tons in 1965
because of a decrease in foreign otter trawl and Canadian
line landings.
The dymanics of this stock during the 1949-65
period were studied by Paloheimo and Kohler (1968).
They described major changes in size and age composition
of the population, growth, and recruitment during this
period. However, they were unable to derive a satisfactory relationship between mortality and fishing
effort, concluding that year-to-year variations in the
catchability coefficient, q, or in natural mortality rate,
M, were greater than variations in total mortality rate, Z,
due to changes in fishing effort. The present paper
describes events in the fishery during the 1960-70 period
and, by using different methods of analysis from
Paloheimo and Kohler, describes a correlation between
fishing effort and mortality for some age-groups in the
fishery.
Landings
Landings from the southern Gulf of St. Lawrence
cod stock were obtained from ICNAF Statistical
Bulletins for the years 1960-69, and from unpublished
landings statistics on file at ICNAF Headquarters for
1970. Division 4T landings for the whole year and those
from Subdivision 4Vn for the months January to April
inclusive were referred to this stock.
Landings in the years 1960 through 1962 averaged
66,000 metric tons. In 1963 they increased to 70,000
tons, but declined to 41,000 tons by 1967. Slight
increases occurred in 1968 and 1969 and a substantial
increase occurred in 1970 when 64,000 metric tons were
landed (Table 1). Canada's share increased from 61% of
landings in 1960 to 96% in 1969, falling to 73% in 1970.
The remainder was accounted for by French, Spanish
and, to a lesser extent, by Portuguse landings.
Annual landings by trawlers comprised from 57%
to 77% of the total and those of sciners from 1% to 5%
(Table 2). Long-line and hand-line landings declined in
'Fisheries Research Board of Canada, Biological Station, St. Andrews, New Brunswick.
52
ICNAF RESEARCH BULLETIN NUMBER 9, 1972
TABLE 1. Division 4T and Subdivision 4Vn Cod. Landings (metric tons round) by Country and Division, 1960-70. (Subdivision
4Vn January-April landings only.)
Year
Canada (M)
Canada (N)
Spain
Portugal
France (M)
Others
Total
4T
4Vn
1960
1961
1962
1963
1964
1965
1966
1967
1968
1969
1970a
40,451
41,836
50,331
50,902
43,792
47,124
42,852
34,713
39,721
41,154
43,814
3
617
1,243
2,761
6,201
9,217
4,813
1,071
3,960
4,612
3,531
8,526
7,883
6,941
11,814
8,583
2,962
2,185
3,281
2,317
1,060
11,666
3,927
1,974
2,700
4,496
13,276
13,272
5,213
228
1,356
240
1
236
1
615
1,200
1,057
285
398
53
7
66,423
65,583
66,664
70,202
43,022
51,750
53,218
50,715
41,618
46,471
38,248
34,245
37,910
40,905
43,408
23,401
13,833
13,446
19,487
18,929
16,556
16,603
7,069
8,641
6,607
21,048
1,392
138
85
25
307
2,474
1,132
3,806
1,879
130
326
2,964
60,547
63,027
54,851
41,314
46,551
47,512
64,456
aPreliminary statistics.
TABLE 2. Division 4T and Subdivision 4Vn Cod. Landings (metric tons round) by gear, 1960-70. (Percentage of annual landings in
parentheses.)
Otter and pair
trawls
Year
1960
1961
1962
1963
1964
1965
1966
1967
1968
1969
1970a
41,019 (62)
42,808 (65)
43,526 (65)
50,862 (72)
45,325 (75)
48,373 (77)
36,684 (67)
23,982 (58)
28,217 (61)
27,075 (57)
43,009 (67)
Danish and Scottish
seines
229 (<1)
716 (1)
1,475 (2)
1,621 (2)
1,985 (3)
2,673 (4)
2,391 (4)
2,212 (5)
982 (2)
1,204 (3)
1,721 (3)
Long- and handlines
25,171 (38)
21,888 (33)
20,517 (31)
15,323 (22)
10,237 (17)
8,410 (13)
6,362 (12)
5,178 (13)
4,419 (9)
9,655 (20)
9,937 (15)
Gillnet
4 (<1)
171 (<1)
1,146 (2)
2,396 (3)
3,000 (5)
3,571 (6)
9,414 (17)
9,942 (24)
12,933 (28)
9,578 (20)
9,789 (15)
Total
66,423
65,583
66,664
70,202
60,547
63,027
54,851
41,314
46,551
47,512
64,456
aPreliminary statistics
importance from 1960 to 1968 (38% to 9% of total) but
increased in 1969-70. Gillnet landings increased from
1960 to 1968 (< 1% to 28% of total) but declined in
1969-70. All gillnet, line, and seine landings were made
by Canada.
Length and Age Composition of Landings
and Numbers Landed
Methods
The difficulties encountered by Paloheimo and
Kohler (1968) in deriving meaningful mortality
estimates for this stock demonstrate the necessity of
taking the seasonal nature of the fishery and the
different gears employed into account in determining
the size and age composition of removals. In the present
study six categories of landings were considered: otter
trawl landings in the periods January-April, May-August,
and September-December, seine, line, and gillnet
landings. Biological sampling for length and age composition of landings in these categories in the 1960-70
period was good only for the Magdalen Shallows
"summer" (May-December) trawl fishery (Table 3). It
was considered more appropriate to treat the winter
Cape Breton fishery separately despite poor sampling
coverage by all countries. Danish and Scottish seine
landings were treated separately when samples were
53
HALLIDAY: THE SOUTHERN GULF OF ST. LAWRENCE COD STOCK
TABLE 3. Div lsi,m 4T and Subdivision 4An Cod. Commercial samples, 960-70.
Alay . Aug. trawl
Ian.-,Apr. trawl
Country
No. of
samples
No.
measured
No
aged
No. of
samples
No.
measured
Seine
Sept..Dee. trawl
No.
aged
No. of
No.
samples measured
No.
aged
No. of
samples
Line
No.
measured
No.
aged
No.
No. of
samples measured
No.
aged
No. of
samples
No.
measured
14
453:1
477
12
2428
No.
aged
217
1
589
-
184
5
1554
69
4
368
-
6
1023
-
1065
-
2
448
-
2
554.
1
58
1960
Portugal
Spain
Canada
0
21
Portugal
I r.ice (NI)
Canada
4
10
1284
9848
124
5490a
856a
1961
550
511
III
8125
819
5
1475
104
1962
Canada
2
850
123
15
7051
640
7
2062
Canada
3
1326
199
22
81132
553
II
4999
Spain
Canada
5
8
1233
2638
124
23
8886
614
6
2630
Canada
8
2678
163
21
7787
645
13
4840
Canada
7
2424
281
17
5006
457
13
3220
Canada
2
806
106
17
3544
492
III
4379
Canada
2
661
128
19
4467
781
9
1848
Canada
4
1208
204
7
1399
287
7
1834
Canada
2
596
102
5
1274
206
4
730
209
932
185
7
2592
735
87
5
1103
1963
190
2
1964
71
1275
-
545
-
1965
228
2
7:13
70
3
1966
437
1967
572
I
345
27
I
195
-
1968
467
1969
303
717
98
1704
305
28
1970
148
8
4 May.Deeember inclusive
available and combined with otter-trawl landings when
there were no seine samples. While seine landings
differed slightly from trawl caught fish, being smaller
and younger (Fig. 1), they formed such a small part of
the total that the error introduced by combining seine
with trawl landings is small. However, gillnet and line
landings could not be combined with trawl landings
when sampling was inadequate, as length and age
composition of landings by these gears differed
markedly from those of trawl caught fish and from each
other (Fig. 1). When there were no length frequency
samples from line or gillnet landings in a particular year,
those of the preceding and subsequent years were
combined (and some 1971 samples were applied in this
way to the immediately preceding years). When age
samples were inadequate or missing for a landings
category, the most appropriate ages from within the
same year were applied to the length-frequency.
54
ICNAF RESEARCH BULLETIN NUMBER 9, 1972
Trawl vs Seine May - Aug 1970
40
- Trawl
30
20
10
- Seine
0
I1t.
Trawl vs Line
g 20
E
May - Dec 1961
40 -
is
-Trawl
30
0
20
-Line
10
tab FL..
0
Trawl vs Gillnet May Dec 1965
20
l5
40- Trawl
30
Trawl
II
10
- Gillnet
20
Gilinjet,
-1
•
•
10
0
37 49 61 73 85 97 109 121 136
Length (cm)
n
2 4
11■
6 8 10 12 14 16
Age ( Years)
Fig. 1. Comparisons of length and age compositions of cod landings by gear, Div. 4T and
Subdivision 4Vn.
HALLIDAY: THE SOUTHERN GULF OF ST. LAWRENCE COD STOCK
In the Canadian fishery, cod landings were
frequently separated by size into "scrod", "market",
and "large" grades, and each grade was sampled. It was
assumed that the proportion of these grades in the
landings of the vessels sampled was representative of the
whole fleet, and the length and age compositions of each
grade were weighted in this proportion.
In contrast to Canadian samples which were of
landings after discard, non-Canadian samples were of
catches before discard. However, as discards were
apparently negligible by non-Canadians (see below) this
should not greatly affect the results.
Spain, Portugal, and Canada conform to the
ICNAF convention of measuring fork length to the
nearest centimeter. However, French samples in 1961
were probably total length to the centimeter below. In
cod, fork and total length are virtually equivalent. Thus,
the length-frequency of French catches in 1961 is
55
displaced 0.5 cm toward zero in comparison with those
of other countries. As this could not be readily
corrected, these samples were used as they stood in the
belief that the increased information they provided
outweighed the slight error introduced.
Numbers of cod landed at age by each of the six
gear-season categories in each year were calculated from
the length and age compositions, and quantities landed
by each category, using appropriate length-weight
relationships. These were summed to give total numbers
landed at age.
Results
Annual mean lengths of total landings ranged from
52.0 to 56.3 cm (Table 4), 85-95% of the fish being in
the range 40-70 cm. Modal length of landings was 46 cm
or 49 cm in all years except 1960 (Fig. 2).
TABLE 4. Division 4T and Subdivision 4Vn Cod. Mean age, length (cm), and weight (kg) of landings.
Trawl
Jan-Apr.
Gillnet
All gears
Sept.-Dec.
May-Dec.
May-Dec.
May-Dec.
January-December
Mean Mean
length age
Mean Mean
length age
Mean Mean
length age
Mean Mean Mean
length age weight
62.5
63.3
57.7
61.5
69.6
67.6
67.6
67.6
67.5
67.5
67.5
77.7
67.9
65.0
80.6
86.2
92.1
69.0
72.0
82.0
75.9
56.3
53.7
53.2
52.8
52.8
52.0
53.2
54.3
53.8
54.2
54.4
Mean Mean
length age
Mean Mean
length age
Mean Mean
length age
1960
1961
1962
1963
1964
1965
1966
1967
1968
1969
1970
53.7
50.1
53.9
51.5
49.5
49.9
50.1
5L5
53.1
47.9
51.8
54.9a
53.6
51.2
51.3
53.0
52.3
53.2
51.4
48.1
53.7
50.6
52.9
50.6
50.4
50.9
49.4
50.1
49.5
50.1
51.9
54.1
aMay-December inclusive.
Line
May-Aug.
Year
6.0
5.9
6.8
6.9
7.1
7.3
5.9
6.1
6.2
5.5
5.9
Seine
6.0a
6.1
6.1
6.6
6.9
6.7
6.3
5.5
5.1
5.6
5.6
5.9
5.6
5.9
6.3
5.6
4.8
4.7
4.8
5.2
5.6
49.4
48.0
5.9
5.8
47.8
6.1
51.9
49.7
5.0
4.9
6.9
7.3
6.6
7.5
8.4
8.5
8.0
7.7
7.7
7.4
7.4
9.3
7.5
7.9
9.4
10.3
10.8
7.9
8.4
8.5
8.4
6.2
6.2
6.3
6.7
7.0
6.9
6.1
6.0
5.9
5.8
6.1
1.73
1.58
1.44
1.44
1.48
1.42
1.57
1.61
1.62
1.65
1.61
56
ICNAF RESEARCH BULLETIN NUMBER 9, 1972
25
49
73
97
121
25
Fork Length
49
73
97
121
(cm)
Fig. 2. Length composition of cod landings, 1960-70, Div. 4T and
Subdivision 4Vn.
HALLIDAY: THE SOUTHERN GULF OF ST. LAWRENCE COD STOCK
Mean ages of landings ranged from 5.8 to 7.0
years. Modal age-group was normally age 5 or age 6, but
on occasion age 4 or age 7 was the most abundant in
landings (Fig. 3).
8
_1965
56
84
4 - '56
0
: a II I I
0
1966
'56
1961
12
4
8-
-
0
1111111 5161 a_
1967
44-
0
'6: 111i . ■586.
1962
16
8
O 12
4-
08
0
4
_
'64
1968
I I 1 1 1 . a6.
'64
1969
12
0
16
'56
Number landed increased from 38 million fish in
1960 to 49 million in 1963, declined to 26 million in
1967, then rose again to 40 million in 1970 (Table 5).
Discards
1960
12
57
8
1963
12
4
8
0
Information on discards of small cod at sea in the
1960-70 period is missing or incomplete for all sectors of
the fishery. It can reasonably be assumed for all gillnet
and line catches that discards were essentially zero.
Reported discards in the Subdivision 4Vn trawl fishery
by Spain, France, and Portugal were low (frequently
0-2%) (e.g. ICNAF, 1968-70). Canadian discards from
Subdivision 4Vn must also have been low as landings
from this fishery normally contained small ungraded and
ungutted cod. As these sizes were apparently acceptable
to the processor it is unlikely that large numbers were
discarded. Canadian discard data for Subdivision 4Vn, as
submitted to ICNAF, do not give an accurate measure of
discard rates due to substantial biases in collection
methods. This is also true of Canadian Div. 4T data
subsequent to 1964. However, in the 1960-64 period
fairly accurate measures of discards were obtained for
the Div. 4T otter-trawl fishery by intensive sea and shore
sampling of commercial catches and landings (Paloheimo
and Kohler, 1968). Discards declined from 10.5% by
numbers in 1960 to 1.6% in 1964. There is no reason to
believe that discards subsequently increased much above
that low value.
Estimated total discards from the Div. 4T ottertrawl fishery declined from almost one million fish in
1960 to 325,000 in 1964. They were mainly fish of
35-45 cm length, and of 3 and 4 years old (Table 6).
Thus, as far as can be judged from inadequate
data, wastage due to discarding small fish at sea is not an
important factor in analysis of this fishery in the 1960's.
4
0
12
' 56
12
1964
8
8
4
4
0
1970
16
.11
2 4 6 8 10 12
14
2 4
16 0
Age, Years
'64
Growth
6
8
10 12 14 16
Fig. 3. Age composition of cod landings, 1960-70, Div. 4T and
Subdivision 4Vn.
Paloheimo and Kohler (1968) described substantial changes in growth rate in the 1949-65 period
with increasing mean length at age between 1950 and
1956, and subsequent decreasing mean length at age to
1965. Mean length at age then increased again until 1969
(Fig. 4). In the 1960-70 period, these changes in mean
length result from change in growth rate from a low level
in 1960-63 to a high level in 1963-69 (Table 7).
58
ICNAF RESEARCH BULLETIN NUMBER 9, 1972
TABLE 5. Division 4T and Subdivision 4Vn Cod. Numbers landed X 10 -3 per age-group, 1960-70.
1961
1962
1963
Year
1964
1965
1966
1967
1968
1969
1970
—
75
3967
8983
12515
7144
1736
795
1812
388
279
76
93
51
39
3304
13921
9475
8313
2661
777
506
741
385
188
174
33
130
22
16
1720
10887
18889
7870
4290
1480
589
153
178
37
26
36
2
255
2123
4352
16021
14742
6390
3108
984
392
137
102
37
50
35
100
970
6728
5863
12038
9261
3760
1133
347
149
103
88
24
56
464
5504
6148
9292
4481
8524
5534
1845
1004
423
150
52
124
49
— —
1498
700
7055
7068
10689
5503
4505
4586
3423
3040
1841
1735
2262
407
1890
1021
867
901
357
383
242
171
76
82
42
23
79
17
—
310
8140
8086
4674
2916
1276
753
434
899
698
259
139
65
43
—
327
4936
12530
357]
2516
2136
917
785
212
283
292
55
21
40
26
3395
14972
11925
4194
1905
1444
727
569
360
239
139
30
42
37953
40608
46195
48728
40620
43594
28692
28621
39967
Age
1960
2
3
4
5
6
7
8
9
10
11
12
13
14
15
161
Total
34826
25637
TABLE 6. Discards of cod from the Div. 4T otter-trawl fishery,
1960-64, as total numbers per age-group X 10-3.
Year
1960
1961
1962
1963
1964
1
7
2
3
4
12
44
4
11
2
212
115
223
122
200
620
323
292
277
98
Age
Abundance
Catch-per-unit-effort
5
6
7
Total
101
154
197
51
18
2
18
14
31
3
1
948
661
731
499
325
1
7
4
There is no available measure of gillnet,
or hand-line effort in the 1960-70 period, and the Danish
and Scottish seine fishery is probably too small and too
localized to accurately reflect abundance changes of the
entire cod stock. Among otter trawlers, the most
consistent data series is available for Gloucester class
vessels fishing from New Brunswick ports. These vessels
80
Age 9
70
,0
Ag
.....
.
■.■
o
.■ 6
...,.../.
o....
..
No
./
.......,,o
0,.../
N.\
o
.„o._ _ .0./
---0-'
.
/
0 ...............a
■0
0 4ge
50
0
4■■■■0■■■•■0
a
\\
t2 60
.
o
.
o
.„....,
,i,,o....„....
.-o •••
o
...
%-o
I/
I
I
I
1
I
1
I
I
I
I
I
1960
'61
'62
'63
'64
'65
'66
'67
'68
'69
'70
Fig. 4. Div. 4T and Subdivision 4Vn cod. Mean length at age of 6-9 year olds in May-August
otter-trawl samples, 1960-70.
L
59
HAI,LIDAY : THE SOUTHERN GULF OF ST. LAWRENCE COD STOCK
Year
Ages 6-7
Ages 7-8
Mean
1960-61
1961-62
1962-63
1963-64
1964-65
1965-66
1966-67
1967-68
1968-69
1969-70
4.41
5.90
2.54
8.54
8.26
9.96
14.18
7.98
14.94
4.92
5.15
5.04
3.86
9.22
5.74
9.70
7.00
9.37
14.41
6.78
4.78
5.47
3.20
8.88
7.00
9.83
10.59
8.68
14.68
5.85
fishery in the area. Comparable vessels of 26-50 gross
tons fishing from Quebec ports have maintained a high
level of effort in the summer fishery in recent years.
Fairly reliable catch-per-unit-effort (cpe) data are available for both groups of vessels for the 6 years 1962-65,
1967-68. Trends in cpe values were similar for both
series, the correlation coefficient being 0.71 (with a
probability, P = 0.12, of so high a value occurring by
chance). Over the 6-year period the ratio of Gloucester
class vessel cpe to that of Quebec 26-50 gross ton vessels
was 0.93. A composite cpe series was obtained by
adjusting Quebec values by 0.93, averaging these with
Gloucester values in the years when both were available,
using adjusted Quebec values alone for 1969-70, and
Gloucester values alone for other years (Fig. 5, Table 8).
of 26-50 gross tons entered the summer Magdalen
Shallows fishery in the late 1940's and the fleet
composition remained virtually unchanged until the
early 1960's, when vessels were progressively retired
from the fishery or diverted to the developing snow crab
Taking catch-per-effort as a measure of stock
abundance indicates that cod became more abundant
from 1960 to 1962, declined in abundance until 1966,
then increased again, reaching the highest value for the
period in 1970.
TABLE 7. Division 4T and Subdivision 4Vn Cod. Specific
loge L 2 - Inge L I
growth rate, g =
X 100
t 2 -q
=
16
-3
L" 14
"-a
-
\--Spanish,
I";
O
12
0
0
0
8
-0 AO/
C.,
/
/
10 -
CD
O
Div 4VN
•••
Gloucester, Div 4T
0
,..
0
2
o
•
•
O
•
//
/o
•
\
6
O/
'-
/
/
/
/
/
0.
OJ
Ni
‘0
V
-
co
I
0
0,
4 -
it.>
.7)
2
0
0
I
1960
'61
'62
'63
'64
'65
'66
'67
.68
I
'69
Fig. 5. Div. 4T and Subdivision 4Vn cod. Catch-per-unit-effort, 1960-70.
'70
0
60
ICNAF RESEARCH BULLETIN NUMBER 9, 1972
TABLE 8. Division 4T and Subdivision 4Vn Cod. Catch-perunit-effort, 1960-70 and "available biomass" calculated from cohort analysis.
Division 4T
Subdivision 4Vn
Metric tons/trip
Metric tons/hour
Year
Gloucester class
equivalents
Spanish otter
trawlers
1960
1961
1962
1963
1964
1965
1966
1967
1968
1969
1970
8.1
9.5
10.9
10.5
9.2
8.8
6.4
7.0
9.1
12.2
12.8
1.37
1.73
1.97
2.96
2.83
1.65
1.08
1.56
1.23
2.33
2.13
"Available
Biomass"
X 10 -3 m.t.
186
202
211
206
181
144
164
157
171
Although landings from the winter Cape Breton
fishery were moderately high between 1960 and 1970,
no country exploited the fishery in a consistent manner
throughout the period. Catch-per-effort data series for
different countries showed different trends indicating
that cod abundance was not the prime factor affecting
cpe in some series. Among national fleets, the cpe values
of Spanish otter trawlers, despite large fluctuations in
effort among years, were most similar to those of Div.
4T (Fig. 5, Table 8). The correlation coefficient of
Subdivision 4Vn Spanish values with Div. 4T values for
the following summer was 0.60, with values for the
previous summer it was 0.67, and with the mean of the
previous and following summer values it was 0.68. All
correlations were significant at the 5% level.
Cohort analysis
Population numbers by age-group in each year
were derived by Pope's cohort analysis technique (Pope,
1972) from numbers landed at each age (Table 5). An
assumed value of natural mortality (M) of 0.20 was used.
(Paloheimo and Kohler (1968) derived a value of M =
0.19 from 1949 to 1965 data.) For year-classes which
had passed through the fishery a starting value of fishing
mortality (F) of 0.50 was assumed. For year-classes still
contributing to the fishery starting F values were
obtained by averaging the calculated F values for fully
recruited year classes for that age-group. Biomass of the
proportion of the stock available to the fishery, called
here "available biomass", was calculated as the product
of population numbers at age and mean weight at age,
adjusting for partial recruitment (see below) of the
youngest age-groups.
Abundance of 3-14 year olds calculated in this
way declined from 433 million fish at the beginning of
1960 to 199 million at the beginning of 1966, then
increased to 313 million by 1968 (Table 9). "Available
biomass" increased from 186,000 tons in 1960 to
211,000 tons in 1962, declining to 144,000 tons in 1965
and then increasing to 171,000 tons in 1968 (Table 8).
TABLE 9. Division 4T and Subdivision 4Vn Cod. Population numbers (X 10 -3 ) by age-group, 1960-68, derived by Pope's Cohort
Analysis.
Age
1960
1961
1962
1963
3
4
5
6
7
8
9
10
11
12
13
14
134,963
143,111
70,667
47,602
19,983
6,224
2,751
4,460
1,330
880
468
152
48,907
110,431
113,580
49,729
27,649
9,896
3,525
1,533
2,012
738
468
314
61,785
40,042
87,424
80,395
32,141
15,115
5,694
2,183
797
977
256
213
45,084
50,571
31,227
61,726
48,730
19,194
8,493
3,323
1,254
514
639
176
Totals
3-14 incl.
432,591
368,782
327,022
270,931
Year
1964
1965
1966
1967
1968
64,983
36,681
39,483
21,629
36,040
26,557
9,933
4,141
1,830
672
297
431
51,924
53,113
29,154
26,238
12,403
18,614
13,363
4,730
2,365
1,184
416
150
63,405
42,092
38,505
18,306
13,074
6,100
7,527
5,933
2,203
1,028
587
205
119,469
50,556
28,078
21,853
10,911
7,607
3,353
4,116
3,147
1,019
519
262
131,256
97,180
34,996
18,009
13,742
6,182
4,658
2,376
2,446
1,761
488
270
242,677
213,654
198,965
250,890
313,364
61
HALLIDAY: THE SOUTHERN GULF OF ST. LAWRENCE COD STOCK
These data are in fairly good agreement with the
relative abundance by weight estimates provided by cpe
data (Table 8). "Available biomass" and Gloucester otter
trawler cpe values have a correlation coefficient r = 0.72
for the 1960-68 period which is statistically significant
(P = 0.05). The high population number in 1960 was
largely due to the good year-classes of 1955-57. As these
became more fully recruited to the fishery cpe increased,
but with declining mean weight at age and the
recruitment of the less strong 1958-63 year-classes cpe
declined after 1962. However, the trend of increasing
mean weight at age from 1965 followed by the entry of
strong 1964 and 1965 year-classes in 1967 and 1968, led
to an increase in cpe from 1966 through 1970.
TABLE 10. Number of cod caught per trip at age in Division 4T otter-trawl fishery, 1960-70.
9
10
11
12
13
14+
914
1388
1039
2454
1980
551
342
338
470
565
672
246
452
538
836
1254
1196
244
184
175
308
194
73
80
160
325
472
652
303
61
104
136
177
158
40
37
78
192
235
184
88
40
128
106
38
66
7
45
31
94
57
91
79
22
31
32
53
11
12
20
34
28
39
35
59
41
8
20
1
15
7
13
15
13
10
34
36
3
7
1
5
15
7
9
13
14
17
18
974
512
231
117
51
33
16
3
4
5
6
7
1960
19
41
33
148
374
269
156
85
-
746
605
473
594
315
1552
1399
2076
3733
1659
1764
1317
2279
2902
817
1474
1048
1327
1560
2528
4479
3545
1639
1647
3760
3178
824
1189
458
916
929
1224
3416
2116
1744
1961
1962
1963
1964
1965
1966
1967
1968
1969
1970
Mean
TABLE 11. Division 4T and Subdivision 4Vn Cod. Survival rates
from Division 4T otter trawl catch and effort data.
Mean
Ages
Age
8
Year
Z7-12
Year
7-8
8-9
9-10
(ages 7-10)
1960-61
1961-62
1962-63
1963-64
1964-65
1965-66
1966-67
1967-68
1968-69
1969-70
0.49
0.39
0.80
0.51
0.60
0.44
0.54
0.52
0.66
0.34
0.33
0.35
0.60
0.56
0.52
0.25
0.25
0.57
0.78
0.57
0.55
0.46
0.49
0.59
0.50
0.28
0.29
0.66
1.23
0.78
0.46
0.40
0.63
0.55
0.54
0.32
0.36
0.58
0.89
0.56
0.49
0.36
0.73
0.53
0.56
0.30
0.41
0.55
0.76
0.48
Mean
0.53
0.48
0.58
0.53
(Z=0.64)
0.52
(Z=0.66)
Mortality
Number of cod caught per trip at each age in the
May-December Div. 4T otter-trawl fishery were derived
from the appropriate age compositions and weight
landed per trip data (Table 10), and survival rates
between successive ages of each year-class calculated
(Table 11). Ages greater than 10 years were omitted
from the calculations of Table 11 because they were
poorly represented in the catches, and those younger
than 7 years were omitted to remove the effects of
partial recruitment on the means.
Survival rates of 7-10 year olds showed considerable fluctuation without apparent trends, the 11-year
average being 0.52, equivalent to an instantaneous total
mortality rate (Z) of 0.65. The catch curve of mean
numbers at age over the period, fitted from ages 7 to 13
(Table 10), gave an estimate of Z = 0.70.
Cohort analysis also provided estimates of fishing
mortality rates (F) and these are independent of
mortality rates provided by catch-per-unit-effort
analysis. Cohort analysis gave the more consistent results
(Table 12) and these can be reasonably interpreted in
terms of the events in the fishery. In the 1960-65 period,
full recruitment of year classes to the fishery, as judged
from calculated F values, occurred at about age 7, and
mortality of cod 7-10 years old was greater than that of
ages 11-14. (The results of 1961 are anomalous in this
regard.) The decrease in F of 7-10 year olds in 1961 and
1962 coincided with increased abundance but fairly
constant landings while increased mortality in 1963-65
62
ICNAF RESEARCH BULLETIN NUMBER 9, 1972
coincided with continuing high landings and declining
abundance. The decline in F for 7-10 year olds in
1966-68 corresponded with increasing stock abundance
and decline in otter trawl and line landings and thus
declining effort. In this 1966-68 period, F of 11-14 year
olds increased becoming substantially greater than that
of 7-10 year olds, reflecting the increasing importance of
the gillnet fishery on large cod.
TABLE 12. Division 4T and Subdivision 4Vn Cod. Instantaneous fishing mortality (F) by age-group and year derived by Pope's Cohort
Analysis.
Age
1960
1961
1962
1963
Year
1964
1965
1966
1967
1968
60-62
63-65
66-68
60-68
3
4
5
6
7
8
9
10
11
12
13
14
<.01
.03
.15
.34
.50
.37
.39
.60
.39
.43
.20
1.143
.03
.15
.24
.40
.35
.28
.45
.52
.86
.59
.94
<.01
.05
.15
.30
.32
.38
.34
.35
.24
.22
.17
.14
.01
.05
.17
.34
.41
.46
.52
.40
.42
.35
.19
.26
G.01
.03
.21
.36
.46
.49
.54
.36
.24
.28
.48
.26
.01
.12
.27
.50
.51
.71
.61
.56
.63
.50
.51
.48
.03
.20
.37
.32
.34
.40
.40
.43
.57
.48
.61
.53
.01
.17
.24
.26
.37
.29
.14
.32
.38
.54
.45
.43
<.01
.10
.29
.34
.27
.26
.20
.26
.52
.58
.88
.84
<.01
.04
.15
.29
.41
.37
.34
.47
.38
.50
.32
.54
.01
.16
.30
.31
.33
.32
.25
.34
.49
.53
.65
.60
.31
.01
.09
.22
.33
.40
.41
.38
.41
.43
.47
.45
.49
.40
F710
.47
.37
.35
.45
.46
.60
.39
.28
.25
.40
.01
.07
.22
.40
.46
.55
.56
.44
.43
.38
.39
.33
.50
f i Tut
.34
.73
.19
.31
.32
.53
.55
.45
.71
.44
.38
.57
.46
1' 7-14
.41
.55
.27
.38
.39
.56
.47
.37
.48
.42
.44
.44
.43
aomitted from averages
Thus, F of 7-10 year olds increased to 0.50 in
1963-65 from 0.40 in 1960-62, then declined to 0.31 in
1966-68. F of ages 11-14 year olds increased substantially in recent years to 0.57. The average F for 7-14
year olds in 1960-68 was 0.43, which is in reasonable
agreement with the 0.45 (assuming M = 0.20) obtained
from catch-per-unit-effort analysis.
Mortality rate on partially recruited age-groups
increased during the 1960-68 period, in contrast to the
mortality rate on 7-10 year olds. There has been an
apparent trend of increase in the proportion of a year
class recruited at age. The following recruitment pattern
to the trawl fishery was deduced from the calculated F
values of Table 12:
Age
1960-62
3
0
10
38
73
4
5
6
7
100
Percentage recruited
1963-65
2
14
44
80
100
1966-68
3
52
97
100
100
Accurate growth data for partially recruited age-groups
are not available from commercial samples. Assuming
growth conditions were similar to those for 6-8 year olds
which were almost or fully recruited to the trawl fishery,
growth rate was higher in the post-1963 period than in
1960-63 (Table 7). Thus, an increasing mean length at
age, and hence increasing degree of recruitment to the
fishery, would occur among 3-6 year olds over the
succeeding 6 years from 1963. The low growth rate of
1960-63 probably also prevailed in the immediately
preceding years as mean length at age was declining from
about 1956 (Paloheimo and Kohler, 1968). However, it
is unlikely that size at age of partially recruited agegroups was smaller in 1960-62 than in 1963-65 (Fig. 4)
and, in fact, was probably a little greater. The slightly
higher age at recruitment in the 1960-62 period is most
likely an artifact from the higher discard rate of partially
recruited age-groups prevalent at this time (Table 6).
Discussion
The fishery in the southern Gulf of St. Lawrence
cod stock has been continuously changing since the
entry of otter trawlers to the fishery in the early 1950's
HALLIDAY: THE SOUTHERN GULF OF ST. LAWRENCE COD STOCK
which resulted in annual landings increasing from less
than 50,000 tons in the 1940's to 110,000 tons by
1956. Landings subsequently declined, reflecting reduced interest in the fishery by foreign otter trawlers
and declining Canadian line landings, reaching a low of
41,000 tons in 1967. However, during this period there
was a considerable increase in gillnet landings which
partly offset the decline in landings from other gears.
This decline in total landings was accompanied by a
decline in abundance of those sizes of cod on which the
trawl and line fisheries are based (Paloheimo and Kohler,
1968; present paper). Between 1967 and 1970 stock
abundance and trawl and line landings increased, total
landings increasing to over 64,000 tons by 1970.
Estimates of population numbers of 3+ fish in the
1960-68 period (derived by Pope's cohort analysis) are
in good agreement with abundance estimates from otter
trawl cpe data. The high population numbers in 1960-61
were largely due to the large year-classes of 1955-57. As
these became more fully recruited, weight caught per
trip increased, but subsequently decreased with the
entry of the poor 1958-63 year-classes. The entry of the
better 1964 and 1965 year-classes in 1967 and 1968
reversed the trend of decreasing abundance by weight.
Substantial growth changes which occurred in the
1950's (Paloheimo and Kohler, 1968) continued in the
1960's, mean length, and presumably mean weight, at
age declining from 1960 to 1964-65 and subsequently
increasing (Fig. 4). These growth changes emphasize the
effects of changes in population numbers on weight
caught per trip. Changes in age at recruitment to the
fishery also resulted from these growth changes. Fishing
mortality rates (from cohort analysis and assuming M is
constant at 0.2) vary in a manner which is explicable in
terms of the events in the fishery. Gillnet landings are
composed of considerably older fish than are trawl and
line landings, and the development of the gillnet fishery,
particularly after 1965, is reflected by the substantial
increase in mortality rate of the oldest age-groups in the
stock. Those age-groups which sustain the bulk of the
trawl and line fisheries (7-10 year olds) showed a
decrease in F in 1961 and 1962 coincident with
increased abundance but fairly constant landings by
these gears. Increased mortality in 1963-65 coincided
with continuing high landings and declining abundance,
while the decline in F in 1966-68 corresponded with the
decline in otter trawl and line landings and increased
abundance. The declining mortality rate with age in the
1960-65 period indicates that the older cod become
progressively less catchable by trawl and line gear.
Thus, cohort analysis, which assumes a constant
value of Al for all age-groups and years, produces
estimates of population numbers which are in good
agreement with independent estimates of abundance
63
from cpe of the commercial fleet, and produces
estimates of F, the variations of which are largely
explicable in qualitative terms by changes in the nature
of the fishery. However, Paloheimo and Kohler (1968)
could not derive a satisfactory relationship between
mortality and effort from 1949 to 1965 data and
concluded that year-to-year variations in the catchability
coefficient, q, or in NI, were greater than variations in Z
due to changes in fishing effort.
' In their analysis, Paloheimo and Kohler obtained
numbers landed at age by weighting total landings by age
compositions obtained from the Div. 4T summer otter
trawl fishery only. Total effort was calculated by
dividing total catch of all age-groups by catch-per-uniteffort in Div. 4T of Canadian otter trawlers of 26-50
gross tons. Relative abundance of particular age-groups
in successive years was obtained by multiplying total
numbers caught per unit effort by the proportion of
these age-groups in the respective catches. Mortality
rates were then obtained from the relative abundance of
the same year classes in successive year& This method of
analysis does not take account of the substantial
differences in age composition among gears, fleets, and
areas, i.e. it assumes that the relative catchability of
different age-groups is constant between and within
different parts of the fishery. Garrod (1967), in his
analysis of the Arcto-Norwegian cod stock, found that
modified methods of catch-per-effort analysis which
took account of these factors were successful in
describing the relationship of mortality to effort,
whereas earlier attempts had been less than satisfactory.
Total annual effort calculated for the 1960-70
period by the method of Paloheimo and Kohler is not
correlated with the mean F for 7-14 year olds obtained
by cohort analysis. However, the development of the
gillnet fishery has had an obvious effect in increasing
mortality on the oldest age-groups. Recalculating total
effort by excluding gillnet landings and correlating these
values with F for 7-10 year olds, i.e. with those ages
where mortality is generated mainly by the trawl and
line fisheries, gives a correlation coefficient r = 0.69 (d.f.
= 7) which is significant at the 5% level (Fig. 6).
The present analysis, in demonstrating a relationship between effort and mortality, implies that variations in NI and q are not so great as to mask variations in
F due to changes in effort. It further demonstrates the
necessity of taking full account of differences in age
composition of removals by the various sectors of the
fishery. The value of cohort analysis in allowing
estimates of F for individual age-groups in each year to
be obtained independent of any measurement of effort
is also shown. It remains to describe the effective effort
on each age-group of the various gears involved by taking
account of their different selective properties and also of
64
ICNAF RESEARCH BULLETIN NUMBER 9, 1972
differences in age composition of the parts of the stock
to which this effort is applied, if the effects of the
fishery on the stock are to he known with accuracy.
data presented here. I thank Mr A. Sreedharan for
statistical advice, Mrs I. Thompson and Mr D. N.
Fitzgerald for the help in data analysis, Drs J. F. Caddy,
A. C. Kohler and Mr T. D. Iles for reviewing the
manuscript.
References
3.
4
5
Effort (Trips r
6
WI}
7
8
Fig. 6. Div. 4T and Subdivision 4Vn cod. The regression of
fishing mortality, F, of 7-10 year olds on fishing effort.
Acknowledgements
at St.
Many individuals in the Groundfish Investigation
Andrews were instrumental in the collection of the
GARROD, D. J. 1967. Population dynamics of the ArctoNorwegian cod. J. Fish. Res. Bd. Canada, 24: 145-190.
ICNAF, 1968-70. Summary of statistics on discards (whole fish
returned to the sea), 1966-68. Mt. Comm. Northw. Anent.
Fish. Redbook, Part III, 1968 p. 29-36; 1969 p. 115-123;
1970 p. 181-188.
MARTIN, W. R., and JEAN, Y. 1964. Winter cod taggings off
Cape Breton and on offshore Nova Scotia banks, 1959-62.
J. Fish. Res. Bd. Canada, 21: 215-238.
McCRACKEN, F. D. 1959. Cod tagging off northern New
Brunswick in 1955 and 1956. Fish. Res. Rd. Canada,
Atlant. Progr. Rept., No. 72, p. 8-19.
McKENZIE, R. A. 1956. Atlantic cod tagging off the southern
Canadian mainland. Bull. Fish. Res. Bd. Canada, No. 105,
93 p.
PALOHEIMO, J. E., and KOHLER, A. C. 1968. Analysis of the
southern Gulf of St. Lawrence cod population. J. Fish. Res.
Bd. Canada, 25: 555-578.
POPE, J. G. 1972. An investigation of the accuracy of virtual
population analysis. Res. Bull. int. Comm. Northw. Atlant.
Fish., this volume p. 65-74.
An Investigation of the Accuracy of Virtual Population
Analysis Using Cohort Analysis
By J. G. Pope'
Abstract
Cohort analysis is a simplified, approximate form of Gulland's virtual population analysis. As such it may be used to
obtain estimates of the instanteous rate of fishing mortality and the population surviving for each age of a year-class, given
the catch-at-age data, and an estimate of the instanteous rate of natural mortality and an estimate of the fishing mortality
at the final age of exploitation. More importantly, the simplicity of cohort analysis makes it possible to investigate the
errors generated in such estimates by the arbitrary choice of the rate of fishing mortality on the last age exploited and by
the sampling errors of the catch-at-age data.
Introduction
Gulland's virtual population analysis (Gulland,
1965) is an extremely useful technique when assessing a
fishery, because it enables estimates of population at age
and fishing mortality to be made independently of the
measurement of effort. These estimates are however
subject to various errors which might adversely affect an
assessment. What causes these errors and how can their
magnitude be calculated?
Section 1. Cohort Analysis as an Approximation
to Virtual Population Analysis
In the text and appendices the following symbols
are used:
M is the instantaneous coefficient of natural mortality;
F is the instanteous coefficient of fishing mortality;
Z is the instantaneous coefficient of total mortality;
N. is the population of a year-class at the ith birthday;
C. is the catch of a year-class at age i;
t is the last age of a year-class for which catch data are
available;
exp is the exponential function.
Virtual population analysis is an ingenious stepwise procedure developed by Gulland to calculate, for a
year-class, the instanteous fishing mortality and population at each age, given a knowledge of the catch at each
age and the natural mortality. Details of the method are
given in Appendix A but basically it is based on the
solution of the formula:
N. + 1
(F + M) exp
(F + M)}
c,
F (1 — exp
(F + M) })
Since this formula does not yield an analytical solution
for F it has to be solved numerically, either by reference
to tables or by using an iterative procedure. Either
method makes calculation of F and N by hand
somewhat laborious. More importantly, the lack of an
explicit formula for F makes it difficult to comprehend
the effect that errors in the input information cause in
the results.
Cohort analysis is a new form of virtual population analysis developed by the author to overcome these
problems. It is in fact an approximation to Gulland's
virtual population analysis which is usable at least up to
values of M = 0.3 and F = 1.2. A detailed explanation of
the method is given in Appendix B. The method is based
on the approximate formula:
Nt
= Ct
exp {M./2 }+ Ntexp
(1.2)
Thus, using 1.2 as a recurrence relationship,
N i = (C1 exp {M/2 ) + (1+ 1 exp {3M/2 ) 1+ (C1 + 2 exp {5M/2 })+ .
( L3)
+ (N t exp {(t i)M})
As with Gulland's virtual population analysis , N t has two
possible forms. The first form is when Ct refers to the
Ministry of Agriculture, Fisheries and Food, Fisheries Laboratory, Lowestoft, England.
60
1CNAF RESEARCH BULLETIN NUMBER 9, 1972
catch in year t only, which is the case with the last year's
catch of a year-class that is still being fished.
and consequently
Ni = C. exp {M/21) i (et, 1 exp {3M/21) +
In this case
Nt =
Ct Z t
F t (1 - exp
9 exp f5M/2 1-.)+
(1.4)
(1.7)
(C t Z t exp fj (t - i) MI
Ft
Z1 1 )
In either case
and consequently
. = loge fN 111- M .
Ni =exp fM/ 2 }) + (7.t 1 exp {3M/2}}i
+ (c1 2 exp {5M/2
The closeness with which these formulae approximate
the results of virtual population analysis can be judged
from Table 1, where results of both methods are
compared. It can be seen that in no case do the estimates
given by the two methods differ by more than 2%.
Consequently an investigation of the errors of cohort
analysis is an approximate investigation of the errors of
Gulland's virtual population analysis. It can he seen from
equations 1.5 and 1.7 that errors in Ni t , and consequently errors in F t , can be introduced by the incorrect
(1.5)
(Cit Z t exp f(t -i) I)
Ft (1 - exp f- G
The second form is when C t refers to the catch in year t
and all subsequent years. This is usually the case with a
completely fished year-class. In this case
Nt =
C t Z. /
choice of F t and by the sampling errors in the C.. These
two sources of error are investigated in the next two
sections. Errors in M can also cause errors in N. and F.,
but for the purpose of this document M will be
considered as fixed.
(1.6)
Ft
(L8)
TABLE 1. Comparison of the results of virtual population analysis and cohort analysis.
Arcto-Norwegian cod, 1956 year-class, M = 0.3.
Fishing mortality, Fn
Age
(years)
12
11
10
9
8
7
6
5
4
3
2
1
aAssumed.
Virtual
population
analysis
0.8000a
1.3400
0.7826
0.6768
0.6582
0.8636
0.7341
0.4289
0.1874
0.0411
0.0024
0.0007
Cohort
analysis
0.8000a
1.3670
0.7806
0.6747
0.6570
0.8657
0.7333
0.4261
0.1854
0.0405
0.0024
0.0007
Population, Ni X 10 6
error
2
1
1
1
Virtual
population
analysis
Cohort
analysis
error
0.2
1.1
3.1
8.3
21.7
69.6
195.6
405.5
660.2
928.5
1256.4
1697.1
0.2
1.1
3.2
8.5
22.2
71.2
200.1
413.6
672.0
944.7
1278.2
1726.6
0
2
2
2
2
2
2
2
2
2
2
67
POPE: VIRTUAL POPULATION ANALYSIS USING COHORT ANALYSIS
Section 2. Error in Cohort Analysis Due to the
Incorrect Choice of F,
If an incorrect value F t is chosen for the terminal
fishing mortality when its true value is F t , then the
proportional error in N t , p(N t), is given as follows in the
case when C t is the catch in year t only:
z,
exp f- Zt 1)
exp 1- Z t 1)
(I
7„ F, (1
P(Nt)
-
(2.1)
Since
p (N i)
= p (N t
t. ) exp 1- Ft(2.2)
It is therefore simple to convert a table of p(61 1) into a
table of p'(N 1). The porportional error of Ft , p(F t), is
given approximately by a formula due to Agger et at,
(1971):
fig
- exp {Ft )
p(Nd
(2.7)
F.
This form supersedes a cruder formula in Pope (1971).
However, for the purpose of discussion 2.7 may be
simplified to the assumption that p(F1) is less than twice
the numerical value of p(Nt) and of opposite sign
provided Ft is less 1.2 (the viable range of cohort
analysis) since within this range
it follows that
Z, Ft (1 — exp (-7,} )
p(Nt)
Ft (1 - exp 1- Zt)
X exp {- Ft - Fi-
X
Ft9
(2.3)
(
F t - Ft
X (exp
)X
L
(2.8)
Figure I shows graphs of p(611) plotted against the
approximately by:
Ft - F i-
F t9
(2.4)
while for larger values of Z this formula tends to
overstate the error and is therefore still of some value.
A formula similar to 2.4 gives p'(N1), the
proportional error in N t when C t is the catch in year t
and all subsequent years. In this case
m
ii(Nt ) - _
Z tFt
X(xp {-
It
sum of the fishing mortality from year i to year t
1
(cumulative fishing mortality). Figure 1 is based on
formula 2.4 which increasingly overestimates p ( N i) as Zt
increases. Consequently the value of p(F i) is given
For small values of Z t this is approximately given by
p(N t)
- exp {Ft 1)
2<
.
X
- Ft9
(2.5)
and therefore
7 p(N.).(2.6)
p'(N1) = M
p(F t)
- {value of p(Nd on Figure 1}
(2.9)
provided F C T. It can be seen that the underi
t
estimation of F t results in estimates of N t which are too
large and estimates of Ft which are too small, whereas
overestimating F t has the reverse effect. It can also be
seen that as the cumulative fishing mortality increases,
both types of error decrease. As an example, if F t was
overestimated by 100% for a year-class and the
cumulative fishing mortality from year i to year t - 1
was 2.0, then the percentage error in N t would at most
be -7% and the percentage error in F t would be about
+7% (see 2.9). If, however, F t was underestimated by
50% and the cumulative fishing mortality was equal to
2.0, then the percentage error in N t would be at the
most 14% and the percentage error in F t would be about
-14% (see 2.9).
68
ICNAF RESEARCH BULLETIN NUMBER 9, 1972
100
-5004
50
-25
0
-10
120
150
100
-50
Ft error
-1000
1
1
2
Cumulative fishing mortalities
3
from year i to year t -1
Fig. I. Graphs of the percentage error in N i due to incorrect values of E t plotted against the
cumulative fishing mortalities from year i to year t — 1.
Thus, provided that Ft can be estimated within this
decreasing function of age. Hence the bias in F. caused
range and provided that the cumulative fishing mortality
is greater than 2.0, the error in in the estimates of N. and
by the incorrect choice of Ft will be greatest amongst
F.t should be small enough for many uses. If, however,
the cumulative fishing mortality is small, which is the
case when the number of recruits to a year-class is
estimated from the catches of partially recruited age
groups, then the accurate estimation of N i and F. will
require the accurate choice of F t . It should also be
realized that since the cumulative fishing mortality is the
sum of the fishing mortalities from age i to age t — 1 it
must, for a particular year-class, be a monotonically
the oldest age groups, and this may upset estimates of
selectivity with age. Table 2 shows the results of a
cohort analysis for the 1956 year-class of the ArctoNorwegian cod. This assumes that the true values of M
and F t are 0.3 and 0.8 respectively and shows the
percentage errors in N i and Fi when Ft is overestimated
by 100% or underestimated by 50%. These errors were
computed by rerunning the data with the appropriate
value of Ft and are therefore precise. It can be seen that
these percentage errors are similar but, in general,
smaller than their estimates in Fig. 1.
69
POPE: VIRTUAL POPULATION ANALYSIS USING COHORT ANALYSIS
TABLE 2. The percentage in Ni and Fi when F t is overestimated by 100% and when F t is
underestimated by 50% for the 1956 year-class of the Areto-Norwegian cod, with M = 0.3
and when the true value of F t = 0.8.
error when Ft
is taken as 1.6
% error when Ft
is taken as 0.4
Age
(years)
Ni X 10-6
Fi
12
11
10
9
8
7
6
5
4
3
2
1
0.2
1.1
3.2
8.5
22.2
71.2
200.1
413.6
672.0
944.7
1278.2
1726.6
0.8000a
1.3670
0.7806
0.6747
0.6570
0.8657
0.7333
0.4261
0.1854
0.0405
0.0024
0.0007
Cumulative
Fi
1.3670
2.1475
2.8222
3.4792
4.3449
5.0782
5.5043
5.6897
5.7302
5.7326
5.7333
ito
in Nt
in F i
in N i
in Fi
+ 68.66
+ 17.50
+ 8.02
4.08
Jr 2.12
+ 0.89
+ 0.43
+ 0.28
+ 0.23
+ 0.22
+ 0.22
+ 0.22
- 26.44
- 10.77
- 5.50
- 2.91
- 1.40
- 0.63
- 0.35
- 0.22
- 0.25
- 0.00
- 0.00
- 32.27
- 8.22
- 3.77
- 1.92
- 0.99
- 0.42
- 0.20
- 0.13
- 0.11
- 0.10
- 0.10
- 0.10
+ 22.21
+ 6.07
+ 2.82
+ 1.43
+ 0.67
+ 0.29
+ 0.16
+ 0.16
+ 0.25
+ 000
+ 0.00
a Assumed.
Section 3. Error in Cohort Analysis Due to
the Sampling Error of Ci
Unlike the estimate of F t , which is usually an
arbitrary choice, each estimate of catch at age can be
assigned a variance, although this is seldom available, due
to the heavy work involved in its computation (see
Gulland, 1955). Assuming such variances to be available
it is a simple matter to compute the resulting variance of
N i and F. since
var (Ni) = war (C 1) exp {M ) + (var (N i + 1)
{2M}),
(3.1)
and this may be used as a recurrence relationship to obtain
var (N i) = war (Ct) exp {M ) + war (C. + 1 ) exp {3M ) +
+ (ar (Ct)
(exp {2 (I - i) M (F t + M)2
F2t. (1 - exp
F t - M )2
(3.2)
which is a very similar formula to 1.5.
The equivalent variance of F t can be approximated, since
Fi + log, {N i / Ni + 1 }- M
(3.3)
which yields approximately
Var (Ft)
(iar (N i)
(2 var (N i
Equations 3.2 and 3.4 should be used to calculate the
respective variances of N i and F t in a particular case, but
)
(3.4)
in order to appreciate the approximate magnitude of these
variances the following
lowing approximate formulae are useful:
70
ICNAF RESEARCH BULLETIN NUMBER 9, 1972
ear ratio (N 1 )) 2
war
ear ratio (CO 2
— exp f—
— exp
ratio ( F i ) ) 2
+ ear ratio (N 1
[ear ratio (CO 2
F?
4 1 ))
2 exp
2
(3.5)
ear ratio (N i + 0) 2]
(3.6)
Details of the derivation of these formulae are given in Appendix C.
120
110
Variance ratio of Fi as a percentage
of the variance ratio of the catches
100
ce,
a,
o
\
"a• 90
u
\
---. ___
"... ---- __
———
-------------
0.2
-0.4
-...
— — — 0-6
0.8
5 80
a
o
70
Variance ratio of Ni as a percentage
Z
of the variance ratio of the catches
08
a,60
a
0
50
06
0
— 40
0
0.2
30
Fishing Mortality
per year
20
10
I
I
2
4
6
8
10
12
Years of further exploitation
1
I
I
I
I
I
14
16
(t -i-1)
I
1
18
20
Fig. 2. Graphs of the percentage variance ratio of F. and of N i for various constant levels of fishing
mortality plotted
against the years of further exploitation.
POPE: VIRTUAL POPULATION ANALYSIS USING COHORT ANALYSIS
Figure 2 shows graphs of these formulae for each
year from the final year, that is for the number of years
from the estimate in question to the final year. The
graphs are given for the ease when the variance ratio of
the catch-at-age data is constant, and when the fishing
mortality is constant throughout the life of the fish.
Although these conditions are unrealistic, the rapid
convergence of the graphs to asymptotic values does
suggest that the graphs would indicate the approximate
value of the variance ratio of the estimates of N i and F.,
even when F. is not constant from year to year. As an
example of the use of the graphs, the estimate of N 5 (for
71
a year-class with an oldest age group of 12 years old,
experiencing a fishing mortality of 0.6 per year) would
have a variance ratio of approximately 54% of the
variance ratio of the catch data. Similarly, the estimate
of F 5 would have a variance ratio of approximately 85%
of the variance ratio of the catch data. Ilene, if the
variance ratio of the catch data was 10%, then the
variance ratios of N 5 and F5 would be 5.4% and
8.5% respectively. As a result the approximate 95%
confidence limits for the estimates would be ± 10.8%
of the estimate of N 5 and ± 17.0% of the estimate
of F5.
TABLE 3. Standard deviations and variance ratios of N i and F i calculated for the 1956
Arcto-Norwegian cod, assuming that the variance ratio for the catch at each age was 10%
and that M= 0.3 and F. = 0.8.
Variance
ratio (%)
Standard deviation
Age
(years)
12
11
10
9
8
7
6
5
4
3
2
I
Ni X 10 -6
0.2
1.1
3.2
8.5
22.2
71.2
200.1
413.6
672.0
944.7
1278.2
1726.6
Fi
N i X 10-6
Fi
Ni
0.8000a
1.3670
0.7806
0.6747
0.6570
0.8657
0.7333
0.4261
0.1854
0.0405
0.0024
0.0007
0.01449
0.08361
0.20763
0.50349
1.26666
4.46487
12.01878
21.65851
31.37061
42.51186
57.38580
77.46281
0.09192
0.06801
0.05865
0.05601
0.06669
0.06134
0.04047
0.01910
0.00439
0.00026
0.00007
7.60
6.49
5.92
5.71
6.27
6.01
5.24
4.67
4.50
4.49
4.49
6.72
8.71
7.51
8.53
7.70
8.36
9.50
10.30
10.83
10.77
10.59
aAssumed.
Table 3 shows the 1956 Arcto-Norwegian cod
results, together with the standard deviations and
variance ratios of N i and F1 . These were computed from
and Ft for any year-class which has catch data which
have approximately constant variance ratios.
equations 3.2 and 3.4 on the assumption that the
variance ratio of the catch data at each age was 10%. It
can be seen that the variance ratios of these estimates are
not very different from those which would have been
predicted by entering the graphs of Fig. 2 with
appropriate values of Ft at the asymptotic parts of the
Summary
graphs. Thus Fig. 2 should prove to be of some value in
providing quick estimates of the variance ratios of N I
This document provides formulae for calculating
the error introduced in cohort analysis (and therefore
virtual population analysis) by errors in F t and by the
sampling error of catch data. It also provides some quick
estimates of the likely size of such errors. These
estimates suggest that such errors converge to fairly
72
ICNAF RESEARCH BULLETIN NUMBER 9, 1972
small values, but they also suggest that a knowledge of
the approximate value of these errors will always be a
safeguard against misinterpretation of data!
References
AGGER, P., I. BOETIUS, and H. LASSEN. 1971. On errors in
the virtual population analysis. ICES C.M. 1971 Doc. No.
16 (mimeographed).
GULLAND, J. A. 1955. Estimation of growth and mortality in
commercial fish populations. Fish. Invest., Lond. (2), 18
(9).
1965. Estimation of mortality rates. Annex to Arctic
Fisheries Working Group Report (meeting in Hamburg,
January 1965). ICES, C.M. 1965, Doc. No. 3
(mimeographed).
POPE, J. G. 1971. An investigation of the accurancy of virtual
population analysis. Annu. Meet. int. Comm. Northw.
Atlant. Fish, 1971, Res. Doe. No. 116, Serial No. 2606
(mimeographed).
Appendix A.
Gulland's Virtual Population Analysis
Ni + 1
CiFi — exp
GI/ Iland's
virtual population analysis is based on
the following two equations:
Ni
1 = Ni exp {—(F. + M)}
C. = Ni/
F.
(A.1)
— exp {— (Fi + M)})
(A.2)
F. + M
(Fi + M) exp
(Fi + M)
(Fi + M) I)
(A.3)
Hence, if N i 1 , C i , and M are known, then (as was
explained in Section 1) it is possible to solve A.3/1.1 for
F. and then to use A.1 to obtain N 1. Then A.3/1.1 may
be used to obtain F i
1 and so on. To start the
procedure it is necessary to estimate N t , the population
size of the oldest age at which the year-class was fished.
This is done by taking the best estimate (or guess) of Ft
available and using A.2 to solve for N t . It is shown in
Section 2 that in general the accurate choice of F t is not
crucial to the accuracy of F or N for other ages.
It follows therefore that
Appendix B
Cohort Analysis
The basic equation of cohort analysis is obtained by rewriting A.1 as
Niexp
which can be expressed as
Substituting A.2 in 8.2,
Ni 1 exp
M1= N i exp
Fi } ,
M = Ni — Ni (1 — exp
(B.1)
F 1 } ).
((F i + M) (1 — exp f— F i 1 )
Ni + 1 exp {+ M } = N i — Ci
Fi (I _ exp {— (F i + M) } )
However, within the range M < 0.3, F i < 1.2 the function
((Fi + M) (1 — exp {— Fi } )
Fi (1 — exp {— (Fi + M) } )
(B.2)
(8.3)
can be
POPE: VIRTUAL POPULATION ANALYSIS USING COHORT ANALYSIS
M/2 }
exp
with an error that
approximated by
is always less than 4%. Thus, with little loss of
accurancy, B.3 can be rewritten as:
Ni = N i + exp {+
M1 -F
C. exp {+ M/2 } .
(B.4)
73
This is the basic equation of cohort analysis. Given a
knowledge of Ni + 1 , C t and NI, it is possible to use B.4
(or 1.2) to obtain N I and then to use B.1 to obtain Ft.
Having found N1, equation B.4 (or 1.2) can be used to
obtain N iand so on. The value of N t is obtained as
for virtual population analysis.
Appendix C
The Derivation of the Formulae of Section 3
If aN t , ANtand AC t denote random errors in N 1 , N i , 1 and C t that are a result of the sampling errors of the
Ci , then making a Taylor expansion of 1.2 gives AN i = ACi exp {M/2}+ AN. + 1 exp
}.
(Cl)
.
Squaring and summing gives
var (N1) = (var (C 1 ) exp {rvi
+ (var (N i
1 ) exp {2M
+ (covar (C1 , Ni i 1 ) exp {3M/2 }).
(C.2)
Since Ct and N i + I are unrelated, the covariance term will be equal to zero and C.2 will yield 3.1, that is:
var (N 1) = (var (C 1) exp {M
(var
(Ni + 1 ) exp {2M }).
Dividing both sides of this by N . gives, after substituting A.1 and A.2,
var (Ni)
N2
= ear (Ci) exp {M})
F. (1 — exp f (Fi + M)
1))2(var
(F + M) C i
(Ni + 1 ) exp
Ni , 1 exp {F1
{2M }
)
+M
(C.3)
Using the same approximation as in Appendix B, this simplifies to:
(var
ratio (N i) 2 z
(var
ratio (C 1)
2
i -
exp {— F. } 2
+
(var ratio (N. +
2
exp {— Ili } 2
which is the form of equation 3.5.
If AF t is the error in F t due to the sampling errors in the C t , then expanding 3.3 as a Taylor series gives
approximately:
AFi=
N.
+1
i
Ni , 1
(C.4)
74
ICNAF RESEARCH BULLETIN NUMBER 9, 1972
Squaring and summing this gives:
var (Ni)
var (F.) -
2 covar (N i , N i
1)
var (Ni
N
L iN +
Ni
(C.5)
N.;{
Multiplying C.1 by ANi + 1 and summing gives:
covar (N i , Ni j 1 ) = (covar (Ci , Ni + 1 ) exp {M/2})
(var (N1 , i ) exp {M}).
(C.6)
And since there is no relation between C i and N i, C.6 becomes:
covar (N.,
= var (Nj
j ) exp {M} .
(Cl)
Substituting C.7 in C.5 gives:
var (IC) -
var (Ni)
2 var (N i j 1 ) exp {M }
Ni
Nii i +
var (N i i)
1
(C.8)
i+1
which is of course the same as 3.4. This can be further simplified by dividing both sides y I ■7 and substituting in A. I ,
which gives:
war ratio (F i )
2
j
(var ratio (N)
2
+
(var ratio
+1
( N.(N)
2
1 - 2 exp {— F1i
(
(C.9)
F?
Hence, using 3.5, this gives:
war ratio (Fj)
2
(
1-
exp { F j }
2
I(var ratio (C
2
i)
F2
which is the same form as 3.6.
4-
war ratio (N. + 1 ))
2
(C.10)
Virtual Population Assessment of St. Pierre BankNewfoundland South Coast Cod Stock
(ICNAF Subdivision 3Ps)
By A. T. Pinhorn'
Abstract
Assessment of the St. Pierre Bank-Newfoundland South Coast (ICNAF Subdivision 3Ps) cod stock, using the "virtual
population analysis" technique, indicated fishing mortalities beyond the level of maximum sustainable yield per recruit
during the 1959-68 period. Cod were fully recruited to the fishery at 7 years of age with very few 3-year-olds being taken.
Total stock size has fluctuated in response to recruitment while numbers of fully recruited fish have declined steadily.
Introduction
As part of a continuing effort to assess the state of
the various cod stocks in the ICNAF area, an assessment
has been performed for ICNAF Subdivision 3Ps cod
using the Gulland and Jones modifications of the
"virtual population analysis" (VPA) technique. The
results of this assessment are presented here.
Materials and Methods
The basic data used were length frequencies,
age-compositions, and age-length keys published in
ICNAF Sampling Yearbooks for 1959-70 and the
nominal catches published in ICNAF Statistical Bulletins
for the same period.
In addition age-length keys from Canada (Newfoundland) research vessel cruises to the area as well as
those from the inshore fishery were used where
necessary.
Compilation of length composition of otter trawl catches
The procedure used to obtain representative length
composition of the total catch by otter trawl (Fig. 1)
was identical to that used by Pinhorn (1971) for ICNAF
Division 2J cod and consisted of adjusting the 0/00
frequency of each country for each month to the
estimated number of fish caught by that country in that
month and then combining into semi-annual and annual
frequencies. However, for this assessment, because of the
relative scarcity of discard data and the low level of
discards indicated by the few data available, no
adjustment from landings to catches was made but the
numbers estimated are numbers landed rather than
numbers caught. In 1963 and 1964, no length frequencies were reported in the Sampling Yearbooks and
the only available data were Canada (Newfoundland)
research frequencies. These were adjusted to the
minimum regulation mesh size in use at the time.
However, it was found in years in which both research
and commercial frequencies were available, that even
after adjusting to the minimum regulation mesh size, the
research frequencies still contained more smaller fish and
less larger fish than the commercial frequencies, possibly
because of the different pattern of fishing of the
research and commercial cruises. By combining years
conversion factors between research and commercial
frequencies for each length group were derived and these
were applied to the adjusted research frequencies in
1963 and 1964. This procedure was also used in 1969
where the available commercial frequencies were not
considered representative of the fishery.
Compilation of numbers caught at each age
The method used to estimate numbers of cod
caught at each age was again similar to that described by
Pinhorn (1971) for ICNAF Division 2J cod and
consisted of applying semi-annual age-length keys from
various countries to the semi-annual otter trawl length
frequencies derived above and then averaging the age
distributions from the various countries and combining
into annual frequencies. To these were added the
estimated numbers landed by Canada (Newfoundland)
inshore gears and by other gears. In obtaining the latter,
the following gear groups were used:
'Fisheries Research Board of Canada, Biological Station, St. John's, Newfoundland.
76
ICNAF RESEARCH BULLETIN NUMBER 9, 1972
3
I
CANADAIR/
2 PORTUGAL
SPAIN
1
0
ANADAIN)
2 UK
I
I
I
II
959
of Cod Catch by Type of Gear in the Newfoundland
Inshore Fishery. In each of these gear groups the Canada
(Newfoundland) inshore age-compositions were used to
estimate the numbers landed at each age and these were
combined with otter trawl numbers to provide estimates
of total numbers landed from the stock in each year
(Fig. 2).
12
I
IcANIA9A iro T ites!91, 01 ■ —
CANAOID PO — Commerom (=—
USS R 1223 _
ill
16,000 1
—
_ 4
IN th lb in AC6
CANADAIN1—Research WM —
1960
USSR =-
2,500
1
4
0 CANA0A1N1
0
PORTUGAL
SPAIN
uK
ANCE
0 NAM
4,400
1961
15
4
10
_
5
1 11 g, I9 in 0
CANADA( N)—Research 1M
USSR 15:37:
ill
2,200
PORTUGAL = _
CAN111) — Commercial 0 - 8
1962
0
20
4
sELIIILEfa_____.±- 0
0 ANADA1N/
CANADA (11/ — Research sue_
Research 1963
_4
..y.,__,j_m_......
Adjusted
_
0 CANADAINI
Go
Ill.__.•
Pd
CkeS
CANAOMN1
UK
fed
CANA04041—Research i•_
1964
_I_ I
1965
3,40 0
CANADA(N)—Commercial
2,700
0
C ANINI
2-
2,300
s_
C ANACIA111) —■Research =
1967
1 Ls—.
1968
CANACIAN—Commerclal NM
1
0
C ANADAINI
2
0 CANINI
2 COMM.
_
0
1969
Research
Adjusted
I 000
1970
I
I
I I
I
I
LANADA (NI —Resemble
I
I
a . .
CANADA(111—Research MN
i CAN (NI —Commercial=
ilillin_
I I- _1_1
1111111
0
4 170
0z
I I
22 34 46 58 70 82 3 4 5 6 7 8 9 10 10+
LENGTH (CM)
AGE (YEARS)
1
0
15
■
1966
—
— 1111m
1 I m—
1963
5
_
8
0
15
—
1
1969
—
11111
--
-
...-1
1970
1964
10
8
8
—
5
0
4
1968
1962
—
5,10 _
10 —
0
1967 ■ m ja—
1111M
IlMisallii“
IT, 0
p 15
4
4
m
5
a
0
I I II
1961
—
0 10 _
0
15
4
•
1960
5
4 c°
I I
mill i lLam alIMEM
15
a Pt
M2
z 0
ANADA(N)
CANUAI
2 FRANC
—
—
I • •
0
CANADAINI — Research =
POLAND=: 8
_Lan .,
-I \ ---'-.--1966
1
2,400
CANADA (NI
co
I
1965
10
0
41
1959
0
;111■11.
mmillill■
3 4 5 6 7 8 9 10 10♦ 3 4 5 6 7 6 9 10 10+
AGE (YEARS}
Fig. 2. Total numbers of cod caught per year and age-group by
all gears, ICNAF Subdivision 3Ps, 1959-70.
0
Fig. 1. Length and age distributions of otter trawl catches used
in ICNAF Subdivision 3Ps cod assessment, 1959-70.
Canada (Nfld.) codtrap + handline + jigger;
Canada (Nfld.) gillnet;
c)
Canada (Nfld.) linetrawl + longline + Danish
seine + Canada (Maritimes) longline + dory vessel +Portuguese dory vessel + St. Pierre and Miquelon
small boats.
The landings were divided into the various inshore
gear groups from information contained in a manuscript
series of the St. John's Biological Station on Breakdown
No estimate of natural mortality (M) is available
for this stock at present but calculations for ICNAF
Subarea 1 cod (Horsted, 1968) and for Division 2J cod
(Pinhorn, 1972) indicate that M is likely to be in the
range of 0.15 to 0.20. An estimate of 0.2 was therefore
used for this VPA and a few trial calculations indicated
that an exploitation rate E(1-c— Z ) of 0.343 was
probably close to the actual value.
Results
Fishing mortality
Table I shows estimates of numbers of cod caught
per year and age-group during 1959-70. Table 2 shows
fishing mortality estimates (F) for ages 3-11 calculated
from the figures in Table 1.
PINHORN VIRTUAL POPULATION ASSESSMENT OF COD
77
TABLE 1. Number of cod caught per year and age-group ICNAF Subdivision 3Ps, 1959-70 (X10 3).
Year
Age
2
3
4
5
6
7
8
9
10
11
12
13
14
14+
Total
1959
1960
1961
1962
1963
1964
1965
1966
1967
1968
1969
1970
1001
13940
7525
7265
4875
942
1252
1260
631
545
44
567
5496
23704
6714
3476
3484
1020
827
406
407
283
27
83
450
5586
10357
15960
3616
4680
1849
1376
446
265
560
58
33
1245
6749
9003
4533
5715
1367
791
571
187
140
135
241
148
961
4499
7091
5275
2527
3030
898
292
143
99
107
92
192
1906
5785
5635
5179
2945
1881
1891
652
339
329
54
27
206
12
2314
9636
5799
3609
3254
2055
1218
1033
327
68
122
36
129
949
13662
13065
4621
5119
1586
1833
1039
517
389
32
22
53
2871
10913
12900
6392
2349
1364
604
316
380
95
]49
3
52
55
1143
12602
13135
5853
3572
1308
549
425
222
111
5
107
399
774
7098
11585
7178
4554
1757
792
717
61
120
67
110
110
756
81]4
12916
9763
6374
2456
730
214
178
77
121
14
167
39280
46494
45236
30825
25206
26829
29612
42887
38388
39486
34923
41880
TABLE 2. Fishing mortality estimates by year and age-group for cod in ICNAF Subdivision 3Ps, 1959-68. Estimates in parentheses not
used in calculation of averages.
1962
1965
F
1966
1967
1968
Age
1959
1960
3
4
5
6
7
9
10
1]
0.02
0.16
0.26
0.40
0.38
0.20
0.43
0.60
0.39
- 0.01
0.13 0.14
0.43 0.40
0.39 0.59
0.34 0.38
0.52 (1.07)
0.35 0.57
0.56 (1.17)
0.39 0.68
0.03
0.21
0.34
0.31
0.44
0.24
0.51
0.34
0.46
0.03
0.14
0.35
0.35
0.29
0.45
0.25
0.36
0.13
0.03
0.21
0.26
0.47
0.34
0.36
0.56
0.29
0.93
0.03 0.01 0.03 0.02
0.21 0.25 0.18 0.20
0.33 0.49 0.40 0.33
0.26 0.48 0.47 0.32
0.62 0.72 0.48 0.53
0.43 0.73 0.42 0.54
0.42 (0.87) 0.59 0.30
0.70 0.76 0.35 ( L14)
0.23 0.97 0.72 0.45
Average
ages 3-11
0.32
0.39
0.40
0.32
0.26
0.38
0.36
0.55
0.40
0.34
Average
ages 7-11
0.40
0.43
0.54
0.40
0.30
0.50
0,48
0.80
0.51
0.46
8
1961
Year
1963 1964
1959-68
0.02
0.18
0.36
0.40
0.45
0.43
0.44
0.50
0.54
Change in F with age as % of
F in fully recruited age-groups,
1959-68
4
38
77
85
100
100
100
100
100
78
ICNAF RESEARCH BULLETIN NUMBER
Fishing mortality estimates for ages 3-1] fluctuated only moderately between 0.3 and 0.4 during
1959-68 except for 1966 when the estimate of F was
unusually high especially for cod older than 6 years
(Table 2). The cod in this area are fully recruited at 7
years of age with very few 3-year-olds being taken, the
50% recruitment age being approximately 4.5 years.
TABLE 3. Number
9, 1972
Stock size
Numbers present in the stock at the beginning of
the year (Table 3 and Fig. 3) indicated that the total
stock size of fish 4 years old and older decreased from
about 200 million fish in 1959 to a low of 100 million in
1964 and then increased to 175 million in 1968. The
of cod present in the stock at the beginning of the year (X10 6 ),
ICNAF Subdivision
3Ps, 1959-68.
Year
1959
1960
1961
1962
1963
1964
1965
1966
1967
1968
56
104
36
24
17
6
4
3
2
2
—
(50)
47
73
23
13
9
4
2
1
1
1
50
47
35
39
13
8
5
2
1
1
1
1
47
40
34
19
18
7
2
1
36
37
26
20
11
9
4
1
1
71
31
27
15
1]
7
5
3
1
1
87
56
22
17
8
6
4
2
2
105
68
37
13
11
3
3
2
1
1
108
79
43
19
7
4
64
81
51
24
10
3
2
1
2i
3+
254
198
224
174
203
153
168
121
145
109
172
101
204
117
244
139
263
155
237
173
3-6
220
193
171
140
119
144
182
223
249
220
14
17
Age
3
4
5
6
7
8
9
10
11
12
13
14
843
1
1
1018
+21%
6t
34
31
32
28
26
28
151
22
21
102
—32%
PINHORN: VIRTUAL POPULATION ASSESSMENT OF COD
Yield per recruit
125
1959
100
1965
Yield per recruit calculations incorporating the
partial recruitment estimates shown in Table 2 produced
a curve almost identical to that presented by Pinhorn
and Wells (1970) (Fig. 4). The point of maximum
sustained yield per recruit was at an F-level of 0.3. The
level of F for fully recruited age-groups prevailing in the
1960's was between 0.3 and 0.55 and thus was beyond
this level of maximum sustained yield per recruit, being
in the range of 90-100% of the maximum (Fig. 4).
75
50
25
0
75
11
11 1-- 1111..
0105
19 60
1966
50
25
01 I
0 75
25
I
1962
75
I°
1961
II 111.“
°
I I I 11 •
I ••
_
II
1967
I.._
1968
Discussion and Conclusions
-
;150
25
111-
0
75
iii,.
1963
-
50
20
75
j
11, .
1964
.
-
50
25
79
a le
0I I I
3 4 5 6 7 8 9 10 10+ 3 4 5 6 7 8 9 10 10+
AGE (YEARS,
Fig. 3. Numbers of cod per age-group present in the stock at the
beginning of the year, ICNAF Subdivision 3Ps, 1959-68.
numbers of 6+ fish have declined fairly steadily from 34
million in 1959 to 14 million in 1967 and 17 million in
1968.
There is some reason to doubt the validity of the
high estimate of fishing mortality for 1966 (0.55 as
compared to 0.3-0.4 for the other years) since neither
the effort nor the catch increased significantly in this
year. This resulted from a higher proportion of older fish
being represented in the samples during 1966 and may
have been caused by some inadequacy in the sampling
data in this year or a greater vulnerability of older fish to
one or the other gears. On the other hand, in some years
there is some mixing of the slower growing West
Newfoundland cod stock with the 3Ps stock in the
vicinity of the western part of St. Pierre Bank and
Burgeo Bank during the migration of the former stock
out of the Gulf of St. Lawrence in winter (Templeman,
1962). If this occurred to a greater extent in 1966 than
in 1965 or 1967 it would result in an apparent increase
in older fish in the catches.
Fluctuations in numbers of cod in the stock arc
correlated with changes in recruitment over the period
.I00
2
3 80
2
cr 60
ta.
o 40
PRESENT PAPER
PINHORN AND WELLS (19701
20
0
0 0 0•1
0 . 2 0 . 3 0 .4 0 .5 0 . 6 0 . 7 0 . 8 0 . 9 NO NI
F IN FULLY RECRUITED AGE GROUPS
1 .2
I .3 I 4
Fig. 4. Yield-per-recruit curves for ICNAF Subdivision 3Ps cod incorporating partial recruitment
estimates. Arrows indicate levels of F in various years. Circled point represents level of
maximum sustained yield per recruit.
80
ICNAF RESEARCH BULLETIN NUMBER 9, 1972
(Fig. 5). The 1955 year-class was large but the 1956-60
year-classes were less than half as large. The 1958
year-class although estimated from surveys to be very
strong, did not contribute significantly to the commercial fishery and the survey data are therefore
questionable for this year. The 1961-65 year-classes were
again larger in size. This pattern of recruitment resulted
in a decrease in stock abundance between 1959 and
1964 and an increase between 1965 and 1968.
The general conclusion from the assessment is the
same as from the previous catch/effort assessment
(Pinhorn and Wells, 1970) that further increases in
fishing effort on this stock will not result in long-term
increases in yield and may result in long-term decreases
in catch per unit effort. In fact some reduction in fishing
effort would probably not impair the long-term yield
and may result in an increased catch per unit of effort.
This assessment was greatly hampered by lack of
data for the otter trawl fishery. In years when data did
exist for the offshore fishery, there was lack of coverage
throughout the year and samples were usually available
for 1 or 2 months only and even then in many cases the
length and age material was really insufficient to ensure
adequate representation of the catches. In 2 years no
data from the otter trawl fishery existed at all and in
another year the existing data were obviously not
representative of the entire catch. In these years research
data were used as indicated above but these are usually
poor substitutes for the actual data from the commercial
fishery, especially in localities such as this where
pre-recruit fish inhabit the same areas as adult fish. It is
suggested that an effort be made to increase the
sampling intensity in this area in future years.
References
320
1111111
I
I
I
1
280
O
240
200
et
co 160
a
z
A -
120
1-0
80
ao
0
\
1955
'56 '57 '58 '59 '60 '61
YEAR—CLASS
'62
'63
'64 '65
Fig. 5. A. Numbers of cod ages 2-3 years per standard hour from
Canada (Newfoundland) research vessel surveys. B.
Numbers of cod age 4 years (millions) in stock at
beginning of year. ICNAF Subdivision 3Ps.
HORSTED, Sv. Aa. 1968. Cod in Subarea I. Review and revision
of parameters. Annu. Meet. int. Comm. Northw. Atlant.
Fish. 1968, Res. Doc. No. 57, Serial No. 2038 (mimeographed).
PINHORN, A. T. 1971. Virtual population assessment of ICNAF
Division 2J cod. Res. Bull. int. Comm. Northw. Atlant.
Fish., No. 8, p. 75-85.
1972. Estimates of natural mortality for ICNAF
Division 2J cod. Annu. Meet. int. Comm. Northw. Atlant.
Fish. 1972, Res. Doc. No. 2, Serial No. 2681.
PINHORN, A. T., and R. WELLS. 1970. Catch/effort assessments for the major cod stocks in ICNAF Subareas 2 and 3.
Int. Comm. Northw. Atlant. Fish., Redbook 1970, Part III,
p. 65-74.
TEMPLEMAN, W. 1962. Division of cod stocks in the Northwest
Atlantic. Int. Comm. Northw. Atlant. Fish., Redbook
1962, Part III, p. 79-123.
WELLS, R., and A. T. PINHORN. 1970. Growth and mortality
changes in cod from ICNAF Subareas 2 and 3. Annu. Meet.
int. Comm. Northw. Atlant. Fish. 1970, Res. Doc. No. 88,
Serial No. 4239.
Short-Term Variations in Estimates of Chlorophyll Abundance
By John B. Colton, Jr.'
Abstract
Short-term variations in total chlorophyll and in the depth of maximum chlorophyll abundance were observed at a
drogue station located in an area characterized by a well-defined vertical temperature gradient and strong tidal currents.
These variations were associated with vertical oscillations of the thermoeline caused by internal waves.
Introduction
Results
From December 1964 to September 1966, a series
of quarterly environmental surveys were made of
Continental Shelf waters between Nova Scotia and
Long Island (Colton et al., 1968). As would be expected
in an area characterized by strong tidal and non-tidal
currents, marked spatial and temporal variations in
physical, chemical, and biological properties were observed. To assess more accurately the degree of this
variation and to establish confidence limits, time-series
observations were made at specific locations (anchor
stations) and in specific water masses (drogue stations)
when time permitted. It is the purpose of this paper to
illustrate the changes in chlorophyll abundance observed
within a given water mass during June 1966 and to
examine this variation in relation to hydrographic
conditions and sampling techniques.
Figure 2 shows the 2-hr time-depth distribution of
temperature and chlorophyll, the abundance of chlorophyll in mg/m2 of sea surface integrated over 100 m
(total chlorophyll), the average and range of temperature
and chlorophyll at the eight sampling depths, and the
average total chlorophyll for specific time intervals.
Methods
A bathythermograph lowering was made hourly
and a Nansen bottle cast at 2-hr intervals alongside a
buoy attached to a parachute drogue (Volkman et al.,
1956) set at 50-m depth. The 2-hr station location and
the track of the parachute drogue during the 46-hr
sampling period are shown in Fig. 1. The Nansen bottle
depths were 1, 10, 20, 30, 40, 50, 75, and 100 m.
Chlorophyll was determined by flouresence of extracts
of 125 ml sea water according to the method described
by Yentsch and Menzel (1963) with modifications given
by Yentsch (196.5). The specific absorption value (k)
used was 65.0 (Richards, 1952). A.G.K. Turner Model
110 fluormeter which had been calibrated against a
similar instrument at the Woods Hole Oceanographic
Institution was used for these determinations. MI
chlorophyll values were corrected for the presence of
phaeophytin.
A well-defined temperature discontinuity layer,
which continued to oscillate vertically, was present
throughout the sampling period. The average depth of
the thermocline was approximately 25 m and the
maximum vertical displacement of an individual
isotherm during a 2-hr period was 17 m. The vertical
displacement of the thermocline was reflected in the
range of temperature encountered at specific depths.
These ranges were greatest between 10 and 30 m.
Although tidal forces undoubtedly were instrumental in
generating these internal waves, turbulent forces due to
winds and bottom topography tended to mask the
semidiurnal periodicity in the vertical oscillations.
Hourly bathythermograph observations revealed the
presence of internal waves of a shorter period than
indicated by the 2-hr sampling interval.
At most stations the concentration of chlorophyll
was greatest at 30 m. The average "chlorophyll depth"
(determined by multiplying the concentration of chlorophyll by the depth sampled, summing the weighted
samples, and dividing by the total chlorophyll at all
depths) tended to oscillate as did the thermoeline, but to
a much lesser degree. The average chlorphyll depth for
all stations was 30 m and the maximum vertical
displacement during a 2-hr period was 9 m. The vertical
displacement of the depth of maximum chlorophyll
concentration was reflected in the range of chlorophyll
values observed at specific depths. These ranges were
greatest between 20 and 40 m.
' N ational Marine Fisheries Service, Northeast Fisheries Service, Woods Hole, Massachusetts 02543, USA.
82
1CNAE RESEARCH BULLETIN NUMBER 9, 1972
71°
70
0
69
0
68
0
0
67
66°
, I
1
„./
s
r
42°—
-
—42°
GEORGES BANK
CAPEJCOD'
N
e
®
„'
STAT ION
41 —
- 50 M
G6LmSZI
2 3
I
0
40°—
10 0
1000
71
—4 I
FINISH
0
00
M .`"
NAUT.
—40
0
MILES
M
1 0
69
68
O
67
0
1
666 °
Fig. 1. Drogue station location. (Insert illustrates drogue track during sampling period.)
There was a considerable variation in the total
chlorophyll (mg/m 2 ) values between the 2-hr sampling
periods, the ratio of maximum to minimum values being
2.8. As with the depth fluctuations of the thermocline,
there was no consistent pattern to the fluctuations in
total chlorophyll. The average day (0700-1900 hr) and
night (2100-0500 hr) values were similar. Maximum and
similar average values occurred between 0700 and 1100
hr and 2100 and 2300 hr. Minimum and similar
average values occurred between 0100 and 0500 hr and
1300 and 1900 hr. This is a significant departure from
prediction, for on the basis of the observations of
Yentsch and Ryther (1957), Shimada (1958), Yentsch
and Seagel (1958), and Wood and Corcoran (1966), one
would expect the maximum total chlorophyll values to
occur during the morning and early afternoon hours.
To determine if there was a relation between the
fluctuations in total chlorophyll values and the vertical
oscillations of the thermocline, a regression of the
difference in total chlorophyll between each 2-hr
sampling period on the depth change of the thermocline
in meters between corresponding 2-hr sampling periods
was calculated. The average depth of the 5°, 6°, and 7°
isotherms was used to estimate the thermocline depth.
There was a significant linear correlation between
thermocline depth and chlorophyll concentration
fluctuations (r = 446, t = 2.2835, with .03 < P < .1)5).
Discussion
The data indicate that the phytoplankton was
concentrated in a narrow stratum (or possibly strata)
within the thermocline, that this stratum oscillated
vertically with the thermocline, arid that the high values
of chlorophyll at specific depths or for the total water
•
COLTON:
83
ESTIMATES OF CHLOROPHYLL ABUNDANCE
s„„,
SUNRISE
7m/56
6/066
0300 0500 07000900 1100 1300 4500 1700 1900 2100 2000 0100 0000 0500 07000900 1100 1300 1500 1 20 0 1900 2100 2300 0100
TEMPERATURE, °C
2
4
6
8
10
- 12 - 0
7\1_
, -
--t-L5-5—
NGE
10:_-------—
ZrE3
tr
50
5-- AVERAGE
4°
TEMPERATURE, °C
j-100
100
CHLOROPHYLL mg/ m5
0
cc
50
2"...1.
H0 2
04
ce
02
0
14
3
-100
65
_J
60 >x
a.
40
NE 40
g
ce
ERASE
60
S-
0
50
02
1
CHLOROPHYLL, mg/m
100
>-
RANGE
g
J
20
20
E
E
0 0
0
Fig.
2.
Time and depth distribution
column occurred when the depth of this stratum
coincided with a sampling depth. Obviously some of the
variation in chlorophyll abundance observed resulted
from changes in the amount of phytoplankton due to
cell division and grazing and from changes in cellular
pigment content, but in the main this variation appears
to be associated with the vertical displacement of
isotherms. Similar internal wave patterns and marked
fluctuations in chlorophyll abundance were observed at
anchor stations, but at these stations lateral shifts in
water masses due to tidal currents tended to mask the
relation between vertical oscillations of the thermocline
and chlorophyll concentration fluctuations.
Marked vertical chlorophyll gradients and a relationship between the vertical distribution of phytoplankton and thermal density stratification have been
noted in other areas (Gessner 1948, Ilalldal 1953,
Sorokin 1960 and 1964, and Strickland 1968). Similar
short-period oscillations of the thermocline and of the
depth of maximum phytoplankton abundance have been
observed off the coast of California (Barham et al.,
1966). Conditions favorable to the development of
of
temperature and chlorophyll.
internal waves and for the concentration of phytoplankton within a narrow depth stratum (marked vertical
density gradient and strong tidal action) exist over most
of the Continental Shelf area between Cape Sable and
Long Island for at least 6 months of the year. In all our
observations where such hydrographic conditions prevailed, chlorophyll was concentrated within the thermocline, the maximum depth limit of which seldom
exceeded 40 m.
In any large scale sampling program, it would be
difficult. if not impossible, to eliminate the error in
chlorophyll estimates due to advection, but it would be
possible to reduce the error due to internal waves by
closer vertical spacing of samples within the thermocline.
As suggested by Strickland (1968), the use of a profiling
hose and the continuous in vivo fluorescence method of
chlorophyll concentration (Lorenzen 1966) would
provide the most adequate measure of the phytoplankton crop. For plankton-net estimations of associated
zooplankters oblique or vertical hauls would give a
better estimate of the abundance in the total water
column than horizontal tows at specific depth intervals.
84
ICNAF RESEARCH BULLETIN NUMBER 9, 1972
References
COLTON, J.B., Jr., R.R. MARAK, S.R. NICKERSON, and R.R.
STODDARD. 1968. Physical, chemical, and biological
observations on the Continental Shelf, Nova Scotia to Long
Island, 1964-1966. U.S. Fish and WildL Seru., Data Rept.,
23: 190 p.
BARHAM, R.G., J.W. WILTON, and M.P. SULLIVAN. 1966.
Plankton and turbidity. N.E.L. San Diego, Calif. Research
and Development Rept., 1386: 81 p.
GESSNER, F. 1948. The vertical distribution of phytoplankton
and the thermocline. Ecology, 29: 386-389.
HA LLDAL , R. 1953. Phytoplankton investigations from
Weathership M in the Norwegian Sea. Ilvalrild. Skr., 38:
1-91.
LORENZEN, C. J. 1966. A method for continuous measurement
of in 'duo chlorophyll concentration. Deep-Sea Res., 14:
381-389.
RICHARDS, F.A. 1952. The estimation and characterization of
plankton populations by pigment analysis. I. The absorption spectra of some pigments in diatoms, dinoflagellates,
and brown algae. J. Mar. Res., 11: 147-155.
SHIMADA, B.A. 1958. Diurnal fluctuations in photosynthetic
rate and chlorophyll content from Eastern Pacific waters.
Limnol. & Oceanog., 3: 336-339.
SOROKIN, J.I. 1960. Vertical distribution of phytoplankton
and the primary organic production in the sea. J. Cons., 26:
49-56.
1964. On the primary production and bacterial activities
in the Black Sea. Ibid., 29: 41-60.
STRICKLAND, J.D.H. 1968. A comparison of profiles of
nutrient and chlorophyll concentrations taken from discrete depths by continuous recording. Linsnol.& Oceanog.,
8: 388-391.
VOLKMAN, G., J. KNAUSS, and A. VINE. 1956. The use of
parachute drogues in the measurement of subsurface ocean
currents. Trans. Amer. geophys. Un., 37: 573-577.
WOOD, EJ.F. and E.F. CORCORAN. 1966. Diurnal variation in
phytoplankton. Bull. Mar. Scb, 16: 383-403.
YENTSCH, CS., 1965. Distribution of chlorophyll and phaeophytin in the open ocean. Deep-Sea Res., 12: 653-666.
YENTSCH, C.S. and D.W. MENZEL. 1963. A method for the
determination of phytoplankton chlorophyll and phaeophytin by fluorescence. Deep-Sea Res., 10: 221-231.
YENTSCH, C.S. and J.H. RYTHER. 1957. Short-term variations
in phytoplankton and their significance. Limnol. &
Oceanog., 2: 140-142.
YENTSCH, C.S. and R.F. SCAGEL. 1958. Diurnal study of
phytoplankton pigments; and in situ study in East Sound,
Washington, J. Mar. Res., 17: 567-583.
Biology of Scotian Shelf Cusk,
Brosme brosme
By W. S. Oldham' '2
Abstract
Observations on the biology of cusk from the Scotian Shelf region, based on sampling from the summers of 1963,
1964, and 1965 in the Lockeport, Nova Scotia area, are presented. Landing statistics are used as an indicator of cusk
distribution and show an increasing abundance of fish from ICNAF Division 4V through Division 4W and a predominance
of cusk in Division 4X. Cusk are generally found on a rough, rocky bottom, preferring waters at a minimum of 4°C.
Data were gathered from approximately 3,000 commercial specimens from which growth, maturation, reproduction,
length-weight relationships, and fecundity are examined.
An analysis of otolith edge types is presented as evidence for the validity of the otolith method of age determination.
Analysis of the age-length data revealed that male and female cask do not differ in their rate of growth.
Commercially caught cusk from Inshore Grounds are significantly smaller than those from the LaHave Region. There
appears to be no difference in Inshore males and females but LaHave females are smaller than LaHave males.
The length-eviscerated weight equation for females was significantly different from length-weight equations for
round females and round and eviscerated males.
In 1964, males were 50% mature at 43.5 cm (age-group 5) and females were 50% mature at 50.7 cm (age-group 7).
The 1964-spawning period lasted over the whole summer but peak spawning occurred towards the end of June.
Fecundity estimates made on 119 mature cusk ranged from 100,000 to 3,927,000 eggs per female. Fecundity
depended mainly on body length and, to a lesser extent, on age.
Introduction
Methods and Materials
The tusk, Brosme brosme (Muller), is a demersal
gadoid inhabiting Atlantic subarctic and boreal waters.
Along the North American coast, it is found from the
Newfoundland Grand Banks in the north to Cape Cod in
the south, with its centre of abundance on the Scotian
Shelf.
An estimate of rusk distribution in the ICNAF
Convention Area was gained by examining landing
statistics (ICNAF Statistical Bulletins, 1956-72).
Little is known about the life history of rusk. With
the exception of generalized accounts in Bigelow and
Schroeder (1953) and Leim and Scott (1966), North
American authors have discussed only its morphology
and distribution (Huntsman, 1922; Jordan and Evermann, 1898; Perlmutter, 1961). Other aspects of its
biology have not been described.
With primary commericial species declining in
number, the rusk of the Northwest Atlantic represents a
fish stock of increasing economic potential. This initial
exploration of rusk biology is preliminary to a sound
assessment of the fishery.
The Lockeport, Nova Scotia area was selected as
the centre of the sampling program because of the large
proportion of round cusk landed there throughout the
year. Cusk landed at Lockeport are taken generally from
Div. 4X. Longline vessels fishing in Div. 4X used gear
composed of a 16 lb. nylon groundline and 4 lb. cotton
gangings. The hooks used were Mustad No. 15 or No. 16
or Pfleuger 6/0. The only specimens examined were
those captured in this area by this type of gear.
Sampling involved a random selection of some
300400 lb. of fish as a vessel was being unloaded.
Commercial catches, however, did not include a representation of all sizes within the stock. Although
fishermen did not cull, the smallest fish landed were 35
cm long. Presumably, fish smaller than this were not
vulnerable to the gear.
' Fisheries Research Board of Canada, Biological Station, St. Andrews, New Brunswick.
'Present address: Oakridge Secondary School, 1040 Oxford Street West, London 74, Ontario, Canada.
86
ICNAF RESEARCH BULLETIN NUMBER 9, 1972
Cusk are landed at I,ockeport in the round
condition. The following information was recorded
(weights by spring balance to nearest 1/10 kg):
Sex and maturity. Sex was established by gonad
examination. The gonads of each fish were placed in one
of six classifications of maturity. The criteria used for
the classification are similar to those used by Powles
(1958) for cod and are shown in Table 1.
Total length. The length to the nearest centimetre
from the maxillary symphysis to the distal end of the
longest caudal fin ray.
Cusk otoliths exhibited markings similar to cod
and haddock otoliths and, upon successful validation,
were used for ageing. Initially, the otoliths were kept dry
but were too opaque to distinguish zonation. When
placed in a 50% glycerin in water solution, they cleared
Round weight. Weight of the whole fish.
Eviscerated weight. Weight of fish after removal of
viscera and gonads but with gills left in.
TABLE 1. Definition of the sexual stages of rusk.
Female
Male
Immature
Ovaries are light orange and very small. Membrane is thin and
transparent. Eggs are microscopic.
Testes appear as thin, narrow, transparent ribbons.
Ripening
Ovaries are enlarged to about twice their previous volume.
Colour is a bright orange with opaque eggs now clearly visible.
Testes are larger and distended into small lobules and convolutions. Colour is whitish with red blood vessels running over
the surface. No milt runs when pressure is exerted on the testis.
Ripe
Ovaries are much enlarged and swollen. Colour is reddish-orange
due to vascularization. Opaque eggs still prevail but clusters of
transparent eggs are appearing. Pressure causes some extrusion of
eggs.
Testes are more distinctly wavy and the lobules have become
larger. Only a small amount of milt may be obtained by pressure.
Spawning
Nearly all eggs arc transparent. Eggs run freely on slightest
pressure to jelly-like ovary.
Testes are densely white and fully distended. Milt runs on
slightest pressure.
Spent
Ovaries are soft, flabby and purple in colour. Few residual eggs
remain. Membrane begins to thicken.
Testes are red and shrunken, lying loose in the body cavity.
Sperm duct is large and prominent.
Recovering
Ovaries begin to turn orange again. Membrane is thick and
whitish. Eggs are not visible.
Testes are reduced to flat white ribbons. Appears similar to
ripening but without the lobules and convolutions.
OLDHAM: BIOLOGY OF SCOTIAN SHELF CUSK
sufficiently to reveal translucent and opaque rings (Fig.
1). Subsequently, all otoliths were preserved in glycerin
solution as they were removed from the fish. Approximately 1,400 otolith pairs were used in age determinations.
Otoliths were read intact with convex side up.
They were placed on a black watch glass, covered with a
87
few drops of 50% glycerin solution and read under
reflected blue light with a 9X binocular microscope.
Each otolith of each pair was read without prior
reference to length, sex, or date of capture of the fish.
Detection of an annulus was sometimes made difficult
by the presence of "false checks". This difficulty was
overcome by using the "ring spacing" technique of
Kohler (1964). Each fish was assigned to an age-group
Fig. 1. Otoliths from cusk of different ages showing the two types of edge deposition. A. age-group 5, hyaline edge; B. age-group IL
hyaline edge; C. age-group 6, opaque edge; D. age-group 8, opaque edge.
after obtaining a consistent reading of each otolith of a
pair.
In late May 1965, lengths, otoliths, and ovaries
were obtained from 119 female cusk in the late ripening
condition. In this stage the opaque maturing eggs were
easily separated from the minute unyolked eggs of
future generations. Also, the ovaries contained no ripe
transparent eggs, thus ensuring that spawning had not
already begun.
Preparation of ovaries and eggs for fecundity
estimates followed the methods of Simpson (1951) and
Fowles (1958). Egg number of individual fish was
estimated gravimetrically. Total mass of dried eggs was
weighed on an analytical balance accurate to 0.0001 g.
Three samples, each of 200 randomly selected eggs, were
then weighed separately, mean weight of 200 eggs was
calculated and total estimated fecundity determined. All
fecundity estimates were rounded off to the nearest
thousand eggs and these figures were logarithmically
transformed for the analyses.
88
1CNAF RESEARCH BULLETIN NUMBER 9, 1972
cusk landed are captured by long-line, reflects the
preference of cusk for a rough, rocky bottom where
they are not vulnerable to trawl gear.
Distribution
From total cusk landings for ICNAF Subareas in
the years 1954-70, taken by all gears and vessels (Table
2), it is clear that most cusk are taken from Subarea 4.
Within that Subarea, largest landings and probably the
greatest stock occur in Div. 4X (Table 3 and Fig. 2).
The principal fishing areas also coincide with
regions having a minimum bottom temperature of about
4°C. The Roseway, LaHave and "toe" of Browns Banks
in Div. 4X show high cusk concentrations and have
year-round bottom temperatures of 4°C and above. Cusk
are less abundant in Div. 4W but are taken from Emerald
Bank and deeper water off the edge of the Shelf, where
year-round bottom temperatures are above 4°C. Cusk
captured in Division 4V come from the Banquereau
Region where temperatures are favourable. No tusk are
It may at first be thought that these landings are
influenced by the large long-line fleet which concentrates in southwest Nova Scotia. However, research
vessel trawl surveys on the Scotian Shelf show that cusk
arc most abundant in Div. 4X (Scott, 1971). That most
TABLE 2. Total tusk landings from the ICNAF Convention Area, 1954-70 (metric tons).
Year
1
1954
1955
1956
1957
1958
1959
1960
1961
1962
1963
1964
1965
1966
1967
1968
1969
1970
17
16
26
18
15
4
31
259
393
225
413
230
204
158
61
119
5
Subarea
3
2
3
10
3
37
32
87
15
24
42
15
11
20
34
208
483
4
4
1
27
4
5
Total
94
1,018
1,407
1,240
1,537
2,253
2,762
3,302
3,695
1,909
4,368
4,635
4,997
4,630
3,154
2,735
3,220
835
942
901
707
683
910
768
726
793
782
945
1,112
1,973
2,362
1,661
1,168
1,365
946
1,976
2,337
1,975
2,238
3,204
3,593
4,374
4,896
2,940
5,772
5,996
7,186
7,170
4,910
4,257
5,073
TA BLE 3. Total cusk landings by Division of Subarea 4 (metric tons).
Year
Div.
4R
4S
4T
4Vn
4Vs
4W
4X
1961
1962
1963
1964
1
4
11
481
3,199
9
1
8
257
1,634
4
3
7
12
236
3,040
6
8
255
4,098
1965
]966
1967
1968
1969
1970
2
1
1
19
669
3,945
1
43
601
4,352
2
31
497
4,102
29
505
2,620
24
335
2,376
15
378
2,822
89
OLDHAM: BIOLOGY OF SCOTIAN SHELF CUSK
66°
64°
60°
62°
58°
4R
0.01°
48°—
/
,Newfoundland —
New
Brunswick
46°—
4016:
-4aoso
Ground
44°
---"
o —Vj •
7Conquereau
11.5 °F:
ok.
Wesiern
8 .871
Bk15!9%.Oe/Rpseway Emerald
sat-°C
%651 Skr
Gulf of ., Sable
g/g Hove V
Is:
Maine
the
r2illlela Have
4W
i. o vas 8k
Fig. 2. Percent landings of Subarea 4 by Division averaged for the years 1961-70. Positions of
mentioned in the text are also indicated.
taken from Canso or Misaine Banks where the bottom
temperature is colder, ranging from 0° to 3°C (McLellan,
1954).
The Bay of Fundy portion of Div. 4X has well
mixed waters with a normal bottom temperature range
from less than 2°C in March to above 10°C in October
(McLellan, 1954). Cusk are only found in the deep water
of the Bay's mouth where temperatures are more stable.
That tusk has a preference for warmer water is
further supported very generally by the higher landings
in Subareas 5 and 1 than in Subareas 2 and 3, where
temperatures are strongly influenced by the cold
Labrador Current.
Nl
0.6%
4V
places and banks
Age and Growth
Age validation
Determining age from otoliths depends on the
presence of zones of modified appearance brought about
by seasonal changes in the growth pattern. If one hyaline
(translucent) and one opaque zone are deposited on the
otolith each year, then this pattern may be considered to
represent 1 year's growth. Some evidence must be
provided indicating that the otolith method is a valid
means of ageing the species under study.
Graham (1929) and Saetersdal (1953) point out
that seasonal change is good evidence that the method is
90
ICNAF RESEARCH BULLETIN NUMBER
valid if turnover from one marginal type to the other is
sharply defined during the year. Figure 3 shows the
frequencies of opaque and hyaline edges for months in
which samples were taken. Only fish 9 years old and
under were used because, in older fish, peripheral
crowding of zones made margin interpretation difficult.
Opaque edges predominated from June to October,
hyaline edges from November to May. Samples are
lacking from December to March but, from the trend in
Fig. 3, the time of lowest opaque edge percentage is
probably in January or February. This annual rhythmicity of edge type validates age determination from
cusk otoliths.
9, 1972
data quite precisely for the age arid size range available
from these samples. The regression data produced the
following equations:
Males
Females
y = 20.37 f 4.76x (Fig. 4)
y = 25.11 4.03x (Fig. 4)
Slopes of the female and male regressions did not differ
significantly (P > 0.05) and it appears that rates of
growth of male and female cusk do not differ
significantly. The male mean length is greater than the
female mean length for most age-groups but the
intercepts of the two lines are not significantly different.
TABLE 4. Mean lengths (cm) of successive age-groups
4X commercially captured cusk in 1964.
(79)
of Div.
11021
Males
Age-
Hyaline
Edge
Opaque
Edge
4
5
6
7
a
Fig. 3. Seasonal changes in otolith edges of cusk less than 9
years old. Numbers of fish in parentheses.
Zonation on otoliths of North Atlantic gadids has
been shown to be related to periods of rapid and slow
growth. }tickling (1933) demonstrated that time of
hyaline zone formation on the hake otolith in autumn
coincided with the period of slow growth. Saetersdal
(1953) found a similar phenomenon in haddock. In
cusk, otolith zonation fits this general pattern, suggesting rapid growth from June to November, slower
growth in winter and spring.
Growth in length
Study of cusk growth is somewhat complicated by
the bias of gear selectivity. Fish under 35 cm were not
captured and this selection eliminates most fish up to 6
years of age. Mean lengths of age-groups 4, 5, 6, and 7
(Table 4) are too high since the larger fish in these
age-groups were the only ones taken.
Plotting these data showed that the von Bertalanffy (1938) growth curve could not be applied. It
appeared that the best possible fit for the points would
be a straight line. Regression lines were fitted by the
methods of least squares and equations were calculated.
The high correlation coefficients (r = 0.99 for males and
0.98 for females) indicate that a straight line fits the
Females
group
9
10
11
12
13
14
ml
7
36
72
77
53
31
9
5
1
1
45.00
49.36
58.83
57.78
63.30
69.19
72.00
72.20
(94.00)
(95.00)
1
3
31
65
73
54
26
14
5
1
(44.00)
45.30
47.61
52.72
58.71
61.94
64.88
68.86
69.20
(72.00)
It is unlikely that cusk grow in linear fashion
throughout their lives. Larger numbers of fish, especially
in the older age-groups where there are very few
individuals, and compensation for the straightening
effect of gear selectivity in young fish, would almost
certainly alter the shape of the curve to a more typical
form. Absence of old fish from the present study might
be due to migration of these fish from the inner banks
(the present study area) to deep water on the
continental slope or to inefficiency of the gear used (i.e.
small hooks) in capturing large old fish.
Length frequencies
Samples from the Inshore Grounds of Div. 4X
(Fig. 1) were shown by Student's t test to he
significantly different (P < 0.05) from I,allave Bank
samples in length frequencies. The differences are shown
graphically in Fig. 5. A difference existed for both sexes
with inshore samples having a higher percentage of small
fish in each case. The polymodal character of the inshore
length frequency plot is probably due to the small
number of individuals composing each length grouping.
91
OLDHAM: BIOLOGY OF SCOTIAN SHELF CUSK
100
0
0
90
Males
80
0 0 a
70
• a'
A
AK
E
Females
60
_°;) 50
40
30
20 -
0
II
I
2
4
I
6
8
Age-Group
I
I
I
10
12
14
Fig. 4. Growth curves of LaHave and inshore cusk (1964). Circles, males; triangles, females; open
symbols represent less than 10 fish in an age-group.
composition of both sexes were compared for
of the two regions sampled. No significant
difference was found in the size of inshore male and
female cusk. However, a significant difference (P < 0.05)
was discovered in the size composition of LaHave males
and females. Although males do not grow longer than
females, the higher mode of male fish — 64 cm against
61 cm for the females — and the fact that there is a
Size
each
greater percentage of males among the larger fish would
account for males being significantly larger. This could
indicate a better survival of male fish.
The relatively high percentage of small fish taken
from the Inshore Grounds is probably related to the
rocky ledge that occurs inside the 50-fathom contour,
from east of Halifax to west of Cape Sable Island
92
ICNAF RESEARCH BULLETIN NUMBER 9, 1972
24
Males
.A•
Inshore
(80 Fish)-------/\
16
• .d.
Zfr>S 41,-.
......•.
•
N. a
/
..
-"*"•
..o•
\
.0-- ...--..3--
C
CD
I-
Have
--tkr5o
X1500 Fish)
%
1:‘
N -"33/4-...,
Ito
LL
—
24
C.)
CD
0-
16
8
0
34
40
46
52
58
Length
64
in Cm
70
76
82
88
94
Groups
Fig. 5. Length composition of male and female cusk in commercial catches from inshore and LaHave grounds in 1963 and
1964.
transecting Div. 4X in the region of Inshore Grounds
(Fig. 2). Hachey (1961) states that the general circulaLion pattern on the Scotian Shelf is anti-clockwise with a
predominantly southwesterly drift along the coast of
Nova Scotia. Since cusk inhabit rocky-bottomed areas, it
seems reasonable that the prevailing currents might carry
the young fry into this area from offshore, where they
would encounter a rough bottom on which to begin
their growth. The high percentage of small fish suggests
that they remain here until they are roughly 50-60 cm in
length. Perhaps, at that time, a migration occurs which
takes them into deeper water of the outer banks and
shelf where they complete their growth. Scott (1971),
on analyzing research trawler data accumulated from
1958 to 1968, found that cusk in Div. 4X were far more
numerous in depths of 50-149 fathoms than in water
under 50 fathoms. Length frequencies for these fish,
however, are unknown.
Length-Weight Relationship
The length-weight relationship in fishes is usually
described by the equation
w= aL6
where W is the weight of the fish (either round or
eviscerated) and L its length. Linearly transformed this
becomes
log W = log a b log L
93
OLDHAM: BIOLOGY OF SCOTIAN SHELF CUSK
where b represents the slope of the line and log
intercept.
its
a
To compensate for the "condition" factor as
described by Kohler (1960) for haddock, all fish
sampled from May to August of 1963 and 1964 were
pooled by sex. Mean weights, both round and eviscerated, were calculated for each centimetre length
Males
10
8
6
Eviscerated
Round
Weight
Weight
7
group. This way, an average condition factor would be
obtained since the sampling would include fish in all
stages of maturity. The pooled plots of length and
weight on double logarithmic paper indicated linear
regression in each of the four cases (Fig. 6). Regression
lines were fitted to the plots by the method of weighted
least squares and equations calculated.
It was found that the length-weight relationship of
commercially caught cusk can best be represented by the
following equations:
log W = 5.0654 + 2.974 log L
Male Eviscerated
log W = 6.9918 + 3.025 log L
Male Round
Female Eviscerated log W = 5.4302 + 2.746 log L
Female Round
log W = 5.0270 + 3.000 log L
;
4
The b value for eviscerated females is significantly
different from any other b value and is probably due to
anisometric growth of ovaries.
7
2
Reproduction
I
I
Age and length at maturity
-- 0.8
I
I
1.1.1
1
1
Females
3
10:
8
Eviscerated
Weight
Round
Weight
O
Classification of mature and immature fish of both
sexes, in each age-group for a total of 954 fish, was
carried out in 1964. Mature fish include those in any
stage from Ripening to Recovering (Table 1). Some male
fish were mature by age 5 and all were mature by age 10
(Fig. 7). The youngest mature female rusk were in
age-group 6 and by 10 years all were mature.
.0
ad
Mature
100
aP
4—
50
152)
(64)
(31)
(71
I
(30)
2
4 0
A
Males
Females
1
50
0.8
I.
40
i
1.1.
60
Immature
1. i1
80 100
40
60 80 100
Length (cm)
Fig. 6. Length-weight relationship of male and female cusk,
1963 and 1964 data pooled by sex.
100
5
Fig.
6
7
8
Age -Group
9
10
7. Age at maturity of cusk sampled in 1964.
94
ICNAF RESEARCH BULLETIN NUMBER 9, 1972
The age at which 50% of males and females are
sexually mature was determined using the LD 50 method
as modified by Fleming (1960). It was calculated that
50% of male cusk were mature at 4.7 years while 50% of
females were mature at 6.5 years, a significantly older
age (P < 0.05).
A probit analysis of length at maturity (Fig. 8)
showed that 50% of males were mature at 43.5 cm and
50% of females at 50.7 cm. The calculated age and size
at 50% maturity may be slightly higher than naturally
occurring because of the bias of gear selectivity to largest
5-, 6-, and 7-year-old fish.
100
/
/
,A
•
4
4
4
AAA
•
4
A
A
/
75
Males-
/
A
;—Females
a
-e-
50
CD
A
0
6-
CD
CL
25
Ail
A
0
?
34
A
'9'
40
46
52
58
Length
in
Cm Groups
64
70
Fig. 8. Length at maturity of cusk sampled in 1964. Circles — males; triangles — females; open
symbols — represent less than 10 fish.
95
OLDHAM: BIOLOGY OF SCOTIAN SHELF CUSK
Spawning
In determining spawning period, it is logical that
this interval would be preceded by a high percentage of
maturing fish and would be followed by a large number
of spent fish. In both males and females, the highest
percentage of ripe-spawning individuals occurred towards the end of June (Fig. 9). Ripening individuals
were most common before this period and spentrecovering fish after it, indicating that most spawning in
1964 was accomplished during the last two weeks of
June. However, some spawning took place throughout
the sampling period of May to August.
50
Immature
25
0
M--t En
75
Ripening
Males
Females
over the whole of Div. 4X. Fish in the ripe and spawning
condition were taken from most areas sampled, but
usually in depths less than 100 fathoms.
Fecundity
Statistical methods
Fecundity was investigated in relation to length
and age. All data used were transformed to their
logarithmic forms for two reasons. First, the investigation of fecundity involves a relationship between body
size and egg number. 'This implies application of the
general growth equation
.11
Y aXb
where X represents body size and Y a dependent
variable. For convenience, this equation can be reduced
from its exponential to linear form by taking the
common logarithm of both sides of the equation in
which case it becomes
50
° 25
log Y = b log X log a
a- 25
0
75
Ripe - Spawning
NH
_Fl
111
Spent - Recovering
50
0
=El
16 - 31
May
Males 104
Females 123
Results and conclusions
Ii
25
1-15
16-30
June
59
42
Secondly, in regression analyses, variance must be
independent of the mean. In growth and form relationships, variance is positively correlated with size. By
converting the data to logarithmic form, this relationship
is eliminated.
1-15
Aug
191
53
138
66
32
Number Examined
68
48
52
Fig. 9. Cask maturity cycle, summer of 1964.
The low percentage of ripe and spawning individuals is probably caused by the same factors Kohler
(1960) suggested in explaining a similar occurrence in
haddock. These two stages occupy a relatively short
period in the cycle, reducing the chance of catching
haddock or cusk in this condition. Also in haddock and
possibly cusk, a large proportion cease feeding as
spawning time approaches, making them less available to
the hook and line fishery.
The present study indicated that there were no
discrete cusk spawning grounds and spawning occurred
Fecundity (F) vs length (L) showed a linear trend
on a log-log plot (Fig. 10A). Fitting a least squares
straight line to the data produced the relationship
log F = 3.64 log L — 0.74
The correlation coefficient 0.8211 is significantly different from zero (P < 0.005).
Similar treatment of fecundity vs age (A) data
(Fig. 10B) gave the equation
log F = 3.09 log A + 2.91
The correlation coefficient for this relation (r = 0.6924)
is also significantly different from zero (P < 0.005).
That fecundity is related more to length than age
is reflected not only by the higher r-value but also the
lesser variation (Fig. 10). However, since length is related
to age, a multiple correlation was used to analyze the
contribution of each to fecundity variation. The partial
96
ICNAF RESEARCH BULLETIN NUMBER 9, 1972
correlation coefficient for fecundity on length was
0.6133, whereas the corresponding figure for fecundity
4—
on age was very small, 0.0781. The multiple correlation
coefficient was 0.8218.
_
.
A
3
•
•
••_
„„. •
•
2
0
0
•
•
0
0
0
0 410 0
0
0
0
o
0
441.
•S et ••
o 8
• ••• ••
• •
et• •
••
• •
•
t
• •• •
1
la!
41-
•
o
0
ce•
.6
N
C
O
•
0
0
0
•
r
•• e:
V•
4
0
•
•
•
0
4c
-
•
° c8
0 8
§ 100
0
0
0 000
0 00 0
0
0
%8 0
0#0
0
0
o
o
O
o o0 o
oo
0 0, 8
•
•
.3
0
0
8
8
0
Q
u
0
0
0
.2
•
0
•
•
.1
40
I
I •1
60
80 100
Length (cm )
0
0
0
I
6
o
I
Iii
8
10 12
Age-Group
Fig. 10. Scatter diagrams of cusk fecundity plotted (A) against length, (B) against age.
OLDHAM: BIOLOGY OF SCOTIAN SHELF CUSK
From these results it appears that in cusk the
closest correlation is between fecundity and length, and
that a consideration of age adds little to the predictive
value of the relationship. The fecundity-length regression
coefficient of 3.64 indicates that cusk fecundity is
approximately proportional to the cube of the length.
This value is comparable to those found for many
species including North Sea plaice (Simpson, 1951),
American plaice (Pitt, 1964), and Atlantic cod (May,
1967).
Although the effect of age on fecundity is small, it
can be demonstrated by calculating regression equations
from the length vs fecundity data of each age-group:
Age-group 7 (m=11) log Y = 3.840 log X — 1.085
Age-group 8 (m=23) log Y = 4.211 log X — 1.810
Age-group 9 (n=25) log Y = 3.770 log X — 0.963
Age-group 10 (n=21) log Y = 3.371 log X — 0.223
Age-group 11 (n=26) log Y = 2.493 kg X + 1.479
Age-group 12 (n=13) log Y = 1.441 log X + 3.379
With the exception of age-group 7, the regression
coefficients show a decreasing progression. It can be
concluded that in younger fish, fecundity increases at a
more rapid rate with length than it does in older fish.
This feature has been found by Raitt (1933) for
haddock and Ilickling (1940) for herring.
Discussion
There is very little information in the literature on
the biology of cusk, Brosme brosme. The few scattered
observations which have been made are well summarized
in Wheeler (1969) for European waters and Bigelow and
Schroeder (1953) for the Northwest Atlantic. The
present study indicates that eusk of the Northwest
Atlantic inhabit rough, rocky bottoms and are restricted
in distribution by water less than 4°C. Bigelow and
Schroeder (1953) state that cusk of the Gulf of Maine
are found chiefly on hard ground composed of rocks,
gravel, or pebbles and may possibly be found among
offshore gorgonian corals as they are in Norwegian
waters. They say that cusk spend their lives in water
between 48° to 50°F (9° to 10°C) and 33° to 34°F
(0.5° to 1.1°C). Present data indicate cusk are taken in
areas where temperatures reach 9°C. However, it seems
reasonable that if cusk can tolerate cold waters at 1°C,
they should be found on hard-bottomed regions to the
northeast of the Scotian Shelf.
Most cusk on the Scotian Shelf are taken from
depths of between 50-150 fathoms with a few being
captured from depths of over 200 fathoms (Scott,
1971). The greatest depth from which cusk are taken in
97
the Northwest Atlantic is in accordance with the
200-300 fathoms reported by Bigelow and Schroeder. In
European waters, cusk (torsk) appear to be most
common in depths of 82-246 fathoms but are taken as
deep as 546 fathoms (Wheeler, 1969).
Growth in length of European cusk differs
markedly from growth of cusk from Div. 4X. Commercially captured cusk from European waters most
frequently range between 45 and 60 cm and are between
10 and 12 years old. The majority of eusk landed by
Canadian fishermen are 45-75 cm in length and 5-12
years of age. European cusk grow from an average of 22
cm at age 6 to between 36 and 48 em at age 8.
Comparatively, the mean length of Div. 4X cusk was 49
cm at age 6 and 58 cm at age 8. Wheeler gives maximum
length of Northeast Atlantic cusk to be 110 cm. The
largest eusk sampled by the author was 97 em although
Bigelow and Schroeder state cusk grow to 3Y2 ft (107
em).
Although ripe fish were discovered from May to
August, spawning occurs in the majority of eusk towards
the end of June. Damas (1909) reported that the
spawning season for European cusk lasts from the end of
April to July while Bigelow and Schroeder (1953) stated
that the situation is similar for Gulf of Maine cusk. It
appears that a lengthy spawning season is consistent for
cusk throughout its range.
In the present study there appeared to be no
aggregation of spawning cusk in any one region of Div.
4X. Ripe fish were evenly distributed over the principal
fishing areas in depths less than 100 fathoms. European
cusk, on the other hand, also spawn maximally at depths
of approximately 100 fathoms but appear to have
principal spawning areas (Damas, 1909; Wheeler, 1969).
Wheeler also says cusk may spawn over most of its entire
range. The evidence for discrete spawning grounds off
Europe may simply be a manifestation of cusk abundance in these areas.
Study of fecundity indicated cusk to be reasonably prolific. Fulton (1891), in a fecundity study of
several marine species including cusk, estimated the
fecundities of two 34-inch (86 em) eusk to be 2,283,979
and 790,064. These values compare with the fecundity
range of 86 cm fish of the present study. Egg number for
Scotian Shelf eusk varied from 100,000 for a 7 year old,
56 cm specimen to 3,927,000 for an 11 year old, 90 cm
fish.
Acknowledgments
I thank the Fisheries Research Board of Canada,
St. Andrews, New Brunswick, and Acting Director Dr F.
98
ICNAF RESEARCH BULLETIN NUMBER 9, 1972
D. McCracken, for extending to me full use of station
facilities in the preparation of this paper.
I am especially grateful to Dr R. G. Halliday whose
constructive criticisms and assistance were valued
throughout the preparation of the manuscript. Suggestions for improvement of draft copies were provided
by Dr J. S. Scott, Dr A. C. Kohler and Dr McCracken.
References
BERTALANEFY, 1.. VON. 1938. A quantitative theory of
organic growth. Hum, Biol., 10(2): 181-213.
BIGELOW, H. B., and W. C. SCHROEDER. 1953. Fishes of the
Gulf of Maine. (First Revision). Fish. Bull., U.S., 53: 577 p.
DAM AS, D. 1909. Contribution a la biologie des Gadides. Rapp.
Cons. Expl. Mer, 10(3): 277 p.
FLEMING, A. M. 1960. Age, growth and sexual maturity of cod
(Gadus morhua L.) in the Newfoundland area, 1947-1950.
J. Fish. Res. Bd. Canada, 17: 775-809.
FULTON, T. W. 1891. The comparative fecundity of sea fishes.
Rept. Fish. Bd. Scot. (1890), Part 3, p. 243-268.
GRAHAM, M. 1929. Studies of age determination in fish. Part
II. A survey of the literature. Fish. Invest., Lond. (2), 11:
50 p.
HACHEY, II. B. 1961. Oceanography and Canadian Atlantic
waters. Bull. Fish. Res. Bd. Canada, No. 134, 120 p.
HICKLING, C. F. 1933. The natural history of the hake. Part
IV, Age-determination and the growth-rate. Fish. Invest.,
Lond. (2) 13: 120 p.
1940. The fecundity of the herring of the southern
North Sea. J. mar. biol. Ass. U.K., 24: 619-632.
HUNTSMAN, A. G. 1922. The fishes of the Bay of Fundy.
Contr. Can. Biol. for 1921, No. 3, p. 49-72.
JORDAN, D. S., and B. W. EVERMANN. 1898. The fishes of
North and Middle America. Bull. U.S. nat. Mutt, 47(3):
2561 p.
KOHLER, A. C. 1960. The growth, length-weight relationship,
and maturity of haddock (Melanogrammus aeglefInus L.)
from the region of Lockeport, N.S. J. Fish. Res. Bd.
Canada, 17: 41-60.
1964. Variations in the growth of Atlantic cod (Gradus
morhua L.). Mid, 21: 57-100.
LE1M, A. H., and W. B. SCOTT. 1966. Fishes of the Atlantic
coast of Canada. Bull. Fish. Res. Bd. Canada, No. 155, 485
MAY, A. W. 1967. Fecundity of Atlantic cod. J. Fish. Res. Bd.
Canada, 24: 1531-1551.
MCLELLAN, H. J. 1954. Bottom temperatures on the Scotian
Shelf. J. Fish. Res. Bd. Canada, 11: 404-418.
PERLMUTTER, A. 1961. Guide to marine fishes. New York
University Press.
PITT, T. K. 1964. Fecundity of the American plaice, Hippoglossoides platessoides (F abr.) from Grand Bank and
Newfoundland areas. J. Fish. Res. Bd. Canada, 21(3):
597-612.
POWLES, P. M. 1958. Studies of reproduction and feeding of
Atlantic cod (Gadus eallerias L.) in the southwestern Gulf
of St. Lawrence. J. Fish. Res. Bd. Canada, 15: 1383-1402.
RAITT, D. S. 1933. The fecundity of the haddock. Fish. Bd.
Scot., Set Invest., 1932, No. 1, p. 1-42.
SAETERSDAL, G. S. 1953. The haddock in Norwegian waters.
Norweg. Fish. Mar. Invest., 10: 46 p.
SCOTT, .1. S. 1971. Abundances of groundfishes on the Scotian
Shelf. Fish. Res. Rd. Canada, Tech. Rept. No. 260, 8 p. + 2
figures and 8 tables.
SIMPSON, A. C. 1951. The fecundity of the plaice. Fish. Invest.,
Lond. (2), 17: 1-27.
WHEELER, A. 1969. The fishes of the British Isles and
North-West Europe. MacMillan, London, Melbourne, Toronto. 613 p.
The Fecundity of Herring in Some Parts
of the Newfoundland Area
By V. M. Hodder'
Abstract
The fecundity of herring in Newfoundland coastal waters was investigated from 278 ovaries collected in four
different areas during January to August 1966. It was found that fecundity increased at a rate proportional to the 4.5
power of total length and to the 1.5 power of body weight, the correlation in both cases being quite similar. The egg
production of spring spawners in three herring stocks of southern Newfoundland was about the same but it was
considerably lower than that for autumn spawners of eastern Newfoundland, the latter being similar to values reported for
Georges Bank, Gulf of Maine, and Southwest Nova Scotia autumn spawners. The differences in fecundity between spring
and autumn spawners are discussed in relation to the very different environmental conditions existing during several
months immediately preceding the spawning periods of spring and autumn spawners, conditions which are probably critical
during the development and maturation of the ova.
Introduction
During the past decade, following the recent
upsurge in exploitation of the herring stocks of the
Northwest Atlantic (from Labrador southward to Cape
Cod), much information has been published on their
migratory behaviour and general biology, including
comprehensive population dynamics studies. Of particular importance arc the effects that high exploitation
rates might have on the spawning potential of the stocks
once the size and age structure changes, so that the
propagation of the species must depend on the egg
production of much younger spawners, and this is where
fecundity studies may play an important role in
determining the relation between spawning potential and
recruitment. Also, fecundity like some other biological
characteristics may be useful as an indicator in stock
differentiation. Investigations on the fecundity of
herring stocks in the Georges Bank, Gulf of Maine, Nova
Scotian, and southern Gulf of St. Lawrence areas have
been made (Yudanov, 1966; Barrett, MS 1968; Perkins
and Anthony, 1969; Draganik and Bast, MS 1970), but
none have previously been reported for the herring
stocks of the Newfoundland area. This paper presents
information on fecundity of herring taken in four areas
of southern and eastern Newfoundland.
Materials and Methods
The herring specimens used for fecundity estimation
were collected from January to August 1966 in the
coastal waters of the south and east coasts of Newfoundland (Table 1). Ovaries were preserved in jars containing
Gilson's fluid, and the method of preservation and
cleaning was the same as that followed by Hodder
(1963) for Grand Bank haddock. Information recorded
routinely for each specimen included the total length of
the fish in millimetres, the whole weight of the fish and
the weight of the ovaries in grams, and the sex and
maturity condition according to the numerical scale
adopted by ICNAF (1964). Specimens taken along the
south coast during January to April were generally stage
4 in the maturity scale, and those taken in late April and
early May were stage 5; thus all of the south coast
specimens were fish which would normally spawn in the
spring (May). The specimens taken in the bays along
eastern Newfoundland in July and August were likewise
mostly stage 4 with some stage 5's in August, and these
would normally spawn in the autumn.
Two methods of obtaining fecundity estimates
were employed. Specimens taken during January to May
were treated by the method described by Hodder (1963)
using a whirling vessel of the type described by Wiborg
(1951), while those taken in July and August were
treated by a method similar to that used by Boyar and
Clifford (1967) employing an electronic "Decca Mastercount". Ova samples from six specimens were treated by
both methods for comparative purposes.
The whirling vessel technique involved the successive fractioning of egg samples. The first fraction
yielded 10 samples, each of which was 1/10 of the
'International Commission for the Northwest Atlantic Fisheries, P.O. Box 638, Dartmouth, N.S., Canada.
100
ICNAF RESEARCH BULLETIN NUMBER 9, 1972
TABLE]. Number of herring ovaries sampled for fecundity
estimation with area and date of capture and size
range of fish (cm).
Number of
specimens
Length
range
11-19Jan
10-12 Apr
45
20
28-36
27-36
Fortune Bay area
17-18 Mar
4-7 May
45
43
27-40
25-39
Placentia Bay
22-23 Feb
15 Apr
36
25
27-38
27-40
Eastern Nfld.
10-12 July
2-12 Aug
22
42
27-38
27-40
Area
Dates
Southwest Nfld.
original sample size. Two of these, selected at random,
were combined and further fractioned to yield 10
subsamples, each of which was about 1/50 of the
original egg sample. Four of these subsamples were
randomly selected for counting of ova under the low
power of a binocular microscope. The fecundity
estimate was taken as the average of the four counts
multiplied by a factor of 50. Subsample counts for all
specimens generally ranged between 1,000 and 4,000
ova. Some indication of the reliability of the sampling
technique with the whirling vessel is obtained by
computing for each specimen the average percentage
deviation of the four counts from their mean. The
frequency distribution of the percentage deviations show
that 75% of the observations deviated from their means
by less than 10%.
Preparatory to counting with the "Mastercountmachine, the egg sample (previously cleaned and stored
in 5% formalin solution) was poured from the jar on to
fine-meshed bolting cloth, washed thoroughly, and left
to dry on filter paper at room temperature for 2-3 hr.
The complete ova sample was then weighed to the
nearest 0.01 g and a subsample, in the weight range of
2-3 g, taken and weighed for counting. The dried eggs
were next placed in the feeder bowl of the machine and
moved by vibration singly along a sizing groove, from
the end of which they fell individually through a
detection aperture past a photo-electric cell which
activated the digital counter. Of the 64 specimens
treated by this method, all of the eggs were counted for
two specimens and subsamples ranging from 9,000 to
40,000 ova were counted for the remainder. In order to
maintain a check on the accuracy of the machine counts,
eight batches of 100 ova each were taken during the
course of the machine counting of each subsample and
these were counted visually under a binocular microscope. The frequency distribution of the deviations
indicate that on the average the visual counts deviated
from the machine counts by 0.02% and that 95% of the
deviations were within the limits of ± 3.44%. This degree
of precision agrees favourably with the accuracy
indicated by Boyar and Clifford (1967) who used a
similar machine for counting herring eggs.
During the course of subsampling the egg samples
with the whirling vessel, a 1/10 part of each sample was
preserved in case it became necessary, due to unduly
large variation in subsample egg counts, to carry out
further verification checks of the fecundity estimates.
Six of these subsamples were subsequently subjected to
machine counting, and the results indicate good agreement with those obtained by the whirring vessel method
(Table 2).
TABLE 2. Comparison of fecundity estimates for selected
specimens using the whirling vessel and "Mastercount" methods.
Length
(mm)
305
325
328
349
351
354
Fecundity estimates
Whirling vessel
"Mastercount"
66,600
99,150
115,600
111,900
82,900
100,650
66,290
94,910
111,550
115,850
90,270
98,310
For most of the South Newfoundland samples, the
average egg diameter was estimated by taking the average
of the linear distance (to the nearest 0.1 mm) occupied
by 50 eggs lined up adjacent to each other singly in a
small V-shaped groove cut in a piece of black plexiglass.
In tables where mm length measurements are
grouped into cm intervals the lengths are given to the 0.5
cm below, i.e. lengths of 300 to 309 mm are grouped in
the 30-cm interval.
Results
Fecundity related to length of fish
Fecundity estimates were made for 278 female
herring ranging in total length from 258 to 408 mm. The
estimates ranged from 12,750 eggs for a 278 mm fish to
241,630 eggs for a 370 mm specimen, but most of the
fish were in the range 300-380 mm with fecundity
estimates generally ranging between 40,000 and 200,000
ova.
On the basis of current knowledge of herring
stocks in the Newfoundland area, the specimens were
grouped by area into four lots as illustrated in the scatter
diagrams of fecundity against body length (Fig. 1). The
curvilinear relationships were determined by applying a
101
HODDER: FECUNDITY OF HERRING IN THE NEWFOUNDLAND AREA
240
220 200
•
SOUTHWEST NFLD
JAN, APR 1966
PLACENTIA AND
ST MARY'S BAYS
FEB, APR 1966
180
.
160
..•
100
..
80
0
O
• ge
60
.t
' •
•
•
.
•
.
•
w •
.
.
.
140
120
-
.
•
..
.
0
.;
.
•••
. . . •••
Vs• .
.
.
•
4,
.
.
C
A
0 40
0
20
0
E
0
240
'220
-o
5 200
EAST NFLD
JUL, AUG 1966
FORTUNE BAY
MAR, MAY 1966
o o
.
160
.
. .
.
140
120
. .. •
.
• •.•
. •
•
• .. . . • • .
.
•
•
•
•
•
... .
.
.
•
•
%. ;
••
100
.
. %
•
80
s
60
..
40
20
0
•
260
•
280
:
.
300
320
D
B
_.
340
360
380
400
280
300
Total length of herring (mm)
320
340
360
380
400
Fig. 1. Fecundity estimates by length of fish and the fitted regression lines for four groups of herring in the Newfoundland area.
logarithmic transformation to the two variables and
computing the parameters of the lineal model:
log F = n log L log k
Parameters for each of the four groups are given in
Table 3. The resulting fecundity-length curves indicate
that fecundity increases at a rate greater than the cube
of the body length, the regression coefficient
between 4.03 and 4.88.
n
ranging
The data of Fig. 1 show that for any one length of
fish fecundity varies between fairly wide limits. This
variation is greater than would be expected due to
sampling errors and tends to mask any obvious
differences in fecundity between areas. This aspect is
TABLE 3. The relationship between log fecundity and log body length for herring of four areas of southern and eastern Newfoundland
1966.
Area
Southwest Nfld.
Fortune Bay
Placentia and St. Mary's Bays
Eastern Nfld.
No. of
fish
Regression
coefficient, n
Intercept
log k
Correlation
coefficient, r
65
88
61
64
4.495
4.880
4.027
4.242
—14.693
—16.981
—11.933
—12.838
0.77
0.90
0.85
0.93
102
1CNAF RESEARCH BULLETIN NUMBER
better shown by plotting in a single diagram the four
curves as derived from the fitted log-log regressions (Fig.
2). Comparisons of the observed means (geometric) of
fecundity-at-length data with the corresponding values
from the fitted curves are given in Table 4.
To test the significance of the between-area
differences in slope (rate of increase in log fecundity
with log length) and in intercept (log fecundity adjusted
to a common log length), an analysis of covariance was
used according to Snedecor (1956). No significant
difference was found between the regression coefficients
of the samples by area, but when the test was applied to
measure the variability in intercepts a significant
difference at the 1% level resulted. The curve derived
from the data for eastern Newfoundland (Fig. 2) lies
considerably above the three curves derived from
southern Newfoundland data. When the test was applied
to the latter three sets of data, neither the regression
9, 1972
300
280
260
A SOUTHWEST NFLD
B FORTUNE BAY
C PLACENTIA BAY
D EASTERN NFLD
240
220
o
> 200
0
o 180
0
0 160
140
-82
°
120
100
80
60
40
20
0
26
28
30
32
34
36
38
40
Fish Length (cm)
Fig. 2. Fecundity-length relationships for herring from Newfoundland coastal waters.
TABLE 4 Mean fecundity estimates ('000) and predicted values by length group (cm) for herring taken in Newfoundland coastal
waters. (Means are geometric means, and numbers of specimens are given in parentheses.)
B. Fortune Bay area
A. Southwest Newfoundland
Length
group
(cm)
25
27
28
29
30
31
32
33
34
35
36
37
38
39
40
Predicted
from
curve
Mean
38.5
45.2
52.8
61.3
70.9
81.6
93.5
106.7
12L3
137.1
155.2
31.0 (1)
47.7 (1)
71.8 (2)
64.5 (7)
65.7 (15)
78.5 (16)
104.5 (8)
96.7 (8)
102.9 (4)
184.0 (2)
163.8 (1)
Observed
Range
65.4 - 78.9
54.2 - 76.3
26.8 - 94.0
53.2 - 115.6
94.1 - 115.4
73.4 - 115.8
8L6 - 164.3
155.1 - 218.2
Predicted
from
curve
Mean
Range
22.0
32.3
38.8
46.4
55.0
64.9
76.2
89.1
103.6
120.0
138.4
159.0
182.0
207.7
236.1
20.4 (1)
32.4 (I)
37.4 (3)
34.1 (3)
52.4 (4)
74.9 (3)
65.9 (10)
92.0 (16)
115.0 (8)
124.6 (12)
142.7 (7)
166.9 (4)
170.9 (3)
159.5 (4)
176.5 (1)
12.5 - 51.3
28.3 - 45.3
21.9- 45.8
44.7 - 66.9
57.3 - 104.8
36.7 - 118.6
62.5 - 115.1
91.1 - 152.1
91.5 - 162.7
120.6 - 175.8
135.1 - 188.9
147.3 - 202.7
136.6 - 176.0
C. Placentia and St. Mary's Bays
27
28
29
30
31
32
33
34
35
36
37
38
39
40
43.7
50.5
58.0
66.4
75.5
85.7
96.8
108.1
122.2
136.6
152.4
169.4
187.8
207.7
26.7 (2)
53.2 (2)
65.1 (1)
73.4 (1)
63.9 (1)
94.1 (4)
114.6 (6)
112.3 (18)
120.7 (11)
122.4 (5)
142.7 (4)
147.1 (2)
177.4 (2)
145.4 (1)
20.7 - 34.3
35.7 - 79.3
78.8 - 107.2
92.0 - 128.0
92.0 - 162.8
86.9 - 182.8
104.8 - 138.7
127.3 - 159.6
142.1 - 152.2
168.9 - 186.2
-
Observed
D. Eastern Newfoundland
59.1
66.3 (1)
80.1
91.7
105.1
120.1
136.4
154.6
174.5
196.3
220.1
246.1
274.4
305.1
75.3 (5)
84.4 (3)
123.4 (1)
98.0 (2)
134.9 (2)
165.0 (10)
181.5 (17)
196.6 (8)
21L8 (11)
215.6 (2)
221.4 (1)
237.5 (1)
64.7 - 87.2
73.2 - 94.8
97.4 - 98.6
132.7 - 137.1
132.3 - 210.7
145.7 - 220.0
182.5 - 218.4
182.5 - 241.6
203.3 - 228.7
103
HODDER: FECUNDITY OF HERRING IN THE NEWFOUNDLAND AREA
coefficients nor the intercepts were significantly different at the 5% level.
C). A quantitative indication of the differences in
fecundity for selected weights (gm) is given in Table 6.
A feature of three of the four sets of fecunditylength data (Fig. 1, B, C, and D), for which there are
several specimens greater than 36 cm in length, is the
apparent change in rate of increase in fecundity with
length. In fact, there is the tendency for fecundity to
remain relatively constant within certain limits of
variability for 37-40 cm herring. For Fortune Bay and
Placentia Bay fish the fecundity of 37-40 cm
specimens ranges from about 140,000 to 200,000 eggs,
whereas for eastern Newfoundland herring the range is
higher at 180,000 to 240,000 ova.
Egg diameter related to month and area
The average diameter of eggs was estimated for
most of the specimens taken during January to May in
the three areas of southern Newfoundland (Table 7). In
each month and area the mean egg diameter was
relatively constant for specimens 30 cm and larger in
length. The lower values for some of the smaller herring
are probably associated with fish maturing to spawn for
the first time, and these would thus spawn later than the
period of peak spawning.
Fecundity related to weight of fish
Since fecundity has been shown to increase at a
rate greater than the cube of the length and since the
weight of fish is generally accepted as being approximately proportional to the cube of the length, the
relationship between log fecundity and log weight, when
treated by the usual method of least squares, should
produce an equation of the form F = kW", where n is
greater than 1.0. This is comfirmed by the log
fecundity-log weight regression lines whose regression
coefficients range from 1.24 to 1.60 (Table 5). As
previously shown by the fecundity-length relationships,
the curve derived from fecundity-weight data for eastern
Newfoundland herring (Area D) is significantly different
from those for southern Newfoundland (Areas A, B, and
The absence of any significant variation in average
egg diameter by area and month (except for Fortune
Bay in May) reflects the absence of ovarian development
during the winter months (January to April); the average
diameter increased only slightly (0.67 to 0.71 mm) in
Southwest Newfoundland from January to April, and
remained the same (0.72 mm) in Placentia Bay herring
between February and April. Only in Fortune Bay
herring did the average diameter of eggs increase
significantly (0.74 to 0.84 mm) between March and
May, just prior to spawning. Surface to bottom water
temperatures in the bays and fjords of southern and
eastern Newfoundland are generally below 1°C during
January to early April, after which there is gradual
warming of the surface layer to 5° C or higher during
spawning time in May and early June.
TABLE 5. The relationship between log fecundity and log weight for herring of four areas of southern and eastern
Newfoundland, 1966.
Area
Southwest Nfld.
Fortune Bay
Placentia and St Mary's Bays
Eastern Nfld.
N o. of
fish
Regression
coefficient, n
Intercept
log k
Correlation
coefficient, r
65
45
61
64
1.599
1.427
1.235
1.244
2.422
3.384
4.431
4.671
0.84
0.92
0.86
0.92
TABLE 6. Computed fecundity values for selected weights as derived from the log fecundity-log weight regressions for
Areas A, B, C, and D.
Fecundity ('000) predicted from curves
Fish
weight
(gm)
A
B
C
D
200
250
300
350
400
53
77
103
131
163
56
58
77
96
117
138
78
102
129
156
184
78
101
126
152
104
ICNAF RESEARCH BULLETIN NUMBER 9, 1972
TABLE 7. Average diameter (mm) of herring eggs by fish length and by area and month of capture. (Number of specimens in
parentheses.)
Total
length
(cm)
Southwest Newfoundland
January
27
28
29
30
31
32
33
34
35
36
37
38
39
40
0.68
0.69
0.68
0.65
0.64
0.67
0.60
0.71
Av.
0.67 (45)
0.62 (I)
(6)
(14)
(9)
(6)
(5)
(2)
(1)
(1)
Fortune Bay
April
0.45 (1)
0.62
0.77
0.61
0.73
0.74
0.79
0.77
0.41
(2)
(1)
(1)
(7)
(2)
(3)
(2)
(1)
0.71 (20)
March
0.51
(7)
0.68
0.80
0.71
0.77
0.79
0.87
0.77
0.72
0.77
(1)
(8)
(4)
(8)
(6)
(4)
(3)
(3)
(1)
0.74 (45)
Discussion and Conclusions
The fecundity of herring taken in Newfoundland
coastal waters was found to vary at a rate proportional
to about the 4.5 power of total length, the regression
coefficents ranging between 4.0 and 4.9. These values of
the exponent are generally in the upper part of the range
of values reported by others for herring and for other
species. Most authors of papers on fecundity of a variety
of species have found that the exponent usually ranged
between 3 and 5: values between 3 and 4 have been
reported by Raitt (1933) for North Sea haddock, by
Bagenal (1957) for long rough dab, by Botros (1962) for
Baltic cod, by Pitt (1964) for American plaice of the
Grand Bank and by May (1967) for cod off eastern
Newfoundland, while values between 4 and 5 have been
reported by Powles (1958) for Gulf of St. Lawrence cod
and by Hodder (1963) for Grand Bank haddock.
Fecundity has been extensively studied in herring of the
Northeast Atlantic with exponent values generally
ranging between 3.5 and 4.5 (Farrow, 1938; Hickling,
1940; Baxter, 1959; and many others), and in herring of
the Northeast Pacific by Katz (1947) who obtained a
value of 4.7 and by Nagasaki (1958) who reported values
generally between 3 and 4. Of the few fecundity studies
previously reported for the herring stocks of the
Northwest Atlantic, two authors applied the exponential
relationship between fecundity and length: Barrett (MS,
1968) obtained an exponent of 2.36 for 51 specimens of
spring spawners between 30 and 35 cm in total length
from the southern Gulf of St. Lawrence, and Draganik
and Rast (MS, 1970) obtained a value of 5.76 for
Georges Bank autumn spawners in the length range of
Placentia Bay
May
0.80
0.59
0.80
0.75
0.89
0.88
0.87
0.82
0.88
0.94
Febmary
(3)
(2)
(3)
(4)
(3)
(7)
(8)
(4)
(4)
(1)
0.99 (1)
0.84 (40)
0.63 (1)
0.45 (1)
0.67
0.76
0.75
0.71
077
0.74
0.74
(4)
(5)
(10)
(7)
(4)
(2)
(2)
0.72 (36)
April
0.45
0.45
0.64
0.58
0.69
0.64
0.64
0.77
0.75
0.69
0.79
0.81
0.82
(1)
(1)
(1)
(1)
(1)
(1)
(1)
(8)
(4)
(1)
(2)
(2)
(1)
0.72 (25)
26-35 cm. Perkins and Anthony (1969) give fecundity
estimates for a total of 656 herring from Georges Bank,
Gulf of Maine and Southwest Nova Scotia stocks, but
they used the linear model without the logarithmic
transformation. It appears, therefore, that for herring, as
for other species of fish, fecundity varies with fish length
at a rate greater than the cube of the length and that the
exponent may vary between fairly wide limits for
different stocks and areas.
Comparison of the correlation coefficients for the
relationships of fecundity to length and to weight
separately (Tables 3 and 5) indicates that fecundity is
slightly better correlated with weight than with length.
Similar observations were made by Hodder (1963) for
Grand Bank haddock and by May (1967) for East
Newfoundland cod, and Botros (1962) concluded that
the fecundity-weight relationship provided the best
description of the egg production of Northeast Atlantic
cod. However, length measurements are usually more
easily and more accurately obtained during field
sampling than weights, and with the rather insignificant
difference between the correlation coefficients of the
fecundity-length and fecundity-weight relationships, the
egg production of herring in the Newfoundland area may
be considered to be adequately described by fecunditylength relationships of the form used in the present
analysis.
Casual examination of the exponential relationships for the Newfoundland herring fecundity data does
not reveal any obvious differences between the stocks;
yet the fecundity estimates for autumn spawners of
105
HODDER: FECUNDITY OF HERRING IN THE NEWFOUNDLAND AREA
eastern Newfoundland are approximately 50% higher
than the estimates for spring spawners (in the same
length groups) of the three south coast areas. This
confirms the generally accepted view that autumn
spawners are more fecund than spring spawners; for
example, Hickling (1940) and Baxter (1959) have shown
that in fish of the same size there are significant
differences in the egg production of winter and spring
spawners on the one hand and summer and autumn
spawners on the other, with the latter types being the
more fecund. Also, Parrish and Saville (1965) observe
that differences in fecundity between stocks seem to be
governed by the level of first spawning rather than by
differences in the rate of change in fecundity with
length.
A comparison of available fecundity values by
length for autumn and spring spawning stocks of herring
in the Northwest Atlantic is provided in Table 8.
Considered over the same length range (27-33 cm), the
fecundity values for eastern Newfoundland autumn
spawners agree reasonably well with those reported by
Perkins and Anthony (1969) for autumn spawners of the
Georges Bank, Gulf of Main, and Southwest Nova Scotia
stocks. However, fecundity values reported by Draganik
and Rast for Georges Bank herring, taken in 1968, are
considerably less than values given for the same stock by
Perkins and Anthony, based on samples collected in
1963 and 1964. The difference between the two sets of
data for Georges Bank herring is greater than one would
expect to attribute to sampling error or even to
differences in counting techniques, but it could be due
to increased growth rate or delayed maturation or a
combination of both factors during the period between
1963 and 1968. If the two sets of data are really
representative of the fecundity of the Georges Bank
herring stock in the two different periods, the value of
fecundity studies as a characteristic suitable for differentiating between stocks would have to be questioned, and even the importance of fecundity as a
parameter in determining the relation between spawning
potential and recruitment, as postulated by Draganik
and Rast (MS, 1970), would be minimized, unless the
fecundity of the stock is monitored regularly.
Herring, which inhabit the fjords of Southwest
Newfoundland in winter (December-April), migrate
there from the southern Gulf of St. Lawrence where
they spend the rest of the year (Hodder, 1969, 1971;
Hodder and Parsons, 1971; Winters, MS, 1971). Thus the
fecundity estimates reported in this paper for spring
spawners taken in the fjords of Southwest Newfoundland in winter should be comparable with data reported
by Barrett (MS, 1968) for spring spawners taken in the
southern Gulf of St. Lawrence in the spring of 1967.
However, his fecundity values (49,600-61,400 eggs for
herring in the length range of 30-34 cm) are not much
more than one-half of the range of values presented in
this paper (61,300-106,700 eggs) for the same groups. A
plausible explanation for the difference is that Barrett's
samples were taken near the end of the spawning period
and that his specimens were partially spent when
captured. Messieh and Tibbo (1971) reported that the
peak period of spawning in the southern Gulf of St.
Lawrence (Bay of Chaleur area) varied from 3 to 17 May
for spring spawners in the years 1966 to 1969. In 1967
TABLE 8. Fecundity data by length for herring stocks of the Northwest Atlantic (derived from the curves reported by various authors).
Length
group
(cm)
25
26
27
28
29
30
31
32
33
34
35
36
37
38
39
40
Spring spawners
Autumn spawners
Georges
Banka
24.7
30.7
37.9
46.6
56.3
62.1
81.6
97.6
115.9
137.0
Georges
Bankb
Gulf of
Maineb
28.0
41.0
54.5
67.5
80.5
93.5
106.5
120.0
133.0
17.5
33.0
48.5
63.5
79.0
94.5
110.0
125.0
141.0
Southwest
Nova Scotiab
28.0
39.5
51.5
63.5
75.5
87.5
99.5
111.5
123.0
East
NBC
59.1
68.9
80.1
91.7
105.1
120.1
136.4
154.6
174.5
196.3
220.1
246.1
274.4
305.1
Gulf of
St. Law.d
49.6
52.3
55.2
58.5
61.4
Southwest
Ntld.c
38.5
45.2
52.8
61.3
70.9
81.6
93.5
106.7
121.3
137.1
155.2
aDraganik and Rast (MS, 1970). b Perkins and Anthony (1969). °Hodder (This paper). dBarrett (MS, 1968).
Fortune
Bay€
Placentia
Bay'
22.0
27.0
43.7
50.5
58.0
66.4
75.5
85.7
96.8
108.1
122.2
136.6
152.4
169.4
187.8
207.7
32.3
38.8
46.4
55.0
64.9
76.2
89.1
103.6
120.0
138.4
159.0
182.0
207.7
236.1
106
ICNAF RESEARCH BULLETIN NUMBER 9, 1972
spawning was reported to be at its peak on 17 May, but
Barrett's samples were taken during 30 May - 5 June.
Barrett (MS, 1968), in explaining the very low
value of the exponent (2.36) in his fecundity-length data
compared with values reported for European herring,
suggested that his samples consisted of fish which were
becoming senile and thus their reproductive capacity was
declining rapidly. This view was expressed by Raitt
(1933) who found that for haddock the increase in
fecundity with age gradually declined and ceased when
the age was reached at which all specimens of an
age-class were spawners. Although the phenomenon of
declining reproductive potential is not apparent in the
Southwest Newfoundland data for herring up to 37 cm
in length (Fig. 1), some evidence of it is indicated for the
larger fish (> 36 cm) in the other three areas.
In the interpretation of differences in fecundity
between spawners of different stocks, both genetic and
environmental factors have variously been emphasized,
and a review of the problem is given by Parrish and
Saville (1965). Parsons and Hodder (1971), in their
analysis of meristic differences between spring- and
autumn-type spawning herring which intermix during
the over-wintering period in the fj ords of Southwest
Newfoundland, attribute the observed differences in
fin-ray and gillraker numbers to differences in developmental rates of spring- and autumn-hatched larvae due
to increasing and decreasing water temperatures respectively. In the Newfoundland area spawning generally
occurs in May for spring-spawners and in late AugustSeptember for autumn spawners. By December, when
the herring have migrated into the fj ords, the ovaries of
spring spawners have developed to maturity stage 4
while those of autumn spawners are in stage 8 condition.
Further gonadal development is retarded (Table 7) due
to the scarcity of food and the low water temperatures
(< 1° C) which prevail during January to early April.
During the winter, as revealed by the examination of
thousands of stomachs over several years of sampling,
herring feed very little if at all, and this is verified by a
substantial decrease in their fat content between
December and April (Hodder and Parsons, unpublished
manuscript). Hodder arid Parsons (MS, 1972) evert
report a small decrease in weight from January to April.
Although there is little or no evidence to indicate that
follicular atresia plays a very significant role in the
fecundity of marine fishes, it is possible that severe food
restriction during the winter months immediately preceding spring spawning may induce reabsorption of eggs.
Vladykov (1956) for wild speckled trout, Salvelinus
fontinalis, in Quebec lakes reported that an abundant
food supply during several months preceding spawning
resulted in higher fecundity at spawning time, while
Scott (1962), who carried out experimental diet
restriction on rainbow trout, Salmo gairdneri, found that
starvation preceding spawning increased the rate of
atresia. If these observations are considered relevant to
herring, the very significant difference in fecundity
between spring and autumn spawners (Fig. 2) could be
attributed largely to the very different environmental
conditions existing in the months preceding the spawning periods.
Acknowledgements
The author is indebted to many members of the
St. John's Biological Station staff who assisted in the
collection of the specimens and carried out the sampling
and the counting of the eggs, and especially to Mr R.
Chaulk who ably assisted in all phases of the investigation.
References
BAGENAL, T. B. 1957. The breeding and fecundity of the long
rough dab (Hippoglossoides platessoides Fabr.) and the
associated cycle in condition. J. mar. biol. Ass. U.K., 36:
339-375.
BARRETT, B. E. NIS, 1968. The fecundity of Canadian Atlantic
herring. Annu. Meet. int. Comm. Northw. Atlant. Fish.,
1968, Res. Doe. No. 62, Serial No. 2046 (mimeographed).
BAXTER, I. G. 1959. Fecundities of winter-spring and
summer-autumn herring spawners. J. Cons., 25: 73-80.
BOTROS, G. A. 1962. Die fnichtbarkeit des dorsches (Gadus
morhua L.) in der westlichen Ostsee and Westnorwegisehen
Gewassern. Kiel. Meeresforch., 18: 67-80.
BOYAR, H. C., and R. A. CLIFFORD. 1967. An automatic
devise for counting dry fish eggs. Trans. Amer. Fish. Soc.,
96: 361-363.
DRAGANIK, B., and B. RAST. MS , 1970. The fecundity of
Georges Bank herring. Annu. Meet. Mt. Comm. Northw.
Atlant. Fish. 1970, Res. Doc. No. 63, Serial No. 2404,
(mimeographed).
FARRON, G. P. 1938. On the size and number of ova of Irish
herrings. J. Cons., 13: 91-100.
HICKLING, C. E. 1940. The fecundity of the herring of the
southern North Sea. J. mar. biol. Assoc. U.K., 24: 619-632.
HODDER, V. M. 1963. Fecundity of Grand Bank haddock. J.
Fish. Res. Rd. Canada, 20: 1465-1487.
1969. Herring landings and distribution of catches in
Newfoundland, 1967-68. Fish. of Canada, 22(4): 3-6.
1971. Status of the southwest Newfoundland herring
stocks, 1965-70. Ht. Comm. Northw. Atlant. Fish.,
Redbook 1971, Part III: 105-114.
HODDER, V. M., and L. S. PARSONS. 1971. Comparison of
certain biological characteristics of herring from Magdalen
Islands and southwest Newfoundland. Res. Bull. int.
Comm. Northw. Atlant. Fish., No. 8, p. 59-65.
HODDER, V. M., and L. S. PARSONS. MS , 1972. Length, age
and weight of herring in the Southwest Newfoundland
winter fishery from 1965-66 to 1970-71. Fish. Res. Rd.
Canada, Tech. Rep. (In press).
HODDER: FECUNDITY OF HERRING IN THE NEWFOUNDLAND AREA
ICNAF. 1964. Report of Standing Committee on Research and
Statistics. App. I. Report of ad hoc group on herring and
other pelagic fish. Int. Comm. Northw. Atlant. Fish.,
Redbook 1964, Part I: 23-30.
KATZ, M. 1947. The fecundity of herring from various parts of
the North Pacific. Trans. Amer. Fish. Soc., 75: 72-76.
MAY, A. W. 1967. Fecundity of Atlantic rod. J. Fish. Res. Bd.
Canada, 24: 1531-1551.
MFSSIEH, S. N., and S. N. TIBBO. 1971. Discreteness of
Atlantic herring (Clupea harengus harengus) populations in
spring and autumn fisheries in the southern Gulf of St.
Lawrence. J. Fish. Res. Bd. Canada, 28: 1009-1014.
NAGASAKI, F. 1958. The fecundity of Pacific herring (Clupea
pallasi) in British Columbia coastal waters. J. Fish. Res. Bd.
Canada, 15: 313-330.
PARRISH, B. B., and A. SAVILLE. 1965. The biology of the
Northeast Atlantic herring populations. Oceanogr. Mar.
Biol. Ann. Rev., 3: 323-373.
PARSONS, L. S., and V. M. HODDER. 1971. Meristic
differences between spring- and autumn-spawning Atlantic
herring (Clupea harengus harengus) from southwest Newfoundland. J. Fish. Res. Bd. Canada, 28: 553-558.
PERKINS, F. E., and V. C. ANTHONY. 1969. A note on the
fecundity of herring (Clupea harengus harengus L) from
Georges Bank, the Gulf of Maine and Nova Scotia. Int.
Comm. Northw. Atlant. Fish., Redbook 1969, Part III:
33-38.
107
PITT, T. K. 1964. Fecundity of American plaice, (Hippoglossoides platessoides Fabr.), from Grand Bank and Newfoundland areas. J. Fish. Res. Rd. Canada, 21: 597-612.
POWLES, P. M. 1958. Studies on reproduction and feeding of
Atlantic cod (Cadus eallarias L.) in the southwestern Gulf
of St. Lawrence. J. Fish. Res. Rd. Canada, 15: 1383-1402.
RAITT, D. S. 1933. The fecundity of the haddock. Fish. Bd.
Scotland Sal. Invest. 1932. No. 1, p. 1-42.
SCOTT, D. P. 1962. Effect of food quantity on fecundity of
rainbow trout (Salmo gairdneri). J. Fish. Res. Bd. Canada,
19: 715-731.
SIMPSON, A. C. 1951. The fecundity of the plaice. Fish. Invest.
Lond. (2), 17(5): 1-27.
SNEDECOR, G. W. 1956. Statistical methods (fifth edition).
Iowa State College Press, 534 pp.
VLADYKOV, V. D. 1956. Fecundity of wild speckled trout
(Salvelinus fontinalis) in Quebec lakes.
Fish. Res. Bd.
Canada, 13: 799-841.
WIBORG, K. F. 1951. The whirling vessel. Fiskeridir. Skr.
Havundersak., 9(13): 1-16.
WINTERS, G. H. MS, 1971. Migrations of the southwest
Newfoundland stock of herring as indicated by tag
recaptures. Annu. Meet. int. Comm. Northw. Atlant. Fish.
1971, Res. Doc. No. 108, Serial No. 2591 (mimeographed).
YUDANOV, I. G. 1966. Fecundity and efficiency of spawning
of Atlantic herring in the Gulf of Maine. Trudy PINRO 17:
249-262.
Growth and Mortality of Atlantic Argentine, Argentina silos
Ascanius, on the Nova Scotia Banks
By C. Zukowski'
Abstract
Studies on the age, length, rate of growth, and mortality of argentine, Argentina sans Ascanius, were carried out
between 1964 and 1968 on the Nova Scotia Banks. Results show that argentine can attain great ages. Growth in length is
rapid up to first sexual maturity at 7-8 years of age. Total mortality rate is low. However, it may easily be affected by an
increase of fishing effort and therefore subject to overfishing.
Introduction
Among the publications on Atlantic argentine,
Ascanius, the most noteworthy are those
by Borodulina (1964), Emery and McCracken (1966),
Keysler (1968), and Wood and Rain. (1968). All of these
papers deal intensively with the biology and distribution
of this species.
Argentina sans
The present paper contributes more information
on the biology of argentine and furnishes further data
for estimation of the abundance of the stocks. Since
there was only limited exploitation of this species
between 1964 and 1968, fundamental parameters of its
rate of growth and total morality can be established.
Mortality coefficient, corresponding to the slope
of the straight line, has been calculated by the method
of least squares. Samples were taken from catches made
with trawls which were adapted to eliminate, as far as
possible, the effect of selectivity.
Extensive sampling of the fishery in 1964-68 was
carried out at the same depth range which should take
care of the possibility of the fish size increasing with
depth as recorded by Chrzan and Zukowski, 1965 and
Emery and McCracken, 1966.
Results
Age
Materials and Methods
Materials were collected from otter trawl catches
made on Sable Island Bank, Emerald Bank, Sambro
Bank, and Browns Bank from 1964 to 1968. A total of
10,651 fish were measured. Detailed analysis was
performed on 1,915 individuals of which 1,760 were
examined for age. Back calculations for the rate of
growth were made from the otoliths from 479 individuals.
Measurements included body length to the nearest
centimeter. Ages were estimated using reflected light
from the concave surface of unpolished otoliths immersed in 1:1 mixture of ethyl alcohol (96%) and
glycerin. Back calculations for rate of growth were based
on otolith readings. This served as a basis for calculation
of theorectical growth by means of the von Bertalanffy
equation.
Morski lnstytut, Rybacki al. Zjednoczenia 1, Gydnia, Poland.
The results of investigations on age in the years
1964-68 are given in Fig. 1.
In 1964 the most abundant fish were 4 and 5 years
old, born in 1960 and 1959 respectively. Their total
number in the catches exceeded 45%. The proportion of
3-year-old fish and 6- to 11-year-olds amounted in total
to about 50%. Only a small number of individuals were
older.
In 1965 the 4-, 5- and 6-year-olds were dominant.
Hence it may be concluded that the 1959 and 1960
year-classes were abundant. The proportion of fish older
than 8 years was comparatively small.
In 1966, the 1959 and 1960 year-classes, as 6- and
7-year-old fish, were still dominant. However, fish of
ages 4 to 13 years were abundant in the sampled catches.
110
ICNAF RESEARCH BULLETIN NUMBER 9, 1972
0/.0
Age
250
Length
1964
200
150
100
50
300
250
1965
200
150
100
50
200
150
1966
100
50
2021 22 years
le 966
200
100
50 -
1967
m.111111111=1
413
300 - 40161_377
250 -
68
968
200
150 100
50
3 4 5 6 7 8 9 101112 13 1415 161718 19 202122 years
15
20
25
30
35
40
45 c m
Fig. 1. Age and length of argentine in the catches made on the Nova Scotia Banks from 1964 to 1968.
ZUKOWSKI: GROWTH AND MORTALITY OF ATLANTIC ARGENTINE
In 1967, older fish, of the 1956 and 1955
year-classes, of 11 and 12 years of age were predominant. The proportions of 8 to 10 and 13 to 16 year
old fish were also high.
In 1968 the samples were made up of much
younger fish, 4 to 7 years of age, than in previous years.
These were presumably concentrations of juvenile fish
which do not occur with the adult fish and are found in
different localities.
Length
The results of length measurements for the years
1964-1968 are given in Fig. 1.
A number of distinctly marked peaks may be
noted in 1964. They were the 15-, 19- and 28-cm
length-classes. It may be assumed that the presence of
three predominant length-classes was connected with the
occurrence of a number of strong year-classes.
In 1965 fish from 19 to 23 cm in length were most
abundant. The modal length-class was 22 cm. Fish
ranged in length from 14 to 42 cm. Similarly, some
increase of mean length was noted from the preceding
year (Table 1).
TABLE 1. M ean length of argentine off Nova Scotia, 1964-68.
d+4
Year
n
cm
n
cm
n
cm
1964
1965
1966
1967
1968
99
257
455
173
30
23.8
23.3
28.3
30.5
22.6
112
243
440
78
30
22.4
25.5
31.0
32.0
23.0
211
500
895
251
60
23.0
24.3
29.6
30.9
22.8
The decrease in length in 1968 is based on
comparatively little material, collected only in the first
quarter of the year.
Rate of growth
Borodulina (1964), Emery and McCracken (1966),
and others determined the rate of growth of argentine
on the basis of mean lengths of fish in particular
age-groups.
In the present paper in order to obtain more
representative data, particularly for the youngest and
oldest age-groups, it was decided to determine the rate
of growth also by the method of back calculation using
otoliths. To adopt this method the relationship between
rate of growth of fish and length increase of its otolith
was determined. In the literature this problem is dealt
with by Ketchen (1964), Jensen (1938), Trout (1954),
and Cieglewicz, et al. (1969). Depending on the fish
species and the section plane of the otolith, the ratio of
fish length to otolith radius may be depicted either by a
curve or by a straight line. Since this problem has not
been considered previously for argentine, the above ratio
was examined in detail before back calculation was
attempted.
Measurements of the otolith radius along the axis
connecting the nucleus with the edge of rostrum and the
nucleus with the edge of antirostrum showed that the
former axis is more suitable for back calculation of
growth rate for the following reasons:
3)
In 1 966 the abundance of particular length-classes
was not appreciably different. However, a slight predominance of fish in the length-class 26-27 em was
noted.
From 1965 there is a tendency for the annual
modal length to shift towards the right-hand side of the
graph, i.e., towards the range of larger fish. This
tendency persists to 1967.
For the same length of fish any error in the
measurement of the shorter radius affects the final
result to a greater extent;
The zones (rings) of annual length increment on
the rostrum show more contrast and therefore can
be measured with more accuracy;
The distribution of the points in the graph,
showing the relation between the rostrum radius
and the fish body length is rectilinear (Fig. 2).
On the basis of empirical data the following linear
equation was derived:
In 1967 the majority of fish ranged in length from
30 to 35 cm with a peak at 32 cm.
In 1968 the length of fish was confined to the
21-25 em -range with a distinct predominance of the
23-em length-class.
111
R = 0.168L + 0.14
where
R = the length of otolith radius in mm,
L = the length of fish body in cm.
This equation shows that the application of the
Lea formula (Walus-Karpinska, 1961) gives the results of
back calculation with a slight error only. An ideal
equation for the above relation should have the
parameters: b = 0, y = ax. The value of b = 0.14 in the
112
ICNAF RESEARCH BULLETIN NUMBER 9, 1972
/mm/
5
10
15
20
25
30
35
40 L.c. /cm/
Fig. 2. Relationship between the length body (L.c.) of argentine and the longer radius
of its otolith (R).
above equation might be due either to inadequate data
or to slight disproportion between the growth of otolith
and the length increase of fish body. For practical
purposes, it was assumed that both these characteristics
are directly proportional.
The growth of argentine was finally characterized
on the basis of back calculations by means of the von
Bertalanffy equation:
L t L . (1
(1 —
—e
— to)
) (Beverton and Holt,
1957)
Where
L t = length of fish in cm at age t,
L . = asymptotic length of the fish,
e = the base of natural logarithm,
t 0 = arbitrary origin of growth curve,
K = the rate at which length reaches the
asymptote.
Methods of calculating the above parameters have
been described in detail in papers by Allen (1966),
Cieglewicz, et al. (1969), and Ketchen (1964-66). For
this reason, only their values are given in Table 2 and
graphic presentation of the rate of growth plotted on the
basis of above equation.
TABLE 2. The parameters for the von Bertalanffy equation.
L.
Region
Nova Scotia
K
to
d
4
d
4
d
9
37.9
41.4
0.145
0.129
—0.75
—0.75
Since the empirical data and the data calculated on
the basis of parameters (L . , K, t) agree closely,
adoption of the von Bertalanffy equation for the
determination of the characteristics of the rate of
growth of argentine seems justified (Fig. 3).
The data show that, in the region off Nova Scotia,
argentine from 1 to 8 years of age increase in length
from 4.0 to 1.8 cm annually. Over 8 years of age the
increase drops markedly to within a range of 1.5 to 0.5
em annually (Fig. 3).
Figure 4 shows that male and female argentine
increase in length at about the same rate up to 8 years of
age. From this age onward the length increase is greater
in females than in males.
ZUKOWSKI: GROWTH AND MORTALITY OF ATLANTIC ARGENTINE
113
cm
45
40
35
30
25
20
0 Mean values according to V Bertalanffy
formula
• From back readings.
15
X From direct readings
10
5
1 2 3 4 5 6 7 8 9 lb (I 1.2 13 14 lb 16 17 18 19 20 21 22 23 24 25 26 27 28 29 30 age
Fig. 3. Curve of growth for argentine, plotted according to von Bertalanffy formula.
45 4035
30
25
20
15
10
I
2 3 4 5
6 7 8
.
9 10 11 12 13 14 15 16 17 18 19 20 2. 1 2'2 23 2 4 Years
Fig. 4. Curves of growth for males and females of argentine plotted according to the von Bertalanffy
formula.
/ 14
ICNAF RESEARCH BULLETIN NUMBER 9, 1972
Mortality
Age composition data were used to determine the
coefficient of total mortality (Z). This coefficient may
be calculated by means of the equation:
6
5
4
where
3
N o = abundance of fish at time to,
2
N t = abundance of fish at time
However, the application of this formula requires
further data on the catch per unit of effort in numbers
of age-groups in consecutive years. Hence, in addition to
the age composition of the catches it is necessary to have
detailed statistical data on the catches. Since such
statistics are not available, determination of the index of
total mortality was based on age composition.
If we assume the mortality of fish of different ages
to be similar, then the index, according to Ricker
(1958), may be calculated from the catch curve.
When the proportion of particular age-groups is
expressed in logarithms (log e ), the right-hand section of
the curve obtained becomes approximately linear.
Assuming that the abundance of the stock in the region
of Browns Bank has not been subject to any considerable fluctuations in recent years, the slope of this
straight line may be interpreted as the coefficient of
total mortality.
In order to apply this method, data have been
compiled on mean age composition, from which it
appears that starting with the fifth year of life the rate
of mortality is greater than the rate of recruitment. This
mean age composition was expressed in logarithms
(loge ). The right-hand slope of the curve is presented as a
0
5
6
7
6
9
10
11
12
13 14 15 16 17 18 19 20 21
Years
Fig. 5. Mortality of argentine expressed in i n plotted against age.
The slope of the straight line for 5- to 20-year-old
fish calculated by means of least squares is 0.28 (Fig. 5).
This parameter is also the coefficient of total mortality
(Z) for a period of one year and points to the reduction
of the populations by 24% per annum.
From this value, we may conclude that the stock
of argentine has at present a low total mortality rate.
Summary
Investigations of argentine on the Nova Scotia
Banks from 1964 to 1968 showed that the 1959 and
1960 year-classes were the most abundant. The age of
fish in the catches ranged from 3 to 29 years, their
lengths from 13 to 42 cm. Larger fish, up to 52 cm in
length, occurred sporadically.
straight line by means of the method of least squares.
Growth rate was relatively rapid up to 7-8 years of
age. In general, females grew faster than males. This
difference increased with age.
The curve for the age composition of the catches,
plotted from 1964 to 1967 data may not be sufficiently
representative. It presents, however, a preliminary
estimation of the mortality for that period when the
intensity of fishing is still very low. In such a case the
calculated total mortality might have a value similar to
that for natural mortality.
Natural mortality was found to be low and the
coefficient of total mortality — 0.28. Thus an increase in
fishing effort may affect the state of the stock and
excessive fishing intensity may lead to rapid decrease in
the stock size. In view, however, of the present low
exploitation of argentine some expansion of the fisheries
for this species is undoubtedly possible.
ZUKOWSKI: GROWTH AND MORTALITY OF ATLANTIC ARGENTINE
References
ALLEN, K. RADWAY. 1966. A method of fitting growth curves
of the von Bertalanffy type to observed data. J. Fish. Res.
Bd. Can., 23(2).
BEVERTON, R. J. H., and S. J. HOLT. 1957. On the dynamics
of exploited fish populations. Fish. Invest., Loud. (2).
BORODULINA, C. D. 1964. Some data on the biology of the
argentine, Argentina silus Ascanius. Vop. Ikhtiol. 4(1):
68-81. (Translation prepared by C. A. McLean, Fisheries
Laboratory, Lowestoft, Suffolk)
CIEGLEWICZ, W., B. DRAGANIK, and Cz. ZUKOWSKI. 1969.
Charakterystyka wzrostu stomi, Platichthys flesus L., i
skarpia, Scophthalmus maximus L. za pomoca rownania v.
Bertalanffy ego. Prace MIR, Tom 15, Seria A, Wyd. Mors.
Gdansk.
CHRZAN, F., Cz. ZUKOWSKI. 1966. Some characteristics of
Argentine, Argentina silos Ascanius, occuring in the region
off Nova Scotia. Res. Bull. int. Comm. North . w. Afloat.
Fish., No. 3, p. 81-85.
EMERY, A. R., and F. D. McCRACKEN. 1966. Biology of the
Atlantic argentine, Argentina sans Ascanius, on the Scotian
Shelf. J. Fish. Res. Bd, Can., 23(8).
115
JENSEN, A. I. C. 1938. Factors determining the apparent and
the real growth. Rapp. Cons. Explor. Mer, 108.
KARPINSKA-WAL US, B. 1961. Wzrost ploci, Rutilus rutilus B.,
w jeziorach okolic Wegorzewa. Roczn. Nauk rot (B),
Zeszyt Zootechn. No. 2, PWR i L.
KETCHEN, K. S. 1964. Preliminary results of studies on growth
and mortality of Pacific cod, Gadus macrocephalus, in
Hecate Strait, British Columbia. J. Fish. Res. Bd. Can.,
18(4): 513-558.
KETCHEN, K. S., and C. R. FORRESTER. 1966. Population
dynamics of the Petrale sole, Eopsetta jordani, in waters of
western Canada. Bull. Fish. Res. Bd. Can., No. 153.
KEYSLER, H. D. 1968. Investigations on the stocks of
Argentina silts in the waters off Norway, Iceland and
Newfoundland. Rapp. Cons. Explor. Mer, 158.
RICKER, W. E. 1958. Handbook of computations for biologic
statistics of fish populations. Bull. Fish. Res. Bd. Can., No.
119.
TROUT, G. C. 1954. Otolith growth of the Barents Sea cod.
Rapp. Cons. Explor. Mer, 136: 89-102.
WOOD, R. I., and D. F. S. RAITT. 1968. Some observations on
the biology of the greater silver smelt, particularly in the
northeastern Atlantic Ocean. Rapp. Cons. Explor. Mer,
158.
A Yield Assessment of the Eastern Scotian Shelf
Cod Stock Complex
By R. G. Halliday'
Abstract
Landings of cod from ICNAF Subdivision 4Vs and Division 4W fluctuated between 50,000 and 80,000 metric tons,
averaging 62,205 tons, in 1960-71. Canada and Spain were the main exploiters, and over 90% of catches were by otter and
pair trawls. Removals from the stock were predominantly fish 40-70 cm long and 4-6 years of age. Numbers removed
annually varied between 23 and 42 million fish. Recruitment to the fishery occurred between 3 and 6 years of age, the 50%
recruitment age being 4.2 years. Fishing mortality was fairly constant in 1960-69, averaging F = 0.49 on fully recruited agegroups (when natural mortality is assumed to be M = 0.20). This is close to that giving maximum yield-per-recruit. An
increase in long-term yield-per-recruit is predicted to result from increase in the age at recruitment, and substantial
economic benefits are predicted from a reduction in fishing mortality. Analysis of likely biases in the data implies that the
estimates of benefits are conservative.
Introduction
The cod fishery on the eastern Scotian Shelf
(ICNAF Subdivision 4Vs and Division 4W) is based on a
complex of cod stocks (Templeman, 1962; Martin and
Jean, 1964). However, considerable mixing takes place
among adults of these stocks and possibly also among
the pelagic egg and larval stages. Thus, in the present
state of knowledge, it is practical to consider this
complex as a unit for assessment purposes.
The only previous assessments of this stock were
made in connection with studies on the effects of
changes in trawl mesh size reported on by Beverton and
Hodder (eds., 1962). In the 1947-58 period when landings averaged 38,000 metric tons, instantaneous total
mortality, Z, was 0.50 on fully recruited age-groups.
This paper describes size and age composition of
landings, stock abundance, and mortality in the 1960-71
period, and the relationship of yield-per-recruit to
mortality rate and age at first capture.
Landings
Landings fluctuated between approximately
50,000 and 80,000 metric tons in the 1960-71 period,
averaging 62,205 metric tons (Table 1). Almost equal
quantities were taken from Subdivision 4Vs and Division
4W. Spain was the principal exploiter of the stock,
taking 63% of the catch in the 12-year period. Canada
was the only other country taking substantial quantities
from the Stock (28% of the catch). Canada has taken
75% of her catch from Div. 4W, whereas Spain has taken
60% of her catch from Subdivision 4Vs.
On average, 70% of Canadian landings were caught
by otter trawlers. The remaining 30%, amounting to
4,000-7,000 metric tons annually, was taken predominantly inshore. Up to 1,000 tons were taken annually by
gillnets, seines, and traps, and the remainder by handline
and longline gear. All non-Canadian landings were taken
by otter trawlers or pair trawlers, except for small
catches by Portugese dory vessels in 1960-62.
Size and Age Composition of Catches
and Landings and Numbers
Removed from the Stock
Biological sampling of this fishery has been extremely poor (Table 2) and well below minimum ICNAF
requirements as set out in the Assessments Subcommittee report for 1970. This analysis is based predominantly on samples of Canadian landings which represent
only 28% of total landings, but includes the few Spanish
and French samples available from ICNAF Sampling
Yearbooks. French length-frequency samples represent
total lengths measured to the centimetre below, whereas
Canadian and Spanish sampling conforms to the ICNAF
convention of measuring fork length to the nearest
Fisheries Research Board of Canada, Biological Station, St. Andrews, New Brunswick.
118
ICNAF RESEARCH BULLETIN NUMBER 9, 1972
TABLE 1. Subdivision 4Vs and Div. 4W cod: Nominal catches. (From ICNAF Statistical Bulletins for 1960-70.)
Year
Canada
France
1960
1961
1962
1963
1964
1965
1966
1967
1968
1969
1970
1971b
18,390
19,697
17,579
13,144
14,330
23,104
17,690
18,464
24,888
14,188
11,818
17,064
1,018
3,252
2,645
72
1,010
536
1,494
77
225
217
420
. ..
Portugal
1,720a
2,321a
341a
617
88
102
296
. ..
Spain
USSR
Others
Total
Subdivision 4Vs
Div. 4W
29,391
40,884
42,146
44,528
39,690
39,280
43,157
33,934
50,418
32,305
41,926
30864
30,864
113
2,383a
9,505
7,133
7,856
5,473
1,068
4,865
2,783
2,521
...
126
42
60
307
1,094
124
356
512
29
664
446
(3,672)
50,645
66,309
65,154
68,173
63,257
70,988
68,170
54,157
80,425
50,157
57,427
51600
,
27,689
34,237
26,350
27,566
25,496
36,713
27,163
26,607
48,781
22,309
28,632
...
22,956
32,072
38,804
40,607
37,761
34,275
41,007
27,550
31,644
27,848
28,795
...
a Landings reported as Div. 4V assigned as in ICNAF Res. Doc. 72/57.
bSpanish and Canadian landings as reported to ICNAF Secretariat, landings of other countries estimated from 1969-70 landings.
TABLE 2. Subdivision 4Vs and Div. 4W cod: Commercial samples (trawl gear only).
Year
Country
No. of
samples
Div. 4W
No. of
lengths
No. of
ages
No. of
samples
Subdivision 4Vs
No. of
lengths
No. of
ages
1960
Canada
Spain
5
1
2,365
258
493
-
1961
Canada
France(M)
Spain
7
2,326
398
-
16
3
606
878
1962
Canada
Spain
4
17
916
2,320
223
1
3
395
398
70
-
1963
Canada
4
1,098
341
1
375
47
1964
Canada
Spain
2
-
298
213
1
3
330
654
59
-
1965
Canada
8
3,101
631
3
1,092
123
1966
Canada
6
2,245
304
2
590
121
1967
Canada
3
857
197
6b
1,841
188
1968
Canada
8
2,717
354
5c
1,443
184
1969
Canada
France(S.P.)
3
960
130
-
3
4,264
1970
Canada
5
1,626
212
3
928
139
1971
Canada
2
711
92
10
3,178
467
2a
-
550
-
110
-
alneludes one sample from 4Vs-W combined. b includes two samples from 4Vs-W combined. clncludes one sample from 4Vs-W
combined.
119
HALLIDAY: THE EASTERN SCOTIAN SHELF COD STOCK COMPLEX
centimetre. In cod, fork and total length are virtually
equivalent so French sampling technique results in a
length frequency displaced 0.5 cm toward zero in
comparison with that of Canada and Spain. This cannot
be readily corrected for with data summarized in 3 cm
groups, and the French samples arc used without
adjustment in the belief that the increased information
they provide outweighs the slight error introduced.
Canadian and French samples in 1969 are of
landings after discard. French samples in 1961 and
almost all Spanish samples are of catches, presumably
before discard. However, Spanish discards have been
negligible (ICNAF, MS, 1966-67; 1968-71) and catches
and landings are virtually synonymous. There are no
accurate data on Canadian discards. Substantial biases in
collection methods make Canadian discard submissions
to ICNAF' unreliable. However, it is known that discards
of cod by Canadian vessels in the 4Vs-W area have been
very low. It is assumed therefore that discards by Canada
and Spain have been zero between 1960-71 in this
fishery, and that available samples are representative of
both landings and removals from the stock.
virtual absence of samples from it, is ignored. The major
assumption here is that samples from Canadian landings
are also representative of Spanish catches. Only for 1962
is it possible to make a comparison of the age and length
composition of Spanish catches and Canadian landings
(Fig. 1). In that year Spanish catches contained a
substantially higher proportion of smaller, younger fish.
This may indicate that Canadian discards were not
negligible as assumed, or it may be a result of poor
sampling. Alternatively, it may reflect a real difference
in size and age composition of removals. It is impossible,
with the information currently available, to distinguish
among these possibilities. It is almost certain, however,
that whatever biases are in the data tend to underestimate the quantities of small fish removed from the
stock.
1960
1966
//
As there is inadequate material to treat the two
areas (4Vs and 4W), different countries, or different
seasons separately, annual landings are weighted by all
otter and pair trawl samples available for that year. The
fishery by other gears, due to its insignificance and the
00
1961
1967
1962
12
1968
2
A
Canada
Spar's,/
0
0
6
1963
6
1969
-I
28 34 40 46 52 58 64 70 76 82 88 94 100 106 112
Fork Length (cm)
40 —
1964
4
30 —
1970
20 —
0
1965
100-
A
p
10 11
6
8
Age (rears)
Fig. 1. Subdivision 4Vs and Div. 4W cod: Spanish catches and
Canadian landings in 1962, A — size composition, B —
age composition.
2
4
2
0
1971
0
25
55
85
115
25
55
85
115
Fork Length ( cm 1
Fig. 2. Subdivision 4Vs and Div. 4W cod: length composition of
removals, 1960-71.
120
ICNAF RESEARCH BULLETIN NUMBER
The available sampling data indicate that most
removals from the stock were of fish 40-70 cm long
(Fig. 2), mean lengths of annual removals varying between 54 cm and 59 cm (Table 3). Ages 4, 5, and 6 predominated numerically (Fig. 3), average age varying
between 5.2 years and 6.1 years. Mean weight of fish
varied from 1.6 to 2.2 kg. Estimated numbers removed
from the stock varied between 23 and 42 million
without major trend (Table 4), averaging 32.3 million.
TABLE 3. Subdivision 4Vs and Div. 4W cod: Annual mean
length, weight and age of removals from the stock.
Year
Mean length
(cm)
Mean weight
(kg)
1960
1961
1962
1963
1964
1965
1966
1967
1968
1969
1970
1971
58.1
59.0
53.8
55.4
59.2
54.5
55.3
57.1
56.6
53.9
57.0
58.9
2.04
2.17
1.73
1.78
2.24
1.79
1.75
2.00
1.93
1.62
1.97
2.22
Mean age
(yrs)
5.83
5.87
5.30
5.49
5.99
5.42
5.19
5.58
5.37
5.15
5.63
6.12
9, 1972
12
8
1%0
4
0
8
0
1961
4
8
0
4
1962
8
4
tn 12
0
8
8
1969
4
4
0
8
0
1964
1970
8
IIII.__
4
1965
Abundance
Canadian and Spanish cpe for 4Vs-W have little in
common (Fig. 5). Canadian data indicate that population abundance, which was fairly stable in the 1960-67
period, was considerably lower in 1968-71. Spanish data
1968
0
8
The cpe of Spanish pair trawlers in Subdivision
4Vs has been similar to that in Div. 4W (Fig. 4) with
apparent abundance being slightly higher in Subdivision
4Vs in the 1962-67 period. Canadian cpe in the two
areas is also similar from 1961 onwards with indications
that abundance was slightly higher in 4Vs that in 4W in
the 1 963-65 period. Therefore, for each country the cpe
was averaged for the two areas in each year to give
abundance indices for the entire stock.
0
12
8
o-11
Two data series on catch-per-unit-effort (cpe) are
available as indicators of abundance changes of the
stock; that of Spanish pair trawlers of 151-500 gross
tons and that of Canadian side otter trawlers of 151-500
gross tons.
1967
4
4-
Catch-per-unit-effort
1966
4
4
0
2 4
o
6 8 10 12
14 16
2 4
Ills6 8 10
1971
12 14 16
Age, Years
Fig. 3. Subdivision
4Vs and Div. 4W cod: age composition of
removals, 1960-71.
indicate a gradual increase in abundance from 1958-67, a
sharp increase in 1968, and moderate declines in
1969-70.
The Canadian fishery in 4Vs-W has been a mixed
one with haddock a prime species and flounders also of
importance. Canadian cpe data may therefore be a poor
reflection of cod abundance due to interactions between
the cod and other fisheries. The Spanish fishery, which
had cod as its prime species, is likely to give the more
accurate indication of cod abundance.
121
HALLIDAY: THE EASTERN SCOTIAN SHELF COD STOCK COMPLEX
TABLE 4. Subdivision 4Vs and Div. 4W cod: Numbers removed from stock at age (X 10-3).
Age
2
3
4
5
6
7
8
9
10
11
12
13
14
15
16+
Total
1960
889
3,569
7,364
5,737
3,623
2,633
454
166
202
116
6
20
9
24,786
Year
1965
1961
1962
1963
1964
242
5,260
9,345
7,507
3,174
2,340
1,659
185
190
144
131
8
2,339
12,072
6,922
7,152
2,458
2,188
841
494
216
94
97
337
9,681
13,246
6,372
5,134
2,602
505
207
155
63
35
136
1,337
2,598
9,788
5,088
3,603
3,401
1,475
426
206
102
66
3
2
-
18
6
49
35
5,435
9,573
7,261
9,176
2,960
2,199
1,532
819
289
170
112
51
74
23
30,203
34,878
38,343
28,274
39,709
-
1966
1967
1968
1,972
13,496
12,027
4,915
3,225
1,401
748
508
519
60
7
4
3
285
6,020
11,409
4,254
1,389
1,624
802
709
356
120
22
15
17
5
79
2,379
10,300
13,379
8,637
3,624
1,098
990
437
251
371
100
50
4
8
38,886
27,026
41,705
3
1969
1970
1971
1,277
9,426
10,508
6,198
2,066
513
278
537
101
34
14
81
5,699
11,631
5,572
3,341
1,517
578
210
221
171
45
59
38
14
117
1,080
2,975
5,960
4,831
3,776
2,317
931
408
241
174
187
83
31
103
30,952
29,179
23,211
•
/N
/
/
A 484
v A\
,
2
•
\10 Spain
/
I
Canada
ty•
-•'
dM
/
1
1958
60
62
fid
66
68
70
72'
Fig. 4. Subdivision 4Vs and Div. 4W cod: catch-per-unit-effort
of Spanish pair trawlers 151-500 gross tons (February to
April inclusive), 1958-70.
Population estimates
An independent check on abundance changes is
provided by population abundance estimates from
cohort analysis (Pope, 1972). Numbers removed at age
(Table 4) are used with an assumed natural mortality of
M = 0.20 and, after several trials, an assumed fishing
mortality for the oldest age-groups of F = 0.50, to give
population numbers at age (Table 5).
1958
60
62
64
66
68
70
72
Fig. 5. Subdivision 4Vs and Div. 4W cod: catch-per-unit-effort
of Canadian side otter trawlers and Spanish pair trawlers,
151-500 gross tons, 1958-71. (Canadian cpe X 10,
Spanish cpe for February-April inclusive.)
The population has remained stable over the
1960-69 period, numbers of 3-11 year olds fluctuating
close to the mean of 186 million fish. The numbers of
the older, fully recruited (see below) age groups 6-11
years old have also remained stable, although in the most
recent years 1966-69 their abundance has been below
the average of 39 million fish.
122
ICNAF RESEARCH BULLETIN NUMBER 9, 1972
TABLE 5. Subdivision 4Vs and Div. 4W cod: Population numbers (X 10 -3 ) per age-group, 1960-69 from Pope's cohort analysis.
Age
Year
1960
1961
1962
1963
1964
1965
1966
1967
1968
1969
Mean
3
4
5
6
7
8
9
10
11
55,783
57,265
36,788
17,510
10,016
6,953
1,440
684
620
68,669
44,867
43,655
23,456
9,145
4,922
3,310
768
409
72,113
56,002
31,975
27,286
12,411
4,615
1,912
1,209
461
37,070
56,925
34,927
19,915
15,868
7,937
1,799
804
542
60,025
30,046
37,846
16,610
10,539
8,346
4,144
1,015
471
78,843
47,935
22,248
22,129
8,996
5,369
3,756
2,058
446
70,154
59,633
30,584
11,645
9,815
4,687
2,406
1,689
944
68,518
55,653
36,612
14,157
5,087
5,118
2,569
1,293
923
60,307
55,840
40,117
19,652
7,742
2,908
2,720
1,378
417
38,056
47,222
36,398
20,739
8,274
3,059
1,387
1,331
733
60,954
51,139
35,115
19,310
9,789
5,391
2,544
1,223
597
E6-11
E 3-11
37,224
187,060
42,010
199,201
47,894
207,984
46,865
175,787
41,125
169,042
42,754
191,780
31,196
191,567
29,147
189,930
34,817
191,081
35,523
157,199
38,856
186,063
Estimates of "available biomass" were obtained
from population numbers and mean weight at age,
adjusting for partial recruitment, giving:
"Available biomass" (metric tons X 10-3)
Year
While confirming the general conclusion from cpe
data that abundance has not changed greatly between
1960 and 1969, these data are in contrast with Spanish
cpe data in indicating a lower abundance in the 1965-69
period than in 1960-64 by about 16% on average.
1960
1961
1962
1963
1964
169
193
225
186
180
Mean = 191
Recruitment
1965
1966
1967
1968
1969
158
157
158
175
157
Mean = 161
The mean recruitment to the stock at age 3 in the
1960-69 period was 61 million fish, showing only
moderate variation between 37 million and 79 million
fish (Table 5). The 1959 and 1962 year-classes were
good while those of 1960 and 1966 were poor.
These data should be more comparable than population
numbers to catch-per-unit-effort data which are also
expressed in terms of weight.
Three-year olds are only slightly recruited to the
fishery, ages 4 and 5 are about 40 and 80% recruited to
the fishery respectively, and full recruitment occurs at
age 6 (Table 6). A graphical estimate from these data
give an age at 50% recruitment of 4.2 years.
TABLE 6. Subdivision 4Vs and Div. 4W cod: Instantaneous fishing mortality (F) per age-group, 1960-69, from Pope's cohort analysis.
Year
Age
1960
1961
1962
1963
1964
1965
1966
1967
1968
1969
Mean
1960-69
recruitment
3
4
5
6
7
8
9
10
11
0.02
0.07
0.25
0.45
0.51
0.54
0.43
0.31
0.45
0.00
0.14
0.27
0.44
0.48
0.75
0.81
0.31
0.72
0.04
0.27
0.27
0.34
0.25
0.74
0.67
0.60
0.73
0.01
0.21
0.53
0.44
0.44
0.45
0.37
0.33
0.38
0.02
0.10
0.34
0.41
0.47
0.56
0.50
0.62
0.66
0.08
0.25
0.45
0.61
0.45
0.60
0.60
0.58
1.26
0.03
0.29
0.57
0.63
0.45
0.40
0.42
0.40
0.93
0.00
0.13
0.42
0.40
0.36
0.43
0.42
0.93
0.56
0.04
0.23
0.46
0.66
0.73
0.54
0.51
0.43
1.09
0.04
0.25
0.38
0.40
0.32
0.20
0.25
0.59
0.17
0.03
0.19
0.39
0.48
0.45
0.52
0.50
0.51
0.70
6
39
80
100
100
100
100
100
100
Mean
6-10
0.45
036
0.52
0.41
0.51
0.57
0.46
0.51
0.57
0.35
Overall mean, ages 6-10 = 0.49
123
HALLIDAY: THE EASTERN SCOTIAN SHELF COD STOCK COMPLEX
Mortality
Estimates of fishing mortality (F), obtained from
cohort analysis, averaged 0.49 for fully recruited age
groups for the 1960-69 period (Table 6). There was little
year-to-year variation.
Growth
I6
1.2
tAt0.10
M.0.20
0.
PA-0.30
There were no consistent trends in mean length at
age among commercial landings in the 1960-71 period.
A von Bertalanffy growth curve fitted to data for
ages 6-10, i.e. those fully recruited age groups best
represented in the fishery, gives the following estimates
of growth parameters:
K
= 0.14
to= 0.07
= 105 cm
The length-weight relationship:
log W = 3.0748 log L -2.1571
obtained for this stock on a July 1971 research vessel
survey, gives a value of Woo = 11.4] kg by substituting
the above value of Loa = 105 -cm.
0.4
04
I
8
6
Instantaneous Fishing
I
I
1.0
I.2
Mortality ( F)
.
I
I. 4
Fig. 6. Subdivision 4Vs and Div. 4W cod: yield-per-recruit.
(Arrows indicate average 1960-69 position on the
curves.)
If M = 0.10, the stock is considerably over
and if M = 0.30, the present yield-per-recruit
is slightly below the maximum (95% of maximum).
Discussion
Yield-Per-Recruit
The values of parameters derived in earlier sections
are substituted in the Beverton and Molt constant
parameter yield-per-recruit model as follows to estimate
yield-per-recruit:
= 0.14
K
to= 0.07
Woo = 11.41 kg
to= 3.0 yrs (4 age at recruitment to the
fishing area)
tp l= 4.2 yrs (= age at recruitment to the
exploited phase)
13 yrs (= maximum age of significant
contribution to the fishery)
Instantaneous natural mortality, M, is not known for
this stock. However, in those cod stocks in the
Northwest Atlantic for which M has been estimated, the
value obtained has been close to 0.20. The values 0.10,
0.20 and 0.30 are used in the yield equation giving the
results shown in Fig. 6.
Assuming M = 0.20, maximum yield-per-recruit is
obtained from this stock at F = 0.45, slightly lower than
current values of F (0.49).
The present analysis suggests that the 4Vs-W cod
fishery was moderately stable over the period of
investigation. Size and age compositions of removals and
quantities landed did not vary greatly and recruitment,
abundance and mortality have also remained fairly
constant. However, there are some inconsistencies in the
results, presumably due to the inaccuracy of some of the
assumptions it has been necessary to make.
Spanish cpe data indicate that stock abundance
gradually increased from 1960-67 and increased substantially in 1968. Abundance estimates from cohort
analysis, which are independent estimates based only on
age compositions and total removals, suggest a lower
abundance in 1965-69 than in 1960-64. Thus, the
assumption that Canadian samples adequately represent
Spanish catches is apparently inaccurate. The discrepancy could be explained by an increasing tendency by
Spain to catch smaller cod resulting in small increases in
cpe even though abundance of larger cod, on which the
Canadian fishery was based, was declining.
The 49n/o increase in Spanish landings in 1968 was
accompanied by a 43% increase in cpe, indicating that
virtually all of the increase in landings was due to
increased cpe and not to increased effort. The increased
•
124
ICNAF RESEARCH BULLETIN NUMBER 9,
1972
cpe may reflect an increase in the catchability coefficient rather than a real increase in abundance, but the
consistency of the other cpe data in the series suggest
that such a substantial change is unlikely. If a real
increase in abundance occurred, it implies that a strong
year class entered the Spanish fishery and was heavily
exploited at an age younger than that normally fished by
Canadians.
maximum yield-per-recruit would be obtained at F
values of 55% of the present level (i.e. F = 0.28).
Increased long-term yield-per-recruit is likely to accrue
from increased age at recruitment to the fishery. If, as
appears to be the case, the number of young fish
removed from the stock is underestimated, then the
greater are the benefits likely to be of reduced fishing
mortality and increased size at first capture.
If Spain has removed fish significantly smaller than
Canada, and if there is an increasing tendency to fish
small cod, this is equivalent to lowering the mean
selection age with a resultant loss in yield-per-recruit.
The Beverton and Holt model predicts increases in
yield-per-recruit at F = 0.50 up to an age at recruitment
to the exploited phase of about 6 years (Fig. 7).
These results are not directly comparable with those
of Beverton and Hodder (eds., 1962). In the 1947-58
period, the fishery was prosecuted predominantly by
hook and line and although Z on fully-recruited age
groups age 10 and over was 0.50, Z on all age-groups age
6 and older must have been considerably less. This value
is not available to compare with current estimates.
Acknowledgements
8
a.
6
0.8
0.7
o
I thank the many individuals in the Groundfish
Investigation, Fisheries Research Board of Canada,
Biological Station, St. Andrews, New Brunswick, who
were instrumental in the collection of the data presented
here, and particularly Mrs I. Thompson and Mr D. N.
Fitzgerald for their help in data analysis. I am grateful to
Drs J. S. Scott and D. G. Wilder for their review of the
manuscript.
0.6
4
0.5
References
BEVERTON, R. J. H., and V. M. HODDER. eds. 1962. Report
of working group of scientists on fishery assessment in
relation to regulation problems. Supplement to Annu. Proc.
2
int. Comm. Northw. Atlant. Fish., 11:81 p.
0
I
.2
4
.6
instantaneous
1
1.4
1.0
12
Fishing Mortality IF)
Fig. 7. Subdivision 4Vs and Div. 4W cod: yield isopleth diagram.
Dot indicates average 1960-69 position. Values on right
define isopleth yields per recruit in kg (K = 0.14; to =
0.07; Woo = 11.41; tp = 1 yr; = 13 yrs; M 0.20.)
Thus, the incomplete information available on the
4Vs-W cod stock indicates that the stock is stable and
being exploited close to the maximum-yield-per-recruit.
However, substantial economic benefits could be obtained by a reduction in fishing mortality — 95% of the
ICNAF. 1966-71. Summary of statistics on discards (whole fish
returned to the sea), 1964-69. Annu. Meet. int. Comm.
Northw. Atlant. Fish. 1966, Res. Doc. No. 10, Serial No.
1664; 1967, Res. Doc. No. 7, Serial No. 1786 (mimeographed). Ira. Comm. Northw. Atlant. Fish. Redbook, Part
III: 1968 (p. 29-36); /969 (p. 115-123); 1970 (p. 181-188);
1971 (p. 297-302).
MARTIN, W. R., and Y. JEAN. 1964. Winter cod taggings off
Cape Breton and on offshore Nova Scotia Banks, 1959-62.
J. Fish. Res. Bd. Canada, 21: 215-238.
POPE, J. G. 1972. An investigation of the accuracy of virtual
population analysis using cohort analysis. Res. Bull. int.
Comm. Northw. Atlant. Fish., this volume, p. 65-74.
TEMPLEMAN, W. 1962. Division of cod stocks in the northwest
Atlantic. Int. Comm. Northw. Atlant. Fish. Redbook 1962,
Part III: 79-123.
125
International Commission for the Northwest Atlantic Fisheries
The Commission in Brief
Under the terms of a Convention signed in 1949, the International Commission for the Northwest Atlantic Fisheries (ICNAF) is
responsible for promoting and co-ordinating scientific studies on the stocks of the species of fish which support international fisheries in
the Northwest Atlantic. Based on these researches, the Commission recommends measures to keep these stocks at a level permitting the
maximum sustained catch.
The governments sharing these conservation interests are Bulgaria, Canada, Denmark, France, Federal Republic of Germany, Iceland,
Italy, Japan, Norway, Poland, Portugal, Romania, Spain, Union of Soviet Socialist Republics, United Kingdom, and United States of
America.
Research Bulletin of ICNAF
The International Commission for the Northwest Atlantic Fisheries invites contributions to its serial publication, "The Research Bulletin
of ICNAF".
There will be one or more issues each year depending on the number of papers received and accepted for publication.
Purpose. The main purpose of the Research Bulletin is to publish the results of research carried out in the ICNAF area It is expected
that most papers published in the Research Bulletin will be selected from papers presented at Annual Meetings of the Commission, but
other papers, either concerning the ICNAF area or outside it, will be accepted if their contents are of importance to the work of the
Commission.
Submission of Manuscripts. Manuscripts for publication should be submitted to the Commission's Secretariat on or before 1 October
each year. This provides authors with sufficient time to revise or extend papers submitted or solicited at the previous Annual Meeting of
the Commission which is held in early June each year. The arrangement also provides the possibility that the Bulletin can be issued
before the next Annual Meeting of the Commission.
Editing. The Editor of the Research Bulletin will be the Executive Secretary of the Commission. He will be assisted on matters of
editorial policy by the Chairman of the Commission's Standing Committee on Research and Statistics and the members of the Steering
and Publications Subcommittee.
Refereeing. To maintain a high standard of publication each contribution will be submitted by the Editor to one or more referees from
a panel of experts appointed for that purpose. On the advice of the referee(s), the Editor will request the author to make such
amendments to his manuscript as will help to avoid error or misunderstanding and add strength to his presentation or will reject the
manuscript. Referees will remain anonymous and will treat all manuscripts as confidential.
Preparation of Manuscripts. To achieve maximum conformity of presentation by authors and to minimize typing and other editorial
work, the Commission's Secretariat has prepared the following aid.
Instructions to Authors for the Preparation of Manuscripts Intended for
Publication in the Research Bulletin of ICNAF
Text
Manuscript should be type-written, double-spaced, and on one side only of good quality white bond quarto paper,
size 81/2 X 11 inches (220 X 280 mm).
Leave all margins 1 inch (25 mm) to 11/2 inches (38 mm) for editorial marks and queries.
Prepare and submit the original and two carbon copies of the text and at least two sets of illustrations.
Number all pages of the manuscript consecutively with Arabic numerals in the centre of the top margin space.
Start a new page for each of the following sections with appropriate headings and sub-headings: (1) title, name and
address of author, list of contents (if applicable); (2) abstract of the paper; (3) text; (4) references to literature; (5)
tables; (6) legends for figures and (7) figures.
Please double-space everything — Text, quotations, footnotes, tables and table headings, legends, references to
literature, and use even greater spacing where helpful (particularly around equations and formulate).
Wherever practical the text should be subheaded into Introduction, Materials and Methods, Results, and Discussion.
Authors must provide a Summary which lists one by one the principal facts and conclusions of the paper.
Acknowledgements should be placed immediately after the Summary.
All measurements, linear, weight, and time, should be given in numerals (not words) in the metric system. The
Celsius scale should be used as a standard. When other units of measure are preferred, authors should include
equivalents in metric units.
Footnotes should be avoided as far as possible, but if necessary they must be numbered consecutively in the text
and type under a horizontal line at the foot of the page concerned.
Only those words to be printed in italics should be underlined.
(This page is perforated. TEAR OUT and file for future use)
126
Abstract
Each manuscript should have an abstract not to exceed 3% of the length of the text or 200 words whichever is the smaller.
For position of the abstract in the manuscript see (e) above. The abstract should summarize the contents and conclusions
of the paper, point to new information in the paper and indicate the relevance of the work.
Tables
Tables should be carefully constructed so that the data presented may be easily understood.
Tables should be set out on separate sheets following the references.
Position of the tables in the text should be indicated clearly.
Each table should be provided with a descriptive heading which, together with the column headings, makes the table
intelligible without reference to the text.
e)
Tables should be numbered consecutively with Arabic numerals, e.g. Table 1, 2, 3, etc.
Figures
All illustrations, whether black-and-white drawings, graphs, photographs, or tone drawings, are to be considered as
figures.
Each figure should be mentioned and described in the text.
A legend should be provided for each figure; the legends should all be typed together on a separate sheet or sheets
attached to the manuscript following the tables.
e)
1)
a)
h)
Figures should be numbered consecutively with Arabic numerals, as Fig. 1, 2, 3, etc.
Figures should be set out on sheets preferably the same size as the text pages and in any case should not require a
printer's reduction to less than one-third. Small figures can be arranged in groups on sheets the same size as the text
pages.
For guidance in preparing figures, the size of the printed area of the Research Bulletin page is 21 X 17 cm. The
Bulletin will have a two-column format, each column 8 cm wide.
Photographs presented as figures should be high contrast, glossy prints, about 5 X 7 inches (125 X 175 mm) in size
and should be shipped flat protected by stout cardboard.
Each illustration should be identified by marking on the back lightly in soft pencil on the margin the figure number
and the author's name.
Bibliographic Style
a)
References to literature in the text should be by the author-date system, for example
It was reported that (Collins, 1960) the ...;
In examining the situation, Rossini (1959) felt that ...
Where more than one paper by the same author(s) have appeared in one year, reference should be given as follows:
or
Osborne and Mendel (1914a); Osborne. and Mendel (19146)
Oxborne and Mendel (1914a and b); (Barnet and Robinson, 1942; King and Pierce 1943a, 1954)
Reference to material not yet submitted for publication should be written into the text e.g. "Harvey, in an
unpublished manuscript, ..." or "Harvey, in a letter, ..."
h)
All references cited by the author-name system in the text should be listed alphabetically by the surname of the first
author at the end of the paper. Year of publication follows the authorship. Then give the full title of the paper. This
should be followed by the abbreviated name of the periodical with the volume and pages in Arabic numbers (e.g.
:2 : 120 -136). For abbreviations of periodicals follow the "Word List of Scientific Periodicals". An issue, number
supplement or other part within a volume is shown in parentheses only when paged independently (e.g.:
2(4) :1 - 56; 34 (Suppl.2) :1 - 26). Any special Series (Ser 3, III, cr C) precedes the volume number. In book
citations after the title, there appears the edition, the publisher's name, place of publication, and the number of
pages if one volume, but the number of volumes if more. Reference to material submitted but not yet published
should be referred to in the list of references as "in press" or "Submitted for publication" followed by the date of
submission.
A1.4 CORRESPONDENCE should be addressed to:
Executive Secretary,
International Commission for the Northwest Atlantic Fisheries,
P. O. Box 638,
Dartmouth, Nova Scotia
Canada.


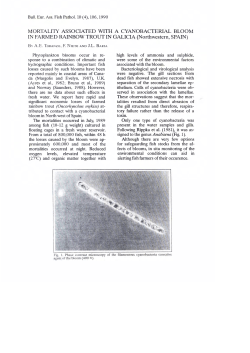


© Copyright 2026