
Community Check-Up: Porcupine Health Unit Status Report 2006
Community Check-Up: A PHU Status Report Foyez Haque, MBBS, MHSc, Public Health Epidemiologist Published by the Porcupine Health Unit Timmins, Ontario © September 2006 Acknowledgements I would like to take the opportunity to thank those who helped me to make this Community Check-Up a reality. Foremost, I would like to thank the management committee at the Porcupine Health Unit for their continued enthusiasm, for their encouragement, and for their valuable comments. A special thanks goes to Dr. Alberto G. de la Rocha for his detailed revision. Thanks to fellow epidemiologists Lee Sieswerda, Jane Hohenadel, Darshaka Malaviarachchi, Adam Stevens, and Mamdouth Shubair for helping me to use their published templates and for supporting me when I was in the middle of an ocean of numbers without any life support. Thanks to Isabel Dagg and Lynda Collins of Genetics services and Anna Gauthier of Dental services for providing statistics on their services as well as valuable comments. Eric Glaister deserves more than a pat on the back for helping me to continue working on different datasets on one single computer without any interruption. Thanks to Bonnie Schultz and Rita Numainville, for preliminary editing and clerical support, and Gary Schelling for assisting me with the design, layout and distribution of this report. Finally, I would like to extend my appreciation to my wife Yasmin Azher, whose support, even during her pregnancy and delivery of our baby boy, Rahat S. Haque, has made this work possible. Foyez Haque, MBBS, MHSc Public Health Epidemiologist Community Check-Up: Porcupine Health Unit iii iv Community Check-Up: Porcupine Health Unit Contents Acknowledgements . . . . . . . . . . . . . . . . . . . . . . . . . . . . . . . . . . . . . . . . . . . . . . . . . i Preface. . . . . . . . . . . . . . . . . . . . . . . . . . . . . . . . . . . . . . . . . . . . . . . . . . . . . . . . . . ix Executive Summary. . . . . . . . . . . . . . . . . . . . . . . . . . . . . . . . . . . . . . . . . . . . . . . . . xi 1 Demography. . . . . . . . . . . . . . . . . . . . . . . . . . . . . . . . . . . . . . . . . . . . . . . . . 1 2 Environment & Health. . . . . . . . . . . . . . . . . . . . . . . . . . . . . . . . . . . . . . . . . 13 3 Reproductive Outcomes & Child Health. . . . . . . . . . . . . . . . . . . . . . . . . . . . 25 4 Genetic Diseases & Congenital Anomalies. . . . . . . . . . . . . . . . . . . . . . . . . . . 45 5 Health Risk Behaviour . . . . . . . . . . . . . . . . . . . . . . . . . . . . . . . . . . . . . . . . . 49 6 Nutrition . . . . . . . . . . . . . . . . . . . . . . . . . . . . . . . . . . . . . . . . . . . . . . . . . . . 63 7 Dental Health. . . . . . . . . . . . . . . . . . . . . . . . . . . . . . . . . . . . . . . . . . . . . . . . 73 8 Mental Health. . . . . . . . . . . . . . . . . . . . . . . . . . . . . . . . . . . . . . . . . . . . . . . 77 9 Communicable & Infectious Diseases . . . . . . . . . . . . . . . . . . . . . . . . . . . . . . 81 10 Morbidity Patterns . . . . . . . . . . . . . . . . . . . . . . . . . . . . . . . . . . . . . . . . . . . 87 11 Cancer Statistics . . . . . . . . . . . . . . . . . . . . . . . . . . . . . . . . . . . . . . . . . . . . . . 93 12 Mortality Patterns . . . . . . . . . . . . . . . . . . . . . . . . . . . . . . . . . . . . . . . . . . . 103 Community Check-Up: Porcupine Health Unit List of tables Table 1: 2001 Population distribution for the Porcupine Health Unit area, by CSD. . . . . . . . . . . . . . . . . . . . . . 2 Table 2: Changes in the population of Cochrane District including Hornepayne (Algoma Census Division) from 1991 to 2001. . . . . . . . . . . . . . . . . . . . . . . . . . . . . . . . . . . . . . . . 3 Table 3: Distribution of total population by ethnic origin. . . . . . . . . . . . . . . . . . . . . . . . . . . . . . . . . . . . . . . 4 Table 4: Population estimates for first nation communities in the Porcupine Health Unit area . . . . . . . . . . . . . 5 Table 5: 2001 Education level — Age 20 and over. . . . . . . . . . . . . . . . . . . . . . . . . . . . . . . . . . . . . . . . . . . 8 Table 6: Highest level of schooling for population age 20 and over. . . . . . . . . . . . . . . . . . . . . . . . . . . . . . . . 9 Table 7: 2000 Income distributions for population age 15 years and over . . . . . . . . . . . . . . . . . . . . . . . . . . 10 Table 8:Description regarding water treatment systems in Timmins. . . . . . . . . . . . . . . . . . . . . . . . . . . . . . 18 Table 9: 2004 water distribution miscellaneous summary20 Table 10: Rate of neural tube defects (NTDs), Canada, 1991-1999. . . . . . . . . . . . . . . . . . . . . . . . . . . . . . . . 30 Table 11: Rate of neural tube defects (NTDs), by province/territory, Canada, 1997-1999 combined. . . . . . . . . . 31 Table 12: Maternal mortality ratio (MMR) per 100,000 live births, according to age in Canada (excluding Quebec), 1997 -2000 . . . . . . . . . . . . . . . . . . . . . . . . . . . . . . . . . . . . . . . . . . . . . . . . 38 Table 13: Rate and duration of breastfeeding, by maternal age. . . . . . . . . . . . . . . . . . . . . . . . . . . . . . . . . . 41 Table 14: Rate and duration of breastfeeding by region/province. . . . . . . . . . . . . . . . . . . . . . . . . . . . . . . . . 41 Table 15: Proportion of overweight and obesity, Ontario. . . . . . . . . . . . . . . . . . . . . . . . . . . . . . . . . . . . . . . 65 Table 16: Gastrointestinal infections in the Porcupine Health Unit, 1990-2004, Rate/100,000 . . . . . . . . . . . . . 82 Table 17: Rate of hepatitis among the population of the Porcupine Health Unit area, 1990-2004, Rate/100,00083 Table 18: Vaccine-preventable diseases, Porcupine Health Unit, Rate/100,000 . . . . . . . . . . . . . . . . . . . . . . . 84 Table 19: Sexually transmitted infections in the Porcupine Health Unit Rate/100,000 population. . . . . . . . . . . 85 Table 20: Leading causes of hospitalization in the Porcupine Health Unit area . . . . . . . . . . . . . . . . . . . . . . . . 91 Table 21: Age-specific death counts and rates (per 1000 population), Porcupine Health Unit and Ontario (1997–2001). . . . . . . . . . . . . . . . . . . . . . . . . . . . . . . . . . . . . . . . . . . . . . . . . . . . . . . . . . . . . . 104 vi Community Check-Up: Porcupine Health Unit Table 22: Cause specific deaths by ICD9-Chapter for the Porcupine Health Unit and Ontario, 1997–2001, five-year average. . . . . . . . . . . . . . . . . . . . . . . . . . . . . . . . . . . . . . . . . . . . . . . . . . 109 Table 23: Potential years of life lost by cause and sex, Porcupine Health Unit, 1997-2001, rate per 100,000, five-year average. . . . . . . . . . . . . . . . . . . . . . . . . . . . . . . . . . . . . . . . . . . . . . . . . . . . . . . . . . . 110 Community Check-Up: Porcupine Health Unit vii List of figures Boundaries of the Porcupine Health Unit. . . . . . . . . . . . . . . . . . . . . . . . . . . . . . . . . . . . . . . . . . . . . . . . . . . . xiv Figure 1: Aboriginal population. . . . . . . . . . . . . . . . . . . . . . . . . . . . . . . . . . . . . . . . . . . . . . . . . . . . . . . . . 6 Figure 2: Aboriginal group . . . . . . . . . . . . . . . . . . . . . . . . . . . . . . . . . . . . . . . . . . . . . . . . . . . . . . . . . . . . 7 Figure 3: Comparison of hourly AQI reading by category between Timmins and Sudbury. . . . . . . . . . . . . . . . 14 Figure 4: Comparison of fine particulate matter in Sault Ste. Marie, Timmins, North Bay, 2003. . . . . . . . . . . . 15 Figure 5: The Mattagami Watershed. . . . . . . . . . . . . . . . . . . . . . . . . . . . . . . . . . . . . . . . . . . . . . . . . . . . 16 Figure 6: Exceedances in acceptable E. coli levels.Average Proportions of Geometric Means (GM) > 100, Gillies Lake, 2001–2005. . . . . . . . . . . . . . . . . . . . . . . . . . . . . . . . . . . . . . . . . . . . . . . . . . . . . . 22 Figure 7: Comparison of crude birth rate between the Porcupine Health Unit and Ontario . . . . . . . . . . . . . . . 26 Figure 8: Comparison of preterm birth rate between the Porcupine Health Unit and Ontario. . . . . . . . . . . . . . 27 Figure 9: Comparison of low birth weight between the Porcupine Health Unit, Ontario and Canada. . . . . . . . 28 Figure 10: Infant Mortality Rate, Canada, 1960-1995. . . . . . . . . . . . . . . . . . . . . . . . . . . . . . . . . . . . . . . . . . 32 Figure 11: Infant mortality rate, comparing Cochrane District, Ontario and Canada. . . . . . . . . . . . . . . . . . . . . 32 Figure 12: Causes of Infant Death in Canada (excluding Ontario), 1999. . . . . . . . . . . . . . . . . . . . . . . . . . . . . 33 Figure 13: Trends of teen pregnancy in the Porcupine Health Unit area and Ontario, 1996-2001. . . . . . . . . . . . 34 Figure 14: Comparison of teenage pregnancy rate among the Northern Health Units and Ontario, 2001. . . . . . 35 Figure 15: Comparison of teenage abortion rate in Northern Health Units and Ontario, 2001. . . . . . . . . . . . . . 36 Figure 16: SIDS Rates, Provinces & Territories, 1996. . . . . . . . . . . . . . . . . . . . . . . . . . . . . . . . . . . . . . . . . . . 37 Figure 17: Percentage of breastfeeding or bottle-feeding within the first 48 hours after the child’s birth, all Northern health units. . . . . . . . . . . . . . . . . . . . . . . . . . . . . . . . . . . . . . . . . . . . . . . . . . . . . . 40 Figure 18: Percentage of respondents with children born in 2000-02 who breastfed in the first 48 hours after the child’s birth, all Northern health units. . . . . . . . . . . . . . . . . . . . . . . . . . . . . . . . . . . . . . . 42 Figure 19: Leading causes of referral to PHU Genetic Services Program in 2004. . . . . . . . . . . . . . . . . . . . . . . . 46 Figure 20:Congenital anomalies in different PHU communities (1989-2000). . . . . . . . . . . . . . . . . . . . . . . . . 47 Figure 21: Activity levels for Ontario and Porcupine Health Unit, ages over 12, 2001-02. . . . . . . . . . . . . . . . . . 50 viii Community Check-Up: Porcupine Health Unit Figure 22: Leisure activity in Ontario and Porcupine Health Unit, ages over 12, 2001-02. . . . . . . . . . . . . . . . . . 51 Figure 23: Type of smoking behaviour in Ontario and Porcupine Health Unit area, 2001-02. . . . . . . . . . . . . . . 52 Figure 24: Proportion of daily smokers in Ontario and Porcupine Health Unit area, 2001-02. . . . . . . . . . . . . . . 53 Figure 25: Proportion of individuals ( >12 years of age) exposed to second-hand smoke at home in Ontario and Porcupine Health Unit area, 2001–02. . . . . . . . . . . . . . . . . . . . . . . . . . . . . . . . . . . . . . . . . . 54 Figure 26: Frequency of drinking 5 or more drinks on one occasion in last 12 months, in Canada, Ontario and Porcupine Health Unit area, 2001-02. . . . . . . . . . . . . . . . . . . . . . . . . . . . . . . . . . . . . . . . . . . . . 56 Figure 27: Percentage of Canadian population aged 15 years or older who used marijuana in past years, by age group, 1994 & 2002. . . . . . . . . . . . . . . . . . . . . . . . . . . . . . . . . . . . . . . . . . . . . . . . . . . . 57 Figure 28: Percentage reporting marijuana use during past year, Grade 7–12, 1993–2003. . . . . . . . . . . . . . . . 58 Figure 29: Self-reported drug use (among those who reported taking drugs) in the last 12 months in Timmins high schools, 1998–2000. . . . . . . . . . . . . . . . . . . . . . . . . . . . . . . . . . . . . . . . . . . . . 59 Figure 30: Self-reported drug use (among those who reported taking drugs) in the last 12 months in Timmins high schools, 1998–2000. . . . . . . . . . . . . . . . . . . . . . . . . . . . . . . . . . . . . . . . . . . . . 60 Figure 31: Prevalence of obesity among boys and girls. . . . . . . . . . . . . . . . . . . . . . . . . . . . . . . . . . . . . . . . . 64 Figure 32: Weight categories for Ontario and Porcupine Health Unit, ages over 18, 2001–02. . . . . . . . . . . . . . 66 Figure 33: Weight categories for Porcupine Health Unit, by gender, ages over 20-64, 2001–02. . . . . . . . . . . . . 67 Figure 34: Weight categories for Porcupine Health Unit, by age group (over 18), 2001–02. . . . . . . . . . . . . . . . 68 Figure 35: Vegetables and fruit consumption per day for Ontario and Porcupine Health Unit, 2001–02. . . . . . . 69 Figure 36: Vegetables and fruit consumption per day for Porcupine Health Unit, by gender, 2001–02. . . . . . . . 70 Figure 37: Vegetables and fruit consumption per day for Porcupine Health Unit, for ages over 18, 2001–02 (5–10 servings per day). . . . . . . . . . . . . . . . . . . . . . . . . . . . . . . . . . . . . . . . . . . . . . . . . . . . . . . 71 Figure 38: Percentage of children with acute tooth decay (1996–2005). . . . . . . . . . . . . . . . . . . . . . . . . . . . . 74 Figure 39: Caries-free 5 year old children in various Northern Ontario health units, 2002–04 . . . . . . . . . . . . . . 75 Figure 40: Mean deft score for 5-year-old children in various Northern Ontario health units, 2002–04. . . . . . . . 76 Figure 41: Prevalence of mental illnesses, comparing rates between males & females in Canada, 2002–03. . . . 78 Figure 42: Prevalence of mental illnesses, in Timmins, 2004–05 . . . . . . . . . . . . . . . . . . . . . . . . . . . . . . . . . . 79 Figure 43: Comparison of chlamydia infection among Canada, Ontario and Porcupine Health Unit (1996–2002). . . . . . . . . . . . . . . . . . . . . . . . . . . . . . . . . . . . . . . . . . . . . . . . . . . . . . . . . . . . . . 86 Community Check-Up: Porcupine Health Unit ix Figure 44: Inpatient hospitalizations for Canada, 1995–96 to 2004–05. . . . . . . . . . . . . . . . . . . . . . . . . . . . . 88 Figure 45: Leading causes of hospitalization in Ontario and in the Porcupine Health Unit area, 2000–2004. . . . 89 Figure 46: Comparison of age-specific respiratory & cardiovascular rates, Porcupine Health Unit area, 2000–2004. . . . . . . . . . . . . . . . . . . . . . . . . . . . . . . . . . . . . . . . . . . . . . . . . . . . . . . . . . . . . . . 90 Figure 47: Leading cause of cancer incidence, in both genders, Porcupine Health Unit area, 2002. . . . . . . . . . . 94 Figure 48: Trends of the incidence of trachea, bronchus and lung cancer, in Ontario and Porcupine Health Unit area, 1983–2002. . . . . . . . . . . . . . . . . . . . . . . . . . . . . . . . . . . . . . . . . . . 95 Figure 49: Trends of the incidence of prostate cancer, in Ontario and Porcupine Health Unit area, 1983–2002. . 96 Figure 50: Trends of breast cancer incidence, in Ontario and Porcupine Health Unit area, 1983–2002. . . . . . . . 97 Figure 51: Mortality due to cancer of the trachea, bronchus and lung, in Ontario and Porcupine Health Unit area, 1983–2002. . . . . . . . . . . . . . . . . . . . . . . . . . . . . . . . . . . . . . . . . . . 98 Figure 52: Mortality due to breast cancer, in Ontario and Porcupine Health Unit area, 1983–2002 . . . . . . . . . . 99 Figure 53: Mortality due to prostate cancer, in Ontario and Porcupine Health Unit area, 1983–2002. . . . . . . . . 100 Figure 54: Mortality due to colon cancer, in Ontario and Porcupine Health Unit area, 1983–2002. . . . . . . . . . . 101 Figure 55: Life expectancy at birth, male and female, in Ontario, 1979–1999. . . . . . . . . . . . . . . . . . . . . . . . . 105 Figure 56: Life expectancy at age 65, male and female, in Ontario, 1979–1999. . . . . . . . . . . . . . . . . . . . . . . . 106 Figure 57: Life expectancy at birth, Northern health units and Ontario, 2001. . . . . . . . . . . . . . . . . . . . . . . . . . 107 Figure 58: Life expectancy at age 65, Northern health units and Ontario, 2001. . . . . . . . . . . . . . . . . . . . . . . . 108 Community Check-Up: Porcupine Health Unit Preface The Porcupine Health Unit is an organization that works with communities in our area to promote and protect health. Together, we are committed to understand our health and safety and their determinants, and provide a variety of relevant, responsive and effective programs that will improve and protect our health. The Community Check-Up, Porcupine Health Unit Status Report supports the health unit’s mission statement by describing the health status of the population of the area. This report describes the core indicators set by the Mandatory Health Programs and Services Guidelines by the Ministry of Health and Long-Term Care. Other than the core indicators, this report also describes the mental health status of the population of the City of Timmins. By reckoning the indicators, this report helps health planners to take necessary measures to achieve the goals of their programs. The various indicators in the Community Check-Up provide a snapshot of how the Porcupine Health Unit is doing in public health areas. They include the demographics of the area, air and water quality, crude birth rate, preterm birth rate, teenage pregnancy rate, physical activity, smoking status, alcohol drinking status, body weights, indices of dental health, communicable diseases, morbidity and mortality rates, cancer rates and potential years of life lost. With each indicator in this report, a description and a graph or table have been attached. To allow the readers to evaluate the progress, comparisons Community Check-Up: Porcupine Health Unit xi were made between Ontario and Canada (where applicable). This report uses the most up-to-date data available at the time of writing to describe the determinants of health of the Porcupine Health Unit area. Data that are used to publish this report come from provincial and national data sources, i.e., Statistics Canada: Census 2001, the Provincial Health Planning Database (PHPDB), the Health Planning Service Database (HELPS) , 1.1 and 2.1 , the Canadian Community Health Survey (CCHS), the Integrated Public Health Information System (iPHIS), and Cancer Care Ontario Data (SEER Stat 5.3.1). The intent of this publication is to provide updated information to health planners, local community leaders, community partners and the residents of the Porcupine Health Unit area, helping them make our community safe and helping them protect our health. All data were analyzed using SPSS 13.0 (SPSS Inc., Illinois, USA) and STATA 9.1 (STATA Corp., Texas, USA) and are presented according to source guidelines, including weighted values and collapsing response categories, where required. A P-value less than 0.05 was considered statistically significant. When rates were compared among different years, the population estimates were extracted from the PHPDB database and also from 2001 Census. During the CCHS data analysis, when the number of observations for a variable was (on which an estimate was based) less than 30, the weighted estimate was not published in this report, regardless of the value of the coefficient of variation. xii Community Check-Up: Porcupine Health Unit Executive Summary Community Check-Up: A Porcupine Health Unit Status Report highlights the health status of the people living in the geographic area served by the Porcupine Health Unit. G Between 1996 and 2001, the population declined in the area served by the Porcupine Health Unit. In particular, the population of the City of Timmins (the largest city in the catchment area) has declined 8%. G In the area, over eleven percent (11%) of the population are aborig- inal people. G With respect to education level, 38.8% of the area’s population do not have a secondary school certificate: higher than Ontario at 25.6% and Canada at 27.9%. A lower proportion of people (7.8%) in the area have a university degree when compared to Ontario (19.2%) and Canada (16.9%). G Timmins air quality was better than other Northern Ontario cities in 2003. There were no adverse particles or organisms in the Timmins drinking water in the year 2004. G There was a decline in the crude birth rate in the Porcupine Health Unit area as well in Ontario. G In the last 30 years, the infant mortality rate has subsided in both the health unit area and in Canada as a whole. In 2001, the teen pregnancy rate was 43.5/1,000 in the Porcupine Health Unit area, compared to 30.5/1,000 in Ontario. Community Check-Up: Porcupine Health Unit xiii G Sixty-five percent (65.1%) of mothers in the Porcupine Health Unit area breastfed their babies within 48 hours of birth, compared to 77.2% of mothers in all Northern Ontario health unit areas. G Hornepayne had the highest prevalence of congenital anomalies (519.0/10,000 live births) when compared to other jurisdictions within the Porcupine Health Unit catchment area. G Twenty-seven percent (27.1%) of people over the age of 12, in the Por- cupine Health Unit area, identified themselves as a daily smoker, compared to 16.7% in the Province of Ontario. G The Porcupine Health Unit area population had a higher rate of drink- ing 5 or more drinks (on more than one occasion, in the last 12 months) (30.2%) compared to that of Ontario (20.5%) and Canada (20.7%) in the year 2001– 02. G Marijuana was the most popular substance abused by youths in Tim- mins in 2002. G Twenty percent (20.1%) of the population of the Porcupine Heath Unit over 18 years of age were obese, compared to 13.4% of Ontarians in 2001–02. G Twenty-nine percent (29.2%) of the population of the health unit area ate the recommended 5–10 servings of fruit and vegetables per day, compared to 36% (36.5%) of Ontarians. G The percentage of children with acute tooth decay has increased from 11.2% in 1996–97 to 14.7% in 2004– 05. G Forty-seven percent (47%) of the mentally ill population suffered from mood disorders and 38% suffered from psychotic or schizophrenic disorders during 2004–05 in Timmins. G Salmonella was the most prevalent gastrointestinal micro-organism (11.2/100,000 population) in the health unit area. xiv Community Check-Up: Porcupine Health Unit G In 2004, 24.7/100,000 population suffered from hepatitis C in the catch- ment area. G Chlamydia trachomatis had the highest prevalence rate (226.7/100,000 population) of sexually transmitted infections reported in 2004. G Cardiovascular disease was the highest leading cause of hospitalization in the Porcupine Health Unit area, (15.6%) followed by neurological and psychiatric disease (12.2%) and pregnancy and child birth (12.1%). G In the Porcupine Health Unit area, cancer of the trachea, bronchus and lung were the most prevalent cancers (61.9/100,000), followed by breast (61.6/100,000) and prostate cancer (56.3%). G In Ontario, the difference in life expectancy at birth among males and females has been narrowing over the last 20 years (1979–99). G Diseases of the circulatory and blood-forming system were the highest leading causes of mortality (33.3%) in the Porcupine Health Unit area, followed by cancer (27.6%) and respiratory disease (9.5%). G Cancer was the highest leading cause of potential year of life lost (1,654/100,000) in the health unit area, followed by injury and poisoning (1,231/100,000) and cardiovascular disease (1,178/100,000) in the years 2000–04. Community Check-Up: Porcupine Health Unit xv Boundaries of the Porcupine Health Unit Porcupine Source: xvi Community Check-Up: Porcupine Health Unit http://www.alphaweb.org/map.asp. Accessed on April 06, 2006. 1 g Demography The Porcupine Health Unit area is located in the northeastern part of the Province of Ontario and extends from the Cochrane District to the south, and north to Attawapiskat, east to the Province of Quebec and west to the District of Kenora. The health unit also serves the Hornepayne Township in the District of Algoma. Statistics Canada also included the Attawapiskat and Peawanuck reserve census subdivisions of Kenora District as part of the health unit in the 2001 census. A detailed 2005 edition of the Population Profile is available in the Porcupine Health Unit website at www. porcupinehu.on.ca. Population according to age and gender From the year 1991 to the year 2001, the population in the 0–44 year-old group has steadily decreased in the Porcupine Health Unit area. In the 0–9 year-old group, the decrease was from 15.7% to 12.7%; in the 10–19 yearold group, the decrease was from 16% to 15.4%. The decrease was more substantial in the 20–44 year-old group, dropping from 40% to 35.6%. As a counterpoint, the older population, from 45 to 64 years of age, has experienced a 5% increase. The most notable change occurred in the population over 65 years of age. The proportion of the people in this age group (12.1%) was close to equal to the national proportion (13.0%). The proportion of males and females was almost equal in the general popula- Community Check-Up: Porcupine Health Unit Table 1: 2001 Population distribution for the Porcupine Health Unit area, by CSD Census Subdivision and Type Pop. 2001 Pop. 1996 (unadjusted) Cochrane T (Dissolved) 5,690 5,955 (4,443) Glackmeyer TP 1,070 105 New Post 69 A R Cochrane Office Area Total Constance Lake 92 R 5,795 723 Hearst T 5,825 Mattice-Val Cote TP 891 % Change 1996–2001 Land area (km2) -4.5 538.7 6.9 0 (1,092) -2.0 1.2 450.7 71 47.9 0.1 1.2 6,060 (5,606) -4.6 539.9 458.8 596 21.3 0.8 26.2 6,049 -3.7 6.7 98.7 935 -4.7 1.0 414.6 Hearst Office Area Total 7,439 7,580 -1.9 8.5 539.5 Hornepayne TP 1,362 1,480 -8.0 1.6 204.5 Iroquois Falls T–Office Area Total 5,217 Fauquier-Strickland TP 678 5,714 -8.7 5.9 599.4 7471 (684) -9.2 0.8 1,013.6 Kapuskasing T 9,238 10,036 -8.0 10.5 83.9 Moonbeam TP 1,201 1,322 -9.2 1.4 235.2 Opasatika TP 325 349 -6.9 0.4 330.0 1,112 -8.1 1.2 382.6 13,566 (13503) -7.7 14.2 2,045.3 127 92 38.0 0.1 78.7 Black River-Matheson TP 2,912 3,222 (3220) -9.6 3.3 2,291.0 Matheson Office Area Total 3,039 3,349 (3312) -9.3 3.5 2,369.7 Attawapiskat 91 A R 1,293 1,258 2.8 1.5 2.02 F Factory Island 1 R 1,430 1,286 11.2 1.6 3.1 601 -26.6 0.5 4.2 0 359.5 Val Rita-Harty TP 1,022 Kapuskasing Office Area Total Abitibi 70 R Fort Albany (Part) 67 R-Cochrane 12,464 441 1 Fort Albany (Part) 67 R-Kenora 0 1,004 Marten Falls 65 R 02 204 0.02 0 81.4 Moose Factory 68 R 0 0 0 0 168.8 2 2 New Post 69 R 0 0 0 19.1 Peawanuck S-E 193 239 -19.2 0.2 1.5 3,357 4,592 26.8 3.8 639.6 1,939 (1,939) -51.7 1.1 533.8 1,982 -7.7 2.1 199.8 0 0 58.33 James Bay Area Total Moosonee T - Office Area Total) Smooth Rock Falls T–Office Area Total 936 1,830 Flying Post 73 R 0 0 0 Timmins C 43,686 47,499 -8.0 49.8 2,961.5 Timmins Office Area Total 43,686 47,499 -8.0 49.84 3,019.9 1 Cochrane UNO North Part 3,702 (4,187) -20.3 3.4 130,594.9 Cochrane UNO SE Part 21 29 -27.6 0.02 53.1 Cochrane UNO SW Part 0 2 -100.0 0 553.4 3,733 (4,218) -20.44 3.4 131,201.4 Cochrane UNO Total Health Unit Total Source: 2,949 2,970 88,095 97,425 (92,074) -9.8 (-9.7) Porcupine Health Unit Area Population Profile 1999, Statistics Canada–2001 Census 1. Counts have been adjusted to reflect 2001 Census boundaries 2. Incompletely Enumerated Indian Reserves and Indian Settlements % of 2001 Population Community Check-Up: Porcupine Health Unit 141,892.9 Table 2: Changes in the population of Cochrane District including Hornepayne (Algoma Census Division) from 1991 to 2001 Males Age 0-9 1991 7,360 6,660 5,365 % Gender 15.8 14.5 13.1 15.3 14.2 12.4 8.0 7.3 6.54 7.7 7.0 7,910 7,650 6,825 7,345 16.4 16.1 15.76 8.3 8.1 19,��� 380 % Gender % Area Pop. 1991 1996 2001 14,985 13,550 11,030 6.2 15.7 14.3 12.74 7,190 6,490 15,255 14,840 13,315 15.2 15.3 14.99 7.9 7.7 7.6 7.5 16 15.7 15.37 18,575 15,390 18,815 18,120 15,415 38,195 36,695 30,805 40.2 39.0 35.53 39.0 38.5 35.60 20.3 19.6 17.8 19.7 19.1 17.8 40.0 38.7 35.57 9,320 10,120 10,770 8,760 9,610 10,230 18,080 19,730 21,000 19.3 21.2 24.86 18.2 20.4 23.63 9.8 10.7 12.4 9.2 10.1 11.8 18.9 20.8 24.3 4,025 4,415 4,665 4,995 5,480 5,795 9,020 9,895 10,460 % Gender 8.3 9.3 10.77 10.4 11.6 13.38 % Area Pop. 4.2 4.7 5.4 5.3 5.8 6.7 9.4 10.4 12.1 48,260 47,650 43,315 47,275 47,060 43,295 95,535 94,710 86,610 50.5 50.3 50.0 49.5 49.7 50.0 Number Number Number % Area Pop. Number All Ages 2001 5665 % Gender 65+ 1996 6,890 % Area Pop. 45-64 1991 7,625 % Gender 20-44 2001 Both Number % Area Pop. 10-19 1996 Females Number % Area Pop. Source: Notes: Porcupine Health Unit Area Population Profile 1999, Statistics Canada–2001 Census Total population number may differ from other tables due to rounding from the age-sex subtotals. Percents may not add to 100 due to rounding. Abitibi and Constance Lake are enumerated in 1986 census as reserve type CSDS. Blue colour denotes the decreasing trend of the population group Red colour denoted the increasing trend of the population group tion (50.01% vs. 49.99%), but interestingly, the proportion of females 65 years or older was higher than the male proportion (13.4% female vs. 10.8% male). This rate reflected the provincial and national figure at 14.4% and 11.3% for female and male respectively. From 1986 to 2001, significant density changes occurred in the population of a number of groups. A notable density decrement — ranging from 10 to 29 percent — took place among the 0–44 age group. In contrast, the 45 to > 65 age group experienced a density increment ranging from 20 to Community Check-Up: Porcupine Health Unit Table 3: Distribution of total population by ethnic origin Ethnic Origin Porcupine Health Unit (% Pop.) Timmins (% Pop.) Ontario (% Pop.) Canada (% Pop.) Canadian 56.1 52.4 29.7 39.4 French 40.3 43.3 10.9 15.8 English 15.3 18.8 24.0 20.2 Irish 11.2 13.9 15.6 12.9 10.3 4.6 2.2 3.4 Scottish 9.1 11.3 16.3 14.0 German 4.3 5.0 8.6 9.3 Italian 3.6 5.9 6.9 4.3 Metis 3.2 4.0 0.5 1.0 Polish 2.1 2.8 3.4 2.8 Ukrainian 1.9 2.5 2.6 3.6 Finnish 1.6 2.4 0.6 0.4 Dutch (Netherlands) 1.3 1.4 3.9 3.1 North American Indian Source: Statistics Canada, 2001 Census 31 percent (Table 2). Aboriginal Population The population of the First Nation reserves does not always conform to the estimates enumerated by Statistics Canada due to a lack of community participation in the census. In several First Nation Bands, the Chief’s offices enumerate their own population. Table 4 shows the discrepancy between the 2001 census and the original source. Community Check-Up: Porcupine Health Unit Table 4: Population estimates for first nation communities in the Porcupine Health Unit area Census Division Kenora District Census Subdivision Attawapiskat Population Estimates Community 1 1,520 1,293 2002 1,5642 0 2004 1 67 193 2002 Marten Falls/Ogaki 3061 0 2002 Constance Lake 1 787 723 2002 Fort Albany Part 1,0653 441 2003 Moose Factory 1 1,559 0 2002 931 0 2002 1 123 127 2002 01 0 2002 Kashechewan (Fort Albany Part) Peawanuck/Weenusk Cochrane District Stats Can Year of Estimate New Post* Wahgoshig/Abitibi Flying Post Sources: 1. Registered Indian Populations estimated by Ministry of Indian and Northern Affairs, December 2002 2. Enumerated by Chief’s office in March 2004 3. Enumerated by Chief’s office in November 2003 * New Post has changed their name to Taykwa Tagamou Nation. The difference between the two estimates is more than 4,000. In some jurisdictions, census estimates showed a population of zero even though the local authorities enumerated a significant number of people. Community Check-Up: Porcupine Health Unit Figure 1: Aboriginal population 100 Percentage of Population 80 60 40 20 0 PHU PHU Ontario Ontario Canada Canada m Aboriginal 11.4 1.7 3.3 m Non-Aboriginal 88.6 98.3 96.7 Source: Statistics Canada Figure 1 shows the distribution of the aboriginal and nonaboriginal population estimated by the 2001 census. Note that, as seen in Table 4, Kashachewan (Fort Albany Part), Marten Falls and Moose Factory were estimated with a zero population whereas the community statistics showed a significant population. Therefore, Figure 1 represents a slight under-estimation of the aboriginal population in the Porcupine Health Unit area. Aboriginal people required two sets of data: identity and origin (20% sample data). Identity referred to belonging to at least one aboriginal group: North American Indian, Métis and Inuit (Eskimo) and/or those identified as Treaty Indian or Registered Indian as per the Indian Act of Canada. Mem- Community Check-Up: Porcupine Health Unit 80 Figure 2: Aboriginal group Percentage of Aboriginal Groups 70 60 50 40 30 20 10 0 North American Indian Métis Inuit Multiple Aboriginal Other Aboriginal m PHU 71.9 25.2 0.2 0.3 2.5 m Ontario 69.9 25.7 0.7 0.9 2.8 m Canada 62.4 29.9 4.6 0.7 2.4 Source: Statistics Canada bers of an Indian band or First Nation (Statistics Canada– Catalogue No. 92-378-XIE 2001 Census Dictionary–Internet version) were also included. Origin referred to those who reported at least one aboriginal origin (North American Indian, Métis, or Inuit) in the ethnic origin question. Ethnic origin is defined as ethnic or cultural groups to which the respondent’s ancestor belonged (Statistics Canada–Catalogue No. 92-378-XIE 2001 Census Dictionary–Internet version). The Porcupine Health Unit area had a higher proportion (11.4%) of aboriginal people than the rest of Ontario (1.7%) or Canada (3.3%). A higher proportion of all aboriginal groups were included in the census. Community Check-Up: Porcupine Health Unit Table 5: 2001 Education level — Age 20 and over Education Level PHU Area Timmins Ontario Canada < Grade 9 15.0 % 11.6% 8.7% 10.5% Grade 9-13 without secondary certificate 23.8% 23.5% 16.9% 17.4% Grade 9-13 with certificate 13.5% 13.5% 14.2% 13.9% Trades certificate or diploma 14.4% 14.0% 10.2% 11.8% 6.0% 6.6% 6.6% 6.4% 16.2% 18.2% 17.1% 16.2% University without degree 3.4% 3.5% 7.1% 7.0% University with degree 7.8% 9.3% 19.2% 16.9% 62,065 30,990 College without diploma/certificate College with diploma/certificate Total Population 20+ Source: Statistics Canada, 2001 Census The majority of aboriginal people (71.9%) were North American Indian, 25.2% were Métis and Inuit, and a smaller portion of aboriginal people were recorded as “multiple aboriginal” and “other”. The North American Indian population dropped in 2001 census to 71.9% from 87.2% in the 1996 census. The proportion of “other aboriginal groups” rose from 1.8% in the 1996 census to 2.5% in the 2001 census (Porcupine Health Unit Area Population Profile, 1999). Education In Table 5, individuals in the Porcupine Health Unit area, Timmins, Ontario and Canada, who are older than 20 years of age, are grouped by the highest level of education attained. Community Check-Up: Porcupine Health Unit Table 6: Highest level of schooling for population age 20 and over Less than Grade 9 (% pop.) Trades or High school non-university Completed University certificate or higher certificate or diploma (% pop.) (% pop.) or higher (% pop.) Timmins 10.7 41.7 30.2 8.4 Kapuskasing 13.2 23.4 30.6 7.0 Hearst 18.0 20.1 25.8 7.5 Iroquois Falls 11.8 22.2 31.4 7.2 Cochrane 13.3 23.4 24.6 4.7 Smooth Rock Falls 13.9 24.1 29.0 3.6 Hornepayne 10.1 22.1 23.1 8.0 Porcupine Health Unit 13.7 22.0 28.7 7.0 Ontario 8.1 25.6 27.2 17.5 Canada 9.8 24.9 28.4 15.4 Source: Statistics Canada, 2001 Census Over one-third (38.8%) of the population of the heath unit area over the age of 20 had not received a secondary school certificate, compared to the population of Timmins (35.1%), Ontario (25.6%), and Canada (27.9%). Within the Porcupine Health Unit area, 7.8% of the population had a university degree, as did 9.3% of the population of Timmins. This rate was significantly lower than that of Ontario (19.2%) and Canada (16.9%). These numbers included students who were still pursuing their formal education. Community Check-Up: Porcupine Health Unit Table 7: 2000 Income distributions for population age 15 years and over Income Variable Average income Cochrane District Ontario Canada $ 27,939 $ 32,865 $ 29,769 Males 15+ $ 35,676 $40,900 $ 36,865 Females 15+ $ 19,938 $ 25,129 $ 22,885 Median1 income $ 20,499 $ 24,816 $ 22,120 $ 30,675 $ 31,560 $ 29,276 14,342 $ 18,899 $ 17,122 Average household2 income $ 53,051 $ 66,836 $ 58,360 Median household income $ 45,352 $ 53,626 $ 46,752 2.5 2.7 2.6 For unattached individuals 39.6% 34.0% 38.0% For economic families4 11.8% 11.7% 12.8% For households 14.8% 14.4% 16.2% Employment 76.3% 78.7% 77.1% Government transfer (e.g., OAS, GIS, CPP or QPP) 14.2% 9.8% 11.6% Other income (e.g., Retirement pensions, alimony, interest income) 9.4% 11.5% 11.3% Males 15 + Females 15 + Avg. number persons per household Incidence of low income3: Composition of total income: Sources: Statistics Canada, 2001 Census Notes: 1 Median income: Dollar amount that marks the midpoint of a distribution of household ranked by the size of household income. 2 Household: A person or a group of persons who occupy the same dwelling and do not have a usual place of residence elsewhere in Canada 3 Low income: Income levels at which families or unattached individuals spend 20% more than average on food, shelter and clothing. 4 Economic family: A group of two or more persons who live in the same dwelling and are related to each other by blood, marriage, common-law or adoption. 10 Community Check-Up: Porcupine Health Unit Income distribution Table 7 provides information on income distribution for Cochrane District, compared to Ontario and Canada. The median income ($20,499) of people in the Cochrane District who were over 15 years of age was lower than that of Ontario ($24,816) and Canada ($22,120). The average income ($53,051) in the District was also lower than that of Ontario ($66,836) and Canada ($58,360). The average number of persons per household in the Porcupine Health Unit catchment area was 2.5, which was close to that of Ontario (2.7) and Canada (2.6). In the Cochrane District, those whose income came from employment was 76.3% compared to Ontario at 78.7% and Canada at 77.1%. Community Check-Up: Porcupine Health Unit 11 12 Community Check-Up: Porcupine Health Unit 2 g Environment & Health Air Quality The Mobile Air Quality Index (AQI) Unit of the Air Monitoring Section, Environmental Monitoring and Reporting Branch of the Ontario Ministry of Environment monitored hourly concentrations of smog-related pollution in the Timmins area to assess the ambient quality during the summer of the year 2003. 1 Three sites were chosen to monitor air quality, (a) South Porcupine, (b) Downtown Timmins and (c) Baker Lake. Ozone (O3), fine particulate matter (PM2.5), nitrogen dioxide (NO2) and sulphur dioxide (SO2) were monitored in all three sites and compared with fixed locations in Sudbury, Sault Ste. Marie and North Bay. Ozone (O3) The Timmins area showed a lower level of ozone than the provincial recommendation of the one-hour ambient air quality criterion (AAQC) of 80 ppb. The highest one-hour ozone concentration in Timmins area recorded during the study period was 68 ppb. This level was lower than that of North Bay and Sudbury. Parts Per Billion (PPB): Parts Per Billion denotes one particle of a given substance for every 999,999,999 other particles. Community Check-Up: Porcupine Health Unit 13 Figure 3: Comparison of hourly AQI reading by category between Timmins and Sudbury 100 95.2 90.6 Timmins Percent of Hours 80 Sudbury 60 40 20 9.4 4.8 0 Source: Very Good/Good Moderate Air Monitoring Section, Environmental Monitoring and Reporting Branch, Ontario Ministry of the Environment, Timmins Air Quality Study, 2003 The air quality, due to ozone, in the Timmins area rendered “very good” and “good” designations 95.2 percent of the time (Figure 3). In only 4.8 percent of the time was air quality recorded as “moderate”. Sudbury recorded “very good” and “good” air quality 90.6 percent of the time and 9.4 percent of the time air quality was recorded as “moderate”. Fine Particulate Matter (PM2.5) During the study period, Sault Ste. Marie had the highest 24-hour PM2.5 concentration, at 30.1 µg/m3, compared to North Bay at 20.1 µg/m3 and Timmins at 16.3 µg/m3 (Figure 4). The 24-hour PM2.5 concentrations in Timmins remained far below the provincial standard of 30 µg/m3 and also significantly lower than that of North Bay and Sault Ste. Marie. 14 Community Check-Up: Porcupine Health Unit Figure 4: Comparison of fine particulate matter in Sault Ste. Marie, Timmins, North Bay, 2003 Max Min 75% 25% Median 30 Concentration (µg/m3) 24 18 12 6 0 Sault Ste. Marie Source: Timmins North Bay Air Monitoring Section, Environmental Monitoring and Reporting Branch, Ontario Ministry of the Environment, Timmins Air Quality Study, 2003 Sulphur Dioxide (SO2) The Timmins area showed a lower level of SO2 one-hour average concentration (15 ppb) than Sudbury (70 ppb). These two levels were far below than the provincial onehour SO2 AAQC of 250 ppb. Nitrogen Dioxide (NO2) The one-hour average concentration of NO2 in Timmins was recorded at 18 ppb, which was well below the provincial standard of 200 ppb set by the Ministry of Environment. The highest 24-hour average concentration in Timmins (5.2 ppb) was also far below than the provincial standard set by the Ministry (100 ppb). By and large, the general wet and cool conditions experienced during the summer of the study period in Timmins were not conducive to the production of high smogrelated pollutant levels. During smog alerts in Southern Community Check-Up: Porcupine Health Unit 15 Figure 5: The Mattagami Watershed OKE WILHELMINA GEARY MAHAFFY CRAWFORD LUCAS DUFF MANN NEWMARKET Jocko Creek AITKEN MOBERLY THORBURN REID CARNEGIE PROSSER TULLY LITTLE McCART CALVERT BYERS LOVELAND MACDIARMID KIDD WARK EVELYN GOWAN DUNDONALD Frederick House Lake CLERGUE FORTUNE North Porcupine River Bigwater Lake JAMIESON MONTCALM COTE ROBB STRACHAN MURPHY JESSOP Kamiskotia Lake HOYLE MATHESON GERMAN CODY MACKLEM STOCK Mattagami River ENID WHITNEY MASSEY TURNBULL GODFREY MOUNTJOY Bob's Lake TISDALE BOND Pearl Lake Porcupine River STRACHAN CURRIE Night Hawk Lake Timmins Redstone River MELROSE WHITESIDES CARSCALLEN KEEFER DENTON Whitefish River BRISTOL OGDEN DELORO SHAW PRICE ADAMS ELDORADO CARMAN THOMAS LANGMUIR BLACKSTOCK TIMMINS McEVAY FASKEN MICHIE NORDICA SHERATON EGAN FREY Grassy Lake Tatachikapika River THORNELOE Night Hawk River Kenogamissi Lake Kamiskotia River SEWELL HILLARY REYNOLDS McKEOWN FRIPP MCARTHUR DOUGLAS CHILDERHOSE DOYLE MUSGROVE BARTLETT GEIKIE FALLON Beaucage Lake REEVES Misty Lake Akweskwa Lake PHARAND Little Night Hawk Lake CLEAVER MCNEIL Whitefish Lake SHEBA ROBERTSON KENOGAMING PENHORWOOD East Night Hawk Lake Grassy River Mountjoy River Kenogaming Lake McBRIDE CROTHERS HASSARD BEEMER ENGLISH ZAVITZ Mountjoy Lake HINCKS ARGYLE BADEN West Night Hawk Lake ALMA HARDIMAN REGAN CAIRO Pineland Lake NORTHRUP ROBLIN MIDDLEBORO HAZEN POWELL GOUIN MOHER SEMPLE HUTT MONTROSE BANNOCKBURN YARROW EMERALD McOWEN GARDHOUSE WIGLE NURSEY SOTHMAN HALLIDAY MIDLOTHIAN BURROWS KEMP MOND RAYMOND CABOT KELVIN NATAL CONNAUGHT CHURCHILL DOON Tatachikapika Lake Mattagami Lake DESROSIERS GENOA WHALEN CARTER STETHAM RANKIN MATTAGAMI VAN HISE Makami Lake MALLARD ERIC FRATER SOMME JACK NOBLE TOGO Nabakwasi River Makami River Gogama Mesomikenda Lake HUFFMAN POTIER NEVILLE OSWAY KNIGHT ST. LOUIS TYRRELL MACMURCHY GROVES BRUNSWICK Minisinakwa Lake Donnegana River FINGAL ARBUTUS YEO CHESTER BENNEWEIS CHAMPAGNE Nabakwasi Lake LONDONDERRY MIRAMICHI GARVEY GARIBALDI ASQUITH FAWC&55 ALCONA SMUTS INVERGARRY VROOMAN WESTBROOK SHEARD BISCOTASI OGILVIE BROWNING ARDEN Donnegana Lake EDINBURGH INVERNESS HENNESSY MOFFAT BREBEUF BLEWETT BEULAH AMYOT PAUDASH HODGETTS 1:500,000 BAYNES LAMPMAN SHELLEY DUBLIN Source: 16 ONAPING MARSHAY SCOTIA FRECHETTE Mattagami Region Conservation Authority, Timmins. Community Check-Up: Porcupine Health Unit 0 4.5 9 18 27 36 Km Ontario, the elevated pollutant concentrations — especially ozone — were transported into Timmins, but did not raise the AAQC to the provincial standard of 80 ppb. This study suggests that even during smog alerts in Southern Ontario, Timmins experienced a less significant quantity of ozone and other particulate matters. Municipal Drinking Water Quality The Mattagami River in Timmins (Figure 5), is the largest river system in the Upper Mattagami Watershed. It flows northward to James Bay from its headwaters along the Arctic Divide south of Gogama. The river, from the divide to the Sandy Falls Dam, is 251 kilometres in length and drains 8,426 square kilometres. The Mattagami River has four major tributaries, the Grassy River, the Tatachikapika River, the Mountjoy River and the Kamiskotia River. The City of Timmins Water Filtration Plant is upstream of the Upper Mattagami watershed. The Mattagami Region Conservation Authority covers over 11,000 square kilometres of land and water, including all of the Upper Mattagami River watershed and part of the Porcupine River system. Flood control, erosion control, land management and conservation education are the main objectives of the Authority’s programs.2 This water quality report was written using information taken from the 2004 Timmins Water Filtration Plant Compliance Report.3 The Timmins Water Filtration Plant, under the authority of City of Timmins, is a conventional filtration plant which receives untreated water from the Mattagami River at a maximum daily rate of 54,600 m3/day (Table 8). The facility receives water from the Mattagami River which is screened for prevention of intrusion of floating debris. Community Check-Up: Porcupine Health Unit 17 Table 8: Source Name/ Description Mattagami River Description regarding water treatment systems in Timmins Source: Type Taking Specific Purpose Taking Major Category Max. Taken per Minute (litres) River Municipal Water supply 37,916 Max. Num. Max. Taken Max. Num. Zone/ Of Hrs per Day of Days Easting/ Taken per (million Taken per Northing Day: litres) Year: 24 54.6 Total Taking 54.6 365 17 4734430 5371230 Source: Larose B. City of Timmins, 2004 Timmins Water Filtration Plant Compliance Report, 2005. The untreated water flows into a raw water well where a combination of four low lift pumps lift the water up into a mixing chamber for chemical treatment. When the water reaches the mixing chamber, a combination of aluminum sulphate, hydrated lime and a secondary flocculate are rapidly mixed into the untreated water to begin treatment. After this process, the flow of water is split into two portions to feed the Microfloc and Degremont operating systems as required. The original Microfloc plant uses separate vessels to first coalesce the chemicals and water in a flocculation tank and then sends the water into a settling tank to remove the colour and turbidity from the water prior to filtration. In the Degremont section of the treatment plant, the water and chemicals are mixed together in one single tank where both flocculation and settling takes place in a unique upflow system prior to filtration. The water from each plant then enters six filters to remove the small particles of flocculation which are too light in 18 Community Check-Up: Porcupine Health Unit weight to settle. Once the water passes through the filters, it is pumped into the blending chamber where chlorination and pH control takes place. To provide the necessary alkalinity adjustment and to effectively reduce water corrosion within the distribution system, the hydrated lime is added. Three 4.54 million litre storage tanks called Clear Wells hold the treated water before pumping it into the distribution system. Four electric high lift pumps are used singly or in combination to supply the required amount of water and pressure to meet the demand of the population. The backup system for power outage consists of two diesel generators that start automatically to ensure no interruption of electric service. There is another diesel pump which has to be started manually by the operators when needed. In addition to the storage at the plant, there are two facilities within the distribution system with a capacity of 10.4 million litres each. One is a standpipe which is 39.6 meters high and 18.3 meters in diameter, situated in the Hollinger Park. The associated Hollinger Park pumping station has two pumps which supply Schumacher. The second facility is an in-ground storage tank located in the northern part of the City of Timmins. This station has two electric pumps and a diesel pump for fire fighting, capable of supplying the potable water demands of the Mountjoy area of Timmins. Only one of the electric pumps can be remotely started from the filtration plant at the present time. The Ontario Ministry of the Environment (MOE) enacted the Safe Drinking Water Act in 2002, following the Escherichia coli (E. coli) outbreak in Walkerton. The City of Timmins maintains a minimum of 0.20 mg/L of chlorine in the distributed water. The city ensures that the disposal of all designated chemical substan- Community Check-Up: Porcupine Health Unit 19 Table 9: 2004 water distribution miscellaneous summary (Treated and chlorinated water as found within the distribution system) Parameter Asbestos Calcium Copper Chlorine (Free Available) Chlorine (Total Available) Colour (TCU) Conductivity (umho) Cyanide Dioxins (Total) (pg/L) Fluoride Formaldehyde + metabolites Furans (Total) (pg/L) Hardness Iron Lead Manganese Nitrate Nitrite Nitrilotriacetic acid (NTA) Nitrogen (Kjeldahl) Nitrosodiumethylamine (NDMA) (ug/L) Organic Carbon (Dissolved) pH (0-14) Radionuclides (Artificial) Radionuclides (Natural) Sodium Sulphate Trihalomethanes (Total THMs) Turbidity (NTU) Zinc O.D.W.S. mg/L Total Samples <1.0000 N/A N/A >0.050 >0.050 5.0 N/A 0.20 0.015 1.20 N/A 0.015 80-100 0.3000 0.0100 0.0500 10.000 1.000 0.40 0.150 36 36 36 0.0090 36 5.0 6.5-8.5 0.1000 0.1000 20.0 500.0 0.1000 5.0 5.0 36 36 36 36 36 36 36 2,816 36 36 36 36 36 36 36 36 36 36 36 36 36 36 36 36 Samples Above Detection 0 36 36 2,816 2,816 36 36 0 0 10 3 0 36 36 2 36 36 0 0 11 Average mg/L Range mg/L Health Exceedance ND 29.4 0.014 1.11 1.23 1.5 177 ND ND 0.052 0.076 ND 97.2 0.38 0.004 0.021 0.180 ND ND 0.290 N/A 27.0-53.0 0.001-0.032 0.00-1.56 0.02-1.74 0.0-11.0 139.0-215.0 N/A N/A 0.030-0.090 0.056-0.092 N/A 68.1-125.0 0.05-0.76 0.002-0.006 0.007-0.058 0.100-0.310 N/A N/A 0.220-0.460 no no no no no no no no no no no no no no no no no no no no 3 0.0300 0.0240-0.0420 no 36 36 7 0 36 36 36 2,816 8 3.13 7.62 0.2100 ND 14.23 38.6 0.051 0.69 0.018 2.10-4.75 7.45-8.01 0.1000-0.3000 N/A 1.10-39.20 34.0-41.0 0.035-0.078 0.34-127.0 0.011-0.031 no no no no no no no no no Source: Larose, B. City of Timmins, 2004 Timmins Water Filtration Plant Compliance Report, 2005. Notes: • O.D.W.S. denotes “Ontario Drinking Water Standards” • < denotes less than method detection limit (MDL) • > denotes greater than method detection limit (MDL) • mg/L denotes milligrams per litre (equivalent to ppm/parts per million) • ug/L denotes micograms per litre (equivalent to ppb/parts ber billion) • pg/L denotes picograms per litre (equivalent to ppt/parts per trillion) 20 Community Check-Up: Porcupine Health Unit • ND denotes non-detectable using standard methods of analysis • N/A denotes not applicable under these circumstances • umho denotes micro mhos (opposite of resistance) • Bq/L denotes beqerals per litre (measure of radioactivity) • TCU denotes True Colour Units • NTU denotes Nephelometric Turbidity Units (Light Scattering Capabilities) ces (e.g., asbestos, mercury, etc.) is done in an appropriate manner, with accompanying documentation. The city also ensures the production of an Annual Compliance Report every year. In 2004, all water supplied from the Timmins Water Filtration Plant (TWFP) met or exceeded the requirements of Ontario Drinking Water Standards. Only 33 samples (1.13%) of 2,917 bacteriological samples collected from the regular Timmins distribution system location indicated the presence of adverse indicator bacteria, heterotrophic plate counts, general bacteria counts or chemical parameters which affect water conditions. These adverse samples were a result of either erroneous reporting or water failure, not adverse water conditions, produced by the Timmins Water Filtration Plant. One sample was reported as adverse from the treated water system due to lack of the chemical parameters with the water supply. Ninety-one (91) samples — or 6.5% of the 1,408 samples that were collected to support the non-routine functions within the Timmins distribution system — showed the presence of adverse indicator bacteria, heterotrophic plate counts, general bacteria counts or chemical parameters which adversely affect water conditions. (Presence of indicator bacteria do not cause disease, rather they indicate potential bacterial onset.) These adverse conditions were due to construction in different areas of Timmins. More than 200 analytical results for inorganic, organic and radiological parameters met or exceeded the requirements of the Ontario Drinking Water Standards. A high level of Nitrosodiumethylamine (NDMA) in a few samples raised some concern. After checking with the Ministry of Environment, it was confirmed that a sample preparation anomaly resulted in a false positive result. Table 9 shows the summary of laboratory parameters. Community Check-Up: Porcupine Health Unit 21 Figure 6: Exceedances in acceptable E. coli levels.Average Proportions of Geometric Means (GM) > 100, Gillies Lake, 2001–2005 50 39.5 40 40.1 33.1 30 20 26.5 18.4 10 0 2001 2002 2003 N=12 2004 2005 Source: Porcupine Health Unit, Inspection Department, 2006 Posted bathing beaches Gillies Lake is located in the northern part of the City of Timmins. This lake is monitored annually for public swimming. The water samples are taken during the summer months when the beach is open to the public for swimming. Figure 6 shows the proportions of geometric means of E. coli above 100 for the beach, sampled from 2001 to 2005. Figure 6 shows that acceptable E. coli levels below 100 were found during the reported 5-year period. During the same time period, the beach was never closed due to water contamination. 22 Community Check-Up: Porcupine Health Unit Chapter 2 References 1. Air Monitoring Section, Environmental Monitoring and Reporting Branch, Ontario Ministry of the Environment, Timmins Air Quality Study, 2003. 2. Percival, C. Communications Specialist, Source Water Protection, Mattagami Region Conservation Authority, Timmins, (personal communication). 3. Larose, B. City of Timmins, 2004 Timmins Water Filtration Plant Compliance Report, 2005. Community Check-Up: Porcupine Health Unit 23 24 Community Check-Up: Porcupine Health Unit 3 g Reproductive Outcomes & Child Health Crude Birth Rate Crude birth rate is defined as the number of total live births divided by the total population of the area multiplied by 100. Both Ontario and the Porcupine Health Unit area experienced a decline in the crude birth rate since the year 1992. Community Check-Up: Porcupine Health Unit 25 Figure 7: Comparison of crude birth rate between the Porcupine Health Unit and Ontario 15 Rate / 1,000 10 5 0 1986 1987 1988 1989 1990 1991 1992 1993 1994 1995 1996 1997 1998 1999 2000 2001 m PHU 16.0 16.0 15.5 16.0 14.8 15.5 15.1 13.4 13.2 12.5 11.6 10.5 10.8 9.9 10.0 10.3 m ON 14.1 13.9 14.0 14.3 14.6 14.3 14.2 13.8 13.5 13.3 12.6 11.8 11.6 11.4 10.9 11.0 Source: Provincial Health Planning Database, extracted July 5, 2005. Health Planning Branch, Ministry of Health and Long-Term Care, Ontario. Figure 7 shows that the Porcupine Health Unit area had a higher crude birth rate than the province during the latter part of the 80s whereas, through the 90s, the crude birth rate of Ontario surpassed the rate of the area. Preterm Birth Rate Preterm birth is defined as the birth of a baby with a gestational age of less than 37 completed weeks or 259 days. The rate of preterm birth is defined as the number of preterm births for each 100 live births in a particular year. Preterm birth is responsible for 75–85% of all perinatal mortality in Canada. Neuro-developmental handicaps, chronic respiratory infections and ophthalmological problems are associated with preterm birth. Preterm birth mostly occurs in mul26 Community Check-Up: Porcupine Health Unit Figure 8: 9 Comparison of preterm birth rate between the Porcupine Health Unit and Ontario 8 7 Rate / 100 live births 6 5 4 3 2 1 0 1986 1987 1988 1989 1990 1991 1992 1993 1994 1995 1996 1997 1998 1999 2000 2001 m PHU 4.9 4.5 4.5 5.2 4.5 5.4 4.8 5.2 4.7 4.0 6.0 5.0 4.7 5.1 4.9 3.6 m ON 5.1 5.0 5.4 5.1 5.2 5.8 6.0 7.3 7.3 8.1 8.4 7.0 5.9 5.8 6.0 5.7 Source: Provincial Health Planning Database, extracted July 5, 2005. Health Planning Branch, Ministry of Health and Long-Term Care, Ontario. tiple births but it can also occur in singleton birth. The data that is presented in this chapter is from singleton births in the Province of Ontario and the Porcupine Health Unit. Since 1986, the Porcupine Health Unit area has had a lower rate of preterm birth than the province. Figure 8 compares the two rates. Even though the exact cause of preterm birth is unknown, multiple risk factors have shown to be associated with preterm birth. Genital tract infection, maternal smoking during pregnancy, pre-eclampsia, previous preterm birth and abruptio placenta, stress, anxiety and depression are a few known risk factors. Community Check-Up: Porcupine Health Unit 27 Figure 9: Comparison of low birth weight between the Porcupine Health Unit, Ontario and Canada 6 Percent of live births 5 4 3 2 1 0 1986 1987 1988 1989 1990 1991 1992 1993 1994 1995 1996 1997 1998 1999 2000 2001 m PHU 5.1 4.9 4.5 5.5 3.2 5.3 4.5 4.3 4.5 4.2 4.6 5.1 3.7 4.7 4.9 3.6 m ON 5.4 5.4 5.5 5.3 5.4 5.6 5.6 6.0 6 6.1 6.0 5.9 5.8 5.8 5.7 5.6 m Can 5.5 5.5 5.6 5.5 5.5 5.5 5.5 5.7 5.8 5.8 5.7 5.8 5.7 5.6 5.6 5.5 Source: Provincial Health Planning Database, extracted July 5, 2005. Health Planning Branch, Ministry of Health and Long-Term Care, Ontario. There is a limitation in the data that has been presented here. The birth registration rate was lower in the early 90s in Ontario, which may result in an under-representation of preterm births both in Ontario and the Porcupine Health Unit area. 1 Low Birth Weight Rate Low birth weight is defined as the birth of a baby with a weight less than 2,500 grams. The low birth weight rate can be defined as the total number of live births with birth weight less than 2,500 grams, divided by the total number of live births, multiplied by 100. This indicator is the key determinant of infant mortality and morbidity. Low birth weight can occur due to premature birth or reduced growth during the gestational period. 28 Community Check-Up: Porcupine Health Unit In this analysis, the effect of prematurity due to multiple births was minimized by excluding multiple births during calculation, hence only singleton births were considered. In recent years, there has been an increased registration of live births with a birth weight of less than 500 grams. To improve the comparability of this indicator, those babies with birth weight less than 500 grams were also excluded. The age of the mother, gestational age, type of birth, parity, smoking during pregnancy, physical and social environment and genetic factors are the risk factors for low birth weight baby. Figure 9 shows that the low birth weight rate was lower in the health unit area than the provincial and national rate. One of the objectives of the Mandatory Health Programs and Services Guidelines is to curb the low birth weight rate to lower than 4%. In the years 1990, 1998 and 2001, the low birth weight rate was lower than 4% (3.2%, 3.7% and 3.6%, respectively) in the Porcupine Health Unit area. Neural Tube Defects A neural tube defect is the congenital anomaly of the central nervous system which is the most common and serious defect among all the congenital anomalies. Even though the rates of neural tube defects are decreasing since the 1980s, 2 it continues to be an important cause of morbidity and mortality during early childhood. 3 Neural tube defects occur when the neural tube fails to close in the embryo in the first trimester of the pregnancy. Anencephaly and spina bifida are the most common neural tube defects. Anencephaly occurs when the cranial end of the neural tube fails to close and spina bifida occurs when Community Check-Up: Porcupine Health Unit 29 Table 10: Year Rate of neural tube defects (NTDs), Canada, 1991-1999 NTD cases Cases per 10,000 births Total births NTD cases (excluding NS*) Cases per 10,000 births (including NS) 1991 389 389,926 10.0 1992 370 384,740 9.6 1993 345 377,167 9.1 1994 349 375,451 9.3 1995 340 368,100 9.2 1996 257 356,188 7.2 278 366,811 7.6 1997 257 341,122 7.5 267 351,139 7.6 1998 188 334,133 5.6 196 343,822 5.7 1999 185 328,493 5.6 195 338,133 5.8 Source: Total births Health Canada. Canadian Congenital Anomalies Surveillance System (CCAS), 1991–1999. * Nova Scotia data were not available to CCAS before 1996 the caudal part of the neural tube fails to close. The effect of neural tube defects can vary from no symptoms at all to serious mental or physical handicaps. Several studies have demonstrated the protective effect of folic acid supplementation during early pregnancy for the prevention of neural tube defects. 4-9 The rate of neural tube defects decreased 44%, from 10 cases per 10,000 in 1991 to 5.6 cases per 10,000 in 1997 (Table 10). In November 1998, the addition of folic acid to white flour and pasta products (labelled “enriched”) became mandatory in Canada. This fortification added approximately 0.1 mg of folic acid to the average woman’s diet every day. Due to this measure, a lower number of neural tube defects have been reported in Canada in recent years. 30 Community Check-Up: Porcupine Health Unit Table 11: Rate of neural tube defects (NTDs), by province/territory, Canada, 1997-1999 combined Province/territory Number of NTD cases Total Births NTD cases per 10,000 total births Cases Newfoundland 95% CI 15 15,538 9.7 5.4–15.9 0 4,550 0.0 0.0–8.1 Nova Scotia 28 29,346 9.5 6.3–13.8 New Brunswick 19 24,017 7.9 4.8–12.3 Quebec 121 225,053 5.4 4.5–6.4 Ontario 265 406,064 6.5 5.8–7.4 Manitoba 36 43,232 8.3 5.8–11.5 Saskatchewan 22 37,957 5.8 3.6–8.8 Alberta 52 113,844 4.6 3.4–6.0 100 129,230 7.7 6.3–9.4 Yukon 0 1,213 0.0 0.0–30.2 Northwest Territories 0 3,050 0.0 0.0–12.0 658 1,033,094 6.4 5.9–6.9 Prince Edward Island British Columbia Canada Source: Health Canada. Canadian Congenital Anomalies Surveillance System, 1997-1999. Note: Nunavut is included in the Northwest Territories in the Data for 1999. Infant Mortality Rate Infant mortality rate is defined as the number of children dying, under one year of age, divided by the number of live births for that year. It is a significant indicator of the quality of preventive medicine and health care measures provided to infants and pregnant women. Infant mortality is strongly associated with maternal health and socioeconomic determinants. In Canada, as in the rest of the world, higher socioeconomic conditions helped create an environment conducive to a lower percentage of infant mortality (4.5 per 1,000) compared to low socioeconomic conditions (7.5 per 1,000). The infant mortality rate has subsided in Canada linearly since 1960 (Figure 10). Community Check-Up: Porcupine Health Unit 31 Figure 10: Infant Mortality Rate, Canada, 1960-1995 Infant deaths per 1,000 live births 30 25 20 15 10 5 0 1960 Sources: 1970 1980 Year 1990 Statistics Canada, Selected Infant Mortality Statistics, Canada, 1960-1995. Statistics Canada, Births and Deaths, 1995. Figure 11: Infant mortality rate, comparing Cochrane District, Ontario and Canada Rate / 1,000 live births 10 8 6 4 2 0 1992 1993 1994 1995 1996 1997 1998 1999 2000 2001 2002 m PHU 5.0 7.2 5.6 4.9 1.7 7.9 8.6 2.1 6.5 4.3 8.5 m ON 5.9 6.2 6.0 5.9 5.7 5.5 5.0 5.4 5.3 5.4 5.3 m Can 6.1 6.3 6.3 6.1 5.6 5.5 5.3 5.3 5.3 5.2 5.4 Source: 32 Provincial Health Planning Database, extracted July 5, 2005. Health Planning Branch, Ministry of Health and Long-Term Care, Ontario. Community Check-Up: Porcupine Health Unit Figure 12: Causes of Infant Death in Canada (excluding Ontario), 1999 28.5 Congenital Anomalies 22.6 26.5 14.7 Asphyxia 0.8 10.1 32.6 5.3 Immaturity 23.4 3.8 12.5 Infection 6.7 Sudden Infant Death Syndrome 2.1 29.2 11.2 1.1 Unexplained Sudden Infant Death 5.6 Neonatal death 2.6 Postneonatal death 0.7 External Causes 7.0 Infant death 2.8 16.4 17.0 16.6 Other 0 Source: 5 10 15 20 Percentage 25 30 35 Statistics Canada. Canadian Vital Statistics System, 1999 (*Data for Ontario excluded due to data quality issue) The downward trend of infant mortality has also spread throughout the Cochrane District. When the data on infant mortality in the area was compared with that of Ontario and Canada (Figure 11), the average infant mortality rate for 11 years (from 1992 to 2002) was not significantly different, although, in a few instances, the rate of the area was higher than the provincial or national average. Community Check-Up: Porcupine Health Unit 33 Figure 13: Trends of teen pregnancy in the Porcupine Health Unit area and Ontario, 1996-2001 60 PHU 51.7 50 47.5 44.7 40.1 40 Ontario 46.4 44.6 38.8 35.7 43.5 36.3 32.7 30 30.5 20 10 0 1996 Source: 1997 1998 1999 2000 2001 Health Planning System (HELPS), Public Health Branch, Ministry of Health and Long-Term Care, Ontario Teen Pregnancy Rate The rate of teen pregnancy has been decreasing for the last quarter century in Canada due to increased availability of contraceptives and to increased awareness of the risk of acquiring sexually transmitted infections, like AIDS. 10 The same trend has been found in Ontario and in the Porcupine Health Unit area. Figure 13 shows that, in Ontario, the rate of teen pregnancy has declined steadily from 1996 to 2001. In the Porcupine Health Unit, the rate went up in 1998 and 1999 and then declined again in 2000. Even though Canadian society has changed its view on teen pregnancies and births by unmarried women, the risk of serious health consequences for the babies of teen mothers persists. Teen pregnancy can also be linked 34 Community Check-Up: Porcupine Health Unit Figure 14: Comparison of teenage pregnancy rate among the Northern Health Units and Ontario, 2001 80 70.7 70 Rate/ 1,000 teens 60 50 43.5 41.1 40 41.2 34.8 33.5 33.2 30.5 30 20 10 Source: o tari On U Thu nde rB Tim iska Dis ay min tH tric tric Dis nd ya bur gH U U tH U PH U rn H ste No rth we Sud No rth Bay and Alg Dis om tric aH tH U U 0 Health Planning System (HELPS), Public Health Branch, Ministry of Health & Long-Term Care, Ontario to low birth weight and other medical conditions. 11 Anemia, hypertension, renal disease, eclampsia and depressive disorders are a few of the health risks for teen pregnant mothers. Also, teenagers who engage in unprotected sex are susceptible to sexually transmitted infections. 10, 12, 13 There are financial consequences for teen pregnancy. A teenage girl’s opportunity for education is impeded due to pregnancy, as is the prospect of acquiring an appropriate well-paying job. 14 In addition, the cost of living is increasing every year and dual incomes are necessary to maintain a healthy lifestyle. Unfortunately, mothers who are 15♠–17 years old are likely to be unmarried or living alone, increasing their hardships. 12 Community Check-Up: Porcupine Health Unit 35 Figure 15: Comparison of teenage abortion rate in Northern Health Units and Ontario, 2001 25 19.2 Rate/ 1,000 20 17.6 14.8 14.7 15 15.9 15.1 14.4 11.2 10 5 Source: o tari On U min iska ay rB Thu nde Tim tric Dis tric Dis nd ya bur Sud gH U tH U tH U PH rn H ste we rth No No rth Bay and Alg Dis om tric aH tH U U U 0 Health Planning System (HELPS), Public Health Branch, Ministry of Health and Long-Term Care, Ontario Figure 14 shows that, in the year 2001, the rate of teen pregnancy was 30.5/1,000 in Ontario. The highest rate was observed in the Northwestern Health Unit (70.7/1,000). The Porcupine Health Unit reported the second highest rate (43.5/1,000). Among the health units, the lowest number of teen pregnancies was observed in the Sudbury and District Health Unit at 33.2/1,000. Historically, most teen pregnancies resulted in live births rather than abortion. With the advent of various safe methods of abortion, most teen pregnancies are now terminated through abortion. The rate of abortion has declined in the population of the Porcupine Health Unit: decreasing 38% in 2001 from that in 1996 (14.4 from 19.9). Among the northern health units, the abortion rate was the 36 Community Check-Up: Porcupine Health Unit Figure 16: SIDS Rates, Provinces & Territories, 1996 Provinces/Territories P.E.I. Nfld. Y.T. B.C. Que. Ont. Canada Man. N.S. Alta. N.B. N.W.T. 0 0.5 1 1.5 2 2.5 3 3.5 SIDS deaths per 1,000 live births Source: Statistics Canada. Canadian Vital Statistics System, 1996. highest in the Algoma Health Unit (19.2/1,000) and the lowest in the Timiskaming Health Unit (11.2/1,000 teens) in 2001 (Figure 15). Sudden Infant Death Syndrome (SIDS) Sudden infant death syndrome can be defined as the sudden and unexpected death of an apparently healthy infant who is under one year of age and in which the cause of death remains unexplained after all known and possible causes have been ruled out by autopsy, medical history and death scene investigation. 15 Sudden infant death syndrome is one of the leading causes of death of infants between 28 days and one year of age. 16 In 1996, there were 2,051 infant deaths reported and, among them, 168 (8.2%) were attributed to sudden infant death syndrome. The rate of sudden infant death syndrome Community Check-Up: Porcupine Health Unit 37 Table 12: Maternal mortality ratio (MMR) per 100,000 live births, according to age in Canada (excluding Quebec), 1997 -2000 Age (Years) Source: Maternal deaths Live births MMR Rate 95% CI < 20 2 62,236 3.2 0.4–11.7 20–24 4 187,062 2.1 0.6–5.4 25–29 16 321,753 5.0 2.8–8.1 30–34 24 316,588 7.6 4.9–11.3 35–39 15 142,968 10.5 5.9–17.3 40 and over 3 24,221 12.4 2.6–36.2 Total 64 1,054828 6.1 4.7–7.7 Health Canada. Special Report on maternal mortality and severe morbidity in Canada. Canadian Perinatal Surveillance System. 2004 declined in Canada from 1.2 per 1,000 live births in 1980 to 0.9 per 1,000 live births in 1996. 16, 17 Figure 16 shows the rate of sudden infant death syndrome in each province of Canada and it is worth noting that the rate of the syndrome is high in the Canadian aboriginal population. 15 As the number of cases of sudden infant death syndrome less than one in Canada, the rate for the Porcupine Health Unit area was not available. Shaken Baby Syndrome Shaken baby syndrome is defined as a condition when a parent or caregiver shakes an infant or young child so violently that the child suffers from a serious morbid condition, and possibly even succumbs to death. Injuries that are included in the shaken baby syndrome are: intracranial haemorrhage (bleeding in and around the brain), retinal haemorrhage, fractures of the ribs and long bones. Bruises, laceration and other fractures also can occur from the impact of shaking. 18 38 Community Check-Up: Porcupine Health Unit As shaken baby syndrome is not defined by a single disease or is not coded by the International Classification of Disease (ICD), the data for this syndrome is not available in Canada. However, one Canadian study 19 indicates that the median age of infants that suffered from shaken baby syndrome was 4.6 months and 56% were boys. Seizure-like activities were noted among 45% of children, decreased levels of consciousness in 43%, respiratory difficulty in 34%, and bruising was noted in 46% of cases. Nineteen percent (19%) of children died as a direct result of shaking, 55% suffered from ongoing neurological problems and 65% had visual impairment. Shaken baby syndrome is a form of child abuse and warrants police investigation when suspected. Provincial and territorial child welfare authorities also investigate incidents to determine the safety of the child in the current parental or care-giver home. Breastfeeding Breastfeeding is required for the development of a healthy child. The benefits of breastfeeding are enormous: it helps to develop the child normally, both mentally and physically, and helps to prevent breast disease in the mothers. Breastfeeding protects the child from infections, 20 Haemophilus influenza (during the first 6 months of life), 21 otitis media, 22 sudden infant death syndrome. 23 Other important benefits of breastfeeding include improved cognitive development and a reduced incidence of immune-related disease (Type-1 diabetes and inflammatory bowel disease) and childhood cancers. A reduction of the risk of breast cancer, 24 and uterine cancer 25 in the mothers are other benefits. The cognitive developmental benefits of breastfeeding depends on the duration of breastfeeding. 26 Community Check-Up: Porcupine Health Unit 39 Figure 17: Percentage of breastfeeding or bottle-feeding within the first 48 hours after the child’s birth, all Northern health units Percentage of respondents 100 80 60 40 20 0 North Bay & District Northwestern Sudbury & District Timiskaming Algoma Thunder Bay PHU Muskoka/ Parry Sound All Northern HUs m Breastfeeding 75.2 78.3 65.4 67.3 68.2 84.2 67.6 77.8 73 m Bottle-feeding 22.3 17.9 29.4 29.8 29.4 14.1 28.3 18.4 23.6 Source: Sinclair, S., Houston, V., Shields, K., Snelling, S.: Breastfeeding practices in Northern Ontario, a report from the Northern Ontario Perinatal and child health survey consortium. PHRED, Sudbury and District Health Unit, 2003 There is also a direct economic benefit to breastfeeding. A study of women, infants and children who were enrolled in a special supplemental nutrition program 27 indicated that Medicaid expenditures during the first 6 months of the infant’s life were reduced $478/infant due to breastfeeding. This implies that breastfeeding benefits the health care system financially. Mothers who do not breastfeed incur additional cost related to formula purchases. Figure 17 shows the percentage of breastfeeding or bottlefeeding in all northern health units within the first 48 hours after a child’s birth. The rate of breastfeeding in the Porcupine Health Unit area was one of lowest rates among the northern health units. The rate of bottle-feeding in the health unit area was one of the highest among the same group. 40 Community Check-Up: Porcupine Health Unit Table 13: Rate and duration of breastfeeding, by maternal age Maternal age (years) Percentage of children whose mother reported breastfeeding, regardless of duration Canada (excluding the territories) 1994–1995 1996–1997 1998–1999 PHU area 2004–2005 <20 66.3 72.4 73.4 38.0 20–24 67.9 74.2 75.3 59.6 25–29 73.4 74.6 81.4 62.9 30–34 77.7 81.7 83.5 63.4 >35 80.9 82.8 86.5 75.0 All ages 75.1 78.5 81.9 61.1 Sources:Canadian Perinatal Health Report, 2003, Canadian Perinatal Surveillance System, Health Canada and Breastfeeding survey, Porcupine Health Unit Table 14: Rate and duration of breastfeeding by region/province Region/ province Source: Percentage of children <2 years of age whose mother reported breastfeeding regardless of duration Canada (excluding the territories) 1994–1995 1996–1997 1998–1999 Atlantic provinces 66.3 72.4 73.4 Quebec 67.9 74.2 75.3 Ontario 73.4 74.6 81.4 Prairie provinces 77.7 81.7 83.5 British Columbia 80.9 82.8 86.5 All provinces 75.1 78.5 81.9 Canadian Perinatal Health Report, 2003, Canadian Perinatal Surveillance System, Health Canada A breastfeeding survey was conducted by the Porcupine Health Unit in 2005 28 and it showed that, by and large, the breastfeeding initiation rate was lower among all ages of women compared to women across Canada. Table 13 illustrates the age distribution of women and the breastfeeding initiation rate. The breastfeeding initiation rate was significantly lower among mothers who were less than 20 years Community Check-Up: Porcupine Health Unit 41 Figure 18: Respondents with children born in 2000-02 who breastfed in the first 48 hours after the child’s birth, all Northern health units Percentage of respondents 100 % 88.4 83.6 80 80.4 79.8 74.5 77.2 73.1 71.6 65.1 60 40 20 s HU ern ing rth am All No isk ay rB nde Tim tric Dis tric nd ya bur HU U tH U tH U PH HU we Dis Thu No Sud rth Bay No rth and ste tric Dis oun ry S Par kasko Mu rn tH U dH U aH om Alg Source: U 0 Sinclair, S., Houston, V., Shields, K., Snelling, S.: Breastfeeding practices in Northern Ontario, a report from the Northern Ontario Perinatal and child health survey consortium. PHRED, Sudbury and District Health Unit, 2003 of age in the Porcupine Health Unit area than the rate of sameaged women across Canada (38% vs. 73.4%). Figure 18 shows the percentage of respondents in all northern health units with children born from 2000 to 2002 who breastfed in the first 48 hours after birth. According to this figure, the Porcupine Health Unit had the lowest breastfeeding initiation rates when compared with other health units. 42 Community Check-Up: Porcupine Health Unit Chapter 3 References 1. Canadian Perinatal Surveillance System, Public Health Agency of Canada, Ottawa, Canadian Perinatal Health Report, 2003 2. Wen, S.W., Liu, S., Joseph, K.S., Rouleau, J., et al. “Patterns of infant mortality caused by major congenital anomalies.” Teratology. 2000; 61: 342-6 3. Van Allen, M.I., McCourt, C., Lee, N.S. Preconception health: folic acid for the primary prevention of neural tube defects. A resource document for health professionals, 2002. Ottawa: Minister of Public Works and Government Services, Canada 2002 4. Milunsky, A., Jick, H., Jick, S.S., Bruell, C.L., et al. “Multivitamin/folic acid supplementation in early pregnancy reduces the prevalence of neural tube defects.” JAMA. 1989; 262 (20) : 2847-52 5. Wald. N., Sneddon, J., Densem, J., Frost, C., et al. “Prevention of neural tube defects: results of the Medical Research Council Vitamin Study.” Lancet. 1991; 338: 131-7 6. Czeizel, A.E., Dudas, I. “Prevention of the first occurrence of neural tube defects by periconceptional vitamin supplementation.” N Eng J Med. 1992; 327: 1832-5 7. Mulinare, J., Cordero, J.F., Erickson, J.D., Berry, R.J. “Periconceptional use of multivitamins and the occurrence of neural tube defects.” JAMA. 1988; 260 (21): 3141-5 8. Bower, C., Stanley, F.J. “Dietary folate as a risk factor for neural tube defects: evidence from a case-control study in Western Australia.” Med J Aus. 1989; 150 (11): 613-9 9. Werler, M.M., Shapiro, S., Mitchell, A.A. “Periconceptional folic acid exposure and the risk of occurrence of neural tube defects.” JAMA. 1993; 269: 125761 10.Society of Obstetricians and Gyaecologists of Canada (SOGC). Sex Sense: Canadian Contraceptive Guide. Ottawa: SOGC, 2000 11.Federal/Provincial/Territorial Advisory Committee on Population Health. Statistical Report on the Health of Canadians. Ottawa, Health Canada, 1999 12.Combes-Orme, T. “Health effects of adolescent pregnancy: Implications for social workers.” Fam Soc. 1993; 74(6): 344-54 13.Turner, R.J., Grindstaff, C.F., Phillips, N. “Social support and outcome in teenage pregnancy.” J Health Soc Behav. 1990; 31 (1): 43–57 14.The Alan Guttmacher Institute. Facts in Brief: Teen Sex and Pregnancy, 1999. New York: The Alan Guttmacher Institute, 1999 Community Check-Up: Porcupine Health Unit 43 15.Molckovsky, A., Pirzada, K.S. The Toronto notes: A comprehensive medical review textbook for the 2004 Medical Council of Canada Qualifying Examination. 20th Edition. Toronto Notes Medical Publishing. 2004 Inc. P6-7 16.Statistics Canada. Canadiana Vital Statistics System, 1996 17.Statistics Canada. Mortality–summary list of causes, 1995. Catalogue 84-209XPB 18.Health Canada. Joint Statement on Shaken Baby Syndrome. Minister of Public Works and Government Services, Ottawa, 2001 19.King, W.J., MacKay, M., Sirnick, A. “Shaken Baby Syndrome in Canada: clinical characteristics and outcomes of hospital cases.” CMAJ. 2003; 168 (2): 155-9 20.Lerman, Y., Slepon, R., Cohen, D. “Epidemiology of acute diarrheal diseases in children in a high standard of living settlement in Israel.” Pediatr Infect Dis J. 1994; 13(2): 116-22 21.Cochi, S.L., Fleming, D.W., Hightower, A.W., Limpakarnjanarat, K., et al. “Primary invasive Haemophilus influenza type b disease, a population based assessment of risk factors.” J Pediatr. 1986: 108 (6): 887-96 22.Teele, D.W., Klein, J.O., Rosner, B. “Epidemiology of otitis media during the first seven years of life in greater Boston: a prospective cohort study.” J Infect Dis. 1989; 160 (1): 83-94 23.Hoffman, H.J., Damusk, K., Hillman, L., Krongrad, E. Risk factors for SIDS: results of the National Institute of Child Health and Human Development SIDS Cooperative Epidemiologic Study. Ann NY Acad Sci. 1988; 533: 13-30 24.Schack-Nielsen, L., Larnkjaer, A., Michaelsen, K.F. “Long term effects of breastfeeding on the infant and mother.” Adv. Exp. Med. Biol. 2005; 569: 16-23 25.Brock, K.E. “Sexual, reproductive and contraceptive risk factors for carcinomain-situ of the uterine cervix in Sidney.” Med J Aust. 1989; 150 (3): 125–130 26.Anderson, J.W., Johnstone, B.M., Ramley, D.T. “Breast-feeding and cognitive development: a meta-analysis.” Am J Clin Nutr. 1999; 70(4): 525-35 27.Montgomery, D.L., Splett, P.L. “Economic benefit of breast-feeding infants enrolled in WIC.” J Am Diet Assoc. 1997; 97 (4): 379-85 28.Yuskow, S., Mills, M.M., Haque, F., Corstorphine, N., et al. Porcupine Health Unit breast feeding survey. Unpublished data. 44 Community Check-Up: Porcupine Health Unit 4 g Genetic Diseases & Congenital Anomalies Due to many recent scientific advances in genetics, including the Human Genome Project, the profile of genetic diseases is rising. One in every twenty Canadians experiences a gene-related disease or disability by age 25. 1 About half of the admissions in pediatric hospitals 2 and twelve percent of all adult admissions in general hospitals are due to genetic diseases. 3 Several thousand diseases have been identified as genetic diseases. Some genetic diseases occur at high rates in particular geographic areas of Canada or subgroups of the Canadian population. 4 If certain genetic diseases that occur in the Cochrane District or in the area of the Porcupine Health Unit can be identified, then preventive and therapeutic measures can be taken. For individuals who are at risk of genetic diseases, genetic technologies can curb the risk by modifying the environmental risk factor. The Genetics Program of the health unit is responsible for the diagnosis and follow-up care of symptoms associated with genetic diseases. The program staff gather medical data on the clients. To reach a diagnosis, a geneticist takes a medical history, does a physical examination, and reviews all assessments done by other health care professionals. Community Check-Up: Porcupine Health Unit 45 Figure 19: Leading causes of referral to PHU Genetic Services Program in 2004 Cancer - 40% Prenatal - 28% Neurological - 6% Metabolic - 6% Development delay - 20% Source: Genetic Services Program, Porcupine Health Unit The Porcupine Health Unit genetic nurses also counsel patients with genetic diseases on the natural progression of the disease and necessary symptoms that require immediate medical attention. In addition, the health unit nurses counsel using a family pedigree for the genetic disease and advise how it can affect offspring. Cytogenetic and molecular blood tests and urine tests can also be ordered. The program also sends genetic assessment letters to family physicians for the follow-up and monitoring of the patients. No intervention has yet been discovered to prevent genetic diseases, but some interventions are taken to ameliorate the symptoms of the diseases. If any genetic disease can be diagnosed prenatally, parents are offered choices to either continue or discontinue the pregnancy. The sooner a disease is diagnosed, the sooner interventions can be taken to alleviate the severe symptoms. For instance, in the case 46 Community Check-Up: Porcupine Health Unit Figure 20: Congenital anomalies in different PHU communities (1989–2000) 600 519.0 500 449.2 Rate/ 10,000 births 400 300 299.6 291.2 238.5 186.2 200 183.2 154.9 111.1 100 nee oso ock hR Sm oot Mo ls Fal son the Ma ng asi Kap usk alls is F quo Iro Ho rne pay ne t ars He ane chr Co Tim min s 0 Source: Health Planning System (HELPS), Public Health Branch, Ministry of Health and Long-Term Care, Ontario of haemochromatosis, the blood is drained from the body based on ferritin and total iron level thus preventing morbidity and mortality. Since 1983, the Porcupine Health Unit has provided genetic screening. The genetic program started in Northeastern Ontario in the year 1976 in Sudbury. Figure 19 shows the major causes of referral to the Porcupine Health Unit Genetics Services. Figure 20 shows the rate of congenital anomalies in the communities within the Porcupine Health Unit area for the years 1989 to 2000. The rate was the highest in the Hornepayne area (519.0 per 10,000 live births) and was the lowest in the Smooth Rock Falls area (111.1 per 10,000 live births). Community Check-Up: Porcupine Health Unit 47 Chapter 4 References 1. Baird, P.A., Anderson, T.W., Newcombe, H.B., Lowry, R.B. “Genetic Disorders in Children and Young Adults: A Population Study.” Am J Hum Genet. 1988; 42 (5): 677- 693 2. Hall, J.G., Plowers, E.K., McIlvaine, R.E., Ean, V.H. “The frequency and financial burden of genetic disease in a pediatric hospital.” Am J Med Genet. 1978; 1 (4): 417-436 3. Childs, B. “Gene Mutation as a Cause of Human Disease,” in Mutagenic Effects of Environmental Contamination, ed. Sutton, H.E. and Harris, M.I. New York: Academic Press, 1972. 3-14 4. Scriver, C.R., “Window panes of eternity: health, disease, and inherited risk,” Yale J Biol Med. 1982; 55: 506-509. 48 Community Check-Up: Porcupine Health Unit 5 g Health Risk Behaviour Physical Activity Physical activity levels are an important indicator used by policy makers to implement healthy living and healthy weight programs. The activity level is divided into three categories: (a) Active, an energy expenditure value of 3.0 kcal/kg/day or higher; (b) Moderately Active, an energy expenditure value of 1.5–2.9 kcal/kg/day; and (c) Inactive, an energy expenditure value of 1.5 kcal/kg/day. The activity level categories are extracted from frequency, duration and intensity of the respondent’s participation in leisure-time physical activity in the Canadian Community Health Survey. Community Check-Up: Porcupine Health Unit 49 Figure 21: Activity levels for Ontario and Porcupine Health Unit, ages over 12, 2001-02 50 % Ontario 47.1 48.2 PHU Percentage 40 30 26.1 27.0 24.2 238.47 23.3 20 10 0 111.11 Physically Active Source: Moderately Active Inactive CCHS 2.1, Statistics Canada As Figure 21 shows, when comparing levels of physical activity between the Porcupine Health Unit and the Province of Ontario, the differences were negligible. 50 Community Check-Up: Porcupine Health Unit Figure 22: Leisure activity in Ontario and Porcupine Health Unit, ages over 12, 2001-02 80 70 % 73.6 66.0 Ontario 60 PHU 50.6 Percentage 50 44.5 40 35.8 30 25.1 33.6 22.8 20 8.4 10 0 Source: Walking Gardening Swimming Home exercise 6.9 No physical activity CCHS 2.1, Statistics Canada Among the listed leisure activities, the people of the Porcupine Health Unit area enjoyed walking and gardening more than their counterparts in Ontario (Figure 22). The differences were statistically significant. Swimming and home exercise were not chosen as popular leisure activities by the people of the health unit area. Figure 22 also shows that the proportion of inactive people (at leisure activities) was lower in the Porcupine Health Unit area than in Ontario. Community Check-Up: Porcupine Health Unit 51 Figure 23: Type of smoking behaviour in Ontario and Porcupine Health Unit area, 2001-02 50 % Ontario 40 PHU Percentage 30 20 37.1 39.3 40.6 28.5 27.1 16.7 10 3.2 0 Source: Daily 1.9 Occasional Former Never CCHS 2.1, Statistics Canada Smoking Smoking is not only associated with respiratory and cardiovascular diseases, but it is also associated with various cancers and degenerative diseases. The health risks of smoking depend on various factors, i.e., age of smoking initiation, cumulative exposure in years, number of cigarettes smoked and interaction with other factors. Recent data shows that the age of smoking initiation has decreased substantially. Even though males used to initiate smoking at an earlier age than females, recent data shows that this trend has changed. The smoking initiation age has become the same in both genders among the 12 to 19 year age group. 1 The “type of smoker” or smoking behavior indicator describes the proportion of persons over the age of 12, 52 Community Check-Up: Porcupine Health Unit Figure 24: Proportion of daily smokers in Ontario and Porcupine Health Unit area, 2001-02 % 14.5 15 12.6 12 Percentage 9.2 9 7.6 6 3 0 Male Female Male PHU Ontario Source: Female CCHS 2.1, Statistics Canada who identified themselves as “daily”, “occasional”, “former” and “never” smoker. In spite of the decline in the number of “daily” smokers in the Province of Ontario, 2 the rate did not decline in the Porcupine Health Unit area. The proportion of people who identified themselves as a “daily” smoker was higher among the population of the Porcupine Health Unit (27.1%) than that of Ontario (16.7%) (Figure 23). This difference was statistically significant. When the proportion of “daily” smokers was compared between genders in both Ontario and the Porcupine Health Unit, it showed that a higher proportion of males smoked “daily” compared to their female counterparts (Figure 24). In Ontario, this difference was statistically significant, whereas in the health unit area the difference was not. Community Check-Up: Porcupine Health Unit 53 Figure 25: Proportion of individuals ( >12 years of age) exposed to second-hand smoke at home in Ontario and Porcupine Health Unit area, 2001–02 % 100 Ontario Percentage 80 80.0 PHU 69.8 60 40 25.8 20 0 Source: 15.4 Exposed at home Not exposed CCHS 2.1, Statistics Canada About twenty-six percent (25.8%) of people in the Porcupine Health Unit area were exposed to second-hand smoke, whereas only fifteen percent (15.4%) of people in Ontario were exposed (Figure 25). This difference was statistically significant. 54 Community Check-Up: Porcupine Health Unit Alcohol Alcohol use in Canada, Ontario, and the Porcupine Health Unit area is on the rise. The CCHS 2.1 data analysis suggests that, in the past 13 years, the use of alcohol has increased in the Porcupine Health Unit catchment area. Non-drinkers were defined by Statistics Canada as the proportion of the population, 12 years of age or older, who had not consumed alcohol in the past 12 months. In Ontario, the proportion decreased from 27% in the year 1996 –973 to 23% in 2001– 02. In 1990, 21% of the Porcupine Health Unit area population over 12 years of age were identified as non-drinkers and 73% were identified as current drinkers (drank alcohol at least once in the last 12 months), 4 whereas in 2001–02, twenty percent (20%) of the population was identified as non-drinkers and 80% identified as current drinkers. The rise in the proportion of current drinkers is notable. Low-risk drinkers were defined by the CCHS survey as the proportion of drinkers, 20 years of age and over, who consumed 14 or fewer drinks per week for males or who consumed 9 or fewer drinks per week for females. In the Porcupine Health Unit area, 40% of the population were low-risk drinkers, while in the province of Ontario, 49% (49.23%) were low-risk drinkers. More women (22.3%) than men (18.0%) in the Porcupine Health Unit area were low-risk drinkers. Heavy drinkers were identified as the proportion of current drinkers, aged 20 and over, who consumed more than 5 drinks on one occasion, more than once per month during the previous year. In the Porcupine Health Unit area, Community Check-Up: Porcupine Health Unit 55 Figure 26: Frequency of drinking 5 or more drinks on one occasion in last 12 months, in Canada, Ontario & Porcupine Health Unit area, 2001-02 60 % Canada 51.8 Ontario 53.7 PHU 50 42.2 Percentage 40 30.2 30 24.2 26.1 22.5 20 20.7 20.5 10 0 Never Less than once a month More than once a month Frequency of having 5 or more drinks on one occasion Source: CCHS 2.1, Statistics Canada the proportion of heavy drinkers increased from 26% in 2000–01 to 30% in 2001–02. Figure 26 compares the rate of alcohol drinkers who never drank 5 or more drinks on one occasion in the last 12 months; 5 or more drinks on one occasion less than once a month in the last 12 months; and 5 or more drinks on one occasion more than once a month in the last 12 months. Significantly, the proportion of heavy drinkers in the Porcupine Health Unit area was higher than that of both Ontario and Canada. 56 Community Check-Up: Porcupine Health Unit Figure 27: Percentage of Canadian population aged 15 years or older who used marijuana in past years, by age group, 1994 & 2002 40 % 35 30 Percentage 25 20 15 10 5 0 15–17 18–19 20–24 25–34 35–44 45–54 m 1994 26 23 20 10 6 1 m 2002 29 38 35 18 11 6 Source: Statistics Canada Substance Abuse Substance abuse is an important public health issue and of particular significance in the Porcupine Health Unit area. In 2004, Timmins experienced the shocking report of the death of two teenagers who were victims of substance abuse. Figure 27 outlines the distribution of marijuana use in different age groups across Canada and shows that the highest use of marijuana occurred from age 18 to 19 and then it subsided according to age. The same figure also shows that the use of marijuana increased significantly in all age groups from 1994 to 2002. Community Check-Up: Porcupine Health Unit 57 Figure 28: Percentage reporting marijuana use during past year, Grade 7–12, 1993–2003 35 1999 % 33.2 31.9 30 Percentage 2003 32.6 30.0 27.6 30.9 27.6 28.4 24.7 25 20 31.1 2001 19.2 20.8 15 10 5 0 Source: Toronto North West East Ontario Students Drug Use survey, 2003 Figure 28 shows the percentage of marijuana use among students in Grades 7 to 12 in various regions of Ontario, including Toronto. The graph shows that the rate of marijuana use increased in the period between 1999 and 2003. The highest use was in the north region: 33.2%, compared to 24.7% in Toronto. As the Porcupine Health Unit is located in the northern part of the province, the north region cited above can contain data from the catchment area. 58 Community Check-Up: Porcupine Health Unit Figure 29: Self-reported drug use (among those who reported taking drugs) in the last 12 months in Timmins high schools, 1998–2000 50 % Percentage 40 30 20 10 0 Marijuana Hashish Cocaine Other m Male 43.1 30.5 7.1 18.4 m Female 35.3 22.1 1.9 10.3 Source: Timmins Youth Needs Assessment Study, 1998–2000 A study was conducted by TYNA (Timmins Youth Needs Assessment and Strategy Development) among high school students in Timmins from 1998 to 2000. This is a very important study, as the data pertains to local students. About 17% of the study participants stated that they used someone else’s prescribed medication. Figure 29 shows that among those who used illicit drugs, marijuana was the drug of choice, followed by hashish, cocaine and others. This figure also shows that the prevalence of drug use was higher among males than females. Community Check-Up: Porcupine Health Unit 59 Figure 30: Self-reported drug use (among those who reported taking drugs) in the last 12 months in Timmins high schools, 1998–2000 40 % 37.5 34.9 35 Marijuana 32.4 Hashish Percentage 30 23.8 25 20 17.8 15.9 15 10 5 0 Source: 8.1 7.5 3.5 Daily 7.6 7.2 3.8 Almost daily Weekly Occasionally Rarely Never Timmins Youth Needs Assessment Study, 1998–2000 About a quarter (23.8%) of high school students (who reported some kind of drug use) said they used marijuana occasionally whereas 15.9% used on weekly basis (Figure 30). Of the study participants, 44.3% said that it was very easy to get marijuana in Timmins. Boredom, peer pressure, stress, bad family influences, and lack of parental attention were some of the important risk factors for drug use in the area, according to the study participants. Inaccessibility of activities due to expense or lack of transportation, lack of a place to “hang out”, and the long winter season might be other reasons for illicit drug use. According to the TYNA study participants, the most effective technique to prevent the use of illicit drugs could be a presentation done by an individual who survived drug dependency, or by a health care professional or member of a law-enforcing agency. Respondents suggested that strict 60 Community Check-Up: Porcupine Health Unit law enforcement (e.g., undercover police or unannounced inspections of the school and schoolyard) could also be used to curb the prevalence of drug abuse. Chapter 5 References 1. Statistics Canada. Health Indicators, vol. 2004, no. 1. “Smoking initiation 2003.” Catalogue no. 820221-XIE 2. Statistics Canada. Report on smoking in Canada, 1985 to 2001. Catalogue no. 82F0077XIE 3. Sudbury and District Health Unit. Alcohol Use: Results for Sudbury and Districts from the Canadian community Health Survey. Sudbury: Public Health Research, Education and Development (PHRED) Program, Sudbury and District Health Unit, 2005 4. Ontario Ministry of Health and Long-term Care, Ontario Health Survey, 1990. Community Check-Up: Porcupine Health Unit 61 62 Community Check-Up: Porcupine Health Unit 6 g Nutrition Healthy Weights–BMI This chapter focuses on body mass index (BMI) and nutrition. Obesity has emerged as the most important public health concern in recent years. Current data indicate that obesity is increasing among children at an epidemic rate. The experience of obesity is not a pleasant one and carries some serious consequences, including type 2 diabetes, coronary heart disease and stroke, hypertension, osteoarthritis, cancers (breast, endometrial, colon, prostate and kidney) and also gall bladder disease. 1 Other health risks include dyslipidemia, insulin resistance, obstructive sleep apnea, respiratory problems, difficulty performing activities of daily living, impaired fertility and psychosocial problems. 1 Community Check-Up: Porcupine Health Unit 63 Figure 31: Prevalence of obesity among boys and girls 80 % 74.5 Boys 67.7 70 Girls Percentage 60 50 40 30 17.3 20 14.5 13.5 10.8 10 1.5 0 Source: 0.3 Underweight Acceptable weight Overweight Obese Healthy Measures study, Porcupine Health Unit, 2004 In 2004, the Porcupine Health Unit conducted a cross-sectional study on childhood obesity among school-age children in the City of Timmins. 2 The overweight and obesity rate in the total study population was 28%. Boys were found to be more overweight and obese than girls (Figure 31). The study was also compared with other studies and found that the rate of overweight and obesity is same as that of other jurisdictions. 64 Community Check-Up: Porcupine Health Unit Table 15: Proportion of overweight and obesity, Ontario Ontario 1996–97 Ontario 2000–01 Ontario 2001–02 Acceptable Weight (BMI 18.5–24.9) 48.2% 47.4% 41.8% Overweight (BMI 25.0–29.9) 33.1% 32.9% 30.0% Obese (BMI 30.0 or higher) 12.0% 15.3% 13.4 % Body Mass Index Source: Ontario Health Survey, 1990. Ministry of Health and Long-term Care, Ontario and CCHS 1.1 and 2.1 The adult BMI statistics in this section have been extracted from the Canadian Community Health Survey, 2.1, which was conducted in 2001–02. BMI is defined as weight in kilograms divided by height in metres squared. In this section, BMI has been calculated for those aged 18 and above, excluding pregnant women. The international standard for BMI has been used in this analysis. According to the international standard for BMI, underweight is regarded as having a BMI under 18.5, acceptable weight is 18.5–24.9, overweight is 25.0–29.9, and obese is regarded as having a BMI above 30.0. The rate of obesity in Ontario has increased from 12% in the year 1996–97 to 13.4% in 2001–02 (Table 15). Community Check-Up: Porcupine Health Unit 65 Figure 32: Weight categories for Ontario and Porcupine Health Unit, ages over 18, 2001–02 50 % Ontario 41.8 PHU 40 Percentage 31.2 30 33.1 30.0 20.1 20 13.4 10 0 Source: Acceptable weight BMI 18.5−24.9 Overweight BMI 25.0−29.9 Obese BMI > 30 CCHS 2.1, Statistics Canada Figure 32 shows that the rate of obesity was higher in the Porcupine Health Unit area than in the province (20.1% vs. 13.4%, which was statistically different) and the rate of overweight was higher in the area than in Ontario (33.1% vs. 30.0%). This data analysis may not match the analysis done by Statistics Canada because of a different methodology and also the inclusion of a “Not Applicable” category in this analysis. 66 Community Check-Up: Porcupine Health Unit Figure 33: Weight categories for Porcupine Health Unit, by gender, ages over 20-64, 2001–02 25 % Female Male 20.4 Percentage 20 15 18.0 13.2 12.7 10.7 10 9.4 5 0 Source: Acceptable weight BMI 18.5-24.9 Overweight BMI 25.0-29.9 Obese BMI > 30 CCHS 2.1, Statistics Canada According to Figure 33, males were more overweight and obese than females in the Porcupine Health Unit area and there was a statistically significant difference between males and females in the overweight group. Community Check-Up: Porcupine Health Unit 67 Figure 34: Weight categories for Porcupine Health Unit, by age group (over 18), 2001–02 20 % 18-34 18.0 35-44 Over 45 Percentage 15 13.9 10.9 10.6 10 8.4 6.7 6.7 5.4 5 0 Source: 3.8 Acceptable weight BMI 18.5−24.9 Overweight BMI 25.0−29.9 Obese BMI > 30 CCHS 2.1, Statistics Canada The prevalence of overweight and obesity were also analyzed according to age groups. The three groups were: between ages of 18 and 34; between ages of 35 and 44; and above the age of 45. Figure 34 shows that the prevalence of acceptable weight, overweight and obesity was the highest among people over the age of 45. This could be due to the fact that a higher proportion of people in this age group responded to the Canadian Community Health Survey. 68 Community Check-Up: Porcupine Health Unit Figure 35: Vegetables and fruit consumption per day for Ontario and Porcupine Health Unit, 2001–02 80 % Ontario 70 PHU 63.3 60 55.3 Percentage 50 40 36.5 29.2 30 20 10 0 Source: less than 5 servings per day 5 – 10 servings per day CCHS 2.1, Statistics Canada Vegetables and Fruit Consumption It is important to have a balanced diet to maintain a healthy life. According to Canada’s Food Guide to Healthy Eating, 5–10 servings of vegetables and fruit are recommended per day. This section explores the data for the Porcupine Health Unit compared with that of Ontario. The data were also stratified according to age and gender. The data for this section were extracted from the Canadian Community Health Survey, 2.1. Figure 35 shows that a lower percentage of people in the Porcupine Health Unit area consumed the recommended 5– 10 servings of vegetables and fruit, compared with that of Ontario. This difference was statistically significant. Twentynine percent of people in the health unit area consumed Community Check-Up: Porcupine Health Unit 69 Figure 36: Vegetables and fruit consumption per day for Porcupine Health Unit, by gender, 2001–02 35 % Male Female 34.7 30 28.7 Percentage 25 20 18.2 15 11.0 10 5 0 Source: less than 5 servings per day 5 – 10 servings per day CCHS 2.1, Statistics Canada 5–10 servings of vegetables and fruit, compared to thirty-six percent of the Ontario population. When vegetables and fruit consumption between two genders were compared, it showed that a lower percentage of males (11.0%) consumed the recommended servings per day than their female counterparts (18.2%), a statistically significant difference (Figure 36). 70 Community Check-Up: Porcupine Health Unit Figure 37: Vegetables and fruit consumption per day for Porcupine Health Unit, for ages over 18, 2001–02 (5–10 servings per day) 15 % 12.1 Percentage 12 9 6.6 6.3 18–34 35–44 6 3 0 Source: > 45 CCHS 2.1, Statistics Canada Finally, the consumption of the recommended 5–10 servings of vegetables and fruit were compared among different age categories (Figure 37). Among the three age categories, a higher percentage of people in the age group above 45 years consumed the recommended 5–10 servings of vegetables and fruit every day than two other groups. This difference was statistically significant. Community Check-Up: Porcupine Health Unit 71 Chapter 6 References 1. Basrur, S., Chief Medical Officer of Health, Ontario. 2004 Chief Medical Officer of Health Report: Healthy Weights, Healthy Lives. 2005 2. Haque, F., de la Rocha, A.G., Horbul, B.A., Desroches, P., et al. Prevalence of childhood obesity in a Northeastern Ontario city: a cross-sectional study. (Healthy Measure Study–2004) 96th Annual Canadian Public Health Association Conference, Ottawa, 2005 72 Community Check-Up: Porcupine Health Unit 7 g Dental Health The term caries-free children is defined as the children who have never experienced dental caries or cavities. A dental caries is determined when a lesion is found in a pit or on the surface of a tooth with an identifiable softened floor, undermined enamel or softened wall. Teeth with temporary fillings also fall into this category. The objective of the Porcupine Health Unit is to increase the proportion of children with good oral health. Community Check-Up: Porcupine Health Unit 73 Figure 38: Percentage of children with acute tooth decay (1996–2005) 15 % 13.6 Percentage 12 12.2 11.2 12.5 13.1 13.7 14.2 14.7 10.8 9 6 3 0 Source: 1996/7 1997/8 1998/9 1999/ 2000 2000/1 2001/2 2002/3 2003/4 2004/5 DIS data The Porcupine Health Unit Dental Services annually provide students in Grades JK, 2, 4, 6 and 8 with dental screening to determine their oral health status. The percentage of children with tooth decay has increased in the Porcupine Health Unit area from 1996 to 2005 (Figure 38), and at the same time, the number of caries-free children has declined in the area. A complete Dental Indices Survey (DIS) is provided following ministry protocols to collect data on the oral health of young children in our population. Due to small sample size, missing data, different methodology, the regional comparison of the caries-free children are presented only for 5-yearold children in Figure 39. The proportion of caries-free chil- 74 Community Check-Up: Porcupine Health Unit Figure 39: Caries-free 5 year old children in various Northern Ontario health units, 2002–04 80 % 70 60 Percentage 50 40 30 20 10 0 2002–03 2003–04 m PHU 58.0 52.0 m Sudbury 71.4 71.2 m North Bay 64.8 63.0 m Algoma 51.9 53.1 m Thunder Bay 59.9 66.1 Source: DIS data dren has declined from 58% in the year 2002–03 to 52% in 2003–04. In the year 2003–2004, the proportion was lowest in the Porcupine Health Unit area at 52.0%, whereas the Sudbury Health Unit area ranked the highest at 71.2%. The Deft Index denotes the number of primary, decayed, extracted or filled teeth due to dental decay and indicates the severity of dental disease. This index is used as an indicator of the dental health status of young children in a community. The goal of the health unit is to achieve a lower deft index. The lower the index, the better the dental health status of the health unit population. One of the objectives Community Check-Up: Porcupine Health Unit 75 Figure 40: Mean deft score for 5-year-old children in various Northern Ontario health units, 2002–04 2.5 Mean deft score 2.0 1.5 1.0 0.5 0.0 2000–01 2001–02 2002–03 2003–04 m PHU 1.8 2.0 2.0 2.4 m Sudbury 1.5 1.2 1.1 1.2 no data no data 1.5 1.7 m Algoma 2.0 2.2 2.4 2.3 m Thunder Bay 2.3 2.2 2.2 2.0 m North Bay Source: DIS data of the Public Health Mandatory Health Programs and Service Guidelines is to reduce the prevalence of dental disease in children. Due to small sample size, missing data and different methodology, the regional comparison of the deft Index are presented only for 5-year-old children in Figure 40. The figure shows that the deft Index increased 33% in the Porcupine Health Unit area, from 1.8 in 2000–01 to 2.4 in 2003–04. 76 Community Check-Up: Porcupine Health Unit 8 g Mental Health Mental illness can be defined as alterations in thinking, mood and/or behaviour associated with significant distress and impaired functioning over an extended period of time. The symptoms, which can vary from mild to severe, will depend on the type of mental illness, the patient, the family and the socio-economic environment. 1 Every individual goes through stressful events during his or her lifetime and learns how to cope with it. When the event is overwhelming or prolonged, it can lead to mental illness. Physical health and mental health are intermingled. People who suffer from physical ailments can also suffer from depression or anxiety. On the other hand, people who suffer from mental illness, such as eating disorders, can suffer weight loss or electrolyte imbalance. 1 Mental illness affects all ages. According to the Canadian Institute for Health Information, the rate of hospitalization due to mental illness in women in all age groups was higher than in their male counterparts. About half of the hospital admissions (due to one of the seven most common mental illnesses) were in the 15 to 44 age group, whereas a quarter (24%) of the hospitalizations were among the 45 to 64 age group. 1 These data show the significance of preventive programs to curb the prevalence of mental illnesses. Community Check-Up: Porcupine Health Unit 77 Figure 41: Prevalence of mental illnesses, comparing rates between males & females in Canada, 2002–03 40 % 39.6 30 27.1 25.7 25 Percentage Female Male 35 20 19.4 17.5 15 13.7 10 8.0 5 9.7 8.8 4.8 3.0 14.3 3.1 5.2 r he Ot or lat e d dis dis ot ic Sb s ta nc e- re yc h nia /p s hr e Sc hiz op de de or de or dis na lit y Pe r r r rs r de or so M oo d dis iso ga nic d Or An xie ty dis or rd de r er 0 Source: Hospital Mental Health Database, Canadian Institute for Health Information, 2002–03 Mental illness has an enormous impact on the Canadian economy. A comprehensive report has not yet been published to quantify the burden of mental illness on society. However, one study, done by Health Canada in 1993, used various administrative and survey data, including physician billing data, hospitalization data and data on self-reported activity restriction. This study estimated that the cost of mental illness was 7.33 billion Canadian dollars. 2 In 2001, another study, which included the National Population Health Survey data, showed that the annual economic impact of mental health illness in Canada was 14.4 billion Canadian dollars. 3 The author concluded that this could be an underestimate. The Canadian Institute for Health Information reported that among the seven most common mental illnesses, mood disorder had the highest prevalence rate (27.1% in males 78 Community Check-Up: Porcupine Health Unit Figure 42: Prevalence of mental illnesses, in Timmins, 2004–05 50 % 46.8 38.2 40 Percentage 30 20 10 r he Ot s ap dic de dis d De ve lo pm lat e re st a nc e- na lit y so Pe r 2.1 en ta lh an or or dis or dis d oo M rs rs de rs de de or dis ot ic yc h 0.6 Sc hiz op hr e nia /p s so fa er rd r ce ce n les do dis ty An xie Di so Ad jus tm en td iso or rd de er rs s 0 3.9 2.3 0.8 Su b 3.5 0.8 Source: Canadian Mental Health Association (Cochrane-Timiskaming Branch) and 39.6% in females). Anxiety disorders (3.0% in males and 4.8% in females) had the lowest prevalence in the year 2002–2003 (Figure 41) but due to lack of the original data, the comparisons could not be analyzed statistically. The Cochrane-Timiskaming Branch of the Canadian Mental Health Association has provided data on the prevalence of mental illnesses in the Timmins area (Figure 42). Due to the lack of provincial data, the prevalence rate was not compared with that of the Province of Ontario. According to these statistics, mood disorders had the highest prevalence rate (48%), followed by schizophrenia and other psychotic diseases (38%). Adjustment disorders had the lowest prevalence rate (1%) among the population of Timmins in the year 2004–2005. Community Check-Up: Porcupine Health Unit 79 Due to different methodologies and categorization, the prevalence rate of Canada and Timmins was not compared; however, the trend of mental illnesses in Timmins area was similar to that of Canada. Chapter 8 References 1. Stewart, P., Lips, T., Lakaski, C., Upshall, P. Health Canada. A Report on Mental Illnesses in Canada. Ottawa, Canada 2002 2. Moore, R., Mao, Y., Zhang, J., Clarke, K. Economic Burden of Illness in Canada, 1993. Health Canada, 1997 Ottawa 3. Stephens, T., Joubert, N. “The economic burden of mental health problems.” Chronic Dis Can. 2001. 22(1): 18-23 80 Community Check-Up: Porcupine Health Unit 9 g Communicable & Infectious Diseases Gastrointestinal Infection Gastrointestinal infections occur due to the invasion of organisms into the human gastrointestinal tract. Proliferation of these organisms in the human body causes a number of symptoms like nausea, vomiting, watery or bloody diarrhea, abdominal distension or bloating. The organisms can be ingested by eating uncooked or partially-cooked poultry, meat or fish. These organisms can also be ingested by using contaminated kitchen utensils. Some gastrointestinal infections — e.g., Yersinia enterocolitica — occur due to ingestion of unpasteurized milk or milk products. Among gastrointestinal infections, campylobacter, which causes bloody diarrhea, is the most common type found in Canada. Community Check-Up: Porcupine Health Unit 81 Table 16: Gastrointestinal infections in the Porcupine Health Unit, 1990-2004, Rate/100,000 Year Amoeba Campylobacter Cryptosporidium Giardiasis Salmonella Shigela 1990 5.0 39.7 0 24.8 13.9 32.7 4.0 1991 6.0 45.1 0 25.0 26.0 3.0 7.0 1992 2.0 60.3 0 39.2 22.1 0 7.0 1993 6.0 38.2 0 26.1 20.1 0 6.0 1994 2.0 40.2 0 15.1 24.1 1.0 2.0 1995 3.0 40.1 0 17.0 18.0 0 3.0 1996 3.0 35.0 1.0 26.0 26.0 2.0 5.0 1997 6.0 32.2 1.0 20.1 14.1 1.0 7.0 1998 2.0 32.2 1.0 22.5 28.6 2.0 0 1999 1.0 28.0 0 19.7 19.7 0 1.0 2000 0 10.6 1.1 6.4 17.0 0 1.1 2001 0 9.7 1.1 11.8 5.4 0 0 2002 0 11.0 1.0 6.0 7.0 0 2.0 2003 1.0 10.9 5.0 5.0 9.9 0 1.0 2004 2.2 5.6 1.1 9.0 11.2 1.1 1.1 Source: Yersinia Integrated Public Health System (iPHIS) database, 2006 Table 16 shows that the rate of campylobacter infection decreased in the Porcupine Health Unit area since the year 2000. Salmonella infection was predominant in the region and, like campylobacter, the rate of infection has decreased since 2000. Among the bacteria which cause non-bloody diarrhea, giardiasis was the most prevalent in the region. The rate of giardiasis has also subsided since 2000. 82 Community Check-Up: Porcupine Health Unit Table 17: Rate of hepatitis among the population of the Porcupine Health Unit area, 1990-2004, Rate/100,000 Year Hepatitis A Hepatitis C 1990 2.0 18.8 1.0 1991 2.0 16.0 1.0 1992 0 6.0 16.1 1993 1.0 3.0 22.1 1994 0 1.0 21.1 1995 2.0 2.0 36.1 1996 2.0 3.0 61.9 1997 2.0 1.0 29.2 1998 0 2.0 35.8 1999 0 0 60.2 2000 0 1.1 40.3 2001 0 1.1 35.5 2002 4.0 3.0 24.9 2003 1.0 2.0 36.8 1.1 24.7 2004 Source: Hepatitis B Integrated Public Health System (iPHIS) database, 2006 Hepatitis Among the hepatitis viruses, hepatitis B is the only DNA virus. All other hepatitis viruses are RNA viruses. The hepatitis A virus is spread by the fecal-oral route, while hepatitis B is spread through sexual contact and by body fluids i.e., blood, saliva, semen or vaginal fluid. The hepatitis C virus is spread through infected blood. From 1990 to 2004, hepatitis C was the most prevalent of all three serotypes in the Porcupine Health Unit area (Table 17). Community Check-Up: Porcupine Health Unit 83 Table 18: Vaccine-preventable diseases, Porcupine Health Unit, Rate/100,000 Year Source: Diphtheria Haemopilus Influenza B Measles Whooping Cough 1990 0 1.9 1.9 36.7 1991 0 1.0 144.2 2.0 1992 0 0 0 4.0 1993 0 1.0 0 13.1 1994 1.0 0 0 88.5 1995 1.0 0 2.0 38.1 1996 0 0 0 2.0 1997 0 1.0 0 4.0 1998 0 0 1.0 147.2 1999 0 0 1.0 30.1 2000 0 0 0 2.1 2001 0 0 0 2.2 2002 0 1.0 0 17.0 2003 0 0 0 7.0 2004 0 0 0 4.5 Integrated Public Health System (iPHIS) database, 2006 Vaccine-Preventable Diseases Diphtheria, haemophilus influenza B, measles and pertussis (whooping cough) were the most common vaccine-preventable diseases found in the population of the Porcupine Health Unit area. The area experienced an outbreak of whooping cough in 1998 (Table 18), after which the rate subsided. The area also experienced an outbreak of measles in 1991, when 144 children were infected. 84 Community Check-Up: Porcupine Health Unit Table 19: Source: Sexually transmitted infections in the Porcupine Health Unit Rate/100,000 population Year Chlamydia Gonorrhea HIV Syphilis 1990 93.2 29.8 0 1.0 1991 123.2 3.0 2.0 0 1992 123.6 2.0 1.0 0 1993 103.5 1.0 1.0 1.0 1994 180.1 2.0 0 0 1995 175.4 4.0 0 1.0 1996 112.9 4.0 0 0 1997 110.7 1.0 0 0 1998 142.1 2.0 1.0 0 1999 139.2 2.1 1.0 0 2000 146.4 0 0 0 2001 200.4 1.1 0 0 2002 147.7 2.0 0 0 2003 187.1 2.0 0 0 2004 226.7 2.2 0 0 Integrated Public Health System (iPHIS) database, 2006 Sexually Transmitted Infections The rise of some sexually transmitted infections (STIs) are becoming one of the new challenges for the public health sector. The rate of chlamydia infection has surmounted all other STIs in the area (Table 19). The Porcupine Health Unit has shown increases and decreases in chlamydia infections over the years, however there has been an overall increase (2.4 times the number of infections) from 1990 to 2004 (Table 19). Community Check-Up: Porcupine Health Unit 85 Figure 43: Comparison of chlamydia infection among Canada, Ontario and Porcupine Health Unit (1996–2002) 250 Rate / 100,000 200 150 100 50 0 1996 1997 1998 1999 2000 2001 2002 115.9 113.9 129.0 138.2 151.0 160.7 178.9 m Ontario 91.5 87.4 99.1 108.4 117.7 137.8 149.6 m Canada 114.1 111.7 144.1 139.9 147.9 201.6 164.3 m PHU Sources: iPHIS and Statistics Canada When the chlamydia infection rates in the Porcupine Health Unit were compared with Ontario and Canada, the Porcupine Health Unit area had the highest rates in most years from 1996 to 2002 (Figure 43). 86 Community Check-Up: Porcupine Health Unit 10 g Morbidity Patterns Hospitalization The rate of hospitalization in Canada continued to decline until the year 2003–04, when the rate started to rise again. Even using the age standardized rate for hospitalization, the data show that the trend is levelling off. The average length of hospital stay increased in the past decade and then it decreased in the year 2003–04 (from 7.0 to 6.9 days) and stayed at the same rate in the year 2004–05. 1 Community Check-Up: Porcupine Health Unit 87 Figure 44: Inpatient hospitalizations for Canada, 1995–96 to 2004–05 3,500,000 Hospitalizations 3,000,000 2,500,000 2,000,000 1,500,000 Canada (excluding Quebec) 1,000,000 Canada 500,000 0 1995-96 1996-97 1997-98 1998-99 1999-2000 2000-01 2001-02 2002-03 2003-04 2004-05 Fiscal year Sources: Discharge Abstract Database and Hospital Morbidity Database, Canadian Institute for Health Information In the last decade, the inpatient hospitalization rate has declined 13%, while the average number of days spent in the hospital has increased by 3%. In 1995–96, acute care hospitals received 2.5 million hospitalizations and the average length of stay was 6.7 days. After a decade, the hospitalization rate declined to 2.2 million in 2004–05 and the average length of stay increased to 6.9 days. 1 An increased number of ambulatory care services might be responsible for this change. 88 Community Check-Up: Porcupine Health Unit Figure 45: Leading causes of hospitalization in Ontario and in the Porcupine Health Unit area, 2000–04 20 Ontario 19.7 PHU 16.7 15.6 12.2 12.0 11.4 12.1 11.2 10 9.2 7.9 7.8 5.7 5.6 7.6 6.8 6.5 5.0 5 2.9 ry to ira Re sp bir th c ch y& nc eg na al gic olo Ne ur ild hia yc ps & cu us M tri al let ke los iso nin y ar po y& In jur nit ou rin cri Ge do g 1.9 ne ve En sti ge cu rd iov as Ca Ca Di er nc 0 lar 2.4 Pr Percentage 15 Sources: Provincial Health Planning Database (PHPDB), extracted July, 26, 2005. Health Planning Branch, Ministry of Health and Long-Term Care, Ontario. Figure 45 shows a comparison of the leading causes of hospitalization in Ontario and in the Porcupine Health Unit area. In Ontario, the leading cause of hospitalization was pregnancy and childbirth (19.7%), whereas, in the Porcupine Health Unit area, cardiovascular disease (15.6%) was the leading cause of hospitalization from 2000 to 2004. Community Check-Up: Porcupine Health Unit 89 Figure 46: Comparison of age-specific respiratory & cardiovascular rates, Porcupine Health Unit area, 2000–04 60 % 56.0 Respiratory diseases 50 47.1 Cardiovascular diseases 40 Percentage 34.4 30 25.3 20 13.5 10.0 10 0 Sources: 0.5 0–4 3.2 0.7 1.0 0.6 5 – 14 15 – 19 7.8 20 – 44 45 – 64 65+ Provincial Health Planning Database (PHPDB), extracted July, 26, 2005. Health Planning Branch, Ministry of Health and Long-Term Care, Ontario. Figure 46 shows the age-specific disease rate for cardiovascular and respiratory diseases. The rate of hospitalization for both diseases increased with the increased age of the population. Respiratory diseases were prevalent in the young population (0–4 years). The lowest rate of respiratory diseases was reported in the 15–19 age group. As respiratory diseases (e.g., the common cold) are contagious, during the school year or in the day-care setting, infants and pre-kindergarten students get infected more often with respiratory diseases than their counterparts who do not go to school or day care. 90 Community Check-Up: Porcupine Health Unit Table 20: Leading causes of hospitalization in the Porcupine Health Unit area (% of hospitalizations, 2000–04) Cause Cancer PHU Hornepayne Hearst I. Falls Kapus kasing SRF Timmins Matheson Moosonee Cochrane 5.6 2.9 5.9 7.0 7.1 4.4 5.5 3.9 1.4 5.6 Cardiovascular 15.6 9.5 12.7 15.4 14.3 18.0 17.0 15.9 8.4 15.2 Digestive 11.4 15.0 12.1 13.1 16.0 14.2 9.1 13.6 9.8 12.0 Endocrine 2.9 3.6 2.5 2.7 2.7 4.2 2.9 2.8 3.6 2.8 Genitourinal 6.8 6.8 7.6 6.3 6.7 6.4 6.7 6.3 5.8 8.3 Injury & Poisoning 1.9 2.2 1.8 2.1 2.2 1.8 1.4 2.3 4.4 2.5 Musculo skeletal 6.5 11.2 8.8 8.2 6.4 7.4 5.7 5.6 4.2 7.0 Neurological & Psychiatric 12.2 8.2 10.0 12.3 12.3 12.7 13.1 8.7 11.9 11.7 Pregnancy 12.1 11.6 15.2 7.7 9.0 5.7 13.6 9.0 20.5 10.4 Respiratory 11.2 9.6 9.5 11.9 10.7 9.2 11.4 17.1 9.8 11.0 Supp. Class 8.2 11.5 8.5 7.9 6.6 10.8 8.2 8.5 12.5 7.4 Sources: Provincial Health Planning Database (PHPDB), extracted July, 26, 2005. Health Planning Branch, Ministry of Health and Long-Term Care, Ontario. Community Check-Up: Porcupine Health Unit 91 92 Community Check-Up: Porcupine Health Unit 11 g Cancer Statistics Cancer Incidence Cancer is one of the leading causes of death in Canada. According to the Canadian Cancer Society, an estimated 149,000 people were afflicted with cancer and an estimated number of 69,500 cancer-related deaths occurred in Canada in 2005. Traditionally, men were more often afflicted with cancer and subsequently died more often due to cancer than women (4.7% for new cases and 11.9% for deaths). 1 Cancer incidence is defined as the number of new cancer cases that occur in a population in a particular year. Cancer mortality is defined as the number of deaths that occur due to cancer in a population in a particular year. Here, both indicators have been reported per 100,000 population. In the calculation of both indicators, 1996 Canadian population estimates were used. Community Check-Up: Porcupine Health Unit 93 Figure 47: Leading cause of cancer incidence, in both genders, Porcupine Health Unit area, 2002 80 70 60 Rate / 100,000 61.9 59.0 61.6 56.3 50 40 30 20 12.6 9.7 10 11.0 12.4 9.1 7.7 ia m us ph leu ke er Ut r de ad Bl ix rv Ce te ta os Pr as Pa nc re st ea Br h ac om St Tr ac he a, Ly br m on ch Co us lor ec , lu ta l ng 0 Source: Cancer Care Ontario, 2004 Among the leading causes of cancer incidence in the Porcupine Health Unit area, the incidence rate of cancer of the trachea, bronchus and lung was the highest (61.9/100,000) in both genders, followed by breast cancer (61.6/100,000), colorectal (59/100,000), and prostate (56.3/100,000). The lowest prevalent, at 7.7/100,000, was the uterine cancer rate (Figure 47). 94 Community Check-Up: Porcupine Health Unit Figure 48: Trends of the incidence of trachea, bronchus and lung cancer, in Ontario and Porcupine Health Unit area, 1983–2002 120 Rate / 100,000 100 80 60 40 20 0 1983 1984 1985 1986 1987 1988 1989 1990 1991 1992 1993 1994 1995 1996 1997 1998 1999 2000 2001 2002 m Ontario 60.3 60.1 60.5 60.8 60.2 61.9 61.0 61.4 61.5 61.8 60.8 58.9 58.5 59.4 57.2 58.5 57.0 57.0 57.3 54.4 m PHU 93.4 98.0 92.7 95.1 91.0 105.0 84.4 80.4 94.5 90.8 74.0 112.0 86.0 79.0 56.8 78.1 75.9 77.1 90.4 61.9 Source: Cancer Care Ontario, 2004 Between 1983 and 2002, the incidence rate of cancers of the trachea, bronchus and lung decreased 34% from 93.4/100,000 to 61.9/100,000 (Figure 48), whereas the provincial rate during this 20 years remained quite similar and only decreased 10% (9.7%) in that two decade period. During the last 20 years, the incidence rate of trachea, bronchus and lung cancers in the Porcupine Health Unit area was the highest in 1994 (112/100,000) and lowest in 2002. Community Check-Up: Porcupine Health Unit 95 Figure 49: Trends of the incidence of prostate cancer, in Ontario and Porcupine Health Unit area, 1983–2002 100 Rate / 100,000 80 60 40 20 0 1983 1984 1985 1986 1987 1988 1989 1990 1991 1992 1993 1994 1995 1996 1997 1998 1999 2000 2001 2002 m Ontario 31.4 33.4 34.2 34.8 35.9 36.0 m PHU 27.2 23.9 28.4 Source: 37.5 37.5 42.1 49.2 55.2 58.2 56.2 50.3 53.0 44.1 28.3 33.0 52.0 66.4 54.7 46.9 52.6 49.1 57.8 56.7 56.8 60.7 66.2 62.6 44.4 56.7 40.6 67.7 99.4 51.6 56.3 Cancer Care Ontario, 2004 Among the 10 leading cancer sites in males, prostate cancer had the highest rate (30%), followed by trachea, bronchus and lung (23%).2 The rate of prostate cancer increased significantly from 27.2/100,000 in 1983 to 56.3/100,000 in 2002 (Figure 49). This increase was more than double. During the last 20 year period, the rate was the highest in 2000 at 99.4/100,000. 96 Community Check-Up: Porcupine Health Unit Figure 50: Trends of breast cancer incidence, in Ontario and Porcupine Health Unit area, 1983–2002 80 70 Rate / 100,000 60 50 40 30 20 10 0 1983 1984 1985 1986 1987 1988 1989 1990 1991 1992 1993 1994 1995 1996 1997 1998 1999 2000 2001 2002 m Ontario 51.1 m PHU 53.2 47.4 52.6 46.0 34.2 56.3 46.6 50.2 41.8 46.9 56.6 46.9 42.9 37.5 Source: 52.7 53.4 51.2 52.8 56.4 55.6 55.0 58.7 59.6 57.0 56.6 56.9 56.5 58.7 57.8 58.8 56.3 56.1 61.9 41.4 67.6 57.7 51.9 57.9 61.6 Cancer Care Ontario, 2004 Among the 10 leading cancer sites in females, breast cancer incidence was the highest (41%), followed by trachea, bronchus and lung (14%) in 2002.2 Breast cancer incidence went up 16% (15.8%), during the last 20 years from 1983 to 2002 (Figure 50). The incidence of breast cancer was the highest in 1999 (67.6/100,000) and the lowest in 1987 (34.2/100,000) during the same time period. The provincial rate was lower than that of the Porcupine Health Unit rate in 2002. Due to calculation difficulties, the rates could not be compared statistically. Community Check-Up: Porcupine Health Unit 97 Figure 51: Mortality due to cancer of the trachea, bronchus and lung, in Ontario and Porcupine Health Unit area, 1983–2002 100 Rate / 100,000 80 60 40 20 0 1983 1984 1985 1986 1987 1988 1989 1990 1991 1992 1993 1994 1995 1996 1997 1998 1999 2000 2001 2002 m Ontario 48.4 49.6 49.7 48.0 48.9 m PHU 81.7 73.9 79.7 68.7 95.7 68.7 Source: 51.1 49.6 49.6 49.2 48.3 50.0 49.4 76.1 72.9 66.8 65.5 47.3 47.6 45.9 46.9 71.5 68.8 60.3 75.3 64.1 61.1 47.7 45.8 46.4 45.5 49.5 62.9 75.5 64.6 Cancer Care Ontario, 2004 Cancer Mortality Among the leading causes of cancer mortality, trachea, bronchus and lung cancer was the highest. In 2002, among all cancer deaths, 38% of cancer deaths in males and 36% of cancer deaths in females occurred due to cancer of trachea, bronchus and lungs. 2 In both genders, the mortality rates remained high over the last 20 years. A decline of twentyone percent (20.9%) occurred in cancer mortality of trachea, bronchus and lung in the Porcupine Health Unit area from 1983 to 2002 (Figure 51), whereas in the province, there was only a 6% decline in the same cancer mortality through the same 20 year period. 98 Community Check-Up: Porcupine Health Unit Figure 52: Mortality due to breast cancer, in Ontario and Porcupine Health Unit area, 1983–2002 30 Rate / 100,000 25 20 15 10 5 0 1983 1984 1985 1986 1987 1988 1989 1990 1991 1992 1993 1994 1995 1996 1997 1998 1999 2000 2001 2002 m Ontario 18.6 19.4 m PHU 29.5 16.6 19.6 14.2 Source: 19.6 19.7 19.3 18.8 19.4 18.3 18.0 18.0 17.9 18.2 18.0 17.4 17.7 15.9 13.8 14.4 20.6 17.1 18.3 17.9 8.5 17.4 17.7 16.6 15.0 14.9 8.8 7.5 15.5 14.6 14.4 12.1 15.9 14.0 Cancer Care Ontario, 2004 Among the ten leading causes of cancer mortality in females, breast cancer mortality ranked second (17%), preceded by mortality due to cancer of the trachea, bronchus and lung (36%) in 2002. Breast cancer mortality has declined in the Porcupine Health Unit area in the last 20 years (Figure 52): 53% (52.7%) from 1983 (29.6/100,000) to 2002 (14/100,000). The highest proportion of deaths occurred in the year 1983 (29.6/100,000) and the lowest proportion of deaths occurred in 1999 (7.6/100,000). Community Check-Up: Porcupine Health Unit 99 Figure 53: Mortality due to prostate cancer, in Ontario and Porcupine Health Unit area, 1983–2002 25 Rate / 100,000 20 15 10 5 0 1983 1984 1985 1986 1987 1988 1989 1990 1991 1992 1993 1994 1995 1996 1997 1998 1999 2000 2001 2002 m Ontario 11.0 10.6 11.5 m PHU 15.5 11.2 24.5 12.3 Source: 11.0 12.2 12.3 17.0 6.5 11.9 12.0 12.2 12.6 12.8 12.7 12.6 12.5 18.1 11.4 11.9 11.8 11.5 10.9 10.6 10.6 10.3 17.0 16.5 15.9 19.2 15.0 10.8 14.8 11.7 13.2 11.3 13.1 Cancer Care Ontario, 2004 Prostate cancer was the second-leading cause of cancer mortality among men in the Porcupine Health Unit area, at 15% in 2002. It was preceded by cancer of the trachea, bronchus and lungs (38%). The mortality trend due to prostate cancer remained somewhat the same over the last 20 years except for a peak in the year 1985 (24.5/100,000) (Figure 53). There was only a 16% (15.5%) mortality decline from 1983 to 2002 in the health unit area, whereas there was only a 6% mortality decline in the province of Ontario. 100 Community Check-Up: Porcupine Health Unit Figure 54: Mortality due to colon cancer, in Ontario and Porcupine Health Unit area, 1983–2002 35 30 Rate / 100,000 25 20 15 10 5 0 1983 1984 1985 1986 1987 1988 1989 1990 1991 1992 1993 1994 1995 1996 1997 1998 1999 2000 2001 2002 m Ontario 19.5 20.2 19.9 19.2 18.9 19.4 18.8 17.3 16.9 16.6 15.6 16.1 16.9 16.0 15.4 15.3 15.7 15.5 15.0 15.7 m PHU 22.0 21.1 Source: 19.1 33.2 33.6 8.7 20.3 21.7 22.3 22.9 9.1 17.9 24.4 29.3 10.5 25.4 21.7 13.7 14.9 23.2 Cancer Care Ontario, 2004 Mortality due to colon cancer ranked third in both genders among the 10 leading causes of cancer mortality in the year 2002 (14% in females and 12% in males). There was a 6% (5.5%) mortality increase in the health unit area (Figure 54) whereas in the province there was a 20% (19.5%) decline. Due to calculation difficulties the rates could not be statistically compared. There were some peaks during the last 20 years, two in the years 1986 and 1987 and the other two were in 1995 and 1996. Community Check-Up: Porcupine Health Unit 101 Chapter 11 References: 1. Canadian Cancer Society/National Cancer Institute of Canada: Canadian Cancer Statistics 2005, Toronto, Canada, 2005 2. Haque, F. Epi News, Porcupine Health Unit. 6(1), 2005 102 Community Check-Up: Porcupine Health Unit 12 g Mortality Patterns Age-Specific Death Rate Age-specific death rate can be defined as the death rate for a specific age group for a defined population for a certain period of time. This rate identifies which groups of people die more than others. The higher death rate could be due to a number of different factors, e.g., age, gender, or the vulnerability of a group, exposure to certain risk factors, for example, young adolescents exposed to injury. The overall age-specific death rate is higher in the Porcupine Health Unit area than it is in Ontario as a whole. This could be due to the higher-aged population. In addition, respiratory diseases are more prevalent in this area, due perhaps to the mining industry or higher smoking rates. Community Check-Up: Porcupine Health Unit 103 Table 21: Age-specific death counts and rates (per 1000 population), Porcupine Health Unit and Ontario (1997–2001) Porcupine Health Unit Area Age Sources: Mean age specific death counts (1997–2001) Age specific death rate, per 1,000 population (1997–2001) Ontario Mean age specific death counts (1997–2001) Age specific death rate, per 1,000 population (1997–2001) 0-14 8.0 0.4 1,063.0 0.5 15-24 8.2 0.7 677.6 0.5 25-44 30.4 1.2 3,310.0 0.9 45-54 42.8 3.3 4,431.0 2.7 55-64 71.0 8.5 7,842.8 7.4 65-74 158.2 24.9 16,751.4 20.4 75+ 348.0 82.7 46,862.0 71.0 All ages 666.6 37.8 80,937.9 7.1 Provincial Health Planning Database (PHPDB), extracted July, 26, 2005. Health Planning Branch, Ministry of Health and Long-Term Care, Ontario. Table 21 shows the age-specific death counts and rates per 1,000 population in the Porcupine Health Unit area and Ontario. The table shows that the death rates increased as the age of the population increased. It is notable that the age-specific death rates above the age of 45 are higher in the health unit area than in Ontario. 104 Community Check-Up: Porcupine Health Unit Figure 55: Life expectancy at birth, male and female, in Ontario, 1979–1999 84 81 Years 78 75 72 Female 69 Male Source: 99 98 19 97 19 96 19 95 19 94 19 93 19 92 19 91 19 90 19 89 19 88 19 87 19 86 19 85 19 84 19 83 19 82 19 81 19 80 19 19 19 79 66 Statistics Canada Life Expectancy Figure 55 shows the comparison of life expectancy at birth in males and females in Ontario over the 20-year period from 1979 to 1999. The life expectancy at birth has increased in both genders over the last 2 decades. In males, the life expectancy has increased 7%, whereas in females the increase was 4%. If the trend continues, the gap between these two rates will be decrease even more. Community Check-Up: Porcupine Health Unit 105 Figure 56: Life expectancy at age 65, male and female, in Ontario, 1979–1999 24 21 18 Years 15 12 9 6 Female 3 Male Source: 99 98 19 97 19 96 19 95 19 94 19 93 19 92 19 91 19 90 19 89 19 88 19 87 19 86 19 85 19 84 19 83 19 82 19 81 19 80 19 19 19 79 0 Statistics Canada Figure 56 shows that life expectancy at age 65 has increased in both genders: 15% in males and 6% in females. As noted earlier, if the trend continues at the same rate in the future ,the gap between these two rates will decrease. 106 Community Check-Up: Porcupine Health Unit Figure 57: Life expectancy at birth, Northern health units and Ontario, 2001 84 82 82.0 81.0 80 80.2 80.0 80.4 79.4 78 Years 80.6 77.4 77.4 76 75.3 75.6 74 73.6 73.6 74.4 74.3 73.5 72 70 Male Source: ing ay Tim isk am y rB ur Th un de U db PH Su rn y ste Ba No rth we a m No rth rio go Al ta On ing ay isk am y ur rB Tim No Th un de U db PH Su rn y ste Ba rth we a m rth go No Al On ta rio 68 Female Statistics Canada Figure 57 shows the life expectancy at birth in Northern Ontario health unit areas, along with the provincial rate in the year 2001. Life expectancies of the population of the Porcupine Health Unit area were lower than that of Ontario in both genders and the differences were statistically significant. In males, the lowest life expectancy was among the population of the Timiskaming Health Unit area and in females, the lowest life expectancy was in the Northwestern Health Unit area. Community Check-Up: Porcupine Health Unit 107 Figure 58: Life expectancy at age 65, Northern health units and Ontario, 2001 24 21 20.4 18 19.4 19.5 18.5 18.6 18.7 17.2 16.1 16.2 15.8 15 Years 19.9 19.5 15.0 15.6 15.9 15.2 12 9 6 3 Male Source: ing ay Tim isk am y rB ur Th un de U db PH Su rn y ste Ba No rth we a m No rth go rio ta Al On ing ay isk am y ur rB Tim No Th un de U db PH Su rn y ste Ba rth we a m rth go No Al On ta rio 0 Female Statistics Canada When life expectancies (at the age of 65) of the people in the Porcupine Health Unit area were compared with other northern health unit areas and the province of Ontario, it was found that the population of the Porcupine Health Unit area had a lower life expectancy than their provincial counterpart and the difference was statistically significant. Among males, the lowest life expectancy, at age 65, was in the Porcupine Health Unit area and in females, the lowest life expectancy, at age 65, was in the Northwestern Health Unit area. 108 Community Check-Up: Porcupine Health Unit Table 22: Cause specific deaths by ICD9-Chapter for the Porcupine Health Unit and Ontario, 1997–2001, five-year average Porcupine Health Unit Ontario Mean number of deaths in 5 years Proportional mortality (% of deaths) 921 184.2 27.6 115,054 23,010.8 28.4 52 10.4 1.6 5,112 1,022.4 1.3 Diseases of circulatory system and blood forming organs 1,113 222.6 33.3 149,167 29,833.4 36.9 Diseases of the digestive systems 125 25.0 3.8 15,882 3,176.4 3.9 Diseases of the endocrine glands 135 27.0 4.1 15,280 3,056.0 3.8 Diseases of genitourinary system 100 20.0 3.0 7,865 1,573.0 1.9 Symptoms and signs & Ill-defined conditions 143 28.6 4.3 9,061 1,812.2 2.2 67 13.4 0.0 Number of deaths ICD9- Chapter Neoplasms Congenital anomalies, skin breast and musculoskeletal diseases Eye, ear, nost, throat and Immunologic Infectious Number of deaths Mean number of deaths in 5 years Proportional mortality (% of deaths) 41 8.2 1.2 4,491 898.2 1.1 Injury and poisoning 189 37.8 5.7 20,873 4,174.6 5.2 Neurological disease 199 39.8 5.9 24,940 4,988.0 6.2 1,596 319.2 0.4 8.7 Pregnancy & child birth Respiratory disease Total Sources: 315 63.0 9.5 35,301 7,060.2 3,333 666.6 100.0 404,689 80,937.8 100.0% Provincial Health Planning Database (PHPDB), extracted July, 26, 2005. Health Planning Branch, Ministry of Health and Long-Term Care, Ontario. Community Check-Up: Porcupine Health Unit 109 Table 23: Potential years of life lost by cause and sex, Porcupine Health Unit, 1997-2001, rate per 100,000, five-year average Cause of death 110 Male Female Cancer 1,654 1,755 1,913 Injury and poisoning 1,231 1,229 197 Cardiovascular diseases and blood forming diseases 1,178 2,494 871 Ill defined diseases 464 505 2,020 Respiratory system diseases 326 273 280 Diseases of nervous system and psychiatric diseases 318 375 110 Congenital diseases 224 69 17 Digestive system diseases 186 492 44 Endocrine gland diseases 174 720 24 Genitourinary system diseases 105 336 6 Infectious diseases 123 173 31 87 71 30 Musculo-skeletal diseases Source: Both genders PHPDB, 2005 Community Check-Up: Porcupine Health Unit


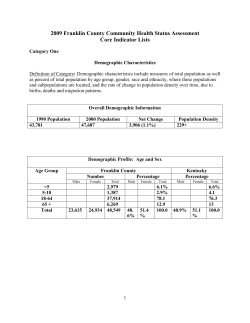


© Copyright 2026