
The Meanings of Menopause: Identifying the Bio-Psycho-Social Predictors of the
The Meanings of Menopause: Identifying the Bio-Psycho-Social Predictors of the Propensity for Treatment at Menopause Helena Rubinstein Lucy Cavendish College, The University of Cambridge This thesis is submitted for the degree of Doctor of Philosophy Abstract All women will experience menopause by the time they have reached mid life. So it is surprising that, in comparison with other female reproductive experiences such as menarche, pregnancy and childbirth, there is relatively little research from a psychological perspective. The main aims of this study were to explore how women make sense of the menopause, to assess which factors predict symptom severity and treatment utilisation and to explore how women’s beliefs about menopause are located within their social context The study comprised three stages. Study 1 was a quantitative study with 149 women to develop new measures to assess women’s beliefs. The new belief scales were incorporated into study 2 which was a larger study with 344 women recruited from the general population and from specialist menopause clinics. This study sought to identify the factors that predict symptom severity and treatment utilisation. The main analysis was with 295 women who were peri- and postmenopause. A range of validated scales were used and a treatment utilisation scale was created. Hierarchical multiple regression and structural equation modelling were used to identify predictors of symptom severity and treatment utilisation. A sub-sample of 30 women from study 2 went on to participate in study 3 which was a qualitative study designed to explore how beliefs about menopause influence symptom perception and decisions about treatment in the context of women’s daily lives. Diaries were completed and used in interviews in study 3 to enable more accurate recall of the social context of menopause events. Thematic analysis was used to analyse the data. Ninety one percent of the women in this study had sought treatment for menopause symptoms and the main predictors of treatment utilisation was symptom severity and the belief that menopause was a pathological illness. A key finding was that four social constructions of menopause were prevalent in this sample: menopause renders women invisible and unvalued, menopause is an illness that changes women, menopause is amenable to treatment with hormone therapy, and menopause is a temporary phase after which there is recovery. These four beliefs were significantly predictive of perceptions of symptom severity and of treatment utilisation. Furthermore, the social constructions mediated between symptom severity and different categories of treatment utilisation. Qualitative analysis revealed that women have inadequate knowledge of menopause and can be surprised and distressed by its onset, menopause is little talked of and is still ‘taboo, menopause is regarded by women as a significant phenomenon that changes them but this is not often acknowledged publicly, women and clinicians have difficulty in making attributions to menopause and neither women nor clinicians are able to define ‘normality’ at menopause. These findings have major implications for how women interpret their symptoms, for how to manage the expectations of women in their 40s and 50s, and for how clinicians advise women at this stage of their life. i Declaration No part of this dissertation has been previously submitted for a qualification. This dissertation is the result of my own work and includes nothing that is the outcome of work done in collaboration. I designed the study reported in this thesis, and collected all the data. The analyses and interpretation contained within this thesis are entirely my own. Word count: 79,604 excluding references and bibliography. ii Acknowledgments This research programme has been something of a voyage of discovery. Although it was not exactly starting with a blank sheet, there were few other researchers working in the same field, with consequently few experienced voices to draw on. Thus, I am especially indebted to my supervisors for their support and advice. Dr Juliet Foster has been unerringly helpful, making just the right interventions at just the right time. Her knowledge of health issues and of qualitative processes has been invaluable. Professor Melissa Hines acted as my faculty advisor and read through and made insightful comments on this research at various stages of development. Her knowledge of the influences of activational hormones was also invaluable. Professor Mark Haggard patiently taught me everything I needed to know about advanced statistics and structural equation modelling and Jan SirkSadowski offered assistance when computer programs refused to behave as they should. Mr Nick Panay, who was, at the time, Chairman of the British Menopause Society, supported the study and enabled me to gain access to clinical patients. He also encouraged me to report work in progress to the Society. I am particularly indebted to the women who participated in this study for giving up their time and being prepared to give me a great deal of often personal and sensitive information. Finally, thanks to my immediate family – Brian, my partner, and my two daughters, Ilana and Nadia – who had to put up with listening to my continual descriptions of the research as it progressed. I am sure they will be pleased it is over. iii Contents Abstract…………………………………………………………………………… ….. i Declaration………………………………………………………………………... ….. ii Acknowledgments………………………………………………………………… ….. iii List of tables………………………………………………………………………. ….. v List of figures……………………………………………………………………… ….. vii Chapter 1: Introduction……………………………………………………………....... 1 Chapter 2: What happens at menopause………………………………………………. 8 Chapter 3: Coping with symptoms……………………………………………………. 20 Chapter 4: The social construction of menopause…………………………………….. 38 Chapter 5: Objectives, hypotheses and methodology…………………………………. 49 Chapter 6: Analytical strategy and data preparation ………………............................. 66 Chapter 7: Study 1: The development of a new measure to assess women’s beliefs about menopause............................................................................... 84 Chapter 8: Study 2: Quantitative study to assess the predictors of symptom severity and treatment utilisation................................................................................ 97 Chapter 9: Study 3: Qualitative study to explore how women’s beliefs about menopause are located within their social context........................................ 139 Chapter 10: Discussion and theoretical implications………………………………........ 171 Chapter 11: Conclusions, implications, limitations and future directions…………….... 181 Bibliography………………………………………………………………………......... 187 Appendices 1 Letter to GPs ..……………………………………………………………………..... 207 2a Recruitment poster and postcards…………………………………………………… 208 3 Questionnaire………………………………………………...................................... 210 4 Information sheets, consent forms and instructions for stages 1 & 2………………. 235 5 Topic Guide……………………………………………………………………….... 250 6 Variables in the dataset……………………………………………………………... 253 7. Comparison of WBIM and WHQ scales by menopause stage……………………... 259 8 Profile details of study 3 participants……………………………………………….. 260 9 Coding frame for qualitative analysis………………………………………………. 263 10 Example of Network analysis in study 3……………………………………………. 265 11 Detailed tables for regression analysis for sociodemographics and ………………... 266 health & lifestyle factors iv List of tables 3.1: Summary of Characteristics of Treatment and Non-Treatment Seekers, 37 4.1: Discourses Identified in Reviews by Gannon & Stevens (1998),Hvas & Gannik (2008), Jones (1994) and Lyons & Griffin (2003), 47 5.1: Items of the Menopause Rating Scale and Allocation to Sub-Scales, 57 5.2: Stimulus Material Used In the Interviews: Four Statements Describing Different Social Constructions of Menopause, 64 6.1: Sample Distribution by Response Mode and Sample Source, 67 6.2: Selected Interaction Terms Regressed onto Symptom Severity (MRS), 68 6.3: Sample Distribution by Menopause Status and Sample Source, 68 6.4: Rotated Components Matrix of Items for the 4-factor Solution Showing Only Loadings of > 40, 71 6.5: WBIM Scores Compared with UK Reference Data on the Women’s Health Questionnaire Subscales, 72 6.6: Scores on the MRS and Sub-scales for Wellbeing in Midlife Survey Compared with European Population Reference Values, 73 6.7: Comparison of Means and Standard Deviations of the WBIM and TIPI Scores, 74 6.8: Correlations between Scores on the WHQ and MRS Sub-scales, 75 6.9: Percentage of Women Ever Using a Category of Treatment for Menopause Symptoms n=295, 76 6.10: Mean Number of Treatments for Menopause Symptoms by Category of Treatment, 77 6.12: Recruitment Profile of Participants at stage 2, 86 7.1: Characteristics of sample in study 1, 85 7.2: One Way Analysis of Variance to Compare Menopause Status Groups by Symptom Intensity, 87 7.3. Beliefs about menopause, 88 7.4: Rotated Components Matrix of Items for the 5-factor Solution, 91 7.5: Pearson Product Moment Correlations between Symptom Sub-groups & Social Constructions, 94 8.1: Characteristics of the sample in study 2, 98 8.2: Sample by Category and Source, 99 8.3: Post-Hoc Comparisons of Menopause Status on the Somatic and Urogenital MRS Sub-scales, 102 8.4: Prevalence of Hormone Therapy Usage by Menopause Status, 103 8.5: Comparison of Clinical and General Population Sample on Key Variables, 105 8.6: Logistic Regression to Predict Membership of Clinical or General Population Sample, 107 8.7: Pearson Product-Moment Correlations between the Main Independent Variables in the Wellbeing in Midlife Questionnaire, 108 8.8: Multiple Hierarchical Regression of Predictors of Symptom Severity, 110 8.9: Hierarchical Multiple Regression Analyses of Predictors of Overall, Biomedical & Nonbiomedical Treatment Utilisation from Sociodemographic Variables, 112 v 8.10: Multiple Regression Analyses of Predictors of Overall, Biomedical and Non-biomedical Treatment Utilisation from Menopausal Status, 113 8.11: Results of ANOVA to Compare Medical Treatment Utilisation by Menopausal Status, 114 8.12: Hierarchical Multiple Regression Analyses of Predictors of Overall, Biomedical and Nonbiomedical Treatment Utilisation from Symptom Severity, 115 8.13: Multiple Regression Analyses of Predictors of Overall, Biomedical and Non-biomedical Treatment Utilisation from Menopause Rating Sub-scales, 116 8.14: Hierarchical Multiple Regression Analyses of Predictors of Overall, Biomedical and Nonbiomedical Treatment Utilisation from Health and Lifestyle Variables, 117 8.15: Regression Analysis of Predictors of Overall, Biomedical and Non-biomedical Treatment Utilisation from Perceived Social Support, 118 8.16: Hierarchical Multiple Regression Analyses of Predictors of Overall, Biomedical and Nonbiomedical Treatment Utilisation from Personality Variables, 119 8.17: Multiple Regression Analyses of Predictors of Overall, Biomedical and Non-biomedical Treatment Utilisation from Social Constructions of Menopause, 120 8.18: Hierarchical Multiple Regression Analysis of Predictors of Overall Treatment Utilisation, 121 8.19: Hierarchical Multiple Regression Analysis of Predictors of Biomedical Treatment Utilisation, 123 8.20: Hierarchical Multiple Regression Analysis of Predictors of Non-biomedical Treatment Utilisation, 113 8.21: Standardised Regression Weights for Model, 131 8.22: Selected Output for Model 1 Showing Modification Indices and Parameter Changes, 131 8.23: Model Fit Indices for Revised Models of Pathways to Treatment Utilisation, 132 8.24: Standardised Regression Weights for Model 5, 134 vi List of figures 2.1: The Ten Stages of Reproductive Aging, 9 2.2: Schematic of the Hypothalamic-Pituitary-Ovarian Axis, 10 2.3: Prevalence Rate of Symptoms from 51 Population Studies. From Nelson (2008), 14 2.4: Representation of Changes in the Thermoneutral Zone, 16 2.5. Schematic of the Brain Adaptation Hypothesis, 18 3.1. Schematic of Transactional Coping Model (Lazarus & Folkman 1984), 21 3.2: Annual Prescriptions for Estrogen Therapy in the USA 1995-2003, 30 3.3: Schematic of Leventhal et al.’s 1980 Common Sense Model of Illness Representations, 34 5.1: Flow diagram of recruitment process for study 2 and study 3, 56 6.1: Schematic of Analytical Strategy for study 2, 66 6.2: Frequency Distribution of Biomedical Treatments for Menopause Symptoms, 78 6.3: Frequency Distribution of Non-Biomedical Treatments for Menopause Symptoms, 79 6.4: Frequency Distribution of Composite Factor of Overall Treatment Utilisation for Menopause Symptoms, 80 6.5: Biplot of Component Loadings for Eight Coping Strategies, 81 7.1: Percentage of Women reporting Symptoms by Menopause Stage, 86 8.1: Frequency and Severity of Menopause Symptoms, 100 8.2: Mean Severity of Menopause Symptom Domains by Menopause Status, 101 8.3: Frequency Distribution of Symptoms Attributed to Menopause, 103 8.4: Usage of Hormone Therapy by Sample Source, 106 8.5: Treatment belief as a mediator of Biomedical and Non-biomedical Treatment Utilisation, 125 8.6: Postmenopausal Recovery belief as a mediator of Biomedical and Non-biomedical Treatment Utilisation, 126 8.7 Illness (that changes women) belief as a mediator of Biomedical and Non-biomedical Treatment Utilisation, 127 8.8. Interaction Effects of Social Support on Biomedical and Non-biomedical Treatment Utilisation, 128 8.9: Theoretical and Measurement Model of Treatment Utilisation at Menopause, 129 8.10: Model 1 Showing Standardised Path Coefficients for Pathways To Treatment, 130 8.11: Revised Model of Pathways to Treatment Utilisation, 133 vii Chapter 1: Introduction Menopause is defined as the point at which women have ceased menstruating for a period of 12 months or more: it is a universal experience for all women, assuming they reach their mid-50s (Utian, 2004). The genesis of this research study came from the fact that, as a topic of research, menopause has been mostly viewed through the lens of hormone therapy (HT) and there is much less research about the social and psychological aspects of this important phase of a woman’s life. A search for articles about menopause using the SCOPUS search engine in November 2012 identified 47,975 in health and life science journals and only 793 in psychology journals, a ratio of 60 to 1. This is a much greater ratio than for other, less prevalent aspects of the human female reproductive cycle. The ratio of medical to sociopsychological articles about childbirth was 17 to 1 and for pregnancy the ratio was 16 to 1. This does not itself make menopause a suitable topic for study. The fact that there is less psychological research about a topic may simply mean that there are no major psychological issues of interest. However, the majority of women report that they experience symptoms, and a significant minority report that these are severe. For example, approximately three-quarters of women report hot flushes and night sweats at menopause, and up to one-fifth of these women perceive them to be severe and problematic (Bruce & Rymer, 2009; Dennerstein, Dudley, Hopper, Guthrie, & Burger, 2000; Nelson, 2008). Even then, the problem could simply be regarded as a biological one. Assuming that it is possible to identify an agent that causes the physical disturbances and then find a treatment, the problems should disappear. In the case of menopause, the causal agent had been identified as estrogen and progesterone as long as ago as 1932 (Geist & Spielman, 1932) and the use of hormone therapies had been widely available in the West from at least the 1960s (Wilson, 1966). Hormone therapy usage became increasingly prevalent among women in their 50s in the West from the 1960s to the late 1990s. However, there was a dramatic decline in both usage and prescribing after two major epidemiological studies reported in the early 2000s that prolonged use of artificial hormones could lead to elevated rates of some cancers and thromboembolisms (Million Women Study Collaborators, 2003; Writing Group for the Women’s Health Initiative Investigators, 2002). The virtually immediate response from both women and their clinicians was to avoid HT, raising the question of whether there was any help available for those women who were experiencing severe problems at menopause. Despite the focus on hormones as a causal factor, there has been recognition that menopause is not only a biological experience: a range of social and psychological factors also influence the symptom experience at menopause (Ayers, Forshaw, & Hunter, 2010; Hunter & Rendall, 2007). Some studies have suggested that attendance at a clinic is better predicted by psychological rather than somatic symptoms (Hunter, 1988). However, there are relatively few studies that have identified how those factors together contribute to the perception of symptom severity, or indeed treatment utilisation. Most studies examine 1 only one aspect of psycho-social influence, such as personality (Elavsky & McAuley, 2009), social functioning (Montero, Ruiz, & Hernandez, 1993) or stress (Igarashi et al., 2000). Moreover, the majority of studies have been conducted with clinical patients, so there has been concern that these may not be applicable to non-patient populations (McKinlay, McKinlay, & Brambilla, 1987; Morse et al., 1994). One possible reason for the lack of socio-psychological studies on menopause is that menopause has never had ‘a good press’ and perhaps as a result it has not been regarded as of great import. Menopausal women have been described as borderline pathological, being regarded as unstable in both body and mind (Foxcroft, 2009, p. 174) and were defined as ‘castrates’ by Wilson in his 1966 book entitled Feminine Forever because menopause rendered them neither male nor female. Historically, menopause has been routinely portrayed as a time when women were expected to become ill, depressed, unattractive and less sexually desirable, and the predominant discourse in the West tended to portray menopause as a stage in life that was associated with the inevitable process of aging and illness (Chrisler, 2008). Whilst there was a backlash against such portrayals among feminist researchers (Dillaway, 2005; Lock, 1991; Perz & Ussher, 2008; Posner, 1979), it is interesting to question to what extent these socially constructed ideas of menopause have been dispelled and whether, if they still exist, they exert an influence on the perceptions of the experience. The final reason for embarking on this study was an observation by the author when working on an earlier study that women could report very severe symptoms but some would decide to seek biomedical treatments whereas others reported equally severe symptoms but preferred to try and ‘deal with’ the situation as best they could without resorting to drugs (Rubinstein & Foster, 2012). What could account for these differences and why were some women more resilient than others? On this basis, the following broad aims were identified (i) to explore how women make sense of menopause, (ii) to assess which factors predict perceptions of symptom severity, (iii) to assess which factors predict treatment utilisation, and (iv) to explore how beliefs about menopause are located within the social context of their daily lives. An important component of understanding how women make sense of menopause was to identify the social constructions of menopause that were prevalent in our culture and the extent to which they contributed (if at all) to the symptom experience and to treatment uptake. The main outcome measures were symptom severity and overall level of treatment utilisation which was further divided into biomedical and non-biomedical treatment utilisation. The research design selected was sequential mixed methods. The reason for this design was that the research questions were distinctive but interlinked: the need to quantify the relative contribution of bio-psycho-social factors called for a quantitative approach but the need to understand the meanings of menopause and the mechanisms by which these might operate called for a qualitative approach. Study 1 was a survey to develop new measures of to assess women’s beliefs about menopause, Study 2 was a broader survey which was designed to assess which factors predicted symptom severity and treatment 2 utilisation. Questions covered sociodemographics, lifestyle, general health, the experience of menopause, treatment utilisation for menopause symptoms, along with psycho-social variables including perceived social support, personality traits, coping approaches and social constructions of menopause. Where possible, validated scales were used but the social construction scales and the treatment utilisation scales were developed specifically for this study. Study 3 was a qualitative study where selected women from study 2were given diaries to keep for eight days, after which time they were interviewed. The reason for doing the research in this order was that there was no pre-existing scale for treatment utilisation and it was necessary to ensure that women were selected to represent the range of treatment utilisation from low to high. The range of this scale could not be identified until after the quantitative survey was completed. The intention was to recruit from a representative group of women who were menopausal. To this end, the age range was specified as 40 to 60 years of age to ensure that women who were just entering menopause as well as those who had been through it could be studied. In order to ensure that women from different socioeconomic groups and ethnicities were recruited, the study locations chosen were Cambridge and Nottingham. In the event, the sample was better educated and of a higher socioeconomic status than intended. Women were recruited from the general population via GP surgeries. Surgeries were used purely to advertise the study and the GPs were not involved in recommending participants. The women were not attending the surgery specifically because they wanted treatments for menopause. A clinical sample was recruited through two specialist clinics at London hospitals to ensure that there was the opportunity to understand what caused some women to seek this level of biomedical treatment. Ethical approval for the study was given by the University of Cambridge Psychology Ethics Committee and the Cambridge Central NRES Ethics Committee, East of England. Site agreements were given to conduct the research at Queen Charlotte’s and The Chelsea and Westminster Hospitals. The structure of this thesis: Chapters 2 to 4 describe the existing literature from different perspectives and defines the gaps in knowledge. Chapter 5 outlines the objectives, hypotheses and methodology. Chapter 6 describes the analytical strategy. Chapters 7, 8 and 9 report the results of the three studies, followed by Chapter 10: Discussion; and the Conclusions and Implications are reported in Chapter 11 Chapter 2 focuses on the biological aspects of the menopause. It outlines the pathophysiology of menopause, describes the changes at menopause, what is known about symptom prevalence, and theories as to the mechanisms by which these symptoms occur. It is evident that whilst some symptoms are highly prevalent, i.e., vasomotor symptoms and vaginal atrophy, a wide range of symptoms have been attributed to menopause and there are large individual differences in the extent to which women experience them. Whilst declines in estrogen are always implicated in the genesis of symptoms, the precise mechanisms that cause these symptoms are not clear. The brain adaptation hypothesis has been put forward as a reason for why some women seem better able to adjust to the fluctuations in hormones but again, this mechanism is not understood (Deecher & Dorries, 2007). 3 Chapter 3 discusses how women cope with symptoms in general and reports the few studies that specifically focus on coping strategies used at menopause. These are discussed in the context of illness representations and of different theories of coping. In particular, one specific coping strategy – the use of hormone therapy is discussed. Coping and the use of HT is also discussed in relation to what is known about why women choose to seek or not to seek treatment for menopause symptoms. This chapter highlights that women have long believed they receive confusing and contradictory information about menopause, and that health beliefs and illness representations of menopause are important in determining symptom severity and whether or not treatment is sought. However, health beliefs about menopause and representations of menopause have rarely been investigated. Chapter 4 reviews what is known about the social constructions of menopause in non-western and western societies. It traces the rise in the biomedical discourse of menopause as a precursor to disease and to treatment. Other types of constructions are also apparent, including a construction of menopause as a symbol of aging, and menopause as just another stage of life (Gannon & Stevens, 1998; Hvas & Gannik, 2008; Jones, 1994). There is a suggestion that a new discourse of confusion is emergent that attempts to smooth over the tensions between the disease and the natural constructions (Lyons & Griffin, 2003). However, research in this area has been mainly small scale and qualitative and so it is extremely difficult to know how prevalent these beliefs currently are. Chapter 5 describes the objectives, hypotheses and methods used in the study. The review of the literature in Chapters 2 to 4 revealed several important gaps in our knowledge about menopause including a lack of research investigating the influence of health beliefs, as well as the lack of an empirical evaluation of social constructions of menopause. Furthermore, it is apparent that much of the research has been with clinical populations and we know little about the daily ‘lived’ experiences of women from nonpatient populations. Four main aims were identified as described above. The methods chosen were in accordance with the principles outlined by Dennerstein & Holmes (2000): research about complex issues that affect women’s health should use a broad approach and take account of social factors and the role of culture. They suggested that the study should be described as a general health survey so that bias caused by emotional responses to menopause is lessened. On this basis, the main study (2) was called the Wellbeing in Midlife Survey (WBIM) and will be referred to in this way throughout. They also recommended that information on current symptomatology be collected, to minimise the problem of recall bias and to ensure that the age range encompasses the menopausal transition. On this basis, women aged between 40 and 60 years of age were recruited. In addition, Dennerstein & Holmes recommend that validated scales are used and hence the Menopause Rating Scale (Heinemann et al., 2004) – a widely used, reliable and validated measure of symptoms – was used in studies 1 and 2. Chapter 6 describes the analytical strategy used for studies 1, 2 and 3 and describes the data preparation that was required before conducting analyses. This section outlines the instruments used in studies 1 and 2, and the qualitative approach of thematic analysis for study 3. 4 Chapter 7 describes study 1- a preliminary study to develop new measures to assess women’s beliefs about menopause. One hundred and forty nine women aged between 40 and 60 years of age completed a questionnaire about symptom severity and beliefs about menopause. The data was factor analysed resulting in four latent variables which defined prevalent beliefs about menopause. These were incorporated into study 2. Chapter 8 describes Study 2 - a quantitative study to assess the predictors of symptom severity and treatment utilisation. The questionnaire could be completed in pen and paper as well as online, and a special website was prepared for participants and GPs that provided more information about the study. Three hundred and sixty six women completed the questionnaire. Three hundred and forty four pre-, periand postmenopausal women1 were included in the analysis. The main analysis was conducted on the groups of most interest – 295 perimenopausal and postmenopausal women. This chapter describes the preliminary analysis comparing clinical and general population samples and the regression modelling and structural equation modelling used to identify predictors of symptom severity and treatment utilisation. The main findings from study 2 were that 91% of the women in this study had sought treatment for one or more menopause-related symptoms, and that biomedical treatments were the most prevalent category of treatment for all the symptoms reported. Four social constructions of menopause were confirmed: a belief that menopause is an illness that changes women; a belief that menopause is amenable to treatment with hormone therapy; a belief that menopause renders women invisible and unvalued; and a belief that menopause is a temporary phase after which there is postmenopausal recovery. These constructions had significant, direct effects on symptom severity and treatment utilisation, and were also significant mediators between symptom severity and treatment utilisation. However, they operated on the categories of treatment in different ways. The belief that menopause is amenable to treatment with hormone therapy influenced biomedical treatment utilisation and the belief that menopause is a temporary phase after which there is postmenopausal recovery influenced non-biomedical treatment utilisation. The regression analyses indicated that there were multiple, interrelated predictors of treatment utilisation, and the structural equation model showed that the pathway to treatment utilisation had to go through perceived symptom severity. That is, there were several factors that were significantly predictive of symptom severity and perceived symptom severity was the main predictor of the level of treatment utilisation. The main predictors of symptom severity included levels of Health wellbeing, prior illness, menopause stage, the number of attributions made to menopause, and emotional stability. Believing that menopause was a pathological condition was predictive of treatment utilisation, even when controlling for other variables. 1 Menopause status was assessed according to the WHO definition. Premenopausal women were defined as currently menstruating or using birth control. Perimenopausal women were defined as experiencing noticeable changes in the length, duration or amount of flow in the menstrual cycle. Postmenopausal women were defined as not having experienced a period for 12 months or more. 5 The hypotheses that women who rate higher for treatment utilisation will be more likely to construct menopause as pathological and to associate menopause with aging was supported, as was the hypothesis that women who rate higher for treatment utilisation will score lower on emotional stability and higher on cognitive inflexibility. The hypothesis that women who rate lower for treatment utilisation will be more likely to construct menopause as a natural stage was only partially supported, and the hypothesis that women who rate higher on treatment utilisation will have fewer coping strategies was unsupported. Chapter 9 describes study 3 - a qualitative study designed to explore how women’s beliefs are situated within the social context of their daily lives. At the end of the WBIM questionnaire women were asked if they would complete diaries and participate in an interview. One hundred and ninety-four women (53%) from study 2 volunteered to participate in study 3. This is a surprisingly high proportion and indicated that this was a topic women were keen to discuss. A comparison of volunteers and nonvolunteers indicated that the main difference between these groups was that volunteers scored more highly on symptom severity on average. Thirty women were selected for study 3 to represent a range of treatment utilisation. Thematic analysis was chosen as the framework for analysis. As one of the aims was to reflect the daily lived experiences of menopause and locate them within their social context, study 3 used diaries and interviews to allow women to describe their feelings in detail. The 7-day calendar and 24-hour diary were based on the principles of Kahneman, Schkade, Shwarz and Stone's (2004) Day Reconstruction Method. This reinstates the events of the previous day, hence improves accuracy and reduces recall bias. The analysis of the diaries and interviews emphasised the ways that women responded emotionally to the experience of going through menopause. Although menopause is an inevitable and natural phase, women believed it was a major event in their lives that changed them. This fact often goes unacknowledged by others, precisely because people are keen to avoid medicalising a normal phase of life. Emotional and physical changes were inextricably intertwined and in many ways the psychological changes were more problematic than the somatic ones. A major issue highlighted was the poor knowledge about menopause, which often led to inaccurate expectations. Many women seemed surprised that they were in menopause and there is a suggestion that women have recalibrated the ‘social clock’2 such that they imagine menopause happens to much older women. This chapter focuses on the ways women cope with this major change and the extent to which they are able to accept it or deny it. The medical encounter is also discussed. This chapter highlights that women have inadequate knowledge of menopause and can be surprised and distressed by its onset, menopause is little talked of and is still ‘taboo, menopause is regarded by women as a significant phenomenon that changes them but this is not often acknowledged 2 The theory of the social clock suggests that age norms exist for significant life-course events such as marriage and childbirth (Rook, Catalano, & Dooley, 1989). 6 publicly, women and clinicians have difficulty in making attributions to menopause and neither women nor clinicians are able to define ‘normality’ at menopause Chapter 10 brings all this information together, integrates the findings from the three studies and discusses how they address the original aims of the research. Implications for theory are discussed. The concluding chapter 11 focuses on outlining the implications for women and their doctors. In particular, it makes practical suggestions for how those women who find menopause more challenging than expected can be supported at this stage in their lives. 7 Chapter 2: What Happens at Menopause: Pathophysiology, Symptom Prevalence, and Mechanisms Apart from pilot and killer whales, human females are the only animals who experience menopause (Johnstone & Cant, 2010), and it is puzzling why these mammals stop reproducing long before they die, while most animals do not live long beyond their reproductive period. Evolutionary anthropologists have argued for the ‘grandmother hypothesis’ to explain this phenomenon (Hawkes, 2003; Pollycove, Naftolin, & Simon, 2011). This theory suggests that because human infants require an extended period of parenting, grandmothers can invest resources in their reproductive-age daughters and their offspring, so that aging women gain an inclusive fitness advantage from investing in their grandchildren. Thus, menopause is regarded as an evolutionary adaptation that improves the survival and potential fertility of one’s own adult offspring. This hypothesis has been the source of much debate and contention (Peccei & Peccei, 2001) but most agree that the menopause evolved early in human history. In current times, the median age at which women reach natural menopause is 51 years (Khaw, 1992; Morabia & Costanza, 1998), though onset can vary somewhat as a result of a range of factors, including ethnicity, use of oral contraceptives, reproductive history and some quality of life factors, such as smoking, body mass index (BMI), educational attainment, or being widowed or divorced (Gold et al., 2001). Menopause is defined as the permanent cessation of menstruation resulting from the loss of ovarian follicular activity (World Health Authority, 1994). However, the terminology involved in defining menopause has often been beset by confusion and, as a result, the Stages of Reproductive Aging Workshop (STRAW) was convened in 2001 (Soules et al., 2001). This resulted in a 7-stage classification, subsequently refined to ten stages that are thought to be more accurate and comprehensive (Harlow et al., 2012) (Figure 2.1). There are five reproductive stages, (–5 to –1), followed by the menopausal transition (defined as stages –2 and –1) where women experience variability in the length of menstruation with intervals of amenorrhea. Perimenopause is the term used to include the two stages of the menopausal transition plus the early stage of postmenopause when there are periods of amenorrhea. Postmenopause (defined as stages +1a, +1b, +1c and +2) occurs when menstruation has not occurred for a 12-month period. Assays of mean levels of follicle stimulating hormone (FSH) and estradiol3 indicate that FSH continues to increase and that estradiol continues to decrease until approximately 2 years after the final menstrual period, so that by stage +1c, FSH concentrations have stabilised, and anti-Müllerian hormone and inhibin are very low. The most common symptoms associated with menopause – hot flushes and night sweats (together referred to as vasomotor symptoms) – are most likely to occur in late peri- and early postmenopause (Harlow et al., 2012). 3 Estrogens are a group of compounds: E1 (estrone) is the most prevalent postmenopause, E2 (estradiol) is the strongest, E3 (estriol) is the most prevalent in pregnancy and is the weakest. All are synthesised from androgens, especially testosterone, by the enzyme aromatase. 8 Figure 2.1: The Ten Stages of Normal Reproductive Aging in Women Early menopause (sometimes referred to as premature ovarian failure [POF]) is said to occur when the onset of menopause occurs before 40 years of age (Maclaran, Horner, & Panay, 2010). In addition, women who have had a hysterectomy or oophorectomy have menopause as a result of the abrupt reduction of estrogen, and women who have treatment for breast cancer may also enter a premature menopause during initial treatment for their malignancy (Goodwin, Ennis, Pritchard, Trudeau, & Hood, 1999). Pathophysiology By 20 weeks of gestational age women have the maximum number of eggs that they will ever have (approximately 7 million). From that time onwards the number and quality of eggs declines with an exponential decline from about 37 years of age until the ovary is unable to sustain its normal function. To explain the pathophysiological changes associated with menopause, it is necessary to explain the normal function of the hypothalamic–pituitary–ovarian axis in premenopausal women (Figure 2.2). 9 Figure 2.2: Schematic of the Hypothalamic–Pituitary–Ovarian Axis. Notes: GnRH = gonadatrophin-releasing hormone; LH = luteinizing hormone; FSH = follicle stimulating hormone The hypothalamus produces gonadotrophin-releasing hormones (GnRH) in pulses. In response to GnRH, the anterior lobe of the pituitary gland produces gonadotrophin, follicle-stimulating hormone (FSH) and luteinising hormone (LH]. These hormones regulate ovarian function such that FSH stimulates the ovarian follicles to develop and LH triggers the release of the mature ovum. During a normal menstrual cycle, the ovaries produce a single dominant follicle (DF) which results in a single ovulation each menstrual cycle. During the follicular phase the major product is estradiol and after ovulation, the DF becomes the corpus luteum of which the the major products are progesterone and estradiol. In order to maintain a balance of these hormones, there are feedback systems between the hypothalamus–pituitary unit and the ovaries: the increase in estradiol inhibits FSH secretion (negative feedback) and stimulates LH release (positive feedback). After ovulation, high levels of progesterone and estradiol inhibit FSH secretion (negative feedback). FSH is also subject to a feedback system which is mediated by inhibins and activins produced by the ovaries. The menopause occurs when the pool of ovarian follicles is depleted. Little is known about the exact mechanisms but during perimenopause the concentrations of FSH increase earlier in the follicular phase, which leads to earlier estradiol elevations and hence a shortened follicular phase. In contrast, the length of the luteal phase remains the same, as does the level of progesterone until very late in the aging 10 process. This leads to shorter menstrual cycles. As the DF is no longer active, the concentration of circulating estradiol drops dramatically after menopause and, as a result of this, FSH and LH concentrations increase due to the lack of negative feedback from estradiol (Bruce & Rymer, 2009). The principal form of estrogen in postmenopausal women is estrone, which is synthesised by converting androsteniodine in the liver and adipose tissue (Longcope, Kato, & Horton, 1969). The hormonal changes that occur during the menopausal transition have been implicated in the elevation of a wide range of ailments among women aged between 40 and 60 years of age, including headaches, cardiovascular disease, depression, osteoporosis and poor memory, as well as the more commonly reported vasomotor and urogenital symptoms (Bruce & Rymer, 2009). Estradiol is thought to enhance some aspects of cognitive functioning in animal and human models (Luine, 2008) and there is some evidence that estrogens may also affect aspects of verbal and abstract reasoning (Rehman & Masson, 2005). Women often perceive that poor memory is associated with menopause (Luetters et al., 2007) but Fuh and colleagues (2006) found that only verbal fluency was affected during the menopause transition. Mitchell and Woods (2001) reported that perceived memory functioning was more closely related to perceived health, depressed mood and stress than to menopausal stage or age, suggesting that other factors may be more important. In addition, high levels of vasomotor symptoms or sleeplessness could affect performance because inadequate sleep may result in delayed verbal memory (Maki et al., 2008). If this is the case, then severe hot flushes and night sweats could have a temporary effect on cognitive functioning, so any cognitive difficulties may be time limited (Greendale et al., 2009) . Thirty-five per cent of postmenopausal women are diagnosed with osteoporosis compared with 19% of men, suggesting that estrogen depletion is a factor in bone loss (Riggs, Khosla, & Melton, 2002). In women, the menopause initiates an accelerated phase of bone loss that declines rapidly and plateaus over a four- to eight-year period, followed by a slow phase of bone loss that continues indefinitely. The accelerated phase results from the loss of estrogen: after menopause, bone loss can be as much as 7% per year. Coronary heart disease is also associated with the reporting of menopausal complaints (Gast et al., 2008) such that women who report more hot flushes and night sweats are at higher risk of cardiovascular illnesses. There is also a significant association between younger age at menopause and a higher risk of coronary heart disease (Hu et al., 1999) but the exact mechanisms are still not understood. Depression has been cited as a menopause-related risk (Maartens, Knottnerus, & Pop, 2002; Soares, 2010) and some women seem to be vulnerable at this time. However, there is no direct relationship between natural menopause and increased incidences of depression. Factors associated with negative moods include surgical menopause, prior depression, health status, menstrual problems, social and family stressors, and negative attitudes to menopause (Dennerstein, 1996). Thus, depressed mood should not be attributed automatically to the menopause transition (Hunter & Rendall, 2007) and many longitudinal studies have found that the transition is not associated with increased rates of depression in healthy women (Avis & McKinley, 1991). 11 These examples show that it is often difficult to distinguish between conditions directly associated with menopause and those that may be the result of other confounding factors or of aging in general. Higher incidence of osteoporosis, poor cognitive functioning, depression and coronary heart disease were directly associated with declining estrogen concentrations, in part because they seemed to show improvement when treated with HT. However, the evidence for these associations is often contradictory and the mechanisms are unclear. This will be discussed in more detail later in chapter 3. Nevertheless, there are some symptoms that can reliably be attributed to menopause. These include hot flushes and night sweats (vasomotor symptoms) and vaginal dryness. Mood change, sleep disturbances, urinary incontinence, cognitive changes, somatic complaints, sexual dysfunction and reduced quality of life may be secondary to other symptoms or related to other causes. It is these more common symptoms that will be the focus of the discussion about prevalence rates and mechanisms. Prevalence rates of the most common symptoms associated with menopause The list of symptoms that have been attributed to menopause is large and includes (in no particular order) vasomotor symptoms, insomnia, vaginal atrophy, dizziness, palpitations, breathing difficulties, flatulence, panic attacks, headaches, joint and muscular pain, restless legs, tiredness, breast tenderness, anxiety and depression, wanting to be alone, loss of libido, bladder incontinence and poor memory. In fact, some questionnaires that measure menopause symptoms list as many as 32 items (Bowles, 1986; Greene, 1998; Hilditch et al., 1996), though it is generally acknowledged that symptoms can typically be grouped into somatic, psychological, sexual and vasomotor symptoms (Hunter, 2000; Lewis, Hilditch, & Wong, 2005; Schneider, Heinemann, Rosemeier, Potthoff, & Behre, 2000). Mishra and Kuh (2012) found that 18 symptoms formed into four stable symptom groups with specific profiles; for vasomotor symptoms 10% of women were classified as very severe; for somatic symptoms 18% of women were classified as having severe or very severe profiles; for psychological symptoms 10% of women were classified as having severe symptoms with a further 13% classified as ‘recovering severe’ with chronic bothersome symptoms across midlife. For sexual discomfort symptoms, a minority (4%) of women were classified as having a very severe profile. Furthermore, women often experience clusters of symptoms. Latent class analysis of a sample from the Seattle Women’s Midlife Health Study (Cray, Woods, & Mitchell, 2010) identified four groups of women according to the severity and number of symptoms reported. Sixty-five per cent were identified as having low severity for all symptoms except joint ache, 13% were identified as high severity for all symptoms except hot flushes (which were moderate), 12% had high severity for hot flushes, joint ache and waking at night and 10% were identified as high severity for poor concentration and joint ache. They comment that “Membership in the high hot flashes, joint ache, awakening at night group was significantly predicted by estrone level, cortisol level, and job stress”. This suggests that the causal link is 12 complex and that whilst changes in the hypothalamic-ovarian-pituitary axis may be responsible for some symptoms, stress levels and lifestyle may also play a role. Changes to hormone concentrations, in particular to estrogen and estradiol, are thought to be responsible for the vasomotor symptoms and vaginal dryness often reported by women. Prevalence rates for symptoms vary but it is estimated that 70 to 80% of women experience vasomotor symptoms (Bruce & Rymer, 2009; Dennerstein, Dudley, Hopper, Guthrie, & Burger, 2000; Nelson, 2008) though the majority do not perceive them to be problematic. A substantial minority of up to 20% of women report that they are severe (Blümel et al., 2011; Mishra & Kuh, 2012; Nelson, 2008; Porter, Penney, Russell, Russell, & Templeton, 1996) and have a negative impact on health-related quality of life (Avis, Assmann, Kravitz, Ganz, & Ory, 2004; Dennerstein & Helmes, 2000; Kuh, Hardy, Rodgers, & Wadsworth, 2002; Utian, 2005). According to the Office of National Statistics there are 6.7 million women in the United Kingdom aged between 45 and 59 years of age. If 70% of them are experiencing symptoms and follow a similar profile pattern to that reported by Mishra and Kuh, then more than 47,000 women would report severe psychological symptoms, a similar number would report severe somatic symptoms, more than 850,000 women would be experiencing severe or very severe vasomotor symptoms, and 189,000 women would have severe sexual discomfort. It is not statistically accurate to extrapolate the data in this way but it indicates that, although only a minority report problematic symptoms, this may translate into a relatively large cohort of women who suffer from severe or very severe disruptions to their daily lives. It is evident that there are large individual differences as regards women’s experience of menopause. A review of 51 studies by Nelson (2008) demonstrated the variability of symptom reporting (see Fig. 2.3). These data from different populations indicate that mood changes, urinary complaints and sleep disturbance can occur at all reproductive stages but the most common menopause-related complaints, vasomotor symptoms and vaginal dryness, increase during the menopause transition and postmenopause, though both may be reported by women before the onset of perimenopause. This is supported by Kronenberg, (1990) who found that the age range for reporting hot flushes was 29-58 years with 50% of women reporting when their menstrual cycles were still regular. The median duration for experiencing hot flushes is 4 years (Politi, Schleinitz, & Col, 2008) but a small percentage experience them to the end of their lives (Kronenberg 1990). An analysis of data from the Australian Study of Women’s Health also indicated that symptom reporting may continue for some time: the prevalence of hot flushes, night sweats, stiff or painful joints and difficulty sleeping can still be raised 7 years after the onset of menopause (Berecki-Gisolf, Begum, & Dobson, 2009). Using the same data set, Mishra and Dobson (2011) identified a group of women described as having a ‘late severe’ profile representing about 29% of the women who experienced natural menopause. Women with this profile had 13 a peak in symptoms at 1 to 4 years postmenopause but more than a decade later these women were reporting at least one vasomotor symptom. Figure 2.3: Prevalence Rate of Symptoms from 51 Population Studies. From Nelson, 2008. Notes: Rates of vasomotor symptoms, vaginal dryness and sleep disturbances are higher for women in menopausal transition and postmenopause than for women in reproductive stages It is evident that symptom reporting among women going through the menopause is elevated and that symptoms can continue for some years, though it may be difficult to distinguish symptoms relating to menopause from those relating to aging in general. When menopause is considered within a lifespan perspective, there is a progressive loss of function across many domains, including motor functions (Papalia, 2007, p. 96), neuronal changes (Kramer, Fabiani, & Colcombe, 2006) , and respiratory functions (Stuart-Hamilton, 1994, p. 12) but these may not be obvious until people are in their sixties (Alessio, 2001, p. 117). Thus, as most women reach menopause at around 50 years of age, they will not necessarily be subjectively experiencing the biological changes that are customarily associated with old age. It will be of interest to understand which symptoms women specifically attribute to menopause as opposed to assuming that they are the result of general aging. Moreover, it is relevant to consider the degree to which menopause is defined as symbolic of aging as opposed to being a natural reproductive transition. Nevertheless, there are some symptoms that are reliably associated with menopause: odds ratios for vasomotor symptoms are 8.6 for hot flushes and 5.5 for night sweats during peri- and early postmenopause compared with premenopause (Berecki-Gisolf et al., 2009). Yet we understand relatively little about the mechanisms that cause them. 14 Mechanisms The usual explanation for symptoms commonly reported at menopause is estrogen deficiency. Reduction in estrogen is thought to be related to urogenital problems, hot flushes, night sweats, migraines, depression and restless legs (Bruce & Rymer, 2009), though exactly how is often unclear. There are estrogen and progesterone receptors throughout the urogenital tract and these may be affected by the hormonal changes that occur at menopause. The most common changes are thinning of the epithelial tissues, decreased muscle and fat deposition and reduced vascularity. The effects of these changes can include incontinence, vaginal dryness, itching, burning and inadequate lubrication during sexual activity (Panay & Maamari, 2012). It is estimated that urogenital symptoms affect at least 40% of women but only 25% of women tell their clinicians about these problems (Robinson & Cardozo, 2001), perhaps because they feel embarrassed or are concerned that their doctors will not take the matter seriously. Also often reported at menopause are modulations to libido, which may be affected by estrogen-related changes, as well as a change in motivation, which can be testosterone-related. Sexual problems are among the most frequent concerns of women attending menopause clinics and it is apparent that as well as an age-related decline in sexual functioning there is an added incremental decline associated with the menopausal transition (Dennerstein, Alexander, & Kotz, 2003). The mechanisms by which changes to estrogen and progesterone contribute to vasomotor symptoms are not fully understood (Deecher & Dorries, 2007). Estrogen was cited as the primary cause of menopausal symptoms because HT was effective for 70–90% of women (MacLennan, 2009). However, levels of estrogens in plasma do not correlate with the presence or absence of hot flushes (Freedman, 2002) and the levels are the same in women who are asymptomatic vs. those who are symptomatic (Freedman, 2001; Hutton, Murray, Jacobs, & James, 1978). Prepubertal girls have low circulating estrogen but do not suffer from vasomotor symptoms and there are reports of hot flushes during pregnancy when estrogen levels are high (Kronenberg 1990). Women who have never had normal estrogen levels due to gonadal dysgenesis do not experience hot flushes unless HT has been started and then discontinued (Casper & Yen, 1985) and men who are treated with androgen ablation or are deprived of androgen for treatment for prostate cancer also experience hot flushes (Holzbeirlein, Castle, & Thrasher, 2003). If all women experience a decline in estrogen but only 70 to 75% experience vasomotor symptoms, mechanisms other than estrogen deficiency must be operating. Hot flushes are a malfunction of the thermoregulatory system and four possible mechanisms have been proposed: a change in thresholds for maintaining optimal core body temperature, loss of responsiveness of the peripheral vasculature, neurochemical changes and genetic polymorphisms. Freedman (1998, 2001, 2005a, 2005b) has conducted extensive research, which has demonstrated that there is a change in the thresholds for maintaining core body temperature (CBT) in symptomatic 15 women. Under normal circumstances, CBT remains within an optimal range, which oscillates within a daily circadian rhythm. This optimal range is controlled by a number of homeostatic centres, one of which is the hypothalamus where there are many hormone receptors. In order to maintain optimal temperatures, blood vessels dilate to raise CBT (accompanied by sweating) or constrict to reduce temperature (accompanied by chilling). Freedman and Krell (1999) measured CBT in twelve postmenopausal women, using a rectal probe, ingested telemetry pill, and took a weighted average of rectal and skin temperatures. The zone within which we do not see temperature changes (the thermoneutral zone) in symptomatic women had virtually disappeared (Figure 2.4). Figure 2.4: Representation of Changes in the Thermoneutral Zone. In asymptomatic women the zone within which there is no response to changes in CBT is 0.4 degrees, but in symptomatic women this zone reduces to zero. Thus, there is miscommunication of temperature signals, resulting in exaggerated heat-loss responses, which present as vasomotor symptoms (Deecher & Dorries, 2007). The thermoneutral zone can be influenced by noradrenaline, which affects heart rate and blood flow. Noradrenaline can act as a hormone or a neurotransmitter and high levels have been found in women with hot flushes. Noradrenaline also increases during a hot flush (Freedman, 1998, 2002). Estrogen modulates noradrenaline receptors and it is possible that these are affected by estrogen reduction 16 at menopause. A decline in inhibitory responses would lead to an increase in noradrenaline and hence cause inappropriate responses to changes in CBT, leading to hot flushes. The most recent research from Freedman’s group used fMRI scanning on 20 healthy postmenopausal women. This highlighted that the possible functional origins of hot flushes may lie in brainstem structures where neuronal activity occurs earlier than in interoreceptive areas such as the insula and prefrontal cortex (Diwadkar, Murphy, & Freedman, 2013). However, the research did not use a control group and there is no clear explanation as to why the authors did not find measurable fMRI responses in other thermoregulatory areas such as the hypothalamus. It has also been proposed that there is a loss of responsiveness of the peripheral vasculature (Charkoudian, 2003). Disturbances in thermoregulatory skin circulation occur because there is a delay in vasculature response to signals from the body that the temperature is too high. Estrogen and progesterone influence skin blood control. Thus, the fluctuations in estradiol may be affecting vascular reactivity, and low levels during menopause may be contributing to reduced elasticity of blood vessels, which delays responsiveness. Deecher (2009) proposes that hot flushes are caused by neurochemical alterations due to fluctuations in gonadal hormones. The hypothalamus is particularly affected by gonadal hormone changes as it is hormone-responsive and is also a key site for the integration of thermal information. There is evidence that selective serotonin reuptake inhibitors (SSRIs) and serotonin-adrenaline inhibitors can reduce vasomotor symptoms (Nelson, 2008). Serotonin (5-HT) is involved in sleep disorders, anxiety and memory disorders; estrogen enhances the synthesis of 5-HT and inhibits noradrenaline. It is suggested that SSRIs restore levels of 5-HT and noradrenaline. Therefore, neurochemical imbalances in the brain that affect thermoregulation may be the underlying dysfunction that results in hot flushes. As well as the influence of sex steroid hormones, researchers have hypothesised that there are genetic variations in hormone biosynthesis and metabolising enzymes, which affect the variability of hot flushes. Specific polymorphisms have been identified in women who report more severe and frequent hot flushes in the middle and late menopausal transition; Woods et al (2006) found that women with the CYP19 11r polymorphism reported more hot flushes, while Schilling et al. (2007) reported that a polymorphism in CYP1B1 was associated with lower DHEA-S and progesterone levels, which in turn were associated with more severe and more frequent hot flushes. They suggest that progestins and estrogens interact with several neurotransmitter pathways in the hypothalamus, which is responsible for thermal regulation. However, to date no specific polymorphisms have been identified as biomarkers for the risk of experiencing hot flushes, and it is likely that there are multiple factors (Ziv-Gal & Flaws, 2010). These factors may include hormone levels as well as race/ethnic associations and Body Mass Index and lifestyle factors such as smoking and drinking (Crandall, Crawford, & Gold, 2006). 17 These proposed mechanisms all suggest that declining estrogen levels are not the only or direct cause of vasomotor symptoms at menopause but that estrogens modulate some functions of the central nervous system (McEwen, 2007). One further feature requires an explanation. If symptoms at menopause are indirectly due to declines in estrogen, why do women not have them for the rest of their lives? One hypothesis is that the brain has to reset and adapt to a new neurochemical level in order to restore temperature regulation (Deecher & Dorries, 2007). The suggestion is that the female brain must adapt to changes in estradiol levels throughout the lifespan in a way that is not required for males, who do not have a regular cycle of fluctuation. During the menopause transition, hormonal changes in women are exaggerated and the female brain needs to be even more flexible in response. During perimenopause, vasomotor symptoms can be severe, but then usually diminish. The adaptation period is individually determined and it can require a long time to readapt brain function, reset temperature thresholds and return to normal temperature responses (Figure 2.5). Further evidence for this is that estradiol alleviates symptoms but after ceasing HT these symptoms often return, suggesting that they have been relieved but not eliminated. This implies that the brain must reset and adjust. Most women will adapt to this new state and there are large individual differences. Figure 2.5: Schematic of the Brain Adaptation Hypothesis This brain adaptation hypothesis has implications for the impact of psychological processes and may go some way to explaining why some women find the transition difficult to accept whereas others cope more effectively. Women who are less flexible in their responses psychologically may find the transition more difficult, and holding negative attitudes and fixed constructions may cause the reset 18 process to take longer. Rating menopause as negative or stressful is significantly associated with higher levels of symptom reporting and depression (Avis & McKinley, 1991; Ayers, Forshaw, & Hunter, 2010; Liao & Hunter, 1995), and there is a relationship between symptom reporting and higher levels of neuroticism and lower levels of agreeableness (Bosworth, Bastian, Rimer, & Siegler, 2003; Elavsky & McAuley, 2009). Thus, lack of cognitive flexibility may be contributing to higher levels of symptom reporting. 19 Chapter 3: Coping with Symptoms The previous chapter highlighted the fact that the majority of women report significant changes at menopause, up to 80% experience vasomotor symptoms and a significant minority (up to 20%) report these to be severe enough to affect daily quality of life (Avis, Assmann, Kravitz, Ganz, & Ory, 2004; López, Soares De Lorenzi, & d’Andretta Tanaka, 2010; Oldenhave, Jaszmann, Haspels, & Everserd, 1993). Furthermore, the duration of some symptoms, especially vasomotor symptoms, can continue for more than a decade postmenopause for as many as a quarter of women who experience natural menopause (Mishra & Dobson, 2011; Mishra & Kuh, 2012). How do women cope with these changes and what, if any, treatments do they seek to relieve problematic symptoms? Coping with symptoms at menopause: coping styles and the interplay of disposition and situation Coping is defined as ‘thoughts and behaviours that people use to manage the internal and external demands of situations that are appraised as stressful’ (Folkman & Moskowitz, 2004; Lazarus & Folkman, 1984). A situation is deemed to be stressful if the individual appraises it as being personally significant and exceeding his or her resources (Lazarus & Folkman, 1984). In Lazarus and Folkman’s Transaction Model of Coping, the transaction between the person and the environment is dynamic and bidirectional (Figure 3.1). An event occurs that is primarily appraised as to whether it is benign or whether it has the potential to cause loss, threat or harm. If the event is appraised as potentially harmful, a secondary appraisal occurs which involves the individual deciding whether or not she has sufficient resources to manage the stressor and whether she has any control over the situation. This influences the selection of a coping strategy, which can be either problem-focused or emotion-focused. If the outcome of the event is not favourable or there is no resolution to the stressor, then distress occurs, which results in a reappraisal of the situation. This reappraisal is then fed back into the system. Coping refers to what a person thinks or does to try to manage the threat. Personality dispositions influence the initial appraisal of stress as well as the coping style adopted (Folkman & Moskowitz, 2004). For example, higher levels of neuroticism and lower levels of agreeableness relate to higher levels of avoidance-coping (Bosworth, Bastian, Rimer, & Siegler, 2003) and optimism may lead individuals to perceive stress less often (Chang, 1998). Perceptions of stress also relate to control (Kobasa, 1979) and self-efficacy (Bandura, 2004) such that stress will occur if the individual feels that she has little mastery or control over the situation or has limited coping resources. It is generally agreed that a sense of control is important for emotional and physical health and that loss of control is associated with anxiety and depression (Frazier & Waid, 1999; Veit & Ware, 1983). 20 Figure 3.1. Schematic of Transactional Coping Model. Lazarus and Folkman (1984) identified two broad categories of appraisal: situations that are amenable to change and those which are not amenable to change, and two broad categories of coping: problem-focused coping where something is done constructively to address the problem, and emotionfocused coping where efforts are made to regulate the emotions associated with the stressor, such as talking with others or venting anger. In the case of an appraisal where the situation is thought to be amenable to change, problem-focused coping is more likely to be used, and in the case of an appraisal where the situation is not amenable to change, emotion-focused coping is more likely. Subsequent scholars have further refined the classification of coping styles to include a distinction between rumination and active cognitive processing (Morrow & Nolen-Hoeksema, 1990), meaning-focused coping (Aldwin & Revenson, 1987), social-coping (Carver, Scheier, & Weintraub, 1989) and avoidance-coping (Amirkhan, 1990). Skinner and colleagues (2003) reviewed 400 types of coping strategies and concluded that there are five higher order categories: problem-solving (instrumental action), support seeking (seeking advice from others), avoidance (including denial), distraction (focusing attention elsewhere) and positive cognitive restructuring (reinterpreting stressors in a positive light). Coping is therefore a complex, multidimensional process, often involving the regulation of emotion, especially distress (Aldwin, Yancura, & Boeninger, 2010, p. 304). This way of thinking about stress coping has relevance for women experiencing problematic symptoms during the menopause transition and postmenopause. Individual personality predispositions could influence the extent to which symptoms are appraised as a threat. The extent to which a woman perceives that the threat (symptom) is amenable to change could influence the type of coping style used. 21 Feelings of control and self-efficacy could also influence whether or not a woman uses a problem-focused style of coping or an emotion-focused style of coping. There is evidence that coping skills develop over the lifespan (Cornelius & Caspi, 1987; Denney & Pearce, 1989; Klohnen, Vandewater, & Young, 1996), so we might expect women in mid-life to have more resources for coping than younger women. However, if a woman feels she has little control over her symptoms and there are few coping strategies available, it is possible that the experience of symptoms associated with menopause may be more stressful. Conversely, the experience of symptoms associated with menopause may be less stressful if a woman feels there are strategies that can be used to alleviate distress. HT was once considered almost a first port of call for women experiencing problematic symptoms (Birkhäuser & Reinecke, 2008), but since the publication of the WHI report (Writing Group for the Women’s Health Initiative Investigators, 2002) and the Million Women Study (Million Women Study Collaborators, 2003), many women and their clinicians have ruled this out as a solution because of concerns about elevated risk for some cancers. This topic will be discussed in more detail later in this chapter. Unfortunately, there is limited research about how women cope during menopause. When the terms ‘coping AND menopause’ were put into the SCOPUS electronic search engine (24/06/2013), only 159 papers were retrieved, and using the terms ‘coping strategies AND menopause’, only 47 were retrieved. Even then, many of the studies focused on women receiving treatment for breast cancer or on the decision to use HT. Coping with symptoms at menopause will depend on how women appraise them in the first place. Are they surprised by or expecting to experience these changes? Do they consider symptoms to be a normal part of this stage of life? A particular problem for many women is that they do not know what constitutes ‘normal’, and it is common to hear women say that prior to onset of menopause they knew little or nothing about what to expect. In an analysis of 7000 letters sent to a magazine, O'Leary Cobb (1998) found that women were puzzled and confused about menopause and required ‘reassurance and validation’ that what is happening to them is not unusual. Similarly, in a recent qualitative study by Rubinstein & Foster (2012), one woman commented that ‘it took me a ridiculously long while to realise that the symptoms I was having were to do with menopause’. The result was that she was taken by surprise and in denial so that her appraisal of what was happening to her was that it was unusual and problematic rather than common and to be expected. Being in denial may mean that individuals are using an avoidant-coping style and that taking this approach could contribute to perceptions that symptoms are severe. Some support for this can be found in a study by Neri, Demettenaere and Facchinetti (1997), who evaluated coping styles among 85 women referred to an Italian Menopause Clinic, and found that an avoidant-coping style was predictive of the severity of vaginal dryness. As this was a retrospective design, it is not possible to be sure of the direction of the relationship, hence we cannot be sure that an avoidant-coping style pre-dates the experience of this 22 particular symptom. A study in Poland also identified that avoidant-oriented and emotion-oriented coping styles correlated with a higher frequency and intensity of reported symptoms regardless of whether women were on HT (Bielawska-Batorowicz, 2007). Coping processes are not inherently good or bad and the coping approach chosen needs to be evaluated in the context of the situation. A coping process used in one situation may not be suited to another situation (Folkman & Moskowitz, 2004). Nevertheless, some types of coping may be maladaptive for women experiencing menopause-related symptoms Compared with other life stresses, menopause symptoms may be considered trivial. However, in a study with 179 postmenopausal women attending a menopause clinic, 20% of the most bothersome problems of the day were attributed to menopause (Simpson & Thompson, 2009). The most common coping strategies to combat menopause-related problems were direct action, social support and expressing emotion. Once again, it is hard to generalise to a wider population because the study was of women who were seeking treatment and who may be experiencing greater severity of symptoms and higher stress levels than a community sample. Coping unfolds in response to a situation but an individual’s disposition also influences the coping response (Suls, David, & Harvey, 1996). For example, appraisal of symptoms may be influenced by personality factors. There is evidence that women who report more vasomotor symptoms have lower stress coping and higher levels of neuroticism than women without symptoms (Nedstrand, Wijma, Lindgren, & Hammar, 1998), and conversely, having lower levels of neuroticism is associated with reporting menopause as less stressful (Bosworth et al., 2003). Using the Stress Coping Inventory, Nedstrand and colleagues (1998) compared 16 women who reported vasomotor symptoms with 17 women who were asymptomatic. At baseline and after three months on HT, the women with symptoms had significantly lower stress coping even after symptoms had been effectively treated with estrogens. The authors comment that neuroticism may play a role in how symptoms are perceived in general and that factors other than biological ones may influence the extent to which vasomotor symptoms are perceived as bothersome. Once again, this study was with women who had sought medical advice for symptoms and so may not be generalizable to a wider population. A possible explanation for the relationship between reporting bothersome symptoms and neuroticism is that individuals who rate highly on neuroticism tend to experience higher levels of distress and may engage in coping styles that create and maintain the distress (O’Brien & DeLongis, 1996). Whilst personality traits do not tend to change dramatically over the lifespan (Costa & McCrae, 1988), the directionality of this relationship cannot be deduced, as experiencing severe symptoms may influence levels of neuroticism and stress coping at menopause. In addition, the degree to which a woman feels she comprehends the situation and has some control over it has a direct influence on stress coping. Catalbiano and Holzheimer (1999) report that optimism and a sense of coherence had a direct influence on the symptoms experienced by women during peri- and postmenopause, independent of personality traits. Women who had a positive outlook 23 (optimism) reported fewer symptoms and endorsed attitudes such as ‘menopause can be a time of personal growth’, ‘menopause is simply another stage of development’, and they were more likely to agree with specific problem-focused strategies such as seeing a doctor, taking vitamin supplements and doing more exercise. Furthermore, optimism exerted an indirect effect on symptoms via problem-focused coping but not through emotion-focused coping. Women who find the symptoms incomprehensible or unmanageable (low sense of coherence) were more likely to hold negative attitudes such as ‘after the change of life, women don’t consider themselves to be real women any more’ and ‘women think of the menopause as the beginning of the end’(Caltabiano & Holzheimer, 1999). Such attitudes had a small effect on how women coped emotionally with the menopause rather than on direct problem-focused coping. These data suggest that being optimistic and having a sense of coherence has a protective function for women going through menopause, though it is hard to know the directionality of this relationship, as the study was crosssectional. It could be that experiencing a symptom-free menopause influences the amount of optimism and sense of coherence experienced. Nevertheless, lower perceived control over hot flushes has been repeatedly linked to reporting more severe symptoms, having fewer coping strategies and experiencing greater distress (Carpenter, Wu, Burns, & Yu, 2012; Pimenta, Leal, Maroco, & Ramos, 2011; Reynolds, 1999). In fact, Pimenta and colleagues (2011) found that the strongest predictor of self-reported severity of hot flushes and night sweats was perceived control even after controlling for sociodemographics, lifestyle variables, menopause stage and age, and other health-related factors. Coping solutions: what is on offer? What practical things can women experiencing menopause symptoms do to cope? Cooling down by wearing cotton clothes, layers and avoiding confined spaces is the most common response to hot flushes (Hunter & Liao, 1995; Reynolds, 1999; Voda, 1982), though 25% of women tolerate them and ‘do nothing’(Voda, 1981). Reynolds (1999) classified the coping strategies used to manage menopause symptoms into combative and preventative, with each type of strategy having a physical and a psychological component. Combative coping included techniques for the management of hot flushes such as the cool-down solutions discussed above and techniques for managing distress such as calming anxiety and finding humour in the hot flush episode. Preventative coping meant putting in place techniques to reduce future hot flushes, such as wearing loose clothing, trying to reduce life stresses or developing positive attitudes to aging. These coping repertoires were broadly related to beliefs about control; women who had low perceived control reported fewer (sometimes no) coping strategies. Given that some of the techniques used are psychological rather than physical, the reports that some women ‘do nothing’ may be incorrect, as women may be making adjustments that indicate acceptance or distraction. Reynolds observed that the choice of coping strategy varied according to the context in which the menopauserelated event took place so that, for example, removing items of clothing could make a hot flush seem 24 worse in a public situation because the cool-down behaviour is overt. This implies that relying on standardised coping inventories will fail to give an accurate impression of which strategies women use, as frequently used coping solutions in one situation may not be used in another. These types of low-level coping strategies are relatively common, but there are several other possibilities for women who find that these simple strategies are ineffective or who are seeking more long-term solutions. These include: a) self-treatments such as vitamin or herbal supplements or making lifestyle changes; b) seeking emotional and social support; c) seeking advice from a complementary practitioner such as an acupuncturist or therapist; and d) seeking biomedical treatment. Self-treatment: Before seeking help from others or resorting to hormonal treatments, many women try to find solutions they can easily undertake themselves, such as purchasing over-the-counter remedies or making changes to their lifestyle. Duffy and colleagues (2012) found that menopausal women in a community sample in Scotland used herbal remedies more commonly than they used prescription drugs, and Williams (2007) estimated that up to 31% of women in the USA had bought herbal treatments for menopause, although as many as 70% did not tell their doctors that they were using them (Geller & Studee, 2005). Several herbal supplements have been suggested as a possible remedy for vasomotor or depressive symptoms associated with menopause, the most prominent being supplements containing phytoestrogens such as soya, red clover and black cohosh. Other supplements that have been used are Chinese herbs such as dong quai and ginseng. Unfortunately for the women who use these herbal therapies, there is either a lack of or conflicting clinical evidence for their efficacy, and although they are considered to be ‘natural’ they are not without adverse side-effects (Nedrow et al., 2006; Pitkin, 2012). For example, black cohosh in high doses can cause vomiting, headaches and joint pain. Further concerns are the quality of production and the fact that these supplements may react badly with other treatments (Rees, 2011). The most potentially effective remedies are those containing isoflavones (such as soya and red clover) because they are thought to have estrogenic properties, and there has been some evidence for the alleviation of vasomotor symptoms and maintaining bone health (Carmignani, Pedro, Costa-Paiva, & Pinto-Neto, 2010; Chiechi & Micheli, 2005). However, once again, the evidence is contradictory. One literature review of red clover indicated a minimal effect on reducing hot flushes and night sweats (Booth et al., 2006), whereas another review of 17 randomised controlled trials using red clover showed significant reduction in hot flush frequency (Howes, Howes, & Knight, 2006). Furthermore, a recent Cochrane Review of 30 randomised controlled studies concluded that results were too discrepant to be able to recommend phytoestrogen treatments for the relief of menopausal symptoms (Lethaby et al., 2007). Black cohosh is not estrogenic but it has been suggested for the relief of vasomotor symptoms and has been certified by the German Medicines Control Agency for use in controlling menopause 25 symptoms. In a recent review, the authors argued that black cohosh seemed promising because it was safe and seemed to offer relief from vasomotor symptoms (Geller & Studee, 2005). However, despite the 20 positive trials that show that black cohosh is effective, all NIH funded trials cast doubt on its efficacy (Kapil, Lawal, Locklear, & Mahady, 2011). At the end of almost every study, the authors call for more research to be conducted on the efficacy of non-hormonal treatments. However, without a fuller understanding of the mechanisms underlying the symptoms experienced at menopause, it is likely that future findings will continue to be conflicting. Exercise and weight control have also been discussed in relation to symptom reporting at menopause. There are two conflicting theories as to why weight control has an effect on vasomotor symptoms: the ‘thin’ hypothesis, which posits that women with a low Body Mass Index (BMI) have more hot flushes because they have less adipose tissue and hence less aromatase activity and estrogen production (Erlik, Meldrum, & Judd, 1982), and the Thermoregulatory Model which posits that women with a high BMI have more hot flushes because the increase in adipose tissue is insulating and hence prevents heat dissipation (Thurston et al., 2008). Neither theory is conclusive, though the distribution of adipose tissue seems to be important. There is often an increase in weight around the time of menopause and women notice changes to their body shape. Thus, exercise has been suggested as a means of maintaining an acceptable weight and reducing symptoms. However, there is little evidence from randomised controlled trials that exercise is an effective treatment for reducing hot flushes and night sweats (Daley, Stokes-Lampard, Mutrie, & MacArthur, 2007). There is a weak trend for exercise to be more effective perhaps because exercise in general is beneficial to health, hence will be beneficial at menopause because of the positive effects on the musculoskeletal system and on mood (Pines & Berry, 2007). Seeking emotional and social support: If changes to diet and exercise are ineffective, women may also seek advice and support from friends and family. It is estimated that around two-fifths of women manage menopause symptoms by seeking out social support from friends and family (Duffy, Iversen, & Hannaford, 2012) but, as with many aspects of research about the menopause, there are very few studies that specifically investigate the relationship between social support and the experience of menopause. In general, a lack of social support is a problem for both men and women as it can have a negative impact on overall health (House, Landis, & Umberson, 1988). Typically, women have more intensive social networks than men (Shumaker & Hill, 1991), but because some aspects of the menopause are ‘taboo’ (especially aspects relating to urinary incontinence and vaginal dryness), women may not be confiding in partners or using their networks effectively. The lack of knowledge and ignorance about what to expect and the fact that menopause seems ‘shrouded in secrecy’ has been described as one of the worst aspects of the experience (Koch & Mansfield, 2004). This is despite the fact that several authors comment that menopause is more openly discussed nowadays (Utian & Boggs, 1999), and despite the fact that some organisations, such as the North American Menopause Society, publish guidelines for developing menopause discussion groups. There has been some change over time in the extent to which 26 women are prepared to discuss menopause and it is often reported that earlier generations of women rarely mentioned what they were going through compared with women nowadays (Utz, 2010). However, the fact that so many women today continue to feel ill-informed and uncertain suggests that any discussion they might have with friends may be superficial or merely humorous. It is also usual for women to turn to their partners for support during the menopause, but in this instance male partners may be unable to help. Not only do they know even less than women but some of the problems reported can be very sensitive. For example, vaginal dryness may be affecting sexual functioning (Dennerstein, Dudley, & Burger, 2001), and mood swings may be having a direct impact on family life (Dennerstein, Randolph, Taffe, Dudley, & Burger, 2002). In the Midlife Women’s Health Survey, 63% of men tried to provide emotional support for their wives but were hampered due to lack of understanding and stresses they faced in their own lives (Mansfield, Koch, & Gierach, 2003). In any case, most men get their information from their female partners, so if the women have poor knowledge so, too, will their menfolk. The research community is almost entirely silent as to how lesbian couples experience menopause. Talking about menopause with friends may offer some relief because being unable to discuss problems with others contributes to poor knowledge and a lack of understanding as to what is happening. Lack of social support is one of the reasons women feel confused about symptoms (Duffy, Iversen, & Hannaford, 2011) and there is some evidence that a lack of social support is associated with higher demands for medical care for menopause complaints (Montero, Ruiz, & Hernandez, 1993). Seeking alternative therapies: Self-treatment and support from friends may still be insufficient and some women, rather than go to a clinician, prefer to use complementary or alternative therapies whilst others use complementary and alternative therapies alongside biomedicine (Williams et al., 2007). Reasons given by women for using alternative therapies as a substitute or alongside biomedicine is that they have low confidence in the ability of clinicians to provide information, they believe that such therapies are ‘natural’, and they are concerned about the risks of taking HT (Ma, Drieling, & Stafford, 2006) . Acupuncture is often suggested as a possible treatment for menopause complaints but yet again, the number of good quality trials is small. Randomised controlled trials using a placebo and control group have shown a reduction in the number of hot flushes (Borud et al., 2009; Zaborowska et al., 2007) and an improvement in somatic and sleep problems (Borud et al., 2009) and these effects are maintained after the trials. However, a measure of how bothersome hot flushes are is generally preferred as an outcome measure because it is a better predictor of lower perceived health than frequency (Rand et al., 2011). Acupuncture may have an effect on vasomotor symptoms by increasing central β-endorphin activity and so makes thermoregulation more stable, but more research is still needed (Wyon, Nedstrand, & Hammar, 2006). Relaxation techniques such as paced respiration, yoga or mindfulness training may also be effective because of the impact on the sympathetic nervous system (Freedman, 2005a). Tremblay, 27 Sheeran, & Aranda (2008) reviewed 14 studies of these types of psycho-educational interventions but found that most used small samples, were not randomised and had no control groups. Nevertheless, several studies have reported an improvement in the frequency and severity of hot flushes (Carmody et al., 2011; Freedman, 2005b; Joshi, Khandwe, Bapat, & Deshmukh, 2011), though hormone treatment reduces hot flushes faster and to a greater extent than relaxation (Nedstrand, Wijma, Wyon, & Hammar, 2005). Relaxation techniques offer a practical solution because they may help to alleviate stress and so have an effect on hot flushes. However, there are few good quality studies of this technique in relation to menopausal complaints. In summary, there is insufficient evidence that complementary and alternative treatments for the management of menopause are safe and effective, and more rigorous trials are still needed. Some techniques may contribute to the reduction of the frequency or severity of hot flushes by reducing perceived stress but to date there are few, if any treatments that have been as efficacious as hormone treatment in reducing some of the more common complaints. The problem of late has been that many women and many recently trained clinicians do not want to use hormone therapy because of possible risks associated with it (Panay, 2012). Seeking medical help: When self-help remedies are ineffective, women may visit the doctor. What assistance can the clinician offer to women who are experiencing problems at menopause if they do not want to use HT? Hormone therapy had been regarded as highly effective for the relief of hot flushes and night sweats, to treat osteoporosis and vaginal atrophy. As will be discussed shortly, this has become controversial. There are several possible non-hormonal treatments, though few general practitioners recommend them and there is doubt about their efficacy. For example, clonidine, an adrenoceptor agonist originally developed for hypersensitivity, is thought to widen the thermoneutral zone and thus help to reduce hot flushes (Freedman, 2005b). However, it seems to have limited effectiveness (Rees, 2011). Selective serotonin re-uptake inhibitors have been found to reduce hot flushes in short-term studies but the evidence is mixed, and may not be effective in healthy women (Stearns et al., 2003; SuvantoLuukkonen et al., 2005). Gabapentin is used to treat epilepsy, neuropathic pain and migraine, and some studies suggest it can reduce the frequency and severity of hot flushes (Toulis, Tzellos, Kouvelas, & Goulis, 2009). However, there are side effects such as dizziness and oedema and there is limited evidence to show it is effective. Tibolone is a synthetic steroid compound with mixed estrogenic, progestogenic and androgenic actions and can be used in postmenopausal women who wish to maintain amenorrhoea. It conserves bone mass and reduces the risk of vertebral and non-vertebral (but not hip) fractures particularly in patients who have already had a vertebral fracture (Rees, 2011). Tibolone is prescribed less often since the WHI and Million Women studies. One other possibility is Cognitive Behavioural Therapy (CBT). Cognitive Behavioural Therapy developed from the idea that automatic negative thoughts and dysfunctional beliefs can be identified and challenged (Beck, 1976) and a Cochrane review found it to be an effective treatment for general anxiety 28 (Hunot, Churchill, Teixeira, & Silva de Lima, 1996). Previous small scale studies which randomly assigned women to either CBT or HT groups found that, in the CBT group, there was a reduction in the number of hot flushes and an improvement in the rating of anxiety and depressed mood (Hunter & Liao, 1995; Keefer & Blanchard, 2005). A more extensive trial with 140 women in the UK assigned women to either 4-week group CBT, 4-week self-help CBT or a control group (Ayers, Smith, Hellier, Mann, & Hunter, 2012). Both group CBT and self-help CBT significantly reduced the frequency and problemrating of hot flushes and night sweats after 6 and 26 weeks and improved emotional and physical functioning at 26 weeks for those who received group CBT. However, there was a noticeable placebo effect in the control group, who also reported a 23% reduction of hot flushes and night sweats compared with a 40% reduction for the group CBT and 36% reduction for self-help CBT. These results suggest two conclusions: first, there is a strong psychosocial component to menopause symptoms and second, a brief intervention of this nature can help women reassign negative thoughts about menopause and teach them strategies to manage symptoms. However, it is not currently recommended or available through the National Health Service as a suitable treatment for women at menopause. That leaves Hormone Replacement Therapy, which has been the subject of controversy since the beginning of 2002. The rise and fall (and rise again?) of HT Despite not knowing the precise mechanisms behind menopause-related complaints, doctors have prescribed HT because it was found to be effective in relieving symptoms for 90% of women (Williams et al., 2007), though it does not work for all women and some women are progestorone intolerant (Panay & Studd, 1997). The idea of using estrogens to prevent ‘climacteric syndrome’ was first mentioned by Geist & Spielman (1932), and the first synthetic estrogen was reported by Cook and colleagues in 1933. However, the use of replacement hormones was not well publicised until the publication of Robert Wilson’s Book, Feminine Forever (1966), which enthusiastically recommended hormone replacement for ‘estrogen deficiency syndrome’ because it would prevent women from becoming ‘dull and unattractive’ and ensure that they were ‘more pleasant to be with’. The publication of this book stimulated huge public interest in the USA and Europe and women began to ask their physicians for this treatment that would ‘keep women young’ (Van Keep, 1990). Not surprisingly, there was a rapid increase in usage, which peaked in the late 1990s (Figure 3.2). It is estimated that up to 40% of postmenopausal women were using hormone replacement in the USA (Hersh, Stefanick, & Stafford, 2004), with rates of 52% in France (Gayet-Ageron et al., 2005) and 30% in the UK ( Mishra et al., 2006). The dramatic increase in use derives from the fact that not only was HT deemed to be effective for the treatment of symptoms typically associated with menopause such as hot flushes and night sweats, urogenital complaints and osteoporosis (Nelson, Humphrey, Nygren, Teutsch, & Allan, 2002), but there 29 were also suggestions that HT could reduce coronary heart disease and strokes (Colditz et al., 1987), improve memory and concentration (Leblanc, Janowsky, Chan, & Nelson, 2001), and prevent disease in general and prolong life (Grady et al., 1992; Studd, 2010). There is some controversy as to the effectiveness of HT to reduce strokes (Prentice et al., 2006) and a recent Cochrane review challenged the use of HT for the improvement of cognitive functioning, arguing that there was no evidence for prevention of cognitive impairment after four or five years of treatment (Lethaby, Hogervorst, Richards, Yesufu, & Yaffe, 2008). Figure 3.2: Annual prescriptions for estrogen therapy in the USA Notes: From National Use of Postmenopausal Hormone Therapy: Trends and Response to Recent Evidence. JAMA 2004; 291(1):47-53. HERS = Heart and Estrogen/Progestin Replacement Study; WHI = Women's Health Initiative . The main changes in use occurred as a result of two major studies: the Women’s Health Initiative Report (WHI) (2002) and Million Women’s Study (MWS) (2003). Concerns had previously been raised about the impact of long term use of hormone replacement on women’s health. The Collaborative Group on Hormonal Factors (1997) had previously alerted clinicians to the fact that use of any HT after 5 years increased the risk of breast cancer in women over 50 years of age, saying that they would anticipate an extra two cancers per 1000 women from 50 to 55 years of age. However, the publication of these two large epidemiological studies captured the attention of the press and the public. The WHI reported that the risk of breast cancer in the estrogen-alone arm was lower than in the placebo group but was higher in the combined arm and in women who had a history of HT use before the study started, although in fact both regimes (unopposed estrogen and combined) showed a benefit. The MWS study reported that the greatest risk was from combined HT, regardless of how it was delivered. Furthermore, the MWS study indicated that unopposed hormone therapy increased the risk of endometrial cancer and when endometrial and breast cancers were added together, there was a greater increase in total cancer incidence with use of combined HT, both continuous and cyclic, than with use of the other therapies (Beral, Bull, & Reeves, 2005). In addition, it was suggested that the risk of venous thromboembolism increases two-fold, with the highest risk being in the first year of use (Canonico et al., 2007). 30 The media were enthusiastic in reporting these results and, as the media are a major source of information about menopause for women (Brown, 2012), it comes as no surprise that the majority of women in the age group most affected by menopause had heard about the WHI and MWS studies. Canales et al (2008) found that the media consistently reported that the risks of hormone therapy outweighed the benefits, with some publications reporting statistics suggesting there was a 30% increase in breast cancer risk after using HT (Graziottin, 2005). In most cases absolute risk was reported more than relative risk. In studies in the USA, the majority of women surveyed reported that they had heard about the WHI study (Ettinger, Grady, Tosteson, Pressman, & Macer, 2003; McIntosh & Blalock, 2005), with the result that 52% said it had affected their use of hormone therapy and made them less likely to trust information from their physicians (McIntosh & Blalock, 2005). A survey of 1100 women using the Menopause Matters website found that, of those who took the decision to stop taking HT, 56.4% said they were influenced by the media. Many women who would potentially have benefited from continuing with HT ceased using it without taking medical advice (Cumming, Currie, Panay, Moncur, & Lee, 2011). It is fair to say that the media reports of the WHI and MWS studies created fear and anxiety among women. Tiihonen et al. (2011) found that 50% of hormone therapy users reported fears, and the main concern was contracting breast cancer. Moreover, among the women who reported adverse reactions, the most common source of information was not their clinicians but the media. Women have long believed that they have received contradictory and confusing information about menopause (Bond & Bywaters, 1998; Buchanan, Villagran, & Ragan, 2002). The media storm about the risks of HT stoked this belief. Women often felt that doctors were too ready to offer HT as a panacea for menopause-related complaints, or they complained that doctors were uninterested in their concerns. The result of the media storm was an ‘epidemic of fear and distrust [that] infected women and physicians’ (Graziottin, 2005). Many GPs refused to prescribe HT, particularly those who had qualified most recently (Panay, 2012), and women in all countries lost confidence in the use of hormone therapy. In Canada, there was a decline in the total number of new users from 28,400 prescriptions in January 1998 to 14,800 in April 2002 – a fall of 52%. Persistence rates of existing users also declined and, if prescribed at all, lower doses of HT were given (Pharm, Dragomir, Pilon, Moride, & Perreault, 2007). In Spain, usage of HT peaked in 2002 at 11% in 50–54 year olds and 10% for 55–59 year olds; however, by 2000, HT use had decreased by 89% and the reduction was especially marked two years after the WHI report (Barbaglia et al., 2009). In the UK, the overall percentage of HT users declined from 31% in January 2002 to less than 26% by February 2003, and there was a steeper decline for women with low educational attainment (Mishra et al., 2006). There was a 60% reduction in the Netherlands between 2001 and 2004 (de Jong-van den Berg, Faber, & van den Berg, 2006) and, as noted earlier, similar steep declines in usage occurred in the USA (Hersh et al., 2004). Many women are now fearful of using hormone therapy even if they are experiencing problematic symptoms. However, of late, there has been something of a fight-back from the medical profession in the UK and in the USA. The British Menopause Society has submitted recommendations to 31 the UK Department of Health making the point that arbitrary limits should not be placed on the duration of usage of hormone therapy and that HRT prescribed before the age of 60 has a favourable risk/benefit profile (Panay, Hamoda, Arya, & Savvas, 2013). The North American Menopause Society and the British Menopause Society have both issued recent position statements to the effect that hormone therapies are the most effective treatment for menopause symptoms and recommend that it should be given at a low dosage and for the minimum time possible. These medical associations argue that there is a pressing clinical need because women are suffering unnecessarily and that the prescribing of hormone therapy will optimise quality of life and facilitate the prevention of long-term conditions. There has also been a significant backlash against the Women’s Health Initiative and Million Women Studies. The WHI study has been criticised for poor study design (MacLennan, 2009) because the participants were enrolled 13–14 years postmenopause and were unrepresentative of symptomatic women who initiate HT. The MWS sample was considered to be biased because participants were recruited from a breast cancer screening programme and hence were more likely to present with breast cancer (Shapiro, Farmer, Seaman, Stevenson, & Mueck, 2011). It was often overlooked that the WHI reported that the estrogen-only HT trial found there was no increased risk of breast cancer in women taking this type of HT relative to the control group and, in any case, the absolute increased risk of breast cancer was 8 per 10,000 women (0.1% per annum). Researchers also complained that the studies overlooked the possible protective effects of hormone therapy when taken during the ‘critical window’ period (MacLennan et al., 2006). This theory suggests that estrogen may protect against osteoporosis and reduce coronary heart disease if initiated in the early stages of menopause. John Studd (2004) went so far as to say that as a result of the Women’s Health Initiative clinicians were subject to press manipulation and betrayed their responsibility to women. In this climate of misinformation and fear, the decision to seek treatment is not an easy one. It will depend not only on the perceived severity and duration of symptoms but also on attitudes to and representations of menopause (discussed in detail in chapter 4), on illness representations and health beliefs in general and on their beliefs about treatments specifically. It is these considerations which are discussed next. Health beliefs, illness representations and the decision to seek treatment It has long been understood that psychological and social factors affect health and illness as well as biological factors (Engel, 1977). On this basis, several models of illness have been developed that incorporate other contributory factors, including the patient’s perceptions as well as the illness. One such model, the Transactional Model of Coping (Lazarus & Folkman, 1984), has been discussed earlier. The idea that health beliefs are important to the way in which people perceive and cope with illness has also been well documented. An early Health Belief Model (Janz & Becker, 1984) posits that health behaviour depends on two variables – the desire to avoid illness (or if ill to get well) and the belief that a specific action will prevent or ameliorate illness. An individual’s perception of susceptibility to an illness, the 32 perceived severity of it and perceived self-efficacy will determine whether or not the illness is seen as a threat. The likelihood of taking action depends on whether a person believes that the benefits of doing so will be great enough to overcome the barriers preventing them from taking action. Harrison et al (1992) performed a meta-analysis on 147 studies and found significant positive relationships between the Health Behaviour Model dimensions and health behaviours. Patients’ beliefs about medicine are also important in determining whether or not treatment will be sought or adhered to (Horne, 1999). Some people have a negative view of medicine and regard its use as harmful and over-used by doctors (Horne, Weinman, & Hankins, 1999) and practitioners’ perceptions of treatment beliefs also have an effect on outcomes, as they influence the willingness to recommend a treatment (Horne, 1999). Illness beliefs are central to understanding responses to specific conditions and to understanding how people respond to information about them (Weinman & Petrie, 2002). Pennenbaker (1982) identified factors including personal schema, attention, and interpretive processes as important in making sense of normal physiological changes. Symptom recognition alone is not enough to make people think they are ill because some symptoms on their own have no meaning and are merely bodily sensations. Thus, different symptoms are accounted for in different ways. In the case of menopause, it will be interesting to identify which symptoms are attributed to hormone changes and which to general aging or other conditions. Subsequent research has expanded on these concepts to take account of the broader mental models held about disease and treatment (Taylor, 1983, 1984; Leventhal, Nerenz, Steele 1984). These mental models are based in implicit understanding of illness based on commons-sense beliefs which cluster to form illness representations that lead to an explicit understanding of an illness that serves to direct coping responses and illness behaviour. Individuals may hold numerous beliefs about a particular ailment which may be correct or incorrect. Leventhal (1980) identified five cognitive dimensions of beliefs about illness which are relevant to our understanding of how women make sense of menopause. These dimensions include identity, cause, timelines, consequence and control. Identity concerns the diagnostic label which is important in that the new information is interpreted in the light of dominant illness representations. Thus, labelling menopause as an illness (as opposed to a to-be-expected lifestage) might result in additional attributions of symptoms and trigger a visit to a clinician. Knowing what might cause symptoms is important because this relates to treatment expectations. For example, believing that estrogen depletion is the key cause of symptoms could lead to a search for hormone therapies. Timeline issues are important with respect to menopause because it is difficult to predict how long symptoms will last. This is relevant to whether or not women consider menopause symptoms to be chronic or time limited and such decisions could affect both the symptom experience as well as the decision to seek treatment. The consequences of how menopause will impact on daily life are important in terms of personal identity and therefore the perceived severity of menopause symptoms. Finally, control beliefs are important because if women feel 33 that the symptoms can be controlled or managed they are more likely to seek treatments whereas if they believe that hormonal changes cannot be controlled they may decide to tolerate the symptoms Leventhal brought these together into a model which is relevant to menopause- the Common Sense Model (CSM) of illness representations (Leventhal, Meyer, & Nerenz, 1980). This model assumes that people are independent problem-solvers who can make decisions about coping and managing their illness representations (Figure 3.3). Figure 3.3: Schematic of Leventhal et al.’s 1980 Common Sense Model of Illness Representations: From Hagger & Orbell 2003 Individuals make use of lay information and a number of heuristics to understand their symptoms and to interpret or assign meaning to the somatic or psychological changes that are occurring (Leventhal, Brissette, & Leventhal, 2003). They may question whether the symptoms are due to illness or stress or aging, or whether others have the same experience. Each illness representation is made up of a cognitive component and an emotional component. These representations influence the coping strategies used, and can vary from avoidance and denial to reappraisal, expressing emotions, seeking social support and problem-focused solutions. The coping strategies are then appraised as to their efficacy and impact on outcomes, and this feeds back into the previous stages as individuals self-regulate their symptom experiences. A meta-analysis of 45 studies using this model confirmed its construct and discriminant validity (Hagger & Orbell, 2003). It showed that perceptions of an illness as being highly symptomatic, having a chronic timeline and with serious consequences was significantly and positively associated with the use of coping strategies of avoidance and expressing emotion. Perceiving that an illness is curable or controllable is significantly related to psychological wellbeing and social functioning. 34 There has been only one recent study that makes use of this framework to investigate menopause. Chou & Schneider (2011) used the CSM to investigate self-regulation of menopause. Menopause representations were measured according to the five domains described above; identity was measured by symptom reporting, time-line was evaluated according to expected age of onset and whether symptoms were perceived as acute, chronic or cyclical. Consequences were measured in terms of influence on daily activities, causes were evaluated in terms of whether the symptoms were thought to be due to estrogen decline or aging, and control was evaluated in terms of whether these symptoms were thought to be controllable, preventable or curable and whether treatment was effective. They concluded that the model was useful in demonstrating that menopausal representations influence how women seek and engage in health behaviours. For example; women who reported more emotional responses made fewer efforts to alter the situation, and women who reported more exercise had better appraisal of mental and physical health. This framework for thinking about illness/wellness has implications for how women react to symptoms at menopause. Attributing various somatic and psychological complaints to menopause or some other cause is the first stage in deciding whether or not it is worth seeking treatment. Seeing menopause as a temporary or a longer term disruptive condition, worrying about how others perceive you at menopause, or believing that treatment will be ineffective will influence the choice of coping strategies. Believing that menopause is a natural consequence of aging or due to an estrogen deficiency will also be important in the decision to seek or not to seek treatment. It is evident that illness representations help individuals to interpret symptoms and give them meaning. Taylor (1983) suggests that the search for meaning is an important component of whether or not people can cognitively adapt to a new condition. As discussed in chapter 1, women have to adapt to major hormonal changes at menopause and some women take longer to achieve this than others. Thus, the search for meaning may be important because it helps to bring a new attitude to symptoms and to contextualise the experience. Taylor, however, points out that no one perception is better than any other for the process of cognitive adaptation. A related concept for managing perceptions of symptom severity is the concept of mastery which can be achieved through a series of psychological techniques such as developing a positive attitude, meditation, causal attribution, or changing diet (Taylor et al 1984). These types of coping approaches will also be highly relevant to decisions about the types of treatment sought for menopause symptoms. Comparing treatment seekers with non-treatment seekers What we know about menopause has largely been derived from atypical clinical populations (Ballinger, 1985; McKinlay, McKinlay, & Brambilla, 1987; Morse et al., 1994). In Australia, it is estimated that 30% of women each year and 86% over a 9-year period seek treatment for symptoms associated with menopause (Guthrie, Dennerstein, Taffe, & Donnelly, 2003), whereas Morse put the figure closer to 50%. In the USA around 60% of women seek treatment (Williams et al., 2007). 35 There have been very few studies that specifically seek to compare non-patients with patients. Ballinger (1985) conducted one such study in Sydney and reported that patients reported more psychosocial stress, measured in terms of life events, and had higher levels of clinical anxiety and depression than non-patients. However, the incidence of hot flushes and vaginal atrophy was the same for both groups, though interestingly, the non-patient group rated these symptoms as being more severe. McKinlay and colleagues (1987) found that natural menopause itself does not cause poor health or increased use of clinical services and that high health utilisation was best predicted by prior health status. In another early study, Hunter (1988) compared 85 clinic patients with 474 women in a non-clinic sample and found that clinic attendees reported more stress, rated their current health as poor, and had greater preoccupation with their bodily symptoms. Overall, clinic attendees had a more negative attitude to menopause and their attendance at the clinic could be predicted most accurately on the basis of psychological rather than biological symptoms. Subsequent research suggested that treatment-seekers were very different from non-treatment seekers and women who used HT were more demanding in seeking treatment than those who did not (Matthews et al., 1990). Users of HT tended to have low Body Mass Index, a low risk of cardiovascular disease, were physically active, used alcohol moderately and had lower systolic blood pressure (Derby, Hune, McPhillips, Barbour, & Carleton, 1995) suggesting that healthier women sought treatment, perhaps preventatively. Brennan et al (2004) found that predictors of current use of hormone therapy were higher socioeconomic status and higher education, surgical menopause, younger age, perception of health as good, vitamin intake, awareness of having a high cholesterol level, regular medical care, and consuming 5–29 alcoholic drinks per month (from 1 per week to 1 per day). It appeared that hormone therapy users led healthier lifestyles or at least were more aware of their general health. This supports the idea that there was a ‘healthy user bias’ for users of HT and that this may go some way to explaining why there was such a dramatic decrease in usage after the WHI report (Gleason, Dowling, Friedman, Wharton, & Asthana, 2011) Avis and McKinlay (1990) identified two types of health utilisers at menopause: those who were preventative and those who were problem utilisers. Preventative utilisers reported better health, were less depressed and were less likely to have menstrual or menopausal problems, whereas problem utilisers were more likely to be home-makers, had worse self-reported health, suffered from depression and were perimenopausal. Morse and colleagues (1994) also found similar categories in the Melbourne Women’s Health Midlife Study. Here, treatment seekers were more likely to report a greater number and a wider range of symptoms, have worse prior health, have lower self-rated health, report more stress in their lives and have prior menstrual problems. The odds of being a treatment seeker were nearly twice as high for those with surgical menopause and 1.4 times as high as for those with two or more psychosomatic symptoms. Guthrie et al (2003), using the same database, reported that women complained of 4-5 symptoms per year, on average, and that increased consultations were associated with vasomotor 36 symptoms, rating one’s own health as worse than others’, taking two or more prescription medicines and with later HT use. The table below summarises the risk factors for treatment seeking (Table 3.1.) Table 3.1: Summary of Characteristics of Treatment and Non-Treatment Seekers Treatment seeking Non-treatment seeking Not employed Work full or part-time Self-rate health as worse than others Self-rate health as better or same as others Surgical menopause Report positive wellbeing Two or more psychosomatic symptoms Fewer or less severe symptom-rating Exercise Better social support Higher psychosocial stress (life events) Higher education level Healthier lifestyle (users of HT) The studies that directly contrast patient with non-clinical samples are few in number, tend not to consider the representations women have of menopause, the importance of prior attitudes, and have not considered treatment or coping solutions beyond that of HT usage. The Common Sense Model of illness representations suggests that the role played by both cognitive and emotional representations of menopause is significant and it is these representations that are discussed in the next chapter. 37 Chapter 4: The Social Construction of Menopause: From Deficiency Disease to Confusion? The research discussed thus far illustrates three key points: we know a lot about the symptoms that are reported (Bruce & Rymer, 2009; Kronenberg, 2010; Nelson, 2008) but not enough about the mechanisms that cause these symptoms; we know that for the past two decades, the use of HT to treat symptoms has re-shaped how women and clinicians have viewed menopause (Mishra et al., 2006; Utz, 2010), and we also know that by comparison with the vast biomedical literature, there is much less understanding of menopause from a psychosocial or experiential perspective. This is surprising given that menopause will be experienced by nearly all women by the time they have reached their early 50s and given that other, less common female experiences (pregnancy, childbirth, breast cancer) have been researched in this way. It is doubly surprising that psychosocial research on menopause is so limited because it has been readily acknowledged that a range of cultural, social, cognitive and psychological factors influence the experience of menopause (Dennerstein, Lehert, Guthrie, & Burger, 2007; Hunter & Rendall, 2007). Furthermore, some have commented that without an understanding of the broader meanings of menopause, it will be difficult to provide an explanation as to why some women who experience severe symptoms feel distressed whilst others, who also report severe symptoms, feel able to cope (Liao & Hunter, 1995; Reynolds, 1999). It is likely that the meanings attributed to menopause will affect women’s cognitions and have a significant impact on their willingness to be open about their experiences, on whether or not they interpret these experiences positively or negatively, and on the extent to which they believe it is worthwhile seeking medical relief for symptoms. Meanings of menopause are also heavily influenced by the socio-historical context and hence they may differ according to culture, social environment and over time. Thus, the experience of menopause is not purely defined as a biological phenomenon but is also socially constructed. Social constructivism is the generic name for a cluster of theories, which posit that we understand the world within an historical and social context by means of social interaction. It has often been considered to be an anti-positivist approach insofar as it is antithetical to the type of empirical research that believes the ‘truth’ about the world can only be uncovered through direct observation (Gergen, 1985). Positivist approaches assume that there is an observable reality that is stable and can be measured, and, if needs be, manipulated (Levin, 1988). In contrast, a constructivist approach assumes that knowledge is something people do together and whilst knowledge can change, it is always constructed communally. To that extent biomedicine itself is a cultural product that is socially constructed (Engel, 1977). Social constructivism, following Vygotsky’s theory of development (Vygotsky, 1986), suggests that we become individual through social interaction, and our skills and capacities are the product of participation in social practices that are situated historically and culturally. Harré (2002) has argued that social constructivism shares with postmodernism the belief that there are a multiplicity of views about the world, but it differs in that it does not deny that there are universals, nor that social representations are all equally valid. It is not a totally relativist theory in that it does not deny that there are some universal truths 38 or values. Due to the need to understand meanings within a specific social and cultural context, social constructivism has eschewed the artificiality of lab-based, experimental research in favour of greater methodological pluralism (Harré, 2004). In this context, taking a constructivist approach is particularly relevant to the study of menopause. First, Harré (2002) has commented that social constructivism may be defined as ‘psychologists against biological determinism’. As discussed in the previous chapter, reporting of symptoms associated with menopause may be predicted more accurately on the basis of psychological symptoms than by biological symptoms alone (Hunter, 1988). Furthermore, biological indicators are not always consistent: for example, there is no evidence that levels of plasma estrone are different in symptomatic women from those in asymptomatic women (Freedman, 2001; Hutton, Murray, Jacobs, & James, 1978). Thus, the evidence suggests the experience is not purely biological. Second, menopause has a long history in the West of being portrayed negatively (Foxcroft, 2009) as a time when women are expected to become ill, depressed , unattractive and less sexually desirable (Dillaway, 2005; Lock, 1991; Perz & Ussher, 2008; Posner, 1979). Such deeply embedded representations can quickly become commonly accepted stereotypes, which may be internalised by women to become self-stereotypes with consequent ill-effects (Steele & Aronson, 1995). Third, representations of menopause appear to differ culturally (Delanoë, 2001; Lock, 1998) and have changed over time, partly as a result of challenges to the biomedical view by feminist psychologists (Chrisler, 2008; Dillaway, 2005; Ussher, 2011), and partly because HT has turned out not to be the panacea it was initially thought to be (Pharm, Dragomir, Pilon, Moride, & Perreault, 2007). Hence, we would expect meanings to be in a state of flux as women attempt to navigate the transition in the face of changing beliefs and treatments. It is not appropriate to take an extreme view and argue that the experience of menopause is purely a social construct nor is it correct to argue that there is no biomedical ‘truth’ about symptoms associated with hormonal changes. Rather, it is important to find out to what extent meanings attributed to menopause impact on and interact with the physiological changes that typically occur at this time. There is reason to believe that ideas about menopause are deeply associated with aging and loss of fertility (Rubinstein, 2010), whilst at the same time menopause can be regarded almost as ‘the last taboo’(Atwood, McElgun, Celin, & McGrath, 2008). This combination results in limited discussion about a topic of significance to many women. The investigation of self-reported general health and symptoms alongside a deeper understanding of how these are interpreted by women in the context of personal meanings and social expectations will be more able to do justice to women’s experiences. This chapter now focuses on what is currently known about social constructions of menopause in non-Western cultures and reviews the existing multiple social constructions in the West. Non-western constructions of menopause: is there a universal menopause syndrome? There are relatively few cross-cultural studies of menopause and the main studies have taken place in the Anglo-Saxon world: North America, Australia and the United Kingdom. Most of the studies 39 have focused on the number and type of symptoms that are reported and few have considered the meanings of menopause to the women concerned. There have been studies in China, Turkey, India, Iran, South-East Asia, Korea, Norway, Germany and Japan (Melby, Lock, & Kaufert, 2005) and limited ethnic comparisons within the Anglo-Saxon countries (Avis et al., 2001; Brown, Sievert, Morrison, Reza, & Mills, 2009; Crawford, 2007; Hunter, Gupta, Papitsch-Clark, & Sturdee, 2009). The main focus of most of these studies has been on reporting and comparing the incidence of symptoms and there has been little discussion of what the experience ‘feels’ like for women. These studies tend to reveal that women in South-East Asia report lower levels of hot flushes and night sweats than women in Europe and North America, though in reality there is considerable variation. This raises the question: do women in other countries or from other cultures report the same meanings as women in the USA, Australia and the UK? One of the earliest studies to consider cross-cultural meanings of menopause was Marcha Flint’s (1975) study with 483 Rajput women who until menopause had to live in purdah4. However, on reaching menopause they were able to play an active role in society as they were no longer considered to be contaminated. For these women, reaching menopause might well have been a relief, regardless of whether or not they were experiencing unpleasant symptoms (though this is not recorded). Research with Mayan Indians and women in rural Greece revealed that whilst these societies tended to view other female experiences such as menarche and childbirth in a similar way to women in Western cultures, their views of menopause were different (Beyene, 1986). Western society has come to think of menopause as a one-off event, a disease episode defined by an estrogen deficiency or ovarian dysfunction, whereas in Beyene’s study, both Mayan and rural Greek women regarded menopause as a natural phase of life. Neither of these societies associated the menopause with hormonal deficiencies, rather they viewed it as the end of menstruation and associated it with changes to the blood: Mayan women believed that by the time of menopause a woman had used up all her blood and rural Greek women associated it with the removal of unclean blood. The result was that for women in these societies menopause became a time free from taboos and restrictions, relief from menstruation and freedom from childbirth. The Mayan women appeared to have no expectations of physiological or psychological problems, and did not have a word to describe hot flushes. Early menopause was thought to be due to a woman having many children and hence was due to the using up of blood by giving birth so often. In rural Greek society, problematic symptoms were only expected if a woman experienced menopause before the age of 40 and again, this was associated with blood; the retention of unclean blood was thought to be due to off-time menopause as cleansing had not taken place. The Greek women reported instances of vasomotor symptoms, headaches, insomnia, irritability and melancholia, which were much more similar to symptoms reported in the West. Menopause was associated with growing old but the meanings attributed were very different from the disease narrative propounded by Western clinicians. It is possible to think of these constructions as merely the last vestiges of a pre-biomedical epistemology. We might expect isolated societies to have limited interaction with modern biomedicine 4 Purdah is a religious and social institution of female seclusion in Muslim majority countries and South Asian countries 40 and so have minimal knowledge of the influence of hormones. It is, however, worth asking why Western clinicians have solely focused their explanations on estrogen loss, given that we actually know very little about the mechanisms of common menopausal symptoms. For example, plasma-estrone does not explain hot flushes, as patterns of fluctuation in estrogen levels are similar for women with and without symptoms (Hutton et al., 1978), and endogenous estrogen levels do not seem to correlate with hot flushes (Andrikoula & Prelevic, 2009), though several studies have reported that women with lower estradiol levels have more severe vasomotor symptoms (Notelovitz et al., 2000). Hot flush episodes also coincide with an increase in catecholamine production in the brain and a centrally increased activation of the sympathetic nervous system (Genazzani, Gambacciani, Simoncini, & Schneider, 2003). Interestingly, until recently, the dominant discourse of menopause in Japan was related to the destabilisation of the autonomic nervous system rather than to declines in estrogen and, rather like the Greek women, stale blood was associated with various non-specific symptoms (Lock, 1998). Lock’s research with Japanese women in the early 1990s, in both rural and urban settings, indicated that there was no equivalent word for menopause, the word kônenki being used as a long period starting at about 40 years of age and continuing into the mid-50s. Kônenki was construed as a time when the body lost its balance but it was conceived of as a natural phase, which could be experienced by both men and women with the symptoms being different because of biological differences (Lock, 1994). In Japan, women were seen as important household managers who only reached the prime of life at about 50 years of age and Japanese women did not expect (or report) hot flushes and in fact they had no equivalent word. Instead, both clinicians and women attributed headaches and shoulder stiffness to kônenki, and Lock concluded that menopause was much less medicalised in Japan compared with the West. However, these constructions may be changing as Western ideas begin to have an impact on the aging of women in Japan. More recent research indicated that there was no significant difference in the incidence of flushes for Japanese and Australian women (Anderson, Yoshizawa, Gollschewski, Atogami, & Courtney, 2004). This may be due to changing diet and lifestyle, greater media coverage of menopause and also the promotion of hormone replacement therapy by major pharmaceutical companies in the 1990s (Melby et al., 2005), though HT usage is still low compared with other countries: in 1995 only 1.2% of eligible Japanese women were using it and usually for no longer than 6–9 months (Honjo, Mamoru, Okubo, & Kikuchi, 1997). A comparison of women in Germany and Papua New Guinea also indicated that different expectations related to different patterns of symptoms (Kowalcek, Rotte, Banz, & Diedrich, 2005). Disturbances were expected in both cultures but there were qualitative differences. Hot flushes were most important to the German women, whereas the construct of menopause for women in Papua New Guinea concerned aging and a general fear of physical illness. These expectations appeared to influence the actual experience of menopause, with German women reporting a higher incidence of hot flushes and Papuan New Guinean women reporting higher incidences of depression and joint and muscular aches. There was also a difference in the proportion of women in each culture who made positive attributions to 41 menopause: 67.3% of premenopausal women questioned in Germany and 93.7% in Papua New Guinea related positive aspects to menopause. In summary, the differences reported in the incidence of symptoms may be due to a wide variety of influences: some biological, such as natural variation of hormone profiles and reproductive function; some cultural, such as diet, lifestyle, attitudes to women’s roles and sensitivity to reporting symptoms; and some methodological. Cross-cultural research is beset by difficulties because of linguistic differences, the use of different measurement instruments and different periods of recall. Nevertheless, meanings differ according to the local culture, as the examples above indicate, and it is likely that there is a biological and socio-cultural interaction. The differences in reporting of symptoms and the meanings attributed to the menopause suggest that whilst the transition is biologically universal, there is no universal syndrome: women do not experience menopause in the same way everywhere in the world (Anderson et al., 2004; Fujimaka, Katanoda, Hayashi, Fujita, & Suzuki, 2003; Shea, 2006). Culture affects us over the entire lifespan and, without exception, the socio-cultural context has a deep-seated effect on the meaning and experience of menopause (Melby et al., 2005). Multiple social constructions in the West: contradictions and confusion There has been a general consensus that in the West menopause has too often been construed negatively (Chrisler & Ghiz, 1993; Kaufert, Boggs, Ettinger, Woods, & Utian, 1998; McKinley, 2006; Ussher, 2011) and medicalised as a disease that can be successfully treated by the administration of suitable hormone replacements (Studd, 2010; Utian, 2005). These negative constructions are prevalent even though most women do not report problems at menopause. Entry into menopause is routinely associated with the end of fertility, old age (Gergen, 2009), becoming less attractive (Dillaway, 2005), being less sexually desirable (Dennerstein, Dudley, & Burger, 2001) and in some instances becoming mentally disturbed. Atwood et al. (2008) noted that, in reviewing the literature on menopause, they were left with the impression that ‘mid-life women were crazed, angry individuals suffering from menopausal madness; a state that could last for 15 to 20 years’. Estok and O’Toole (1991) commented that there are many examples of stigmatised meanings of menopause and recount a newspaper article from 1977 about the female mayor of Chicago, Jane Byrne, who was criticised for speaking out against corruption of the political machine. This behaviour was attributed to ‘merely being due to the “change of life”’. In the same article, the journalist evinces concern that ‘you wouldn’t want a president of the bank making a loan under these raging hormonal influences’. Such descriptions of what can happen to women during menopause are worrying but, in fact, women’s attitudes and beliefs about menopause are extremely diverse, can be positive and are often contradictory. Women can simultaneously believe that menopause is disturbing and distressing at the same time as they believe it is a time when women feel more confident, more competent and have more freedom (Hvas, 2006; Kaufert et al., 1998; Leiblum & Swartzman, 1986; Neugarten, Wood, Kraines, & Loomis, 1963). Liao & Hunter (1995) found a diversity of beliefs but most women, when asked, were 42 neutral or positive about menopause and only 16.8% believed that menopause was a deficiency disease that required treatment in most cases. Moreover, these beliefs can be moderated by actual experience and knowledge of the menopause. Liao and Hunter (1995) found that there were very high levels of misunderstanding and incorrect knowledge about menopause when they administered the Knowledge of Menopause questionnaire, and only 27% of women rated their knowledge as ‘good’. It appears that knowledge of menopause remains limited until onset (Jones, 1994; Rubinstein, 2010), but as women progress through the transition, knowledge influences their attitudes so that they become more positive, reflecting new-found knowledge and the realisation that whilst this experience may be unpleasant, it is only temporary (Neugarten & Kraines, 1965; Utian & Boggs, 1999). This raises a number of important questions. What is the taxonomy of these beliefs and to what extent do these beliefs influence the experience of menopause? There is agreement that holding negative beliefs about menopause correlates with reporting more symptoms and greater severity of symptoms. Ayers et al. (2010) conducted a systematic review of the literature on attitudes to menopause and found that of 13 studies that investigated the relationship between attitudes and symptoms, all confirmed that there was a link between symptom reporting and negative attitudes to menopause, though the effect sizes (where measures were possible) were small to medium (r = 0.01 to r = 0.37). It is, of course, difficult to assess the direction of influence; holding negative attitudes may result in more severe symptoms or having a bad experience of menopause could result in negative attitudes. Data from the Massachusetts Women’s Health study indicated that women with negative attitudes prior to menopause had a higher frequency of hot flush reporting on reaching the menopause (Avis, Crawford, & McKinlay, 1997). In contrast, recent prospective research by Gibson et al. (2011) revealed that negative affect was not associated with next-day vasomotor symptoms, but vasomotor symptoms were positively associated with next-day negative mood. They suggest that hot flushes and night sweats may lead to negative mood over time by activating schemas about aging and the self. This might indicate a ‘vicious circle’: once negative schemas about aging are activated, they become reinforced by negative symptom experiences, thus making it increasingly difficult for women to cope with vasomotor symptoms. However, the times at which the vasomotor symptoms occurred were not recorded and the changes in mood could have been influenced by other factors including sleep deprivation due to night sweats. It is worth noting at this point that the number of studies explicitly investigating attitudes to menopause is relatively small; Ayers et al. found only 94, and the majority did not investigate the relationship between attitudes and symptoms. There are even fewer studies that investigate the meanings attributed to menopause: a computerised literature search using SCOPUS on 25 th June 2013 using the terms social construction AND menopause resulted in 45 publications, and using the terms discourse AND menopause revealed 59 publications (and there was some overlap). Many of the studies were small 43 scale and qualitative, but three broad groups of social construction are apparent: the biomedical, the natural and the ambivalent/confused. The dominant discourse in the West is biomedical: precursor to disease and HT treatment Most of the literature that discusses constructions of menopause reinforces the view that in the West, menopause has become medicalised (Kaufert & Lock, 1997), hence the dominant discourse is biomedical – a ‘master narrative’ that pervades all other discourses (Bond & Bywaters, 1998; Dillaway, 2008; Gannon & Stevens, 1998; Hvas & Gannik, 2008a). This discourse portrays menopause as a decline in estrogen that causes a wide range of problems for the middle aged woman, ranging from expected vasomotor symptoms and joint aches to depression, vaginal atrophy, osteoporosis, cardiac problems, decreased libido and cognitive decline (Studd, 2000, p. 7). Although there has been resistance to this medical discourse (notably from feminists, i.e., Dillaway, 2005; Kaufert et al., 1998; Posner, 1979), menopause is still presented in medical textbooks in a negative light, suggesting that it is a precursor to disease (Niland & Lyons, 2011). In these texts the language used to describe menopause includes the ‘end of reproductive life’, caused by ‘ovarian failure’ or ‘the exhaustion of ovarian reserve’. Niland and Lyons commented that the textbooks presented knowledge authoritatively whilst at the same time acknowledging that the causes of menopause are poorly understood and much remains unknown. As discussed below, this ambivalence has been picked up by women and forms part of the confusion discourse. The discourse about HT is linked to the biomedical discourse because it was, until recently, the primary solution offered to women to alleviate the unpleasant symptoms described earlier. Pharmaceutical companies initially promoted HT to relieve the most common symptoms of hot flushes and night sweats, and much of the research indicated that this provided effective symptom relief for many women (though not all). However, there was an expansion of the uses of HT to prevent many other problems, including osteoporosis, cardiovascular disease, memory loss and general tiredness. Pharmaceutical brochures tend to depict menopause as an illness leading to bodily decline caused by the impoverishment of hormones (Coupland & Williams, 2002). HT became, for a time, the best solution for middle-aged women to ‘cure’ such problems as wrinkles, thinning hair, tiredness, panic attacks and extreme irritability (Hunter, 1990). As mentioned in chapter 3, both doctors and patients moved away from a reliance on prescribing HT after the Women’s Health Initiative report in 2002. Nevertheless, some specialists continue to advocate the use of HT for a wide range of conditions. John Studd (2010) even went so far as to publish an article entitled ‘Ten reasons to be happy about hormone replacement therapy: a guide for patients’ which stated, among other things, that HRT will ‘make you a better person’. The media took up the biomedical discourse. In a review of the Australian media’s coverage of HT, Shoebridge and Steed (1999) found that of 351 items identified, 73% cited experts and most of these were male and medical. Similarly, in the USA, Gannon & Stevens, (1998) found that when menopause was being reported in women’s magazines, 39 negative symptoms were mentioned but hardly any positive changes were discussed. Most of the articles referred to the necessity of treating menopause and 44 it was assumed that HT was the best solution. So the media stories were representing the discourse that was also occurring in academic and medical studies and in so doing were reinforcing negative stereotypes. The natural discourse: menopause is part of a natural lifespan; no drugs required The biomedical language implies that changes at menopause are inevitable. Women cannot control what is happening to them and the aim of HT is to restore the body to its natural, balanced state. However, whilst biomedical language dominates in media and medical discussions, women themselves have not entirely internalised the biomedical view. Ayers et al. (2010) reported in a systematic review of attitudes to menopause that most women nowadays consider menopause to be a natural transition and 60% of women in the HILO study interviewed in 2004–2005 believed menopause to be natural (Morrison, Sievert, Brown, Rahberg, & Reza, 2010). Hvas and Gannik (2008b) noted in a qualitative study that women made frequent use of biomedical language but tended to reject ideas that menopause is a disease or that HT could keep them ‘forever young’. This is in accord with the notion that the biomedical discourse does not actually reflect women’s experiences; most women think of menopause as neutral or positive, and menopause is seen in the context of mid-life issues rather than as an isolated event (Winterich & Umberson, 1999). It is possible that women have reclaimed menopause as a natural developmental phase in recent years, especially after the scares relating HT to increased incidences of breast and ovarian cancers. In Neugarten et al.’s (1963) study of American women’s attitudes to menopause, a surprisingly high number (95%) of women aged 45–55 years agreed with the statement ‘women should see a doctor during menopause’. This may reflect the USA’s distinctive health care structure and the greater influence of pharmaceutical companies, which led to a higher incidence of the use of HT (Meyer, 2003). Despite frequent criticism of the medicalisation of menopause, it should be noted that even in 2010, Utz was reporting that women in the USA were still expecting some form of pharmaceutical intervention. In the ‘natural’ discourse, menopause is not a monolithic experience but can be viewed as a normal transitional period to older age. The concept of menopause as a disease is resisted (Lyons & Griffin, 2003) and women’s experiences are not solely shaped by their hormones (Lock, 1998). It is true that menopause is seen as the end of reproduction and as such is highly symbolic of aging (Ballard, Elston, & Gabe, 2009) but it is difficult for women to know whether to attribute changes to menopause or to aging in general. Rather, menopause is part of a journey of self-discovery where symptoms may not be negative but merely a part of life itself (Hvas & Gannik, 2008a). In this construct, menopause is just one of many transitions that may lead to a new phase with many possibilities for future development. Doctors have little or no role to play in this discourse and HT is to be avoided, where possible. HT is considered ‘unnatural’ in the context of an expected developmental phase and is acceptable only if symptoms are so severe they have a major impact on daily life (Hunter, O’Dea, & Britten, 1997). 45 To some extent, women’s health has come to be seen in the context of moral virtue; the decision to use or not to use HT has become a moral decision (Stephens & Breheny, 2008). Thus, taking HT implies that one has not taken care of one’s health and the virtuous position is to avoid ‘giving in’ and simply ‘get on with life’. Stephens (2001) remarks that hot flushes can be interpreted by some women as a weakness and women who feel well exhibit a moral superiority; crediting themselves with looking after their health and having a positive attitude. The implication is that women who succumb to hot flushes lack moral virtue because they suffer from negativity and have failed to look after their health. The ambivalent/confusion discourse: doctors don’t have all the answers so women must be responsible for their own health It seems that it is hard for women to ignore the ubiquitous biomedical construction of menopause whilst at the same time finding means to resist and negotiate positions within it (Ussher, 2011, p. 11). One of the problems for women is that their knowledge about menopause is poor in comparison with other female bodily functions such as childbirth or menstruation, which are more openly discussed. Women sometimes complain that they are unprepared for menopause (Utian & Boggs, 1999) and indeed exhibit minimal knowledge until the ‘change’ is actually upon them (Liao & Hunter, 1995; Rubinstein, 2010). This means that women do not know what is normative, in part because the menopause is not an open topic of conversation. How should older people behave and how should women react to menopause? There are no obvious scripts for behaviour (Atwood et al., 2008; Gergen, 2009). In this environment, a new discourse has emerged, which acknowledges that the medical profession may not know everything about menopause and hence the management of symptoms must be by women themselves (Buchanan, Villagran, & Ragan, 2002; Hvas & Gannik, 2008a; Lyons & Griffin, 2003). This discourse can sometimes be related to a health promotion message, that is, women should keep in shape and focus on changes to lifestyle (diet, exercise, giving up smoking) to modify any risks associated with menopause and to avoid disease. Whilst this gives women a more active role in their own health, experts still have the ‘right’ answers and set the agenda. Lyons & Griffin (2003) comment that this discourse may be used as a means to smooth over the tensions between the ‘disease’ and the ‘natural’ discourses. It also reinforces a view that women’s bodies at menopause are confusing and mysterious. The idea of health promotion also links to a discussion about consumer choice. In this part of the discourse, women need enough information to make an informed choice, be it HT, herbal remedies or going ‘cold turkey’ (Hvas & Gannik, 2008a). Here, women are consumers, not patients, who are able to make decisions as to what is the best course. Unfortunately, women report that the information they get about menopause is unclear, contradictory, and confusing (Bond & Bywaters, 1998) and they frequently feel on the receiving end of inadequate or incorrect information (Buchanan et al., 2002). Thus, it is difficult to make an informed choice and this may explain why women hold such diverse attitudes and beliefs about menopause. 46 To summarise, several discourses have been identified in the literature (Table 4.1) all of which are available to be used by women, though the biomedical one tends to be dominant and very hard to resist. The literature on constructions of menopause is limited and most of it has been confined to smallscale qualitative research. It is likely that the social construction of the menopause has changed because of changes in women’s social roles, the introduction of new technologies (i.e., the contraceptive pill, hormone replacement therapy) and greater emphasis on cultural ideals of youth and beauty. Jones (1994) argued that there is a discrepancy between the social construction of menopause in society as aging, deficient and about decline, and women’s embodied experience. This discrepancy may cause women to deny or split off their experiences. There is some support for this idea, as women who have high levels of body awareness and feel ashamed of their bodies also have more negative attitudes to menopause (McKinley & Lyon, 2008; Rubinstein & Foster, 2012) and, as has already been discussed, holding negative attitudes is in turn related to the higher reporting of symptoms. Table 4.1: Discourses Identified in Reviews by Gannon & Stevens, 1998; Hvas & Gannik, 2008a, 2008b; Jones, 1994; Lyons & Griffin, 2003 Social construction Discourses Biomedical Disease A disease discourse based on positivist assumptions: menopause is an illness caused by estrogen deficiency that can be treated so as to avoid disease and death Forever Young Menopause is a negative symbol of old age; the ideal is staying young and Hormone Replacement Therapy can delay the signs of aging Existential /change Menopause is another stage in life not the end of the world; emphasises that menopause co-occurs with many major changes and menopause is trivial in comparison; women should focus on creating a new identity Alternative Anti-Hormone Replacement Therapy, menopause is natural Feminist In opposition to biomedical account; women are oppressed by doctors and ‘big pharma’ Confusion An emerging discourse that is an attempt to smooth over the tension between disease and natural explanations. If doctors are unable to understand what is going on, why should women? Health Promotion Keep in shape, avoid osteoporosis, modify menopausal status and risks by lifestyle changes Management Menopause is like a chronic disease that cannot be ‘cured; women must be made responsible for their own health (may link to the health promotion discourse) Consumer Women should have a choice and by keeping informed they can decide whether or not to use Hormone Replacement Therapy Natural Confusion Key features 47 The various discourses affect how women define, treat, accept or fight bodily changes at menopause. Thus, quantifying the scale and importance of meanings and social constructions used by women in understanding the menopause will contribute to our understanding of when and whether women decide to seek treatment. In addition, it will be important to understand how women use, negotiate and resolve conflicting sources of information in their efforts to embrace or resist the discourses being used. 48 Chapter 5: Objectives, Hypotheses, Methods and Choice of Instruments The review of the literature on the psychology of women going through menopause highlights that, by comparison with the plethora of biomedical research on menopause, there is a relative dearth of research that focuses on the psychosocial aspects of this stage of life. Yet it is clear that the experience of menopause is not purely biological. The degree to which women find this phase of life difficult or easy to manage, disconcerting or positive depends not only on the number and severity of symptoms reported but also cultural, dispositional, situational and social factors. The review of the literature in the previous chapters has revealed several important gaps in our knowledge. 1. The typology of beliefs and meanings about menopause and their prevalence in our society has not been formally assessed. Literature within the field of health psychology attests to the fact that beliefs are important factors in determining an individual’s response to illness and her ability to cope but the impact of beliefs on symptom reporting or treatment utilisation has rarely been tested empirically with menopausal women (Janz & Becker, 1984; Leventhal, Brissette, & Leventhal, 2003; Weinstein & Rutgers, 1993). 2. As much of the research on menopause has been either medical or epidemiological, our knowledge of the daily ‘lived’ experience of women who have symptoms at menopause is limited, as is our knowledge of the coping strategies used. 3. Much of the research has been with clinical populations and so we cannot be sure how many women in the general population actively need or want advice and treatment, nor do we know whether they expect to get such advice from physicians or from elsewhere, e.g., advice from complementary sources or use of alternative medicines. 4. There are large individual differences in women’s experiences of menopause and it is evident that the factors influencing these experiences are biological, cognitive, psychological and social. It is rare that these factors are studied simultaneously and hence we know little about how these factors interrelate or interact to affect symptom reporting and levels of treatment utilisation. Overall objectives 1. To explore how women make sense of menopause 2. To assess which factors predict symptom severity during the menopause 3. To assess which factors predict treatment utilisation for menopause symptoms a. Specifically to compare predictors of biomedical treatments with non-biomedical treatments. 4. To explore how women’s beliefs about the menopause are located within the social context of their daily lives 49 Specific treatment utilisation hypotheses are that: 1. Women who rate higher for treatment utilisation for menopause symptoms will be more likely to construct menopause as pathological and to associate menopause as a symbol of aging. 2. Women who rate lower for treatment utilisation for menopause symptoms will be more likely to construct menopause as a natural lifestage. 3. Women who rate higher for treatment utilisation will have fewer coping strategies, score lower on emotional stability and higher on the measure of cognitive inflexibility (AAQ). Methodological issues in conducting menopause research There are significant methodological issues in conducting menopause research. There are confounding effects of age-related changes, problems of reconstruction bias, the evocation of social stereotypes that bias responses, and the use of unstandardised symptom measures that make it difficult to compare studies (Dennerstein & Helmes, 2000). The use of checklists that ask women to rate their symptoms as mild, moderate or severe take no account of attribution (for example, physical exhaustion or irritability may be due to other issues) and rarely ask about context. Therefore, it is not possible to say if the experience is perceived as better or worse depending on whether the individual is alone, with friends and family, at work or with a partner. In addition, women who are taking HT cannot easily be compared with those who are not because they usually report a reduction or elimination of symptoms. Dennerstein & Helmes (2000) comment that menopause research has been criticised for medicalising women and treating them like objects. They cite several good practice principles, including the fact that when conducting research about complex issues that affect women’s health, it is important to use a broad approach and take account of social factors and the role of culture. To allow for the influence of multiple factors, they recommend that linear regression be used rather than logistic regression where continuous data are available. In addition, they suggest that the study be described as a general health survey, so that bias caused by emotional responses to menopause is lessened. Other recommendations are that information on current symptomatology should be collected so that the problem of recall bias is minimised, an age range that encompasses the menopausal transition is recruited and that reliable scales that have been validated for the cultural groups under consideration are used. These principles guided the scope and selection of variables used in the research. Large, longitudinal, epidemiological studies of how menopause affects quality of life (for example, the number of symptoms and how bothersome they are) are equipped to establish causality and relationships between symptoms and physical, psychosocial and lifestyle factors but do not investigate the meanings of menopause. Epidemiological studies have predominantly been conducted in the USA and Australia (e.g., The Melbourne Women’s Midlife Project; Seattle Midlife Women’s Health Study; Mills Longitudinal study; Massachusetts Women’s Health Study), with much less focus on this subject in the UK (The South-East England Longitudinal Study is an exception). Cross-sectional studies are unable to 50 confirm causality but have the advantage of being cheaper and simpler to carry out, and because participants are only asked to be involved once, the sample is often more representative than longitudinal studies. Although conducting longitudinal research would address some of the issues of predicting causality, this was not possible within the confines of this PhD study. Women may have concerns about menopause but these are rarely the focus of large scale surveys. There are few studies that drill down to actual experience or ask women what they attribute to menopause, or consider context or try to capture daily experiences. In addition, much of the earlier research has been with white, middle-class women and there has been little research among women from different ethnic and socioeconomic groups. Rationale for a mixed methodology research approach On the basis of this analysis the research approach selected was sequential, mixed methods; a quantitative survey followed by a qualitative stage where a sub-sample of women completed a calendar/diary and participated in a semi structured interview. Mixed methodology has been defined as an approach to knowledge that attempts to consider multiple viewpoints, perspectives, positions and standpoints, with the intention of integrating or combining them and that “recognizes the importance of traditional quantitative and qualitative research but also offers a powerful third paradigm choice that often will provide the most informative, complete, balanced, and useful research results” (Johnson, Onwuegbuzie, & Turner, 2007). There are several possible reasons given for taking such an approach (Bryman, 2006; Greene, Caracelli, & Graham, 1989) and at its most basic the argument for doing so is that quantitative methods allow the researcher to assess the magnitude and frequency or relationship between constructs, whilst qualitative research enables the exploration of meaning and understanding of constructs (Johnson & Onwuegbuzie, 2004). It is particularly appropriate to use mixed methods when researching women’s experiences at menopause because the experience of menopause is a subjective one, so we need an approach which values both objective and subjective knowledge. There are few objective measures that can be used to evaluate the frequency and magnitude of symptoms, and where objective measures exist, as in the case of telemetry to measure hot flushes (Freedman, 1998), they are infrequently used, in part because they can be costly, time consuming and invasive. Furthermore, the correlation between the objective and subjective measures used is not strong (Hunter & Haqqani, 2011). Thus, we have to rely on self-report because what is noticed and observed is affected by background, knowledge, theories, and past 51 experience. Moreover, when researchers collect information about menopause-related symptoms they rarely ask whether women, themselves, attribute their symptoms to menopause. The result is that women may report high levels of poor sleep or bladder problems that are attributed to menopause by researchers or physicians but are, in fact, due to some other cause. The impact of social constructions on the experience of menopause has not been tested empirically. However, a wholly positivist view that derives information purely from mathematical treatments is not appropriate in this context because meaning is co-constructed between individuals in society (Gergen, 1985). Social constructionism can be strong or weak. The strong version suggests that all knowledge is constructed, there are few objective facts and all versions of representations are misleading. The weaker version suggests that there are facts but these are filtered through our social constructions of them (Bauer & Gaskell, 1999). The latter view is a more realistic reflection of menopause: there are biological changes but these are interpreted though the social constructions that we have developed to understand them. Therefore, a mixed methods approach will facilitate the integration of a variety of theoretical perspectives (e.g., coping theory and illness representations) and also give context and meaning to the experiences reported. Setting knowledge within a context is especially critical for menopause research because, as discussed earlier, women may feel and behave differently in different situations. There are multiple reasons for using a sequential, mixed methods approach for research into menopause. First, the quantitative stage facilitates sampling of respondents for subsequent interview by ensuring that women can be categorised as high or low treatment utilisers. As it was not possible to know the scale boundaries for treatment utilisation in advance, it was thought better to undertake qualitative analysis after the quantitative stage. Second, triangulation is possible (Flick, 2007, p. 40). This means that information about symptom reporting and coping strategies can be corroborated. This is particularly important, as survey data is retrospective and there may be recall biases. Third, the qualitative stage provides contextual information on the situation. It is hypothesised that specific situations may exacerbate the perception of symptoms, and diary and interview data will illuminate these circumstances. Finally, diary and interview data enriches and helps to explain the survey data and provides a more comprehensive account of the experience. Previous researchers have complained that we cannot fully understand the experience of menopause without better understanding meanings (Liao & Hunter, 1995; Reynolds, 1999) and this study has been designed with these considerations in mind. Study design There were 3 elements to this research: Study 1 was designed to develop a new measure to assess women’s beliefs about menopause. Women were recruited for this stage by placing adverts in places where women gather. The online 52 questionnaire included information on demographics, symptom severity and beliefs about menopause. The responses from this study were used to develop social construction scales for use in study 2 Study 2 incorporated the measures developed at study 1. This was a quantitative study to assess the predictors of symptom severity and treatment utilisation using a questionnaire called the Wellbeing in Midlife survey (WBIM) that covered a broad range of biological, cognitive, social and psychological factors. The outcome measures were symptom severity, measured by the Menopause Rating Scale (MRS) and treatment utilisation, a composite measure of the number of treatments sought for menopause symptoms. A sub-sample of high and low treatment utilisers were selected from study 2 for the qualitative stage. Study 3 was a qualitative study that explored how women’s beliefs about menopause are located in their social context. A 7-day calendar and detailed 24-hour diary were developed for this study, and were used as memory aides for an interview. The criteria for inclusion in this stage were being peri- or postmenopausal, reporting symptoms above the median on the MRS and attributing one or more symptoms to menopause. In addition, participants were to be non-users of hormone therapy. In the event, two of the high treatment utilisers had just begun using HT at the time of the interview but were still symptomatic. They were retained because they were able to describe the differences pre- and post-usage of HT. Ethical approval: The research was given ethical approval by the University of Cambridge Psychology Ethics Committee and the Cambridge Central NRES Ethics Committee, East of England, and site agreements were given to conduct the research at Queen Charlotte’s and The Chelsea and Westminster Hospitals. At stages 1 and 2, participants read an Information Sheet describing the purpose of the study and completed a consent form. Participants were told that they could withdraw at any time and were given information about who to contact if they had any complaints. They were also given details of the NHS Choices website, where they could find more information about menopause. This information was the same for both online and pen and paper versions of the study. Participants were fully debriefed after the stage 2 study. Recruitment strategy In-keeping with Dennerstein and Holme’s (2000) recommendations, the sample was aged between 40 and 60 years of age in order to maximise the probability of identifying women who were peri- or postmenopause. Diverse locations were used in order to maximise the probability of recruiting women from a wide range of socio-demographic and ethnic backgrounds. Study 1: Women were recruited using adverts at women’s groups, volunteer staff at museums in Cambridge, the Minority Ethnic Network for the East of England, Housing Association staff, gyms, leafleting at Race for Life meetings, and leaflets in places where women congregate (public lavatories, pubs, supermarkets) in Cambridge, Stevenage. 53 Studies 2 & 3: Locations in Cambridge and Nottingham were selected for studies 2 and 3. Cambridge and London were selected because the profile of the areas is different. Compared with the population in England, Nottingham has a higher proportion of people who are mixed race, Asian/Asian British and Black/Black British than the average for the country as a whole. In addition, more people in Nottingham report that their health is poor compared with the average for England. Cambridge is the opposite in all respects; more than the average number of people are white and fewer people report that their health is poor (ONS, 2001 Census). In addition, two local housing associations, one in Cambridge and one in Nottingham, agreed to participate, thus widening access to a range of socioeconomic groups. The general population sample was identified using adverts in housing associations, GP practices and supermarkets. The clinical sample was identified via London menopause clinics. Two menopause clinics were approached, one at Queen Charlotte’s and one at Chelsea & Westminster Hospitals, both run by consultant gynaecologist, Mr Nick Panay, who at the time was Chairman of the British Menopause Society. It is worth noting that there are relatively few specialist menopause clinics in the UK either at primary or secondary care level. Some hospitals in major conurbations, including London, Nottingham, Leeds, Birmingham, Manchester and Southampton, run menopause clinics as part of general gynaecology outpatients. There are also some privately run clinics. At GP level, provision of specialist menopause clinics is ‘patchy’ and depends on the interests of individual clinicians (source: The British Menopause Society). Thus, women who want treatment may have to seek out specialists at primary level, request referral to a hospital consultant or find alternative treatments. Details of recruitment process for studies 2 & 3(Figure 5.1): An initial letter explaining the purpose of the study and requesting participation was sent to two housing associations (Metropolitan Housing, who have associations in Cambridge and Nottingham) and to GP surgeries within a 5-mile radius of the city centres of Cambridge and Nottingham (Appendix 1). Mr Panay was contacted separately and agreed to act as Principal Investigator for the study to ensure that site specific access could be given at each hospital. GP practice managers were sent a letter and each practice was contacted by telephone. Practice managers usually consulted with the GPs and of the 34 GP surgeries in Cambridge, one surgery declined and 33 agreed to participate, and of the 63 surgeries in Nottingham, 42 agreed to participate, one declined and twenty were unavailable. A website was prepared (www.sdp.cam.ac.uk/wellbeingsurvey) for doctors and participants to find out more about the study and the investigator, and to gain access to the questionnaire online. A pack was sent to participating surgeries and the housing associations that included a poster(s) to put in the waiting room (A4 and A3 sizes) and postcards explaining the study and providing details of the website address. Copies of the questionnaire with a stamped, addressed envelope were also included for patients 54 to take away with them. Each questionnaire was pre-coded to enable source-tracking (Appendix 2: advert and questionnaire). The posters were also displayed in supermarkets in Cambridge. A prize draw was offered to win £50 of shopping vouchers to encourage participation. The study was explained to the clinicians, nurses and receptionists at the two menopause clinics and the posters, postcards and questionnaires were displayed during clinic times. Doctors at the clinic could suggest that their patients consider participating in the study and the author attended the clinics (one each week) to ask patients to complete the questionnaires. This had the advantage that momentum was maintained and provided greater insights into how the clinics operated and the reasons women were attending. At the end of the study 2 questionnaire there was a question asking if women were willing to continue to study 3. Those who volunteered but were ineligible (because they were premenopausal, were below the median on the MRS, did not attribute symptoms to menopause or were using HT) received a letter or email thanking them and explaining that they would not be required for the next stage. Those who volunteered and were eligible were contacted by email or phone and asked to confirm that they were willing to continue to the next stage. If participation was confirmed, a pack was sent to each woman containing an Information Sheet, Consent Form, and instructions for the completion of the 7-day calendar and 24-hour diary (Appendix 4). The participants were contacted by phone to ensure that they had received and understood the information and to set up a time for interview. Interviews were conducted by phone or face-to-face as soon as possible after the completion of the 24-hour detailed diary at a convenient time and place (Appendix 5 Topic Guide). 55 Figure 5.1: Flow diagram of Recruitment process for Study 2 and Study 3 Study 1: The development of a new measure to assess women’s beliefs about menopause: Belief scale questionnaire This was a brief study to develop a new measure to assess women’s beliefs about menopause. Data was collected on demographics, menopause status, symptom experience and beliefs. Menopause status was assessed according to WHO definitions (Utian, 2004): women who were premenopausal were defined as currently menstruating regularly or using birth control, women who were perimenopausal were defined as experiencing noticeable changes in the length, duration or amount of flow in the menstrual cycle and postmenopause was defined as 12 months after the last menstrual period. Women with surgical menopause were defined as having had an operation for removal of the uterus or ovaries or who had treatment for breast cancer. The Menopause Rating Scale was used to assess symptom prevalence and severity. It was developed in 1992 by the Berlin Center for Epidemiology and Health Research as an alternative to the Kupperman Index. It is a self-administered scale that can provide the clinician with information about symptoms and their changes during treatment. It is easy to understand and to score and has been used for clinical trials and observational studies in many countries worldwide (Heinemann et al., 2004). It was selected because it measures 11 broad symptoms, whereas other symptom scales list out a very large number of possible symptoms (Bowles, 1986; Greene, 1998) thus potentially attributing symptoms to menopause that may be the result of other conditions. The intensity of each of the 11 items is scored from 56 0 (not applicable) to 4 (very severe) and the total score ranges from 0 (asymptomatic) to 44 (high level of complaints) (Table 5.1) Table 5.1: Items of the Menopause Rating Scale and Allocation to Sub-scales Symptom Sub-scale Sleep problems: difficulty falling asleep, difficulty in sleeping through, waking up early Somato-vegetative Irritability: feeling nervous, inner tension, feeling aggressive Psychological Heart discomfort: unusual awareness of heartbeat, heart skipping, heart racing, tightness Somato-vegetative Physical & mental exhaustion: general decrease in performance, impaired memory, decrease in concentration, forgetfulness) Psychological Dryness of vagina: sensation of dryness or burning in the vagina, difficulty in sexual intercourse Urogenital Hot flushes, sweating: episodes of sweating Somato-vegetative Anxiety: inner restlessness, feeling panicky Psychological Sexual problems: change in sexual desire, in sexual activity and satisfaction Urogenital Bladder problems: difficulty in urinating, increased need to urinate, bladder incontinence Urogenital Depressive mood: feeling down, sad, on the verge of tears, lack of drive, mood swings Psychological Joint and muscular discomfort: pain in joints, rheumatoid complaints Somato-vegetative There are three sub-scales; the psychological sub-scale and the somato-vegetative sub-scales are both made up of four items and hence scores range from 0 to 16 for each scale. The urogenital sub-scale is comprised of three items and scores range from 0 to12. The test-retest correlation in Europe is 0.96 and internal consistency as measured by Cronbach’s Alpha ranges between 0.6 and 0.9 for the total scale and the three domains. In the WBIM questionnaire Cronbach’s Alpha scores for the peri- and postmenopausal women were 0.85 for the total MRS, 0.87 for the psychological sub-scale, 0.65 for the somatic sub-scale and 0.60 for the urogenital sub-scale. The MRS compares well with the Kupperman Index (Pearson’s r =0.91) and with the SF-36 quality of life scale (Schneider, Heinemann, Rosemeier, Potthoff, & Behre, 2000a). It is also consistent across countries and hence measures the same phenomenon across regions. Norms exist for each scale by region. The MRS was also used as the basis for reporting symptoms at the diary phase of the study. 57 Belief items were developed based on existing literature as described in Chapter 4: the social construction of menopause. These represented the main discourses that were identified in previous research. Study 2: Quantitative study to assess predictors of symptom severity and treatment utilisation. The WBIM questionnaire was divided into four sections. Section 1 focused on sociodemographic variables – age, ethnicity, household income, home ownership, work status, marital status, number of children given birth to, and highest educational level. Section 2 concerned lifestyle and health related variables – self-rated health, life satisfaction, weight and height (transformed into Body Mass Index), prior illnesses, lifestyle behaviour (smoking, drinking and exercise), 23-item Women’s Health Questionnaire, and annual treatment utilization. Section 3 was about menopause related variables – menstrual status, previous menstrual symptoms, Menopause Rating Scale (MRS), use of Hormone Therapy, length of time used HT, attribution of symptoms to menopause, and beliefs about (social constructions of) menopause. Finally, section 4 focused on social and cognitive variables – personality, cognitive flexibility, social support and number of confidantes, and the type and number of coping approaches Standardised scales that had been validated were used where possible. This included the Women’s Health Questionnaire (WHQ) (Hunter, 2000), the Menopause Rating Scale (MRS) (Potthoff, Heinemann, Schneider, Rosemeier, & Hauser, 2000; Schneider, Heinemann, Rosemeier, Potthoff, & Behre, 2000b), the Ten-Item Personality Inventory (TIPI) (Gosling, Rentfrew, & Swann, 2003), the Action and Acceptance Questionnaire (AAQ) (Hayes, Luoma, Bond, Masuda, & Lillis, 2006), and the Duke Functional Support Questionnaire (DFSQ) (Broadhead, Gehlbach, Gruy, & Kaplan, 1988). The social construction scales and the treatment utilisation scales were developed by the author. The validated scales are described below and the scales developed by the author are discussed in more detail in Chapter 6. Symptom severity was assessed using the Menopause Rating Scale as in study 1. The Women’s Health Questionnaire is a standardised measure of women’s health in mid-life and as such is suitable for use with women aged 40 to 60 years of age (Hunter, 2000). The questionnaire is reliable and has good construct validity, is sensitive to detecting change and has been used in a wide range of studies in Europe and North America. The WHQ has been applied in studies of healthy mid-aged women, with peri- and postmenopausal women being treated for menopausal problems (e.g., vasomotor symptoms, sexual problems and emotional problems), with women seeking preventative treatment for osteoporosis, and in samples of women who experience menopausal symptoms following treatment for breast cancer. There are two versions, a 37-item version and a shorter 23-item version. The 23-item version is suitable for non-clinical populations and was used in this survey (Girod, de la Loge, Keininger, & Hunter, 2006). The items are measured on a 4-point scale from 1 (Yes, definitely) to 4 (No, not at all). The 23-item version investigates six domains, which are anxiety/depressed mood, wellbeing, somatic 58 symptoms, memory/concentration, vasomotor symptoms and sleep problems. Two optional domains – menstrual symptoms and sexual behaviour – were omitted. Administration, scoring, interpretation guidelines, and country reference values are available from the MAPI Research Institute (Girod, Abetz, de la Loge, Fayol-Paget, & Hunter, 2004). The Ten-Item Personality Inventory (TIPI) is a brief measure of the Big Five personality domains developed to enable researchers to use a shorter measure in situations where personality is not the main topic of interest and where time and resources may be limited. The five domains typically measured by personality instruments are openness to experience, conscientiousness, extroversion, agreeableness and emotional stability. TIPI measures the classic personality traits usually measured by much more complex instruments such as the 240-item NEO Personality Inventory (Costa & McCrae, 1992). The ten items represent the poles of each of the dimensions, and participants self-rate on a 7-point Likert scale ranging from 1 (disagree strongly) to 7 (agree strongly). Test-retest reliability is good (mean r = 0.72) and correlations with external correlates of the Big Five Inventory are also good. TIPI is not as accurate as more extensive Big Five measures but is considered to be reasonable proxies for them (Gosling et al., 2003). The Action and Acceptance Questionnaire (AAQ) is a measure of cognitive flexibility that emerged from a model of psychotherapy and treatment similar to Cognitive Behavioural Therapy: Acceptance and Commitment Therapy. This scale has been in development and the AAQ-1 was used for this study, though it should be noted that a more recent 10-item AAQ-2 is also available. AAQ-1 is a validated 9-item scale that assesses a person’s experiential avoidance and immobility and acceptance and action (Hayes et al., 2004). Experiential avoidance occurs when a person is unwilling to be in contact with private experiences (e.g. bodily sensations or emotions) and has excessively negative evaluations of personal experiences. This can lead to thoughts and emotional suppression and an inability to take action (Bond et al., 2011). The items of the AAQ focus on different aspects of cognitive flexibility, including ability to take action, attempt to control experiences, worry and anxiety. Cognitive flexibility occurs when there is acceptance and the ability to take action is commensurate with current contingencies, whereas cognitive inflexibility implies the rigid dominance of psychological reactions (Hayes et al., 2006). The AAQ has been found to relate significantly to mental health, job satisfaction and several quality of life indices, and a meta-analysis of 27 studies found an average correlation across studies of r = 0.42 (Hayes et al., 2006). The scale reaches reliability (Cronbach’s Alpha of 0.70) but sometimes (though not always) falls a little below accepted levels. In the WBIM questionnaire, the scale reliability was 0.72. Items are rated on a 7-point Likert-type scale from 1 (never true) to 7 (always true). High scores on the AAQ are reflective of greater experiential avoidance and immobility, while low scores reflect greater acceptance and action. Average scores in clinical populations are typically about 38 to 40, while in non-clinical populations they are typically about 30 to 31 (Hayes et al., 2006) . The AAQ has not previously been used in relation to menopause and it was selected because it is hypothesised that cognitive inflexibility could 59 be associated with higher levels of symptom reporting. In the WBIM survey the mean for the general population sample of peri- and post-menopausal women was 32.58 (SD 8.32) and the mean for the clinical sample of peri- and postmenopausal women was 33.68 (SD 8.87). This difference was not significant: t (290) = –1.076; p = 0.283; CI95 [–3.119, 0.914] The Duke Functional Support Questionnaire (DFSQ) was developed to measure a person’s perception of the amount and type of personal social support available. Social support is defined as aid from significant others that is intended to meet the emotional, informational, or instrumental needs of an individual (Heaney & Israel, 1997). Thus, social support refers to the function and quality of social relationships rather than the size or density of the network of relationships (Schwarzer & Leppin, 1991). Lower levels of social support have been reliably associated with higher rates of morbidity and mortality (House, Landis, & Umberson, 1988). There are several possible ways that social support can affect health outcomes but in general there appear to be two broad processes, one behavioural (health behaviour and adherence) and one psychological (appraisals, emotions and control) (Uchino, 2006). It is suggested that social support acts as a buffer by reducing the harmful effects of stress (Cohen & Wills, 1985) and by enabling the individual who receives the support to increase their sense of self-efficacy (Schwarzer & Knoll, 2010). For example, social support may be health promoting because it facilitates healthier behaviours such as exercise and diet (Lewis & Rook, 1999). Koch & Mansfield (2004) argue that because women lack accurate knowledge about menopause and because it is shrouded in secrecy, social support may be of critical importance during this transition. The 8 items of the DFSQ measure two dimensions of social support, affective (emotional form of caring) and support from confidantes (a relationship where important concerns can be discussed) (Broadhead et al., 1988). The items are rated on a 5-point scale ranging from 5 (As much as I would like) to 1 (Much less than I would like) and the score is calculated by summing all items and averaging them. Higher scores denote greater perceived support. Scores for the two sub-scales (affective and confidante support) can also be calculated. Internal reliability was reported as good, with an alpha of 0.80–0.85 and the two week test-retest reliability was 0.55 to 0.70. This measure was selected because it is brief and easy to self-administer and focuses on the quality of social support. Furthermore, it may be of particular relevance to women at menopause because, as discussed in Chapter 4, menopause is not often discussed and can be considered to be ‘taboo’ (Atwood, McElgun, Celin, & McGrath, 2008). The hypothesis is that women who report lower levels of perceived support have a higher propensity for treatment. For the purposes of this survey one item was omitted (‘I get chances to talk to someone I trust about money problems’) because this was less relevant to the health related issues discussed in the survey. This had no discernible impact on scale reliability, and in fact it was improved: Cronbach’s Alpha for the total support scale was 0.91, for affective support was 0.87 and for confidante support was 0.86. 60 A distinction is made between functional and structural aspects of social networks. The DFSQ measures the functional aspect of an individual’s social network. However, the size and type of network is also important. Antonucci and Akiyama (1987) describe a convoy model of social support, which incorporates the idea that people move through life surrounded by a group of people, some of whom form a stable core and travel with them through life and others who are with them for shorter periods. This concept was visualised as a set of three concentric circles surrounding an individual, with those in the inner circle viewed as the people to whom one felt closest and who were the most important providers of support. Over the lifespan the number of members in the convoy alters so that by mid-life the number of people in the convoy will be greatest as the number of roles and family size increases and then decreases as people get older. Furthermore, women tend to report more close relationships than do males (Antonucci, Akiyama, & Takahashi, 2004). On this basis an additional question was included in the survey based on Antonucci et al.’s theory. This was ‘Thinking about the people in your life right now, how many people are there in your life that you feel very close to, such as close family and friends? People you feel close to might include those you discuss important matters with, regularly keep in touch with or are there for you when you need help’. Investigations were conducted to see whether the number of confidantes had any impact on perceptions of symptoms or on treatment utilisation. Analyses were also done to discover whether it was feasible to use a composite scale of social support made up of the DFSQ and the number of confidantes. The DFSQ and the number of confidantes did not correlate significantly and it was hypothesised that this may be because it is only necessary to have one or two close friends in order to feel supported. Attempts to create a composite measure also failed because the variable was highly skewed and non-predictive of either perceptions of symptom severity or of treatment utilisation. On this basis, only the DFSQ was used as a measure and the number of confidantes will not be discussed further. Coping questions were used based on Stone and Neale’s (1984) measure of Daily Coping. As discussed in Chapter 3, long checklists of coping are problematic because coping tends to be situationand disposition-dependent and it is difficult to define a typology of coping that is appropriate or reliable. In order to resolve these issues and to ensure that the questionnaire was not overlong, a reduced version of the Daily Coping questions was used. Participants were asked what was the most bothersome event of the previous day, whether this was a problem that had happened before and how much control they had over it. The event was rated on a scale of 1 (minor annoyance) to 100 (very stressful event). The participant was then asked how they had handled the event, by selecting from one or more of eight descriptions as defined by Stone and Neale, which include distraction, situation redefinition, direct action, catharsis, acceptance, seeking social support, relaxation, and religion. Finally, participants were asked if this was typical or not typical of how they usually handled bothersome situations. The checklist of 8 items was also used in the context of menopause-related events in the diary phase of the study. 61 Social Construction of Menopause scales: these scales were developed specifically for the study and details of their development are discussed in detail in studies 1 and 2. Four scales were used which met reliability criteria; an invisible and unvalued belief (Cronbach’s Alpha 0.81), a treatment belief (Cronbach’s Alpha 0.77), and an illness belief (Cronbach’s Alpha 0.76) and a belief in postmenopausal recovery (Cronbach’s Alpha 0.71) A Treatment utilisation measure was specifically developed for this study. It encompasses biomedical and non-biomedical treatment including complementary therapies, changes to diet and the use of herbal products and supplements. Women were asked whether they had sought treatment for any of the 11 MRS items from a medical doctor, therapist, taken vitamins or supplements, taken herbal products or changed their diet in order to treat menopause symptoms. The overall treatment utilisation scale was a composite weighted score of the number of treatments used for any of the 11 MRS items. This was also split into two scales, biomedical treatment utilisation and non-biomedical treatment utilisation. Details of the construction and characteristics of the treatment utilisation scale are in Chapter 6: analytical strategy. Study 3: Qualitative study to explore how women’s beliefs about menopause are located within their social context. The original intention had been to recruit women who were not on hormone therapy because the use of HT usually results in the reduction of symptoms. However, this constraint was relaxed in two cases in order to better understand treatment-seeking behaviour. In these instances women had only recently begun to use HT and so their experiences of ‘before and after’ were fresh in their minds. Furthermore, some women who were using HT continued to experience symptoms, albeit often at a lower level than before. Diaries were used to record information because they have the advantage of reducing retrospective bias and facilitates the collection of reliable person-level information (Bolger et al., 2003). In addition, as Bolger and colleagues comment, ‘capturing life as it is lived’ allows for the recognition of the importance of the context in which the processes unfold. However, the requirement to keep diaries for a long period can increase the burden on participants and reduce the level of compliance (Stone, Shiffman, Schwartz, Broderick, & Hufford, 2003). 1. 7-day calendar: In order to keep the burden as low as possible, two types of diary were used. The 7day Daily Menopause Experiences Calendar was designed to replicate the MRS symptoms reported at the survey stage. For each day, women were asked to rate the existence of menopause symptoms on a scale of 0 (none) to 4 (very severe). Women were also asked to record the frequency of hot flushes and night sweats on each day. Sloan et al. (2001) found that the longer the diary period, the more likely that there was an increase in missing data. Research has indicated that diaries that recorded the number and severity of hot flushes over a shorter period were an accurate reflection of experience. In fact, with 3 days of diary keeping, the mean number of hot flashes per day and mean severity were 62 almost identical to the means based on the 7-day diary, the SDs of the means were almost identical, and the intraclass correlations were almost perfect (Grady et al., 2009). On this basis, a 7-day diary was considered to be as effective as a monthly diary. After completing the 7-day calendar, women answered questions about which of the symptoms recorded were most problematic, and to what extent these symptoms affected family life, work, and relationships. They were also asked to answer the same coping checklist as used in study 2. 2. 24-hour detailed diary: On completion of the 7-day calendar, women kept a 24-hour detailed diary. This was based on the Day Reconstruction Method (Schwartz, Kahneman, & Xu, 2009), which aims to improve accuracy and reduce recall bias by limiting reports to very recent activities. Schwartz et al. (2009) note that when respondents’ reports pertain to very recent affective experiences they often arrive at different conclusions about the hedonic value of events. Thus, being asked to focus on very recent episodic events results in more accurate information. Participants recorded information about their activities on an hourly basis and were contacted as soon as possible (preferably the next day) to describe the events that had occurred. The 24-hour diary was in hourly segments and was divided into two sections: section 1 concerned what was being done at the time and section 2 concerned the recording of the menopause-related event. For each event the participant recorded how long it lasted, who they were with at the time, how they felt (mood) and what they did to minimise the experience. The main purpose of the diary was to act as a memory aid for use during the interview. The 24-hour diary reinstates the events of the previous day in working memory; retrieval from autobiographical memory is facilitated by recording the detailed sequence of episodes (Kahneman, Krueger, Schkade, Schwarz, & Stone, 2004). In keeping with the recommendation from Kahneman and colleagues, the 24-hour diary was confidential and respondents did not need to return it to the researcher. The subsequent interview used the diary as the basis for discussion in order to better understand how women described the experience of the menopause symptoms and how this affected their moods, and enabled the contextualising of the experience in terms of the situation and beliefs about treatment, and social constructions of the menopause. 3. Semi- structured interview: For the interview, women were asked to describe their day, hour by hour, using the diary as a prompt and were asked to explain why they rated the episode at a particular level, with specific attention being paid to the situation and who they were with at the time. Women were also asked to describe the coping mechanisms used to minimise the experience. After completing the description of their day, women were asked about their reasons for seeking or not seeking treatment, and about their experience of getting treatments for menopause. Finally, women were shown four statements that represented the most prevalent social constructions of menopause as identified earlier and also tested out the emergent idea of menopause as contradictory and confusing (Table 5.2). Women were told that these were statements made by other women about menopause and they were encouraged to comment on the extent to which they agreed or disagreed with them. 63 Table 5.2: Stimulus material used in the interviews: four statements describing different social constructions of menopause Statement 1 Menopause can be treated as if it were an illness. Hormone Replacement Therapy is good for treating hot flushes, preventing osteoporosis, delaying the signs of aging and improving your sex life Statement 2 Menopause is a confusing time. Women don’t know what to believe because there are so many conflicting views and even doctors don’t know everything so women should do whatever they think is right Statement 3 The menopause is natural and nothing out of the ordinary and doctors should not be giving women drugs for it. In fact, life is more interesting after the menopause and women have more confidence in themselves Statement 4 Older women are not respected or valued and at menopause they become invisible. The media are so obsessed by youth that it is difficult for older women to get noticed and menopause is a sign of getting old The interviews lasted between 45 and 90 minutes. Women were told that the diaries were confidential and were to be used as prompts for discussion. They did not have to return them to the researcher but could do so if they wished. A stamped addressed envelope was provided and 28 out of the 30 participants returned the completed diaries. The interview took place as soon as possible after the 24hour diary was complete (preferably the next day) in order to improve recall. Wherever possible interviews were face-to-face but women who lived at some distance were interviewed by telephone. All interviews were audio-recorded. 14 women were interviewed face-to-face, 1 by Skype and 15 by telephone. The interviews were transcribed by the author and were then loaded into Atlas.ti 6.2 for analysis. Thematic analysis of the qualitative data was used because it enables the researcher to move back and forth between the process of collecting the data and the analysis. Thematic analysis seeks to describe patterns across the data set and is particularly relevant to the study of meanings at menopause because it can examine events, meanings and experience within a broad context (Attride-Stirling, 2001; Braun & Clarke, 2006). The data collection continued until all possible codes had been identified and allowed for the development of themes during the process (see Chapter 6: analytical strategy). This approach has explanatory power when considered in combination with the quantitative data because it is systematic and can illuminate the beliefs and mechanisms associated with the transmission of these beliefs. A note on reflexivity and potential interviewer bias An often-expressed concern about qualitative (and perhaps also quantitative) analysis is that the researcher will influence both the collection of data as well as its interpretation due to the individual’s position and perspective. This is more likely to be evident in interview situations where an intersubjective element is explicit and where the researcher’s behaviour may affect the participant’s responses (Finlay, 2002). It is, therefore, important to acknowledge the position of the researcher vis-à-vis the data being 64 collected and to encourage reflexivity. Reflexivity has been described as ‘an attitude of attending systematically to the context of knowledge construction, especially to the effect of the researcher, at every step of the research process’ (Malterud, 2001). This requires thoughtful self-conscious awareness and the continual evaluation of personal subjective responses. In this respect, I should declare my position. I am within the age range of the women who participated in this study and as a woman who is postmenopause and has made use of Hormone Therapy I can claim some personal experience of the transition. This had some advantages during the interview process, especially when discussing sensitive issues such as changes to the body or reduction of libido. I felt that women were more likely to (a) talk to me rather than to a male or to a younger woman and (b) to be honest about their experiences and feelings because I am a woman of similar age and might be more likely to understand what is being said. On the other hand, there is a danger in being from the same stratum as the participants because I might be more likely to make assumptions about what is being said rather than probing more deeply or analysing statements objectively. To counter this tendency I pursued a number of strategies. I based all analysis in prior theory where this was available, I discussed analysis at each stage with my advisors, one of whom was a younger female and the other of whom was an older male, and I was systematic in the coding and interpretation of results. 65 Chapter 6: Analytical strategy Analytical approach to study 1 The aim of this study was to develop belief scales that measure the social constructions of menopause to be used in study 2 which was designed to assess the factors that predict symptom severity and treatment utilisation. Data cleaning was conducted and of the 160 women who completed the questionnaire, five were removed as more than 50% of the data was incomplete Symptom severity was measured using the MRS scales and sub-scales; these were created as described by Heinnemann et al (2004) Thirty two belief items were used based on previous literature on social constructions of menopause described in chapter 4. Women’s beliefs about menopause were described using descriptive statistics and a comparison of symptom experience according to menopause status was made using a oneway analysis of variance. Principal component analysis was used to reduce the data and to explore the psychometric properties of these new measures. Pearson product moment correlations were used to review associations between the new measures and the symptom sub-domains Analytical approach to study 2 A schematic of the analytical approach for study 2 is shown in Figure 6.1. Details of data preparation and preliminary analysis, reliability and validity checks are described below. Figure 6.1: Schematic of Analytical Strategy for Study 2 Data cleaning, data preparation on total 366 responses: All responses were checked for suitability for inclusion. Three hundred and sixty-six women filled in the questionnaire of which 148 were online responses. Three respondents who used pen and paper did not complete the questionnaire beyond 66 the first few pages and two were older than 60 years of age. From the online sample, three were ineligible because they were from overseas; five were unsuitable because they had either not gone beyond the landing page or not completed items beyond date of birth; nine had not responded beyond the Women’s Health Questionnaire and so there was no data on menstrual status, symptom reporting or psycho-social measures. These 22 respondents were excluded from the survey resulting in 344 participants (Table 6.1). A comparison of completers and non-completers on key variables (where possible) did not indicate significant differences. For example: age: t (138) = 0.491, p = 0.624; work status: Pearson χ2 (1) = 0.159, p = 0.690; level of education: Pearson χ2 (3) = 0.955, p = 0.582 Table 6.1: Sample Distribution by Response Mode and Sample Source Pen & paper Online Total 125 106 231 Clinical 93 20 113 TOTAL 218 126 344 Population The 218 pen and paper responses to the stage 1 questionnaire were entered twice to identify and correct miscoded items before combining with the online responses. The full data set of 344 eligible respondents was then reviewed for data entry issues and missing data. There were six pen and paper responses where a participant had turned over two pages at the same time and thus missed out an entire section but the remaining responses were valid and so these were included for analysis. Missing data per item were relatively low with most items having between 0 and 4 missing responses. The highest number was for the household income variable where 21 responses (6%) were missing. The next highest missing rate was seven (2%) in response to the question concerning sexual problems (which is part of the Menopause Rating Scale), one of the social support questions, ‘I get help when I am sick in bed’ and a question concerning response to negative situations on the Acceptance and Action Scale. Overall, the pattern of missing items was not cause for concern. It is worth noting that despite the fact that there is a general tendency for questionnaires to be online nowadays, 64% of responses to this study were pen and paper. Women seemed to prefer to use paper questionnaires for the WBIM study and many women contacted me by phone specifically requesting a paper version, even though they had details of the website and access to the internet. Similarly, many of the women contacted via the clinic preferred to do the questionnaire using pen and paper while they were in the waiting area. Checks were done to identify whether there were any conditioning effects as a result of answering the questionnaire online or on paper. To test to see whether response mode (RM) was having an influence on responses, a selection of key variables were regressed onto symptom scores (MRS) using response mode as an interaction term (Table 6.2). If response mode was conditioning responses we would expect to 67 see a significant moderation of responses on certain key variables. However, the interactions were not significant, indicating that response mode was not conditioning responses. Table 6.2: Selected Interaction Terms Regressed onto Symptom Severity (MRS) Interaction terms Cognitive flexibility x RM Perceived social support x RM Health wellbeing x RM B S.E. Sig. –0.046 0.106 0.664 1.810 3.590 0.729 –1.645 4.742 0.933 In order to ensure that women were experiencing menopause, a relatively wide age range from 40–60 years of age was surveyed. Thus, a proportion (15%) of the sample was premenopause: 40 from the general population and 11 from the clinic (Table 6.3). These women were not included in the main analysis that investigated predictors of treatment at menopause. Table 6.3: Sample Distribution by Menopause Status and Sample Source Population Clinical Total Premenopause 40 11 51 Perimenopause 67 15 82 Postmenopause 96 59 155 Surgical menopause 25 31 56 Total 231 113 344 Preparation of variables (items, scales and factors) for use in the analysis (n = 344): All items were explored in order to review distributions and central tendencies and to create the relevant scales or factors to be used in the correlation and regression analyses. This process allowed the identification of nonnormal distributions that would benefit from transformation or bootstrapping, and enabled data reduction that would result in greater reliability and more parsimonious analysis during path modelling (Kline, 2011, p. 102). The list of variables, data structure, central tendencies and the data consolidation approaches is shown in Appendix 6. The independent variables were organised into 4 major categories as described in Chapter 5. The dependent variables were symptom severity as measured by the MRS and treatment utilisation for any of the eleven MRS symptoms. Categories of treatment included medical, therapy, supplements, herbal remedies and changes to diet, and a composite scale of general treatment utilisation was created from these items. Details of this process will be discussed in the section that focuses on women who are peri- and postmenopausal, later in this chapter. 68 The validated scales were created for analysis purposes: the Menopause Rating Scale and the three sub-scales, the six sub-scales of the Women’s Health Questionnaire, the Duke Functional Support Scale, the Acceptance and Action Scale, and the ‘Big Five’ Personality Traits. New items were constructed to reduce the number of variables or factors to be used in the analysis: a Health wellbeing factor (HWB) and a Lifestyle factor. The composite Health wellbeing factor was created using a principal components analysis of life satisfaction (reversed), self-rated-health (reversed) and the 4 items from the Women’s Health Questionnaire that are used for the wellbeing subscale. These are reversed for the sub-scale and are ‘I still enjoy the things I used to’, ‘I have a good appetite’, ‘I have feelings of wellbeing’ and ‘I feel physically attractive’. Thus, low scores on this factor denote low levels of Health wellbeing. The Kaiser Meyer Olkin Measure of Sampling Adequacy was 0.823, indicating that these items were suitable for combining. Using this method each item is weighted according to its individual contribution. One factor was requested and the resulting distribution of scores was slightly negatively skewed (–0.634, SE of skew 0.144). The standardised HWB scale ranged from – 3.24 to 1.77. Similarly, the items recording frequency of smoking, drinking and exercising were combined into one composite lifestyle factor. Smoking was dichotomised into non-smokers and smokers, drinking was re-categorised to represent never or rarely drink (never or less than once a month), occasional drinkers (more than once a month and one or two days a week) and frequent drinkers (3 days a week or more). Exercise was categorised into four categories: never/rarely (never or less than once a month), occasionally (once or 2–3 times a month), often (2–5 times a week), and very often (6–7 days a week). These were subjected to a principal components analysis to create one weighted factor. This also had a slight negative skew (–0.718, SE of skew 0.143). The standardised Lifestyle scale ranged from –3.29 to 1.81 The social constructions of menopause were derived from the 32 belief items using Principal Components Analysis. The Kaiser Meyer Olkin Measure of Sampling Adequacy was 0.78 and the Bartlett’s Test of Sphericity was significant at p < 0.01 indicating that these items were suitable for factoring. Three-, four- and five-factor solutions were tested specifying a Varimax rotation with Kaiser normalisation and the retention of items with loadings of > 0.40. The five-factor solution described 53% of the variance and the three-factor solution described 41% of the variance. However, the three-factor solution was not easily interpretable and the fifth factor, which was comprised of three items, did not produce a reliable scale. Parallel analysis (Watkins, 2000) confirmed the decision to retain four factors as there were only four components with eigenvalues exceeding the corresponding criterion values for a randomly generated matrix of the same size (22 variables x 344 respondents). The four-factor solution explained 48% of the variance in the data and is shown in Table 6. 4. Component 1 represented the belief that menopause is associated with aging and becoming invisible. This factor was made up of five items including ‘Older women are not valued in our society’, and ‘After the menopause women become invisible in our society’. This accounted for 19% of the 69 variance and had a Cronbach’s alpha of 0.81. Component 2 represented a belief in postmenopausal recovery and was made up of six items including ‘After the menopause women have more time to do the things they always wanted to do’ and ‘A woman has more confidence in herself after menopause’. This explained 12% of the variance and had a Cronbach’s alpha of 0.71. Component 3 represented the idea that menopause is a condition that is amenable to treatment and was made up of five items including ‘A woman who experiences distressing menopausal symptoms should be on hormone replacement therapy’ and ‘Hormone replacement therapy is good for making sure that women do not get osteoporosis after the menopause’. This factor explained 9% of the variance in the data and had a Cronbach’s alpha of 0.77. The last component was a belief that menopause is an illness that changes women. This was comprised of six items including ‘At menopause most women will feel physically and emotionally unwell’ and ‘Women change a lot because of the menopause transition’. This factor explained 8% of the variance in the data and had a Cronbach’s Alpha of 0.76. These scales will be referred to as Invisible and Unvalued belief, Postmenopausal Recovery belief, Treatment belief and Illness belief respectively. All are normally distributed and a one-way analysis of variance (ANOVA) indicated that there was no significant difference between pre-, peri- and postmenopausal women with respect to holding these beliefs: Invisible and unvalued belief F (338) = 0.512, p = 0.600; Postmenopausal Recovery belief F (338) = 0.209, p = 0.811; Treatment belief F (338) = 0.739, p = 0.478; and Illness belief F (338) = 0.128, p = 0.880. 70 Table 6.4: Rotated Components Matrix of Items for the 4-factor Solution Showing Only Loadings of > 0.40 Component Older women are not valued in our society 1 0.847 After the menopause women become invisible in our society 0.808 The media is so obsessed with youth that it makes it very difficult for older women to get noticed Male partners of menopausal women regard them as less sexually desirable Older women are respected and valued for their knowledge and experience After the menopause women have more time to do the things they always wanted to do A woman has more confidence in herself after the menopause 0.780 2 3 4 0.602 -0.600 0.694 0.693 Life is more interesting for women after the menopause 0.673 At menopause there are so many things going on in a woman's life that she just doesn't have time to worry about these things Sexual interest and comfort increase following the menopause because women don't have to worry about pregnancy or contraception Women make too much of a fuss about the menopause; it is nothing out of the ordinary A woman who experiences distressing menopausal symptoms should be on HRT HRT is too dangerous for women to take for menopausal symptoms 0.549 0.514 0.414 0.739 -0.736 HRT is good for making sure that women do not get osteoporosis after the menopause HRT is good for women who want to maintain a health sex life 0.723 0.662 The menopause is natural and doctors should not be giving women drugs for it At menopause most women will feel physically and emotionally unwell 0.467 -0.595 0.718 Women change a lot because of the menopause transition 0.703 Women should expect to be ill at menopause because of a drop in estrogen Menopause is a mysterious thing which most women don't understand 0.617 When women reach menopause it is the beginning of getting old 0.530 The menopause is a big change in women's lives 0.498 0.546 % variance explained 19 12 9 8 Cronbach’s Alpha 0.81 0.71 0.77 0.76 Notes: Varimax rotation with Kaiser normalisation 71 Reliability and validity checks: The preparatory analysis above allowed for several validity and reliability checks. These were (a) comparison with WHQ, MRS and TIPI reference norms and (b) internal reliability checks: comparing some of the sub-scales of the WHQ (vasomotor scales, sleep scales, and anxiety and depression scales) with the MRS equivalent and comparing general treatment utilisation with treatment utilisation for menopause symptoms. There are reference norms in the UK for the 23-item Women’s Health Questionnaire published by the MAPI Research Trust (Lobo-Luppi & Fayol-Paget, 2004). This research was conducted with 1131 patients aged from 40 to 60 years and hence the data shown below (Table 6.5) is for the total sample and for the clinical sub-sample Table 6.5: WBIM Scores on the Women’s Health Questionnaire Sub-scales Compared with UK Reference Data WHQ, UK reference data n = 1131 patients Mean (SD) Anxiety, mood, depression Wellbeing Somatic symptoms Memory/concentration Vasomotor symptoms Sleep problems 72.55 (22.94) 66.03 (20.48) 58.88 (60.00) 57.11 (27.47) 59.60 (34.17) 55.77 (30.28) Median 76.19 66.67 60.00 55.56 66.67 50.00 Wellbeing in Midlife Survey n = 344 Clinical sample = 113 Total Mean (SD) Median Clinical Mean (SD) 68.17 (22.64) 71.43 64.24 (23.87) 66.66 69.32 (19.93) 66.66 68.89 (20.17) 66.66 54.92 (22.91) 53.33 53.33 (24.39) 53.33 54.93 (24.61) 58.33 50.81 (24.39) 53.33 54.15 (36.92) 50.00 51.21 (37.28) 50.00 50.69 (30.21) 50.00 49.70 (32.48) 50.00 Notes: Results are based on 1000 bias-corrected bootstrap samples. Clinical scores shown in italic Although the disparity between the data sets is not huge, the Wellbeing in Midlife (WBIM) sample had average scores that are lower than all those recorded in the MAPI UK reference data, apart from the score for wellbeing, which is slightly higher. This suggests that the women in the present study are healthier than the national study conducted by MAPI. The disparity is likely to be due to the fact that the WBIM study was not nationally representative and a large proportion of participants was drawn from either the London or Cambridge regions. It is known that on a range of health indices, the South of England performs better than other regions in the UK (“Health Profiles 2012”, 2012) 72 MAPI also provided scores by menopause status for women who were pre-, peri-and postmenopause. The pattern of symptom reporting for pre-, peri-, and postmenopausal women was the same for the MAPI and the WBIM data but, again, the scores for the WBIM sample were slightly lower (see Appendix 7). Taken together, these comparisons suggest that the WBIM sample may be slightly healthier than the women of this age in the general population. The Berlin Center for Epidemiology and Health Research (ZEG) also publishes reference norms for the Menopause Rating Scale. These are currently available on a Europe-wide basis. The WBIM scores were significantly higher on the MRS scales than the European reference data (Table 6.6). There is no data specific for the UK and the ZEG sample is very much larger. Table 6.6: Scores on the MRS and Sub-scales for Wellbeing in Midlife Survey Compared with European Population Reference Values Total score Psychological subscale Somatic sub-scale Urogenital subscale n Mean (SD) n Mean (SD) n Mean (SD) n Mean (SD) 4246 8.80 (7.10) 4453 3.40 (3.40) 4465 3.60 (2.90) 4465 1.90 (2.20) WBIM total 342 15.38 (8.33) 342 6.10 (3.90) 342 5.61 (3.40) 342 3.65 (2.85) WBIM pop. 230 14.25 (7.78) 230 5.50 (3.56) 230 5.39 (3.22) 230 3.35 (2.75) WBIM clinical 113 17.73 (8.94) 113 7.37 (7.00) 113 6.08 (3.71) 113 4.29 (2.97) Europe It is probable that there is some self-selection bias among the WBIM sample. However, it has been reported that there is wide variation between countries and regions. For example: “…the total, psychological and somatic scores are systematically higher in Latin America, and systematically (significantly) lower in Asia (Indonesia) than in Europe and North America. The urogenital scores are significantly lower in Latin America/Indonesia than in Europe/US. Obviously, the subjective perception of some prevalent symptoms depends on cultural factors – or the symptoms show real differences in prevalence. Thus, direct comparisons of MRS scores between Europe/North America on the one side and regions in Latin America and Asia should be considered with caution” (Berlin Center for Epidemiology & Health Research, 2013). Furthermore, it is not clear whether the differences are due to different perceptions of identical symptoms or whether the interpretation of symptom descriptions differs between countries. Thus, a degree of caution should be applied when comparing the European reference values with UK data. As we have seen, the WHQ scores for the WBIM survey and reference scores for the UK are similar and it may be that variation between countries is so large that a European wide sample is not a suitable benchmark. 73 The norms for the TIPI personality traits are published by gender and ethnicity for a US population (Rammstedt, 2007). There is concordance for all the personality traits except Agreeableness where the mean of the TIPI self-reported data is noticeably higher (p<.01). It is possible that this is because of desirability bias: US females may be more concerned about describing themselves as unsympathetic and cold or being thought to be critical and quarrelsome than UK females. Conversely, the WBIM sample may be less agreeable overall as a result of feeling less well at menopause. The TIPI data is not broken down by age group and so it is difficult to make direct comparisons. Table 6.7: Comparison of Means and Standard Deviations of the WBIM and TIPI Scores WBIM n = 344 TIPI female n = 1173 Mean SD Mean SD Extroversion 4.48 1.43 4.54 1.47 Agreeableness 4.20 1.18 5.32 1.11 Conscientiousness 5.48 1.17 5.51 1.11 Emotional stability 4.33 1.42 4.66 1.45 Openness 5.05 1.20 5.40 1.06 The Women’s Health Questionnaire asks some similar questions to the Menopause Rating Scale and hence internal reliability checks were possible (Table 6.8.). The correlation between the WHQ vasomotor scale and the MRS vasomotor symptoms is –0.722, between the WHQ sleep scale and the MRS sleep symptom is –0.707, and between the WHQ anxiety depression and mood and the MRS scores for depression and anxiety is –0.783 (the negative sign is an indication of the different direction of the scoring). These relatively high correlations between similar scales suggest that there is a good level of internal reliability and the disparities may in part be accounted for by the fact that the questions are asked in a different way and scored differently. A further internal reliability check was to correlate annual utilisation of medical, therapy and supplements with the use of these same categories of treatment for menopause-related symptoms. Annual usages of medical, therapy and supplements for any reason were combined into one factor and correlated with the use of medical, therapy, and supplements used for menopause symptoms. This analysis excluded the women who were premenopausal. The Pearson correlation coefficient was 0.282, which was not significant. This relatively low correlation suggests that women seek treatment for a range of conditions at this stage of life and that only a small proportion of treatments are for menopause symptoms. Furthermore, it confirms that women were specifically attributing categories of treatment for menopause and were not attributing treatments in a general way. 74 Table 6.8: Correlations between Scores on the WHQ and MRS Sub-scales WHQ vasomotor scale WHQ Sleep scale WHQ anxiety, depression and mood MRS Vasomotor question MRS sleep problems question WHQ vasomotor scale 1 WHQ Sleep scale 0.393 1 WHQ ADM scale 0.241 0.382 1 MRS vasomotor –0.722 –0.331 –0.174 1 MRS sleep problems –0.337 –0.707 –0.347 0.416 1 MRS anxiety, depressive mood –0.214 –0.257 –0.783 0.298 0.365 MRS anxiety & depressive mood 1 Note: Results are based on 1000 bias-corrected bootstrap samples. High correlations are in bold Analytical focus on the peri- and postmenopausal sample (n = 295) The preparatory analysis described above was conducted on the full sample of 344 women. However, the area of interest – level of treatment utilisation at menopause – was of relevance only to women who were peri- or postmenopause or who had entered menopause as a result of surgery due to an oophorectomy or treatment for breast cancer. Thus, the main analysis excluded premenopausal women. Developing the dependent variable: the treatment utilisation scale. Women were asked to indicate whether they had sought treatment from a medical practitioner, therapist, bought vitamin supplements, purchased herbal remedies or changed their diet for any of the 11 symptoms reported in the Menopause Rating Scale. The distribution of treatments for each symptom by category of treatment is shown in Table 6.9. There were some symptoms for which the majority of women had sought treatment: 51% of women had sought treatment for sleep problems and the same proportion had sought treatment for depressive mood; 48% of the sample had sought treatment for vasomotor symptoms. By comparison, only 20% had sought treatment for sexual problems and only 30% had sought treatment for vaginal dryness – both of which might be defined as problems of an intimate nature. 75 Table 6.9: Percentage of Women Ever Using a Category of Treatment for Menopause Symptoms (n = 295) Medical Therapy Supplements Herbal Diet None Sleep problems 24.7 9.4 11.1 23.3 17.8 48.8 Irritability 24.4 10.8 11.8 14.3 8.4 56.1 Heart discomfort 23.1 1.7 2.1 2.8 3.1 72.4 Physical/mental exhaustion Vaginal dryness 27.3 9.4 19.2 10.1 11.5 51.0 21.3 1.4 5.2 6.6 1.4 71.1 Vasomotor 38.7 5.3 12.0 13.4 8.5 51.6 Anxiety 28.4 9.5 7.0 9.5 5.3 59.6 Sexual problems 14.3 1.7 1.7 4.2 1.7 81.5 Bladder problems 20.1 2.1 1.8 2.8 3.5 76.4 Depressive mood 38.0 11.6 8.8 14.1 6.3 49.6 Joint/muscular discomfort 31.7 31.7 16.2 9.0 7.9 53.7 Note: These % values can sum to more than 100 in any column or row so are not in present form suited to contingency analysis Medical treatment was the most frequently used treatment category for all symptom categories. Women were most likely to seek medical help for vasomotor symptoms, depressive symptoms, and joint and muscular discomfort. Almost 40% of the sample had been to see a medical practitioner for hot flushes and night sweats. However, there were some symptoms where other categories of treatment utilisation were also quite prevalent, e.g., herbal remedies for sleep problems (23% of women) and supplements for physical and mental exhaustion (19% of women). The majority of women had sought some form of treatment at menopause: only 9% of the sample had not used a treatment of any kind for any symptom. The utilisation of treatments for menopause symptoms for this sample ranged from a minimum of 1 to a maximum of 39 and the mean number of treatments ever used was 6.2. Thus, the distribution was skewed to the lower end of the scale. As shown below (Table 6.10), medical and herbal treatments were the most likely to be used across all 11 symptom types. 76 Table 6.10: Mean Number of Treatments for Menopause Symptoms by Category of Treatment Mean SD Medical 2.88 2.66 Therapy 0.74 1.52 Supplements 0.96 1.62 Herbal remedies 1.09 1.88 Dietary change 0.74 1.61 It became apparent from the qualitative research that changes to diet tended to be non-specific, and women would often make dietary changes in a general way to lose weight, to feel better or in the hope of resolving a range of issues simultaneously (see Chapter 8). Correlational analyses that included dietary changes as a treatment category were also weaker: as a result, the further development of the scale excluded dietary changes as a treatment category due to lack of specificity. Therefore, the main focus for the overall treatment utilisation scale was biomedical treatments (defined as seeing a medical practitioner) and non-biomedical treatments (defined as using a therapist, purchasing supplements and purchasing herbal remedies). Biomedical treatment distribution. As noted above, seeing a medical practitioner was the most common category of treatment across all 11 symptom types. Three-quarters of the sample (76%) had sought one or more biomedical treatments and 24% had not had biomedical treatment for menopause symptoms. Two women had sought biomedical treatment for ten symptoms and one woman had sought biomedical treatment for all 11 symptom types. Figure 6.2 illustrates that the distribution was positively skewed: skew 0.762 (SE of skew 0.143); kurtosis –0.297 (SE of kurtosis 0.285). The standardised residuals were fairly normally distributed (skew of 0.38 and kurtosis of 0.069) and so this scale did not require transforming. 77 Figure 6.2: Frequency Distribution of Biomedical Treatments for Menopause Symptoms 80 70 Frequency 60 50 40 30 20 10 0 0 1 2 3 4 5 6 7 8 9 10 11 Number of medical treatments for menopause symptoms Non-biomedical treatment distribution (therapy, supplements and herbal remedies). The total possible number of non-biomedical treatments was 33 but the greatest number used was 23. Almost onequarter of the sample had not used a non-biomedical treatment for any of the 11 menopause-related symptoms. The distribution was highly kurtotic: kurtosis 5.823, SE of kurtosis 0.285 and even more skewed than the biomedical frequency distribution: skew 2.21, SE of skew 0.143 (Figure 6.3). The residuals were also non-normally distributed. A log transform was tested. This reduced the skew (skew 0.633, SE of skewness 0.143) and the level of kurtosis (–0.612, SE of kurtosis 0.285) but the transformation was not smooth and so was not suitable for analysis. The summed number of treatments of all non-biomedical types of treatment assumes additivity and equivalence of types. To see whether there were grounds for such additivity and to allow the covariance structure to determine the relative weighting, a principal components analysis was conducted to create a composite score for non-biomedical treatments. This standardises the scores and weights the relative contributions of the different treatment categories. If proven appropriate, the first principal component would be defined as underlying non-biomedical treatment utilisation, and will have improved the distributional properties for modelling. The three categories of treatment loaded onto one component. The Kaiser-Meyer-Olkin measure of sampling adequacy was 0.623 (above 0.60, which is considered acceptable for factoring), and the Bartlett’s test of Sphericity was also significant. The factor explained 62% of the variance and the coefficients loaded above 0.4: supplements 0.844, herbal remedies 0.831 and therapy treatments 0.674. The composite factor score of non-biomedical treatments suffered from the same problems of skew and kurtosis as before (skew of 2.22, kurtosis of 5.873) and once again log transformation resulted in a distribution that was not smooth. The composite non-biomedical variable was an improvement on the summed non-biomedical treatments with respect to reliability but 78 bootstrapping was necessary for analysis to obtain empirical confidence intervals for coefficients, and hence to do significance tests on them. Figure 6.3: Frequency Distribution of Non-Biomedical Treatments for Menopause Symptoms 120 100 Frequency 80 60 40 20 0 0 1 2 3 4 5 6 7 8 9 10 11 12 13 14 15 16 17 19 22 23 Number of non-biomedical treatments for menopause Overall treatment utilisation scale: The aim was to create a continuous measure of treatment utilisation as the outcome measure and to try to avoid dichotomising the measure as this has less power. As discussed above, the summed number of all treatments assumes additivity and equivalence of types. Therefore, rather than using the summed number of treatment categories (medical, therapy, supplements and herbal remedies), a principal component analysis was conducted to create a composite score of overall treatment utilisation as this standardised the scores and weighted the relative contributions for each treatment category. The Kaiser-Meyer-Olkin measure of sampling adequacy was 0.66, which was above the 0.60 acceptability for factoring, and the Bartlett’s test of Sphericity was significant. One principal component was requested, and this explained 52.48% of the variance. The four categories of treatments had coefficients above 0.4 and loaded onto the factor as follows: supplements 0.830, herbal remedies 0.785, therapeutic treatments 0.666 and biomedical treatments 0.505. 79 Figure 6.4: Frequency Distribution of Composite Factor of Overall Treatment Utilisation for Menopause Symptoms The scale range was from –0.907 to 5.091. The distribution of this factor was still skewed but less extreme than the biomedical and non-biomedical treatments separately (Figure 6.4), with skew 2.033, SE of skew 0.143; kurtosis 5.873; SE 0.285. Fitting independent variable predictors, especially any having similar skew, should further improve matters, but with such extreme skew it was certain that analyses would still need to be bootstrapped. Developing a coping strategy scale. The intention had been to develop a coping strategy measure from the responses to a series of questions about the previous day’s most bothersome event. Participants described the event, indicated whether they had experienced the event before and rated it on a scale of 1 (not bothersome at all) to 100 (very bothersome). To avoid using a lengthy checklist of coping strategies, the eight prototypical strategies from Stone and Neale’s (1984) measure of Daily Coping were used (see Chapter 5). The prototypical strategies were presented and participants were asked to check those used to cope with the bothersome event. The mean rating of the level of stress for the prior day’s event was 33.86 (SD 28.34). There was no significant difference between mean rating for the clinical (M 35.26, SD 27.86) and general population samples (M 33.24, SD 29.16) in terms of perceiving events as more or less bothersome: t (268) = –0.621, p = 0.535. Nor was there a significant difference in the mean number of coping strategies used by the clinical (M 3.28, SD 1.85) and general populations (M 2.89, SD 1.68) samples; t (280) = –1.773, p = 0.077. The total number of coping strategies (8) were summed and correlated with the total number of symptoms reported, the total number of treatments for menopause, and the AAQ measure of cognitive inflexibility. None of these correlations was significant. 80 A categorical factor analysis was run in order to investigate whether there was empirical evidence for a division into problem-focused and emotion-focused coping. Although the items loaded onto two dimensions, which together explained 41.4% of the variance in the data, they made little intuitive sense. Cronbach’s alpha scores for these dimensions were poor; dimension 1 was 0.576 and dimension 2 was 0.263, suggesting low internal validity. Furthermore, the biplot (Figure 6.5) indicated little evidence for two distinct categories of coping style. As a result, it was not possible to use the data on coping to construct a robust coping strategy scale. There are various possible explanations. A numerical scale may not be relevant because if a woman finds a strategy that has worked previously then she may not need to pursue other strategies. Another possibility was that the prior day’s events did not relate to menopause and were too heterogeneous. Matching strategies to categories of events might have been more useful but as these related to one day only, this approach was not followed. It was also the case that the coping strategies lacked specificity and so masked more appropriate and subtle responses. Figure 6.5: Biplot of Component Loadings for Eight Coping Strategies This issue of coping strategies was investigated in more detail in the interviews where it was possible to be precise about the events and specific about the coping strategies. Predictors and relationships between variables: Each variable in the data was explored and investigated for interrelationships. Preliminary analyses were conducted to compare responses by menopausal stages and to identify potential differences between the clinical and population samples. Variables were transformed or bootstrapped if data were not normally distributed. Pearson product moment correlations were used to identify relationships that could be significantly predictive of treatment propensity. 81 Multiple regression analyses were conducted on groupings of variables in the dataset, e.g., sociodemographics, symptom severity, social constructions, health and lifestyle factors and so on. This process identified the relative predictive power of several independent variables. Mediation and moderation effects were evaluated where appropriate. In order to gain a better understanding of the relationship between observed and latent variables, a Structural Equation Modelling (SEM) approach was used because this is an efficient way to describe the latent structure underlying a set of observed variables. A relatively large sample is required to optimise the dataset because if the sample is too small the results are unstable and cannot replicate. A general rule of thumb is that the minimum sample size should be no less than 200 or 5–20 times the number of parameters to be estimated, whichever is larger (Kline, 2011, pp. 111, 178). The sample of 295, with around 20 parameters to be estimated, was suitable for this approach as the sample size affords the opportunity from within the data to define the most revealing formulation of the variables. The goal of the SEM was to seek a set of coherent path links among constructs that would be amenable to a causal interpretation. SEM procedures are comprised of two models. The measurement model defines relationships between the latent and unobserved variables and specifies the pattern by which each measure loads onto a specific factor. The structural model defines relationships between latent variables and specifies how the latent variables directly or indirectly influence (cause) the changes in values of other latent variables in the model (Byrne 2010, p.13). In the WBIM study, the measurement model weighted the different types of health care uptake (biomedical and non-biomedical treatments) to represent an underlying treatment utilisation factor, weighted the different types of symptoms (somatic, psychological and urogenital) to represent an underlying symptom severity factor, and weighted different aspects of health and wellbeing (self-rated general health, life satisfaction and four items from the Wellbeing scale of the WHQ) to represent an underlying Health wellbeing factor. Structural equation models are expressed diagrammatically and mathematically via a set of regression equations. They are comprised of a series of regression (structural) equations where each equation summarises the impact of all variables (observed and unobserved) on a specific variable (in this case overall treatment utilisation). They are schematically portrayed using a series of symbols which are, by convention, oval icons for unobserved (latent) factors and rectangular icons for observed (measured) variables. Residual errors are included in the prediction of unobserved factors. The data is represented as a model + residual where the data are the observed variables (in this case the WBIM variables), the model is the hypothesised structure of the relationship between variables and the residual is the discrepancy between the two. The statistical assumptions of multiple regression are that residuals are normally distributed and have uniform variances across all levels of predictor. As we have already discussed, the main outcome variable violated the assumption of normality. As a result bootstrapping was used as it is one of the 82 methods recommended in conditions of severe non-normality and for sample sizes ≥ 200 (Kline, 2011, p. 177). The AMOS program cannot deal with missing values when using the bootstrap function. There were relatively few missing values in this dataset and so these were imputed by replacing them with the mean values. Once the model is specified, the model testing procedure evaluates the goodness-of-fit between the hypothesised model and the data. There are several tests of goodness-of-fit measures and by convention there are various threshold criteria used to evaluate how well the model fits the data. For example, if the Comparative Fit Index (CFI) has values of above 0.95 the model is considered to be a good fit (Hu & Bentler, 1999). For the Root Mean Square Error of Approximation (RMSEA), values of < 0.06 indicate a model that is a good fit to the data (Hu & Bentler, 1999) though values as high as 0.8 may be considered reasonable errors of approximation (Byrne, 2010, p. 80). The detailed approaches and findings are discussed in the results section. Analytical approach for study 3 Objectives: the purpose of study 3 was to explore how women’s beliefs about menopause are located within their social context and to relate this to uptake of biomedical and non-biomedical treatments Comparison of volunteers and non-volunteers:. One hundred and ninety-four women (53% of the participants at stage 1) from study 2 volunteered for study 3. Ninety-six women declined to participate and 54 women did not complete this question. There were no significant differences between the volunteers and non-volunteers with respect to selected items including scores on the Menopause Rating Scale, believing that menopause is an illness and perceived social support, or on the AAQ (cognitive flexibility). However, there was a difference with respect to the uptake of treatments. Volunteers were more likely to have sought more treatments for menopause-related symptoms on average. Volunteers had a higher level of treatment utilisation overall (M 7.54, SD 0.67) compared with non-volunteers (M 5.40 SD 4.18): t (222) = 3.22 (equal variances not assumed), p < 0.001, CI95 [0.84, 3.44]. Thus, volunteers for study 3 had used more treatments (though had not necessarily experienced more intense symptoms). Women were identified from study 2 for inclusion at this stage. A range of high to low treatment utilisers was selected. Thematic analysis was used to analyse the data. Transcripts were read and re-read and analysed using Atlas.ti. 6.2. Codes were developed using an inductive and deductive approach. A coding audit was performed with another researcher, and differences were debated and codes amended after discussion. Families of codes were identified using measures of ‘groundedness’ and were further integrated to identify higher order concepts. Networks of codes were identified using network analysis. Constant comparison was used to identify inconsistencies in the data and the findings from study 3 were reviewed in the context of results from study 2. 83 Chapter 7: Study 1- development of new measures to assess women’s beliefs about menopause The social constructions described in Chapter 4 were taken from the literature and were derived from focus groups, analyses of the media, medical texts or patient leaflets. Most of the studies were qualitative and few specifically asked women about their beliefs and, as Ayers et al (2010) noted, there were few studies that explicitly investigated the relationships between attitudes and symptoms. There are no scales that identify the prevalence of these beliefs among women of menopausal age in the UK. Aims: 1. To develop new measures of belief about menopause based upon the existing literature 2. To explore their psychometric properties 3. To describe women’s beliefs about the menopause Sample and recruitment Women aged between 40 and 60 years of age were recruited between May and June 2011. Participants were recruited from women’s groups, volunteer staff at museums in Cambridge, the Minority Ethnic Network for the East of England, Housing Association staff, gyms, leafleting at Race for Life meetings, leaflets in places where women congregate (public lavatories, pubs, supermarkets) in Cambridge, Stevenage, and London. The survey was made available online and on paper. One hundred and sixty women responded to the questionnaire, of which 155 were completed online. Incomplete surveys, where a large proportion (50% or more) of the questionnaire was not filled in were removed, leaving 149 responses. The average age of the women recruited was 51.2 years (SD= 4.76). Despite efforts to reach a more diverse audience, the sample was predominantly white, well-educated and married with children (Table 7.1) 84 Table 7.1: Characteristics of Sample in Study 1(n=149) Educational level % Marital status % No qualification 4 Single, never married 9 School level 20 Married or cohabiting 74 Degree level 58 Separated or divorced 15 Professional e.g. nurse 18 Widowed 1 Employment status Number of children delivered Working full time 56 None 19 Working part time 33 1-2 58 Retired /not employed 9 3-5 23 Student 2 Ethnicity Menstrual status White 92 Premenopausal 18 Mixed race 1 Perimenopausal 24 Asian or Asian British 6 Postmenopausal 47 Chinese 1 Surgical menopause 11 Never 85 Used but not currently 11 Current user 4 HT usage Choice of instruments Menopausal status: Menopausal status was determined using WHO criteria whereby premenopause was defined as currently menstruating or using birth control, perimenopause was defined as experiencing noticeable changes in the length, duration or amount of flow in the menstrual cycle and postmenopause was defined as not having a menstrual cycle in the last 12 months (not because of birth control pills) (Utian, 2004) Belief scale items: The 32-items developed for the belief scales were based on the research described earlier and represent the different discourses in Table 4.1. In addition, items were added to represent concerns about aging and feelings of being invisible in society as identified in research by Rubinstein and Foster (2012). All the items were measured on a Likert scale from 1 (strongly disbelieve) to 7 (strongly believe). Symptom severity: Prevalence and intensity of symptoms were determined using the Menopause Rating Scale. Attribution of symptoms to menopause was also reported. 85 Data analysis The data were analysed in the following ways: 1. Comparison of symptom ratings between pre-, peri- and postmenopausal women with oneway analysis of variance. 2. Descriptive statistics were used to describe women’s beliefs about the menopause 3. Psychometrics properties of the new measures using factor analysis and Cronbach’s Alpha All data were analysed using SPSS 19. Results Eighteen per cent of the sample was premenopausal (either using contraception or having regular periods), 24% were perimenopausal (experiencing irregular or heavy periods), 47 % were postmenopausal (not menstruated for more than 12 months) and 11% had surgical menopause. Only 3% of this sample reported no symptoms at all, with 27% reporting 1-2 symptoms, 25% reporting 3-4 symptoms, 35% reporting 6-7 symptoms, and 11% reported 8-9 symptoms. Sleep problems, exhaustion and vasomotor symptoms were common among this sample. Sleep problems, physical and mental exhaustion, and vasomotor symptoms were reported as being the most severe and apart from irritability, all these symptoms were more prevalent among postmenopausal women (Figure 7.1). There was some indication that premenopausal women also reported some symptoms associated with menopause including hot flushes and night sweats and dryness of the vagina. Nonetheless, in keeping with previous research, incidences of reporting these symptoms are higher in the peri- and postmenopausal groups. Figure 7.1: Percentage of Women Reporting Symptoms by Menopause Stage pre peri post 100 80 60 % 40 20 0 Notes: sample sizes for some groups are small. Premenopause = 27, perimenopause = 36, postmenopause = 86 86 The mean intensity of symptoms was higher in the peri- and postmenopause groups compared with premenopausal women. The intensity of sleep problems, exhaustion, anxiety, bladder problems, joint & muscular discomfort and vasomotor symptoms were significantly higher among postmenopausal women though women in perimenopause reported higher mean symptoms for irritability, dryness of the vagina and sexual problems. The differences with respect to sleep problems and exhaustion may be related to the experience of vasomotor symptoms as night sweats could affect sleeping patterns that results in tiredness during the day (Table 7.2). Post hoc comparisons indicated the following: differences in sleep problems were significant between pre- and postmenopausal women (p<0.001); differences in physical and mental exhaustion were significant between pre- and perimenopausal women (p=0.016), and between pre- and postmenopausal women (p=0.001); differences with respect to dryness of the vagina were significant between pre- and postmenopausal women (p=0.002); differences in vasomotor symptoms were significant between preand postmenopausal women (p<0.001) and there were significant differences with respect to sexual problems between pre- and postmenopausal women (p =0.019). Table 7.2: One Way Analysis of Variance to Compare Menopause Status Groups by Symptom Intensity. Mean intensity of symptom reporting Pre Peri Post f Sig. Eta2 Sleep problems (difficulty falling asleep, difficulty in sleeping through, waking up early) .81 1.39 1.78 7.91 .001 0.1 Irritability (feeling nervous, inner tension, feeling aggressive) 1.89 1.22 1.00 .991 .374 NA Physical and mental exhaustion (general decrease in performance, impaired memory, decrease in concentration, forgetfulness) .74 1.44 1.51 6.60 .002 .085 Dryness of vagina (sensation of dryness or burning in the vagina, difficulty in sexual intercourse) .37 1.72 1.21 6.78 .002 .087 Hot flushes or sweating (episodes of sweating) .44 1.14 1.63 10.29 .000 .127 Anxiety (inner restlessness, feeling panicky) .67 1.92 2.00 1.04 .358 NA Sexual problems (change in sexual desire, in sexual activity and satisfaction) 1.63 1.83 1.34 4.9 .009 NA Bladder problems (difficulty in urinating, increased need to urinate, bladder incontinence) .56 .75 .91 1.7 .186 NA Joint and muscular discomfort (pain in joints, rheumatoid complaints) .85 .81 1.05 .88 .419 NA Notes: Eta squared values of .06 are medium effect size, and above .14 large effect size (Cohen 1988: 284-277) 87 Beliefs about menopause In this sample, 90% of women believed the statement ‘There is nothing unusual about menopause, it is just another stage of life’ and 87% believed that ‘the menopause is a big change in women’s lives’. Thus, women depicted menopause as a natural but significant developmental phase (Table 7.3). Other items also received majority support. For example, 84% believed that ‘women should consider changing their diet and exercise more at menopause’ and 83% believed that ‘every woman experiences menopause in a different way and there is no one expert to go to’. This reflects the discourse that focuses on self-management and personal responsibility for one’s own health during menopause. Women did not believe that ‘health professionals think that menopause is an illness because they want to control women’ (73% disagreed) but were divided in their opinion as to whether or not doctors are experts; 41% believed and 35% did not believe that doctors are ‘experts when it comes to offering good advice about menopause’. Seventy percent of women believed that ‘there are lots of natural remedies that women can use to help them get through the menopause’ suggesting that they may prefer to find their own solutions to problematic symptoms. There was some indication that women were unsure about who is authoritative about menopause; 83% believed that ‘doctors don’t know everything about menopause’ Table 7.3: Beliefs about Menopause Belief items Mean % neither/nor 24 % believe 4.05 % disbelieve 35 Doctors are the experts when it comes to offering good advice on the menopause Women should expect to be ill at menopause because of a drop in estrogen 2.65 69 16 15 Hormone replacement therapy is good for delaying the signs of aging 3.72 36 36 28 There is nothing unusual about menopause; it is just another stage of life 6.06 6 4 90 Health professionals think that menopause is an illness because they want to control women 2.51 73 13 14 If women feel ill during menopause it is up to them to manage their own health 3.81 44 15 41 At menopause most women will feel physically and emotionally unwell 3.97 39 19 42 When women reach menopause it is the beginning of getting old 4.04 36 11 53 Women change a lot because of the menopause transition 3.92 36 22 42 It is changes to women's hormones that causes all the problems at menopause and there is nothing that they can do about it 3.19 65 10 25 88 41 Belief items Mean % neither/nor 36 % believe 4.07 % disbelieve 26 Hormone Replacement Therapy is good for making sure that women do not get osteoporosis after the menopause There are lots of natural remedies that women can use to help them get through the menopause 5.01 10 20 70 The menopause is natural and doctors should not be giving women drugs for it 3.72 45 24 31 Women should consider changing their diet and do more exercise when they reach the menopause 5.48 5 11 84 After the menopause women become invisible in our society 3.49 53 7 40 Male partners of menopausal women regard them as less sexually desirable 3.21 54 23 33 Every woman experiences the menopause in a different way and there is no one expert to go to 5.58 8 9 83 At menopause there are so many things going on in a woman's life that she just doesn't have time to worry about these things 3.84 37 26 37 Women don't know what to believe because there are too many different and conflicting views about the menopause 4.78 15 18 67 Hormone Replacement Therapy is too dangerous for women to take for menopausal symptoms 3.85 35 36 29 The menopause is a big change in women's lives 5.35 10 3 87 Sexual interest and comfort increase following the menopause because women don't have to worry about pregnancy or contraception 3.97 30 34 36 Older women are not valued in our society 4.1 44 7 49 After the menopause women have more time to do the things they always wanted to do 3.56 42 32 26 Women get fat and change their shape when they go through the menopause 4.16 30 25 45 Women make too much of a fuss about the menopause; it is nothing out of the ordinary 3.49 53 21 36 The media is so obsessed with youth that it makes it very difficult for older women to get noticed 4.75 24 10 66 Women often find their memory gets much worse during menopause 4.65 13 35 52 A woman who experiences distressing menopausal symptoms should be on Hormone Replacement Therapy 3.94 25 47 28 Even doctors don't know everything about menopause so women should do whatever they think is right 4.99 15 16 69 89 38 Belief items Mean Older women are respected and valued for their knowledge and experience 4.3 % disbelieve 32 Hormone Replacement Therapy is good for women who want to maintain a health sex life 3.76 24 % neither/nor 18 % believe 58 18 50 Women’s views about hormone therapy were also divided as the items referring to HT showed the largest proportion of ‘neither believe nor disbelieve’ responses. Nevertheless, a substantial number of women believed that HT helps to prevent osteoporosis, can delay the signs of aging and helps women to maintain a good sex life; 18% - 38% of women believed these statements. In contrast, almost one-third (29%) believed that ‘Hormone replacement therapy is too dangerous for women to take for menopausal symptoms’ Data reduction to identify social constructions of menopause A principal components analysis was run using a Varimax rotation, selecting for components of > 0.4. The scree plot indicated a break at 5 components. These explained 45.48% of the total variance in the data. Parallel analysis using MonteCarlo PCA (Watkins, 2000) supported the 5-Component solution: there were 5 components with Eigen values exceeding the corresponding criterion values for a randomly generated data matrix of the same size (32 items x 149 respondents) (see Table 7.4). Component 1 comprised 5 items and accounted for 15.8% of the variance with a Cronbach’s Alpha of 0.82, Component 2 comprised 5 items and accounted for 9.6% of the variance with a Cronbach’s Alpha of 0.73, Component 3 comprised 5 items and accounted for 7.0% of the variance with a Cronbach’s Alpha of 0.62, Component 4 comprised 7 items and accounted for 6.7% of the variance in the data with a Cronbach’s Alpha of 0.70 and, Component 5 comprised 6 items and accounted for 6.5% of the variance in the data with a Cronbach’s Alpha of 0.59. Components 1 to 4 reached reasonable scale reliability levels but component 5 was well below the acceptable level for a robust scale. Component 1 achieved a high reliability and represented a construction of menopause as rendering menopausal women as invisible and unvalued by society. The 5 items in this construct are the same as in the Invisible and Unvalued belief scale used in the final WBIM study. This construct is robust and appears to have good test-retest reliability. Component 2 also achieved scale reliability and represented a construction that represented menopause as a big change that makes women ill. This was similar to the Illness belief in the WBIM study. The same items were evident in study 2. However, the item ‘It is changes to women’s hormones that cause all the problems and there is nothing they can do about it’ did not load onto the component in study 2 and was not used in the final Illness belief scale. Component 3 had a slightly lower reliability score and was the opposite of component 2 in that it represented a construction of menopause as a natural phenomenon. Items in this component included 90 ‘Women make too much of a fuss about menopause, it is nothing out of the ordinary’ and ‘Sexual interest and comfort increase following the menopause because women don’t have to worry about contraception’. The items in this scale were similar, but not identical to the final Postmenopausal Recovery scale used in study 2 (see Chapter 8 for detail). Component 4 achieved reliability and represented a Treatment belief. The items in this scale were similar to those in the WBIM study and included ‘HRT is good for making sure that women do not get osteoporosis’ and ‘HRT is good for women who want to maintain a healthy sex life’. One item did not load onto this scale in study 2; this was ‘Women should consider changing their diet and do more exercise when they reach menopause’ and hence this was omitted in the final scale. Component 5 failed to achieve reliability, though it did incorporate some of the questions that reflected confusion. For example, ‘Even doctors don’t know everything about menopause so women should do whatever they think is right’ and ‘Women don’t know what to believe because there are so many conflicting views’. A confusion construction also failed to emerge in the WBIM study and the reasons for this are discussed in detail in Chapters 10. Table 7.4: Rotated Components Matrix of Items for the 5-factor Solution 1 2 3 4 5 Invisible Illness Recovery Treatment Confusion After the menopause women become invisible in our society .859 .111 .019 .043 .071 The media is so obsessed with youth that it makes it very difficult for older women to get noticed .804 .088 .055 .036 -.037 Older women are not valued in our society .795 .142 -.164 -.021 .037 Older women are respected and valued for their knowledge and experience -.665 .043 .323 .056 .068 Male partners of menopausal women regard them as less sexually desirable .592 .176 .012 .172 .051 Women get fat and change their shape when they go through the menopause .319 .315 -.031 .129 .285 At menopause most women will feel physically and emotionally unwell .152 .767 -.102 -.094 .006 Women should expect to be ill at menopause because of a drop in estrogen .133 .722 .016 .076 -.119 Women change a lot because of the menopause transition .245 .640 -.230 .185 .115 It is changes to women’s’ hormones that causes all the problems and there is -.075 .449 .032 .052 -.012 91 1 2 3 4 5 Invisible Illness Recovery Treatment Confusion When women reach the menopause it is the beginning of getting old .324 .415 -.075 .160 .161 Women often find their memory gets much worse during menopause .159 .333 -.323 -.041 .047 Women make too much of a fuss about menopause; it is nothing out of the ordinary -.069 -.180 .651 -103 .123 Sexual interest and comfort increase -.073 .040 .623 .013 -.176 At menopause there are so many things going on in a woman’s life that she just doesn’t have time to worry about these things -.013 -.323 .554 -.035 .250 After the menopause women have more time to do the things that they always wanted to do .025 .199 .536 -.125 -.117 The menopause is a big change in women’s lives .182 .436 -.497 .093 .084 Health professionals think that the menopause is an illness because they want to control women .293 -.196 .393 -.009 .266 There is nothing unusual about menopause it is just another stage of life -.183 -.074 .266 -.068 -.171 A woman who experiences distressing menopausal symptoms should be on Hormone Replacement Therapy (HRT) .107 -.062 .054 .787 .005 HRT is good for women who want to maintain a healthy sex life .164 .179 .102 .757 .058 The menopause is natural and doctors should not be giving women drugs for it .124 -.031 .333 -603 .390 HRT is good for making sure that women do not get osteoporosis after the menopause .039 .186 -.161 .483 .184 HRT is good for delaying the signs of aging .181 .212 -.019 .459 .123 Women should consider changing their diet and do more exercise when they reach menopause .141 .253 .222 -.426 .068 HRT is too dangerous for women to take for menopausal symptoms .092 .091 .250 -.414 .328 Even doctors don’t know everything about menopause so women should do .060 -.078 -.161 .104 .728 nothing that they can do about it following the menopause because women don’t have to worry about pregnancy or contraception 92 1 2 3 4 5 Invisible Illness Recovery Treatment Confusion Every woman experiences the menopause in a different way and there is no one expert to go to -.027 -.075 .100 .045 .703 Doctors are the experts when it comes to offering advice on the menopause -.155 .255 .338 .252 -.500 If women feel during menopause it is up to them to manage their own health -.147 .268 .350 -.104 .475 Women don’t know what to believe because there are too many conflicting views about the menopause .155 .177 -.172 .134 .436 There are lots of natural remedies that women can use to help them to get through the menopause -.260 .295 .046 -.193 .405 .82 .73 .62 .70 .59 % variance explained 15.77 9.60 7.00 6.68 6.53 Eigen values 5.05 3.07 2.24 2.14 2.09 whatever they think is right Cronbach’s Alpha On the basis of this analysis, some questions were excluded from the WBIM study and new ones were added. Items which failed to load onto any component were removed: these included ‘Women often find that their memory gets worse during menopause’, ‘Women get fat and change their shape when they go through menopause’, and ‘Health professionals think that the menopause is an illness because they want to control women. New items were added to reflect previous research by Neugarten et al (1964) and in particular to ensure that positive attitudes to menopause could be reflected. These included ‘Menopause is a mysterious thing which women don’t understand’, ‘Life is more interesting for women after the menopause’ and ‘A woman has more confidence in herself after the menopause’. The final belief scale items with their psychometric properties used in the WBIM for Study 2 are shown in Table 6.4. A Pearson’s product moment correlation was conducted between the symptom sub-groups of the menopause rating scale and the four most robust constructs (table 7.5) 93 Table 7.5: Pearson Product Moment Correlations between Symptom Sub-groups and Social Constructions Psychological Somatic Urogenital Invisible & unvalued belief .272** .260* .166* Illness belief .348** .427** .193 Recovery belief -.381** -.396** -.217 Treatment belief -.007 .072 .026 Notes: *p<.05 ** p<.01 There was a significant positive relationship between feeling invisible and unvalued and thinking that the menopause is an illness and reporting psychological symptoms (irritability, anxiety and exhaustion), somatic symptoms (vasomotor, sleep problems and joint problems) and urogenital symptoms (bladder, sexual problems, and dryness of the vagina). Believing in postmenopausal recovery has a significant negative association with psychological symptoms and somatic symptoms but not urogenital symptoms Discussion Symptom reporting was prevalent across all menopausal statuses with higher levels of severity reported by postmenopausal women for most symptoms. Women’s beliefs about menopause are multifaceted and contradictory with a degree of confusion and uncertainty apparent. However, the principal components analysis indicated the presence of four constructs and one emergent construct. The four constructs portrayed menopause as rendering women invisible and unvalued, as an illness, as a period of change after which there is recovery and as amenable to treatment. A possible emergent construct related to menopause as a time confusion and confliction was also evident. The preliminary survey did not support all the constructions identified in the literature and some discourses were rejected by women. For example, the feminist discourse which portrays doctors as oppressing and controlling women was not supported. A discourse where doctors are the experts was not evident and the discourse of menopause as confusion was indicated but did not result in a robust construct. There was no evidence of an explicitly anti-hormone replacement discourse. Most women agreed that menopause is natural but views about hormone therapy were mixed. There was some indication that the confusion discourse is embryonic and Component 5 appeared to reflect this. However, it did not emerge as a reliable latent variable despite the fact that a majority of women (67%) of respondents believed that ‘women don’t know what to believe because there are too many different and conflicting views about the menopause’. Thus, there were four prevalent social constructions of menopause among this sample as follows: 94 Construct 1 represented menopause as a symbol of being unvalued and invisible. Menopause, which is symbolic of aging, is constructed as a time when women become invisible, unvalued and less desirable. Our society routinely undervalues older people (Cuddy, Norton & Fiske 2005) and if these associations trigger negative schema of aging there may be an impact on women’s perceptions of symptoms. This was reflected in the significant correlations between this construct and all three symptom domains. Construct 2 represented menopause as an illness that changes women and a time when women should expect to feel unwell. This belief was also significantly positively related to symptom domains. Thus, perceiving menopause as an illness is associated with perceived higher severity of psychological, somatic and urogenital symptoms. However, the direction of this association is unclear as experiencing more severe symptoms could contribute to a stronger belief that menopause is an illness. This is explored further in studies 2 and 3. Construct 3 represented menopause as being amenable to treatment with hormone therapy. In this construction HT is viewed as a panacea for a wide range of possible ailments caused by the decline in estrogen. This construction incorporates the idea that replacing lost estrogen will delay the signs of aging, have a positive effect on osteoporosis, and help to maintain a healthy sex life. This construction did not correlate significantly with symptom experiences in study 1. Construct 4 construed menopause more positively suggesting a postmenopausal recovery: items included ‘after menopause women have more time to do what they always want to do’, ‘menopause is nothing out of the ordinary’, and ‘sexual interest and comfort increase’. Nevertheless, the construction of menopause as a period of declining estrogen which leads to illness is deeply embedded in how women think about this transition, regardless of menopausal stage. Both the illness and treatment constructs were supportive of the dominant biomedical view. The social constructions described above, indicate that the label ‘menopause’, for some (though not all) women, contains an expectation of being unwell and is associated with a series of anticipated symptoms such as hot flushes, tiredness and irritability. Individual differences in terms of the cognitive schema which women hold about menopause (the beliefs contained in each of the constructs) are likely to contribute to their perception of symptom severity. Two of the constructs in this study were sub-optimal with Cronbach Alpha scores below the threshold of 0.7. Hence, some items were omitted and new ones introduced in study 2. As described in chapter 6, the changes that were made in study 2 resulted in four robust components (Cronbach Alpha above 0.7) and these confirmed the four constructs described above. 95 Summary of key findings: The principal components analysis indicated the presence of four constructs representing beliefs about menopause as a symbol of invisibility, menopause as an illness, menopause as amenable to treatment with HT and menopause as a temporary phase after which there is postmenopausal recovery. There appeared to be one emergent construct which might represent the confusion discourse. The ‘master narrative’ of menopause as biomedical is supported as was the concept of menopause as a symbol of old age. Women’s beliefs about menopause can be multiple and contradictory Beliefs about menopause were significantly correlated with symptom severity 96 Chapter 8: Study 2: Quantitative study to assess predictors of symptom severity and treatment utilisation Objectives: 1. To compare the general population and clinical groups 2. To assess which factors predict symptom severity during menopause 3. To assess which factors predict treatment utilisation during menopause 4. To identify mediators and moderators of treatment utilisation 5. To explore the pathways to treatment Specific treatment utilisation hypotheses were: 1. Women who rate higher for treatment utilisation for menopause symptoms will be more likely to construct menopause as pathological and to associate menopause as a symbol of aging. 2. Women who rate lower for treatment utilisation for menopause symptoms will be more likely to construct menopause as a natural lifestage. 3. Women who rate higher for treatment utilisation will have fewer coping strategies, score lower on emotional stability and higher on the measure of cognitive inflexibility. The rationale for the selection of measurement instruments is described in detail in Chapter 5: Methods. Validated scales were selected, the social construction scales were developed and piloted in study 2 and the outcome measure, treatment utilisation was specifically developed for this study. The data were analysed in the following ways: i) Descriptive statistics to describe general health wellbeing, symptom prevalence, attribution of symptoms to menopause and to compare women of different menopausal status ii) Logistic regression was used to identify predictors of being in the clinical sample iii) Bivariate and multivariate hierarchical regression were used assess which factors were predictive of symptom severity and of treatment utilisation iv) Structural equation modelling was used to explore the pathways to treatment mediation and moderation analysis Recruitment of participants: The recruitment process is described in detail in Chapter 5. Participants were recruited via adverts in GP surgeries in Cambridge and London and from two specialist menopause clinics in London hospitals. The questionnaire could be accessed online or completed on pen and paper. Questionnaires which were more than 50% incomplete were excluded from the analysis. 97 Sample characteristics: The sociodemographic characteristics of the sample are shown in Table 8.1. The sample has a bias towards the higher income groups and 42% had a degree or higher degree. This may reflect the sample locations: income levels are higher in the south of England and Cambridge is a university town. Despite recruiting from Nottingham, which has a higher level of working class and ethnic populations, the sample was predominantly white, and biased towards the better educated and households with higher income levels. Discussion with some of the GP practice managers in Nottingham indicated that it is particularly difficult to get women from ethnic minorities to participate in this type of research. One practice manager reported that she ‘had tried many times to get Asian women to fill in questionnaires at the surgery’ but either their English was poor or they preferred not to participate. Table 8.1: Characteristics of the Sample (n = 295) Age 41 to 60 years Mean 52.38 (SD = 5.08) Ethnicity White 93% Mixed race 2% Asian origin 2% Black 2% Chinese or other 1% Low (no qualifications /GCSE or equivalent) 26% Medium (A level or equivalent) 32% High (degree or above or equivalent) 42% Socioeconomic Salaried 34% status* Intermediate 38% Working class 11% Not in paid employment 15% Single (never married) 12% Married or cohabiting 66% Divorced/separated/widowed 22% Not given birth 33% Given birth 67% Work full time 48% Work Part-time 33% Not working (retired/student/unemployed) 19% Low (< £19,999) 21.0% Medium (£20,000–£39,999) 26.4% High (£40.000–£59,999) 21.0% Very high (< £60,000 25.0% Own 81% Rent 19% Education level Marital status Given birth Work status Household Income Home ownership Note: * SEC based on European Socioeconomic classification (Harrison & Rose, 2006) 98 The sample was predominantly White British and there were an insufficient number of women in the sample to represent different ethnicities. It is known that there are cultural differences with respect to symptom reporting and attitudes to menopause (Avis & Crawford, 2008) but there were too few women of different ethnicities to be able to conduct analysis of these groups separately. Two hundred and ninety five peri- and postmenopausal answered questions on sociodemographics, lifestyle and general health, menopause experience and attitudes, and social and cognitive factors. Twenty-nine per cent were in perimenopause, 53% were postmenopause and 18% had a surgical menopause as a result of a hysterectomy or treatment for cancer. Table 8.2 shows the sample source Table 8.2. Sample by Category and Source Population Clinical Total Perimenopausal 69 16 85 Postmenopausal 95 60 155 Surgical menopause 25 28 53 Total 189 104 295 A Chi-squared test indicated that there were significantly fewer women who were perimenopausal in the clinical sample than expected (17 observed compared with an expected count of 31) and significantly more of the clinical sample had surgical menopause (28 observed compared with an expected count of 19) χ2 (2) = 16.48, p < 0.001. It has been reported elsewhere that women who experience surgical menopause often experience higher levels of symptom reporting than those who experience natural menopause and this may account for their greater representation in the clinic (Avis et al., 2001). Descriptive statistics The main areas of interest were general levels of health and wellbeing, prevalence and severity of reporting menopausal symptoms, the extent to which these were attributed to menopause, usage of hormone therapy and an understanding of the main attitudes to the menopause transition. In addition, it was important to understand whether there were any significant differences on these measures between women of different menopausal status. General health and wellbeing: The Health wellbeing variable was a composite score of self-rated general health, life satisfaction and the four wellbeing items of the Women’s Health Questionnaire. Higher scores denote higher levels of health wellbeing. The distribution indicated a slight negative skew as most people reported good levels of health and satisfaction: skew –0.634 (SE of skew 0.144), kurtosis 0.304 (SE of kurtosis 0.304). One-way ANOVA indicated that there were no significant differences between women of different menopausal status: F (2, 283) = 0.295, p =0.745. 99 Fifty-six women reported having had a hysterectomy or oophorectomy, 29 had treatment for cancer (of whom 15 had breast cancer) and 75 reported an illness for which they had to see a physician regularly e.g., irritable bowel syndrome, asthma. One hundred and ninety women (52%) did not report any illnesses. One-quarter of women in perimenopause reported an illness that might impact on their experience of menopause compared with 46% of women at postmenopause. By definition, women who had undergone surgical menopause had had an operation that could induce symptoms or could exacerbate existing menopause symptoms. Symptom reporting: The most commonly reported symptoms across the total sample were physical and mental exhaustion and sleep problems and the least reported were vaginal dryness and heart discomfort (Figure 8.1). However, there were some symptoms where women reported higher levels of severity overall, e.g., sexual problems (40% described them as severe or very severe), sleep problems (36% described them as severe or very severe) and vasomotor symptoms (35% described them as severe or very severe). In contrast, only 12% of women reported heart discomfort that was severe or very severe. Figure 8.1: Frequency and Severity of Menopause Symptoms % experiencing 100 90 80 70 60 % 50 40 30 20 10 0 88 28 86 81 36 75 35 22 % severe or very severe 75 30 70 68 64 40 25 20 62 29 58 52 33 12 As described in Chapter 5, these individual symptoms were combined into an overall Menopause Rating Scale by summing the severity rating for each item from 0 (none) to 4 (very severe). The three sub-scales were calculated similarly: the somato-vegetative domain is comprised of scores for sleep problems, heart discomfort, vasomotor symptoms, and joint and muscular discomfort; the psychological domain is comprised of scores for irritability, physical and mental exhaustion, anxiety and depressive mood and the urogenital domain is comprised of scores for sexual problems, vaginal dryness and bladder problems. The sub-scales will be used for the remainder of the analysis and will be referred to as the Somatic MRS, the Psychological MRS and the Urogenital MRS, respectively. 100 The possible ranges of the scales were 0–44 for the overall MRS, 0–16 for both the Somatic MRS and Psychological MRS and 0–12 for the Urogenital MRS. The average rating for the overall MRS was 16.09 (SD 8.26), for the psychological MRS the mean was 6.26 (SD 3.96), for the somatic MRS the mean was 5.90 (SD 3.33), and for the urogenital MRS the mean was 3.94 (SD 2.85). All the scales were normally distributed. There were some differences according to menopausal status, as can be seen in Figure 8.2 below. Figure 8.2: Mean Severity of Menopause Symptom Domains by Menopause Status Somatic Psychological Urogenital 8 Mean symptom severity 7 6 5 4 3 2 1 0 Peri Post Surgical Menopause status Women who were postmenopause reported higher severity of symptoms overall and higher severity for the somatic and psychological domains. Women who had a surgical menopause reported higher symptom severity in the urogenital domain. Perimenopausal women reported a slightly higher mean level of psychological symptoms than women in postmenopause and there is a steep increase in the mean level of symptom severity from peri- to postmenopause for urogenital symptoms. The differences in severity rating between women of different menopausal status were statistically significant for the urogenital domain [F (2, 288) = 7.353, p = 0.001] and somatic domain [F (2, 288) = 3.032, p = 0.05] but not for the psychological domain [F (2, 288) = 0.991, p = 0.373]. Post-hoc comparisons revealed that the significant differences were between women in peri- and surgical menopause with respect to somatic symptoms but the difference was not significant between post- and surgical menopause. In the urogenital domain there were significant differences between periand postmenopausal women, between women in peri- and surgical menopause and between women in postmenopause and surgical menopause (Table 8.3). 101 Table 8.3.: Post-Hoc Comparisons of Menopause Status on the Somatic and Urogenital MRS Sub-scales 95% Confidence Interval Menopause status Somatic MRS peri post Urogenital Peri MRS post surgical SE Sig. Lower Upper post –0.74582 0.453 0.302 –1.84 0.35 surgical –1.37947* 0.570 0.048 –2.75 –0.007 0.74582 0.453 0.302 –0.35 1.83 –0.63364 0.511 0.650 –1.87 0.59 peri 1.37947* 0.570 0.048 0.007 2.75 post 0.63364 0.512 0.650 0-.59 1.86 post –1.29702* 0.383 0.002 –2.22 –0.38 surgical –1.58804* 0.482 0.003 –2.75 –0.43 peri –1.29702* 0.383 0.002 0.38 2.21 surgical –0.29102 0.432 1.000 –1.33 0.75 peri 1.58804* 0.487 0.003 0.43 2.75 post 0.29102 0.432 1.000 –0.75 1.33 peri surgical surgical Mean Difference Note: * The mean difference is significant at the 0.05 level. Bonferroni-corrected Attribution of symptoms: The symptom list that was used represented the most commonly reported symptoms at menopause but in the majority of studies women are not asked whether they attribute them to menopause. In the WBIM questionnaire women were asked about attribution immediately after rating symptom severity. It was possible for all 11 symptoms to be attributed to menopause and indeed, 23 women did so. Of the 295 women in the sample, 90% attributed one or more symptoms to menopause and the average number attributed was 5.4 (SD 3.47) (Figure 8.3) There were clear differences between women of different menopausal status: perimenopausal women attributed 4.42 symptoms on average, postmenopausal women attributed 5.76 symptoms on average and women who had undergone surgical menopause attributed 5.97 symptoms on average to menopause. This does not seem surprising: women who are just entering menopause may not be as knowledgeable as women who have already had some years of experience, and women who have had a surgical menopause are usually warned by the clinical team that there is a greater risk of experiencing symptoms as a result of treatment. It is also possible that when postmenopausal women look back on the experience they tend to attribute more symptoms. One-way ANOVA indicated that these differences were significant: F (2, 268) = 4.646, p = 0.01. Post-hoc comparisons also indicated that the differences between peri- and postmenopausal women and between peri- and surgical menopause were significant at the p < 0.05 level, though the difference between postmenopausal women and women who had undergone 102 surgical menopause was not significant. This suggests that as women go through the menopause transition they become more likely to attribute changes to menopause, whereas women at the beginning of the transition may be less certain about attribution. Figure 8.3: Frequency Distribution of Symptoms Attributed to Menopause 35 30 Count 25 20 15 10 5 0 0 1 2 3 4 5 6 7 8 9 10 11 Number of symptoms attributed to menopause Usage of hormone therapy: More than half the sample (57%) had never used hormone therapy, 15% were ex-users and 28% currently used it. Thus, a relatively high proportion (43%) of women had experience of hormone therapy. This figure may have been boosted because of the clinical sample. This will be discussed later in the chapter. Table 8.4: Prevalence of Hormone Therapy Usage by Menopause Status Perimenopause Postmenopause Surgical menopause Never used HT 68 81 18 Ex-user of HT 4 28 44 Current user of HT 10 45 27 Total 82 154 89 It is evident that a larger proportion of the women who had surgical menopause were ex-users or current users of hormone therapy (80%) (Table 8.4.). Women who have had a hysterectomy or oophorectomy are usually offered hormone therapy either because they are below the median age of menopause or the operation precipitates an early menopause or because the abrupt cessation of estrogen increases symptom severity, especially severity of vasomotor symptoms. Attitudes to menopause: There were 32 belief statements in the questionnaire measured on a scale from 0 (strongly disbelieve) to 7 (strongly believe). It is worth looking at the responses to some specific questions before discussing the four social constructions. 103 Thirty-seven per cent of the sample did not believe that ‘Doctors are experts when it comes to offering advice on the menopause’, and 62% believed that ‘Even doctors don’t know everything about menopause, so women should do whatever they think is right’. The concern about advice from the medical profession is echoed in the response to the question ‘If women feel ill during menopause it is up to them to manage their own health’: 32% of the sample believed this statement to be true. The implication is that, for a significant minority, the medical profession were not considered to be the best source of information and support. The reason for this may be that women consider that ‘The menopause is natural and women should not be giving women drugs for it’ and indeed, 64 % of participants agreed with this statement, although a sizeable proportion (36%) believed that ‘A woman who experiences distressing menopausal symptoms should be on hormone replacement therapy’. Women’s beliefs about menopause are often ambiguous and women can hold contradictory ideas simultaneously. These themes are discussed in more detail in the sections on the medical encounter and social constructions in Chapter 8. As described in Chapter 6, the individual belief statements were data reduced using principal components analysis, which resulted in four robust social constructions scales. These were defined as the Invisible and Unvalued belief, a Treatment belief, an Illness belief and a Postmenopausal Recovery belief. All four scales had a Gaussian distribution and an ANOVA indicated that there were no significant differences between women of different menopausal status: Invisible and unvalued belief F (2, 292) = 0.413, p = 0.662; Postmenopausal Recovery belief F (2, 292) = 0.604, p = 0.531; Treatment belief F (2, 292) = 2.269, p = 0.105; and Illness belief F (2, 292) = 0.223, p = 0.800. There was no differentiation by menopause status in terms of the way menopause was represented, e.g., women who were peri- or postmenopause were as likely as women who had undergone surgical menopause to believe that menopause was an illness. Women who had surgical menopause were as likely as women who were perior postmenopause to believe in postmenopausal recovery. Comparison of clinical and general population: There were significant differences between the clinical and general population samples with respect to overall levels of symptom severity and treatment utilisation, with the clinical sample rating significantly higher on these measures (Table 8.5). The clinical sample was significantly more likely to report higher symptom severity on the MRS and on the psychological and the urogenital sub-scales of the MRS, though there were no differences between the groups in terms of reporting somatic symptoms. There were also no significant differences between the groups with respect to overall Health wellbeing. The clinical sample was significantly more likely to attribute more symptoms to menopause and to hold a treatment belief whereas the general population sample was more likely to believe in postmenopausal recovery. Within this context the clinical sample rated significantly higher on all categories of treatment utilisation than the general population sample and rated lower on emotional stability than the general population sample, though there were no differences between the groups with 104 respect to the related construct, cognitive inflexibility. The general population sample scored significantly lower on extroversion. Table 8.4: Comparison of Clinical and General Population Sample on Key Variables 95% confidence intervals Mean diff. Lower Upper t (df) Sig. Total MRS –2.964 –5.024 –0.904 –2.839 (185) 0.005 Psych MRS –1.715 –2.644 –0.784 –3.427 (185) 0.001 Somatic MRS –0.427 –1.226 0.373 –0.997 (185) 0.294 0.344 –1.500 –1.452 –2.390 (291) 0.017 Summed attribution –1.332 –2.195 –0.469 –3.039 (271) 0.003 Health wellbeing 0.0578 –0.186 0.302 0.466 (285) 0.641 Invisible & Unvalued belief –0.229 –0.543 0.086 –1.430 (293) 0.154 Illness belief –0.211 –0.482 0.0424 –1.654 (181) 0.100 Treatment belief –0.794 1.05 –0.543 –6.163 (293) 0.001 Post recovery belief 0.560 0.337 0.783 4.940 (293) 0.001 Overall treatments* –0.671 –0.943 –0.404 –4.978 (140) 0.001 Biomedical treatments* –1.678 –2.247 –1.023 –5.369 (288) 0.001 Non-biomedical treatments* –0.567 –0.853 –0.277 –4.150 (142) 0.001 Cognitive inflexibility –1.102 1.025 –3.119 –1.076 (290) 0.283 Extroversion –0.347 –0.679 –0.0145 –2.054 (290) 0.041 Agreeableness 0.114 0.122 –0.125 0.936 (290) 0.350 Conscientiousness 0.152 0.144 –0.131 1.056 (290) 0.292 Emotional stability 0.352 0.005 0.698 1.998 (290) 0.047 –0.249 –0.537 0.038 –1.707 (290) 0.089 Urogenital MRS Openness to experience Notes: * 1000 bias-corrected bootstrap samples were used for utilisation scales, which are not normally distributed. Significant differences are in bold It is unsurprising that the clinical sample were more likely to be current users of hormone therapy (57% compared with 27% of the general population sample) and a greater proportion of the population sample were never users (73% had never used HT compared with 23% of the clinical sample) (Figure 8.4.). This is because being referred to a clinic is more likely to result in a prescription for hormones and, as discussed below, the use of HT was a major predictor of being in the clinical sample. 105 Figure 8.5: Usage of Hormone Therapy by Sample Source % using Hormone Therapy General population Clinical 80 70 60 50 40 30 20 10 0 Never used Ex-user Category of user User There are relatively few specialist menopause clinics in the UK and it is possible that members of the general population sample are similar to the clinic sample with respect to symptom severity and need for treatment but are unable to get this type of medical care. To investigate how many women in the general population sample were similar to the clinic sample, a backward logistic regression was conducted with clinical or population sample as the outcome variable. Independent variables used were age, menopause status, use of HT, overall treatment utilisation, general Health wellbeing, symptom severity, cognitive inflexibility, social support and the four social constructions. The variables that were significantly predictive of group membership were usage of hormone therapy, overall level of treatment utilisation, menstrual status, a belief in postmenopausal recovery, and age (Table 8.6). These variables correctly classified 86% of the population sample but only 62% of the clinical sample. If women were attending a clinic they were approximately four times more likely to be using HT and almost twice as likely to score more highly on overall treatment utilisation. Women recruited from the general population were 0.7 times more likely to believe in Postmenopausal Recovery. It is interesting to note that the level of symptom severity was not predictive of membership and a relatively large proportion of the clinical sample (38%) was misclassified. This suggests that although there were differences there was also some overlap between these two groups and there may be a sizeable proportion of women (14%) in the general population who might want specialised treatment but are unable to access it. Attending a clinic increases the probability that hormone therapy will be prescribed and therefore usage of HT was considered to be an outcome of biomedical treatment rather than a predictor of it. 106 Table 8.6: Results of Logistic Regression to Predict Membership of Clinical or General Population Sample 95% CI for odds ratio Sig. Odds ratio B SE Intercept 3.917 1.802 0.030 Ever use HT 1.442 0.318 0.000 2.269 4.229 7.882 Overall treatment utilisation 0.603 0.172 0.000 1.304 1.828 2.562 Postmenopausal recovery –0.351 0.165 0.033 0.509 0.704 0.972 Perimenopause 0a 0a 0.016 Postmenopause –1.385 0.486 0.004 0.097 0.250 0.648 Surgical menopause –0.408 0.381 0.284 0.315 0.665 1.403 Age –0.068 0.034 0.049 0.874 0.935 1.000 Lower Upper Notes: The overall pseudo-R2 for the model is given as between 27% (Cox and Snell) and 37% (Nagelkerke). a This parameter is set to zero so is redundant Intercorrelations between the main continuous independent variables: There were indications of strong relationships between variables as shown in Table 8.7. Only the stronger relationships with correlations of above 0.40 will be discussed. The Menopause Rating Scale was positively correlated with the number of attributions (r = 0.530), cognitive inflexibility (r = 0.476) and the belief that menopause is an illness (r = 0.408) and negatively correlated with Health wellbeing (r = –0.549), and emotional stability (r = –0.466). Thus, believing that menopause is an illness, attributing more symptoms to menopause and being cognitively inflexible were associated with reporting higher symptom severity and being more emotionally stable, and having better Health wellbeing was associated with lower levels of symptom severity. Health wellbeing was positively correlated with emotional stability (r = 0.402) and social support (r = 0.402), and negatively correlated with cognitive inflexibility (r = –0.542). Cognitive inflexibility was also negatively associated with emotional stability (r = –0.558). Therefore, better Health wellbeing was associated with higher levels of social support and greater emotional stability whereas lower levels of Health wellbeing were associated with higher levels of cognitive inflexibility. Finally, rating lower on emotional stability was associated with being less cognitively flexible. 107 Table 8.7: Pearson Product-Moment Correlations between the Main Independent Variables in the Wellbeing in Midlife Questionnaire Social constructions Age MRS Attribut- HWB ion Life- AAQ Belief 1 Personality constructs Belief 2 Belief 3 Belief 4 DFSQ Trait 1 Trait 2 Trait 3 Trait 4 style Age 1 MRS -.067 1 Attribution .103 .530** 1 Health wellbeing .140* -.549** -.069 1 Lifestyle -.072 .236** .009 -.332** 1 AAQ -.087 .476** .180* -.542** .216** 1 Belief 1 .019 .258** .074 -.282** .141* .284** 1 Belief 2 .161** -.278** -.228** .257** .042 -.184** .130* 1 Belief 3 -.011 .132* .112 -.086 .006 .139* .046 -.344** 1 Belief 4 .144* .408** .355** .267** .135* .329** .277** -.182** .214** 1 .040 .220** -.028 .440** .142* -.405** .272** .048 -.095 .-.148* 1 Extroversion .062 -.092 .063 .293** -.101 -.284** .142* .055 -.019 .066 -.195** 1 Agreeableness .092 .142* -.023 .143* -.095 -.215** .143* .013 -.004 -.156** -.131* .012 1 Conscientiousness .056 -.228** -.085 .312** -.238** -.372** -.180** -.040 -.058 -.157** -.208** .059 .189** 1 Emotional stability .072 -.466** .129* .402** -.164* -.558** -.325** .059 -.147* -.297** -.318** .155** .347** .340** 1 Open to experience .062 -.050 .058 .181** -.168** -.182* -.035 .002 .005 .005 .103 .337** .062 .034 .057 Social support1 Trait 5 Notes: Attribution = summed number of symptoms attributed to menopause; MRS = Menopause Rating Scale; HWB = Health wellbeing; Lifestyle = composite score of self-rated health, life satisfaction and four wellbeing items; AAQ = Action and Acceptance Questionnaire measure of cognitive inflexibility; Belief 1= invisible and unvalued belief; Belief 2 = Postmenopausal Recovery belief; Belief 3 = Treatment Belief; Belief 4 = Illness belief; DFSQ = Duke Functional Support Questionnaire I(analysis using 1000 bootstrap bias-corrected samples due to non-normality); Trait 1 = Extroversion; Trait 2 = Agreeableness; Trait 3 = Conscientiousness; Trait 4 = Emotional Stability; Trait 5 = Open to Experience; * significant at p < 0.05 (2-tailed), ** significant at p < 0.01(2-tailed) 108 1 Predictors of symptom severity A hierarchical multiple regression analysis with the total Menopause Rating Scale as the dependent variable was run as follows: Step 1: sociodemographic variables (age, income, education) Step 2: menopause status and attributions, Step 3: Social constructions, Step 4: Personality traits, and Step 5: Health and wellbeing variables5 (Table 8.8.). Changes to the model were significant at each step and adjusted R2explained 61% of the variance in the data. The tolerance and VIF collinearity statistics did not indicate any major problems with multicollinearity. Of the sociodemographic variables a medium level of education was predictive of lower levels of symptom severity and a high level of education was almost predictive. Intermediate socioeconomic status was also predictive of higher levels of symptom severity. It has been reported previously that there is a tendency for better educated women with more disposable income to make better use of treatment services as they constitute the ‘worried well’ (Brashers, 2001). There was little evidence of this among this sample. It is possible that better off women seek out and use private health services because provision of specialist services for menopause is not uniformly available. In-keeping with previous research, surgical menopause was predictive of higher levels of symptom severity, as was making more attributions of symptoms to menopause. It is possible that some women are more inclined than others to attribute all changes experienced to menopause rather than attributing them to other causes. It is also possible that seeing a doctor reinforces the belief that all changes at this time of life can be attributed to menopause. This will be explored further in Chapter 9. Both cognitive inflexibility and emotional instability were predictive of higher levels of symptom severity. None of the other personality traits were predictive. Thus, women who were more sensitive to change and who were less able to adapt to the changes were more likely to perceive that the symptoms they experienced at menopause were severe. Finally, reporting higher overall levels of Health wellbeing predicted lower levels of symptom severity whereas having had treatment for cancer (breast or other kinds) was predictive of higher levels of symptom severity. 5 Perceived social support was added at step 6 but was not a significant predictor and did not improve the model R2 and hence was not used in the final model as shown in Table .8.8 109 Table 8.8: Multiple Hierarchical Regression of Predictors of Symptom Severity 95% confidence intervals Intercept Step 1 Age in years Education High Medium Low Income High Medium Low Socioeconomic status Working class Intermediate Salaried Not in paid employment B SE Sig. Lower Upper 18.192 5.425 .001 7.506 28.877 -.003 .100 .975 -.200 .194 -2.659 -3.461 0a 1.359 1.369 0a .052 .012 -5.335 -6.158 .018 -.763 -1.281 .740 0a -.1281 .740 0a .319 .602 -3.808 -2.056 1.246 3.537 -.862 3.162 -1.022 0a 1.792 1.359 1.351 0a .631 .021 .450 -4.393 .484 -3.682 2.669 5.839 1.639 Adj. R2 0.061 Step 2 Menopause status Peri Post Surgical Attributions to menopause 0a 1.844 3.417 1.275 0a 1.101 1.343 .125 .088 .020 .000 -.285 .501 1.029 4.054 5.793 1.522 0.359 Step 3 Invisible & Unvalued belief 1.189 .324 .000 .551 1.828 Postmen. Recovery belief -1.074 .464 .021 -1.981 -.160 Treatment belief .142 .391 .716 -.627 .912 Illness belief .572 .463 .218 -.340 1.485 0.414 Step 4 AAQ Extroversion .16 -.053 .059 .295 .007 .856 .044 -.634 .276 .527 .388 .390 .321 -.381 1.156 Conscientiousness -.165 .341 .629 -.838 .507 Emotional stability -1.341 .339 .000 -2.008 -.673 .333 .338 .325 -.333 .999 Agreeableness Openness to experience 0.508 Step 5 Health wellbeing -2.367 .448 .000 -3.251 -1.484 Lifestyle -.347 .357 .331 -1.050 .356 Prior illnesses Chronic Hysterectomy/ooph Cancer BMI 3.681 2.400 2.940 .002 .448 1.461 1.378 .002 .000 .102 .034 .361 1.953 -.478 .226 -.002 5408 5.279 5.655 .005 0.609 110 Predictors of treatment utilisation The main candidates for potential predictors of treatment utilisation used were the same as for predictors of symptoms severity: sociodemographic variables, menopause status, symptom severity, health and lifestyle factors, social support, personality characteristics and social cognitions. The use of hormone therapy was not used as a potential predictor variable because earlier analysis suggested that this was most likely to be the outcome of attending a clinic rather that being a predictor of treatment. These groups of variables were first evaluated in stages before putting those that were most predictive into a full regression model. Moderators and mediators of treatment were also investigated. In addition, the same variables were used to investigate predictors of symptom severity prior to investigating pathways to treatment utilisation. A multiple regression analysis was conducted for each of the groups of variables onto the dependent variables; overall treatment utilisation, biomedical treatment utilisation and non-biomedical treatment utilisation. All regressions were on 1000 bias-corrected samples. Sociodemographic factors: Age, social class, income, education, marital status and whether given birth to children were regressed in blocks onto each of the dependent variables. The collinearity statistics indicated that there were no problems with respect to multi-collinearity: none of the variance inflation values (VIF) were greater than 10 and the average VIF was not substantially greater than 1 (Bowerman & O’Connell, 1990). All the tolerance statistics (1/VIF) were above 0.2 (Menard 1995). The majority of the sociodemographic variables were not predictive of treatment utilisation although being intermediate socioeconomic status was significantly predictive of biomedical and nonbiomedical treatment utilisation and hence, of overall treatment utilisation. The other significant demographic predictor of biomedical treatment was medium level income and this was only just significant at p = 0.045. In order to make the comparisons easier to read, only 95% Confidence Intervals and the significance level are shown in Table 8.9. Details for B values and standard errors are in Appendix 11. Given findings from other research, it is perhaps surprising that sociodemographic factors are relatively unimportant. There seemed to be an inverted ‘U’-shaped function with respect to seeking treatment: women in intermediate socioeconomic groups, in medium income households and medium levels of education sought higher levels of treatment. This is hard to explain but it could be the result of having a sample that is comparatively wealthy. Two of the social constructions predicted symptom severity: believing that at menopause women become invisible and unvalued predicted higher levels of symptom severity, whereas believing in postmenopausal recovery predicted lower levels of symptom severity. It is hard to be sure of the direction of this association: being symptomatic may reinforce feelings of low value, and being asymptomatic or experiencing low severity may reinforce ideas about postmenopausal recovery. We 111 have seen that postmenopausal recovery also mediated between symptom severity and non-biomedical treatment utilisation so it is also possible that the decisions about the category of treatment to use have a reinforcing effect on these beliefs. These ideas will be explored in Chapter 9 Table 8.9: Hierarchical Multiple Regression Analyses of Predictors of Overall, Biomedical and Nonbiomedical Treatment Utilisation from Sociodemographic Variables Categories of treatment Predictors Intercept Step 1 Age in years1 Step 2 Social class Working class Intermediate Salaried Not in paid employment Step 3 Overall treatment Biomedical treatment Non-biomedical utilisation utilisation treatment utilisation 95% CI Sig. 95% CI Sig. .700 2.235 .310 -.960 5.477 .149 -.041 .012 .291 -.052 .078 .804 -.522 .083 .160 -.135 .678 .287 .926 .002 .358 -.192 .341 .599 -1.00 Ref 95% CI 2.386 .250 -.043 .008 .236 .478 -.479 .074 .165 2.157 .002 .229 .835 .002 .624 .616 -.183 .382 .499 Ref -.531 Sig. Ref Income2 High -.481 .163 .340 -1.256 .437 .301 -.450 .164 .431 Medium -.369 .363 .997 -1.727 .009 .045 -.305 .493 .656 Low Ref Ref Ref Education3 High -.349 .368 .956 -1.266 .378 .290 -.260 .365 .731 Medium -.255 .401 .705 -1.622 .187 .114 -.172 .489 .387 Low Step 4 Ref Ref Ref Marital status Married/cohabiting -.419 .700 .703 -1.595 .495 .378 -.398 .776 .554 Divorced/widowed/separ. -.437 .078 .166 -.881 .656 .694 -.432 .053 .143 .395 .418 Single/never married Ref Ref Ref Children Given birth to children Not given birth Adj R2 -.242 .307 Ref .785 -1.388 Ref .070 .095 -.185 Ref Overall .072; Biomedical .072, Non-biomedical .060 Notes: Unless otherwise stated bootstrap results are based on 1000 bias-corrected samples. p values are 2-tailed Ref = reference; 1age at 01.09.2012; 2low household income <£20,000, medium household income £20,000–£39,999, high household income >£40,000; 3low education level: none, GCSE or equivalent, medium education level: ‘A’ level or equivalent, high education level: degree or postgraduate degree Menopausal status: the three menopausal stages – peri-, post- and surgical menopause were regressed onto each of the dependent variables (Table 8.10.). Menopausal status was not predictive of overall treatment utilisation although being postmenopause almost reached significance. Nor was menopausal status predictive of non-biomedical treatment utilisation. However, being postmenopause and having had a surgical menopause was predictive of seeking biomedical treatments. Having had a 112 surgical menopause (either due to hysterectomy or oophorectomy) often necessitates more frequent medical consultations and symptom severity tends to be greater in postmenopause than in perimenopause. Nevertheless, adjusted R2 suggests that the effect of menopause status on treatment utilisation was relatively small. Table 8.10: Multiple Regression Analyses of Predictors of Overall, Biomedical and Non-biomedical Treatment Utilisation from Menopausal Status 95% confidence intervals B SE Sig. Lower Upper -.146 .088 .104 -.309 .044 Perimenopause 0a 0a Postmenopause .233 .122 .058 -.010 .472 Surgical menopause .128 .165 .463 -.146 .423 2.084 .238 .001 1.590 2.506 Perimenopause 0a 0a Postmenopause 1.103 .321 .003 .421 1.768 Surgical menopause 1.367 .444 .003 .475 2.233 -.075 .094 .449 -.243 .096 Perimenopause 0a 0a Postmenopause .144 .133 .291 -.099 .409 -.003 .167 .985 -.320 .327 Overall Intercept Biomedical Intercept Non-biomedical Intercept Surgical menopause Adjusted R2 Overall treatment utilisation = .003, biomedical treatment utilisation = .034, non-biomedical treatment utilisation =.002 Notes: Unless otherwise stated, bootstrap results are based on 1000 bias-corrected samples. a This parameter is set to zero so is redundant Menopausal status was only predictive of biomedical treatment utilisation. This was reflected in the mean number of medical treatments for each group: at perimenopause M = 2.13 (SD 2.207), compared with M= 3.10 (SD 2.787) postmenopause and M = 3.36 (SD 2.773) after surgical menopause. These differences were significant [F (2) = 4.752, p =0.009] and post-hoc comparisons indicated that differences between peri- and postmenopausal women and between peri- and surgical menopause were significant but that the difference was not significant between postmenopause and surgical menopause (Table 8.11). 113 Table 8.11: Results of ANOVA to Compare Medical Treatment Utilisation by Menopausal Status Mean SE Sig. 95% confidence interval. difference Peri vs. post Lower Upper -.980 .325 .022 -1.670 -.220 Peri vs. surgical -1.232 .449 .023 -2.107 -.370 Post vs. surgical -.253 .438 1.000 -1.089 .506 Note: Unless otherwise stated bootstrap results are based on 1000 bias-corrected samples. Bonferroni-corrected The implication is that it might be possible to collapse the post- and surgical menopause categories so that there are only two categories (peri- and postmenopause) for the purposes of path modelling. When the groups were collapsed in this way the difference between peri- and postmenopause in terms of predicting biomedical treatments remained significant. Symptom severity and attribution of symptoms to menopause. The Menopause Rating Scale (MRS) measured the severity of symptoms from 0 (no symptom) to 4 (very severe symptom). The 11 symptom types were also categorised into psychological, somatic and urogenital sub-scales. The total MRS and the sub-scales were investigated as well as the total number of symptoms attributed to menopause. Symptom severity was a highly significant predictor of all categories of treatment utilisation, especially biomedical treatments. In fact, the MRS explained 30% of the variance in biomedical treatment utilisation but only 12% of the variance in non-biomedical treatment utilisation. However, the number of symptoms attributed was not a predictor of treatment uptake when symptom severity was held constant (Table 8.12). 114 Table 8.12: Hierarchical Multiple Regression Analyses of Predictors of Overall, Biomedical and Nonbiomedical Treatment Utilisation from Symptom Severity 95% confidence intervals Overall Intercept SE Sig. Lower Upper -.894 .133 .001 -1.179 -.641 Step1 Total MRS .057 .009 .001 .039 .076 Step 2 Total attributions .013 .019 .485 -.025 .048 Intercept .000 .256 1.000 -.484 .498 Step 1 Total MRS .181 .017 .001 .146 .217 Step 2 Total attributions -.040 .046 .408 -.131 .051 Intercept -.691 .139 .001 -1.004 -.382 Biomedical Non-biomedical Adjusted R2 1 B Step 1 Total MRS .044 .010 .001 .027 .061 Step 2 Total attributions .019 .019 -338 -.020 .052 Overall treatment utilisation =.198, biomedical treatment utilisation = .298 non-biomedical treatment utilisation = .119 Notes: Unless otherwise stated bootstrap results are based on 1000 bias-corrected samples. 1Total MRS = summed score of the Menopause Rating Scale When the sub-scales were investigated separately, it was the psychological sub-scale that was significantly predictive of overall, biomedical and non-biomedical treatments (Table 8.13). In addition, the urogenital sub-scale significantly contributed to the uptake of biomedical treatments. Perhaps surprisingly, somatic symptoms, which include vasomotor symptoms and joint pains, did not predict any category of treatment utilisation 115 Table 8.13: Multiple Regression Analyses of Predictors of Overall, Biomedical and Non-biomedical Treatment Utilisation from Menopause Rating Sub-scales 95% confidence intervals Overall B SE Sig. Lower Upper -.865 .123 .001 -1.118 -.614 Psychological MRS .076 .018 .001 .043 .109 Somatic MRS .038 .024 .115 -.011 .083 Urogenital MRS .042 .022 .061 .001 .089 Intercept .039 .244 .873 -.395 .513 Psychological MRS .225 .039 .001 .143 .298 Somatic MRS .102 .055 .071 -.016 .208 Urogenital MRS .213 .049 .001 .109 .338 -.663 .126 .001 -.922 -.396 Psychological MRS .061 .018 .003 .026 .099 Somatic MRS .032 .026 .213 -.018 .081 Urogenital MRS .024 .023 .301 -.020 .063 Intercept Biomedical Non-biomedical Adjusted R2 Intercept Overall treatment utilisation =.206 biomedical treatment utilisation = .306 non-biomedical treatment utilisation = .113 Notes: Unless otherwise stated bootstrap results are based on 1000 bias-corrected samples. Health and lifestyle factors: were regressed onto the dependent variables in blocks: step 1: Health wellbeing, step 2: lifestyle, step 3: prior illnesses and step 4: Body Mass Index. In order to make the comparisons easier to read, only 95% Confidence Intervals and the significance level are shown in Table 8.14. Details for B-values and standard errors are in Appendix 11. Health wellbeing was significantly predictive of overall treatment utilisation and nonbiomedical treatment utilisation. Health wellbeing and having a chronic illness (i.e., diabetes, asthma, IBS) for which a physician is regularly consulted were significantly predictive of biomedical treatment utilisation. Lifestyle factors were almost significant in terms of predicting uptake of medical treatments. Thus, if a woman reported higher levels of Health wellbeing she was significantly more likely to report fewer treatments for all categories of treatment and if she had a prior illness she was significantly more likely to use more biomedical treatments for menopause. This may be because seeing a doctor on a regular basis, for any reason, could result in a discussion about symptoms that results in treatment for menopause or it may be that having a prior illness exacerbates the experience of menopause symptoms so that they are perceived as more severe. 116 Table 8.14: Hierarchical Multiple Regression Analyses of Predictors of Overall, Biomedical and Nonbiomedical Treatment Utilisation from Health and Lifestyle Variables Categories of treatment Predictors Overall treatment Biomedical treatment Non-biomedical utilisation utilisation treatment utilisation 95% CI Sig. 95% CI Sig. 95% CI Sig. Intercept -.132 .105 .798 2.557 3.153 .001 -.128 .106 .808 Step 1 Health wellbeing1 -.360 -.104 .002 -.105 -.464 .001 -.314 -.057 .010 Step 2 Lifestyle 2 .124 .127 .958 -.627 .030 .069 -.081 .151 .539 Step 3 Illness experience: Chronic illness -.272 .401 .756 .456 1.849 .003 -.383 .256 .655 Cancer (breast/other) -.250 .340 .868 -.310 1.113 .300 -.284 .304 .937 Hysterectomy/ooph. -.381 .403 .924 -.461 1.657 .270 -.467 .336 .699 .000 .000 NA -.001 .002 .200 .000 .001 .598 Step 4 BMI3 Adj R2 Overall = .032; Biomedical =.121, Non-biomedical =.012 Notes: Unless otherwise stated bootstrap results are based on 1000 bias-corrected samples. 1Composite of self-rated health, life satisfaction and four items from the Women’s Health Questionnaire Wellbeing sub-scale; 2Lifestyle is a composite factor derived from smoking, frequency of drinking, frequency of exercise (skewed and therefore log transformed); 3BMI is Body Mass Index Social support: was measured by seven items from the Duke Functional Support Scale. This was extremely skewed as most women believed they had sufficient social support [M 4.00, SD = 1.10 (SE= 0.142), Skew –1.049]. Log transformation improved matters somewhat [Skew 0.406 (SE = 0.142)] but the distribution was not smooth and dichotomising the scale meant that some power was lost. As a result all analyses with this variable were bootstrapped. Correlational analyses (Table 8.7) showed that social support was positively associated with Health wellbeing and negatively associated with cognitive inflexibility. There was no evidence of a relationship between overall treatment utilisation or nonbiomedical treatment utilisation and social support but there was an indication that lower levels of social support predicted higher levels of biomedical treatment utilisation (Table 8.15). Although there was some evidence that social support influenced uptake of medical treatment utilisation, it explained very little of the uptake of treatments and was not included in the final regression model as it would be unlikely to remain predictive. However, moderation analyses were conducted to discover whether social support interacted with symptom severity to affect treatment uptake (see section on mediation and moderation). 117 Table 8.15: Regression Analysis of Predictors of Overall, Biomedical and Non-biomedical Treatment Utilisation from Perceived Social Support 95% confidence intervals B Overall Biomedical Non-biomedical Sig. Lower Upper Intercept .230 .238 .334 -.238 .698 Perceived social support -.058 .058 .319 -.171 .056 Intercept 4.652 .645 .001 3.363 6.059 Perceived social support -.433 .157 .005 -.752 -.155 .073 .209 .726 -.325 .498 -.018 .052 .725 -.117 .077 Intercept Perceived social support Adjusted R2 SE Overall treatment utilisation =.003 biomedical treatment utilisation = .023 non-biomedical treatment utilisation = .019 Notes: Unless otherwise stated bootstrap results are based on 1000 bias-corrected samples Personality characteristics: the Big 5 personality traits – openness to experience, conscientiousness, emotional stability, agreeableness and extroversion – were measured using the Ten Item Personality Inventory (Gosling, Rentfrew, & Swann, 2003), and the Action and Acceptance Questionnaire was used to measure cognitive inflexibility (Hayes et al., 2004). There was a relatively high correlation between the AAQ and emotional stability (r = –0.558; p = 0.001). The AAQ and Emotional Stability are not measuring the same construct but are clearly related: cognitive inflexibility predicted 31% in the variance of emotional stability (B = –0.096, p < 0.001; CI95 [–0.113; –0.080]. Despite this relationship, the collinearity statistics did not indicate major problems with multicollinearity; there was no VIF value greater than10 and the average VIF was not substantially greater than 1 (Bowerman & O’Connell, 1990). All tolerance statistics (1/VIF) were above 0.2 (Menard 1995). The AAQ remained predictive of overall treatment utilisation and biomedical treatment utilisation even when emotional stability was controlled for, though it was not predictive of non-biomedical treatment utilisation (Table 8.16). Personality influenced uptake of treatments in different ways. Emotional stability and higher levels of cognitive inflexibility were predictive of increased treatment utilisation and, in particular, of biomedical treatments. Higher levels of Openness to Experience predicted increased numbers of nonbiomedical treatments but higher levels of cognitive inflexibility were not predictive of nonbiomedical treatment utilisation. 118 Table 8.16: Hierarchical Multiple Regression Analyses of Predictors of Overall, Biomedical and Nonbiomedical Treatment Utilisation from Personality Variables Overall Step1 Step 2 Biomedical Step 1 Step 2 Non-biomedical Step 1 Step 2 Adjusted R2 95% confidence intervals Lower Upper -1.246 .501 -.053 .108 -.045 .185 -.102 .135 -.286 -.064 -.011 .222 .005 .032 Intercept Extroversion Agreeableness Conscientiousness Emotional stability Openness AAQ B -.379 .027 .074 .020 -.174 .102 .019 SE .463 .040 .059 .062 .053 .054 .007 Sig. .438 .509 .219 .743 .001 .064 .015 Intercept Extroversion Agreeableness Conscientiousness Emotional stability Openness AAQ 5.326 -.003 .084 -.228 -.485 .086 .053 1.165 .124 .161 .131 .118 .136 .020 .001 .592 .988 .091 .001 .525 .010 1.803 -.242 -.266 -.487 -.690 -.172 .016 7.411 .240 .463 .064 -.285 .360 .089 Intercept Extroversion Agreeableness Conscientiousness Emotional stability Openness AAQ -.679 .031 .073 .046 -.142 .104 .015. .476 .040 .059 .061 .051 .053 .008 .171 .464 .216 .456 .007 .034 .060 -1.537 -.046 -.041 -.078 -.245 .004 .001 .217 .102 .189 .165 -.031 .222 .029 Overall treatment utilisation =.063, biomedical treatment utilisation =.112 non-biomedical treatment utilisation = .041 Notes: Unless otherwise stated bootstrap results are based on 1000 bias-corrected samples. Social constructions of menopause: Finally, the social constructions were regressed onto the treatment utilisation categories (Table 8.17). The belief that menopause is an illness significantly predicted higher levels of overall treatment utilisation and the belief that there is postmenopausal recovery significantly predicted lower overall treatment utilisation. Biomedical treatment utilisation was predicted by three social constructions: associating menopause with becoming invisible and unvalued, believing that menopause is an illness and believing that this condition can be effectively treated all contributed to higher levels of biomedical treatment utilisation. Holding the belief that menopause is an illness and believing that there is postmenopausal recovery were both significantly predictive of higher levels of non-biomedical treatment utilisation. This suggests the way symptoms are interpreted by women influences uptake of all categories of treatment e.g., beliefs that menopause is an illness and a condition of aging that can be treated with hormones leads to higher levels of biomedical treatment utilisation, whereas beliefs 119 that menopause is an illness, but also that there will be recovery afterwards predicts higher levels of the use of complementary treatments. Table 8.17: Multiple Regression Analyses of Predictors of Overall, Biomedical and Non-biomedical Treatment Utilisation from Social Constructions of Menopause 95% confidence intervals Overall B SE Sig. Lower Upper -.587 .455 .206 -1.515 .334 .068 .043 .101 -.024 .152 -.195 .074 .004 -.357 -.051 Treatment belief .010 .064 .867 -.107 .138 Illness belief .216 .066 .002 .094 .337 -.259 1.136 .022 -4.886 -.421 .282 .106 .012 .084 .474 -.285 .159 .067 -.571 .031 Treatment belief .834 .121 .001 .608 1.064 Illness belief .332 .148 .026 .055 .630 -.068 .453 .890 -.833 .763 .046 .044 .286 -.039 .128 Postmenopausal recovery belief -.187 .075 .015 -.348 -.036 Treatment belief -.077 .062 .204 -.197 .050 .206 .064 .003 .087 .326 Intercept Invisible & unvalued belief Postmenopausal recovery belief Biomedical Intercept Invisible & unvalued belief Postmenopausal recovery belief Non- Intercept biomedical Invisible & unvalued belief Illness belief Adjusted R2 Overall treatment utilisation = .114 biomedical treatment utilisation = .223 non-biomedical treatment utilisation = .081 Notes: Unless otherwise stated bootstrap results are based on 1000 bias-corrected samples. Finally, the variables that were predictive of treatment utilisation were put into one model. Predictors of overall treatment utilisation, biomedical utilisation and non-biomedical utilisation will be discussed individually. Predictors of overall treatment utilisation, biomedical treatment utilisation and non-biomedical treatment utilisation The regression analysis was rerun using a reduced set of variables selected from those that were predictive at earlier stages. Income, socioeconomic status and menopausal status were control variables and other variables were entered in the order of amount of variance explained. Menopause status was split between peri- and postmenopause as discussed earlier. 120 Table 8.18: Hierarchical Multiple Regression Analysis of Predictors of Overall Treatment Utilisation 95% confidence intervals Step 1 Intercept Income High Medium Low Socioeconomic status Working class Intermediate Salaried Not in paid employment Menopause status - peri or post B -.210 SE .152 Sig. .156 Lower -.530 Upper .133 025 -.206 0a .138 .187 0a .145 .886 -.486 -.346 .088 .396 -.239 .592 .063 0a .135 .154 .164 .134 .112 .003 .656 -.534 .281 -.208 .062 .936 .320 .119 .267 -.098 .360 .050 .009 .001 .032 .070 Step 2 Symptom severity (Total MRS) Step 3 Invisible & Unvalued belief Postmenopausal Recovery belief Treatment belief Illness belief .020 -.090 .005 .080 .039 .074 .057 .070 .626 .226 .927 .249 -.058 -.227 -.112 -.077 .104 .050 .107 .222 Step 4 Emotional stability Openness to experience AAQ -.016 .106 -.010 .053 .052 .008 .751 .041 .240 -.128 .000 -.026 .087 .206 .005 Step 5 Health wellbeing Experience of chronic illness .011 -.001 .075 .141 .900 .994 -.137 -.275 .149 .324 Adj R2 0.247 Notes: Unless otherwise stated bootstrap results are based on 1000 bias-corrected samples. Of the control variables, only being of intermediate socioeconomic status remained predictive of overall treatment utilisation. Symptom severity was a significant predictor but none of the social constructions were significant and only the personality trait of Openness to experience remained predictive. In total these variables explained almost 25% of the variance in the data (Table 8.18). However, this pattern differed when biomedical treatment utilisation was considered. When these predictors were entered into the model with biomedical treatment as the outcome variable, 45% of the variance was explained (Table 8.19). 121 Table 8.19: Hierarchical Multiple Regression Analysis of Predictors of Biomedical Treatment Utilisation 95% confidence intervals Step 1 Intercept Income High Medium Low Socioeconomic status Working class Intermediate Salaried Not in paid employment Menopause status - peri or post B 2.397 SE .447 Sig. .001 Lower 1.593 Upper 3.212 -.378 -1.1018 0a --.398 .428 0a .356 .022 -1.154 -1.900 .358 -.235 -.621 1.049 -.418 0a 1.010 .466 .422 .387 0a .335 .177 .014 .277 -1.583 .160 -1.246 .381 1.924 .283 .002 .360 1.704 .167 .016 .001 .136 .198 .125 .056 .777 -.054 .095 .175 .117 .141 .191 .744 .001 .687 -.063 -.269 .537 -.360 .311 .432 1.042 .243 Step 2 Symptom severity Step 3 Invisible & Unvalued belief Postmenopausal Recovery belief Treatment belief Illness belief Step 4 Emotional stability Openness to experience AAQ .000 .151 .001 .114 .109 .020 .997 .179 .966 -.209 -.051 -.038 .192 .363 .039 Step 5 Health wellbeing Experience of chronic illness 0.450 .208 .926 .179 .292 .235 .005 -.137 .360 .515 1.542 Adj R2 Notes: Unless otherwise stated bootstrap results are based on 1000 bias-corrected samples. Now, not only was intermediate socioeconomic class and symptom severity predictive of biomedical treatment utilisation but so too was being in a medium income group, being postmenopause, holding a treatment belief, and having experience of a chronic prior illness. By comparison, non-biomedical treatment utilisation followed a pattern that was the same as for overall treatment propensity but had less explanatory power (17% of the variance was explained). Symptom severity was a predictor of increased uptake of non-biomedical treatments as well as Openness to experience (Table 8.20). 122 Table 8.20: Hierarchical Multiple Regression Analysis of Predictors of Non-biomedical Treatment Utilisation 95% confidence intervals Step 1 Intercept Income High Medium Low Socioeconomic status Working class Intermediate Salaried Not in paid employment Menopause status - peri or post B -.183 SE .151 Sig. .228 Lower -.485 Upper .146 -.187 .138 0a .136 .185 0a .177 .460 -.483 -.244 .081 .506 -.201 .544 .112 0a .044 .158 .171 .148 0a .117 .215 .002 .462 -.518 .209 -.206 .091 .877 .388 .709 -.187 .265 .038 .009 .001 .022 .055 Step 2 Symptom severity Step 3 Invisible & Unvalued belief Postmenopausal Recovery belief Treatment belief Illness belief .008 -.107 -.077 .095 .041 .075 .063 .073 .827 .154 .229 .206 -.087 -.245 -.199 -.051 .101 .044 .042 .236 Step 4 Emotional stability Openness to experience AAQ -.017 .102 -.011 .052 .053 .008 .749 .051 .170 -.126 -.003 -.030 .081 .204 .006 Step 5 Health wellbeing Experience of chronic illness -.011 -.100 .077 .156 .897 .546 -.161 -.392 .133 .211 Adj R2 0.168 Notes: Unless otherwise stated bootstrap results are based on 1000 bias-corrected samples. Mediators and moderators of treatment utilisation It was evident from the analysis of the social constructions that certain beliefs about menopause were influential in terms of treatment utilisation when considered independently of severity of symptoms. Modern thinking about mediation analysis does not require evidence of a total effect prior to the estimation of direct and indirect effects (Cerin & MacKinnon, 2009; Hayes, 2009; Zhao, Lynch, & Chen, 2010). Therefore, the social constructions were further investigated to see if they might be playing a mediating role with respect to different categories of treatment. Simple mediation analyses were conducted in order to model the direct influence of symptom severity on biomedical and non-biomedical treatment utilisation and to see whether there was an indirect influence through one of the social constructions acting as an intermediary between symptom severity and biomedical or non-biomedical treatment utilisation. All tests generated a bias-corrected 95% bootstrap confidence interval for the indirect effect using 10,000 bootstrap samples and a bias-corrected 123 bootstrap confidence interval for estimates of indices of effect size for indirect effects. The results are illustrated in Figures 8.4 to 8.6. The belief that menopause renders women invisible and unvalued was not a mediator of treatment utilisation and will not be discussed further. The remaining three social constructions had mediating effects as follows: the belief that menopause is amenable to treatment was a highly significant mediator of medical treatment utilisation with a relatively larger effect size (0.052), whereas it was not a mediator of non-biomedical treatment utilisation. The belief in postmenopausal recovery was a mediator of both biomedical and non-biomedical treatment utilisation and the effect size was larger for non-biomedical treatments (0.055) compared with biomedical treatments (0.028). The idea that menopause is an illness that changes women did not mediate biomedical treatments but was a mediator for non-biomedical treatments and had an effect size of 0.045. Thus, social constructions mediated the use of different categories of treatment such that experiencing symptoms and holding a treatment belief predicted an increase in medical utilisation but experiencing symptoms and holding a postmenopausal recovery belief predicted a decrease in medical treatment utilisation. Interestingly, experiencing symptoms and believing in postmenopausal recovery stimulated the use of non-biomedical treatments as did believing that menopause is an illness that changes women. 124 Figure 8.5: Treatment Belief as a Mediator of Biomedical and Non-biomedical Treatment Utilisation Notes: Total effect of X on Y = C1 (C1= C’ + a1b1); C’ = direct effect of X on Y; Indirect effect of X on Y through M is a*b 125 Figure 8.6: Postmenopausal Recovery Belief as a Mediator of Biomedical and Non-biomedical Treatment Utilisation Notes: Total effect of X on Y = C1 (C1= C’ + a1b1); C’ = direct effect of X on Y; Indirect effect of X on Y through M is a*b 126 Figure 8.7: Illness (that changes women) Belief as a Mediator of Biomedical and Non-biomedical Treatment Utilisation Notes: Total effect of X on Y = C1 (C1= C’ + a1b1); C’ = direct effect of X on Y; Indirect effect of X on Y through M is a*b 127 Moderators of treatment: It is known that social support is an important coping strategy and it has been cited as a means of buffering women against distressing symptoms at menopause (Duffy, Iversen, & Hannaford, 2012). Social support as measured by the Duke Functional Support Questionnaire had not emerged as predictive of treatment utilisation. It had been hypothesised that social support might moderate symptom severity such that having low levels of social support would be associated with seeking higher levels of treatment. A moderation analysis, however, indicated that social support conditioned symptom experience such that there was a steeper increase in using nonbiomedical treatments with higher levels of support. As Figure 8.7 shows, there was a significant interaction between social support and symptom severity such that there was an increase in the mean number of non-biomedical treatments (B = 0.0709 (SE.0.0316), p = 0.0258). No such effect was evident for biomedical treatments (B = –0.0155 (SE 0.753), p = 0.8371) Figure 8.8: Interaction Effects of Social Support on Biomedical and Non-biomedical Treatment Utilisation Notes: Perceived social support is plotted at the mean and at one SD above and below the MRS mean. This may seem paradoxical as previous research would imply that social support would reduce the need to seek treatment. It is, possible however, that with higher levels of social support, women make recommendations to each other about suitable over-the-counter treatments and this results in an increase rather than a decrease in the use of non-biomedical treatments. This will be explored further in Chapter 9. 128 Putting it all together: path model to predict overall utilisation at menopause. The analyses suggested the model of treatment utilisation needed to reflect the strong relationship between symptom severity and treatment utilisation. In this model, there are three latent variables: Health wellbeing (comprised of self-rated general health, life satisfaction and the wellbeing scale of the Women’s Health Questionnaire), symptom severity (comprised of the three MRS sub-scales) and the outcome variable, overall treatment propensity (which has two markers – biomedical and non-biomedical treatments) (Figure 8.8). Figure 8.9: theoretical and measurement model of treatment utilisation at menopause Notes: P = Psychological sub-scale, S= somatic sub-scale, U = Urogenital sub-scale. LS = Life satisfaction. H = self-rated general health, W = Wellbeing scale of Women’s Health Questionnaire. Bio = biomedical treatments, Nonbio = non-biomedical treatments. The model incorporated the variables that were predictive of symptom severity as measured by the Menopause Rating Scale and also recognised that women have to perceive that these symptoms are occurring and attribute them to menopause. Thus, this model reflects the fact that a range of variables influence perceptions of symptom severity, which in turn influences treatment utilisation. In order to gain a better understanding of the relationship between these observed and latent variables a Structural Equation Modelling (SEM) approach was used (as described in chapter 6) because this is an efficient way to describe the latent structure underlying a set of observed variables. In the model (Figure 8.8) there were 16 observed variables and 13 unobserved variables. The revised model with estimated standardised regression path coefficients is shown in Figure 8.9. The model indicated that, as anticipated, there was a strong causal relationship between symptom 129 severity and treatment uptake (B = 0.70) and that Health wellbeing negatively predicted symptom severity (B = –0.52). That is, feeling well and satisfied with life predicted perceived lower levels of symptoms. It was also evident that psychological symptoms were major contributors to the overall perception of symptom severity. However, this is a complex model and several of the observed variables contributed little and were not significant. For example, menopause status, recovery belief and the belief that menopause renders women invisible and unvalued failed to reach significance. The model fit indices were also poor; the model χ2 was very high at 512.230, which is significant at p < 0.01, CFI was 0.666 and RMSEA was 0.117. All these are indicators of a poorly fitted model. Figure 8.10: Model 1 Showing Standardised Path Coefficients for Pathways To Treatment Notes: P = Psychological sub-scale, S= somatic sub-scale, U = Urogenital sub-scale. LS = Life satisfaction. H = self-rated general health, W = Wellbeing scale of Women’s Health Questionnaire. Bio = biomedical treatments, Nonbio = non-biomedical treatments. Notes: 1000 bias-corrected bootstrap samples 95% confidence intervals Further investigation revealed that the Invisible and Unvalued belief, the Postmenopausal Recovery belief, menstrual status and openness to experience were contributing little to the model (regression estimates were 0.044, –0.093, 0.083, 0.114 respectively) and none of these were significant (Table 8.21). 130 Table 8.21: Standardised Regression Weights for Model 1 Parameter Estimate Lower Upper p Symptom severity Health wellbeing -.517 -.672 -.345 .002 Symptom severity Menstrual status .083 -.009 .193 .077 Symptom severity Total attributions .503 .374 .620 .001 Symptom severity Emotional stability trait -.361 -.518 -.205 .002 Symptom severity Chronic illness .156 .051 .275 .009 Symptom severity Recovery belief -.093 -.195 .028 .136 Symptom severity Invisible & unvalued belief .044 -.056 .148 .383 Symptom severity Symptom severity .695 .454 .920 .004 Symptom severity Treatment belief .422 .281 .602 .002 Treatment utilisation Open to experience trait .114 -.024 .273 .118 WHQ wellbeing Health wellbeing .785 .681 .862 .003 Psychological MRS Symptom severity .754 .664 .832 .003 Somatic MRS Symptom severity .673 .580 .751 .003 Urogenital MRS Symptom severity .555 .425 .659 .003 Biomedical treatments Treatment utilisation .728 .546 .916 .002 Non-biomedical treatments Treatment utilisation .331 .187 .463 .002 Life satisfaction Health wellbeing .656 .548 .743 .002 Self-rated general health Health wellbeing .673 .545 .770 .003 Notes: 1000 bias-corrected bootstrap samples 95% confidence intervals Modification indices (MI) indicated that there were no serious misspecifications associated with the pairing of error terms but that some variables co-varied and taking these into account would change the parameter estimates significantly (Par change). These MI are shown in Table 8.22. Table 8.22 Selected Output for Model 1 Showing Modification Indices and Parameter Changes MI Par change Health well being Emotional stability 40.214 0.443 Self-rated general health Chronic illness 40.383 -0.700 Treatment belief ↔ Postmenopausal recovery 34.801 -0.375 Emotional stability Psychological MRS 31.717 -0.617 Emotional stability ↔ Invisible & unvalued belief 30.683 -0.613 131 These indices indicate misspecifications in the model. The model is somewhat complex and so on the basis of this analysis the decision was taken to change it in the following ways: (a) remove the invisible and unvalued belief from the model as it contributed so little and was not significant, and test whether openness to experience was contributing to non-biomedical treatments as suggested by the earlier regression analyses; (b) consider whether menopause status predicted attribution rather than symptom severity per se;(c) consider whether postmenopausal recovery and treatment beliefs were either end of a spectrum of perceiving menopause as pathological (by combining them into one factor); (d) consider whether emotional stability mediated between health wellbeing and psychological wellbeing; and (e) consider whether chronic illness mediated between general health ratings and symptom severity rather than just having a direct influence. Each of these steps was taken individually and the changes to model fit indices for each stage are shown below (Table 8.23). Table 8.23: Model Fit Indices for Revised Models of Pathways to Treatment Utilisation χ2 Model tested Model 1 – all predictors in model 512.230 Model 2 – invisible & unvalued removed, openness onto non-bio 456.728 Model 3 – menopause status as predictor of attributions Δχ2 CFI RMSEA .666 .117 55.502 .690 .119 451.483 5.297 .694 .119 Model 4 – belief that menopause is pathological 367.104 83.396 .736 .115 Model 5 – emotional stability as mediator of health & psychol. MRS 321.611 46.507 .776 .107 Model 6 – chronic illness as mediator of health & symptom severity 198.920 122.691 .886 .077 Removing the Invisible and Unvalued belief and ascertaining whether menopause status was a predictor of attributions did not improve the overall fit of the model. However, believing that menopause is a pathological condition resulted in an improved model, as did incorporating mediating factors as described above. The final model tested (Figure 8.10) almost achieved a good fit but the modification indices did not indicate further amendments. Overall, the model may be described as a mediocre fit. Issues with measurement will be discussed later. 132 Figure 8.11: Revised Model of Pathways to Treatment Utilisation Notes: P = Psychological sub-scale, S= somatic sub-scale, U = Urogenital sub-scale. LS = Life satisfaction. H = self-rated general health, W = Wellbeing scale of Women’s Health Questionnaire. Bio = biomedical treatments, Nonbio = non-biomedical treatments. Notes: 1000 bias-corrected bootstrap samples 95% confidence intervals Nevertheless, all the relationships between these variables are significant (Table 8.24) and this is a reasonable representation of the data. The model demonstrated that overall Health wellbeing was a strong influencer of perceived symptom severity and that higher reported levels of symptom severity predicted higher levels of treatment uptake. Looking at the first level of the model, it was clear that as Health wellbeing increases by one unit, there is a 0.57 decrease in symptom severity when controlling for other variables. There were significant mediators between Health wellbeing and symptom severity; emotional stability mediated between Health wellbeing and psychological symptoms such that being emotionally unstable was predictive of higher levels of reporting psychological symptoms. Having a chronic illness also mediated between self-reported health and symptom severity; having a preexisting chronic illness contributed to higher levels of severity for menopause symptoms. Menopause status was significantly predictive of the number of attributions made (once a woman recognised that she was menopausal, she was more likely to attribute more symptoms to menopause) and the higher the number of attributed symptoms, the greater the level of severity of symptoms reported. Furthermore, the greater the number of symptoms that were attributed to menopause, the higher the symptom severity: an increase of one attribution predicted a 0.54 unit increase in symptom severity, when other variables were controlled for. Finally, symptom severity was the main predictor of treatment utilisation: for every unit increase in symptom severity, there was a 0.78 unit increase in overall treatment utilisation when controlling for other variables. Additionally, being open to experience was a significant predictor of uptake of non-biomedical treatments 133 Table 8.24: Standardised Regression Weights for Model 5 Parameter Estimate Lower Upper p Self-rated health Health wellbeing .684 .566 .770 .003 Total attributions Menopause status .163 .038 .271 .015 Chronic illness General health -.417 -.510 -.305 .003 Symptom severity Health wellbeing -.570 -.695 -.422 .003 Symptom severity Chronic illness .140 .038 .250 .012 Symptom severity Total attribution .539 .434 .643 .001 Symptom severity Symptom severity .773 .558 .991 .003 Treatment utilisation Menopause as pathological .395 .234 .588 .002 Emotional stability Health wellbeing .447 .328 .561 .001 Wellbeing Health wellbeing .753 .661 .828 .003 Psychological MRS Symptom severity .570 .475 .649 .003 Somatic MRS Symptom severity .780 .718 .833 .003 Urogenital MRS Symptom severity .656 .557 .731 .003 Biomedical treatments Treatment utilisation .677 .497 .820 .002 Non-biomedical treatments Treatment utilisation .368 .223 .504 .002 Non-biomedical treatments Open to experience .143 .010 .256 .036 Psychological MRS Emotional stability -.423 -.514 -.338 .001 Life satisfaction Health wellbeing .672 .566 .754 .002 Notes: 1000 bias-corrected bootstrap samples 95% confidence intervals Kline (2011, p 190) makes the point that there is no true model as all models can be wrong to some degree and even models where the fit statistics are good can be incorrect. The threshold values for fit statistics are ‘rules of thumb’ and therefore, to some extent, are arbitrary. This model does not meet any of the recommended threshold values that are currently used and it may be that the model lacks parsimony and there were measurement errors due to the constructs selected. The model does, however, provide an overview of the relationships between variables and these will be explored further in Chapter 9. 134 Discussion The main predictors of symptom severity included levels of Health wellbeing, prior illness, menopause stage, the number of attributions made to menopause and emotional stability. These factors together explained 64% of the variance in the data. Thus, lower levels of Health wellbeing and having a prior illness predicted higher levels of symptom severity. Emotional stability mediated between psychological symptoms and Health wellbeing such that reporting higher levels of Health wellbeing predicted greater levels of emotional stability and having lower levels of emotional stability predicted higher levels of psychological symptoms. Emotionally stable people are less reactive to stress whereas those who are neurotic tend to be more anxious so it is unsurprising that women who were more neurotic suffered more anxiety, irritability and depression about menopause. It is worth noting that cognitive flexibility was strongly negatively associated with emotional stability (r = 0.56) and although it was not predictive when all other factors were controlled for, cognitive inflexibility was an important predictor when considering personality traits separately in relation to perceived symptom severity. The greater the number of symptoms attributed to menopause, the greater the perceived severity of symptoms. However, the stage of menopause predicted the number of attributions; symptoms were more likely to be attributed to menopause by postmenopausal women than by perimenopausal women. There are a number of possible explanations for this. One possibility is that women in postmenopause have more symptoms than perimenopausal women, especially those who have had a surgical menopause. There was some evidence for this with respect to physical symptoms but women in perimenopause reported higher levels of psychological symptoms than either postmenopausal women or those who had a surgical menopause. Another possibility is that as women go through menopause they become more aware of the symptoms that are linked to it and so become more likely to make definite attributions. There were some significant differences between the general population and those who had sought treatment at a clinic. The clinical sample scored significantly more highly on symptom severity (especially psychological and urogenital symptoms) and treatment utilisation than the general population and was four times more likely to be using Hormone Therapy. The logistic regression suggested that 14% of women in the general population have similar characteristics to the women who sought clinical treatment. This may indicate that there is unmet demand for clinical services in the population as a whole. Ninety-one per cent of the women in this study had sought treatment for one or more menopause-related symptoms, and biomedical treatments were the most prevalent category of treatment for all the symptoms reported. The use of herbal remedies and supplements was also quite prevalent for sleep problems and physical and mental exhaustion. Thus, a strict distinction between women who are in treatment and women who are not may be inappropriate as suggested by other 135 authors (Avis & McKinlay, 1990; Guthrie, Dennerstein, Taffe, & Donnelly, 2003; Morse et al., 1994) Rather, it would seem that the majority of women seek treatment for menopause symptoms at this stage of their lives but as the mediation analyses indicated, the social constructions which are held influence the type of treatment sought. Four social constructions were present: the invisible and unvalued belief, the illness belief, the treatment belief and the postmenopausal recovery belief. All four had good psychometric properties and influenced symptom severity and treatment utilisation. The social constructions of menopause were significant mediators of symptom severity and treatment utilisation but they operated on the categories of treatment in different ways. Believing that hormone therapy is an efficacious treatment for menopause symptoms mediated between symptom severity and biomedical utilisation such that there was an increase in uptake but there was no mediating effect on non-biomedical treatments. Believing that there is postmenopausal recovery mediated between symptom severity and both biomedical and non-biomedical treatment utilisation such that holding this belief predicted an increase in non-biomedical treatments but a decrease in biomedical treatments. Believing that menopause is an illness that changes women mediated between symptom severity and non-biomedical treatments such that there was an increase in uptake but there was no mediating effect on biomedical treatments. Thus, the belief that hormone therapy is an effective treatment was more important than the belief that menopause makes women ill in terms of triggering a visit to a clinician. It should be noted, however, that believing that menopause is a pathological condition (as opposed to a temporary phase after which there is recovery) directly increased treatment utilisation. The structural equation model demonstrated that the pathway to treatment utilisation was through perceived symptom severity. That is to say, there were several factors that were significantly predictive of symptom severity, and perceived symptom severity was the main predictor of the level of treatment utilisation. Unsurprisingly, reporting more severe symptoms led to higher levels of treatment uptake at menopause. When all other factors were taken into account age, socioeconomic status, educational level and lifestyle were not significant predictors of symptom severity as found in previous studies (Matthews et al., 1990; Morse et al., 1994). Hypothesis 1: Women who rate higher for treatment utilisation will be more likely to construct menopause as pathological and to associate menopause with aging This hypothesis was supported. Women who scored more highly on the belief that menopause is an illness were significantly more likely to report higher levels of overall treatment utilisation. A one unit increase in scores on the illness belief predicted an increase of 0.216 on the overall treatment scale. Furthermore, the illness belief was particularly influential with respect to biomedical treatments; a one unit increase in scores on this construct predicted a 0.332 increase in biomedical treatments. However, the association of menopause with aging, as represented in the belief that women become invisible and unvalued at menopause, did not predict higher overall treatment utilisation. Rather, it 136 was predictive of biomedical treatments only; a one unit increase in the scores on the invisible and unvalued belief scale predicted an increase of 0.282 on the biomedical treatment utilisation scale. Hypothesis 2: Women who rate lower for treatment utilisation for menopause symptoms will be more likely to construct menopause as a natural life stage This hypothesis is partly supported in that women who scored more highly on the belief that there is postmenopausal recovery were significantly more likely to report lower levels of overall treatment utilisation. This construct is not specifically about the naturalness of menopause as it focuses on the idea that menopause is a temporary phase that is normal and after which there is a positive recovery. Additionally, women who scored more highly on the belief that menopause is amenable to treatment with hormone therapy were significantly more likely to report higher treatment utilisation. The item ‘menopause is natural and women should not be given drugs for it’ loaded negatively onto this construct, suggesting that women who believe that menopause is natural are less likely to think that treatment with drugs is efficacious. Hypothesis 3: Women who rate higher for treatment utilisation will have fewer coping strategies, score lower on emotional stability and higher on cognitive inflexibility. The hypothesis that women who score lower on emotional stability and higher on the related trait of cognitive inflexibility was supported. A one unit decrease in emotional stability predicted a 0.174 unit increase in overall treatment utilisation and a 0.485 unit increase in biomedical treatment utilisation. The AAQ measures different aspects of cognitive inflexibility, including the ability to take action, attempts to control experiences and levels of worry and anxiety. Even when holding emotional stability constant, an increase in cognitive inflexibility predicted an increase in all categories of treatment. Therefore, women who are more reactive to stress and less willing to adapt to change are more likely to seek treatment for symptoms at menopause. The hypothesis that women who rate higher for treatment utilisation will have fewer coping strategies could not be supported empirically because the quantitative measure of the number of typical coping strategies used was not robust and there was no support for a division into emotionfocused and problem-focused coping. However, coping approaches are discussed in more detail ain study 3. 137 Summary of key findings 91% of peri- and postmenopausal women have sought treatment for menopause symptoms at this stage of their lives The factors that predict symptom severity are Health wellbeing, prior illness, menopause stage, the number of attributions made and emotional stability Symptom severity and believing that menopause is a pathological condition are the main predictors of overall treatment utilisation The social constructions of menopause mediate between symptom severity and different categories of treatment Logistic regression indicates that a sizeable proportion of women in the general population exhibit characteristics that are similar to the clinical sample and there could be an unmet need for specialist menopause services 138 Chapter 9: Study 3: A qualitative study to explore how women’s beliefs about menopause are located within the social context of their daily lives Study 2 highlighted that the menopause is more than just a biological process. It is also a psychological experience, a social phenomenon and is culturally situated. Study 2 demonstrated the dominant role of psychological factors with respect to the overall rating of menopause symptoms, the role of social support in increasing the use of non-biomedical treatments and the importance of social constructions with respect to both the rating of symptoms and their influence on treatment utilisation. Aims: 1. To describe the bio-psycho-sociocultural aspects of the menopause experience 2. To explore how women cope with the emotional and physical demands of menopause 3. To explore how women manage social and cultural expectations of menopause Recruitment and sample The following criteria were used to select participants for study 3: a. above the median on symptom reporting; b. to represent a spread of high and low treatment utilisation; and c. not to be using Hormone Therapy at the time of completing the study 2 questionnaire. Sixty-four volunteers met the criteria for selection and 40 were emailed or contacted by phone. Only four women declined to continue, four women were unreachable and two women agreed but were unable to complete the diary. Thirty women were sent diaries with instructions for completion. In addition to symptom severity and treatment ratings, women had to attribute two or more symptoms to menopause. Two of the women had decided to use Hormone Therapy since the survey was completed but as they had only very recently decided on this course of action they were included because it might be helpful to get their opinions of the differences pre- and post-usage of HT. The sample characteristics are shown in table 9.1. 139 Table 9.1: Characteristics of the Sample Characteristics Location Profile 12 Cambridge 10 Nottingham 8 London Sample 9 clinic 21 population Age Range from 42 to 60 years Mean = 52.8 years Menstrual status 8 perimenopausal 15 postmenopausal 7 surgical menopause MRS score Range from 15–37 Mean 22.9 Treatment score range 15 low treatment utilisers 15 high utilisers and/or clinical From 1 to 26 Mean = 8.1 HT usage 2 just started 20 never used 8 previously used Attribution of symptoms to menopause Range from 1 to 11 Mean = 7.3 Marital status 2 single 23 married or cohabiting 4 divorced 1 widowed Children 6 had no children 6 had 1 child 12 had 2 children 5 had 3 children 1 had 4 children Prior illnesses 13 had a prior illness that could affect or promote symptoms 17 had no prior illness Cognitive inflexibility score (AAQ) 19 to 55 Mean = 36.07 140 Nine of the participants were recruited from the clinic and the remaining 21 were recruited from the general population. Note that treatment utilisation at stage 2 is not only related to the number of treatments used. This is because women may seek treatment at a clinic where they receive HT, which they find to be effective. Hence, they decide not to seek other forms of treatments and may have a relatively low score for the total number of treatments. As women were selected to represent a spread of treatment uptake, the number of treatments used ranged from 1 to 26 with an average of 8 treatments per participant. A summary of the sample profile is in Table 6.12. A detailed profile of each participant can be found in Appendix 8. Data analysis The data were analysed using thematic analysis. Each transcription was read and re-read, the content analysed and each interview was coded on numerous occasions. The themes used were both deductive (based on existing knowledge) and inductive (derived from repeated patterns in the data). The process involved the following: 1. A coding framework was developed. Descriptive codes were assigned ‘in vivo 6’ to specific phenomena as they emerged from the data and were subsequently grouped into higher level categories. A code audit was conducted with another researcher to weed out duplicated codes, confusing nomenclature and to refine categories. This process produced 367 individual codes. 2. Identification of themes: codes were grouped into 23 code families or sub-themes using measures of ‘groundedness’ (the number of quotes associated with an individual code) and ‘density’ (the number of codes connected to an individual code). Relationships between themes and the dimensions within themes were identified. Sub-themes were further categorised into major organising themes. Eight broad major themes were identified: age and acceptance of menopause, social and cultural constructions of menopause, the symptom experience, the medical experience, impact on life and work, getting through the experience and what is unspoken (see Appendix 9 for details of the coding frame). 3. Networks of themes: The major themes and sub-themes were organised into thematic networks on the basis of content. Network diagrams were developed to represent the relationships between codes and code families. Each network was described in terms of content using the text as support (for an example see Appendix 10). These were grouped into the biological experience, the psychological experience, the sociological experience and the cultural experience 4. Constant comparison: During the process there was constant comparative analysis to identify similarities and differences between the categories and the participants. Negative cases were looked for and memos were written throughout the process to record ideas and hypotheses 6 In vivo coding selects quotes from the text and uses them as codes 141 5. Comparison with study 2 findings: Themes that reinforced or contradicted findings from the WBIM survey data were identified. The survey findings were a useful form of data triangulation in that they allowed for the reaching of ‘a maximum of theoretical profit’ from using the data (Flick, 2007, p. 42). That is to say, there is a profit due to an increase in reliability (several methods are more reliable than one method) and the grounding of theory development is improved (Denzin, 1970). Findings The biological experience The biological experience can best be defined as the experience of somatic and urogenital symptoms and the impact these may have on daily life. Women reported that at some point they started to notice changes that signalled ‘something was happening’. The most frequently reported signs were changes to the pattern of menstruation (less frequent or heavier periods), exhaustion, sleeplessness, irritability, hot flushes and night sweats. These changes could initially be frightening because they were unfamiliar and unexpected. Some women worried or panicked and so went to see their GP about the changes to discover if there was an underlying problem. Those who had a prior ailment, for example migraines, a tendency to depression or irritable bowel syndrome, all commented that menopause exacerbated pre-existing conditions. One woman believed that the menopause was turning her into a ‘nasty person’ because she was constantly irritable, and another went so far as to say she believed that her particular personality disposition was made worse by menopause, a comment that is supported in the survey data, which indicated that neuroticism was a predictor of reporting greater severity of symptoms. “No, I don’t feel ‘Oh my God, I’m coming towards the menopause – this is the end of my life’. Not depressed in that sense but the function – it’s making me, I feel that all of the changes are not helping the type of personality that I have” Low treatment utiliser (2)7 Six of the participants spontaneously commented that one of the biggest problems with these symptoms was that they were not obvious to other people and so it was difficult to get sympathy. However, it was not until the symptoms were perceived to be so intrusive as to interfere with daily life that women actively sought a treatment solution. The threshold for what was defined as intrusive varied for each woman and so treatment utilisation was not determined by the intensity or frequency of symptoms alone but was also influenced by how they were interpreted, the context within which the symptoms occurred, and by the individual’s ability to manage them. Context was important because there were situations where women could not stop to deal with feeling unwell. For example, feeling exhausted or having a hot flush caused problems in the public domain, especially at work, because women found that their level of concentration was impaired or they felt embarrassed. Embarrassment 7 All interviews are referred to by number from 1 to 30 142 may simply be due to going red in the face but it could also be caused by worrying that symptoms could be interpreted by others as interfering with job competence. “Yes in a group situation or in a meeting at work. It was awful at work because there were times when – when I was a community midwife – it was fine when I was just visiting someone and talking one on one, I could say to the woman ‘oh excuse me I’m having a hot flush’ and I could take my cardigan off and she would say ‘oh don’t worry, have a glass of water’. And that just helped relieve the situation a bit but if you are doing a delivery or people in the room, doctors are trying to get everything and something has gone wrong and you are in that stressful situation and even when everything is going normally, it’s hard to think about yourself and say ‘I’m having a hot flush, I have to go out of the room’– well you can’t because you have to stay with that woman because she is going to give birth or whatever – so situations like that would always be difficult… .” Low treatment utiliser (1) Thus, working in a stressful environment and being surrounded by other people may increase the perception that the symptom is problematic and that a treatment solution is required. In fact, stress was the reason most frequently given, cited by 17 of the participants, as the main trigger for a hot flush. Hot flushes and night sweats were among the most intrusive symptoms and were described most vividly. The experience and impact of vasomotor symptoms Twenty-eight out of the 30 women had experienced vasomotor symptoms and 23 were experiencing them at the time of the interview. The women who were categorised as being high treatment utilisers were the most likely to describe them as being ‘debilitating’ (25), ‘awful’(15), ‘frustrating’(20), and ‘a real trial (14)’ They were frequently embarrassed by them and described them as interfering with daily activities. By comparison, low treatment utilisers were more likely to describe vasomotor symptoms as irritating (4). The causes, as far as they could be identified, were thought to be stress- and pressure-related, being in a hot environment or consuming hot food and drink (in terms of temperature and spiciness). Some women believed that exercise caused an increase in hot flushes but many were unable to predict when a hot flush would arrive and felt that the pattern of vasomotor symptoms was random. The language used to describe flushes and night sweats was dynamic and expressive in an attempt to represent the immediate and surprising nature of these symptoms. For example, the onset of a hot flush might be described as ‘coming on with a bang’ (13), ‘like an eruption (30)’ or ‘arriving like a freight train (27)’. The flush itself was ‘a wave of heat’ (1), ‘creeping over the body (3)’ or ‘crawling over the skin(7)’. Women talked of their eyes filling up with sweat, their legs sticking together, sweat in their hair and being drenched. The three quotes below graphically exemplify these feelings. 143 “Ooh they are very strange. Mine – sometimes they start at my head and go downwards and I feel as if ‘pheww!’ you are going to explode with the heat and I have to run out of the door or open the window or strip off my sweater or whatever I am wearing at the time and erm they don’t last that long. I know for some people they last a long time. I am lucky maybe – they don’t last too long. But I am very aware of them. And every now and again they will make me feel quite anxious. You feel as though your heart is going to go ‘oof’ and you have to catch your breath a bit” Low treatment utiliser (19) “Like I have a Bunsen burner inside of me and it’s trying to get out and I just feel I have caught fire. I am just incredibly hot and then about a second later I sweat like anything and that’s when I have to rush off and sit in the garden” High treatment utiliser (23) “I just get very, very, very thirsty and my skin feels nice and dry but very hot, like I’ve got a fever. And then all of a sudden – seconds later – the sweat starts pouring off me. So yeah – I get a kind of a fuzzy – I can’t quite explain – er oh it’s not fuzzy – it’s a bit like – have you ever had really, really, really bad food poisoning and you know when you are throwing up a lot and there’s one moment when you feel you are going to pass out – a bit like that. And everything starts like, like I’ve got pins and needles. Or something but not quite – my blood, my skin starts crawling. And then really thirsty, really thirsty and then the hot flush – drink lots of water – and then go to sleep because I cool right down and start shivering and then oh god just as you are about to go back to this nice sleep again I want to go to the loo. And that’s the cycle. And the loo thing is a nightmare” High treatment utiliser (7) Those women who had not had severe vasomotor symptoms found them to be less troublesome but, as these quotes illustrate, such experiences are more than just uncomfortable; they can be unbearable. Furthermore, the intensity of the experience could be described similarly by high and low treatment utilisers. It is hardly surprising, given the nature of these experiences, that vasomotor symptoms could have a large impact on daily life and work. One woman commented that she had to stop the car when driving because it was too dangerous to continue and three commented that they had to reduce working hours and, in one case, to retire early. Other less extreme changes were apparent, such as moving desks to be nearer to a window or asking to have a fan installed, or leaving the room to splash cold water on the face. One woman reported a discussion with an architect at her office concerning the installation of fans. The male architect was adamant that this would not be possible. The middle-aged, female workforce was equally adamant that fans were essential! Many of these changes were individually small but cumulatively onerous. Furthermore, being suddenly hot or having broken sleep could affect the ability to concentrate and hence, to work effectively. “I was irritable, obviously a lot of those things are going to be down to not having enough sleep, but I couldn’t retain information. Erm I couldn’t read referrals at work. I’d stop reading half way through and not – I’d have to go back because I couldn’t remember 144 what I was reading. I was using propelling pencils to underline things….” High treatment utiliser (5) Hot flushes and night sweats are the most commonly reported symptoms at menopause. Three-quarters of the women who participated at stage 1 reported having them and of the women who did, 34% reported that they were severe or very severe. Getting hot and sweaty at menopause tends to be treated as a joke but clearly the women in this sample did not think the experience was amusing. The experience and impact of sexual changes Whilst most people are aware of hot flushes and night sweats at menopause, an aspect that has received less overt attention is the change in sexual activity and desire. According to the British Menopause Society (Rees, Stevenson, Hope, Rozenberg, & Palacios, 2011, p. 12), women are staying sexually active into their 70s but in this study, 21 out of the 30 women mentioned problems of either loss of desire or vaginal dryness or both. Women recognised that something had changed since they were younger. “It’s a pain, it’s a nuisance but, you know, it could be worse. It’s something that I hope will eventually right itself. All this hormonal stuff and I know that when we have our own space or when we are on holiday, you know, when the house is empty and all the rest of it but it I do feel I had to put a ‘2’8 because I thought ‘yes, I am not quite the same as I was premenopause’ so I had to indicate it in some way because it bothers me. I wish I wasn’t like that” Low treatment utiliser (28) For some, this change has occurred because of vaginal dryness and sex has become too painful, but most focused on the reduction of or the complete disappearance of desire. This lack of passion was described by one woman as a loss of ‘the fire in the belly’ (23) and it was common for women to say that they just couldn’t be bothered about sex any more. “I think there are times when probably when it comes to actually wanting sex you need to be coaxed slightly more but I don’t think really the physical side – I don’t find it uncomfortable. But I think more of the emotional side – I sometimes think ‘oh go away’ – especially when you’re sweating – you don’t particularly feel that sexual” Low treatment utiliser (2) As the quote above indicates, having hot flushes was a contributory factor to the diminishment of desire because women would immediately become too hot. Night sweats also contributed to tiredness and lack of energy, which may be an additional factor in lack of interest. Although the change to sexual activity and desire was commonly reported, not every woman claimed to be distressed about this. Some, especially those who were in long term, secure 8 2 refers to the rating as moderate 145 relationships, claimed not to be too worried saying ‘I don’t care if it never comes back again’ (14). Others, however, were upset that they could no longer take any pleasure in sex and that they took longer to get aroused. However, the real fear was not about physical changes but emotional fears that a partner would think the problem was with themselves. Women expressed concerns that the loss of desire reduced intimacy with their partner, which might ultimately affect their relationship. This was of even more concern to women who had recently remarried or begun a new relationship. Conversely, women who did not have a current relationship claimed that the lack of desire was not an issue because there was no-one to have intercourse with. The biggest problem, therefore, with respect to the change to sexual desire was the lack of closeness. In our society, sex is considered to be part of a normal loving relationship and it is implied that a sexless relationship cannot be loving (Lindau et al., 2007). Women were at pains to counter this saying that that they still loved their partner despite being less interested in sex. In fact, many women commented that they were ‘shocked’ by these unexpected changes. “The main problem for me has been the sex drive. It seems to have disappeared and that is a big, big problem in our lives which I am trying to address. Because the trouble is I feel like the cat that got neutered. I feel neutered – I am indifferent to sex and it is really hard to explain to your partner. Because you know I am not bothered by it but he is and I have to address it. That is a big issue and so people say ‘now you don’t have to worry about contraceptives’ well that’s the least of my problems (laughs). I mean before, if you were with somebody that is part of life – you just get on with it. You use whatever you have to use and that is the price you pay. And to have absolutely no sex drive at all now. That has shocked me how much that has gone” High treatment utiliser (14) If women talked among themselves they found that changes to sexual desire were commonplace (‘all my friends are the same’). They joked about their lack of interest in sex (‘I’d rather have a cup of tea’) and were puzzled by the media’s obsession that women should feel the need to be sexually active in their 50s and 60s. “I have got another friend she used the patches – you know you can use those patches that you stick on – and she chose to do that because she was one of these people– I think it is to do with how attractive you want to feel to be honest, as a woman. That again is a huge media pressure” High treatment utiliser (5) So these changes were commonplace, but compared with other common symptoms at menopause, changes in sexual desire were not usually discussed with a GP. The survey showed that whilst 37% of women at this stage of life had sought treatment from a clinician for vasomotor symptoms, only 14% had done so for sexual problems. This cannot be purely because women failed to attribute sexual changes to menopause – 51% did, compared with 75% who attributed vasomotor symptoms to menopause. The reluctance may be partly due to embarrassment but partly because women were not persuaded that GPs take this issue seriously. 146 “It is just the thought that it is confirmation that you are getting older and er that your body is changing and to be honest with you one of the worst aspects of it was the loss of libido, I think, which doctors don’t really tend to take that seriously in women. And the only thing they can really suggest is testosterone which I can’t really take because I have suffered with acne all my life and that made it really, really bad so I had to stop that. So, erm, to be honest with you it is good that there is more research going on into that side of things. If a man couldn’t get an erection there is all sorts of things but if a woman doesn’t respond it is all ‘well that’s part of getting older, the menopause and all that’ which I think is a real shame” Low treatment utiliser (17) Furthermore, those who had been brave enough to approach their physicians tended to report bad experiences. For example, one was referred to a psycho-sexual counsellor despite saying that she believed she was suffering from bleeding and painful intercourse rather than a psychological problem. Another was told by her doctor that this state was normal because women at menopause have ‘atrophied’ (30), a phrase which upset her considerably. The underlying reasons for sexual changes of this nature may be hormonal – a decline in estrogen causing atrophic changes – and non-hormonal – life stresses, relationships and depression causing loss of interest. The impact of these changes can be physical – painful intercourse, or psychological – decreased desire. Among this sample, instances of decreased desire were highly prevalent. None of the women admitted to having strained relationships with their partner and hence, the changes were attributed to menopause. Thus, it is surprising how little this was expected or publicly acknowledged. The experience and impact of other physical symptoms Other physical symptoms that were mentioned were bladder problems, joint pains and leg cramp, changes to the body and disrupted sleep. Joint pains and muscular discomfort were sometimes mentioned but were not often associated with menopause (see the discussion about attribution below). For some women, bladder problems had become noticeably worse, necessitating frequent trips to the toilet. These physical problems were commented on but did not seem to be considered overly intrusive by these participants. Changes to the body tended to refer to putting on weight, thinning hair and dry skin. The majority of women accepted that this might be due to aging but some women became very upset about these changes, attributing them directly to menopause and claiming that this was the cause of a decline in confidence and self-esteem. “I think it does [relate to menopause]. I think just generally by the way it makes you feel. Your body changes where you start carrying more weight around the middle and I don’t know just generally it makes you feel down. Your self-esteem hits rock bottom a bit I think. There are skin changes of course and there are just lots of different changes” Low treatment utiliser (22) 147 This illustrates the difficulty of separating physical from psychological responses. A physical change will trigger an emotional response and a ‘vicious spiral’ may result. Incidences of disrupted sleep are a case in point. Difficulty sleeping was the second most frequently mentioned complaint at stage 1: 86% of women claimed to have difficulty getting to sleep, problems waking in the middle of the night, or waking up early. During the interviews women directly attributed this to menopause, arguing that these problems had become worse recently and that night sweats were the cause of disrupted sleep. Disrupted sleep in turn was the cause of extreme tiredness and exhaustion (90% of women at stage 1 claimed they were physically and mentally exhausted), and extreme tiredness and exhaustion was thought to lead to increased irritability, moodiness, lack of concentration and memory problems. And irritability, moodiness, poor memory and loss of concentration have an impact at work and at home in terms of reducing the ability to function normally. “I just burst into tears. I can’t sleep. I haven’t slept for some months now. I was getting very anxious. I couldn’t concentrate, my memory was awful. Erm it was awful. I had no energy” Low treatment utiliser (5) Whether it is true that menopause has a long term, detrimental effect on memory is open to debate (Maki et al., 2010) but this was the attribution made by many of the participants. Individually, each of these physical symptoms may be manageable, though as we have seen very severe vasomotor symptoms may not be. However, there is a cumulative impact of numerous symptoms over time that becomes difficult to ignore and increases the likelihood of seeking treatment. Specifically, the physical symptoms aggregate to produce a psychological response and it is this experience that will be discussed next. The psychological experience The psychological experience can best be defined as the emotional response to the changes described above but also the emotional response to the event itself. This can be quite profound. For example, menopause may be a tangible reminder for women that they are getting older. As one woman put it ‘I feel like it put me on the scrap heap’ (5), another described herself as being ‘on a dusty old shelf now’ (14), and one woman described herself as ‘lost and confused’ (26) at the time when symptoms were most severe. The realisation that the menopause was occurring could stir up complex emotions. “I think it is 50, it’s the menopause, it’s morbidity – it sounds very heavy stuff but it’s true – it is how I feel – the children have grown up, we’ve had the babies and we have got these physical symptoms and our depressed mood and we don’t feel sexy any more. We don’t feel attractive and people don’t look at you anymore. Not that it is important that they do but you are kind of ignored” Low treatment utiliser (23) 148 Increased moodiness was a frequent emotional response. Half the women interviewed commented that they were experiencing greater mood swings, which they attributed to menopause. In some cases the mood changes were extreme enough to cause tearfulness and despair and were described as being similar to depression. An associated complaint was increased irritability with other people, much less patience and a tendency to become more easily stressed and anxious about small things. Shouting at drivers on the road, being less understanding with people at work or shouting at family members were attributed to hormonal changes. One woman who was disabled and in a wheelchair had asked her medical consultant whether the increased irritability she was experiencing was because of her condition and he insisted that it was not. Thus, she assumed that the cause must be menopause. Another prevalent psychological complaint attributed to menopause was poor memory, described as feeling ‘foggy’(17), ‘woolly (1)’ or ‘fuzzy’(2). As evidence for this, women cited not being able to remember words, forgetting why they had gone into a room and forgetting diary appointments. Many believed that this was not merely a natural facet of getting older but was because of the exhaustion, sleeplessness and debilitating effects of menopause. Together, all these changes were emblematic of a loss of vibrancy and youthfulness. The dramatic change in emotions contributed to a loss of confidence and loss of motivation. Women described this as ‘a dimmer switch being turned down (24)’ and a ‘loss of zest for life’ (23), which was especially puzzling to those women who felt they had previously been sociable and lively. “And in a way I quite worry about that because I don’t want to continue feeling this way. I want to be back to how I was – life and soul of the party, you know, organising everything. I have never, ever been like this before in my life. I have always been happygo-lucky. Never used to worry about much. I was always the one out there organising things. Getting friends together. I have done it for years. Always done it. I was the one organising the Christmas party, organising weekends away, organising people having to meet in town and you know, go for a drink or curry, you know with friends – always me organising it. And I had a complete change over the last 2 years where it is ‘I can’t be bothered, too tired’” High treatment utiliser (13) Thus, it is not surprising that women believed that menopause was a major change in their lives. Seventy-nine per cent of the survey sample believed or strongly believed that menopause is a big change in women’s lives and 35% believed or strongly believed that women changed because of it. Whilst menopause was a to-be-expected stage of life, it would seem that the emotions accompanying it were not anticipated. Women had to accommodate these new feelings and this was not always easy. Accommodating to change: acceptance or denial The degree to which women were able to adapt to the new situation depended, to some extent, on the personality characteristics of the women in question. These individual differences are 149 exemplified by the two quotes below: “I am trying to deal with it. I am not taking it lying down. I suppose – I think that people have been trying to sell it [menopause] as a positive thing and it is not a positive thing. It is something that happens and it is neither good nor bad – you haven’t got any choice…………….. And I thought ‘I’m not having that’. People say ‘this is what happens during menopause and this and this’ and you think ‘I will fight it all the way’” High treatment utiliser (14) “I actually thought ‘whether it is or whether it isn’t as long as I know about the symptoms I have got concerns about I’ll just go with the flow and see what happens’. So that was it really…….. I struggle with people who just have days off and my husband will say ‘you are going to work and you are dying, you are silly’. I think ‘no, I have got a job to do and if I can do it I will do it’. If you stay at home you can make yourself feel worse. I am kind of a bit more get up and get on with it sort of thing and I think that has been my attitude to the menopause really” Low treatment utilisation (18) The high treatment utiliser expressed the view that she could, and should, fight menopause whereas the low treatment utiliser believed that she should adjust to it. The high treatment utilisers tended to express the view that menopause was part of aging but women do not have to ‘take it lying down’(14). It is possible to fight menopause and it is not necessary to accept discomfort or to suffer in silence. By comparison, the low treatment utilisers were more likely to comment that ‘you can’t turn the clock back (24)’, that women must learn to adapt and adjust and that they should ‘not make a big thing of it’ (10). These views explain how emotional stability and cognitive inflexibility predicted menopause symptom reporting and the propensity to use medical treatments at stage 1. Those who were emotionally stable were less reactive to stress and hence, were better equipped to cope with new, unfamiliar experiences. Those who demonstrated higher levels of cognitive inflexibility were less willing to accept unwanted private events and hence were less equipped to adapt to new experiences. In the case of menopause, women who were emotionally stable tended to report that the symptoms were less problematic and women who were cognitively inflexible tended to fight rather than adapt to the experience and hence, sought medical treatments more readily. Some of the women categorised as high treatment utilisers were in denial and it was evident that the adaptation process was taking longer for them than for the low treatment utilisers. There is a strong negative relationship between emotional stability and attribution of symptoms to menopause. At stage 1 the correlation coefficient between emotional stability and number of attributions was –0.59, indicating that the more neurotic women were, the more attributions to menopause were made. Furthermore, cognitive inflexibility was a significant predictor of the number of attributions made: b = 0.74, t (268) = 3.002, p = 0.003, CI95 [0.025; 0.122]. That is to say, women with higher levels of cognitive inflexibility made more attributions of symptoms to menopause. Thus, inherent personality traits can influence what is attributed to menopause and what is 150 not. A question of attribution During the discussion about frequency and intensity of symptoms, issues of attribution were never far from the surface. Bladder problems, tiredness, irritability, mood changes, reduction in libido, poor memory and concentration were attributed to menopause along with hot flushes and night sweats. The onset of these symptoms coincided with changes to the menstrual cycle and women described these as new symptoms or symptoms that had become worse since the menopause transition had started. These changes were sometimes described as ‘not being normal for me (27)’ or provoking a sense of ‘no longer feeling like myself’(1). When these unusual changes occurred women looked for an explanation because not knowing what was behind such changes could be frightening. There were some women who were so unnerved by what was happening to them that they thought that they must have a serious illness. “I was thinking ‘you can’t be menopausal, this is too awful and too terrible. Maybe I am dying of some awful illness’ (laughs)… and it wasn’t until the HRT kicked in and gave me such relief on these symptoms that I could think ‘well maybe it is menopause. It must be menopause’ I thought I was dying” Low treatment utiliser (5) Receiving confirmation of attribution was therefore reassuring because this made the experience less frightening and more understandable. The dominant explanation given by women for the presentation of the new symptoms was a decline in hormones. Women variously described this as a ‘lack of hormones’ or ‘missing hormones’, especially estrogen and, as women have no control over their hormonal fluctuations, they could then blame hormonal changes for any number of symptoms. There was definitely a tendency for some women to blame menopause for all manner of ailments rather than to consider other possibilities. As one woman said … “A lot of things seem to be blamed on menopause by women but women always do this. They do this with periods and pregnancy. Women are hormonal and always blame things on their hormones” Low treatment utiliser (29) Nevertheless, deciding what changes were due to menopause was a real problem for women. It was not always clear what was due to normal aging or what was due to other conditions. Whilst discussing the 7-day calendar, women reflected on whether their experiences were due to menopause or some other issue. They frequently commented that they were not really sure. For example, poor memory could be due to getting older, sleeplessness could be because of a stressful job, irritability could be because they happened to be anxious by nature, and a bad back could have been a preexisting problem that was more noticeable because of menopause. Joint aches and muscular discomfort were the least likely to be attributed to menopause and the fact that this was being asked 151 about in a study often prompted the response ‘I didn’t associate joint pains with menopause’ (4). On the other hand, it was easier to attribute some inexplicable or vague symptoms, such as poor concentration, to menopause because no other explanation was readily available. Thus, there was uncertainty about what could reasonably be ascribed to menopause. Women were unsure whether their reactions to situations were a reflection of how they would normally behave or whether they were reacting differently because of menopause. The role of attribution was validation: reassurance that the experience was normal and not necessarily problematic. In the absence of attribution, fears and anxieties could multiply. There are other unique female experiences such as pregnancy and childbirth where unfamiliar bodily changes are well documented. Although all pregnancies differ there is also common ground and women are provided with sufficient information in advance to allay their fears. This is not the case with menopause. Women were unsure that what they were experiencing was normal and the medical profession was unable to provide a benchmark of normality. In this context it is not surprising that some women panicked when they experienced unexpected physical and emotional changes. The theme of ‘what is normal?’ will be revisited later in the discussion. The Social Experience: knowledge and social learning The social experience of menopause only occurs at the point when women become aware of the physical and psychological changes described earlier. Up until that point most women had limited prior knowledge of menopause and had paid no heed to the fact that it is an inevitable part of the lifecourse. If they had thought about it at all, it was because they had witnessed their mother or a close relative or friend experiencing menopause but had assumed that this event was a long way off and so was not necessary to consider. The result was that the majority claimed ignorance and this ignorance led to myths and erroneous beliefs about when the onset of menopause occurs and what happens. Being ignorant of the facts meant that menopause could come as a complete shock. Women professed amazement that they knew so little about what to expect. They were astonished to hear that there is a phase called perimenopause and were unaware of the average age of onset of menopause and so concluded that they were too young to be experiencing it. A common belief was that menopause happened to older women – at least to women who were older than they were, by which they often meant women who were nearer to 60 rather than 50 years of age. “I don’t really know because I am the kind of person who would actually read and study this stuff and I… because for me I thought it doesn’t come for another ten years. I never thought. I always associated menopause with 56, 57 year olds. I never thought that menopause would come early. So when it came to me I think it was a shock” High treatment utiliser (15) 152 Women would say ‘I didn’t plan on having my menopause this early’ (18) or ‘Did you realise the age of menopause is so young’ (14) or ‘It was early for me at the age of 48’ (15). It is not clear why expectations of menopause have been pushed so far into the future but we may hypothesise that there has been a recalibration of the ‘social clock’. The theory of the social clock suggests that age norms exist for significant life-course events such as marriage and childbirth (Rook, Catalano, & Dooley, 1989). In today’s society women have come to believe that they can delay childbirth into their late 30s and 40s with limited consequences (Baldwin & Nord, 1984). It may be that such a delay has been transferred to menopause, which may explain why women seemed so surprised about the age of onset. The lack of knowledge came as a surprise to many of these women because they believed that they were well-informed about others aspects of the female reproductive cycle such as puberty, pregnancy or childbirth. Such ignorance meant that women felt unprepared for menopause and wondered why there had been no attempt to manage their expectations as there was with these other significant events. “…. like when you have your period, when you have your pregnancy you study about it before. When I wanted to get pregnant I read books, when I wanted to have a child I read books. I never read anything about menopause until it hit me and given that it was kind of haphazard – internet and asking here and there. I think the knowledge of what you are going to go through, certain symptoms and how to deal with it – if I had it before it would be amazing. If I knew what it was. Because one night I couldn’t sleep and I didn’t know what was wrong with me and I thought I had a temperature. It took me a week or so to realise that maybe this is the menopause” High treatment utiliser (15) The lack of forewarning was one of the reasons that women did not think about menopause until it was actually happening to them. In most instances their mothers had not prepared them, as they had with menstruation or childbirth, and the only prior information women possessed was that there was a decline in hormones, periods stopped, and women got hot flushes. A minority had heard about the loss of libido and some referred to mood swings and tearfulness. Several women reported that women could go mad at menopause with references to ‘an aunt who had committed suicide’(14), a mother who ‘went bonkers’ (6) and a woman who was ‘an absolute martyr to it and was a broken woman’ (26). It was not unheard of in earlier times for menopause to be associated with insanity (Foxcroft, 2009, p. 162) but it seemed surprising that this association was current. Most women were not aware of other physical symptoms or possible emotional and psychological changes and so these new sensations were a surprise. When faced with new sensations, some sought information from their GP and were surprised that the doctor could not offer definitive advice, though many would suggest hormone therapy. The main complaint was that doctors themselves were not well-informed about this stage of life and different doctors would provide different types of advice. Women sometimes left the surgery not 153 knowing what to believe and felt more confused than when they went in. This issue will be addressed in the section on the medical encounter. Those women who had tried to inform themselves about menopause found that advice was conflicting and were unsure how to evaluate the information they were getting. The women who were high treatment utilisers were frustrated by contradictory and confusing information and some demanded to be referred to a specialist clinic. By comparison, low treatment utilisers felt more comfortable in ‘knowing what works for you’ (16) and were happier to make decisions and not just rely on medical advice. “In the sense that you get talking to friends or family and they are saying things and then you read an article and it contradicts what they are saying. Cos I agree there are so many conflicting views and I agree that doctors don’t know everything but then I pushed to go to – first it was Charing Cross – to a clinic there to test me to find out what my hormones were. That is how I got to hear about Dr P’s menopause clinic and I pushed to go to his clinic” High treatment utiliser (12) “I just think there are lots of different views about it but you have to know when something works for you and when it doesn’t and you manage it the best you can really” Low treatment utiliser (16) Where does new knowledge come from? Information from mothers or friends is relied on most Once women had decided that they needed to acquire new knowledge about the menopause there were several available sources of information, including magazines, books and the internet. These would be accessed as a means of checking whether other women had the same experiences and to see whether the symptoms they had were ‘normal’. Although such sources were considered to be helpful there were concerns about their provenance. Furthermore, undertaking numerous internet searches could just add to the confusion and so in the absence of an obvious authority on the subject, women turned to other women. Talking with friends served a number of purposes. A major reason for opening discussions was to make comparisons. Twenty-two out of the 30 women interviewed commented that that they wanted to compare their experiences with those of others in order to work out what was normal and what was not. The outcome of this process was that women heard numerous stories, which merely led them to believe that every woman’s experience is different. Women also wanted to gauge whether their own experiences were better or worse than others. There were frequent stories of how badly other women suffered and how well they were doing in comparison. Downward comparison was common as a means of reassurance of coping and women were envious of other women who seemed to be having an easier time. “I think my colleagues and friends and that of a similar age we have all approached it in different ways. I have got a friend who has just gone through the menopause and had a really, really bad time with it as well and she is determined that it is not going to beat her 154 and in fact she has gone very physical. She has taken up lots of physical activities and stopped whatever changes that might be going on in her body. Other friends have gone ‘oh if it happens, it happens, you know. I have to get on with it’ High treatment utiliser (17) Talking with friends was also a means to get or to give treatment recommendations. This included recommendations for alternative remedies as well as biomedical treatments. Women would recommend specific doctors or clinics. A woman who had found that hormone therapy or testosterone had been effective would proselytise the benefits, and those women who were against hormone therapy would give reasons as to why other women should steer clear of it. It was noticeable that the low treatment utilisers used their friends’ warnings about hormone therapy as justification for not using it. The constant flow of information between women and their peer group explains how social support comes to moderate the uptake of non-biomedical treatments as shown in the causal model. Women are constantly hearing about and recommending the latest new supplement or treatment to their friends. Alternative remedies were considered to be natural and safe and so women willingly tried them in an attempt to alleviate symptoms, even if they were unsure if they actually worked. “…she said ‘you can try primrose oil’. I take that religiously but it doesn’t work. I’ve been taking primrose oil for years now and I don’t want to stop it – just in case. And I asked my colleague at work because she has tried everything under the sun and she says it’s a waste of time – waste of time and money. Because the latest one was you put on your abdomen and it vibrates and she bought that and she said ‘don’t, it’s a waste of time’” Low treatment utiliser (2) A major reason for discussing menopause with other women was that ‘talking helps’. Women swapped war stories and exchanged tips, and they were able to discuss their emotions and feelings openly among friends. Some women noted that the menopause had become a regular topic of conversation with their peer group, though it was mostly joked about rather than a subject of serious debate. Others said that they had suddenly begun to discuss the menopause and would do so to anybody who politely asked them ‘how are you?’ much to the consternation of the interlocutor. Older women who had been through menopause were a particularly important source of knowledge because they were able to give some indication of what happens afterwards. Such discussion helped to relieve feelings of anxiety but in the absence of a formal authority it could also reinforce folk beliefs and maintain myths. It is paradoxical that women seemed to talk freely to their friends about menopause whilst at the same time complaining that menopause is a taboo. This theme will be discussed later. Whilst friends were a source of immediate information and social comparison, the role of mothers was more complex. Mothers acted as a major mechanism of social learning about menopause in that they were important for the intergenerational transmission of core ideas. It is known that daughters often report a similar age of onset of menopause, suggesting that there is a heritable component (Murabito, Yang, Fox, Wilson, & Cupples, 2005; Van Asselt et al., 2004). However, mothers also played an important role in setting expectations of what might occur. 155 If a woman asked her mother about her experiences she could be met with a number of different responses. Some mothers were considered to be unhelpful in that they were unable or unwilling to tell their daughters of their own experiences. Some mothers claimed they had an easy time, saying that women made too much of a fuss nowadays. Some mothers had a bad time and tried to make sure that their daughter knew of this. One woman reported her mother as saying ‘look at me, look at this. This is what the menopause does to you. I am getting old’ (13). However, whether or not mothers had explicitly commented on their experiences of menopause, women drew conclusions from the behaviour they had witnessed. Several women commented that they had been unaware that their mother was going through menopause at the time because they were teenagers and did not pay attention to such things. However, looking back they had memories of their mother being inexplicably tearful or moody and of her throwing open windows and removing layers of clothing. Some recalled that their mother had a very bad time during menopause and admitted that this had raised concerns and helped to set their own expectations. “We all relate to our mothers, don’t we as females, and I talked to mum about it and she went through absolute hell – yes. And even – I remember she ended up having a hysterectomy in the end and I remember my son said ‘oh, you’ve had a hystericalectomy’ and she said ‘I can assure you there is nothing hysterical about it’. She just went through years of it. And my mum’s story was actually more bad in terms of the GPs because she was just flooding all the time. She went to Greece and she went through baby nappies, waterproof pants, shorts – the works. Basically just – it was completely ignored. Oh you got told ‘you’re flooding – just get on with it’” High treatment utiliser (8) More than half reported that their mother’s experiences were negative and hence assumed that they too would have a bad time. Only eight women reported a neutral comment about their mother’s experiences or that their mother ‘had it easy’. Thus, remembering that mother had a bad experience sets the mindset; menopause will be bad and this is to be expected. However, the mindset is also put in place as a result of cultural expectations. The cultural experience The cultural experience may be defined as the way women co-construct their view of menopause and develop the ‘network’ of ideas, metaphors and images used to make sense of their experiences (Moscovici, 1998, p. 243). Menopause, as discussed earlier, is an unanticipated experience for women, and their knowledge about it at the time of onset is poor to non-existent. Moscovici (2000) makes the point that the purpose of social representations is to make the unfamiliar familiar. Never has this been more relevant than in the case of menopause where representations serve as a way to give meaning to an unfamiliar experience, as a guide to behaviour and as a way to create a shared discourse. Representations of menopause emerged from a previous and current impoverished 156 knowledge-base, which meant that old wives tales co-existed alongside recent scientific explanations and these may be in conflict. Ideas about menopause were not static and there was a constant switching between representing menopause as natural and representing menopause as pathological, and between menopause as a medically treatable, long term condition and menopause as a temporary phase to be endured. Thus, it is unsurprising that women may hold multiple representations of menopause simultaneously, both positive and negative. The representations that emerged during the interviews confirmed the stage 1 analysis but there were additional themes that were relevant. The major constructions were menopause as a sign of aging, menopause as the end of fertility, menopause as a natural phase of life, menopause as an illness or malfunction of the body, and menopause as a process of change. Though the topic of ‘confusion’ was highly prevalent it cannot really be said to be a representation, as suggested by Lyon and Griffin (2003), because representing menopause as confusing fails to make the unfamiliar familiar, and hence does not guide behaviour. This was evident in the stage 1 analysis: 56% of women agreed that ‘women don’t know what to believe because there are so many conflicting views’, but a confusion scale did not emerge as a robust measure. Menopause as a signifier of aging was salient for both low and high treatment utilisers, with 17 out of the 30 women spontaneously responding to the question ‘what does menopause mean to you?’ by making some reference to it. Menopause and aging were deeply entwined because as one woman said ‘you don’t do them separately, do you?’(24). Of course, men also age and experience a decline in their faculties but they do not tend to have such a marked confirmation of aging as women do at the time of menopause. Many admitted to a fear of aging because aging represented loss of functions, loss of youth and loss of fertility and ultimately reminded women of their own mortality. “Do you want the absolute truth? We have just been talking about it and erm this is awfully heavy but your own mortality and turning of that age as non-having babies – that has gone and therefore you are getting older and therefore you are heading towards ultimately dying. Do you get that? It’s weird” Low treatment utiliser (23) In our society, aging is almost always associated with decline and incompetence. Few women felt able to comment on any positive aspects, though a minority referred to the fact that people become more confident and assertive with age and can be more respected. The discussion reflected an underlying belief that there was a double standard of aging where women were treated more harshly than men. Women believed that the media played a large role in making older women ‘invisible’ as a result of a focus on young, thin, nubile females and that this contributed to a lack of respect towards older women. Though menopause was symbolic of aging, becoming invisible or less respected was not directly linked to menopause. Rather it was a reflection of the fact that ‘the culture sees youth as more valuable’ (20). Rationally, women knew that menopause did not make women old (‘50 is not 80 or 90 you know’ (10)) but there was a feeling that society was particularly unforgiving of older women. The re-definition of what constitutes ‘old’ nowadays may also have some bearing on why women believe 157 that menopause happens to women who are older than them. If menopause is associated with being old but women do not think of themselves as old, then menopause must happen to older women as this 51 year old attests. “In my head it just hadn’t occurred to me that it would be that soon and I wasn’t prepared in a way that I would think I would have been. As unrealistic as it sounds but I would have thought ‘right, OK it’s going to happen now’ and I would be ready for it in a sense” High treatment utiliser (14) Aging meant decline and so could be feared and menopause meant aging and so was disliked. Thus, women did not want to admit or even expressed shame that they were menopausal because this would imply that they were in decline. This will be discussed in the section on taboo. The end of fertility and aging were often mentioned in the same sentence and hence menopause meant ‘being on the downhill slope’ (29). As with many aspects of menopause, women’s responses to this realisation were often contradictory. It was possible to be relieved about not menstruating any more whilst feeling a sense of loss that it was no longer possible to have children. A few women became quite tearful at the thought that they were no longer fertile whilst others had come to terms with the fact that it was just part of the cycle. The various representations of menopause were closely interlinked and the idea of the end of fertility was part of the construction of menopause as a natural phase of life. It is a truism that menopause is a natural phase of life and the words ‘a natural stage’ or ‘part of life’ were frequently invoked to describe it. Low treatment utilisers were especially likely to use this phrase and tended to go on to explain why this was a reason for seeking out natural remedies and avoiding hormone therapy. The women who adhered to the view that menopause was a natural phase found the idea of menopause being treated as an illness old-fashioned and offensive because it ‘categorises women as creatures who are victims of their own bodies and really can’t cope with life’(30). Others talked about menopause as an inevitable ‘condition’ that may be natural but could also be unpleasant. Every woman has to go through menopause but the high treatment utilisers rejected the idea that women have to accept discomfort or suffer. Menopause may be a natural phase but it can be made easier by being treated. This brings us to the construction of menopause as an illness or malfunction of the body. Embodied within this representation is the use of medical terminology to describe menopause. This could range from defining a list of symptoms to a discussion about the role of hormones. However, it was only the high treatment utilisers who subscribed to the idea that menopause can be treated as an illness. “In the respect of – if menopause didn’t exist and I for the last year-ish started to feel the way I felt I’d be putting myself down as having a horrible illness. And that is basically it. ... I am thinking that menopause is really a malfunction of the female woman’s body. I 158 feel like I am being poisoned by the fluctuations of hormones which are not compatible with my body's requirements”. High treatment utiliser (7) By comparison, the low treatment utilisers were likely to resist the description of menopause as a pathological condition: ten out of the 15 low treatment utilisers rejected the illness label preferring to talk about menopause as a process. Thus, the women who had a high propensity for treatment may be experiencing symptoms but they interpret these as being ‘out of the ordinary’ and as an illness that can be cured by drugs. The women who had a low propensity for treatment tended to interpret symptoms as part of a natural process that all women have to go through. Indeed, there was the occasional comment that implied that some women were making too much of a fuss about the transition. “I don’t think it is an illness. It is just a stage of your life like you start periods when you are 12 or 13 and that is not seen as an illness is it? You might get stomach ache but it is not an illness. I think you just have to get on with it and that’s my view here as well - you just have to get on with it” Low treatment utiliser (10) In some ways the distinction between menopause as a natural phase and menopause as an illness is a false dichotomy. Menopause can be a natural occurrence, but many bodily phenomena can be natural and people can still feel ill. Women recognised this to the extent that they were aware that menopause affected each woman differently and if a woman felt unwell, it was up to her to decide whether and what type of treatment was suitable. There were, however, individual differences with respect to seeking medical help as opposed to letting the process take its course. The high treatment utilisers were less willing to accept ‘suffering in silence’ and more likely to believe that drugs were an efficacious solution. The low treatment utilisers were more likely to construe menopause as a phase that women should learn to cope with and less willing to resort to medical treatments to secure relief. The majority of women represented menopause as a process of change, and 19 out of the 30 women described this process as a major physical and emotional transition. Whilst many described the process as difficult and trying, the high treatment utilisers tended to describe the change as wholly negative saying that it was difficult to find anything good at all to say about menopause ‘no matter how much other women pretend it is positive’(14). The low treatment utilisers were more likely to talk about a temporary phase where there was hope of something better in the future. The stage 1 analysis demonstrated that believing there is postmenopausal recovery was a predictor of lower levels of reporting symptom severity, and these views help to illuminate how this mechanism works. The low treatment utilisers seemed able to imagine that the future could be better whereas the high treatment utilisers focused on the unpleasantness of the here and now. The quotes below are indicative of these differing attitudes. 159 “I look at it as a temporary stage in my life until I get to grips with what is going on and find a solution to it. I am forever looking to find things that will help me to feel better” Low treatment utiliser (22) “The first thought that comes into my head is change of life which is an old fashioned saying that my mother used to use. To some extent it is quite right. It is a change to your life because it is a physical change and it is a mental change as well and erm I think it is very, very much to do with hormones and erm the fact that your body is not well and you think ‘that’s it’. It is not really viable for you to have children any more that is all finished with. And then you start to look like your mother” High treatment utiliser (17) Most agreed that whilst the change could be disruptive, it was a significant milestone that altered women both physically and emotionally. It seemed impossible to separate the emotional from the physical changes and changes of such magnitude were likely to be difficult. Even women who did not report severe symptoms felt that they had to adjust to a phase where they had to admit that they were no longer able to have children, no longer young and were, potentially, no longer healthy. One woman described the adjustment as difficult because ‘we women all like to be copers… but it is [hard] admitting it to yourself isn’t it?’(19). The women in this study often joked about menopause but there was an underlying seriousness about this transition that seemed hard to ignore and was rarely acknowledged publicly. Regardless of whether women were having an easy or difficult time at menopause, the changes experienced were indicators that women were changing from one state to another. By adhering to the idea that menopause is a natural phase, the low treatment utilisers found the transition to a new state less threatening. The high treatment utilisers, by adhering to a view that menopause is a malfunction of the body that is amenable to medical treatment, found the experience more distressing, in part because they were uncertain whether the new state they were entering would be a positive one. Finally, we come to the theme of confusion. There is no doubt that the messages women received were confusing. Women have come to believe that every woman experiences menopause differently and that doctors issue different and contradictory advice. This view is elaborated in the section on the medical encounter. The tendency for women to discuss these problems with other women only served to increase the folk tales and myths surrounding the subject. However, as women go from pre- to peri- to postmenopause their stock of knowledge improves, the levels of confusion diminish and with better knowledge women learn to adjust. This will be discussed in the section on ‘what is normal?’ ‘Dealing with it’: coping with the emotional and physical changes It was difficult to identify distinct categories of problem-focused and emotion-focused coping at menopause from the stage 1 study, probably because the categories lacked specificity. It was possible to be more precise during the interviews about the coping mechanisms used to deal with emotional and physical changes, and there was evidence of a range of practical, problem solving and 160 emotional categories of response. Problem-focused approaches fell into three categories: lifestyle and routine changes, use of natural remedies and use of biomedicine. Emotion-focused approaches were used to contextualise and frame the experience and these divided into two categories: positive emotional responses, such as being positive, talking with friends and trying to reassign emotions, and neutral/ negative emotional responses such as denial or distraction. Problem-focused coping Problem-focused coping took three forms: making routine changes, seeking out ‘natural’ remedies or seeking medical remedies. Regardless of whether or not women bought herbal remedies or used biomedicine, they often made myriad small adjustments to their lifestyle. This could include changing the type of clothes bought, wearing layers and removing clothes as required, carrying a fan or having one in the bedroom, opening windows and going out of doors (even in the coldest weather), sleeping with the window wide open (even in winter), avoiding hot baths, permanently having a summer weight duvet, throwing the duvet on and off all night, and subtle changes to diet such as drinking lots of water or avoiding alcohol and spicy foods. Individually, these changes seemed small but collectively could become onerous and were a low level, persistent irritation. Most women had thought about using herbal remedies and 21 of the 30 women mentioned these. Items such as Maca, vitamin D, black cohosh, red clover, Menopace, sage, Ginkgo biloba for memory, flower essences to try and keep calm (described as a ‘magic potion’ (6) by one participant), soya milk, and acupuncture had been tried. Women who had sought medical treatments also tended to make use of ‘natural’ remedies, though low treatment utilisers mentioned more types of herbal remedies than high treatment utilisers. Some GPs had recommended herbal remedies and the general attitude was ‘I might as well try it, it can’t hurt’. Despite trying a variety of remedies it was common to hear women complain that they were unsure if they were efficacious with a few stating that ‘they did not do a thing’ whilst others believed that ‘perhaps they worked for a while and then stopped’. Many carried on using these remedies ‘just in case’. It was almost as if using the natural remedies was like a talisman. “I am sure it works for people who believe in them. If you don’t believe them, it is a bit like going to church when you have no real deep beliefs in God. You know you are only doing it for the form” High treatment utiliser (25) Women would often have spoken to their GP about changes they were experiencing but the high treatment utilisers discussed medical treatments more frequently. The most obvious medical solution was to take hormone therapy, in the form of tablets, patches or the Mirena coil. A few had tried testosterone patches (no longer licensed in the UK and so difficult to source) and two women had been recommended anti-depressants. Some had tried HT but were no longer using it either because of side-effects or because the GP considered that it was no longer safe to continue. Those women who were ex-users of HT had not necessarily wanted to stop using it because hot flushes and mood swings 161 returned. Experiences of seeking medical help and the decision to use HT will be described in the section on the medical encounter. Emotion-focused coping There were two categories of emotion-focused coping that were used to contextualise and frame the experience. Positive emotional responses included adjusting, being positive, talking with friends. Trying to reassign emotions and neutral/ negative emotional responses included denial and distraction. As discussed earlier, talking with friends was an important source of emotional support not least because friends could provide reassurance that what was being experienced was not uncommon or unusual. However, women had found a variety of ways to reassure themselves. Maintaining a positive outlook was considered to be important as was trying to think about the experience differently. This could take different forms such as reminding oneself that hot flushes were not harmful, that most women go through it, that there was no need to panic and identifying mechanisms to relax and reduce stress. “You repeat the word ‘the’ and you say it in different pitches or lengths and it stops you from thinking. It is almost like left side, right side – it stops you from thinking and worrying because you are focusing on a light or a dot or whatever. I started using that within the last 12 months and that has been brilliant. I just go with it and I don’t think about it. It helps me block out thoughts you have in the middle of the night” Low treatment utiliser (28) ‘Going with the flow’ was more likely to be mentioned by low treatment utilisers, who felt they were able to adapt and adjust, but the concept of ‘just dealing with it’ was mentioned by most participants. This meant ‘being stoical’(8), ‘learning to live with it’(14), ‘not labelling menopause as an illness’(9), and not making a ‘big song and dance out of it’(10). However, denial and distraction, which might be considered negative, could be just as effective and 12 out of the 30 participants mentioned this form of coping. The medical encounter: GPs and the decision to take or not to take hormone therapy Compared with all other professions doctors are consistently rated as the most trustworthy (Ipsos Mori, 2009, p. 3), yet the most frequent comment about clinicians in the context of menopause was that they did not treat menopause seriously, were often dismissive and the advice they gave was contradictory. Twenty-two women out of 30 complained that each doctor they had seen, or heard about from friends, responded differently and had provided different information. “Some have been to the GP and some have had experiences where the GP has been quite dismissive and just said ‘oh it is probably the menopause’ and sent them home and some have had experiences where the GP has been very sympathetic and have said ‘I can do a blood test and that would give some indication of whether you are menopausal or not – but we still can’t be sure’, some have had GPs saying ‘ I can do a blood test, I can tell 162 you definitely’. There seems to be a lot of conflicting information and experience out there” Low treatment utiliser (3) This tendency was not considered to be gender specific; female doctors seemed no more likely to be understanding than male doctors. The conclusion reached was that menopause was not a priority for most clinicians, because they showed limited interest. Some women reported that their GPs were actively unhelpful. For example saying ‘it’s what you get isn’t it, go away and see what happens’(30) rather than listening to concerns or explaining what is occurring and what type of relief may be available. Women were dismayed that doctors seemed unable to give a precise diagnosis and blood tests were not definitive. The lack of precision in terms of diagnosis led to the belief that GPs were not well informed about menopause. Women criticised GPs for not listening to them when they reported symptoms, such as hot flushes, in their mid-40s, and several participants commented that they had been told they were too young to be experiencing menopause, despite the fact that earlier menopause was a familial trait. Furthermore, there was a concern that GPs may understand the physical aspects of menopause but knew little about the emotional and psychological aspects and so were ill equipped to deal with women who came to them for advice. “I think a lot of doctors think they have more important things to worry about than menopause you know. Er….and sometimes their solution to it is either to put you straight onto HRT or not. I think it is a sort of condition that has to be treated with 2 or 3 approaches for each person. It isn’t solely a medical thing and it isn’t purely erm something you have to deal with by yourself. But you do need a support system of some sort”. High treatment utiliser (25) Clinicians were expected, perhaps unfairly, to be knowledgeable about all common conditions and so women were surprised that the advice they received was unclear or confusing. They commented that GPs were sometimes unwilling to recommend hormone therapy or had changed their minds about the safety and benefits of it. Nevertheless, the relationship with the GP was viewed as important because the role of the GP with respect to menopause was to ‘validate’ symptoms and to reassure. Not all women complained about their GPs and ten women said that their GP had been understanding and sympathetic. The belief that GPs lacked expert knowledge of menopause had led some women to ‘fight’ to be referred to a specialist clinic where being seen by someone who appeared well-informed was instrumental in allaying fears. “I have been telling every woman I know [about the clinic]. ‘Listen, try to find out where is a menopause clinic because at least you go to somebody who understands what you are talking about’. And they are dealing with people like yourself. When I go to my GP, most 163 probably, he will see one woman in a day with menopause, the rest of it are other kind of conditions” High treatment utiliser (15) Unfortunately, provision of specialist clinics is patchy and several of the women recruited via the GP surgeries said they knew of no specialist clinics in their area, though in fact there is one in Nottingham. Even if a clinician took a woman’s concerns seriously and was sympathetic the only treatment on offer was hormone therapy, and it is to this we turn next. This sample was deliberately selected to be non-users of hormone therapy but eight were previous users and two had recently elected to use hormone therapy so it was possible to discuss with them the reasons for deciding to use or not to use HT. The women who had discussed menopause with their GP felt that hormone therapy was offered as the first and only solution to relieve symptoms and, as discussed earlier, it was not an acceptable solution for many women. One woman described it as a treatment that was so ubiquitous it was like ‘being offered antibiotics to cure an infection’ (15). The majority were aware of the controversy about HT, though only one referred specifically to the Million Women Study. As a result of talking with friends, reading magazines and discussing the situation with their doctor they had received mixed reports. Almost all referred to the increased risk of cancer and a minority had also heard of protective benefits to bones and joints and improvements to skin and libido. Therefore, making the decision to use HT was difficult because it was not always easy to work out whether the advantages outweighed the disadvantages, and the plethora of statistics on the subject did not clarify the situation. “There is a lot of information that is put your way statistically, i.e. statistically your chances are very small of exacerbating breast cancers and this, that and the other. At the same time what we have to understand is that it also could be of benefit for your heart, benefit for osteoporosis and erm so the plusses and minuses are still extraordinarily debateable among the medical profession, so who am I to properly understand this – not having any [medical knowledge]” High treatment utiliser (26) The women who had decided to use HT had done so because the symptoms had gone beyond an acceptable threshold and become intrusive. One woman said: ‘I was so desperate, I would have taken cyanide…I was so desperate at that point’ (5). Others had weighed up the pros and cons and come to the decision that the risks were very small and that it was okay to use HT. Of the ten women who had used or had just started using HT the benefits were obvious. They reported a reduction or complete elimination of hot flushes and night sweats, better sleep patterns, more energy, improved skin tone and less joint pain. Taking medicine of any kind could have side-effects but they considered these side-effects were acceptable if it reduced women’s suffering. Thus, for those women who perceived that they had a poor quality of life and could not cope with menopause symptoms, hormone 164 therapy was like a ‘magic cure’ that they were reluctant to stop taking. Ex-users of HT had usually been told by their GP to stop taking it because of health risks and whilst they were prepared to listen to and act on this advice, they were not happy about it. The women who had decided not to use HT did so for a variety of reasons. A few mentioned that there was a history of breast cancer in the family and others that they were scared of getting cancer and hence did not feel it was worth the risk. The main reason given was that HT was ‘unnatural’ and therefore one should try to avoid it if possible. Most women could cite a friend who ‘swears by’ HT and was enviably energetic and youthful. However, they personally had decided not to use HT because they did not like the idea of ‘messing around with hormones’ (28) and did not trust the biomedical solution, preferring instead to use ‘natural’ remedies. This was true for both high and low treatment utilisers. Many had heard stories from other women about coming off HT and then experiencing symptoms when they were much older and had decided that it was better to put up with the discomfort now rather than delay it until later. Regardless of whether or not women were users of HT, were ex-users or had eschewed this solution, all believed that the critical factor was choice. Doctors should have the choice of offering HT and women should be free to choose it. “Nothing is black and white. You can’t have one person saying ‘it’s natural, doctors shouldn’t be doing this or that’ because the women sitting right next to you might really need something because they have got different symptoms. So I am not keen on people doing the ‘it should be like this’ thing. I think it is natural but everybody must have a choice about how they go about it” High treatment utiliser (4) However, whilst choice was fundamental, the problem was that there was only one choice – hormone therapy – and to that extent this was really no choice at all. Women evinced surprise that doctors had no other suggestions other than HT and often asked if there were other possibilities only to be told ‘that’s life, HRT or nothing’. Managing social and cultural expectations As well as coping with physical and emotional changes, women have had to learn how to manage the social and cultural expectations surrounding menopause. This is not as straightforward as it should be because there are many myths surrounding the topic, a sense of embarrassment and a feeling that, despite women being more open about menopause nowadays, it is still taboo. Eighteen of the 30 women spontaneously brought up the issue of menopause being taboo. It was described as ‘a conspiracy of silence’, ‘an embarrassing problem’ and as ‘having a shame factor’. This belief is a paradox as these participants were clearly prepared to discuss menopause openly with the interviewer and yet simultaneously believed that menopause is not a topic for conversation. Several women expressed the view that previous generations were unwilling to acknowledge menopause although nowadays women were more open. Nevertheless, some of the participants were 165 aware of instances where women refused to acknowledge menopause or had husbands who disliked talking about emotional issues. Three explanations were suggested as to why menopause remains taboo: embarrassment, the associations with sex and synonymity with aging. All three directly related to the representations of menopause discussed earlier. Embarrassment reflects the illness belief in that women expressed concern that others would think they were unwell or incapable. One high treatment utiliser likened talking about menopause to being ‘a bit like talking about thrush or something…. you don’t want people to know’ (7). A low treatment utiliser stated that if you discuss symptoms ‘you feel silly… like a hypochondriac’ (23). Furthermore, it is embarrassing to own up to bladder problems, vaginal dryness or low libido because this would mean admitting to no longer being fertile or sexually desirable. “…because I think people are embarrassed talking about it. There is so much pressure on women now I think in the media to be sexually active and out there until they are 92 and off with young men or whatever they want to be off with. It is just this whole image that we are presented with. That we don’t need to age now and sex is all part of that isn’t it? And you must be having a great time because now you know you can do what you like” High treatment utiliser (30) However, the main reason for the taboo is related to the representation of menopause as being synonymous with aging and invisibility. In our society, aging is undesirable – even feared. Youth is revered and old people go unnoticed, are disrespected, and considered incompetent (Cuddy, Norton, & Fiske, 2005), Thus, admitting to being in menopause meant admitting to oneself and to others that one was old and no longer competent. “It draws attention to yourself in some way for the wrong reasons. Because I don’t look 53, I probably look five or so years younger, a tiny bit younger. I don’t look like a lot of women my age, although I think I have aged a lot (because of menopause) but when I am sitting around going pink in the face I am automatically put into the sort of ‘young’ geriatric” Low treatment utiliser (28) There were several ways that women choose to manage these expectations. They could be in denial, they could resist the stereotypes or they could accept and adapt. Being in denial could take the form of not being prepared to admit that one is entering menopause. This may be the underlying reason for the fact that so many women evinced surprise at the age of onset of menopause. It could also take the form of not admitting to being menopausal to others in case they made the type of assumption referred to by the participant above. Women expressed a fear that if they started talking about ‘bits and bobs and saggy tits’ (26) others would lose respect for them or stop treating them as a friend and start thinking of them as an ‘older auntie’. Another strategy used was not to take menopause seriously and to make a joke out of it. Many acknowledged that there was a comedic element to menopause and that by joking about having ‘a senior moment’ or ‘my own personal summer’ the situation could be made more acceptable. It also 166 served as a code which women of a similar age would understand but which obviated the need to discuss anything more seriously. Despite all the negative connotations of aging females and menopausal bodies, there were signs of resistance. Women acknowledged the stereotype of ‘women becoming batty and fat and zonky’ (22) at menopause whilst at the same time averring that this was untrue. They argued that they could ensure they were treated with respect, refuse to put up with rudeness and could assert their right to be noticed. For some, this meant actively fighting the aging process by maintaining a healthy diet, keeping a low bodyweight and remaining active. For others, fighting the aging stereotype was a question of keeping a young mindset in terms of how they approached their work and other people. Although the representation of menopause as symbolic of aging was important it did not predict symptom reporting. One reason for this may be the very interdependence of aging and menopause; women were simply unable to separate one from the other. Another possibility is that becoming invisible or disrespected is a general facet of aging but cannot be solely attributed to menopause. Adapting to menopause was discussed in the section on dealing with the emotional changes. It was evident that some women chose to ‘fight’ menopause and aging whereas others, usually the low treatment utilisers, were more accepting of it. Part of acceptance was the recognition that menopause is a universal stage of life for women. Women across the world experience menopause and ‘probably just get on with it and don’t make an issue of it at all’ (10). Not labelling menopause as an illness but as a temporary, transitional phase was an important aspect of positioning menopause as a normal stage of life. “I think to be honest some people are psychologically better able to cope with things but I was talking to friends and colleagues who are of a similar age and have gone through it. I think they suffered just as much but they don’t – they think ‘it is natural, I just have to go through it’ High treatment utiliser (17) Taking control by ‘taking things into your own hands’ was a key component of adapting to menopause, as was acquiring more information and better understanding of the situation. One woman commented that the consequence of menopause remaining taboo and not openly discussed was that others (usually men) framed the debate and made decisions on behalf of women. A further consequence of the taboo status of menopause was, of course, poor or incorrect knowledge and the promulgation of myths. For example, one woman said that hormone therapy can make women go bald and, as noted earlier, several continued to believe that women ‘go mad at menopause’. The big issue: what is normal? The critical issue for women in terms of being able to accept or adapt to the changes was that women had no benchmark of normality. Inadequate knowledge, the lack of open discussion, and a failure to set expectations meant that the most frequently asked question was ‘is this normal?’ 167 “I realised this is actually menopause, only then – actually I got double HRT and began to sleep again–- you start to try and piece these things together and think ‘how on earth did that happen?’ and also talking to other women to find out what their experiences are – because when you are suddenly going through something and you think ‘what the hell is it?’ It is only at that time that you want to know about other women, don’t you? To know how normal you are and what it’s like and how others cope. Erm so only really since then and I’ve been trying to piece things together and what about this and looking back that I have made those link” High treatment utiliser (5) The quote above is typical of the type of issues raised by women concerning normality. Twenty-seven out of the 30 participants asked the question ‘what is normal?’ in some respect. This was the main reason for comparing their own experiences with other women; to find out whether others had the same or different symptoms and to discover whether they were better or worse. The result of this extensive process of comparison was, more often than not, more confusion. Women quickly discovered that some women had much worse problems, such as having to change sheets in the middle of the night, and some women barely noticed any changes. Some women had flushes for a few months whilst some women had hot flushes into their seventies. It was the uncertainty that was the main source of worry for women, and uncertainty was the main reason for the search for a benchmark of normality. The level of information seeking was made more intense because, as discussed earlier, GPs were unable to provide specific answers to many of the questions that women asked. The questions women wanted answered were ‘At what age should I expect to start menopause?’, ‘Should I expect this symptom?’, ‘For how long will these symptoms persist?’, and, ‘Is hormone treatment safe?’ Women were not sure that what they were experiencing was normal and many doctors were unable to define what constituted normality. The failure of clinicians to provide some degree of certainty was a primary cause of the loss of faith in the medical profession in terms of advice provided about menopause. Discussion Diaries and interviews were instrumental in helping women to describe their experiences. This process highlighted that menopause is more than a physiological change brought about by a decline in hormones but is also experienced socially, psychologically and culturally. The biological experience was most closely associated with vasomotor symptoms and changes to sexual activity and desire. These biological changes could be disruptive and distressing. The psychological experience of menopause was highly emotional because it was linked to concepts of aging and loss of fertility. For this reason, some women felt unable to accept the new situation and would actively ‘fight’ it. It was often difficult for women to know whether to attribute changes to menopause or to general aging and low levels of knowledge about what to expect at menopause made attributions more difficult. Furthermore, emotional responses were intertwined with 168 physical experiences so that there could be a ‘vicious’ spiral whereby a severe physical symptom prompted an emotional response which in turn prompted a severe physical symptom and so on. The social context in which menopause occurs is critical. Most women get their knowledge from other women though mothers were instrumental in inter-generational transmission of the idea that women should expect to be ill at menopause. The transmission of information between women about what happens at menopause has two consequences: one is that misinformation and myths are perpetuated and the other is that recommendations for new treatments, especially non-biomedical treatments, are passed between women. This, in part, explains why there is a moderating effect of social support on non-biomedical treatment utilisation; there is an increase in the uptake of nonbiomedical treatments because women recommend alternative treatments to each other. Despite the fact that women talk among themselves about menopause, menopause was still described as taboo. The reasons for this related to feeling embarrassed about overt hot flushes, the association of menopause with sex and loss of fertility and a negative association with aging. This taboo means that menopause is not a topic of conversation and most women claimed that they had poor or no knowledge of menopause prior to onset. Although the medical profession is usually a main source of knowledge in other areas, this was not always the case with menopause. Women believed that they received conflicting and confusing advice about menopause, and that there was no specific source of authority. This contributes to the fact that doctors were not seen as experts in this area. The cultural experience is important because women co-construct their view of menopause within a culture that continues to represent menopause as a negative experience that signifies aging and illness. This is despite the fact that women in their fifties are still active in the home and the workplace. It has been suggested that constructing menopause as a medical illness and constructing menopause as a natural phase of life is dichotomous. However, the women in this study saw this as a false dichotomy because it is possible for a condition to be both an illness and a natural phase. The four different aspects of menopause – biological, psychological, social and cultural – together mean that menopause is a significant period in women’s lives but this period of change is rarely acknowledged openly. Women have developed a range of coping strategies which often mean making myriad small changes to their daily lives. Individually these small adaptations (such as wearing layers or opening windows) are not problematic but collectively and over time can seem onerous. Most women adapt and accept but some try to ‘fight’ what is happening to them. The biggest concern, expressed by almost all the women interviewed, was that neither they nor their clinicians could define normality. Inability to define normality was problematic because women felt that their expectations of menopause were not managed to the same degree as other female reproductive experiences such as pregnancy or childbirth. This failure to define normality may make the adaptation to a new phase of life more difficult. 169 Summary of findings The experience of menopause operates at several different interlinked levels: biological, psychological, social and cultural Women have inadequate knowledge of menopause and can be surprised and distressed by its onset. Compared with other female reproductive experiences, menopause is little talked of and is still ‘taboo’ Menopause is regarded by women as a significant phenomenon that changes them but this is not often acknowledged publicly Women and clinicians have difficulty in making attributions to menopause Women nor clinicians are able to define ‘normality’ at menopause 170 Chapter 10: Discussion This study on the meanings of menopause was designed with the overall aim of identifying the bio-psycho-social predictors of treatment at menopause. Specific aims were to a) understand how women make sense of menopause, b) assess which factors predict symptom severity c) assess which factors predict treatment utilisation d) explore how women’s beliefs about menopause are located in the social context of their daily lives. Three studies were designed to address these aims. Study 1 used a questionnaire to ask women about their beliefs about the experience. From these, the prevalent social constructions were identified and new measures of beliefs about menopause were derived to be used in study 2. Study 2 was a questionnaire that identified factors that predicted symptom severity and treatment utilisation and investigated the pathways to treatment and study 3 was a qualitative study that explored how women’s beliefs about menopause were located within their social context. How do women make sense of menopause? Women’s beliefs about menopause are multi-faceted and often contradictory. The majority of women agree that menopause is a big change in women’s lives and that menopause is a natural stage. Nevertheless, almost half believe that ‘at menopause most women will feel physically and emotionally unwell’. In addition, it can be a period of uncertainty and confusion. Women believe that ‘every woman experiences menopause differently and there is no one expert to go to’ and that ‘even doctors are not experts about menopause’. Multiple contradictions were evident in the data. Menopause can be a malfunction of the body but not an illness, it may be temporary but women worry that it may go on for a long time, it is a normal phase but it is extraordinary, it is universal but a taboo that is not discussed openly, and it is a significant milestone but nothing to make a fuss about. This would seem to contradict the idea that people need to find ways to reduce the discomfort of holding two conflicting ideas simultaneously by changing one or more of the inconsistent cognitions (Festinger, Riecken, & Schachter, 1956). Instead we see that cognitive polyphasia is at work: there is a co-existence of plural and contradictory ways of thinking used in different ways by women to make sense of their everyday lives (Jovchelovitch, 2002). Friling (2012) argues that ‘cognitive polyphasia might be a common sense tool for coping with the dynamic, complex world’. Uncertainty about what to attribute to menopause, the inability to identify what is normal and the contradictory information about menopause makes it all the more likely that seemingly incompatible representations will be used. It was not unusual to hear women make comments that seemed to be contradictory within the same sentence. 171 “Maybe it’s natural but it could be natural and not as bad… So (pause) – I don’t know – I don’t think it’s natural, I really don’t. And ‘nothing out of the ordinary’; it’s plenty out of the ordinary. And you know what? Give me the drugs” High Treatment Utiliser (7) “I don’t think it is anything out of the ordinary. Well it depends what you mean about out of the ordinary. It is out of the ordinary when there you are going along and then…” Low treatment utiliser (11) Studies 1 and 2 confirmed the presence of four social constructions of menopause: Invisible and unvalued, Illness, Treatment and Postmenopausal recovery. The Invisible and unvalued belief depicts menopause as a symbol of aging and invisibility, the Illness belief portrays menopause as a time when women should expect to be unwell, the Treatment belief also represents menopause as an illness but specifically one that is amenable to treatment with hormone therapy. In this construct, hormone therapy is seen as capable of reducing symptoms, preventing osteoporosis, delaying the signs of aging and improving sex life. The Postmenopausal recovery belief is positive in that it depicts menopause as a temporary phase after which women can expect life to be better and more interesting. The existence of these social constructions of menopause is important because they directly influence how women interpret the menopause symptoms they are experiencing and the treatments they use as a result. There were no significant differences by menopausal status in the degree to which women held these beliefs. For example, postmenopausal women were no more likely to believe in Postmenopausal recovery than pre- or perimenopausal women (this was the case in studies 1 and 2). This suggests that these are widely held beliefs in our society that may be present well before the onset of menopause. Given the level of contradictory belief it is perhaps surprising that a construct representing ambivalence and confusion did not emerge as suggested by Lyons & Griffin (2003). There was widespread acknowledgment that advice and information about menopause was inconsistent over time and varied depending on the source of the information. Wagner et al. (1999) comment that events and phenomena that disrupt the life-course are threatening and unfamiliar and, as we have seen, women initially find menopause unexpected and frightening. One of the roles of social representations is to anchor coping responses in something familiar so as to be able to understand the phenomenon: by naming it and attributing characteristics, it can be communicated and talked about. It may be that a construction that is itself about confusion and hence is unfamiliar and frightening is unable to perform this role and so cannot emerge as a concrete entity. Problematically, there is still a ‘conspiracy of silence’ surrounding menopause. Discussion about menopause occurs mainly between women of the same age who are equally (ill-) informed and who use humour to mask the seriousness of the emotions surrounding it. The consequence is that more confusion is created, the situation never becomes familiar and there is no representation to guide behaviour. 172 It is worth considering where these beliefs come from. Study 3 highlighted that there are three important mechanisms in the development and reinforcement of social constructions about menopause: intergenerational transmission between mothers and daughters, peer group information transmission, and social stereotyping about aging and specifically about aging women. Inter-generational transmission of health beliefs has been identified for a range of disparate conditions including somatoform disorder and gastro-intestinal illness behaviour (Levy, Whitehead, Korff, & Feld, 2000; Marshall, Jones, Ramchandani, Stein, & Bass, 2007). It was evident that some mothers (though not all) acted as a major mechanism of social learning about menopause. There were those women whose mothers had experienced problems during menopause and had made it clear to their daughters that this period of life was likely to be difficult. This may, in part, be behind the relatively high level of agreement (47%) with the statement ‘At menopause most women will feel physically and emotionally unwell’. Other women recalled that they had been aware that their mother had been having difficulties at this time of life but that the topic of menopause had not been mentioned within the family. Women were dismayed and puzzled that their mothers had not forewarned them about menopause as they had with other female reproductive experiences. “I said ‘you never told me about this (laughs). Why didn’t you tell me?’ And she said ‘oh that was so long ago, I can’t even remember’…. I said to my mum, ‘you told me about puberty, you managed my expectations about my first periods so I didn’t have a heart attack when the blood turns up. You did all this but you never ever sat me down and talked to me about the possibility of menopause and what it might mean…. You could have said something mum – something” High treatment utiliser (7) In the absence of maternal support, women turned to their peer group and in the absence of an authority on menopause, friends were the most trusted source of information and support. The major role of friends, apart from passing on tips about treatments, was to act as a source of social comparison; a means of establishing whether their opinions and behaviours were a correct or socially approved way of behaving (Festinger, 1954). Women felt the need to make comparisons as a way of working out whether their own experiences were normal. These comparisons tended to be downward in order to enhance their subjective wellbeing through comparison with a less fortunate other (Wills, 1981). Thus, the reference point was other women who were having a worse time than they were because they wanted to ‘know what everyone else is suffering from’. “Oh yes. I have friends my age – we all suffer. One of them went on HRT for five years and started having really high blood pressure. Then they gave her medication to keep her blood pressure down and she did it because her mum had some kind of cancer and she didn’t want to get it – cancer of the ovaries or whatever – she took it. I have another friend who is against any medical drugs and she went herbal and alternative and she was in a state for three years. Yes you talk to your peers obviously and we are cursing the fact that we are women (laughs)” High treatment utiliser (15) This type of comparison strengthens the idea that menopause is a time of suffering for women and can reinforce rather than dispel myths about this period of life. Thus, the idea that 173 ‘women go mad at menopause’ persists (Atwood, McElgun, Celin, & McGrath, 2008) as do new myths about the effects of hormone therapy – ‘hormone therapy makes women go bald’(4) – and of the efficacy of untested treatments. Finally, beliefs about menopause are transmitted through social stereotyping about aging. Stereotypes of aging abound in our society and older people are routinely associated with incompetence and poor performance (Cuddy, Norton, & Fiske, 2005; Hess, Auman, Colcombe, & Rahhal, 2003). These stereotypes apply equally to men and to women, but it has been postulated that age stereotyping interacts with gender stereotyping in a way that is more problematic for women than for men, so that women feel socially invisible at an earlier age than their male counterparts (Arber & Ginn, 1991; Sherman, 1997). Menopause as a signifier of aging was highly salient for the women in this study. Fifty-four per cent agreed that ‘older women are not valued in our society’ and 51% agreed that ‘the menopause is the beginning of getting old’. Women expressed concern that admitting to being menopausal would cause others to regard them as old and incompetent, especially at work, and so it is not surprising that some women tried to ‘fight it all the way’ Therefore, in answer to the question, ‘how do women make sense of menopause?’ we might conclude that women make use of plural and contradictory beliefs, use social representations to guide behaviour and social comparisons with other menopausal women to interpret the menopause experience. Which factors predict symptom severity? As might be expected, peri- and postmenopausal women report higher mean intensity of symptoms than women who are premenopause and women who are postmenopausal report significantly higher levels of sleep problems, exhaustion, anxiety, bladder problems, joint & muscular discomfort and vasomotor symptoms than perimenopausal women. The most commonly reported symptoms were physical and mental exhaustion and sleep problems. The symptoms where there were a higher proportion of women describing them as severe or very severe were sexual problems, sleep problems and vasomotor symptoms. Interestingly, perimenopausal women reported the highest level of symptom severity in the psychological domain. Sociodemographic variables were not important with respect to predicting symptom severity, though there was some small effect of being medium level education, and being intermediate social status. In keeping with previous research, surgical menopause was predictive of higher levels of symptom severity, as was making more attributions of symptoms to menopause. Some women are more inclined than others to attribute symptoms to menopause rather than attributing them to other causes. It is also possible that consulting a doctor for any menopause symptom reinforces the belief that other changes at this time of life can be attributed to menopause because the lifestage has now been labelled and symptoms can be identified. 174 Two social constructions were predictive of higher levels of symptom severity: believing that menopause renders women invisible and unvalued was predictive of higher levels of perceived symptom severity and believing that there is postmenopausal recovery was predictive of lower levels of perceived symptom severity. Both cognitive inflexibility and emotional instability were predictive of higher levels of symptom severity though no other personality traits were predictive. Thus, women who were more sensitive to change and who were less able to adapt to the changes were more likely to perceive that the symptoms they experienced at menopause were severe. Levels of Health wellbeing, and having a prior illness were also predictive; lower levels of Health wellbeing and having a prior illness predicted higher levels of symptom severity. Together, these factors explained 64% of the variance in the data. Which factors predict treatment utilisation? Ninety one percent of the women at study 2 had sought a treatment for menopause. Such high treatment utilisation rates may mean that the difference between non-treatment-utilisers and treatmentutilisers is not as great as previously thought. Ballinger (1985) found that the incidence of hot flushes and vaginal atrophy was the same for treatment-seeking and non-patient groups and this finding was supported in this study which found there were no significant differences in the severity of hot flushes and vaginal dryness between the clinical and the general population samples. 9 There is, however, some evidence that the differences between treatment-utilisers and non-treatment-utilisers may be associated more with psychological than physical symptoms. In this study, the clinical group scored significantly more highly on psychological symptom severity than the general population sample, whereas there was no significant difference between the clinical and general population sample with respect to somatic symptoms. Furthermore, membership of the clinical group was significantly predicted by high scores on the Psychological Sub-scale of the MRS but not by high scores on the Somatic Sub-scale of the MRS. This finding is in line with Hunter’s 1988 study, which also found that attendance at the clinic could be predicted most accurately on the basis of psychological rather than biological symptoms. The regression modelling and structural equation model highlighted that the single most important predictor of treatment utilisation at menopause is symptom severity, whether this was overall treatments or biomedical or non-biomedical treatments. In particular, the psychological symptom domain was most predictive for all categories of treatment. 9 Hot flushes t (192) = –1.492, p = 0.153 CI95 [–0.578; 0.106]; vaginal dryness t (193) = –1.875, p = 0.063, CI95 [–0.636; 0.030]. 175 However, it is useful to make a distinction between the uptake of biomedical and nonbiomedical treatments when considering which factors predict treatment utilisation because factors influence uptake in different ways. Considered individually, emotional stability, higher levels of cognitive inflexibility, having a prior chronic illness, believing that menopause renders women invisible and unvalued and believing that menopause is amenable to treatment predicted increased biomedical treatments but not non-biomedical treatments. In contrast, believing that there is postmenopausal recovery and being open to experience predicted higher levels of non-biomedical treatments but not higher levels of biomedical treatments. The social constructions also mediated the use of different categories of treatment such that experiencing symptoms and holding a treatment belief predicted an increase in biomedical utilisation but experiencing symptoms and holding a postmenopausal recovery belief predicted a decrease in medical treatment utilisation. Interestingly, experiencing symptoms and believing in postmenopausal recovery predicted a higher level of use of non-biomedical treatments. Non biomedical treatment utilisation was also influenced by social support in that social support conditioned symptom experience such that there was a steeper increase in using nonbiomedical treatments with higher levels of support. It has been hypothesised that social support may act as a buffer against distressing symptoms and under normal circumstances we might expect to see a reduction in treatment utilisation. In this instance the opposite occurs. The interviews explained how this might occur. Menopause can be a topic of conversation among the peer group and women swap war stories and make suggestions about the treatments that are available. This can include recommendations for specific clinicians, but is more likely to be for herbal remedies, alternative therapies and supplements. If a woman is open to trying new things she may experiment with whatever treatment is recommended and this can result in an increase rather than a decrease in treatment utilisation. This may explain why the personality trait ‘openness to experience’ is a predictor of non-biomedical treatment uptake because this trait is associated with curiosity and preferences for variety (Costa & McCrae, 1992). Structural equation modelling clarified the pathways to treatment. Health wellbeing, having a prior illness and making attributions to menopause are significant predictors of symptom severity and symptom severity, and believing that menopause is pathological are significant predictors of overall treatment utilisation. How are women’s beliefs about menopause located within the social context of their daily lives? Women’s beliefs are co-created in a social and cultural context and are important because they influence how women perceive symptoms and the types of treatment that are sought. These beliefs were explored in study 3 using diaries and interviews which allowed women to describe their experiences within the context of their daily lives. This exercise revealed that women have inadequate knowledge of menopause and can be surprised and distressed by its onset, menopause is little talked of 176 and is still ‘taboo, menopause is regarded by women as a significant phenomenon that changes them but this is not often acknowledged publicly, women and clinicians have difficulty in making attributions to menopause and neither women nor clinicians are able to define ‘normality’ at menopause. Women’s daily experience of menopause is one where women who are experiencing symptoms have to make a number of accommodations in their daily life which individually are not problematic but collectively can be onerous. The fact that menopause is rarely discussed and remains taboo can mean that women rarely admit openly to being in menopause. The reasons for this are related to embarrassment about being ‘hot and sweaty’, the association with sex and the fact that menopause is symbolic of aging which is associated with incompetence (Cuddy, Norton, & Fiske, 2005). Several women expressed concern that admitting to being menopausal would mean that people would think that they were ‘past it’ or ‘on the scrap heap’. Another feature of the daily experience of menopause is one of uncertainty. This relates to inadequate knowledge, the lack of clarity about what to attribute to menopause and the inability to define normality. Inadequate knowledge affects women’s expectations of menopause. The majority of women commented on their lack of knowledge and poor preparation for the onset of menopause even though they were aware that this was inevitable and universal for women in mid-life. Women did not think about menopause until it was upon them and so could be taken by surprise by the changes that were occurring. It was as if the social clock had been recalibrated: menopause was thought to happen to women at 60 years of age rather than the actual median age of 51 years. Precisely why this has occurred is unclear. One reason could be because of the association of menopause with aging and women preferred not to confront the fact that they were getting older. We might also speculate that women have come to believe that they can delay other reproductive experiences such as pregnancy and childbirth and so they have transferred this belief to menopause. A further problem with the lack of knowledge about menopause was the failure to manage women’s expectations. At menarche young girls are usually given some information about what will happen to them well before the event. During pregnancy and childbirth there is a wealth of information to prepare women for different eventualities. At menopause there is little attempt to prewarn women of the experience. At best women were momentarily surprised; at worst women believed they had a serious illness. Furthermore, there is a clash between lay knowledge and medical knowledge. Lay knowledge was passed between women when they got together to discuss symptoms and treatments. During this process women discovered that every woman appeared to have a different story to tell. Some found the menopause transition uneventful whilst others found it disruptive. Some ‘swore by’ hormone therapy whilst others warned that was it dangerous. Some found alternative remedies to be effective 177 whereas others said they had tried everything and nothing worked. Advice and information in magazines appeared to be just as disparate. Medical knowledge, in comparison, is focused on objective measures and clinical evidence. Clinicians know that the median age of menopause is 51 years of age. GPs base their decisions on blood tests which identify hormone levels. They respond to data about hormone therapy and its impact on other conditions. There has been some debate about the safety of HT but the most recent advice from The British Menopause Society, The Endocrine Society and The Association of Reproductive Health Professionals is that HT has an important role in managing symptoms at menopause (Stuenkel et al., 2012). Nevertheless, the women in this study reported a time lag in this information being incorporated at the primary care level: some GPs were not prepared to prescribe HT and women reported that treatment practices and information provision were patchy and inconsistent. Thus, women and clinicians view menopause from different standpoints. Women focus more on the psychological and emotional experience of menopause and the impact on their daily lives, whereas clinicians focus on somatic symptoms, changes to the regular cycle and hormone levels tested in the laboratory (Hyde, Nee, Howlett, Drennan, & Butler, 2010). The majority of women believe that menopause is a major change in their lives whereas doctors (now) think of menopause as a natural phase that may be risky (Erol, 2011). This research has highlighted the extent to which psychological and somatic symptoms are inter-related and how psychological symptoms contribute as much, if not more, than somatic symptoms to perceptions of overall symptom severity. General practitioners were ill-equipped to cope with psychological and emotional responses to menopause and so women received little emotional support. This was made more problematic by an attitude that positioned menopause as a natural lifestage where some degree of discomfort should be expected and, even tolerated. Lack of clarity about what to attribute to menopause: There was uncertainty about what could be attributed to menopause and what could be attributed to the general effects of aging. For example, vasomotor symptoms could be reliably attributed but it was difficult for women and their GPs to be sure that joint pains or poor memory were due to menopause or some other condition. It was, however, apparent that women wanted validation and confirmation because not knowing what the cause of discomfort was could be frightening. It was also apparent that some women were more predisposed than others to attribute a large number of symptoms to menopause because this explanation was preferable to being told that it was due to a (potentially) more serious issue. For example, attributing joint aches to menopause meant that the reason for feeling unwell was due to an external cause over which they had no control. In comparison, attributing joint aches to lack of exercise meant that they had to take responsibility for their health. 178 One of the problems with the uncertainty of making attributions was that it was not possible for women to be sure what was normal at menopause. Inability to define normality at menopause: Knowing what is normal at menopause was the most frequent concern raised by the women interviewed. Women wanted to know when menopause would start, when it would end, and whether the symptoms they were experiencing were usual or exceptional. Knowing what is normal would help to reduce uncertainty, and alleviate anxieties about unfamiliar changes. Furthermore, knowing what is normal would help women to know whether and when they need to seek treatments, especially medical treatments. Women want specific explanations and confirmation that their experiences are ‘normal’ whereas doctors cannot easily define ‘normality’ and have to work within a wide margin of error. Women demand timely and authoritative information of the kind they would expect to receive for other (partially) medicalised areas (for example, childbirth and pregnancy) whereas clinicians feel that the increase in research data is important but has, to date, created more uncertainty (Bush et al., 2007). It is difficult for biological ‘normality’ to be precisely defined. Implications for theory Health beliefs and illness representations are critical for our understanding of women’s experiences at menopause. They influence coping strategies, symptom perceptions and treatment utilisation. Both problem-focused coping and emotion coping strategies were used extensively by women in this study. It was evident that the number of coping strategies used was not a critical factor because women may find one strategy that works and stick to it. However, measures of coping at menopause cannot be generic. They need to be specific to menopause and should reflect strategies such as making routine changes (i.e., layering of clothes, using fans), seeking out biomedical treatments, seeking out natural remedies, talking with friends, reassigning negative emotions and using negative or neutral strategies such as distraction or denial. Using the dimensions of cognitive beliefs (Leventhal 1980) as a framework it is clear that the degree to which women label menopause as a pathological illness that is amenable to treatment increases perceptions of symptom severity and increases the likelihood of choosing to use biomedical treatments. Furthermore, labelling the condition does not make attributions more obvious; some symptoms could be due to general aging or another underlying problem. It is evident that some women are more predisposed than others to make attributions and this may relate to an internal/external focus or the degree of individual sensitivity (Pennebaker 1983). The fact that women who are more emotionally unstable reported greater symptom severity suggests that this may be the case. Most women believe that the cause of the symptoms at menopause is estrogen depletion but this does not act as a helpful explanation in the sense that women feel that they have little control over 179 their hormones. Furthermore, coping strategies that involve the use of synthetic hormones are often eschewed because of concerns about safety, leaving women with few options. Timelines are also difficult to evaluate because women cannot predict the onset of menopause, its duration or the symptoms that may be associated with it. Beliefs about the pathological nature of changes at menopause relate to whether or not women view this as a chronic problem or a temporary phase. Women who believed in postmenopausal recovery were more likely to report lower levels of symptom severity and to use alternative rather than biomedical treatments. The consequences of menopause are also uncertain. Some women report little impact but the majority believe that the menopause is a significant change that alters them. However, because of the uncertainty concerning timelines women cannot be sure what form the changes will take. They worry that the symptoms represent a long term decline but hope that the symptoms will be short lived. Such levels of uncertainty make predicting treatment utilisation especially difficult. The usual health belief models cannot easily be applied. The Health Belief Model (Janz & Becker, 1984), the Theory of Planned Behaviour (Ajzen, 1991), Protection Motivation Theory (Maddux & Rogers, 1983) and the Common Sense Model of Illness (Leventhal, Meyer, & Nerenz, 1980) depend to some extent on normative beliefs, threat appraisals and coping appraisals. Social cognition models of this kind have been criticised for failing to predict health behaviours as accurately as expected (Mielewczyk & Willig, 2007; Ogden, 2003). The main concerns relate to the failure to take affective behaviour into account, an inadequate role for subjective norms, and not understanding health practices in a wider social context. We might add to that a need to incorporate ambiguity and a need to incorporate meanings into our understanding of health behaviours. Additionally, most health belief models assume that behavioural decisions are rational and deliberative and as such cannot reflect the intense emotional responses to menopause. More specifically, they are unable to accommodate ambiguity, which is a feature of women’s responses to this stage of their life. If a model of treatment utilisation is to be useful in this context it will need to be able to take account of meanings, affect and ambiguity Finally, the meanings of menopause influenced treatment utilisation, both directly and indirectly. The search for meaning is an important component of whether or not people can cognitively adapt to a new condition (Taylor 1983). At this stage of life women are obliged to adapt to major hormonal changes and some find it more difficult than others (Deecher & Dorries 2007). Not everyone manages to accept or accommodate to the new situation and some women take longer to master the situation. The fact that women who scored highly on measures of cognitive inflexibility also reported higher levels of symptom severity supports this view. 180 Chapter 11: Conclusions, Implications, Limitations and Future Directions This research grew out of a belief that whilst menopause is a universal experience for women, there has been insufficient research into the psychological aspects of it. This seemed surprising, given that other, more prevalent aspects of the female reproductive cycle such as pregnancy and childbirth have been more thoroughly investigated from a bio-psycho-social perspective. Approximately 26% of the female UK workforce is older than 50 years of age. This equates to 3.5 million workers and, if 20% of them are suffering from disruptive symptoms, 700,000 women may be at risk. A recent study at Oxford University Hospitals Trust found that 51% of menopausal women reported that symptoms made their work somewhat or fairly difficult and 5% said that they made work very or extremely difficult. Furthermore, 42% believed that this adversely affected their job performance (Brockie & Kemp, 2013). There are economic implications of failing to address problems at menopause. There has been plentiful research from a medical perspective, for example into the impact of hormone replacement therapy or the effects of a decline in estrogen on osteoporosis and cardiovascular disease. This emphasis has positioned menopause as a pathological condition and neglected the psychological and social experiences of the women going through it. Most research had been with patient populations and thus, findings did not reflect the experiences of women who had not been seen in a clinic. That is not to say that the biological perspective is unimportant. It is critical to understand why some women report severe and problematic symptoms at menopause whereas others notice relatively few changes. Research indicates that maternal age and experience of complaints at menopause is predictive of the age of onset of menopause in their daughters, which suggests that there is a genetic component (Murabito, Yang, Fox, Wilson, & Cupples, 2005; Van Asselt et al., 2004). This is supported by the identification of specific polymorphisms that are associated with more severe and more frequent hot flushes (Schilling et al., 2007). However, the biological perspective has focused mainly on hormone replacement and even after more than 60 years of using estrogen to replace declining hormones in women (Geist & Spielman, 1932), the medical profession knows little about the exact mechanisms of hot flushes and night sweats. Furthermore, researchers acknowledged the relevance of socio-psychological factors in influencing symptom appraisal but there had been few studies that explicitly attempted to quantify their relative importance at menopause (Ayers, Forshaw, & Hunter, 2010). When conducting research with women going through menopause, the author had noticed that some women reported severe symptoms and immediately sought medical treatment but other women perceived equally severe symptoms but had eschewed this solution (Rubinstein & Foster, 2012). This raised questions as to what factors might be influential in triggering treatment uptake. 181 Therefore, this research was conceived to investigate the bio-psycho-social predictors of treatment seeking at menopause. Moreover, the author wanted to locate the experience of menopause within the social context of women’s daily lives. Specifically, the study aimed to identify how menopause was socially constructed and to understand what role these constructions had, if any, in influencing symptom perceptions and treatment uptake. This seemed especially important in the light of concerns about long-term risks of hormone therapy, which had resulted in a dramatic decline in prescribing, leaving many women with no solution to their problems. Since the start of this study, there has been a wholesale review of the data on which these concerns were based (Million Women Study Collaborators, 2003; Writing Group for the Women’s Health Initiative Investigators, 2002) and there is currently a renewed effort to promote hormone therapy (Panay, Hamoda, Arya, & Savvas, 2013). This change has not yet filtered through to primary care level and, in any case, we might question the desirability of the wholesale prescribing of HT to healthy, asymptomatic women as was suggested at a recent conference of the British Menopause Society (Stevenson, 2013). The fundamental conclusion is that social constructions of menopause play a key role in determining perceptions of symptoms. Other factors such as general Health wellbeing, levels of emotional stability, the number of attributions made to menopause and the existence of prior illness were important predictors of symptom appraisals but the social constructions that women placed on menopause remained predictive even after controlling for these factors. Additionally, these social constructions were critical to determining whether and what category of treatment women decided to use, over and above perceived symptom severity. Socially constructing menopause as an illness and a condition of aging but a condition that hormone therapy can alleviate (and possibly prevent) mediated between symptom severity and increased the likelihood of pursuing biomedical solutions. Socially constructing menopause as an illness condition but one that is a temporary phase that women recover from mediated between symptom severity and increased the likelihood of pursuing alternative, nonbiomedical solutions that can be perceived as natural and safer than hormone therapy. Changing these constructions of menopause will be difficult because they are deeply embedded within Western society. Beliefs about menopause are intrinsically connected to fears of aging and loss of function and are passed on between women from generation to generation and within generations in conversations among women who are menopausal. The media reflects these beliefs, thus reinforcing ideas about menopause as a symbol of aging and decline (Gannon & Stevens, 1998; Gannon, 1999; Lyons & Griffin, 2003). Despite the fact that women play a more active role in society and despite new medical knowledge about the role of activational hormones, there is still a ‘conspiracy of silence’ about menopause. This silence is problematic for two reasons. First, it contributes to misinformation and myths and second, women still feel embarrassed to admit to being menopausal. The result is that women can feel isolated and become depressed during this stage of life and may not seek treatments from which they could derive benefit. 182 The majority of women do not report severe problems at menopause but a significant minority (20–30%) do and hence it is important that women are aware of when it is appropriate to seek help. Even considering that only a minority seek treatment for menopause, this research indicated that most women (91%) had sought some form of treatment for a symptom related to menopause at this stage of their lives. The boundary between treatment-utilisers and non-treatment-utilisers was not clearly delineated and there was a significant minority (15%) from the general population who had the same characteristics as those in the clinical population – the only difference being that the clinical population had managed to get a referral to a specialist clinic and were on hormone therapy. Implications: There are several implications that derive from this analysis. One group of implications relates to the need for fundamental research and this is discussed below in the section on future directions. The other group of implications relates to practical support and information. The provision of medical advice at primary care level in the UK appears to be inconsistent and patchy. The women in this study reported that they had received contradictory advice from different clinicians within the same practice or from the same clinician at different times. In a recent report from the Royal College of Obstetricians and Gynaecologists (2011, p. 57), the key recommendation from the BMS was that “primary care teams should invite women on their register, around the time of their 50th birthday, to attend a health and lifestyle consultation to discuss a personal health plan for the menopause and beyond”. To date, this recommendation has not been acted on and in the current political climate it is doubtful that women’s health at menopause will be a priority. There are some specialist clinics in the gynaecology departments at major hospitals and some GP practices have someone who specialises in women’s health. Even fewer practices offer a specialist menopause service: the British Menopause Society record only 167 menopause clinics, the majority of which are at major hospitals whereas there are approximately 10,000 general surgeries in the UK (British Medical Association 2010).Several of the women who were interviewed spontaneously commented that this type of consultation would be welcomed as the quotes below illustrate. “I think more information. More accessible information. GPs that actually possibly offer you – I know they have these well-women clinics - but they seem to be thin on the ground – more of those I think” High treatment utiliser (8) “If people could have – I don’t know whether the doctors checking like they do now – they send letters for a health check about a year ago to check your cholesterol. Mine was a little bit high. But like a health check. I have always thought I wish doctors could do more well-being things, I’ve always thought that rather than just wait until you have got it…” Low treatment utiliser (11) The pressing need is for women to be better informed about menopause nearer the time of onset so that they can make better decisions and manage their expectations. Most GP surgeries have 183 prominent information in the form of leaflets and posters about pregnancy and childbirth, but there is no equivalent information about menopause. Making it public in this way would serve to normalise this stage of life and could help to break the conspiracy of silence that surrounds it. Furthermore, women want to be informed about a range of options, not just about hormone therapy. Women commented on the need for a more ‘holistic approach’. This might include suggestions about Mindfulness training and Cognitive Behavioural Therapy. Given that women’s ideas about menopause may include the notion that it is an illness that inevitably causes women to feel physically and emotionally unwell, treatments that seek to reassign maladaptive beliefs could be useful. It also makes sense in the light of the fact that women struggle more with the psychological than the somatic aspects of menopause, especially in the early transitional stages. The support however, does not necessarily need to involve treatments. Another suggestion is to create a space for women to talk about these experiences in a more formalised setting. The North American Menopause Society offers advice on how health care providers can develop a menopause discussion group. As discussed in chapter 8, women frequently talk in private about their experiences but tend to use humour to cover their embarrassment. A forum where they could openly share their feelings but one where more authoritative, up-to-date information is available may help to reassure women that their experiences are not abnormal. This type of forum has been available during pregnancy through childbirth classes or via the National Childbirth Trust, and something similar could be beneficial at menopause. Additionally, it may help GPs and specialist nurses to re-establish their role as experts, a role that has been dented as a result of confusion about prescribing hormone therapy. Again, this is an idea that is likely to be positively received by women. “Perhaps a group where you could learn a bit more about it. Each woman is different so it is difficult to know what to expect for yourself because I have only heard from my immediate family – I hadn’t really discussed it at that time with other menopausal women. So, it is almost like a coaching session, sort of thing. Where there is perhaps a lady who is two years down the line, a lady at five years down the line and a lady who has gone through it but you know who could perhaps talk to you” High treatment utiliser (13) “Have clinics and [places where you can] chat – because talking about it helps, it does help and talking to somebody who is obviously knowledgeable about it must be and has studied it…. Low treatment utiliser” (1) As we live in the internet age, it could be argued that the best place to provide information is online. Menopause Matters is a website that is run by Dr Heather Currie and is a burgeoning forum for women to discuss issues and to find information. It is an excellent model of its kind. However, a note of caution should be struck. The majority of women in this study preferred to complete the survey using pen and paper and many commented that they were unsure of the veracity of information they 184 got from the internet. It is possible that this is merely a cohort issue and the next generation of women will feel more comfortable getting their information online – although we should not assume this, because many of the issues surrounding menopause are of an intimate nature and women in the future may still prefer to receive face-to-face advice and information about menopause from an expert. Ultimately, women want and need more precise information and greater reassurance of what to expect at menopause. This will not be possible until there is more fundamental research into the risk and resilience factors for women as they enter the menopause transition. Contributions and Limitations The study has contributed new knowledge to our understanding of menopause because it has empirically described the predictors of pathways to both biomedical and non-biomedical treatment. Furthermore, it has defined the existence and prevalence of social constructions (meanings) of menopause, the extent to which these social constructions predict the uptake of treatments, over and above the existence of biological symptoms, and has described the mechanisms for how these social constructions operate. Finally, it used diary and interview data to comprehensively describe the ‘lived’ experience of women during this period of their lives in the context of how women make decisions about treatment. There are, however, limitations to consider. Despite making every effort to recruit women from a range of social classes and ethnicities, the sample was not truly representative and hence, caution should be taken in generalising the findings. Although the path model was not a ‘good’ fit due to measurement error it was a reasonable representation of the data. The mediocre fit of this model suggests that some variables may have been omitted or that there is not yet a good enough ‘health belief’ model on which to base decisions about the most appropriate variables to use. The overall model might have been improved if a measure of coping was included. Such a coping measure should use an inventory of coping strategies that are specific to menopause because general checklists will not do. Finally, the outcome measure might be improved. The treatment utilisation scale was a composite of the weighted number of biomedical and non-biomedical treatments for menopause symptoms. This raises issues of recall bias and it might have been better to use either recorded treatments or to be more time specific. In addition, the Menopause Rating Scale groups symptoms into 11 broad categories, and treatment utilisation information could be more precise if specific symptoms were used. Future directions The study of menopause is important because it is a universal experience that all women will go through if they reach mid-life. Unfortunately, we still know too little about the exact mechanisms 185 of some of the more common symptoms. Fundamental research is needed to define the mechanisms of vasomotor symptoms and to better understand why there are such large individual differences between women. There is some understanding of the risk factors involved at menopause but not enough about why some women are more resilient than others. Better measures of coping would need to be developed in order to investigate this further. More evidence is needed for the effectiveness of possible preventative measures including the role of diet and exercise, and a longitudinal perspective may be required. There also needs to be consideration of other forms of treatment besides hormone therapy. There has been some initial research into the effectiveness of Cognitive Behavioural Therapy for clinical patients (Ayers, Smith, Hellier, Mann, & Hunter, 2012) but there is not enough that investigates the effect of interventions such as CBT or Mindfulness training with non-clinic samples. Finally, there is a need for general practitioners to gain a greater understanding of how to deal with menopausal women in their surgeries and for a more consistent and comprehensive provision of treatment for women at this stage of their lives. 186 Bibliography Ajzen, I. (1991). The theory of planned behavior. Organizational Behavior and Human Decision Processes, 50(2), 179–211. Aldwin, C. M., & Revenson, T. A. (1987). Does coping help? A reexamination of the relation between coping and mental health. Journal of Personality and Social Psychology, 53(2), 337–348. doi:10.1037/0022-3514.53.2.337 Aldwin, C. M., Yancura, L. A., & Boeninger, D. K. (2010). Coping across the Life Span. In The Handbook of Life-Span Development. John Wiley & Sons, Inc. Retrieved from http://onlinelibrary.wiley.com/doi/10.1002/9780470880166.hlsd002009/abstract Alessio, H. (2001). Physiology of Human Aging. In Aging: the social context (2nd Edition., pp. 107– 142). Pine Forge Press. Amirkhan, J. H. (1990). A factor analytically derived measure of coping: The Coping Strategy Indicator. Journal of Personality and Social Psychology, 59, 1066–1074. Anderson, D., Yoshizawa, T., Gollschewski, S., Atogami, F., & Courtney, M. (2004). Menopause in Australia and Japan: Effects of country of residence on menopausal status and menopausal symptoms. Climacteric, 7(2), 165–174. Andrikoula, M., & Prelevic, G. (2009). Menopausal hot flushes revisited. Climacteric, 12(1), 3–15. doi:10.1080/13697130802556296 Antonucci, T. C., & Akiyama, H. (1987). Social Networks in Adult Life and a Preliminary Examination of the Convoy Model. Journal of Gerontology, 42(5), 519–527. Antonucci, T. C., Akiyama, H., & Takahashi, K. (2004). Attachment and close relationships across the life span. Attachment and Human Development, 6(4), 353–370. Arber, S., & Ginn, J. (1991). Gender and Later Life: A sociological analysis of resources and constraints. London: Sage. Attride-Stirling, J. (2001). Thematic networks: an analytic tool for qualitative research. Qualitative Research, 1(3), 385–405. doi:10.1177/146879410100100307 Atwood, J. D., McElgun, L., Celin, Y., & McGrath, J. (2008). The socially constructed meanings of menopause: Another case of manufactured madness? Journal of Couple and Relationship Therapy, 7(2), 150–174. Avis, N. E., Assmann, S. F., Kravitz, H. M., Ganz, P. A., & Ory, M. (2004). Quality of Life in Diverse Groups of Midlife Women: Assessing the Influence of Menopause, Health Status and Psychosocial and Demographic Factors. Quality of Life Research, 13(5), 933–946. doi:10.1023/B:QURE.0000025582.91310.9f Avis, N. E., & Crawford, S. (2008). Cultural Differences in Symptoms and Attitudes towards Menopause. Menopause Management, 17(3), 8–13. Avis, N. E., Crawford, S. L., & McKinlay, S. M. (1997). Psychosocial, behavioral, and health factors related to menopause symptomatology. Women’s Health (Hillsdale, N.J.), 3(2), 103–120. Avis, N. E., Stellato, R., Crawford, S., Bromberger, J., Ganz, P. A., Cain, V., & Kagawa-Singer, M. (2001). Is there a menopausal syndrome? Menopausal status and symptoms across racial/ethnic groups. Social Science & Medicine, 52(3), 345–356. doi:10.1016/S02779536(00)00147-7 Avis, N., & McKinlay, S. (1990). Health Care utilisation among mid-aged women. Annals of the New York Academy of Sciences, 592, 228–238. Avis, N., & McKinley, N. M. (1991). A longitudinal analysis of women’s attitudes toward the menopause: results from the Massachusetts Women’s Health Study. Maturitas, 13(1), 65–79. doi:10.1016/0378-5122(91)90286-Y Ayers, B., Forshaw, M., & Hunter, M. S. (2010). The impact of attitudes towards the menopause on women’s symptom experience: A systematic review. Maturitas, 65(1), 28–36. 187 Ayers, B., Smith, M., Hellier, J., Mann, E., & Hunter, M. S. (2012). Effectiveness of group and selfhelp cognitive behavior therapy in reducing problematic menopausal hot flushes and night sweats (MENOS 2): A randomized controlled trial. Menopause, 19(7), 749–759. doi:10.1097/gme.0b013e31823fe835 Ballard, K. D., Elston, M. A., & Gabe, J. (2009). Private and public ageing in the UK: The transition through the menopause. Current Sociology, 57(2). Retrieved from http://www.scopus.com/inward/record.url?eid=2-s2.060749116920&partnerID=40&md5=a771642bd9474292f58e2016d2691521 Ballinger, S., E. (1985). Psychosocial stress and symptoms of menopause: a comparative study of menopause clinic patients and non-patients. Maturitas, 7, 315–327. Baldwin, W. H., & Nord, C. W. (1984). Delayed childbearing in the US: facts and fictions. Population Bulletin, 39(4). Bandura, A. (2004). Health promotion by social cognitive means. Health Education and Behavior, 31(2), 143–164. Barbaglia, G., Macià, F., Comas, M., Sala, M., Del Mar Vernet, M., Casamitjana, M., & Castells, X. (2009). Trends in hormone therapy use before and after publication of the Women’s Health Initiative trial: 10 years of follow-up. Menopause, 16(5), 1061–1064. Bauer, M. W., & Gaskell, G. (1999). Towards a Paradigm for Research on Social Representations. Journal for the Theory of Social Behaviour, 29(2), 163–186. doi:10.1111/1468-5914.00096 Beck, A. T. (1976). Cognitive therapy and the emotional disorders. INT.UNIV.PRESS,NEW YORK. Beral, V., Bull, D., & Reeves, G. (2005). Endometrial cancer and hormone-replacement therapy in the Million Women Study. Lancet, 365(9470), 1543–1551. doi:10.1016/S0140-6736(05)66455-0 Berecki-Gisolf, J., Begum, N., & Dobson, A. J. (2009). Symptoms reported by women in midlife: menopausal transition or aging? Menopause, 16(5), 1021–1029. doi:10.1097/gme.0b013e3181a8c49f Berlin Center for Epidemiology & Health Research. (2013). MRS - Menopause Rating Scale. Retrieved June 10, 2013, from http://www.menopause-rating-scale.info/population.htm Beyene, Y. (1986). Cultural significance and physiological manifestations of menopause a biocultural analysis. Culture, Medicine and Psychiatry, 10(1), 47–71. Bielawska-Batorowicz, E. (2007). Frequency and intensity of menopausal symptoms in relation to temperament, personality and coping style. Przeglad Menopauzalny, 6(2), 70–76. Birkhäuser, M. H., & Reinecke, I. (2008). Current trends in hormone replacement therapy: Perceptions and usage. Climacteric, 11(3), 192–200. Blaxter, M. (2004). Health. Cambridge: Polity. Blümel, J. E., Chedraui, P., Baron, G., Belzares, E., Bencosme, A., Calle, A., … Vallejo, S. (2011). A large multinational study of vasomotor symptom prevalence, duration, and impact on quality of life in middle-aged women. Menopause, 18(7), 778–785. doi:10.1097/gme.0b013e318207851d Bolger, N., Davis, A., & Rafaeli, E. (2003). Diary Methods: Capturing Life as it is Lived. Annual Review of Psychology, 54(1), 579–616. doi:10.1146/annurev.psych.54.101601.145030 Bond, F. W., Hayes, S. C., Baer, R. A., Carpenter, K. M., Guenole, N., Orcutt, H. K., … Zettle, R. D. (2011). Preliminary Psychometric Properties of the Acceptance and Action Questionnaire-II: A Revised Measure of Psychological Inflexibility and Experiential Avoidance. Behavior Therapy, 42(4), 676–688. Bond, M., & Bywaters, P. (1998). Working it out for ourselves: Women learning about hormone replacement therapy. Women’s Studies International Forum, 21(1), 65–76. Booth, N. L., Piersen, C. E., Banuvar, S., Geller, S. E., Shulman, L. P., & Farnsworth, N. R. (2006). Clinical studies of red clover (Trifolium pratense) dietary supplements in menopause: A literature review. Menopause, 13(2), 251–264. 188 Borud, E. K., Alraek, T., White, A., Fonnebo, V., Eggen, A. E., Hammar, M., … Grimsgaard, S. (2009). The Acupuncture on hot flushes among menopausal women (ACUFLASH) study, a randomized controlled trial. Menopause, 16(3), 484–493. Bosworth, H. B., Bastian, L. A., Rimer, B. K., & Siegler, I. C. (2003). Coping styles and personality domains related to menopausal stress. Women’s Health Issues, 13(1), 32–38. Bowles, C. (1986). Measure of Attitudes toward Menopause using the Semantic Differential Model. Nursing Research, 35, 81–85. Brashers, D. E. (2001). Communication and Uncertainty Management. Journal of Communication, 51(3), 477–497. doi:10.1111/j.1460-2466.2001.tb02892.x Braun, V., & Clarke, V. (2006). Using thematic analysis in psychology. Qualitative Research in Psychology, 3(2), 77–101. doi:10.1191/1478088706qp063oa Brennan, R. M., Crespo, C. J., & Wactawski-Wende, J. (2004). Health behaviors and other characteristics of women on hormone therapy: Results from the Third National Health and Nutrition Examination Survey, 1988-1994. Menopause, 11(5), 536–542. Broadhead, W. E., Gehlbach, S. H., Gruy, F. V. de, & Berton H. Kaplan. (1988). The Duke-UNC Functional Social Support Questionnaire: Measurement of Social Support in Family Medicine Patients. Medical Care, 26(7), 709–723. Brockie, J., & Kemp, E. (2013). Optimising menopausal health in the workplace. Presented at the 23rd Annual Conference of the British Menopause Society, Stratford on Avon. Brown, D. E., Sievert, L. L., Morrison, L. A., Reza, A. M., & Mills, P. S. (2009). Do Japanese American women really have fewer hot flashes than European Americans? The Hilo Women’s Health Study. Menopause, 16(5), 870–876. doi:10.1097/gme.0b013e31819d88da Brown, S. (2012). Shock, terror and controversy: How the media reacted to the Women’s Health Initiative. Climacteric, 15(3), 275–280. Bruce, D., & Rymer, J. (2009). Symptoms of the menopause. Best Practice & Research Clinical Obstetrics & Gynaecology, 23(1), 25–32. doi:10.1016/j.bpobgyn.2008.10.002 Bryman, A. (2006). Integrating quantitative and qualitative research: how is it done? Qualitative Research, 6, 97–113. Buchanan, M. C., Villagran, M. M., & Ragan, S. L. (2002). Women, Menopause, and (Ms.)Information: Communication about the Climacteric. Health Communication, 14(1), 99– 119. Bush, T. M., Bonomi, A. E., Nekhlyudov, L., Ludman, E. J., Reed, S. D., Connelly, M. T., … Newton, K. M. (2007). How the Women’s Health Initiative (WHI) influenced physicians’ practice and attitudes. Journal of General Internal Medicine, 22(9), 1311–1316. doi:10.1007/s11606-0070296-z Byrne, B. M. (2010). Structural Equation Modeling with AMOS: Basic Concepts, Application and Programming (2nd ed.). New York: Routledge. Caltabiano, M. L., & Holzheimer, M. (1999). Dispositional factors, coping and adaptation during menopause. Climacteric, 2(1), 21–28. Canales, M. K., Breslau, E. S., Nelson, D. E., & Ballard-Barbash, R. R. (2008). Did News Reporters Get It Right?. Translation of the 2002 Hormone Study Findings. American Journal of Preventive Medicine, 34(1), 61–68. Canonico, M., Oger, E., Plu-Bureau, G., Conard, J., Meyer, G., Lévesque, H., … Scarabin, P.-Y. (2007). Hormone therapy and venous thromboembolism among postmenopausal women: impact of the route of estrogen administration and progestogens: the ESTHER study. Circulation, 115(7), 840–845. doi:10.1161/CIRCULATIONAHA.106.642280 Carmignani, L. O., Pedro, A. O., Costa-Paiva, L. H., & Pinto-Neto, A. M. (2010). The effect of dietary soy supplementation compared to estrogen and placebo on menopausal symptoms: A randomized controlled trial. Maturitas, 67(3), 262–269. 189 Carmody, J. F., Crawford, S., Salmoirago-Blotcher, E., Leung, K., Churchill, L., & Olendski, N. (2011). Mindfulness training for coping with hot flashes: results of a randomized trial. Menopause, 18(6), 1–10. doi:10.1097/gme.0b013e318204a05c Carpenter, J. S., Wu, J., Burns, D. S., & Yu, M. (2012). Perceived control and hot flashes in treatmentseeking breast cancer survivors and menopausal women. Cancer Nursing, 35(3), 195–202. Carver, C. S., Scheier, M. F., & Weintraub, J. K. (1989). Assessing coping strategies: a theoretically based approach. Journal of Personality and Social Psychology, 56(2), 267–283. doi:10.1037/0022-3514.56.2.267 Casper, R. F., & Yen, S. S. (1985). Neuroendocrinology of menopausal hot flushes: a hypothesis of flush mechanisms. Clinical Endocrinology, 22(3), 293–312. Cerin, E., & MacKinnon, D. P. (2009). A commentary on current practice in mediating variable analyses in behavioural nutrition and physical activity. Public Health Nutrition, 12(08), 1182– 1188. doi:10.1017/S1368980008003649 Chang, E. C. (1998). Dispositional optimism and primary and secondary appraisal of a stressor: Controlling for confounding influences and relations to coping and psychological and physical adjustment. Journal of Personality and Social Psychology, 74(4), 1109–1120. doi:10.1037/0022-3514.74.4.1109 Charkoudian, N. (2003). Skin blood flow in adult human thermoregulation: how it works , when it does and why. Mayo Clinic Proceedings, (78), 603–612. Chiechi, L. M., & Micheli, L. (2005). Utility of dietary phytoestrogens in preventing postmenopausal osteoporosis. Current Topics in Nutraceutical Research, 3(1), 15–28. Chou, H.-F., & Schneider, J. K. (2011). Self-regulation of menopause. Menopause, 1. doi:10.1097/gme.0b013e318238f74b Chrisler, J. C. (2008). 2007 Presidential Address: Fear of Losing Control: Power, Perfectionism, and the Psychology of Women. Psychology of Women Quarterly, 32(1), 1–12. doi:10.1111/j.14716402.2007.00402.x Chrisler, J. C., & Ghiz, L. (1993). Body Image Issues of Older Women. Women & Therapy, 14(1), 67. doi:10.1300/J015v14n01_07 Cohen, S., & Wills, T. A. (1985). Stress, Social Support, and the Buffering Hypothesis. Psychological Bulletin, 98(2), 310–357. Colditz, G. A., Willett, W. C., Stampfer, M. J., Rosner, B., Speizer, F. E., & Hennekens, C. H. (1987). Menopause and the Risk of Coronary Heart Disease in Women. New England Journal of Medicine, 316(18), 1105–1110. doi:doi: 10.1056/NEJM198704303161801 Collaborative Group on Hormonal Factors. (1997). Breast cancer and hormone replacement therapy: collaborative reanalysis of data from 51 epidemiological studies of 52,705 women with breast cancer and 108,411 women without breast cancer. Collaborative Group on Hormonal Factors in Breast Cancer. Lancet, 350(9084), 1047–1059. Conrad, P. (1992). Medicalization and Social Control. Annual Review of Sociology, 18, 209–232. Cook, J. W., Dodds, E. C., & Hewett, C. J. (1933). A synthetic oestrus-exciting compound. Nature, 131, 56–57. Cornelius, S. W., & Caspi, A. (1987). Everyday problem solving in adulthood and old age. Psychology and Aging, 2(2), 144–153. doi:10.1037/0882-7974.2.2.144 Costa, P. T. J., & McCrae, R. R. (1992). Revised NEO Personality Inventory (NEO-PI-R) and the NEO Five-Factor Inventory (NEO-FFI) professional manual. Psychological Assessment Resources. Costa, P. T., & McCrae, R. R. (1988). Personality in adulthood: A six-year longitudinal study of selfreports and spouse ratings on the NEO Personality Inventory. Journal of Personality and Social Psychology, 54(5), 853–863. doi:10.1037/0022-3514.54.5.853 190 Coupland, J., & Williams, A. (2002). Conflicting discourses, shifting ideologies: Pharmaceutical, “alternative” and feminist emancipatory texts on the menopause. Discourse and Society, 13(4), 419–445. Crandall, C. J., Crawford, S. L., & Gold, E. B. (2006). Vasomotor Symptom Prevalence Is Associated with Polymorphisms in Sex Steroid-Metabolizing Enzymes and Receptors. American Journal of Medicine, 119(9 SUPPL. 1). Retrieved from http://www.scopus.com/inward/record.url?eid=2-s2.033747893585&partnerID=40&md5=465c167ee6afd4efc657c23120020282 Crawford, S. L. (2007). The roles of biologic and nonbiologic factors in cultural differences in vasomotor symptoms measured by surveys. Menopause, 14(4), 725–733. Cray, L., Woods, N. F., & Mitchell, E. S. (2010). Symptom clusters during the late menopausal transition stage: Observations from the Seattle Midlife Women’s Health Study. Menopause, 17(5), 972–977. Cuddy, A. J. C., Norton, M. I., & Fiske, S. T. (2005). This Old Stereotype: The Pervasiveness and Persistence of the Elderly Stereotype. Journal of Social Issues, 61(2), 267–285. doi:10.1111/j.1540-4560.2005.00405.x Cumming, G. P., Currie, H. D., Panay, N., Moncur, R., & Lee, A. J. (2011). Stopping hormone replacement therapy: Were women ill advised? Menopause International, 17(3), 82–87. Daley, A., Stokes-Lampard, H., Mutrie, N., & MacArthur, C. (2007). Exercise for vasomotor menopausal symptoms. Cochrane Database of Systematic Reviews, (4). De Jong-van den Berg, L. T. W., Faber, A., & van den Berg, P. B. (2006). HRT use in 2001 and 2004 in The Netherlands-A world of difference. Maturitas, 54(2), 193–197. Deecher, D. C. (2009). Thermoregulation and menopause: Understanding the basic pathophysiology of vasomotor symptoms, 175, 77–87. Deecher, D. C., & Dorries, K. (2007). Understanding the pathophysiology of vasomotor symptoms (hot flushes and night sweats) that occur in perimenopause, menopause, and postmenopause life stages. Archives of Women’s Mental Health, 10(6), 247–257. Delanoë, D. (2001). La ménopause comme phénomène culturel. Champ Psychosomatique, 24(4), 57– 67. Dennerstein, L, & Helmes, E. (2000). The Menopausal Transition and Quality of Life: Methodologic Issues. Quality of Life Research, 9(6, Supplement), 721 – 731. Dennerstein, L. (1996). Well-being, symptoms and the menopausal transition. Maturitas, 23(2), 147– 157. Dennerstein, L., Alexander, J. L., & Kotz, K. (2003). The menopause and sexual functioning: A review of the population-based studies. Annual Review of Sex Research, 14, 64–82. Dennerstein, L., Dudley, E. C., Hopper, J. L., Guthrie, J. R., & Burger, H. G. (2000). A prospective population-based study of menopausal symptoms. Obstetrics and Gynecology, 96(3), 351– 358. Dennerstein, L., Lehert, P., Guthrie, J. R., & Burger, H. G. (2007). Modeling women’s health during the menopausal transition: A longitudinal analysis. Menopause, 14(1), 53–62. Dennerstein, L., Randolph, J., Taffe, J., Dudley, E., & Burger, H. (2002). Hormones, mood, sexuality, and the menopausal transition. Fertility and Sterility, 77(SUPPL. 4). Retrieved from http://www.scopus.com/inward/record.url?eid=2-s2.00036253422&partnerID=40&md5=10732d475d27a3cd130fcceeeed79dc1 Dennerstein, L, Dudley, E., & Burger, H. (2001). Are changes in sexual functioning during midlife due to aging or menopause? Fertility and Sterility, 76(3), 456–460. doi:10.1016/S00150282(01)01978-1 Denney, N. W., & Pearce, K. A. (1989). A developmental study of practical problem solving in adults. Psychology and Aging, 4(4), 438–442. doi:10.1037/0882-7974.4.4.438 191 Denzin, N. K. (1970). The Research Act. Chicago: Aldine. Derby, C. A., Hune, A. L., McPhillips, J. B., Barbour, ]Marilyn McFarland, & Carleton, R. A. (1995). Prior and current health characteristics of postmenopausal estrogen replacement therapy users compared with nonusers. American Journal of Obstetrics & Gynecology, 173(2), 544–550. Dillaway, H.E. (2005). (Un)changing menopausal bodies: How women think and act in the face of a reproductive transition and gendered beauty ideals. Sex Roles, 53(1-2), 1–17. Dillaway, H.E. (2008). Why can’t you control this? How women’s interactions with intimate partners define menopause and family. Journal of Women and Aging, 20(1-2), 47–64. Dillaway, H. E. (2005). Menopause is the “Good Old”: Women’s Thoughts about Reproductive Ageing. Gender & Society, 19(3), 398–417. Diwadkar, V. A., Murphy, E. R., & Freedman, R. R. (2013). Temporal Sequencing of Brain Activations During Naturally Occurring Thermoregulatory Events. Cerebral cortex (New York, N.Y.: 1991). doi:10.1093/cercor/bht155 Duffy, O., Iversen, L., & Hannaford, P. C. (2011). The menopause “It's somewhere between a taboo and a joke’. A focus group study. Climacteric, 14(4), 497–505. Duffy, O. K., Iversen, L., & Hannaford, P. C. (2012). The impact and management of symptoms experienced at midlife: A community-based study of women in northeast Scotland. BJOG: An International Journal of Obstetrics and Gynaecology, 119(5), 554–564. Elavsky, S., & McAuley, E. (2009). Personality, menopausal symptoms, and physical activity outcomes in middle-aged women. Personality and Individual Differences, 46(2), 123–128. Engel, G. L. (1977). The Need for a New Medical Model: A Challenge for Biomedicine. Science, 196(4286), 129–136. Erlik, Y., Meldrum, D. R., & Judd, H. L. (1982). Estrogen levels in postmenopausal women with hot flashes. Obstetrics and Gynecology, 59(4), 403–407. Erol, M. (2011). Melting bones: the social construction of postmenopausal osteoporosis in Trueky. Social Science & Medicine, 73(10), 1490 – 1497. Estok, P. J., & O’Toole, R. (1991). The meanings of menopause. Health Care for Women International, 12(1), 27–39. doi:10.1080/07399339109515924 Ettinger, B., Grady, D., Tosteson, A. N. A., Pressman, A., & Macer, J. L. (2003). Effect of the Women’s Health Initiative on women’s decisions to discontinue postmenopausal hormone therapy. Obstetrics and Gynecology, 102(6), 1225–1232. Festinger, L. (1954). A theory of social comparison. Human Relations, 7, 114–140. Festinger, L., Riecken, H. W., & Schachter, S. (1956). When prophecy fails (Vol. vii). Minneapolis, MN, US: University of Minnesota Press. Finlay, L. (2002). “Outing” the Researcher: The Provenance, Process, and Practice of Reflexivity. Qualitative Health Research, 12(4), 531–545. doi:10.1177/104973202129120052 Flick, U. (2007). Managing Quality in Qualitative Research (1st ed.). London: SAGE. Flint, M. (1975). The menopause: reward or punishment? Psychosomatics, 16(4), 161–163. doi:10.1016/S0033-3182(75)71183-0 Folkman, S., & Moskowitz, J. T. (2004). Coping: Pitfalls and Promise. Annual Review of Psychology, 55(1), 745–774. doi:10.1146/annurev.psych.55.090902.141456 Foxcroft, L. (2009). Hot Flushes, Cold Science: A History of the Modern Menopause. London: Granta Publishers. Frazier, L. D., & Waid, L. D. (1999). Influences on anxiety in later life: The role of health status, health perceptions, and health locus of control. Aging and Mental Health, 3(3), 213–220. Freedman, R. R. (1998). Biochemical, metabolic, and vascular mechanisms in menopausal hot flashes. Fertility and Sterility, 70(2), 332–337. Freedman, R. R. (2001). Physiology of hot flashes. American Journal of Human Biology, 13(4), 453– 464. 192 Freedman, R. R. (2002). Hot flash trends and mechanisms. Menopause, 9(3), 151–152. Freedman, R. R. (2005a). Hot flashes: Behavioral treatments, mechanisms, and relation to sleep. American Journal of Medicine, 118(12 SUPPL. 2), 124S–130S. Freedman, R. R. (2005b). Pathophysiology and treatment of menopausal hot flashes. Seminars in Reproductive Medicine, 23(2), 117–125. Freedman, R. R., & Krell, W. (1999). Reduced thermoregulatory null zone in postmenopausal women with hot flashes. American Journal of Obstetrics and Gynecology, 181(1), 66–70. Friling, D. (2012). “Having It All”: Cognitive Polyphasia as Preserving a Complex Reality: The Israeli Case. Papers on Social Representations, 21, 1–24. Fuh, J.-L., Wang, S.-J., Lee, S.-J., Lu, S.-R., & Juang, K.-D. (2006). A longitudinal study of cognition change during early menopausal transition in a rural community. Maturitas, 53(4), 447–453. Fujimaka, S., Katanoda, K., Hayashi, K., Fujita, T., & Suzuki, S. (2003). Prevalence of hormone replacement therapy among women: Japan Nurses’ Health Study Baseline Survey. Journal of Epidemiology, 13(Supplement), 197. Gannon, L., & Stevens, J. (1998). Portraits of menopause in the mass media. Women and Health, 27(3), 1–15. Gannon, L. (1999). Women and aging : transcending the myths. London: Routledge. Gast, G.-C. M., Grobbee, D. E., Pop, V. J. M., Keyzer, J. J., Van Gent, C. J. M. W., Samsioe, G. N., … Van Der Schouw, Y. T. (2008). Menopausal complaints are associated with cardiovascular risk factors. Hypertension, 51(6), 1492–1498. Gayet-Ageron, A., Amamra, N., Ringa, V., Tainturier, V., Berr, C., Clavel-Chapelon, F., … Schott, A.-M. (2005). Estimated numbers of postmenopausal women treated by hormone therapy in France. Maturitas, 52(3-4), 296–305. doi:10.1016/j.maturitas.2005.05.002 Geist, S. H., & Spielman, F. (1932). The therapeutic value of amniotin in the menopause. American Journal of Obstetrics and Gynecology, 23, 697. Geller, S. E., & Studee, L. (2005). Botanical and Dietary Supplements for Menopausal Symptoms: What Works, What Doesn’t. Journal of women’s health (2002), 14(7), 634–649. doi:10.1089/jwh.2005.14.634 Genazzani, A. R., Gambacciani, M., Simoncini, T., & Schneider, H. P. (2003). Hormone replacement therapy in the climacteric and aging brains. In Controversial Issues in Climacteric medicine III (Vol. 6, pp. 188–203). Presented at the International Menopause Society Expert Workshop, Pisa, Italy: Climacteric. Gergen, K. J. (1985). The Social Constructionist Movement in Modern Psychology. American Psychologist, 40(3), 266–275. Gergen, M. M. (2009). Framing lives: Therapy with women of a certain age. Women and Therapy, 32(2-3), 252–266. Gibson, C. J., Thurston, R. C., Bromberger, J. T., Kamarck, T., & Matthews, K. A. (2011). Negative affect and vasomotor symptoms in the Study of Women’s Health Across the Nation Daily Hormone Study. Menopause, 18(12), 1270–1277. doi:10.1097/gme.0b013e3182230e42 Girod, I., Abetz, L., de la Loge, C., Fayol-Paget, C., & Hunter, M. (2004). WHQ: Women’s Health Questionnaire, User Manual. MAPI Research Institute. Girod, I., de la Loge, C., Keininger, D., & Hunter, M. S. (2006). Development of a revised version of the Women’s Health Questionnaire. Climacteric: The Journal of the International Menopause Society, 9(1), 4–12. doi:10.1080/13697130500487372 Gleason, C. E., Dowling, N. M., Friedman, E., Wharton, W., & Asthana, S. (2011). Using predictors of hormone therapy use to model the healthy user bias. Menopause, 1. doi:10.1097/gme.0b013e318238ff2c 193 Gold, E. B., Bromberger, J., Crawford, S., Samuels, S., Greendale, G. A., Harlow, S. D., & Skurnick, J. (2001). Factors associated with age at natural menopause in a multiethnic sample of midlife women. American Journal of Epidemiology, 153(9), 865–874. Goodwin, P. J., Ennis, M., Pritchard, K. I., Trudeau, M., & Hood, N. (1999). Risk of menopause during the first year after breast cancer diagnosis. Journal of Clinical Oncology, 17(8), 2365– 2370. Gosling, S. D., Rentfrew, P. J., & Swann, W. B. (2003). A very brief measure of the Big-Five personality domains. Journal of Research in Personality, 37, 504–528. Grady, D., Macer, J., Kristof, M., Shen, H., Tagliaferri, M., & Creasman, J. (2009). Is a shorter hot flash diary just as good as a 7-day diary? Menopause, 16(5), 932–936. Grady, D., Rubin, S. M., Petitti, D. B., Fox, C. S., Black, D., Ettinger, B., … Cummings, S. R. (1992). Hormone therapy to prevent disease and prolong life in postmenopausal women. Annals of Internal Medicine, 117(12), 1016–1037. Graziottin, A. (2005). The woman patient after WHI. Maturitas, 51(1), 29–37. Greendale, G. A., Huang, M.-H., Wight, R. G., Seeman, T., Luetters, C., Avis, N. E., … Karlamangla, A. S. (2009). Effects of the menopause transition and hormone use on cognitive performance in midlife women. Neurology, 72(21), 1850–1857. Greene, J. (1998). Constructing a standard climacteric scale. Maturitas, 29(1), 25–31. doi:10.1016/S0378-5122(98)00025-5 Greene, J. C., Caracelli, V. J., & Graham, W. F. (1989). Toward a Conceptual Framework for MixedMethod Evaluation Designs. Educational Evaluation and Policy Analysis, 11(3), 255–274. doi:10.2307/1163620 Guthrie, J. R., Dennerstein, L., Taffe, J. R., & Donnelly, V. (2003). Health care-seeking for menopausal problems. Climacteric, 6(2), 112–117. Hagger, M. S., & Orbell, S. (2003). A Meta-Analytic Review of the Common-Sense Model of Illness Representations. Psychology & Health, 18, 141–184. doi:10.1080/088704403100081321 Harlow, S. D., Gass, M., Hall, J., Lobo, R., Maki, P. M., Rebar, R. W., … +10 Collaborative Group. (2012). Executive summary of the Stages of Reproductive Aging Workshop + 10: addressing the unfinished agenda of staging reproductive aging. Menopause, 19(4). doi:DOI: 10.1097/gme.0b013e31824d8f40 Harré, R. (2002). Public sources of the personal mind: Social constructionism in context. Theory and Psychology, 12(5), 611–623. Harré, R. (2004). Discursive psychology and the boundaries of sense. Organization Studies, 25(8), 1435–1453. Harrison, E., & Rose, D. (2006). The European Soci-economic Classification (ESeC) User Guide (User Guide). University of Essex, Colchester: Institute for Social and Economic Research. Harrison, J. A., Mullen, P. D., & Green, L. W. (1992). A meta-analysis of studies of the Health Belief Model with adults. Health Education Research, 7(1), 107 –116. doi:10.1093/her/7.1.107 Hawkes, K. (2003). Grandmothers and the evolution of human longevity. American Journal of Human Biology, 15(3), 380–400. Hayes, A. F. (2009). Beyond Baron and Kenny: Statistical Mediation Analysis in the New Millennium. Communications Monographs, 76(4), 408–420. doi:doi: 10.1080/03637750903310360 Hayes, S. C., Luoma, J. B., Bond, F. W., Masuda, A., & Lillis, J. (2006). Acceptance and Commitment Therapy: Model, processes and outcomes. Behaviour Research and Therapy, 44(1), 1–25. Hayes, S. C., Strosahl, K. D., Wilson, K. G., Bisset, R. T., Pistorello, D., Taormino, M. A., & Polusny et al. (2004). Measuring experiential avoidance: A preliminary test of a working model. Psychological Record, 54, 553–578. 194 Health Profiles 2012. (00:00:00). view 49802. Report None. Retrieved April 10, 2013, from http://www.apho.org.uk/resource/item.aspx?RID=117721 Heaney, C. A., & Israel, B. A. (1997). Social networks and social support. In Health Behavior and health education. San Francisco, CA: Jossey-Bass Inc. Heinemann, K., Ruebig, A., Potthoff, P., Schneider, H. P. G., Heinemann, L. A., & Do Minh, T. (2004). The Menopause Rating Scale (MRS) scale: A methodological review. Health and Quality of Life Outcomes. Health and Quality of Life Outcomes, 2, 45. Heinemann, L. A. J., DoMinh, T., Strelow, F., Gerbsch, S., Schnitker, J., & Schneider, H. P. G. (2004). The Menopause Rating Scale (MRS) as outcome measure for hormone treatment? A validation study. Health and Quality of Life Outcomes, 2, 67. doi:10.1186/1477-7525-2-67 Hersh, A. L., Stefanick, M. L., & Stafford, R. S. (2004). National Use of Postmenopausal Hormone Therapy: Annual Trends and Response to Recent Evidence. Journal of the American Medical Association, 291(1), 47–53. Hess, T. M., Auman, C., Colcombe, S. J., & Rahhal, T. A. (2003). The impact of stereotype threat on age differences in memory performance. Journals of Gerontology - Series B Psychological Sciences and Social Sciences, 58(1), P3–P11. Hilditch, J. R., Lewis, J., Peter, A., van Maris, B., Ross, A., Franssen, E., … Dunn, E. (1996). A menopause-specific quality of life questionnaire: development and psychometric properties. Maturitas, 24(6), 161–175. Holzbeirlein, J. M., Castle, E. P., & Thrasher, J. B. (2003). Complications of androgen-deprivation therapy for prostate cancer. Clinical Prostate Cancer, 2, 147–152. Honjo, H., Mamoru, U., Okubo, T., & Kikuchi, K. (1997). Country-specific information on the menopause in Japan. First Consensus Meeting on Menopause in East Asian Region. Horne, R. (1999). Patients’ beliefs about treatment: the hidden determinant of treatment outcome? Journal of Psychosomatic Research, 47(6), 491–495. Horne, R., Weinman, J., & Hankins, M. (1999). The Beliefs about Medicines Questionnaire: The development and evaluation of a new method for assessing the cognitive representation of medication. Psychology and Health, 14, 1–24. House, J. S., Landis, K. R., & Umberson, D. (1988). Social relationships and health. Science, 241(4865), 540–545. Howarth, C. (2006). A social representation is not a quiet thing:exploring the critical potential of social representations theory. British Journal of Social Psychology, 45(1), 65–68. doi:10.1348/014466605X43777 Howes, L. G., Howes, J. B., & Knight, D. C. (2006). Isoflavone therapy for menopausal flushes: A systematic review and meta-analysis. Maturitas, 55(3), 203–211. Hu, F. B., Grodstein, F., Hennekens, C. H., Colditz, G. A., Johnson, M., Manson, J. E., … Stampfer, M. J. (1999). Age at natural menopause and risk of cardiovascular disease. Archives of Internal Medicine, 159(10), 1061–1066. Hu, L., & Bentler, P. M. (1999). Cutoff criteria for fit indexes in covariance structure analysis: Conventional criteria versus new alternatives. Structural Equation Modeling: A Multidisciplinary Journal, 6(1), 1–55. doi:10.1080/10705519909540118 Hunot, V., Churchill, R., Teixeira, V., & Silva de Lima, M. (1996). Psychological therapies for generalised anxiety disorder. In Cochrane Database of Systematic Reviews. John Wiley & Sons, Ltd. Retrieved from http://onlinelibrary.wiley.com/doi/10.1002/14651858.CD001848.pub4/abstract Hunter, M. (2000). The Women’s Health Questionnaire (WHQ): The Development, Standardization and Application of a Measure of Mid-Aged Women’s Emotional and Physical Health. Quality of Life Research, 9(6 Supplement), 733–738. 195 Hunter, M, & Rendall, M. (2007). Bio-psycho-socio-cultural perspectives on menopause. Best Practice & Research Clinical Obstetrics and Gynaecology, 21(2), 261–274. doi:10.1016/j.bpobgyn.2006.11.001 Hunter, M. (1988). Psychological and somatic experience of the climacteric and postmenopause : predicting individual differences and help seeking behaviour. University of London. Hunter, M. S. (1990). Emotional well-being, sexual behaviour and hormone replacement therapy. Maturitas, 12(3), 299–314. Hunter, M. S., Gupta, P., Papitsch-Clark, A., & Sturdee, D. W. (2009). Mid-Aged Health in Women from the Indian Subcontinent (MAHWIS): A further quantitative and qualitative investigation of experience of menopause in UK Asian women, compared to UK Caucasian women and women living in Delhi. Climacteric, 12(1), 26–37. Hunter, M. S., & Haqqani, J. R. (2011). An investigation of discordance between subjective and physiological measures of vasomotor symptoms. Climacteric, 14(1), 146–151. Hunter, M. S., & Liao, K. L.-M. (1995). A psychological analysis of menopausal hot flushes. British Journal of Clinical Psychology, 34(4), 589–599. Hunter, M. S., O’Dea, I., & Britten, N. (1997). Decision-making and hormone replacement therapy: A qualitative analysis. Social Science and Medicine, 45(10), 1541–1548. Hunter, M. (1988). Psychological and somatic experience of the climacteric and postmenopause: predicting individual difference and help-seeking behaviour. Unpublshed doctoral thesis, The University of London. Hutton, J. D., Murray, M. A. F., Jacobs, H. S., & James, V. H. T. (1978). Relation Between Plasma Oestrone and Oestradiol and Climacteric Symptoms. The Lancet, 311(8066), 678–681. doi:10.1016/S0140-6736(78)90796-1 Hvas, L. (2006). Menopausal women’s positive experience of growing older. Maturitas, 54(3), 245– 251. doi:10.1016/j.maturitas.2005.11.006 Hvas, L., & Gannik, D. E. (2008a). Discourses on menopause - Part I: Menopause described in texts addressed to Danish women 1996-2004. Health, 12(2), 157–175. Hvas, L., & Gannik, D. E. (2008b). Discourses on menopause - Part II: How do women talk about menopause? Health, 12(2), 177–192. Hyde, A., Nee, J., Howlett, E., Drennan, J., & Butler, M. (2010). Menopause Narratives: The Interplay of Women’s Embodied Experiences With Biomedical Discourses. Qualitative Health Research, 20(6), 805–815. doi:10.1177/1049732310363126 Igarashi, M., Saito, H., Morioka, Y., Oiji, A., Nadaoka, T., & Kashiwakura, M. (2000). Stress vulnerability and climacteric symptoms: Life events, coping behavior, and severity of symptoms. Gynecologic and Obstetric Investigation, 49(3), 170–178. Ipsos Mori. (2009). Trust in Doctors 2009. London: The Royal College of Physicians. Ipsos Mori. (2013). Trust Polling. London: Ipsos MORI. Janz, N. K., & Becker, M. H. (1984). The Health Belief Model: a decade later. Health Education Quarterly, 11(1), 1–47. Johnson, R. B., & Onwuegbuzie, A. J. (2004). Mixed Methods Reearch: A Research Paradigm Whose Time Has Come. Educational Researcher, 33(7), 14–26. Johnson, R. B., Onwuegbuzie, A. J., & Turner, L. A. (2007). Toward a Definition of Mixed Methods Research. Journal of Mixed Methods Research, 1(2), 112–133. Johnstone, R. A., & Cant, M. A. (2010). The evolution of menopause in cetaceans and humans: The role of demography. Proceedings of the Royal Society B: Biological Sciences, 277(1701), 3765–3771. Jones, J. (1994). Embodied meaning: Menopause and the change of life. Social Work in Health Care, 19(3-4), 43–65. 196 Joshi, S., Khandwe, R., Bapat, D., & Deshmukh, U. (2011). Effect of Yoga on Menopausal Symptoms. Menopause International, 17(3), 78–81. doi:10.1258/mi.2011.011020 Jovchelovitch, S. (2002). Re-thinking the diveristy fo knowledge:Cogniitve polyphasia belief and respresentation. Psychologie & Societe, 5, 121–138. Kahneman, D., Krueger, A. B., Schkade, D., Schwarz, N., & Stone, A. (2004). The Day Reconstruction Method (DRM): Instrument Documentation. Kapil K, S., Lawal, T. O., Locklear, T. D., & Mahady, G. B. (2011). Black cohosh for menopause: Safety and efficacy issues and future perspectives. Drug Information Journal, 45(1), 37–44. Kaufert, P. A., & Gilbert, P. (1986). Women, menopause and medicalization. Culture, Medicine and Psychiatry, 10, 7–21. Kaufert, P. A., & Lock, M. (1997). Medicalization of Women’s Third Age. Journal of Psychosomatic Obstetrics & Gynecology, 18(2), 81–86. doi:10.3109/01674829709085573 Kaufert, P., Boggs, P. P., Ettinger, B., Woods, N. F., & Utian, W. H. (1998). Women and menopause: Beliefs, attitudes, and behaviors. The North American menopause society 1997 menopause survey. Menopause, 5(4), 197–202. Keefer, L., & Blanchard, E. B. (2005). Hot flash, hot topic: Conceptualizing menopausal symptoms from a cognitive-behavioral perspective. Applied Psychophysiology Biofeedback, 30(1), 75– 82. Khaw, K. T. (1992). Epidemiology of the menopause. British Medical Bulletin, 48(2), 249 –261. Kline, R. B. (2011). Principles and practice of structural equation modeling. Guilford Press. Klohnen, E. C., Vandewater, E. A., & Young, A. (1996). Negotiating the middle years: Ego-resiliency and successful midlife adjustment in women. Psychology and Aging, 11(3), 431–442. doi:10.1037/0882-7974.11.3.431 Kobasa, S. C. (1979). Stressful life events, personality, and health: An inquiry into hardiness. Journal of Personality and Social Psychology, 37(1), 1–11. Koch, P. B., & Mansfield, P. K. (2004). Facing the Unknown: Social Support During the Menopausal Transition. Women and Therapy, 27(3-4), 179–194. Kowalcek, I., Rotte, D., Banz, C., & Diedrich, K. (2005). Women’s attitude and perceptions towards menopause in different cultures: Cross-cultural and intra-cultural comparison of premenopausal and post-menopausal women in Germany and in Papua New Guinea. Maturitas, 51(3), 227–235. Kramer, A. F., Fabiani, M., & Colcombe, S. J. (2006). Contributions of Cognitive Neuroscience to the Understanding of Behavior and Aging. In Handbook of the Psychology of Aging (6th EDition., pp. 57 – 83). Elsevier Academic. Kronenberg, F. (2010). Menopausal hot flashes: A review of physiology and biosociocultural perspective on methods of assessment. Journal of Nutrition, 140(7), 1380–1385. Kronenberg, F. (1990). Hot Flashes: Epidemiology and Physiology. Annals of the New York Academy of Sciences, 592(1), 52–86. doi:10.1111/j.1749-6632.1990.tb30316.x Kuh, D., Hardy, R., Rodgers, B., & Wadsworth, M. E. J. (2002). Lifetime risk factors for women’s psychological distress in midlife. Social Science and Medicine, 55(11), 1957–1973. Lazarus, R. S., & Folkman, S. (1984). Stress, Appraisal, and Coping. Springer Publishing Company. Leblanc, E. S., Janowsky, J., Chan, B. K. S., & Nelson, H. D. (2001). Hormone replacement therapy and cognition: Systematic review and meta-analysis. Journal of the American Medical Association, 285(11), 1489–1499. Leiblum, S., & Swartzman, L. (1986). Women’s attitudes toward the menopause: an update. Maturitas, 8(1), 47–56. doi:10.1016/0378-5122(86)90007-1 Lethaby, A. E., Brown, J., Marjoribanks, J., Kronenberg, F., Roberts, H., & Eden, J. (2007). Phytoestrogens for vasomotor menopausal symptoms. Cochrane database of systematic reviews (Online), (4). 197 Lethaby, A., Hogervorst, E., Richards, M., Yesufu, A., & Yaffe, K. (2008). Hormone replacement therapy for cognitive function in postmenopausal women. Cochrane Database of Systematic Reviews, (1). Retrieved from http://www.scopus.com/inward/record.url?eid=2-s2.044949199302&partnerID=40&md5=3c5a1de6d271d4f6fbbe9dda35769b38 Leventhal, H., Brissette, I., & Leventhal, E. A. (2003). The self-regulation of health and illness behaviour. In The self regulation of health and illness behaviour (pp. 42–65). New York: Routledge. Leventhal, H., Meyer, D., & Nerenz, D. (1980). The common-sense representation of illness danger. In Contributions to Medical Psychology (Vol. 2, pp. 7–30). New York: Pergamon Press. Levin, D. M. (1988). The opening of vision:nIhilism and the postmodern situation. London: Routledge. Levy, R. L., Whitehead, W. E., Korff, M. R. V., & Feld, A. D. (2000). Intergenerational transmission of gastrointestinal illness behavior. The American Journal of Gastroenterology, 95(2), 451– 456. doi:10.1111/j.1572-0241.2000.01766.x Lewis, J., Hilditch, J., & Wong, C. (2005). Further psychometric property development of the Menopause-Specific Quality of Life questionnaire and development of a modified version, MENQOL-Intervention questionnaire. Maturitas, 50(3), 209–221. doi:10.1016/j.maturitas.2004.06.015 Lewis, M. A., & Rook, K. S. (1999). Social control in personal relationships:Impact on health behaviors and psychological distress. Health Psychology, 18, 63–71. Liao, K. L.-M., & Hunter, M. S. (1995). Knowledge and beliefs about menopause in a general population sample of mid-aged women. Journal of Reproductive and Infant Psychology, 13(2), 101–114. doi:10.1080/02646839508403240 Lindau, S. T., Schumm, L. P., Laumann, E. O., Levinson, W., O’Muircheartaigh, C. A., & Waite, L. J. (2007). A study of sexuality and health among older adults in the United States. New England Journal of Medicine, 357(8), 762–774. doi:10.1056/NEJMoa067423 Lobo-Luppi, L., & Fayol-Paget, C. (2004). Cross-Cultural Evaluation of the Women’s Health Questionnaire, the PGWB Index and the MLHF Questionnaire: Psychometric Findings and Reference Values (Newsletter No. 33) (pp. 8–10). Lyon: MAPI Research Trust. Lock. (1991). Contested meanings of the menopause. The Lancet, 337(8752), 1270–1272. doi:10.1016/0140-6736(91)92931-Q Lock, M. (1994). Menopause in cultural context. Experimental Gerontology, 29(3-4), 307–317. Lock, M. (1998). Menopause: lessons from anthropology. Psychosom Med, 60(4), 410–419. Longcope, C., Kato, T., & Horton, R. (1969). Conversion ofblood androgens in nromal adult women. Journal of Clinical Investigations, 48, 2191. López, F. A., Soares De Lorenzi, R. D., & d’ Andretta Tanaka, A. C. (2010). Quality of life of women in the menopausal transition phase evaluated via the menopause rating scale (MRS). Revista Chilena de Obstetricia y Ginecologia, 75(6), 375–382. Luetters, C., Huang, M.-H., Seeman, T., Buckwalter, G., Meyer, P. M., Avis, N. E., … Greendale, G. A. (2007). Menopause transition stage and endogenous estradiol and follicle-stimulating hormone levels are not related to cognitive performance: Cross-sectional results from the Study of Women’s Health Across the Nation (SWAN). Journal of Women’s Health, 16(3), 331–344. Luine, V. N. (2008). Sex Steroids and Cognitive Function. Journal of Neuroendocrinology, 20(6), 866–872. doi:10.1111/j.1365-2826.2008.01710.x Lupton, D. (1997). Consumerism, reflexivity and the medical encounter. Social Science and Medicine, 45(3), 373–381. doi:10.1016/S0277-9536(96)00353-X Lyons, A. C., & Griffin, C. (2003). Managing menopause: A qualitative analysis of self-help literature for women at midlife. Social Science and Medicine, 56(8), 1629–1642. 198 Ma, J., Drieling, R., & Stafford, R. S. (2006). US women desire greater professional guidance on hormone and alternative therapies for menopause symptom management. Menopause, 13(3), 506–516. Maartens, L. W. F., Knottnerus, J. A., & Pop, V. J. (2002). Menopausal transition and increased depressive symptomatology: A community based prospective study. Maturitas, 42(3), 195– 200. Maclaran, K., Horner, E., & Panay, N. (2010). Premature ovarian failure: Long-term sequelae. Menopause International, 16(1), 38–41. MacLennan, A. H. (2009). Hormone replacement therapy: a 2008 perspective. Obstetrics, Gynaecology and Reproductive Medicine, 19(1), 13–18. MacLennan, A. H., Henderson, V. W., Paine, B. J., Mathias, J., Ramsay, E. N., Ryan, P., … Taylor, A. W. (2006). Hormone therapy, timing of initiation, and cognition in women aged older than 60 years: The REMEMBER pilot study. Menopause, 13(1), 28–36. Maddux, J. E., & Rogers, R. W. (1983). Protection motivation and self-efficacy: A revised theory of fear appeals and attitude change. Journal of Experimental Social Psychology, 19(5), 469–479. Maki, P. M., Dennerstein, L., Clark, M., Guthrie, J., LaMontagne, P., Fornelli, D., … Resnick, S. M. (2010). Perimenopausal use of hormone therapy is associated with enhanced memory and hippocampal function later in life. Retrieved from http://www.scopus.com/inward/record.url?eid=2-s2.078649716035&partnerID=40&md5=14fdae33f15f5428184e3cab9f3dc02d Maki, P. M., Drogos, L. L., Rubin, L. H., Banuvar, S., Shulman, L. P., & Geller, S. E. (2008). Objective hot flashes are negatively related to verbal memory performance in midlife women. Menopause, 15(5), 848–856. Malterud, K. (2001). Qualitative research: standards, challenges, and guidelines. The Lancet, 358(9280), 483–488. doi:10.1016/S0140-6736(01)05627-6 Mansfield, P. K., Koch, P. B., & Gierach, G. (2003). Husbands’ support of their perimenopausal wives. Women & Health, 38(3), 97–112. doi:10.1300/J013v38n03_07 Marshall, T., Jones, D. P. H., Ramchandani, P. G., Stein, A., & Bass, C. (2007). Intergenerational transmission of health beliefs in somatoform disorders Exploratory study. The British Journal of Psychiatry, 191(5), 449–450. doi:10.1192/bjp.bp.107.035261 Matthews, K. A., Wing, R. R., Kuller, L. H., Meilahn, E. N., Kelsey, S. F., Costello, E. J., & Caggiula, A. W. (1990). Influences of natural menopause on psychological characteristics and symptoms of middle-aged healthy women. Journal of Consulting and Clinical Psychology, 58(3), 345– 351. doi:10.1037/0022-006X.58.3.345 McEwen, B. S. (2007). Physiology and Neurobiology of Stress and Adaptation: Central Role of the Brain. Physiol. Rev., 87(3), 873–904. doi:10.1152/physrev.00041.2006 McIntosh, J., & Blalock, S. J. (2005). Effects of media coverage of Women’s Health Initiative study on attitudes and behavior of women receiving hormone replacement therapy. American Journal of Health-System Pharmacy, 62(1), 69–74. McKinlay, J. B., McKinlay, S. M., & Brambilla, D. J. (1987). Health Status and Utilization Behavior Associated with Menopause. American Journal of Epidemiology, 125(1), 110–121. McKinley, N. M. (2006). The developmental and cultural contexts of objectified body consciousness: A longitudinal analysis of two cohorts of women. Developmental Psychology, 42(4), 679–687. McKinley, N. M., & Lyon, L. A. (2008). Menopausal attitudes, objectified body consciousness, aging anxiety, and body esteem: European American women’s body experiences in midlife. Body Image, 5(4), 375–380. Melby, M. K., Lock, M., & Kaufert, P. (2005). Culture and symptom reporting at menopause. Human Reproduction Update, 11(5), 495–512. 199 Meyer, V. F. (2003). Medicalized menopause, U.S. style. Health Care for Women International, 24(9), 822–830. Mielewczyk, F., & Willig, C. (2007). Old clothes and an older look: The case for a radical makeover in health behaviour research. Theory and Psychology, 17(6), 811–837. doi:10.1177/0959354307083496 Million Women Study Collaborators. (2003). Breast cancer and hormone replacement therapy in the Million Women Study. Lancet, 362, 419–427. Mishra, G. D., & Dobson, A. J. (2011). Using longitudinal profiles to characterize women’s symptoms through midlife. Menopause, 1. doi:10.1097/gme.0b013e3182358d7c Mishra, G. D., & Kuh, D. (2012). Health symptoms during midlife in relation to menopausal transition: British prospective cohort study. BMJ (Online), 344(7846). Mishra, G., Kok, H., Ecob, R., Cooper, R., Hardy, R., & Kuh, D. (2006). Cessation of Hormone Replacement Therapy After Reports of Adverse Findings From Randomized Controlled Trials: Evidence From a British Birth Cohort. American Journal of Public Health, 96(7), 1219–1225. doi:10.2105/AJPH.2005.071332 Mitchell, E. S., & Woods, N. F. (2001). Midlife women’s attributions about perceived memory changes: Observations from the Seattle Midlife Women’s Health Study. Journal of Women’s Health and Gender-Based Medicine, 10(4), 351–362. Montero, I., Ruiz, I., & Hernandez, I. (1993). Social functioning as a significant factor in women’s help-seeking behaviour during the climacteric period. Social Psychiatry and Psychiatric Epidemiology, 28, 178–183. Morabia, A., & Costanza, M. C. (1998). International Variability in Ages at Menarche, First Livebirth, and Menopause. American Journal of Epidemiology, 148(12), 1195–1205. Morrison, L. A., Sievert, L. L., Brown, D. E., Rahberg, N., & Reza, A. (2010). Relationships between menstrual and menopausal attitudes and associated demographic and health characteristics: The hilo women’s health study. Women and Health, 50(5), 397–413. Morrow, J., & Nolen-Hoeksema, S. (1990). Effects of responses to depression on the remediation of depressive affect. Journal of Personality and Social Psychology, 58(3), 519–527. doi:10.1037/0022-3514.58.3.519 Morse, C., Smith, A., Dennerstein, L., Green, A., Hopper, J., & Burger, H. (1994). The treatmentseeking woman at menopause. Maturitas, 18(3), 161–173. doi:10.1016/0378-5122(94)901228 Moscovici, S., & Farr, R. M. (1984). The phenomenon of social representations. Paris, Cambridge: Cambridge University Press. Moynihan, R. (2002). Too much medicine? BMJ, 324(7342), 859–860. doi:10.1136/bmj.324.7342.859 Murabito, J. M., Yang, Q., Fox, C., Wilson, P. W. F., & Cupples, L. A. (2005). Heritability of age at natural menopause in the framingham heart study. Journal of Clinical Endocrinology and Metabolism, 90(6), 3427–3430. doi:10.1210/jc.2005-0181 Nedrow, A., Miller, J., Walker, M., Nygren, P., Huffman, L. H., & Nelson, H. D. (2006). Complementary and alternative therapies for the management of menopause-related symptoms: A systematic evidence review. Archives of Internal Medicine, 166(14), 1453– 1465. Nedstrand, E., Wijma, K., Lindgren, M., & Hammar, M. (1998). The relationship between stresscoping and vasomotor symptoms in postmenopausal women. Maturitas, 31(1), 29–34. Nedstrand, E., Wijma, K., Wyon, Y., & Hammar, M. (2005). Applied relaxation and oral estradiol treatment of vasomotor symptoms in postmenopausal women. Maturitas, 51(2), 154–162. Nelson, H. D. (2008). Menopause. The Lancet, 371(9614), 760–770. 200 Nelson, H. D., Humphrey, L. L., Nygren, P., Teutsch, S. M., & Allan, J. D. (2002). Postmenopausal hormone replacement therapy: Scientific review. Journal of the American Medical Association, 288(7), 872–881. Neri, I., Demyttenaere, K., & Facchinetti, F. (1997). Coping style and climacteric symptoms in a clinical sample of postmenopausal women. Journal of Psychosomatic Obstetrics and Gynaecology, 18(3), 229–233. Neugarten, B. L., & Kraines, R. J. (1965). “Menopausal Symptoms” in Women of Various Ages. Psychosom Med, 27(3), 266–273. Neugarten, B., Wood, V., Kraines, R. J., & Loomis, B. (1963). Women’s Attitudes to Menopause. Vita Humana, 6(3), 140–151. Niland, P., & Lyons, A. C. (2011). Uncertainty in medicine: Meanings of menopause and hormone replacement therapy in medical textbooks. Social Science and Medicine, 73(8), 1238–1245. Notelovitz, M., Lenihan Jr., J. P., McDermott, M., Kerber, I. J., Nanavati, N., & Arce, J.-C. (2000). Initial 17β-Estradiol dose for treating vasomotor symptoms. Obstetrics and Gynecology, 95(5), 726–731. doi:10.1016/S0029-7844(99)00643-2 O’Brien, T. B., & DeLongis, A. (1996). The Interactional Context of Problem-, Emotion-, and Relationship-Focused Coping: The Role of the Big Five Personality Factors. Journal of Personality, 64(4), 775–813. doi:10.1111/j.1467-6494.1996.tb00944.x O’Leary Cobb, J. (1998). Reassuring the woman facing menopause: Strategies and resources. Patient Education and Counseling, 33(3), 281–288. Ogden, J. (2003). Some problems with social cognition models: A pragmatic and conceptual analysis. Health Psychology, 22(4), 424–428. doi:10.1037/0278-6133.22.4.424 Oldenhave, A., Jaszmann, L. J. B., Haspels, A. A., & Everserd, W. (1993). Impact of climacteric on well-being. American Journal of Obstetrics and Gynecology, 168, 772–780. Ory, M. (2003). Challenging aging stereotypesStrategies for creating a more active society. American Journal of Preventive Medicine, 25(3), 164–171. doi:10.1016/S0749-3797(03)00181-8 Panay, N. (2012). Commentary regarding recent Million Women Study critique and subsequent publicity. Menopause International, 18(2), 33–35. Panay, N., & Maamari, R. (2012). Treatment of postmenopausal vaginal atrophy with 10-µg estradiol vaginal tablets. Menopause International, 18, 15–19. doi:10.1258/mi.2012.011120 Panay, N., & Studd, J. (1997). Progestogen intolerance and compliance with hormone replacement therapy in menopausal women. Human Reproduction Update, 3(2), 159–171. Panay, Nick, Hamoda, H., Arya, R., & Savvas, M. (2013). The 2013 British Menopause Society & Women’s Health Concern recommendations on hormone replacement therapy. Menopause International, 19(2), 59–68. doi:10.1177/1754045313489645 Papalia, D. E. (Ed.). (2007). Adult Development and Aging (3rd ed.). New York: McGraw-Hill. Peccei, J. S., & Peccei, J. S. (2001). A critique of the grandmother hypotheses: Old and new, A critique of the grandmother hypotheses: Old and new. American Journal of Human Biology, American Journal of Human Biology, 13, 13(4, 4), 434, 434–452, 452. doi:10.1002/ajhb.1076, 10.1002/ajhb.1076 Pennebaker, J.W (1982). The Psychology of Physical Symptoms. New York:Springer-Verlag Pennebaker, J.W., (1983) Accuracy of symptom perception in A, Baum, S.E. Taylor and J.Singer (eds) Handbook of Psychology and Health, vol4. Hillsdale, NJ:Erlbaum Perz, J., & Ussher, J. M. (2008). “The horror of this living decay”: Women’s negotiation and resistance of medical discourses around menopause and midlife. Women’s Studies International Forum, 31(4), 293–299. Pharm, M.-P. G. B., Dragomir, A., Pilon, D., Moride, Y., & Perreault, S. (2007). Changes in pattern of use, clinical characteristics and persistence rate of hormone replacement therapy among postmenopausal women after the WHI publication. Pharmacoepidemiology and Drug Safety, 16(1), 17–27. 201 Pimenta, F., Leal, I., Maroco, J., & Ramos, C. (2011). Perceived control, lifestyle, health, sociodemographic factors and menopause: Impact on hot flashes and night sweats. Maturitas, 69(4), 338–342. Pines, A., & Berry, E. M. (2007). Exercise in the menopause - An update. Climacteric, 10(SUPPL. 2), 42–46. Pitkin, J. (2012). Alternative and complementary therapies for the menopause. Menopause International, 18(1), 20–27. Politi, M. C., Schleinitz, M. D., & Col, N. F. (2008). Revisiting the duration of vasomotor symptoms of menopause: A meta-analysis. Journal of General Internal Medicine, 23(9), 1507–1513. Pollycove, R., Naftolin, F., & Simon, J. A. (2011). The evolutionary origin and significance of menopause. Menopause, 18(3), 336–342. doi:10.1097/gme.0b013e3181ed957a Porter, M., Penney, G. C., Russell, D., Russell, E., & Templeton, A. (1996). A population based survey of women’s experience of the menopause. British Journal of Obstetrics and Gynaecology, 103(10), 1025–1028. Posner, J. (1979). It’s all in your head: Feminist and medical models of menopause (strange bedfellows). Sex Roles, 5(2), 179–190. doi:10.1007/BF00287929 Potthoff, P., Heinemann, L. A., Schneider, H. P., Rosemeier, H. P., & Hauser, G. A. (2000). [The Menopause Rating Scale (MRS II): methodological standardization in the German population]. Zentralblatt Für Gynäkologie, 122(5), 280–286. Prentice, R. L., Langer, R. D., Stefanick, M. L., Howard, B. V., Pettinger, M., Anderson, G. L., … Wactawski-Wende, J. (2006). Combined Analysis of Women’s Health Initiative Observational and Clinical Trial Data on Postmenopausal Hormone Treatment and Cardiovascular Disease. American Journal of Epidemiology, 163(7), 589–599. doi:10.1093/aje/kwj079 Rammstedt, B. (2007). The 10-Item Big Five Inventory. European Journal of Psychological Assessment, 23(3), 193–201. doi:10.1027/1015-5759.23.3.193 Rand, K. L., Otte, J. L., Flockhart, D., Hayes, D., Storniolo, A. M., Stearns, V., … Carpenter, J. S. (2011). Modeling hot flushes and quality of life in breast cancer survivors. Climacteric, 14(1), 171–180. Rees, M, Stevenson, J., Hope, S., Rozenberg, S., & Palacios, S. (2011). Management of the menopause (5th ed.). London: The Royal Society of Medicine Press. Rees, Margaret. (2011). Management of the Menopause: Integrated Health-Care Pathway for the Menopausal Woman. Menopause International, 17(2), 50–54. doi:10.1258/mi.2011.011013 Rehman, H., & Masson, E. (2005). Neuroendocrinology of female aging. Gender Medicine, 2(1), 41– 56. doi:10.1016/S1550-8579(05)80008-7 Reynolds, F. (1999). Some relationships between perceived control and women’s reported coping strategies for menopausal hot flushes. Maturitas, 32(1), 25–32. Riggs, B. L., Khosla, S., & Melton, L. J. (2002). Sex Steroids and the Construction and Conservation of the Adult Skeleton. Endocr Rev, 23(3), 279–302. doi:10.1210/er.23.3.279 Robinson, D., & Cardozo, L. (2001). The Pathophysiology and Management of Postmenopausal Urogenital Oestrogen Deficiency. Menopause International, 7(2), 67–73. doi:10.1258/136218001100321263 Rook, K. S., Catalano, R., & Dooley, D. (1989). The timing of major life events: Effects of departing from the social clock. American Journal of Community Psychology, 17(2), 233–258. doi:10.1007/BF00931009 Royal College of Obstericians and Gynaecologists. (2011). High Quality Women’s Health Care: A proposal for change. London: Royal College of Obstetricians and Gynaecologists. Rubinstein, H. (2010). The Invisible Aging Woman: how women think about their bodies during the menopause transition in the face of cultural ideals of youth and beauty (Dissertation). University of Cambridge. 202 Rubinstein, H. R., & Foster, J. L. (2012). “I don’t know whether it is to do with age or to do with hormones and whether it is do with a stage in your life”: Making sense of menopause and the body. Journal of Health Psychology, 18(2), 292–307. doi:10.1177/1359105312454040 Schilling, C., Gallicchio, L., Miller, S. R., Langenberg, P., Zacur, H., & Flaws, J. A. (2007). Genetic polymorphisms, hormone levels, and hot flashes in midlife women. Maturitas, 57(2), 120– 131. doi:10.1016/j.maturitas.2006.11.009 Schneider, H. P. G., Heinemann, L. A. J., Rosemeier, H. P., Potthoff, P., & Behre, H. M. (2000a). The Menopause Rating Scale (MRS): Reliability of scores of menopausal complaints. Climacteric, 3, 59–64. Schneider, H. P. G., Heinemann, L. A. J., Rosemeier, H.-P., Potthoff, P., & Behre, H. M. (2000b). The menopause rating scale (MRS): Comparison with Kupperman index and quality-of-life scale SF-36. Climacteric, 3(1), 50–58. Schwartz, N., Kahneman, D., & Xu, J. (2009). Global & Episodic Reports of Hedonic Experience. In Calendar & Time Diary: Methods in Life Course Research (pp. 157 – 174). Sage. Schwarzer, R., & Knoll, N. (2010). Social support. In Health Psychology (2nd ed., pp. 281–293). Oxford: BPS Blackwell. Schwarzer, R., & Leppin, A. (1991). Social Support and Health: A Theoretical and Empirical Overview. Journal of Social and Personal Relationships, 8(1), 99–127. doi:10.1177/0265407591081005 Shapiro, S., Farmer, R. D. T., Seaman, H., Stevenson, J. C., & Mueck, A. O. (2011). Does Hormone Replacement Therapy Cause Breast Cancer? An Application of Causal Principles to Three Studies Part 1. The Collaborative Reanalysis. Journal of Family Planning and Reproductive Health Care, 37(2), 103–109. doi:10.1136/jfprhc.2011.0078 Shea, J. L. (2006). Parsing the ageing Asian woman: Symptom results from the China Study of Midlife Women. Maturitas, 55(1), 36–50. Sherman, S. R. (1997). Images of middle-aged and older women: Historical, cultural and personal. In Handbook on Women and Aging (pp. 14–28). Westport: Greenwood Press. Shoebridge, A., & Steed, L. (1999). Discourse about menopause in selected print media. Australian and New Zealand Journal of Public Health, 23, 475–481. doi:10.1111/j.1467842X.1999.tb01302.x Shumaker, S. A., & Hill, D. R. (1991). Gender differences in social support and physical health. Health Psychology, 10(2), 102–111. Simpson, E. E. A., & Thompson, W. (2009). Stressful life events, psychological appraisal and coping style in postmenopausal women. Maturitas, 63(4), 357–364. Skinner, E. A., Edge, K., Altman, J., & Sherwood, H. (2003). Searching for the structure of coping: a review abd critique if category systems for classifying systems. Psychological Bulletin, 129, 216–269. Sloan, J. A., Loprinzi, C. L., Novotny, P. J., Barton, D. L., Lavasseur, B. I., & Windschitl, H. (2001). Methodologic Lessons Learned From Hot Flash Studies. Journal of Clinical Oncology, 19(23), 4280 –4290. Soares, C. N. (2010). Can depression be a menopause-associated risk? BMC Medicine, 8. Retrieved from http://www.scopus.com/inward/record.url?eid=2-s2.078649511273&partnerID=40&md5=b8f706faa3b3f70ded14173bb55e9aa7 Soules, M. R., Sherman, S., Parrott, E., Rebar, R., Santoro, N., Utian, W., & Woods, N. R. (2001). Executive summary: Stages of Reproductive Aging Workshop (STRAW) Park City, Utah, July, 2001. Menopause November 2001, 8(6), 402–407. Stearns, V., Johnson, M. D., Rae, J. M., Morocho, A., Novielli, A., Bhargava, P., … Flockhart, D. A. (2003). Active tamoxifen metabolite plasma concentrations after coadministration of 203 tamoxifen and the selective serotonin reuptake inhibitor paroxetine. Journal of the National Cancer Institute, 95(23), 1758–1764. Steele, C. M., & Aronson, J. (1995). Stereotype Threat and the Intellectual Test Performance of African Americans. Journal of Personality and Social Psychology, 69(5), 797–811. Stephens, C. (2001). Women’s Experience at the time of menopause: Accounting for biological, cultural and psychological embodiment. Journal of Health Psychology, 6(6), 651 –663. Stephens, C., & Breheny, M. (2008). Menopause and the virtuous woman: The importance of the moral order in accounting for medical decision making. Health, 12(1), 7–24. Stevenson, J. C. (2013). HRT should be used for primary prevention in the asymptomatic healthy postmenopausal woman. Presntation presented at the BMS 23rd Annual Conference, Stratford. Stone, A. A., & Neale, J. M. (1984). New measure of daily coping: Development and preliminary results. Journal of Personality and Social Psychology, 46(4), 892–906. doi:10.1037/00223514.46.4.892 Stone, A. A., Shiffman, S., Schwartz, J. E., Broderick, J. E., & Hufford, M. R. (2003). Patient compliance with paper and electronic diaries. Controlled Clinical Trials, 24(2), 182–199. doi:10.1016/S0197-2456(02)00320-3 Stuart-Hamilton, I. (1994). The Psychology of Aging: An introduction (2nd Edition.). London & Bristol, Pennsylvania: Jessica, Kingsley Publishers. Studd, J. (2004). Second thoughts on the Women’s Health Initiative study: The effect of age on the safety of HRT. Climacteric, 7(4), 412–414. Studd, J. (2010). Ten reasons to be happy about hormone replacement therapy: A guide for patients. Menopause International, 16(1), 44–46. Studd, J. W. (Ed.). (2000). The Management of the Menopause: the Millenium Review 2000. The Parthenon Publishing Group. Suls, J., David, J. P., & Harvey, J. H. (1996). Personality and Coping: Three Generations of Research. Journal of Personality, 64(4), 711–735. doi:10.1111/j.1467-6494.1996.tb00942.x Suvanto-Luukkonen, E., Koivunen, R., Sundström, H., Bloigu, R., Karjalainen, E., Häivä-Mällinen, L., & Tapanainen, J. S. (2005). Citalopram and fluoxetine in the treatment of postmenopausal symptoms: a prospective, randomized, 9-month, placebo-controlled, double-blind study. Menopause (New York, N.Y.), 12(1), 18–26. Taylor, S.E (1983). Adjustment to threatening events: a theory of cognitive adaptation, American Psychologist 38:1161-73 Taylor, S.E.,Lichtman, R.R., and Wood, J.V. (1984) Attributions, beliefs about control, and adjustment to breast cancer, Journal of Personality and Social Psychology, 46:489-502 Thurston, R. C., Sowers, M. R., Sutton-Tyrrell, K., Everson-Rose, S. A., Lewis, T. T., Edmundowicz, D., & Matthews, K. A. (2008). Abdominal adiposity and hot flashes among midlife women. Menopause, 15(3), 429–434. Tiihonen, M., Saarela, M., Saarinen, S., Ahonen, R., & Heikkinen, A.-M. (2011). Menopausal hormone therapy - Benefits, adverse reactions, concerns and information sources in 2009. Maturitas, 70(1), 69–73. Toulis, K. A., Tzellos, T., Kouvelas, D., & Goulis, D. G. (2009). Gabapentin for the treatment of hot flashes in women with natural or tamoxifen-induced menopause: A systematic review and meta-analysis. Clinical Therapeutics, 31(2), 221–235. Tremblay, A., Sheeran, L., & Aranda, S. K. (2008). Psychoeducational interventions to alleviate hot flashes: A systematic review. Menopause, 15(1), 193–202. Uchino, B. (2006). Social Support and Health: a review of physiological processess potentially underlying links to disease outcomes. Journal of Behavioural Medicine, 29(5), 377– 387. Ussher, J. M. (2011). The Madness of Women: Myth and Experience. London and New York: Routledge. 204 Utian, W. H. (2004). Menopause-related definitions. International Congress Series, 1266, 133–138. doi:10.1016/j.ics.2004.01.102 Utian, W. H. (2005). Psychosocial and socioeconomic burden of vasomotor symptoms in menopause: A comprehensive review. Health and Quality of Life Outcomes, 3. Retrieved from http://www.scopus.com/inward/record.url?eid=2-s2.027344439508&partnerID=40&md5=b765d35b2b550803c5c848136dfbe8c6 Utian, W. H., & Boggs, P. P. (1999). The North American Menopause Society 1998 menopause survey. Part I: Postmenopausal women’s perceptions about menopause and midlife. Menopause, 6(2), 122–128. Utz, R. L. (2010). Like mother, (not) like daughter: The social construction of menopause and aging. doi:10.1016/j.jaging.2010.08.019 Van Asselt, K. M., Kok, H. S., Pearson, P. L., Dubas, J. S., Peeters, P. H. M., Te Velde, E. R., & Van Noord, P. A. H. (2004). Heritability of menopausal age in mothers and daughters. Fertility and Sterility, 82(5), 1348–1351. doi:10.1016/j.fertnstert.2004.04.047 Van Keep, P. A. (1990). The history and rationale of hormone replacement therapy. Maturitas, 12(3), 163–170. Veit, C. T., & Ware, J. E. (1983). The structure of psychological distress and well-being in general populations. Journal of Consulting and Clinical Psychology, 51(5), 730–742. Voda, A. M. (1981). Climacteric hot flush. Maturitas, 3, 73–90. Voda, A. M. (1982). Coping with the menopausal hot flash. Patient Counselling and Health Education, 4(2), 80–83. doi:10.1016/S0190-2040(82)80003-7 Vygotsky, L. S. (1986). Thought & Language. Cambridge, MA: MIT Press. Wagner, W., Duveen, G., Farr, R., Lorenzi-Cioldi, F., Markova, I., & Rose, D. (1999). Theory and method of social representations. Asian Journal of Social Psychology, 2, 95–125. Watkins, M. W. (2000). Monte Carlo PCA for Parallel Analysis (computer software). State College, PA: Ed & Psych Associates. Weinman, J and Petrie, K.J (2002) Illness Perceptions: a new paradigm i for psychosomatics? n (ed. Marks. D.F.) The Health Psychology Reader, Sage:London Weinstein, N. D., & Rutgers, U. (1993). Testing four competing theories of health- protective behaviour. Health Psychology, 12(4), 324–333. doi:10.1037/0278-6133.12.4.324 Williams, R. E., Kalilani, L., DiBenedetti, D. B., Zhou, X., Fehnel, S. E., & Clark, R. V. (2007). Healthcare seeking and treatment for menopausal symptoms in the United States. Maturitas, 58(4), 348–358. Wills, T. A. (1981). Downward comparison principles in social psychology. Psychological Bulletin, 90(2), 245–271. doi:10.1037/0033-2909.90.2.245 Wilson, R. A. (1966). Feminine Forever. London: W.H.Allen. Winterich, J. A., & Umberson, D. (1999). How Women Experience Menopause: The Importance of Social Context. Journal of Women and Aging, 11(4), 57–73. Woods, N. F., Mitchell, E. S., Tao, Y., Viernes, H.-M. A., Stapleton, P. L., & Farin, F. M. (2006). Polymorphisms in the estrogen synthesis and metabolism pathways and symptoms during the menopausal transition. Menopause, 13(6), 902–910. doi:10.1097/01.gme.0000227058.70903.9f World Health Authority. (1994). WHO Scientific Group on Research on the Menopause in the 1990’s. WHO Technical Report Series 866. Geneva, Switzerland (1994). The Health and Social Care Information Centre, NHS. Writing Group for the Women’s Health Initiative Investigators. (2002). Risk and benefits of estrogen plus progestin in healthy post-menopausal women. Principal results from the women’s health initiative randomized controlled trial. Journal of the American Medical Association, 288(3), 321–333. 205 Wyon, Y., Nedstrand, E., & Hammar, M. (2006). Acupuncture and menopausal hot flushes - More research is needed [3]. Acupuncture in Medicine, 24(2), 95–97. Zaborowska, E., Brynhildsen, J., Damberg, S., Fredriksson, M., Lindh-Åstrand, L., Nedstrand, E., … Hammar, M. (2007). Effects of acupuncture, applied relaxation, estrogens and placebo on hot flushes in postmenopausal women: An analysis of two prospective, parallel, randomized studies. Climacteric, 10(1), 38–45. Zhao, X., Lynch, J. G., & Chen, Q. (2010). Reconsidering Baron and Kenny: Myths and Truths About Mediation Analysis (SSRN Scholarly Paper No. ID 1554563). Rochester, NY: Social Science Research Network. Retrieved from http://papers.ssrn.com/abstract=1554563 Ziv-Gal, A., & Flaws, J. A. (2010). Factors that may influence the experience of hot flushes by healthy middle-aged women. Journal of Women’s Health, 19(10), 1905–1914. 206 Appendix 1:Introductory letter to GPs Department of Psychology Free School Lane Cambridge CB2 3RQ Date Name Address Assistance in finding volunteers for study on women’s health & well-being in midlife Dear Name I am writing to ask if your practice would be able to assist me in advertising a project to find volunteers to take part in a survey on women’s health and well-being in midlife. I am at the Department of Social & Developmental Psychology at the University of Cambridge, where I am currently studying for a PhD under the supervision of Dr Juliet Foster. The subject of the study concerns the psychology of the menopause transition; specifically I am investigating predictors of seeking treatment during the menopause transition and am comparing women who seek treatment with those who do not. Surprisingly, given that women make up 50% of the population, this is a relatively under-researched topic and your help would be greatly appreciated. I need to recruit women aged between 40 to 60 years of age who will be prepared to complete a questionnaire (pen & paper or on-line). A small sample of the women who answer the survey will also be asked to keep a diary about their daily experiences of menopause-related events and to participate in an interview to discuss these experiences in more detail. In addition to ensuring that women who are peri- or postmenopausal are recruited, I am very keen to ensure that a range of women from different backgrounds are represented. For this reason, I am using a variety of channels to reach women at this age and stage of their lives and several medical practices in Cambridge and Nottingham will be participating. The study has been reviewed by, and received ethics clearance through the Cambridge Psychology Research ethics committee. I am not asking for any of your time but would appreciate it if you would put up a poster in the waiting room, along with some postcards for women to take away with information about how to volunteer. In addition, I could leave some questionnaires in the surgery for women to take away directly. I intend to collect this data during the next 6-9 months and would be very happy to provide you with feedback and results once I have analysed the data. I will call you shortly to find out if you would be prepared to participate Yours Sincerely Helena Rubinstein email: [email protected] m: 07788 422 688 207 Appendix 2a: Recruitment copy - posters and postcards 208 209 Appendix 3: Wellbeing in midlife questionnaire Helena Rubinstein Social & Developmental Psychology Department of Psychology Free School Lane Cambridge CB2 3RQ 07788 422682 WELLBEING IN MIDLIFE SURVEY For women aged 40-60 years of age 210 # Wellbeing in MidLife Survey This survey concerns women’s experiences in mid-life concerning their health and well-being. The survey is divided into 4 sections: Section 1: general information about you Section 2: your health Section 3: your menstrual status and your experiences of menopause, if appropriate Section 4: your attitudes to life in general Your views are very important, so please try and complete all of the survey. However, you do not have to answer all the questions if you do not wish to and you can stop at any time without explanation. All information is strictly confidential and no details about you will be seen by anyone other than the researcher involved in the project. All responses will be anonymous and your name will not be associated with any comments made during the course of the research. All data will be identified by a code, with names kept in a locked file. Results will be written up as a PhD thesis, and in academic papers for journal and conferences. The research has received ethical approval from the Cambridge Central NRES Committee, East of England. At the end of the survey you will be asked if you wish to take part in a follow up survey which will require you to keep a record for 7 days and complete a detailed 24-hour diary for 1-day only. You are under no obligation to continue to this stage. Only answer this question if you are interested in taking part If you require additional information about the survey please contact Helena Rubinstein at the Department Psychology, The University of Cambridge on [email protected] or 07788 422 682 or refer to the website http://www.sdp.cam.ac.uk/wellbeingsurvey. If you are concerned about any health or related issues raised by this survey you should consider contacting your GP or using the NHS Choices website which has relevant information. This can be accessed at http://www.nhs.uk/conditions/menopause/Pages/Introduction.aspx Please begin the questionnaire. It will take about 25-30 minutes to complete. If you are unable to finish it in one sitting you can return to it later to complete It has been made clear to me that my involvement in this research is voluntary and that I can withdraw at any stage. □ Yes, I am happy to participate □ No, I do not wish to complete the survey 211 SECTION 1 SOME GENERAL INFORMATION ABOUT YOU Q1 What is your date of birth? Day__________ Month_____________Year______________ Q2 Please indicate what is the highest educational qualification that you have □ 'O' levels or GCSEs or CSEs □ 'A' level or Higher School Certificate □ NVQs □ First degree e.g. B.A. or B.Sc. □ Higher Degree e.g. M.A., M.Sc., M.Phil. or PhD □ Professional qualification e.g. nursing, teaching or accountancy □ None of these Q3 Which of the following best describes your current situation? □ I am working full time. Please state industry sector or type of company ________________________________________________________ → GO TO Q3A □ I am working part time. Please state industry sector or type of company ________________________________________________________ → GO TO Q3B □ I am retired. Please state the industry sector or type of company of your last job ________________________________________________________→GO TO Q3C □ I am not in paid employment → GO TO Q4 □ I am a student → GO TO Q4 Q3A What is your current job title? Q3B What is your current job title? Q3C What was the title you had in your last job? 212 Q4 What is your current status? □ Single, never married □ Married □ Separated □ Living with partner □ Divorced □ Widowed Q5 How many children have you given birth to? □ None □ 1-2 □ 3 -5 □ More than 5 Q6 Please indicate whether you own or rent the accommodation you are in □ Own outright □ Own with mortgage □ Rent from council □ Rent from housing association or cooperative □ Other Q7 Which best describes your race or ethnic group? □ White □ Mixed race □ Asian or Asian-British □ Black or Black-British □ Chinese □ Other. Please state _______________________________________________________ 213 Q8 What is you annual household income? Please select from the appropriate category □ £0 - £9,999 □ £10,000 - £19,999 □ £20,000 - £29,999 □ £30,000 - £39,999 □ £40,000 - £59,999 □ More than £60,000 Q9 Please write in your post code or the name of the area that you live in e.g. Nottingham or Cambridge SECTION 2: QUESTIONS ABOUT YOUR HEALTH Q10 Please enter your current weight in stones and lbs (For those who are more used to using metric measurements, 0.45 kilos = 1 lb and 6.3 kilos = 1 stone) ______ stones ______ lbs Q11 Please enter your height in feet and inches (For those more used to using metric measurements, 2.54 cms = 1 inch and 30.5 cms = 1 foot) ______ feet ______ inches Q12 In general, would you say your health is............ □ Excellent □ Very good □ Good □ Fair □ Poor 214 Q 13 Please indicate below if you have had any of the following: □ An operation to remove your uterus (hysterectomy) □ An operation to remove your uterus and ovaries □ Treatment for breast cancer □ Treatment for another type of cancer. Please state what type of cancer this was_________________________________________________________________ □ Any other long term (chronic) problem for which you see a doctor regularly □ None of these Q14 Which of the following best describes you? □ I have never smoked □ I have given up smoking □ I smoke occasionally □ I smoke regularly Q15 Which of the following best describes you? □ I don't drink alcohol □ I drink alcohol less than once a month □ I drink alcohol more than once a month but not weekly □ I drink alcohol 1-2 days a week □ I drink alcohol 3-5 days a week □ I drink alcohol 6-7 days a week 215 Q16 How often do you exercise? □ Never □ Less than Once a Month □ Once a Month □ 2-3 Times a Month □ Once a Week □ 2-3 Times a Week □ Daily Q17 Thinking about the last 12 months, how often have you been to see A MEDICAL DOCTOR (general practitioner or hospital doctor) about yourself? □ Not at all □ 1- 2 times □ 3-4 times □ 5-6 times □ More than 6 times Q18 Thinking about the last 12 months, how often have you been to see A NON-MEDICAL THERAPIST (such as a chiropractor, homeopath or acupuncturist) about yourself? □ Not at all □ 1- 2 times □ 3-4 times □ 5-6 times □ More than 6 times Q19 Thinking about the last 12 months, how often have you bought SUPPLEMENTS (such as vitamins, Omega 3 or Red Clover) for yourself? □ Not at all □ 1- 2 times □ 3-4 times □ 5-6 times □ More than 6 times 216 Q20 We would like to understand about your current health. Please answer all the questions yourself. There are no right or wrong answers. Simply choose the response that best describes how you feel at the time. Please indicate how you are feeling now, or how you have been feeling THE LAST FEW DAYS, by selecting the correct box in answer to the following questions: Yes, definitely Yes, sometimes No, not much No, not at all I wake early and then sleep badly for the rest of the night □ □ □ □ I get very frightened or panic feelings for apparently no reason at all □ □ □ □ I feel miserable and sad □ □ □ □ I feel anxious when I go out of the house on my own □ □ □ □ I have lost interest in things □ □ □ □ I get palpitations or a sensation of 'butterflies' in my stomach or chest □ □ □ □ I still enjoy the things I used to □ □ □ □ I feel life is not worth living □ □ □ □ I feel tense and 'wound up' □ □ □ □ I have a good appetite □ □ □ □ I have headaches □ □ □ □ □ □ □ □ □ □ □ □ □ □ □ □ □ □ □ □ □ □ □ □ I feel more tired than usual I have dizzy spells I suffer from backache or pain in my limbs I have hot flushes I am more clumsy than usual 217 Yes, definitely Yes, sometimes No, not much No, not at all I feel sick or nauseous □ □ □ □ I have feelings of well-being □ □ □ □ I suffer from night sweats □ □ □ □ I have difficulty getting to sleep □ □ □ □ I feel physically attractive □ □ □ □ I have difficulty concentrating □ □ □ □ My memory is poor □ □ □ □ 218 SECTION 3: QUESTIONS ABOUT MENSTRUAL STATUS AND EXPERIENCE OF MENOPAUSE Q21 If you are still having menstrual periods (naturally or with Hormone Replacement Therapy) please indicate how you felt when you had your last menstrual period □ My breasts feel tender or uncomfortable □ I have abdominal cramps or discomfort □ My stomach feels bloated □ I have heavy periods □ None of these □ I am not currently menstruating Q22 During your periods did you usually experience any of the following (please answer this question, even if you are not currently menstruating): □ Mild pain □ Severe pain □ Headaches □ Bloating □ Emotional changes □ Nausea □ Tender or uncomfortable breasts □ No symptoms at all 219 Q23 Please tick the statement that best describes your current situation.......... □ I currently have regular menstrual cycles □ I am currently experiencing noticeable changes in the length, duration or amount of flow in my menstrual cycle □ I have not had a menstrual cycle in the last 12 months (not because of birth control pills) GO TO Q 24 □ I have had surgery where my uterus (womb) and/or ovaries have been removed □ I have not had a menstrual cycle in the last 12 months because of birth control pills Q24 How long is it since you last menstruated regularly? □ I have not menstruated for 12 months □ I have not menstruated for 13 – 24 months □ I have not menstruated for 2 – 3 years □ I have not menstruated for 3 - 4 years □ I have not menstruated for more than 4 years Q25 Have you taken Hormone replacement Therapy? □ Never used □ Used but not currently doing so. For how long did you take Hormone Replacement Therapy? ____________________ □ Currently using hormone replacement therapy. For how long have you been taking Hormone Replacement Therapy? ____________________ 220 Q26 These questions concern your beliefs about the menopause transition. There are no right or wrong answers. Please answer these questions even if you have not yet started menopause and indicate to what extent you personally believe or disbelieve the statements below. Strongly disbelieve Disbelieve Slightly disbelieve Neither believe nor disbelieve Slightly believe Believe Strongly believe Doctors are the experts when it comes to offering good advice on the menopause □ □ □ □ □ □ □ Women should expect to be ill at menopause because of a drop in estrogen □ □ □ □ □ □ □ Hormone replacement therapy is good for delaying the signs of aging □ □ □ □ □ □ □ There is nothing unusual about menopause; it is just another stage of life □ □ □ □ □ □ □ Menopause is a mysterious thing which most women don’t understand □ □ □ □ □ □ □ If women feel ill during menopause it is up to them to manage their own health □ □ □ □ □ □ □ At menopause most women will feel physically and emotionally unwell □ □ □ □ □ □ □ When women reach menopause it is the beginning of getting old □ □ □ □ □ □ □ Life is more interesting for women after the menopause □ □ □ □ □ □ □ Women change a lot because of the menopause transition □ □ □ □ □ □ □ 221 Strongly disbelieve Disbelieve Slightly disbelieve Neither believe nor disbelieve Slightly believe Believe Strongly believe It is changes to women’s hormones that causes all the problems at menopause and there is nothing that they can do about it □ □ □ □ □ □ □ Hormone Replacement Therapy is good for making sure that women do not get osteoporosis after the menopause □ □ □ □ □ □ □ There are lots of natural remedies that women can use to help them get through the menopause □ □ □ □ □ □ □ The menopause is natural and doctors should not be giving women drugs for it □ □ □ □ □ □ □ Women should consider changing their diet and do more exercise when they reach the menopause □ □ □ □ □ □ □ After the menopause women become invisible in our society □ □ □ □ □ □ □ Male partners of menopausal women regard them as less sexually desirable □ □ □ □ □ □ □ Every woman experiences the menopause in a different way and there is no one expert to go to □ □ □ □ □ □ □ At menopause there are so many things going on in a woman’s life that she just doesn’t have time to worry about these □ □ □ □ □ □ □ 222 Strongly disbelieve Disbelieve Slightly disbelieve Neither believe nor disbelieve Slightly believe Believe Strongly believe A woman has more confidence in herself after menopause □ □ □ □ □ □ □ Women don't know what to believe because there are too many different and conflicting views about the menopause □ □ □ □ □ □ □ Hormone Replacement Therapy is too dangerous for women to take for menopausal symptoms □ □ □ □ □ □ □ The menopause is a big change in women's lives □ □ □ □ □ □ □ Sexual interest and comfort increase following the menopause because women don't have to worry about pregnancy or contraception □ □ □ □ □ □ □ Older women are not valued in our society □ □ □ □ □ □ □ After the menopause women have more time to do the things they always wanted to do □ □ □ □ □ □ □ Women make too much of a fuss about the menopause; it is nothing out of the ordinary □ □ □ □ □ □ □ The media is so obsessed with youth that it makes it very difficult for older women to get noticed □ □ □ □ □ □ □ things 223 Strongly disbelieve Disbelieve Slightly disbelieve Neither believe nor disbelieve Slightly believe Believe Strongly believe A woman who experiences distressing menopausal symptoms should be on Hormone Replacement Therapy □ □ □ □ □ □ □ Even doctors don't know everything about menopause so women should do whatever they think is right □ □ □ □ □ □ □ Older women are respected and valued for their knowledge and experience □ □ □ □ □ □ □ Hormone Replacement Therapy is good for women who want to maintain a healthy sex life □ □ □ □ □ □ □ 224 Q27 Which, if any, of the following apply to you at this time? Please mark the appropriate box for each symptom that you have experienced. For symptoms that do not apply please mark 'none'. In addition, please indicate if you think that these were related to the menopause Experience of symptoms None Mild Moderate Severe (0) (1) (2) (3) Very severe Related to menopause Yes No (4) Sleep problems (difficulty falling asleep, difficulty in sleeping through, waking up early) □ □ □ □ □ □ □ Irritability (feeling nervous, inner tension, feeling aggressive) □ □ □ □ □ □ □ Heart Discomfort (unusual awareness of heartbeat, heart skipping, heart racing, tightness) □ □ □ □ □ □ □ Physical and mental exhaustion (general decrease in performance, impaired memory, decrease in concentration, forgetfulness) □ □ □ □ □ □ □ Dryness of vagina (sensation of dryness or burning in the vagina, difficulty in sexual intercourse) □ □ □ □ □ □ □ Hot flushes, sweating (episodes of sweating) □ □ □ □ □ □ □ Anxiety (inner restlessness, feeling panicky) □ □ □ □ □ □ □ Sexual problems (change in sexual desire, in sexual activity and satisfaction) □ □ □ □ □ □ □ Bladder problems (difficulty in urinating, increased need to urinate, bladder incontinence) □ □ □ □ □ □ □ Depressive mood (feeling down, sad, on the verge of tears, lack of drive, mood swings) □ □ □ □ □ □ □ Joint and muscular discomfort (pain in joints, rheumatoid complaints) □ □ □ □ □ □ □ 225 Q28 Thinking about the items that you may have marked in the previous question, have you ever been to get treatment from any of the following sources? You can mark more than one source. If you marked 'none' to all of the items listed in Q29 you do not need to answer this question Medical doctor e.g. GP or hospital Therapist e.g. homeopath, acupuncturist, meditation teacher Taken vitamins or supplements Taken herbal or other natural products Changed your diet in any way None of these Sleep problems (difficulty falling asleep, difficulty in sleeping through, waking up early) □ □ □ □ □ □ Irritability (feeling nervous, inner tension, feeling aggressive) □ □ □ □ □ □ Heart Discomfort (unusual awareness of heartbeat, heart skipping, heart racing, tightness) □ □ □ □ □ □ Physical and mental exhaustion (general decrease in performance, impaired memory, decrease in concentration, forgetfulness) □ □ □ □ □ □ Dryness of vagina (sensation of dryness or burning in the vagina, difficulty in sexual intercourse) □ □ □ □ □ □ Hot flushes, sweating (episodes of sweating) □ □ □ □ □ □ Anxiety (inner restlessness, feeling panicky) □ □ □ □ □ □ Sexual problems (change in sexual desire, in sexual activity and satisfaction) □ □ □ □ □ □ Bladder problems (difficulty in urinating, increased need to urinate, bladder incontinence) □ □ □ □ □ □ Depressive mood (feeling down, sad, on the verge of tears, lack of drive, mood swings) □ □ □ □ □ □ Joint and muscular discomfort (pain in joints, rheumatoid complaints) □ □ □ □ □ □ 226 SECTION 4: THIS LAST SECTION CONCERNS YOUR ATTITUDES AND OUTLOOK ON LIFE Q29 Thinking about yourself, how satisfied are you with your life as a whole these days □ Very satisfied □ Satisfied □ Neither satisfied nor dissatisfied □ Dissatisfied □ Very dissatisfied Q30 Please think about the people in your life right now. How many people are there in your life that you feel very close to, such as close family, and friends (they can be social friends or at work)? People you feel close to might include those you discuss important matters with, regularly keep in touch with or are there for you when you need help. Please estimate how many people there are that fit this description and tick the box below □ No one □ 1 person □ 2 people □ 3 people □ 4 people □ 5 people □ 6 people □ 7 people □ 8 people □ 9 people □ 10 people □ 11-15 people □ 16 people or more 227 Q31 Below is a list of some things that other people do for us that may be helpful or supportive. Please read each statement carefully and place a mark in the column that is closest to your situation. Give only one answer per row As much as I would like Almost as much as I would like Some, but would like more Less than I would like Much less than I would like I have people who care about what happens to me □ □ □ □ □ I get love and affection □ □ □ □ □ I get chances to talk to someone I trust about my problems at work or with help around the house □ □ □ □ □ I get chances to talk to someone I trust about my personal or family problems □ □ □ □ □ I get invitations to go out with other people □ □ □ □ □ I get useful advice about important things in life □ □ □ □ □ I get help when I am sick in bed □ □ □ □ □ 228 Q32 Here are a number of personality traits that may or may not apply to you. Please mark the extent to which you agree or disagree with each statement. You should rate the extent to which each pair of traits applies to you, even if one characteristic applies more strongly than the other Strongly Disagree Disagree Somewhat Neither Disagree Agree nor Disagree Somewhat Agree Agree Strongly Agree Extraverted, enthusiastic □ □ □ □ □ □ □ Critical, quarrelsome □ □ □ □ □ □ □ Dependable, selfdisciplined □ □ □ □ □ □ □ Anxious, easily upset □ □ □ □ □ □ □ Open to new experiences, complex □ □ □ □ □ □ □ Reserved, quiet □ □ □ □ □ □ □ Sympathetic, warm □ □ □ □ □ □ □ Disorganised, careless □ □ □ □ □ □ □ Calm, emotionally stable □ □ □ □ □ □ □ Conventional, uncreative □ □ □ □ □ □ □ 229 Q33 Please indicate how true the following statements are for you. For example if you believe 'I'm not afraid of my feelings ' is almost always true please put a mark in the appropriate box below Never true Nearly always untrue Sometimes untrue Neither true nor untrue Sometimes true Nearly always true Always true I am able to take action on a problem even if I am uncertain what is the right thing to do □ □ □ □ □ □ □ I often catch myself daydreaming about things I've done and what I would do differently next time □ □ □ □ □ □ □ When I feel depressed or anxious, I am unable to take care of my responsibilities □ □ □ □ □ □ □ I rarely worry about getting my anxieties, worries and feelings under control □ □ □ □ □ □ □ I'm not afraid of my feelings □ □ □ □ □ □ □ When I evaluate something negatively, I usually recognise that this is just a reaction, not an objective fact □ □ □ □ □ □ □ When I compare myself to other people, it seems that most of them are handling their lives better than I do □ □ □ □ □ □ □ Anxiety is bad □ □ □ □ □ □ □ □ □ □ □ □ □ □ If I could magically remove all painful experiences I've had in my life, I would do so Q34 Thinking about yesterday. What was the most bothersome event or issue of the day? 230 Q35 Has this problem happened before? □ No, never □ Yes, occasionally □ Yes, often Q36 How much control did you have over its occurrence? □ Complete/quite a lot of control □ Some control □ No control Q37 On a scale from 1 to 100 (where 100 is the death of a friend or family member and 1 is a minor annoyance), how stressful would you rate this issue or event? 231 Q38 Below are descriptions of different ways of handling bothersome events or issues. Please indicate which, if any, you used to help you deal with the event or issue? You can select more than one description □ Diverted attention away from the problem by thinking about other things or engaging in some activity □ Tried to see the problem in a different light that made it seem more bearable □ Thought about solutions to the problem, gathered information about it, or actually did something to try to solve it □ Expressed emotions in response to the problem to reduce tension, anxiety or frustration □ Accepted that the problem had occurred, but that nothing could be done about it □ Sought or found emotional support from loved ones, friends or professionals □ Did something with the implicit intention of relaxing □ Sought or found spiritual comfort and support □ Used a different approach. Please state what this was _______________________________________________________________________________ _______________________________________________________________________________ _______________________________________________________________________________ __________________ Q39 Looking back at how you handled the event or issue, would you say this is typical of the way you approach bothersome issues in your life? □ Yes, typical →GO TO Q41 □ No, not typical → GO TO Q40 232 Q40 You said that this is not how you typically handle events or issues. Please indicate which of the descriptions best fits the way YOU typically handle bothersome events or issues □ Diverted attention away from the problem by thinking about other things or engaging in some activity □ Tried to see the problem in a different light that made it seem more bearable □ Thought about solutions to the problem, gathered information about it, or actually did something to try to solve it □ Expressed emotions in response to the problem to reduce tension, anxiety or frustration □ Accepted that the problem had occurred, but that nothing could be done about it □ Sought or found emotional support from loved ones, friends or professionals □ Did something with the implicit intention of relaxing □ Sought or found spiritual comfort and support □ Use a different approach. Please state what this is _______________________________________________________________________________ _______________________________________________________________________________ _______________________________________________________________________________ Q41 Finally, is there anything else that you would like to tell us about your experiences of menopause that may not have been covered in the questionnaire THANK YOU FOR PARTICIPATING IN THIS SURVEY. YOUR RESPONSES ARE VERY IMPORTANT TO US.SOME PEOPLE WILL BE ASKED TO HELP US WITH A FOLLOW UP SURVEY WHICH WILL REQUIRE COMPLETING A RECORD FOR 7 DAYS AND 24-HOUR DETAILED DIARY, FOLLOWED BY AN INTERVIEW. IF YOU WOULD BE INTERESTED IN TAKING PART, PLEASE LEAVE A NAME AND CONTACT NUMBER, ADDRESS OR EMAIL BELOW □ Yes, I would be interested in taking part □ No, I do not want to take part in a follow up survey 233 Thank you for participating in this survey. Your responses are very important to us. Some people will be asked to help us with a follow up survey which will require completing a record for 7 days and 24hour detailed diary, followed by an interview. If you would be interested in taking part, please leave your contact details below Name ________________________________________________________________________________ Telephone number ________________________________________________________________________________ Address ________________________________________________________________________________ City _________________________________________________________________________________ Post code_____________________________________________________________________________ Email address _________________________________________________________________________________ If you are NOT interested in taking part in the next stage, but wish to be entered into the prize draw, please leave your contact details below. Name ________________________________________________________________________________ Telephone number ________________________________________________________________________________ Address ________________________________________________________________________________ City _________________________________________________________________________________ Post code_____________________________________________________________________________ Email address _________________________________________________________________________________ 234 Appendix 4: Information sheets, consent forms and instructions for studies 2 & 3 Dept. of Psychology Social & Developmental Psychology Free School Lane Cambridge CB2 3RQ DATE Name Address STUDY OF WELLBEING IN MIDLIFE Dear Name I am writing to you because you completed a survey for the wellbeing in midlife study and expressed interest in participating in the next stage. The next stage of this study is in 2 parts:Part 1 is a 7-day calendar for you to record your experiences, including those relating to symptoms associated with the menopause Part 2 is a 24-hour detailed diary that you will keep for 1-day only, which will be followed as soon as possible by a personal interview that lasts about one hour The calendar and diary can be kept at a time that suits you and the interview will be arranged at a time and place that is most convenient for you. The interview will allow you to explain your views in more detail and will take place as soon as possible after you have completed the detailed 24-hour diary. With your permission, the interview will be audio-taped in order to ensure that your views are accurately recorded. The recordings will be deleted once the study has ended. The data will be identified only by a code, and will not be used or made available for any purposes other than the research project. I cannot promise that the study will help you personally but, the information that we get from the study will help improve how we treat women who experience problematic menopausal symptoms You are under no obligation to go on to the next stage but I want to reiterate that your views are very important and that your help is greatly valued. I also wish to reassure you that if you are unable to continue to the next stages, you are still eligible for the prize draw. I will contact you in the next few days to see if you are prepared to go onto the next stage or you can contact me by phone or email on the numbers below Yours Sincerely Helena Rubinstein (Chief Investigator) 07788422682|[email protected] 235 Dept. of Psychology Social & Developmental Psychology Free School Lane Cambridge CB2 3RQ Date Name Address STUDY OF WELLBEING IN MIDLIFE Dear Name, Many thanks for agreeing to participate in the next stage of this study. I enclose the information pack which explains what you will be required to do. It should be self-explanatory but do not hesitate to contact me if there are any problems. The pack contains 1. An information sheet which gives more details of the research and explains what to do if you wish to withdraw from this study 2. A consent form for you to initial which confirms that you have agreed to participate 3. Part 1: 7-day calendar with instructions 4. Part 2: 24-hour detailed diary with instructions 5. A stamped-addressed envelope to return the questionnaire, calendar and diary when they are completed As previously discussed, I am keen to talk with you in more detail about your experiences as soon as possible after you have completed the 24-hour diary. This will take the form of an interview which will last up to one hour at most and will be recorded with your permission. Please email or text me when you have finished the diary and we can arrange a date and time that suits you. I look forward to speaking with you soon Best regards Helena Rubinstein M:07788422682|[email protected] 236 INFORMATION SHEET FOR STUDY OF WELL-BEING IN MID-LIFE This study is being undertaken for research and educational purposes as part of PhD research in Psychology. I would like you to take part in this research study but before you decide whether you wish to participate in the next stage of this study, I would like you to understand why the research is being done and what it would involve for you. Please take a few minutes to go through this information sheet. I will be happy to answer any questions that you may have. Part 1 tells you the purpose of the study and what will happen if you take part. Part 2 gives you more detailed information about the conduct of the study PART 1: PURPOSE OF THE STUDY AND WHAT WILL HAPPEN Purpose of the research The purpose of the research is to find out why some women who are going through the menopause seek treatment whilst others do not. As women are 50% of the population, knowing how the menopause transition affects their lives is of fundamental importance. There has been relatively little research about how women experience the menopause and this research will allow us to go into detail about symptoms that women may experience, how women feel about this, and to discuss what women do to cope with these changes. Why have I been invited? You have been chosen to take part in this stage because you completed a questionnaire on your health and experience of menopause and you indicated that you would be prepared to participate in the next stages of research Do I have to take part? It is up to you to decide to join the study. This information sheet describes the study and if you agree to take part, I will ask you to sign a consent form. You are free to withdraw at any time, without giving a reason. What will happen if I take part? The next stage of this study is in 2 parts Part 1 is a 7-day calendar for you to record your experiences, including those relating to symptoms associated with the menopause and Part 2 is a 24-hour detailed diary that you will keep for 1-day only, which will be followed as soon as possible by a personal interview that lasts about one hour The calendar and diary can be kept at a time that will best suit you and the interview will be arranged at a time and place that is most convenient for you. The interview will allow you to explain your views in more detail and will take place as soon as possible after you have completed the detailed 24-hour diary. With your permission, the interview will be audio-taped in order to ensure that your views are accurately recorded. The recordings will be 237 deleted once the study has ended. The data will be identified only by a code, and will not be used or made available for any purposes other than the research project. Expenses and payments In appreciation of your participation, you will be entered into a prize draw to win £50 of shopping vouchers What are the possible benefits of taking part? I cannot promise that the study will help you personally but, the information that we get from the study will help improve how we treat women who experience problematic menopausal symptoms What happens after the research has finished? Results will be written up as a PhD thesis, and in academic papers for journal and conferences. A summary of the results will be made available on the study website and, if you decide to participate in the next stage of the research, you will receive a short report of the findings. What if there is a problem? Any complaint about the way you have been dealt with during the study or any possible harm you might suffer will be addressed. The detailed information on this is given in Part 2. Any complaint about the way you have been dealt with during the study will be addressed. Will my taking part in the study be kept confidential? Yes. We follow ethical and legal practice and all information about you will be handled in confidence. The details are included in part 2. It should be noted, however, that if anything of a criminal nature is disclosed, the researcher is required to report it If the information in Part 1 has interested you and you are considering participation, please read the additional information in Part 2 before making a decision PART 2: ADDITIONAL INFORMATION What will happen if I do not want to carry on with the study? You may withdraw at any stage without explanation and if you withdraw from the study we will destroy all identifiable information. What if there is a problem? If you have a concern about this study, please contact Helena Rubinstein at [email protected] or by phone on 07788 422682. If you remain unhappy and wish to complain formally, you can do this by contacting Professor Susan Golombok at The Centre for Family Studies on 01223 334510 or at [email protected] Will my taking part in this study be kept confidential? Yes, all information is strictly confidential and no details about you will be seen by anyone other than the researchers who are involved in the project. All responses will be anonymous and your name will not be associated with any comments made during the course of the research. All data will be identified by a code, with names kept in a locked file. If anything of a criminal nature is disclosed, the researcher is required to report it 238 What will happen to the results of the research study? The data will be used as part of a PhD thesis and for academic papers. The results are normally presented in terms of groups of individuals and you cannot be identified. If any individual data were presented, the data would be totally anonymous, without any means of identifying the individuals involved. Who has reviewed the study? All research in the NHS is looked at by an independent group of people called a Research Ethics Committee. This study has been reviewed and given a favourable opinion by the NRES Committee East of England- Cambridge Central Further information and contact details If you have any specific questions about the research please contact me By email at: [email protected] By phone on 07788422 682 Go the website at http://www.sdp.cam.ac.uk/wellbeingsurvey If you are concerned about any health or related issues raised by this survey you should consider contacting your GP or using the NHS Choices website which has relevant information. This can be accessed at http://www.nhs.uk/conditions/menopause/Pages/Introduction.aspx Helena Rubinstein Chief Investigator 239 CONSENT FORM Title of Project: Study of well-being in mid-life Researcher: Helena Rubinstein Please initial the boxes below: 1. I confirm that I have read and understood the information sheet for the above study. I have had the opportunity to consider the information, ask questions and have had these answered satisfactorily 2. I understand that my participation is voluntary and I am free to withdraw at any time without giving any reason, without my medical care or legal rights being affected 3. I agree to take part in part 2 of the study: 7-day calendar 4. I agree to take part in part 3 of the study; 24-hour diary 5. I agree to be interviewed after the 24 hour diary has been completed 6. I agree to the interview being audio-recorded Name __________________ Date_________________________Signature_________________ Name of person taking consent_________________ Date_________________________Signature_________________ 240 How to fill in the Daily Menopause Experiences Calendar The attached sheet is a calendar for a 7 day period. Please read it carefully before starting. You will see a list of items which are the same as the ones in the survey and columns for each of 7 days. You are asked to record whether you have experienced any of these and to code whether your experience of them is mild to very severe. 0 = none 1 = mild, 2 = moderate, 3 = severe and 4 = very severe For example: - if you do not experience sleep problems then you would write 0 in the box if you have night sweats and you think that they are of moderate severity then you would write 2 in the box For hot flushes and night sweats only you are also asked to record how many you had that day. You may want to note down each time the event occurs during the day to help you to remember. It is best to try and find the same time each day to record your experiences. It is also very important to complete the form every day because it is much more difficult to remember what happened if you leave it until the next day. Please refer to these examples of hot flushes or night sweats that have been given by others in previous studies when describing severity. One or more of these descriptions may help to categorise your hot flushes/night sweats as mild, moderate, severe or very severe. Mild Duration: last less than 3 minutes Physical symptoms: warmth, felt uncomfortable, red face Emotional symptoms: not expected Action needed: usually none Moderate Duration: may last up to 5 minutes Physical symptoms: head, neck, ears or whole body feel warm; tense, tight muscles; clammy (wet skin, a change in heart rate or rhythm (heart speeds up of changes beat); some sweating, dry mouth Emotional symptoms : felt irritated, felt agitated (restless), felt as though energy was drained out, felt embarrassed when having a hot flush in front of others, felt tired, felt annoyed Action needed: needed to use a fan, awakened sometimes in the night, needed to uncover, took off layers of clothing, drank water, opened the windows even when cold outside, wore lighter clothing Severe Duration: last up to 10 minutes Physical symptoms: Warmth, sometimes described as a raging furnace or burning up, a change in heart rate or rhythm (heart speeds up or changes beat), felt faint, headache, severe sweating, weakness, a pricking, stinging sensation over the skin; chest heaviness 241 Emotional symptoms: embarrassment, anxiety, feelings of having a panic attack Action needed: needed to stop what was being done at the time, usually awakened at night and removed covers, needed to remove clothes, opened window, kept house at cooler temperature Very severe Duration: last more than 10 minutes Physical symptoms: Boiling heat, rolling sweat, difficulty breathing, felt faint, felt dizzy, feel and/or legs cramping, a change in heart rate or rhythm (heart speeds up or changes beat), felt slightly sick to stomach Emotional symptoms: felt distressed, had the urge to escape, had difficulty functioning Action needed: awakened frequently at night, needed to change sheets and night clothes, needed to take a cold shower, needed to hold ice on skin At the end of the week please look back at your records and answer the questions on the next page: 242 Please rank in order the symptoms that you have recorded that are most problematic. For example if hot flushes are the most problematic write 1, and irritability is the next most problematic write 2 and so on Sleep problems............................................................................................... Irritability........................................................................................................ Heart discomfort............................................................................................. Physical and mental exhaustion..................................................................... Dryness of vagina........................................................................................... Hot flushes ………………………………………………………………………………………………… Night sweats………………………………………………………………………………………………. Sexual problems............................................................................................. Bladder problems.......................................................................................... Depressive mood............................................................................................ Joint & muscular discomfort……………………………………………………………………….. 1. For the symptom that you have rated 1 only. Has the symptom that you have rated as 1 (the most problematic) affected your life in any of the following ways? You can check more than one box Has affected my family life..................................................................................... Has impacted on my work………………………………………………………………………………… Has affected my relationship with my partner………………………………………………….. Has impacted on my friendships……………………………………………………………………….. Makes it hard for me to cope personally…………………………………………………………… Has had no or little impact on my life………………………………………………………………… 2. Please explain in what way, this symptom has impacted on your life. If you checked no impact at all, you do not need to complete this question 243 3. Now looking at TODAY’s record only. What was the most bothersome event or issue of the day that related to your experience of menopause? 4. Below are descriptions of different ways of handling bothersome events or issues. Please indicate which, if any, you used to help you deal with this particular event or issue? You can select more than one description □ Diverted attention away from the problem by thinking about other things or engaging in some activity □ Tried to see the problem in a different light that made it seem more bearable □ Thought about solutions to the problem, gathered information about it, or actually did something to try to solve it □ Expressed emotions in response to the problem to reduce tension, anxiety or frustration □ Accepted that the problem had occurred, but that nothing could be done about it □ Sought or found emotional support from loved ones, friends or professionals □ Did something with the implicit attention of relaxing □ Sought or found spiritual comfort and support □ Used a different approach. Please state what this was _______________________________________________________________________________ _______________________________________________________________________________ _______________________________________________________________________________ __________________________________________________________________ 5. Looking back at how you handled menopausal events during the week would you say this is typical of the way you approach these issues in your life? □ Yes, typical □ No, not typical →GO TO Q7 244 6. If you said that this is not how you typically handle events or issues. Please indicate which of the descriptions best fits the way YOU typically handle bothersome events or issues □ Diverted attention away from the problem by thinking about other things or engaging in some activity □ Tried to see the problem in a different light that made it seem more bearable □ Thought about solutions to the problem, gathered information about it, or actually did something to try to solve it □ Expressed emotions in response to the problem to reduce tension, anxiety or frustration □ Accepted that the problem had occurred, but that nothing could be done about it □ Sought or found emotional support from loved ones, friends or professionals □ Did something with the implicit attention of relaxing □ Sought or found spiritual comfort and support □ Use a different approach. Please state what this is _______________________________________________________________________________ _______________________________________________________________________________ _______________________________________________________________________________ __________________________________________________________________ THANK YOU FOR YOUR TIME. NOW YOU CAN COMPLETE THE FINAL STAGE; THE 24-HOUR DIARY 245 246 Instructions for using the 24-hour diary Please read these instructions carefully. This is a detailed 24-hour diary which I would like you to keep for 1 day only. The diary is on 4 pages: Page I is for the morning, Page 2 is for the afternoon, Page 3 is for the evening, Page 4 is for the night time It is also divided into two halves: the blue half is for you to record your normal daily activities and the pink half is for you to record any menopause- related episodes It is divided into hourly segments. It may be difficult for you to record something every hour of the day but it is important to try to record anything as soon as possible after an event has occurred so that you do not forget. Try and keep the diary with you if possible and if you cannot record the event when it is happening, set some time aside at regular times of the day to fill it in. The aim is for you to record what you were doing during the day and when you experienced an event that you believe could be related to the menopause transition. An example of one sheet that has already been completed is attached so that you can see what this could look like. There is one page for each part of the day – Morning (from 6.00 a.m. until noon), Afternoon (from noon to 6:00 pm), Evening (from 6:00 pm until midnight) and Night time (from midnight until waking up). There is room to list several menopause-related episodes for each part of the day, although you may not need that many, depending on your day. It is not necessary to fill up all of the spaces – use the breakdown of your day that makes the most sense to you and best captures what you did and how you felt. Try to remember each episode in detail, and write a few words that will remind you of exactly what was going on. The columns are there to help you to fill in as much detail as possible Filling in the columns Blue columns are to record what you were doing at different points in the day What doing at the time: Think of your day as a continuous series of scenes or episodes in a film. In this column give each period a brief name that will help you remember it (for example, “preparing breakfast”, “commuting to work”, “at lunch with B”, where B is a person or a group of people). Food, drink, tobacco: This is to record when you were eating, drinking or smoking at a particular time of the day. You do not need to give a detailed account of what you had but might record, “light lunch” or “glass of wine” or “cigarette break” Pink columns are to record any menopause-related episodes and how you felt about them Menopause-related episodes: A menopause-related episode could be a hot flush, a sweat or feeling unusually irritable or upset. It is up to you to decide which episodes you believe are menopause247 related. If there were no menopause-related episodes in any time period leave this and the rest of the row blank How long it lasted: please note down how long the menopause-related event lasted. For example you might record “1 minute” or “20 minutes” or whatever is appropriate. If there was no menopause-related episode this will be left blank. Who with: this is to record who you were with when the menopause-related event occurred. For example you might record “on my own”, “with my partner” or “with friends” or “with the boss”. If there was no menopause-related episode this will be left blank. Mood: this column is for you to record how you felt during the menopause-related episode. You can choose any description that you think is appropriate. For example, you might write down “impatient for it to end”, “angry”, “frustrated”, “ depressed” “anxious” “embarrassed” or “tired”. If there was no menopause-related episode this will be left blank. How much of a problem: this is to record whether or not the menopause-related event was bothersome to you on a scale of 1 to 10. 1 = it did not bother you at all and 10 = it bothered you a lot. If there was no menopause-related episode this will be left blank. What done to minimise the experience: this is to record what steps you to took to reduce the menopause-related episode. For example, you might record “nothing” or “took off sweater” or had to go outside”. If there was no menopause-related episode this will be left blank. The purpose of this detailed record is to help you recall what happened to you during that day and will act as a memory prompt for discussion later After you have completed it, I will contact you for a longer discussion. 248 EXAMPLE 24 HOUR DETAILED DIARY 249 Appendix 5: Topic guide for interviews Short exercise before reviewing the diary. Please write a about what the menopause means to you. This is not a test and you can write as much or as little as you like. A. Reviewing the diary Now please look at the diary you kept yesterday. What time did you get up yesterday? What time did you go to bed? In general how would you say your overall mood was yesterday? How much of the time were you in a bad, low, irritable, pleasant or very good mood? How typical was yesterday for that day of the week? Compared to that day of the week is usual like was it much worse, somewhat worse, pretty typical, somewhat better or much better? Looking at your 24 hour diary how many menopause-related episodes did you record yesterday? What were they? Let’s go through each one (do the same for each major episode; if there are lots of them ask the participant to focus only on one or two typical ones and then only on those that particularly stand out) Basic description of the episode What was the first one that you recorded? Tell me about what happened. What time was it and what were you doing at the time? Who were you with? Language used to describe how felt/salience/reasons for salience What words did you use to describe how you felt during the episode? Why did you choose those words? Was there something about this particular episode that made it stand out or was it fairly typical? If it stood out, what was it about this particular episode that Explaining the rating What score did you give to this episode (1 -10). You say that you rated this episode X. What was it about it that caused you to rate as X. If it was very high ask if there was something specific about the situation that caused this. After asking about several episodes ask if all were rated in the same way or did some rate particularly high or particularly low and focus on these. Antecedents to episodes Do you think that there was anything about this episode that might have caused it to happen? Do you ever feel that you can guess when a menopause-related episode is going to happen? Or is always a surprise? 250 Coping mechanisms What if anything did you do to minimise the experience? Is this what you normally do? Did it help? What prevents you from doing something to minimise the experience? B. Putting your experiences into context Now I want to talk about what you have been experiencing in a broader context. For how long have you been experiencing these types of episodes? Have they always been like this or have they got worse or better (over the past month/6 months)? Treatment seeking/coping mechanisms Have you gone to anyone/any place for information about this? If yes, why? If not, why not? Have you gone to anyone/any place for treatments? Probes include the internet GP, friends, mother, complementary or alternative therapist, health food store If yes, why? For those who answered ‘yes’ to the above: - What did you discover from them? - At what point did you decide that you needed to get advice or help? - When you got advice, was it useful? Did you follow it? - Did the recommendations work for you? And if yes, in what way? - What, if any, concerns did you have about following the advice given? - If you chose not to follow the advice/recommendations, why was this? What difficulties (if any) did you have following advice/ recommendations? For those who answered ‘no’ to the above? - What were your reasons for not seeking help/information about this? Probes: symptoms were not bothering me, able to cope on own, beliefs about efficacy of doctors, therapists and treatments - Did you come up with your own ideas/routine that have been helpful to you? Or did you decide to ignore symptoms or assume they would eventually diminish? Construction of menopause This is the final part of our discussion. I want to focus more broadly on how you feel about going through the menopause transition. Show the participant the developed from the general survey (they will have answered these earlier so check what the responses were). Ask participant to read them (or read them out if necessary) 251 What is it about that description that you agree with? Do you believe it is true for you only or also true for other women you know? Are there any elements that you disagree with? If yes, what are these and why do you disagree with them? Then look at the statements which have been rejected. What is it about these statements that you disagree with? Are there any elements that you agree with? If yes, what are these and why do you agree with them? 252 Appendix 6: Items, Scales and Factors Used In the Dataset 1. Sociodemographic variables How item recorded Data structure Central tendency/comments on distribution Coding and data consolidation Birthdate to calculate age in years to 1st Sept 2012 Continuous Normal distribution Range 40–60 years White, Mixed race, Black/Black British, Asian/Asian British 4 categories Majority Caucasian, 94% white Not large enough sample to distinguish ethnic differences Household income in £10,000 bands from 0 to £60,000 6 categories 20% had income of less than £20,000 and 0 – low HH income >£20,000 26% had household income of greater than £60,000. 1 – medium HH income 2 – high HH income < £40,000 Distribution skewed to higher end of the income scale Social class derived from answers to current job description and industry type 3 categories Lower, middle and upper social class 0 – lower 1 – middle 2 – higher Work status: Working (full), working (P/T), retired, unemployed and student 5 categories Marital status: Single, married, cohabiting, divorced or separated, widowed 5 categories Given birth to children: None, 1-2, 3-5 3 categories Home ownership: own outright, own with mortgage, rent from council, rent privately, rent from housing associations 5 categories 80% working, 0 – working 15% unemployed 1 – not working 65% married or cohabiting, 0 – living with partner 12% single (never married) 1 – not living with partner 33% have no children, 50% have 1-2 children 0 – not given birth to children and 15% have 3-5 children 1 – given birth to children 81% own, 19% rent 0 – own outright/ with mortgage 1 – rent 253 2. Lifestyle & health related variables How item recorded Data structure Central tendency/comments on distribution Coding and data consolidation Education level: None, GCSE’s, NVQ, Alevels, professional qualifications, first degree, postgraduate degree 7 categories 4% have no qualifications. 0 – no or basic qualification Relatively high number of women with degrees (42%) 1 – A-level or equivalent Normal distribution Used to calculate Body Mass Index. Weight in stones and lbs and height in feet and inches Continuous Prior illnesses – hysterectomy, oophorectomy, breast cancer, other cancer or chronic illness for which see a doctor regularly Dichotomous for each item 2 – Tertiary Range from 16.99 to 48.06 No prior illness 52% Each coded as follows Hysterectomy 8% 0 none Oopherectomy 11% 1 had (condition) Breast cancer 4% Other cancer 5% Chronic illness 26% Annual propensity of treatment utilisation: medical, 5 categories Skewed and required re-categorisation into meaningful groups Purchase of supplements and Medical utilisation recoded: 0 less than twice a year or never, therapy or 1 three to 6 times a year purchase of supplements: none, 1-2, 3-4, 5-6, > 6 times in the past 12 months 2 more than 6 times a year Therapy usage recoded: 0 Never use 1 Ever use 254 How item recorded Data structure Central tendency/comments on distribution Coding and data consolidation Self-rated general health 5 intervals Normal distribution From 0 (Excellent) to 5 (Poor) Use in Health Wellbeing Factor Life satisfaction 5 intervals 56% very satisfied or satisfied. Mean 2.48 From 0 (very satisfied) to Skewed to very satisfied /satisfied 5 (very dissatisfied) Used as part of composite health wellbeing factor Frequency of Drink: never, given up, occasional, regular 4 categories 58% never smoked Frequency of Smoking: don’t drink, 1 a month, once a month but not weekly, 1-2 days a week, 3-5 days a week, 6-7 days a week 6 categories 15% don’t drink Frequency of Exercise: not at all , less than once a month, 2-3 times a month, once a week, 2-3 times a week, daily 7 categories Women’s Health Questionnaire: 23 items scored from 0, yes definitely to no, not at all. Six subscales Continuous Anxiety, depression, mood (ADM) Wellbeing Somatic Memory Vasomotor Sleep 6 % drink 6-7 times a week Recoded into more meaningful categories and used to create one lifestyle factor 8% do no exercise 22% exercise daily Six subscales transformed into scores out of 100 As recommended by MAPI WHQ manual Memory and sleep scales normally distributed. Four items from the Wellbeing subscale used as part of overall health well composite score ADM: low scores mean does not enjoy life Wellbeing: low scores mean poor wellbeing Somatic: low scores mean high symptoms Memory: low scores mean poor memory 255 How item recorded Data structure Central tendency/comments on distribution Coding and data consolidation Vasomotor: Low scores mean have hot flushes and night sweats Sleep: low scores mean poor sleep 3. Menopause related variables Menstrual status: based on WHI definitions 5 categories Premenopausal 15% Perimenopausal 24% 50 premenopausal women to be excluded from main analysis on treatment propensity at menopause Postmenopausal 45% Surgical menopause 15% Data on previous menstrual experience Categorical Experience of previous menstrual bloating, nausea, etc. Not used in the main analysis as problems of recall bias. Indicates high levels of cooccurrence of symptoms MRS scale: Symptom severity for eleven symptoms Continuous Normal distribution for all except urogenital which is skewed Subscales used as markers of total symptom severity for modelling purposes Total: 0 to 44 Psychological subscale Somatic subscale Urogenital subscale MRS mean = 15.38 Psychological subscale mean = 6.11 Somatic subscale mean = 5.61 Urogenital subscale mean = 3.66 Psy: Continuous 0 to 16 Som: Continuous 0 to 16 Uro: Continuous 0 to 12 Attribution of symptoms to menopause the 11 items on the MRS scale Usage of HRT Dichotomous for each symptom Mean of scale = 4.5 0 not attributed 25% make no attribution (NB: this sample includes women who are premenopausal) 1 attributed Scale continuous 3 categories 57% not used 0 never 15% previously used 1 previously used 29% currently used 2 currently used 256 Items summed to give continuous scale of 0 to 11 How item recorded Data structure Length of time HRT ever used in months Continuous Central tendency/comments on distribution Coding and data consolidation Range is from 1 month to 22 years for general population sample. M 40 months (SD 55.16) And from 1 month to 25 years for the clinical sample M 56 months (SD 62.01) Social constructions of menopause 32 items on beliefs about menopause Continuous Belief Scales developed using PCA 22 items used to create 4 latent variables Each item rated from 0 (strongly disbelieve) to 7 (strongly believe) 4. Social and cognitive variables Coping approaches: Description of previous day’s bothersome event Open-ended Coping approaches: Prior experience of event/ level of control of event and rating of event Post-hoc coded Principal components analysis results in 4 robust factors: Treatment belief Illness belief Post recovery belief Aging/unvalued belief 9 categories emerged Rating of event from 0 (not bothersome at all) to 100 (very bothersome) Not possible to use (see Ch 5) Use of 8 approaches to cope with the event Dichotomous for each approach Multiple approaches possible Categorical analysis does not support emotional/ problem focused split Personality. Ten Item Personality Inventory Interval Scores from 0 (strongly agree) to 7 (strongly disagree) Big 5 traits created from mean of 2 items for each trait Cognitive flexibility (AAQ) Interval Scores from 1 (never true) to 7 (always true) AAQ scale created from summed scores for each item Scale is normally distributed Higher scores mean greater levels of cognitive inflexibility Social support: Duke UNC Functional Support Scale 7 items Interval Scores range from 1 (less than I would like) to 7 (as much as I would like) DFSQ scale very skewed (most people believe they have enough support) and would benefit 257 DFSQ scale created by mean of all items Sub-scales of affective and confidante support also created How item recorded Data structure Central tendency/comments on distribution Coding and data consolidation from either transforming or bootstrapping Number of confidantes: how many people do you feel close to 5. Dependent variable Treatment utilisation for menopause - Medical Therapy Supplements Herbal remedies Continuous Coded from 0 to 10, then 11-15, 16 or more Normal but is slightly kurtotic due to way coded Not used for composite social support scale (see Chapter 5) Total treatments possible excluding diet = 44 (11 biomedical and 33 non-biomedical) Used to create continuous general treatment propensity outcome measure Scales are not normally distributed. Composite non-biomedical treatment scale created using principal component analysis. This is skewed and kurtotic Residuals for biomedical scale are Gaussian Analyses with these scales was bootstrapped Notes: N = 344. Includes Premenopausal Women 258 Appendix 7: WBIM and MAPI Comparisons by Menopause Stage WHQ Europe N = 8248 WBMI scores Pre & peri = 108 Post = 123 Mean (SD) Median Mean (SD) (Median - Pre or peri 75.86 (21.26) 80.95 69.96 (21.37) 71.43 - Post 73.42 (22.10) 76.19 67.10 (71.43) 71.43 - Pre or peri 67.26 (21.92) 66.67 70.03 (21.91) 75.00 - Post 64.24 (23.51) 66.67 68.81 (20.52) 66.66 - Pre or peri 64.64 (22.74) 66.67 54.86 (21.91) 53.33 - Post 63.46 (22.57) 66.67 54.58 (23.56) 53.33 - Pre or peri 67.37 (25.91) 66.67 57.70(24.73) 58.33 - Post 64.66 (25.97) 66.67 52.54 (24.49) 58.33 - Pre or peri 70.14 (31.58) 66.67 65.52 (34.29) 66.66 - Post 62.66 (33.50) 66.67 46.25 (36.95) 33.33 - Pre or peri 62.91 (29.74) 66.67 55.18 (30.21) 50.00 - Post 57.74 (30.36 66.67 47.61 (30.30 50.00 Anxiety/depression Wellbeing Somatic symptoms Memory/concentration Vasomotor symptoms Sleep problems Notes: The pattern is the same for pre-/peri- and postmenopause in the WBIM and WHQ samples. Stage effect is similar in both samples but WBIM sample report higher scores on wellbeing and lower scores on anxiety, depression, somatic symptoms, vasomotor symptoms, memory, and sleep. This could be influenced by location as health indices are known to be better in the South of England 259 Appendix 8: Profile Data on the 30 participants of study 3 1 General pop. or clinic Gen pop Location Age, Marital & child status Work history Medical history Menopause status MRS score Cambs (f-t-f) Cambs (f-t-f) Notts (phone) Cambs (f-t-f) 60 years M, 2 children 48 years M, 3 children 50 M, 1 child 48 years Cohabits, 3 children 51 M, 3 children 46 Cohabits, no children 53 years Cohabits, no children 49 years Divorced 1 child 50 years M, no children Retired midwife Nurse Had breast cancer Anxiety Post 25 2 Gen pop Peri 19 3 Gen pop Trainer Scoliosis & spina bifida No Peri 31 4 Gen pop Peri 26 5 Gen pop Social worker No Peri 23 6 Gen pop Policy for English heritage Telecoms No Peri 18 7 Clinical London (f-t-f) No Peri 35 8 Gen pop Cambs (f-t-f) Research nurse No Receptionist Peri Started years ago Surgical Notts (phone) Cambs (f-t-f) Carer for mother 9 Gen pop Cambs (f-t-f) 10 Gen pop Cambs (f-t-f) 55 years Divorced, 2 children Teacher Had ovarian cancer Oopherectomy No 11 Gen pop Clinical 59 years M, 2 children 58 S, no children Retired teacher 12 Cambs (f-t-f) London (f-t-f) 13 Gen pop Cambs 52 years 18 2 23 Treatments score HRT usage 3 No HRT 5 No HRT 2 No HRT 10 No HRT Attribution score 5 AAQ (level of cognitive inflexibility) 38 3 34 2 23 5 29 7 No HRT 14 No HRT 10 19 2 26 10 (about to go on HRT) 8 (wants Mirena Coil) 4 (had used Mirena Coil 6 No HRT 10 43 3 41 7 31 1 38 7 26 11 54 10 39 Post 15 No Post 18 Retired civil servant Depression Sexual abuse Post 37 7 No HRT 15 (Had used Mirena Coil) Project Hysterectomy Surgical 27 12 260 General pop. or clinic Location Age, Marital & child status Work history (f-t-f) M, 1 child manager London (phone) London (phone) 51 years M, 2 children 58 years M, 2 children Cambs (f-t-f) London (phone) Notts (phone) Notts (phone) London (phone) 51 years M, 3 children 55 years M, 2 children 53 years M, 2 children 57 years W, 2 children 58 years Divorced, 2 children 45 years M, 3 children 54 years M, 2 children 14 Clinical 15 Clinical 16 Gen pop 17 Clinical 18 Gen pop 19 Gen pop 20 Clinical 21 Gen pop 22 Gen pop 23 Gen pop Notts (phone) 24 Gen pop 25 Clinical Notts (phone) Notts (phone) 26 Clinical Cambs (f-t-f) Cambs (f-t-f) London (phone) Medical history Menopause status MRS score Treatments score HRT usage No HRT Attribution score AAQ (level of cognitive inflexibility) P/T estate agent P/T Financial advisor Librarian No Post 25 9 31 High blood pressure, fibroids No Post 36 9 No HRT 6 Ex-HRT 11 48 Post 15 8 28 HR manager Hysterectomy Surgical 24 8 51 Probation officer Retired nurse No Post 19 9 29 No Post 20 11 33 Administrator Several miscarriages Hysterectomy Tubes tied No No Surgical 20 1 Ex- HRT 4 Ex-HRT 5 No HRT 5 No HRT 11 Ex-HRT 5 55 Peri 16 10 37 Post 21 6 No HRT 7 No HRT 11 37 Child minder Administrator 51 years Cohabits, 4 children 60 years Divorced,1 child 54 years Married, no children Co-ordinator, hospital study Hysterectomy Surgical 15 2 No HRT 6 48 Nurse No Post 16 8 31 Archivist Surgical 28 7 36 58 years M, 2 children Not working Ovary & fallopian tubes removed as family history of cancer No 5 Ex-HRT 11 No HRT Post 21 21 Ex-HRT 9 42 261 Location Age, Marital & child status Work history Medical history Menopause status MRS score 27 General pop. or clinic Gen pop Notts (phone) 42 years M, no children JP Post 28 28 Gen pop Notts (phone) 53 years M, no children Business Devt Manager Surgical 29 Clinical Gen pop 53 years M, 2 children 53 years S, no children Nurse 30 London (phone) Cairo (skype) Motor Neuron disease; in wheelchair Brain haemorrhage Ovarian tumour No Teacher No Notes: Gen pop = general population f-t-f = face to face. M = married S = Single MRS = Menopause Rating Scale 262 Treatments score HRT usage 11 No HRT Attribution score 6 AAQ (level of cognitive inflexibility) 26 26 4 No HRT 9 47 Post 15 5 36 Post 28 6 No HRT 26 No HRT 11 26 Appendix 9: Coding Frame for WBIM study 3 Examples of individual codes Families of codes Broad themes Meaning of theme - Aging not desirable Gaining confidence with age Older women are not valued Age of menopause is older than me Dealing with it - Aging Getting old Becoming invisible Acceptance or non-acceptance of changes Age Attribution is important Menopause is about hormones Feeling debilitated Menopause is a malfunction of the body - Attributions of symptoms to menopause How menopause makes women feel Meanings of menopause Social and cultural constructions - Sexual changes Changes to body Memory loss Loss of motivation Affects relationships - Impact e.g. daily life, sex life, work, life Emotional changes Physical changes Impact on life Impacts on life in small but myriad ways. The impact is physical and emotional and is not easy to ignore - Changing routines Diversion tactics Use natural remedies Comparison with others Menopause not taken seriously - Coping mechanisms Drugs vs. natural remedies Dealing with it Social support Humour Getting though it Description of the varied strategies used by women to manage change. Menopause is a symbol of aging. Reaching menopause is a sign that I am getting old. Women don’t have to accept these changes and can fight aging Multiple beliefs about menopause Uncertainty about what is reasonable to attribute to it. Menopause is a big change in women’s lives which is not always visible to other people These range from seeking medical advice to using natural remedies to using distraction techniques Small individual changes to routine that collectively can become onerous - GP dismissive GP suggests hormones Not expecting much help from GP HRT effective in reducing symptoms - GP responses Benefits and problems of using HRT 263 The medical encounter Compared with other conditions GP expertise is not well-trusted. The only treatment on offer is hormone therapy. Examples of individual codes Families of codes Broad themes Meaning of theme Experience of GP responses is variable and can be negative - - Symptoms in general Descriptions of hot flushes Causes of hot flushes How hot flushes make women feel Situational influences The symptom experience - Hot flushes are like being in a washing machine Sexual problems Symptoms exacerbate existing conditions Hot flushes are caused by stress Work situation makes symptoms worse Detailed descriptions about how symptoms make women feel, what causes them and how certain situations make it more difficult for women to cope with the disruption - What is normal? Every woman’s experience is different Don’t discuss menopause with others Pleased to have finished periods - Normality & difference Taboo and embarrassment Fertility & menstruation What is unspoken Being unsure of what to expect. Need to make comparisons with other women to try and work out a benchmark of normality. The menopause can be an embarrassing topic and lack of open discussion makes this worse. This lacuna can reinforce myths and half-truths - Conflicting views Feeling unprepared Need for education Lack of support - Information and support (or the lack of it) Knowledge or the lack of it What women know Women have very poor knowledge of menopause until they are in it. Feel that information is conflicting and there is little acknowledgement of this major change. There is a need for more support and better education 264 Doctors only have drugs on offer. Doctors tell women about hormones. So menopause is about hormones Doctors may not be able to offer anything so can lead to distress Doctors either don’t know enough or don’t give out clear enough messages Contradictory advice contributes to the idea that menopause is confusing Good doctors are trusted; good doctors are sympathetic. Consultants know more than GPs It would be good if there was general support. A more holistic rather than a medical only approach. GPs don’t have time for this May not expect much from the GP. GPs often described as dismissive. So women have to ‘just deal with it’ Appendix 10: Network view265 of the medical encounter Appendix 11: Hierarchical Regression Analysis for Sociodemographics and Health and Lifestyle Factors Sociodemographic factors The collinearity statistics indicate that there are no problems with respect to multi-collinearity; there is no VIF value greater than10 and the average variation inflation factor (VIF) is not substantially greater than 1 (Bowerman & O’Connell, 1990), and all the tolerance statistics (1/VIF) are above 0.2 (Menard 1995. This is the case for regression onto the overall, biomedical and non-biomedical treatment utilisation. Table A11.1: Control variables: Sociodemographic Variables Regressed onto Overall Treatment Utilisation Scale 95% confidence intervals B Intercept Sig. Lower Upper .726 .726 .310 -.700 2.235 -.014 .014 .291 -.041 .012 -.213 .151 .160 -.522 .083 Intermediate .592 .165 .002 .287 .926 Salaried .072 .141 .599 -.192 .341 0a 0a High -.155 .162 .340 -.481 .163 Medium -.001 .194 .997 -.369 .363 0a 0a High .008 .168 .956 -.349 .368 Medium .066 .169 .705 -.255 .401 0a 0a .108 .281 .703 -.419 .700 -.179 .125 .166 -.437 .078 0a 0a .034 .132 .785 -.242 .307 0a 0a Step 1 Age in years1 Step 2 Social class Working class Not in paid employment Step 3 SE Income3 Low Education2 Low Step 4 Marital status Married/cohabiting Divorced/widowed/separated Single/never married Children4 Given birth to children Not given birth to children Note: Unless otherwise stated bootstrap results are based on bias corrected 1000 samples. p values are 2-tailed a This parameter is set to zero so is redundant 1 age at 01.09.2012, 2low household income <£20,000, medium household income £20,000- £39,999, high household income >£40,000, 3low education level: none, GCSE or equivalent, medium education level: ‘A’ level or equivalent, high education level: degree or postgraduate degree, 4 given birth to vs. not given birth. Adjusted R2 = = 0.080 266 Intermediate socioeconomic status is the only sociodemographic variable that is significantly predictive of overall treatment utilisation. None of the other sociodemographic variables are predictors Table A11.2: Sociodemographic Variables Regressed onto Biomedical Treatment Utilisation Scale 95% confidence intervals B Intercept SE Lower Upper 2.440 1.719 .149 -.960 5.477 .009 .032 .804 -.052 .078 Working class -.359 .527 .478 -.1353 .678 Intermediate 1.258 .429 .002 .358 2.157 Salaried -.195 .397 .616 -1.003 .624 0a 0a High -.435 .413 .301 -1.256 .437 Medium -.871 .427 .045 -1.727 .009 0a 0a High -.471 .442 .290 -1.266 .378 Medium -.755 .473 .114 -1.622 .187 0a 0a Married/cohabiting -.532 .581 .378 -1.595 .495 Divorced/widowed/separated -.138 .360 .694 -.881 .656 0a 0a -.652 .396 .095 -1.388 .070 0a 0a Step 1 Age in years1 Step 2 Social class Not in paid employment Step 3 Sig. . Income3 Low Education2 Low Step 4 Marital status Single/never married Children4 Given birth to children Not given birth to children Note: Unless otherwise stated bootstrap results are based on bias 267


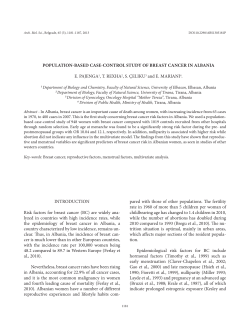


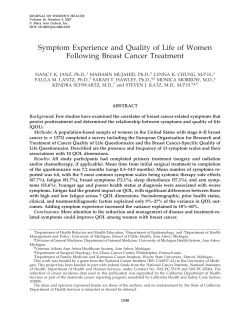
© Copyright 2026