
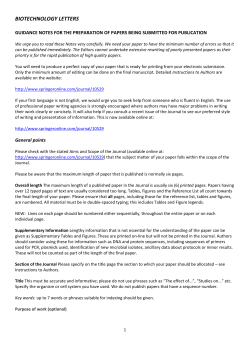
International Journal of Research Studies in Science, Engineering and Technology
Volume 2, Issue 3, March 2015, PP 30-44
ISSN 2349-4751 (Print) & ISSN 2349-476X (Online)
Comparative Study of Adsorption of Methylene Blue onto
Mangrove Plant (Sonneratiaapetala) Leaf and Fruit Powder:
Equilibrium, Kinetic and Thermodynamic Analysis
Satish Patil
Department of Chemistry
A.P.Science College, Nagothane (MS), India
[email protected]
Sameer Renukdas
Naseema Patel
Department of Chemistry
Vaidyanath College, ParliVaijnath (MS), India
Department of Chemistry
YeshwantMahavidyalaya, Nanded (MS), India
Abstract: Batch adsorption of methylene blue (MB) onto mangrove plant leaf powder (MPLP) and mangrove
plant fruit powder (MPFP) was investigated. The parameter studied includes initial dye concentration,
adsorbent dose, pH, agitation time, agitation speed, temperature and particle size. Freundlich, Langmuir and
Temkin isotherm models were used to test the equilibrium data. The best fitting isotherm model was found to be
Langmuir (R2 = 0.988 to 0.997 for MPLP and 0.974 to 0.989 for MPFP). Lagergen pseudo -second order model
best fits the kinetics of adsorption (R2 ≥ 0.99). Intra particle diffusion plot showed boundary layer effect and
larger intercepts indicates greater contribution of surface sorption in rate determining step. Adsorption was
found to increase on increasing pH, increasing temperature and decreasing particle size for MPLP as well as
MPFP. Thermodynamic analysis showed negative values of ∆G indicating adsorption was favourable and
spontaneous, positive values of ∆H indicating endothermicphysisorption and positive values of ∆S indicating
increased disorder and randomness at the solid- solution interface of MB with the adsorbents. The forward rate
constant was much higher than reverse rate constant suggesting dominance of rate of adsorption. But from
overall observations, MPLP was found to be slightly better adsorbent than MPFP.
Keywords: Adsorption, methylene blue, Mangrove plant leaf and fruit powder, isotherms
1. INTRODUCTION
Dye contaminated wastewater originates from a number of industries such as plastic, tannery, textile,
packaging to colour their final products. Control of pollution is one of the prime concerns of society
today. Many dyes and their degradated products may be toxic to living organisms 1. Therefore it is
necessary to decolourise wastewater before discharge. Colour removal was mostly studied with
physiochemical methods such as ultra filtration, electrochemical adsorption, coagulation and photooxidation1-2.
Among these methods, adsorption is widely used for dye adsorption from wastewaters 2-3. Activated
carbon is most commonly used for dye removal3. But it is expensive and also causes several problems
during regeneration and disposal. Therefore, many researchers have studied the feasibility of using
low cost bio sorbents such as coconut shell, ground nut shell, rice husk, bamboo dust and straw 1;
powered activated sludge2; neem leaf powder 3 for removal of various dyes from wastewaters.
MB is an important basic dye widely used for dyeing, printing cotton and tannin, printing calcico,
dyeing leather, indicating oxidation – reduction. In zinc free form, it is used as an antiseptic and for
other medicinal purposes. It causes eye burns. It also may cause methemoglobinemia, cyanosis, and
tachycardia, if inhaled. It also causes irritation to the skin. Hence it is necessary to remove MB from
wastewater.
Therefore there is a need for the search of low cost and easily available biomaterials as adsorbents for
removal of dyes from wastewater. In this paper, we attempt to use MPLP and MPFP as adsorbents. In
India, mangrove vegetation is found in coastal areas of Mumbai, Kerala, Bengal and Andaman and
Nicobar Island. Mangove plants include Rhizophora, Sonneratia, Avicenia, Salsola etc. In this study,
we used Sonneratiaapetala. Mature leaves and fruits of Sonneratiaapetala were collected from coastal
area of Alibag (Village Chikhali).
©IJRSSET
30
Comparative Study of Adsorption of Methylene Blue onto Mangrove Plant (Sonneratiaapetala) Leaf and
Fruit Powder: Equilibrium, Kinetic and Thermodynamic Analysis
2. MATERIALS AND METHODS
2.1. Sorbate and Chemicals
MB (C16H18ClN3S), the sorbate used in the present study, is a monovalent cationic dye. It has a
molecular weight of 373.9 and was supplied by Merck. A stock solution of 1000 mg l-1 was prepared
and the working solutions were prepared by diluting the stock solution by distilled water as per
requirement.
2.2. Sorbent
Mature mangrove plant leaves and fruits were washed thoroughly with distilled water to remove dust
and other impurities. Washed leaves and fruits were dried for 5-6 days in sunlight. Dried leaves and
fruits were ground in a domestic mixer-grinder. After grinding, the powders were again washed and
dried. Different sized MPLP and MPFP were stored in plastic container for further use.
2.3. Sorption Kinetics
The efficiency of adsorbents is evaluated by conducting laboratory batch mode studies. Specific
amount of adsorbents were shaken in 25 ml aqueous solution of dye of varying concentration for
different time periods at natural pH and temperatures. At the end of pre-determined time intervals,
adsorbent was removed by centrifugation at 10000 rpm and supernatant was analysed for residual
concentration of MB, spectrophotometrically at 665 nm wavelength.
Also variation in pH, adsorbent dose, particle size, agitation speed, was studied. Comparative studies
of both the adsorbents (MPLP and MPFP) were carried out under same experimental conditions.
2.3.1. Effect of Initial Dye Concentration and Contact Time
25 mg of adsorbent of ≥ 120 mesh size with 25 ml of dye solution was kept constant for batch
experiments. Initial MB concentration of 100, 150, 200, 250, 300, 350 and 400 mg l-1 were performed
at nearly 303K on a oscillator at 230 rpm for 5,10, 15, 20, 30, 40, 50 and 60 minutes at pH = 7. Then
optimum contact time was identified for further batch experimental study.
2.3.2. Effect of Adsorbent Dosage and Initial Dye Concentration
Initial MB concentrations of 400, 500, 600 and 700 mg l-1 were used in conjunction with adsorbent
dose of 1, 2, 3, 4, 5, and 6 g l-1 . Contact time, pH, agitation speed, temperature and particle size of 30
minutes, 7, 230 rpm, 303K and ≥ 120 mesh respectively were kept constant.
2.3.3. Effect of pH
Initial pH of MB solutions was adjusted to 3, 4, 5, 6, 7, 8, 9, 10 and 11 for 200 mg l-1 concentration.
Contact time, adsorbent dose, agitation speed, temperature and particle size of 30 minutes, 1 g l-1, 230
rpm, 303K and ≥ 120 mesh respectively were kept constant.
2.3.4. Effect of Particle Size and Initial Dye Concentration
Three different sized particles of ≥ 120, 120 ≤ 85 and 85 ≤ 60 mesh were used in conjunction with
100, 150, 200, 250, 300 and 350 mg l-1 MB concentration. Contact time, adsorbent dose, agitation
speed, temperature and pH of 30 minutes, 1 g l-1, 230 rpm, 303K and 7 respectively were kept
constant.
2.3.5. Effect of Temperature and Initial Dye Concentration
303K, 313K and 323K temperatures were used in conjunction with 100, 150, 200, 250, 300 and 350
mg l-1 MB concentration. Contact time, adsorbent dose, agitation speed, particle size and pH of 30
minutes, 1 g l-1, 230 rpm, ≥ 120 mesh and 7 respectively were kept constant.
2.3.6. Effect of Agitation Speed
100, 170 and 230 rpm agitation speeds were used in conjunction with initial MB concentration of 250
mg l-1 for 5,10, 15, 20, 30, 40, 50 and 60 minutes. Adsorbent dose, pH, temperature and particle size
of 1 g l-1, 7, 303K and ≥ 120 mesh respectively were kept constant.
International Journal of Research Studies in Science, Engineering and Technology [IJRSSET]
31
Satish Patil et al.
3. RESULTS AND DISCUSSION
3.1. Effect of Initial Dye Concentration and Contact Time
Effect of initial dye concentration with contact time on adsorption of MB is presented in Figures 1(a)
and 2(a) for MPLP, Figures 1(b) and 2(b) for MPFP. Uptake of MB was rapid in first 5 minutes and
after 30 minutes amount of dye adsorbed was almost constant. Therefore, further batch experiments
were carried out at 30 minutes optimum contact time. Percentage sorption decreased (from 98.9 to
67.75% for MPLP and 98.2 to 63.25% for MPFP) but amount of MB adsorbed per unit mass of
adsorbent increased ( From 98.9 to 271 mg g-1 for MPLP and 98.2 to 253 mg g-1 for MPFP) with
increase in MB concentration from 100 to 400 mg l-1.
300
100mg l-1
150mg l-1
200mg l-1
250mg l-1
300mg l-1
350mg l-1
400mg l-1
200
150
100
50
Figure 1(b) -MPFP
100mg l-1
150mg l-1
200mg l-1
250mg l-1
300mg l-1
350mg l-1
400mg l-1
250
200
qt (mg g-1)
250
qt (mg g-1)
300
Figure 1(a) - MPLP
150
100
50
0
0
50
0
100
0
Time (min)
50
Time (min)
100
Fig1(a) and 1(b). Effect of initial dye concentration and contact time on adsorption of MB onto MPLP and
MPFP respectively
120
120
Figure 2(a) -MPLP
80
80
60
100mg l-1
150mg l-1
40
200mg l-1
250mg l-1
20
300mg l-1
350mg l-1
400mg l-1
20
40
Time (min)
Figure 2(b) -MPFP
60
100mg l-1
150mg l-1
40
200mg l-1
250mg l-1
20
300mg l-1
350mg l-1
400mg l-1
0
0
0
% Removal
100
% Removal
100
60
0
20
40
60
Time (min)
Fig2(a) and 2(b). Effect of initial dye concentration and contact time on percentage removal of MB onto MPLP
and MPFP respectively
To investigate the mechanism of adsorption, pseudo - first order and pseudo- second order models
were used.
The Lagergen pseudo- first order rate expression is given as
log (qe- qt) = log qe – (k1 / 2.303) t
(1)
-1
Where qe and qt are amounts of dye adsorbed (mg g ) on adsorbent at equilibrium and at time t,
respectively and k1 is rate constant of pseudo first order adsorption(min-1). The slope and intercept
values of plots log(qe- qt) against t , Figure 3(a) for MPLP and 3(b) for MPFP were used to
determine pseudo first order rate constant (k1) and theoretical amount of dye adsorbed per unit mass
of adsorbent qe(the), respectively. qe(the)were compared with the qe(exp) values in Table 1. qe(exp) values
differ from the corresponding qe(the) values showed that pseudo first order equation of Langergen does
not fit well with whole range of contact time and is generally applicable for initial stage of adsorption.
International Journal of Research Studies in Science, Engineering and Technology [IJRSSET]
32
Comparative Study of Adsorption of Methylene Blue onto Mangrove Plant (Sonneratiaapetala) Leaf and
Fruit Powder: Equilibrium, Kinetic and Thermodynamic Analysis
Table1. Pseudo -first order model constants for effect of initial dye concentration and contact time on
adsorption of MB
Initial MB Conc.
(mg l-1)
100
150
200
250
300
350
400
K1 (min-1)
0.205
0.2096
0.1865
0.0852
0.1059
0.0944
0.0921
100mg l-1
200mg l-1
300mg l-1
400mg l-1
Figure 3(a) -MPLP
qe(the) (mg g-1)
26.122
37.757
42.267
40.644
50.699
51.404
55.081
R2
0.993
0.926
0.972
0.989
0.955
0.962
0.981
150mg l-1
250mg l-1
350mg l-1
2
MPFP
qe(exp) (mg g-1)
98.2
140.6
172
196.8
222
236
253
K1 (min-1)
0.1934
0.2073
0.0967
0.0944
0.2027
0.1336
0.1036
Figure 3(b) - MPFP
qe(the) (mg g-1)
22.646
41.495
15.776
26.669
115.08
51.404
62.951
100mg l-1
200mg l-1
300mg l-1
400mg l-1
R2
0.934
0.975
0.947
0.948
0.963
0.994
0.98
150mg l-1
250mg l-1
350mg l-1
1
1
log (qe - qt)
log (qe-qt)
2
MPLP
qe(exp) (mg g-1)
98.9
142.2
179.5
212
238.5
254
271
Time (min)
0
Time (min)
0
0
10
20
30
-1
0
10
20
30
-1
Fig3(a) and 3(b). Pseudo first order plot of effect of initial dye concentration and contact time on adsorption of
MB onto MPLP and MPFP respectively
The Langergen pseudo- second order kinetic model is given as
t/qt = 1/(k2qe2) + t/qe
(2)
-1
-1
Where k2 is rate constant of second order adsorption (g mg min ). The slopes and intercepts of plots
of t/qt against t, Figure 4(a) for MPLP and 4(b) for MPFP were used to determine qe(the) and k2
respectively. From highly linear plots it is cleared that there may be a possibility of chemisorptions
playing a significant role in the rate determining step. The pseudo second order parameters, q e(the), h
and k2 obtained from the plot are represented in Table 2.
Where h is initial adsorption rate (mg g-1 .min), h = k2 qe2
The correlation coefficient R2 for second order adsorption model has very high values for both the
adsorbents (R2 ≥ 0.999) and qe(the) values are consistent with qe(exp) showed that pseudo second order
adsorption equation of Langergen fit well with whole range of contact time and dye adsorption
process appears to be controlled by chemisorptions.
100mg l-1
0.7
0.6
150mg l-1
0.6
0.5
200mg l-1
0.5
200mg l-1
0.4
250mg l-1
0.4
250mg l-1
0.3
300mg l-1
0.3
300mg l-1
0.2
350mg l-1
0.2
350mg l-1
0.1
400mg l-1
t/qt
Figure 4(a) - MPLP
0
Figure 4(b) - MPFP
100mg l-1
150mg l-1
t/qt
0.7
400mg l-1
0.1
0
0
20
40
Time (min)
60
80
0
20
40
60
80
Time (min)
Fig4(a) and 4(b). Pseudo second order plot of effect of initial dye concentration and contact time on adsorption
of MB onto MPLP and MPFP respectively
International Journal of Research Studies in Science, Engineering and Technology [IJRSSET]
33
Satish Patil et al.
Table2. Pseudo -second order model constants for effect of initial dye concentration and contact time on
adsorption of MB
MPLP
Initial MB
K2
Conc.
qe(exp)
-1
-1
-1 (g mg
(mg l )
(mg g )
-1
min )
100
98.9
0.0333
150
142.2
0.0245
200
179.5
0.0125
250
212
0.004
300
238.5
0.0053
350
254
0.003
400
271
0.003
MPFP
h
qe(the)
(mg g-1
-1
(mg g )
.min)
100
333.33
142.86 500
200
500
250
250
250
333.33
333.33 333.33
333.33 333.33
R2
qe(exp)
(mg g-1)
1
1
1
0.999
0.999
0.999
0.999
98.2
140.6
172
196.8
222
236
253
K2
(g mg-1
min-1)
0.025
0.0163
0.0125
0.0083
0.0053
0.008
0.0023
qe(the)
(mg g-1)
100
142.86
200
200
250
250
333.333
h
(mg g-1
.min)
250
333.33
500
333.33
333.33
500
250
R2
1
1
1
1
0.999
1
1
Steps involved in sorption of the dye by adsorbent includes transport of solute from aqueous to
surface of solid and diffusion of solute into the interior of pores, which is generally a slow process.
According to
Weber and Morris, the intra particle diffusion rate constant (Ki) is given by the following equation
qt = Ki t 1/2
(3)
Ki (mg g-1min-1/2) values can be determined from the slope of the plots qt against t 1/2, Figure 5(a) for
MPLP and 5(b) for MPFP showed a linear relationship after certain time but they do not pass through
origin. This is due boundary layer effect. The larger the intercept, the greater the contribution of
surface sorption in rate determining step. The intercepts and Ki values of plots qt against t 1/2 increased
with increase in the initial concentration of dye, Table 3. Initial portion is attributed to the liquid film
mass transfer and linear portion to the intra particle diffusion.
Table3. Intra particle diffusion model constants for effect of initial dye concentration and contact time on
adsorption of MB
300
MPLP
Ki (mg g-1min-1/2)
1.287
1.609
2.226
4.415
4.855
5.42
5.866
qt (mg g-1)
300
FIgure 5(a) - MPLP
100mg l-1
250
150mg l-1
200
MPFP
Ki (mg g-1min-1/2)
1.41
2.012
1.854
3.014
4.544
4.357
6.271
R2
0.592
0.682
0.674
0.892
0.837
0.855
0.864
200mg l-1
150
250mg l-1
100
300mg l-1
R2
0.576
0.65
0.692
0.804
0.754
0.699
0.802
Figure 5(b) - MPFP
100mg l-1
250
150mg l-1
200
qt (mg g-1)
Initial MB
Concentration (mg l-1)
100
150
200
250
300
350
400
200mg l-1
150
250mg l-1
300mg l-1
100
350mg l-1
350mg l-1
50
400mg l-1
50
400mg l-1
0
0
0
5
t1/2
10
0
5
t1/2
10
Fig5(a) and 5(b). Intra particle diffusion plot of effect of initial dye concentration and contact time on
adsorption of MB onto MPLP and MPFP respectively
The linearized form of Elovich kinetic equation is presented as
qt =1/ [β ln(αβ)] + ln t /β
International Journal of Research Studies in Science, Engineering and Technology [IJRSSET]
(4)
34
Comparative Study of Adsorption of Methylene Blue onto Mangrove Plant (Sonneratiaapetala) Leaf and
Fruit Powder: Equilibrium, Kinetic and Thermodynamic Analysis
Where α and β are the constants calculated from the intercepts and slopes of plots q t against ln t,
Figure 6(a) for MPLP and 6(b) for MPFP. The values of constant α increases and constant β
decreases with increase in initial MB concentration, Table 4 .This Elovich kinetic model gave quiet
satisfactory results for MPLP than MPFP.
Table4. Elovich model constants for effect of initial dye concentration and contact time on adsorption of MB
MPLP
MPFP
Initial MB
α
β
R2
α
β
R2
Concentration (mg l-1)
100
3.421
0.3036
0.75
3.78
0.276
0.736
150
4.16
0.2481
0.829
5.286
0.1972
0.8
200
5.763
0.1797
0.815
4.759
0.2165
0.832
250
11.095
0.0958
0.967
7.575
0.1378
0.903
300
12.29
0.0863
0.925
11.859
0.0897
0.879
350
13.741
0.0755
0.939
11.49
0.092
0.844
400
14.914
0.0715
0.952
16.482
0.0656
0.918
300
Figure 6(a) -MPLP
200
100
Figure 6(b) - MPFP
100mg l-1
100mg l-1
150mg l-1
200mg l-1
250mg l-1
300mg l-1
350mg l-1
400mg l-1
qt (mg g-1)
qt (mg g-1)
300
150mg l-1
200
200mg l-1
250mg l-1
300mg l-1
100
350mg l-1
400mg l-1
0
0
0 0.5 1 1.5 2 2.5 3 3.5 4 4.5
ln t
0 0.5 1 1.5 2 2.5 3 3.5 4 4.5
ln t
Fig6(a) and 6(b). Elovich plot of effect of initial dye concentration and contact time on adsorption of MB onto
MPLP and MPFP respectively
3.2. Effect of Adsorbent Dosage and Initial Dye Concentration
The adsorption of MB onto MPLP and MPFP was studied by varying the adsorbent dosage. The
percentage of adsorption increased with increase in dosage of adsorbent, Figure7(a) for MPLP and
7(b) for MPFP. Percentage removal of MB decreased with increase in concentration. For above 95%
removal of MB, adsorbent dosage of 3, 4, 5, 5 g l-1 for MPLP and 3, 4, 6, 6 g l-1 MPFP were needed
for initial MB concentrations 400, 500, 600 and 700 mg l-1 respectively
120
80
60
400 mg l-1
500 mg l-1
600 mg l-1
700 mg l-1
40
20
0
0
1
2
3
4
5
-1
Adsorbent dose (g l )
Figure 7(b) -MPFP
100
% Removal
100
% Removal
120
Figure 7(a) -MPLP
80
60
400 mg l-1
500 mg l-1
600 mg l-1
700 mg l-1
40
20
0
6
0
1
2
3
4
5
-1
Asorbent dose (g l )
6
Fig7(a) and 7(b). Effect of adsorbent dosage and initial dye concentration on adsorption of MB onto MPLP and
MPFP respectively
3.3. Effect of pH
pH is an important factor in controlling the adsorption of dye onto adsorbent. The adsorption of MB
from 200mg l-1 concentration onto MPLP and MPFP was studied by varying the pH from 3 to 11. The
amount of dye adsorbed per unit mass of adsorbent at equilibrium (qe) increased from 50 to 192.2 mg
g-1 for MPLP and 57 to 191.6 mg g-1 for MPFP by variation in pH from 3 to 11, Figure 8.
International Journal of Research Studies in Science, Engineering and Technology [IJRSSET]
35
Satish Patil et al.
qe (mg g-1)
200
Figure 8
150
MPLP
100
MPFP
50
0
0
2
4
6
pH
8
10
12
Fig8. Effect of pH on adsorption of MB From initial concentration 200 mg l-1 MB solution onto MPLP and
MPFP
3.4. Effect of Particle Size and Initial Dye Concentration
Adsorption of MB on three sized particles ≥ 120, 120 ≤ 85 and 85 ≤ 60 mesh of MPLP and MPFP
was studied for 100 to 350 mg l-1 concentrations of MB. The results of variation of these particle sizes
on dye adsorption are shown in Figure 9(a) for MPLP and 9(b) for MPFP. It can be observed that as
the particle size increases the adsorption of dye decreases and hence the percentage removal of dye
also decreases. This is due to larger surface area that is associated with smaller particles. For larger
particles, the diffusion resistance to mass transfer is higher and most of the internal surface of the
particle may not be utilized for adsorption and consequently amount of dye adsorbed is small.
≥120 mesh
Figure 9(b) -MPFP
120≤85mesh
100
90
85≤60mesh
90
% Removal
% Removal
Figure 9(a) -MPLP
100
80
70
60
≥120 mesh
120≤85mesh
85≤60mesh
80
70
60
50
50
40
0
100
200
300
400
Initial MB concentration (mg l-1)
0
100
200
300
400
Initil MB concentration (mg l-1)
Fig9(a) and 9(b). Effect of particle size and initial dye concentration on % removal of MB on MPLP and MPFP
respectively
The Freundlich equation was employed for the adsorption of MB onto the adsorbent. The isotherm
was represented by
logqe = log Kf + 1/n log Ce
(4)
Table5. Freundlich isotherm parameters for effect of particle size and initial dye concentration on adsorption of
MB
MPLP
MPFP
Mesh
Kf
n
R2
Kf
n
R2
≥ 120
92.47
4.546
0.994
84.14
4.525
0.988
120 ≤ 85
44.67
2.717
0.967
52.72
3.584
0.973
85 ≤ 60
57.41
4.348
0.962
39.81
3.623
0.969
Where qe is amount of MB adsorbed at equilibrium (mg g-1), Ce is the equilibrium concentration of
MB in solution (mg l-1), Kf and n are constant incorporating factors affecting the adsorption capacity
and intensity of adsorption respectively. The plots of log qe against log Ce (R2= 0.962 to 0.994 for
MPLP and0.969 to 0.988 for MPFP) indicating the adsorption of MB obeys the Freundlich adsorption
isotherm, Figure 10(a) for MPLP and 10(b) for MPFP. The values of Kf and n are given in the Table
5. Values of n between 1 and 10 indicate an effective adsorption while higher values of Kf represent
an easy uptake of adsorbate from the solution.
International Journal of Research Studies in Science, Engineering and Technology [IJRSSET]
36
Comparative Study of Adsorption of Methylene Blue onto Mangrove Plant (Sonneratiaapetala) Leaf and
Fruit Powder: Equilibrium, Kinetic and Thermodynamic Analysis
2.4
2.4
Figure 10(a) -MPLP
≥120 mesh
120≤85mesh
85≤60mesh
2
1.8
0
0.5
1
1.5
log Ce
2
log qe
2.2
2.2
log qe
Fugure 10(b) -MPFP
≥120 mesh
120≤85mesh
85≤60mesh
2
1.8
0
2.5
0.5
1
1.5
log Ce
2
2.5
Fig10(a) and 10(b). Freundlich isotherm plots of effect of particle size and initial dye co
centration on adsorption of MB on MPLP and MPFP respectively.
The Langmuir isotherm was represented by the following equation
Ce / qe = 1/ (qm b) + Ce /qm
(5)
-1
Where qm is monolayer (maximum) adsorption capacity (mg g ) and b is Langmuir constant related to
energy of adsorption (1/mg). A linear plots of Ce / qe against Ce suggest the applicability of the
Langmuir isotherms Figure 11(a) for MPLP and 11(b) for MPFP (R2= 0.989 to 0.997 for MPLP and
0.974 to 0.989 for MPFP). The values of qm and b were determined slope and intercepts of the plots,
Table 6. Monolayer adsorption capacity (qm) decreased from 333.333 mg g-1 to 200 mg g-1 with
decreased in particle size from ≥ 120 to 85 ≤ 60 mesh for both the adsorbents.
Table6. Langmuir isotherm parameters for effect of particle size and initial dye concentration on adsorption of
MB
MPLP
qm
333.3
333.3
200
Mesh
≥ 120
120 ≤ 85
85 ≤ 60
MPFP
qm
333.3
250
200
R2
0.989
0.997
0.997
b
0.111
0.046
0.074
R2
0.979
0.974
0.989
b
0.083
0.048
0.038
The essential features of the Langmuir isotherm can be expressed in terms of dimensionless constant
separation factor,
RL = 1/ (1+bCo)
Where Co is initial MB concentration (mg l-1)
The nature of adsorption If,
RL> 1 Unfavourable,
RL = 1
RL = 0 Irreversible ,
0 < RL< 1
(6)
Linear
Favourable .
RL values lies between 0 and 1 for both the adsorbents (0.0178 to 0.1779 for MPLP and 0.0205 to
0.2075 for MPFP) indicates favourable adsorption for MPLP and MPFP, Table 11 and 12.
1
1.5
Figure 11(a) - MPLP
Figure 11(b) - MPFP
0.5
≥120 mesh
Ce/qe
Ce/qe
1
≥120 mesh
120≤85mesh
0.5
120≤85mesh
85≤60mesh
0
85≤60mesh
0
0
0
50
100
Ce (mg l-1)
150
200
50
100
Ce (mg l-1)
150
200
Fig11(a) and 11(b). Langmuir isotherm plots of effect of particle size and initial dye concentration on
adsorption of MB on MPLP and MPFP respectively.
The Temkin isotherm is given as
qe = B ln A + b lnCe
International Journal of Research Studies in Science, Engineering and Technology [IJRSSET]
(7)
37
Satish Patil et al.
Where A (1/g) is the equilibrium binding constant, corresponding to the maximum binding energy and
constant B is related to heat of adsorption. A linear plots of qe against lnCe, Figure 12(a) for MPLP
and 12(b) for MPFP enables the determination of the constants B and A from the slope and intercept.
The results of the plots are given in Table 7.
300
300
Figure 12(b) -MPFP
200
≥120 mesh
120≤85mesh
85≤60mesh
100
qe (mg g-1)
qe (mg g-1)
Figure 12(a) -MPLP
0
200
≥120 mesh
120≤85mesh
85≤60mesh
100
0
0
2
ln Ce
4
6
0
2
ln Ce
4
6
Fig12(a) and 12(b). Temkin isotherm plots of effect of particle size and initial dye concentration on adsorption
of MB on MPLP and MPFP respectively.
Table7. Temkin isotherm parameters for effect of particle size and initial dye concentration on adsorption of
MB
MPLP
A
9.328
0.597
2.256
Mesh
≥ 120
120 ≤ 85
85 ≤ 60
B
35.88
57.34
31.12
MPFP
A
6.741
1.154
0.753
R2
0.959
0.983
0.983
B
34.97
40.13
33.36
R2
0.946
0.946
0.973
3.5. Effect of Temperature and Initial Dye Concentration
Temperature has important effects on adsorption process. Adsorption of MB at three different
temperatures (303K, 313K and 323K) onto MPLP and MPFP was studied for 100 to 350 mg l-1 initial
MB concentrations. The results variation in temperatures on dye adsorption is shown in Figure 13(a)
for MPLP and 13(b) for MPFP. It is observed that as the experimental temperature increases from
303K to 323K, the dye adsorption also increases. As the temperature increases, rate of diffusion of
adsorbate molecules across external boundary layer and internal pores of adsorbent particle increases .
Changing the temperature will change the equilibrium capacity of the adsorbent for particular
adsorbate.
Figure 13(a) -MPLP
190
303K
140
313K
qe (mg g-1)
qe (mg g-1)
Figure 13(b) -MPFP
240
240
190
303K
140
313K
323K
90
323K
90
50
150
250
Initial MB concentration (mg l-1)
350
50
150
250
Initial MB concentration (mg l-1)
350
Fig13(a) and 13(b). Effect of temperature and initial dye concentration on adsorption of MB on MPLP and
MPFP respectively.
Freundlich and Langmuir adsorption isotherms were employed for 303K, 313K and 323K
temperatures. Plot of log qe against log Ce, Figure 14(a) for MPLP and 14(b) for MPFP and plots of
Ce / qe against Ce,Figure 15(a) for MPLP and 15(b) for MPFP showed good linearity with regression
coefficients (R2≈ 0.99). Freundlich constants Kf and n as well as Langmuir constants qm and b are
given in Table 8 and Table 9 respectively. Dimensionless constant separation factor (RL) values lie
between 0 and 1 for both the adsorbents. Monolayer (maximum) adsorption capacity (q m) obtained
from Langmuir plots for MPLP as well as for MPFP for all temperature conditions remains 333.333
mg g-1. Both Langmuir as well as Freundlich adsorption isotherms fits well for 303 to 323K
temperature range.
International Journal of Research Studies in Science, Engineering and Technology [IJRSSET]
38
Comparative Study of Adsorption of Methylene Blue onto Mangrove Plant (Sonneratiaapetala) Leaf and
Fruit Powder: Equilibrium, Kinetic and Thermodynamic Analysis
2.5
2.5
Figure 14(a) -MPLP
Figure 14(b) -MPFP
logqe
2.3
log qe
2.3
303K
313K
2.1
303K
2.1
313K
323K
323K
1.9
-0.5
1.9
0
0.5
1
log Ce
1.5
2
2.5
0
0.5
1
log Ce
1.5
2
2.5
Fig14(a) and 14(b). Freundlich isotherm plots of effect of temperature and initial dye concentration on
adsorption of MB on MPLP and MPFP respectively
0.4
0.5
Figure 15(a) -MPLP
0.2
303K
313K
323K
0.1
Ce/qe
0.3
Ce/qe
Figure 15(b) -MPFP
0.4
303K
313K
323K
0.3
0.2
0.1
0
0
0
20
40
60
Ce (mg l-1)
80
0
100
20
40
60
80
Ce (mg l-1)
100
120
Fig15(a) and 15(b). Langmuir isotherm plots of effect of temperature and initial dye concentration on
adsorption of MB on MPLP and MPFP respectively.
Table8. Freundlich isotherm parameters for effect of temperature and initial dye concentration on adsorption
of MB
Temp. in Kelvin
303
313
323
MPLP
Kf
92.68
98.17
109.6
MPFP
Kf
84.14
90.78
97.5
R2
0.994
0.992
0.987
n
4.587
4.63
5
R2
0.988
0.995
0.994
n
4.525
4.63
4.739
Table9. Langmuir isotherm parameters for effect of temperature and initial dye concentration on adsorption of
MB
MPLP
MPFP
Temp. in Kelvin
2
qm
b
R
qm
b
R2
303
333.3
0.115
0.99
333.3
0.083
0.979
313
333.3
0.13
0.99
333.3
0.103
0.983
323
333.3
0.158
0.988
333.3
0.136
0.986
Temkin plot qe against lnCe , Figures 16(a) for MPLP and 16(b) for MPFP also showed linearity (R2 =
0.937 to 0.961 for MPLP and 0.946 to 0.97 for MPFP). Temkin constants A and B are given in Table
(11).
Figure 16(a) -MPLP
Figure 16(b) -MPFP
240
qe (mg g-1)
qe (mg g-1)
240
190
303K
313K
140
303K
313K
140
323K
323K
90
-1
190
90
0
1
2
ln Ce
3
4
5
0
1
2
ln Ce
3
4
5
Fig16(a) and 16(b). Temkin isotherm plots of effect of temperature and initial dye concentration on adsorption
of MB on MPLP and MPFP respectively.
International Journal of Research Studies in Science, Engineering and Technology [IJRSSET]
39
Satish Patil et al.
Table10. Temkin isotherm parameters for effect of temperature and initial dye concentration on adsorption of
MB
Temp. in Kelvin
303
313
323
MPLP
A
12.18
9.649
23.94
B
35.78
35.56
33.82
R2
0.954
0.961
0.937
MPFP
A
6.741
9.066
12.44
B
34.97
35.06
34.89
R2
0.946
0.957
0.97
Table11. Dimensionless separation factor (RL) calculated from Langmuir constant (b) for MPLP
Initial MB Conc. (mg l-1)
100
150
200
250
300
350
Mesh
≥ 120
0.083
0.057
0 .043
0.035
0.029
0.025
120 ≤ 85
0.178
0.126
0.098
0.08
0.067
0.058
85 ≤ 60
0.119
0.083
0.064
0.054
0.043
0.037
Temperature
303K
313K
0.08
0.071
0.055
0.049
0.042
0.037
0.034
0.03
0.028
0.025
0.024
0.021
323K
0.06
0.041
0.031
0.025
0.021
0.018
Table12. Dimensionless separation factor (RL) calculated from Langmuir constant (b) for MPFP
Initial MB Conc. (mg l-1)
100
150
200
250
300
350
Mesh
≥ 120
0.107
0.074
0.057
0.046
0.039
0.033
120 ≤ 85
0.172
0.121
0.094
0.077
0.065
0.056
85 ≤ 60
0.208
0.149
0.116
0.095
0.08
0.07
Temperature
303K
313K
0.107
0.088
0.074
0.061
0.057
0.046
0.046
0.037
0.039
0.031
0.033
0.027
323K
0.068
0.047
0.035
0.029
0.024
0.021
3.5.1. Thermodynamic Analysis
Thermodynamic parameters such as change in free energy (∆G) (kJ/mole), enthalpy (∆H) (kJ/mole)
and entropy (∆S) (J/K/mole) were determined using following equations
Ko = Csolid /Cliquid
(8)
∆G = -RTlnKo
(9)
∆G = ∆H - T∆S
lnKo = -∆G/RT
lnKo = ∆S/R - ∆H/RT
(10)
Where Ko is equilibrium constant, Csolid is solid phase concentration at equilibrium (mg l-1), Csolid is
liquid phase concentration at equilibrium (mg l-1), T is absolute temperature in Kelvin and R is gas
constant.
∆G values obtained from equation (9), ∆H and ∆S values obtained from the slope and intercept of
Von’t Hoff plot, lnKo against 1/T , Figure 17(a) for MPLP and 17(b) for MPFP, presented in Table
13 and Table 14 respectively.. The negative value of ∆G indicates the adsorption is favourable and
spontaneous. ∆G values increases with increase in temperature and decreases with increase in initial
concentration of MB. The low positive values of ∆H indicatephysisorption and endothermic nature of
adsorption 12-14. ∆H values decreases from 22.58 to 7.91 KJ/mole for MPLP and 35.758 to 11.132
kJ/mole for MPFP with increase in initial MB concentration from 100 to 350 mg l-1. The positive
values of ∆S indicate the increased disorder and randomness at the solid solution interface of MB with
the adsorbent. The adsorbed water molecules, which were displaced by adsorbate molecules, gain
more translational energy than is lost by the adsorbate molecules, thus allowing prevalence of
randomness in the system. The increase of adsorption capacity of the adsorbent at higher temperatures
was due to enlargement of pore size and activation of adsorbent surface.
International Journal of Research Studies in Science, Engineering and Technology [IJRSSET]
40
Comparative Study of Adsorption of Methylene Blue onto Mangrove Plant (Sonneratiaapetala) Leaf and
Fruit Powder: Equilibrium, Kinetic and Thermodynamic Analysis
6
5
Figure 17(a)-MPLP
5
4
3
100mg l-1
3.5
100mg l-1
150mg l-1
3
150mg l-1
200mg l-1
250mg l-1
2
300mg l-1
1
350mg l-1
0
ln Ko
4
ln Ko
Figure 17(b) - MPFP
4.5
2.5
200mg l-1
2
250mg l-1
1.5
300mg l-1
1
350mg l-1
0.5
0
0.00305
0.00315
0.00325
0.00335
0.003050.00310.003150.00320.003250.00330.00335
1/T
1/T
Fig17(a) and 17(b). Von’t Hoff plots of effect of temperature and initial dye concentration on adsorption of MB
on MPLP and MPFP respectively.
Table13. Equilibrium constants and thermodynamic parameters for the adsorption of MB on MPLP
Initial MB
Conc.(mg l-1)
100
150
200
250
300
350
Ko
303K
82.3
17.3
8.3
4.95
3.76
2.61
313K
110
20.4
9.7
5.76
4.31
2.95
323K
199
27.8
11.5
6.69
5.12
3.43
∆G
(kJ/mole)
303K
-11.111
-7.180
-5.332
-4.030
-3.338
-2.415
313K
-12.235
-7.851
-5.911
-4.555
-3.802
-2.819
323K
-14.215
-8.934
-.6559
-5.105
-4.387
-3.310
∆H
(kJ/mole)
∆S
(J/K/mole)
22.580
21.076
219.15
13.019
8.762
7.910
107.334
91.7866
86.9644
53.5172
37.6209
33.4472
Table14. Equilibrium constants and thermodynamic parameters for the adsorption of MB on MPFP
Initial MB
Conc.(mg l-1)
100
150
200
250
300
350
Ko
303K
51.6
14.8
5.9
3.55
2.84
2.41
313K
70.4
18.2
7.62
4.21
3.19
2.68
323K
89.9
24.9
10.1
4.88
3.52
2.93
∆G
(J/mole)
303K
-9.936
-6.786
-4.470
-3.188
-2.626
-2.221
313K
-11.072
-7.555
-5.285
-3.740
-3.019
-2.569
323K
-12.081
-8.629
-6.213
-4.258
-3.378
-2.889
∆H
(J/mole)
∆S
(J/K/mole)
35.758
19.313
13.244
12.238
12.537
11.132
154.225
87.2139
61.2659
53.7001
52.3366
44.6628
3.5.2. Kinetics of Equilibrium (Reverse and Forward) Adsorption Processes
The adsorption of dye from aqueous solution follows first order kinetics when a single species is
considered on a heterogeneous surface. The heterogeneous equilibrium between the dye solutions and
adsorbent (MPLP/MPFP) are represented as
K1
A
B
K2
Where K1 is forward rate constant and K2 is the backward rate constant. A and B represents dye
remaining in the aqueous solution and dye adsorbed on the surface of adsorbent respectively. The
equilibrium constant (Ko) is the ratio of concentration of dye on adsorbent and in aqueous solution
Ko = K1 / K2
To study the kinetics of the adsorption process the kinetic equation proposed by Natarajan and Khalaf
has been employed
log (Co/Ct) = (Kad /2.303) t
(11)
Where Co and Ct are concentration of MB (mg l-1) at time zero and time t respectively. Kad is first
order adsorption rate constant (min-1) which was calculated from slope of the linear plot log(Co/Ct)
International Journal of Research Studies in Science, Engineering and Technology [IJRSSET]
41
Satish Patil et al.
against t for different concentrations and temperatures. The rate constants are determined by the
following equation,
Kad = K1+K2 = K1+( K1/Ko)= K1 ( 1+ 1/ Ko)
(12)
The overall rate constant Kad for adsorption of dye increases with increase in temperature suggesting
adsorption was endothermic in nature. Kad is separated into rate of forward (K1) and reverse reactions
(K2) using equation (12). Kad, K1, K2 are given in Table 14 for MPLP as well as for MPFP clearly
indicate that, at all temperatures, the forward rate constant was much higher than the reverse rate
constant suggesting that the rate of adsorption was dominant.
Table15. First order adsorption rate constant, forward and backward rate constants for the adsorption of MB
from 200 mg l-1 MB conc.
303K
Kad
(min-1)
0.0184
0.01152
Adsorbent
MPLP
MPFP
K1
(min-1)
0.01642
0.00985
K2
(min-1)
0.00198
0.00167
313K
Kad
(min-1)
0.0195
0.0138
K1
(min-1)
0.0177
0.01222
K2
(min-1)
0.00182
0.0016
323K
Kad
(min-1)
0.0207
0.0161
K1
(min-1)
0.01904
0.01465
K2
(min-1)
0.00166
0.00145
3.6. Effect of Agitation Speed
The sorption is influenced by mass transfer parameters. Figure 18(a) for MPLP and 18(b) for MPFP
illustrates the sorption kinetics of MB by for different agitation speeds ranging from 100 to 230 rpm.
The amount adsorbed at equilibrium was found to increased from 189, 205 and 212 mg g-1 of MPLP
and 172.5 189 and 196.8 mg/g of MPFP with increased in agitation speed from 100, 170 and 230 rpm
of an oscillator from 250 mg l-1 initial MB solution. This is because with low agitation speed the
greater contact time is required to attend the equilibrium. With increasing the agitation speed , the rate
of diffusion of dye molecules from bulk liquid to the liquid boundary layer surrounding the particle
become higher because of an enhancement of turbulence and a decrease of thickness of the liquid
boundary layer. Under such conditions, the value of external diffusion coefficient becomes larger and
finally boundary layer becomes thin and approach to laminar sub layer at high agitation speeds. So,
the external diffusion resistance coefficient are constant or can be neglected. Thus, it can be noticed
that adsorption increases slightly with increase in sped of agitation.
220
200
Figure 18(a)- MPLP
210
Figure 18(b)- MPFP
190
190
180
100 rpm
170 rpm
230 rpm
170
160
150
qt (mg g-1)
qt (mg g-1)
200
180
170
100 rpm
170 rpm
230 rpm
160
150
0
20
Time (min)
40
60
0
20
Time (min)
40
60
Fig18(a) and 18(b). Effect of agitation speed on adsorption of MB on MPLP and MPFP respectively
4. CONCLUSION
In this work, two different adsorbents, mangrove plant leaf powder (MPLP) and mangrove plant fruit
powder (MPFP) have been used for the removal of MB from aqueous solutions. The amount of MB
adsorbed at equilibrium increased from 98.9 to 271 and 98.2 to 253 mg g-1 for MPLP and MPFP
respectively with increased in initial MB concentration from 100 to 400 mg l-1.
The best fitting isotherm model was found to be Langmuir (R2 = 0.988 to 0.997 for MPLP and 0.974
to 0.989 for MPFP). Langmuir and Freundlich isotherm parameters (n = 2.71 to 5 for MPLP and
3.584 to 4.739 for MPFP, RL = 0.0178 to 0.1779 for MPLP and 0.0205 to 0.2075 for MPFP)
confirmed that the adsorption of MB on both adsorbents was favourable. Monolayer adsorption
capacity (qm) decreased from 333.333 mg g-1 to 200 mg g-1 with decreased in particle size from ≥ 120
to 85 ≤ 60 mesh for both the adsorbents.
International Journal of Research Studies in Science, Engineering and Technology [IJRSSET]
42
Comparative Study of Adsorption of Methylene Blue onto Mangrove Plant (Sonneratiaapetala) Leaf and
Fruit Powder: Equilibrium, Kinetic and Thermodynamic Analysis
Lagergen pseudo -second order model best fits the kinetics of adsorption (R2 ≥ 0.99). The values
amount of MB adsorbed per unit mass of MPLP as well as of MPFP obtained by Lagergen pseudo second order Model, qe(the) were in consistent with the experimental qe(exp) .
Intra particle diffusion plot showed boundary layer effect and larger intercepts indicates greater
contribution of surface sorption in rate determining step. Adsorption was found to increase on
increasing pH, temperature, agitation speed and decreasing particle size.
Thermodynamic analysis showed that adsorption of MB on MPLP and MPFP was:
Favourable and spontaneous (negative values of ∆G, -14.215 to -2.415 kJ/mole for MPLP and 12.281 to -2.221kJ/mole for MPFP).
Endothermic (positive values of ∆H, 7.91 to 22.58 kJ/mole for MPLP and 11.132 to 35.758
kJ/mole for MPFP)
Physisorption ( small ∆H values)
Increased disorder and randomness at the solid- solution interface (positive values of ∆S, 0.0334 to
0.1073 KJ/mole for MPLP and 0.0446 to 0.154 KJ/mole).
The overall rate constant Kad for adsorption of MB increased with increase in temperature suggesting
adsorption was endothermic in nature. At all temperatures, the forward rate constant were much
higher than the reverse rate constant suggesting that the rate of adsorption was dominant for MPLP as
well as MPFP.
It was observed that MPLP and MPFP both showed same type of behaviour towards isotherm and
kinetic models but MPLP was found to be slightly better adsorbent than MPFP.
REFERENCES
[1] Kannan N. and Sundaram M.M. 2001. Kinetics and mechanism of removal of methylene blue by
adsorption of various carbons- a comparative study, Dyes and pigments, 51, 25-40.
[2] Bhattacharyya K.G. and Sharma A. 2005. Kinetics and thermodynamics of methylene blue
adsorption on Neem (AzadirachtaIndica) leaf powder, Dyes and pigments, 65, 51-59.
[3] Walker G.M. and Weatherley L.R. 199.8 Fixed bed adsorption of acid dyes onto activated
carbon, Enviornmental pollution, 99, 133 -136.
[4] Y.S.Ho and G. Mckay 1999. Water Res., 33, 578 -584.
[5] Mahvi A.H., Maleki A.,Eslami A. 2004. Potential of rice husk and rice husk ash for phenol
removal in aqueous system. Am. J. Appl. Sci., 1 (4).321-326.
[6] Potgeiter J., Potgeiter – Vermaak S., Kalibatonga P., 2005. Heavy metals removal from solution
byPalygorskite clay. Minerals Engineering.
[7] NamasivayamC.andKanchana N., , 1993. “Removal of congo red from aqueous solution by
waste banana pith”, J. Partanica. 1, 33.
[8] Lin S.H. 1993. “Adsorption of disperse dye on various adsorbents”, J.Chem. Tech. Biotechnol.,
58, 159-162.
[9] Singh A.K., Singh D.P., Pandey K.K., and Singh V. N., 1988. “Wollastonite as adsorbent for
removal of Fe(II) from water,” J. Chem. Technol., 42, 39.
[10] Weber Jr.W.J., Morris J. C., 1963. Kinetics of adsorption on carbon from solutions, J. Sanitary
Eng. Div. ASCE, 89, 31-60.
[11] Potgeiter J., Potgeiter – Vermaak S., Kalibatonga P., 2005. Heavy metals removal from solution
byPalygorskite clay. Minerals Engineering.
[12] Hall K. R. Eagleton L.C.,Acrivos A., Vermeulen T. 1966. Ind. Eng. Chem. Fund., ,5.
[13] Arivoli S., Venkatraman B., Rajachandrasekar T. and Hema M. 2007. Res. J. Chem. Enviorn.,
17, 70.
[14] Arivoli S., Kalpana K., Sudha R. and Rajachandrasekar T. 2007. E. J. Chem. ,4, 238
[15] Renmin G., Yingzhi S., Jian C., Huijun L., hao Y 2005.. Dyes and pigments, 67, 179.
International Journal of Research Studies in Science, Engineering and Technology [IJRSSET]
43
Satish Patil et al.
[16] Vadivelan V., VasnthkumarK.. 2005. J. Colloid Inter. Sci., 286,91.
[17] Weber W.J. Principle and Application of Water Chemistry, 1967. edited by Faust S.D. and
Hunter J. V. Wiiley, New York.
[18] Namasivayam C., Yamuna R.T. 1995, Envior..Pollution, 89, 1.
[19] Langmuir I, 1918. J. Amer Chem. Soc., ,40, 1361.
[20] Freundlich H., 1906. Phys. Chemie., 57, 384.
[21] P. Nigam, G. Armour, R.M.Banat, DSingh D., Marchant R. 2002.Bioresour. Technol., 72, 219226.
AUTHOR’S BIOGRAPHY
Dr.Satish D. Patil working as Assistant Professor in Chemistry at K.E.S. A.P.
Science College, Nagothane, Roha – Raigad (MS) – India since 1995 and M.Sc.
Co-ordinator in the same institute. I have guided the M.Sc. students for their
Research Projects.
International Journal of Research Studies in Science, Engineering and Technology [IJRSSET]
44


© Copyright 2026