
Tracking surgical day care patients using RFID
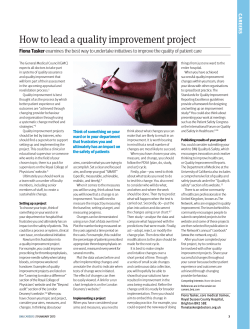
Downloaded from http://innovations.bmj.com/ on July 6, 2015 - Published by group.bmj.com
BMJ Innovations Publish Ahead of Print, published on April 3, 2015 as doi:10.1136/bmjinnov-2015-000038
HEALTH IT, SYSTEMS AND PROCESS INNOVATIONS
ORIGINAL ARTICLE
Tracking surgical day care patients
using RFID technology
L S G L Wauben,1,2,3 A C P Guédon,1 D F de Korne,4,5,6,7
J J van den Dobbelsteen1
For numbered affiliations see
end of article.
Correspondence to
Research Professor
LSGL Wauben, Department of
BioMechanical Engineering,
Faculty of Mechanical, Maritime
and Materials Engineering, Delft
University of Technology,
Mekelweg 2, Delft 2628 CD,
The Netherlands;
[email protected]
Received 5 January 2015
Revised 3 March 2015
Accepted 13 March 2015
To cite: Wauben LSGL,
Guédon ACP, de Korne DF,
et al. BMJ Innov Published
Online First: [ please include
Day Month Year]
doi:10.1136/bmjinnov-2015000038
ABSTRACT
Objective Measure wait times, characterise
current information flow and define
requirements for a technological information
system that supports the patient’s journey.
Design First, patients were observed during
eight random weekdays and the durations of
actions performed at each phase of the surgical
trajectory were measured. Patients were grouped
into patients receiving general anaesthesia or
local (or topical) anaesthesia. Second (active)
Radio Frequency IDentification (RFID) technology
was installed and patients were tracked during
52 weekdays. Length of hospital stay, length of
stay and wait times per phase, and differences in
wait times between the two types of
administered anaesthesia were analysed. Third,
interviews were conducted to characterise the
current information flow between staff, and
between staff and escorts ( patients’ family/
friends escorting them throughout their journey).
Results Observations (198 patients) showed that
the average duration of actions for general
anaesthesia patients took longer than for local
anaesthesia patients, especially at the recovery
phase (general anaesthesia: 0h16, local
anaesthesia: 0h01).
RFID tracking (622 patients): Significant
differences were seen for wait times between
general and local anaesthesia patients at:
preoperative ward ( p=0.014), recovery ( p<0.001)
and postoperative ward ( p<0.001). The average
percentage of wait time during the entire
hospital stay ranged from 64% to 68% (with
variation in groups being substantial).
Interviews (30 escorts, 9 ward nurses and 8
holding/recovery nurses): Escorts did not use the
current information system and ward nurses
indicated problems with exchanging information
concerning bringing/picking up patients to/from
the holding/recovery that resulted in unnecessary
wait times for some patients (mainly local
anaesthesia patients).
Conclusions Most time spent in hospital is wait
time. A Patient Tracking System was designed to
automatically display the phase in which a
patient is in. It provides transparency for patients
and staff in the surgical trajectory and is
expected to reduce intermittent communication,
improve patient flow, reduce wait times and
improve patient and staff satisfaction.
INTRODUCTION
In the next 10–15 years, the number of
patients requiring eye care and eye surgery
will increase.1–3 Meanwhile, besides focusing on clinical issues, hospitals are also
urged to focus on social and organisational
issues, such as service and patient satisfaction.1 4 5 Previous research has shown that
patient dissatisfaction is mostly related to
non-clinical aspects, such as long (recurrent) wait times, lack of information
about the clinical process and its predictability and wait times, inattentiveness/unresponsiveness of staff and the physical
environment.4 6–8
To cope with the growing demand
for surgical care and to manage the
increasing healthcare costs, hospitals need
to focus on patient satisfaction and on
operational efficiency, particularly in the
surgical trajectory where the costs are the
highest.1 3 7 9–11 Recently, the potential of
Radio Frequency IDentification (RFID)
technology is being explored to facilitate
healthcare processes, improve its efficiency and improve patient safety.12 RFID
technology can be used to uniquely
identify and localise objects, for example,
medical asset/equipment tracking, patient/
staff
identification
and
workflow
tracking, anticounterfeiting and medication safety.13–19 Data generated by RFID
systems can also provide valuable information to improve the efficiency of processes in the surgical trajectory, reduce
wait times, improve nurse allocation and
improve patient flow.7 18 To improve
patient satisfaction, patients’ expectations
Wauben LSGL, et al. BMJ Innov 2015;0:1–8. doi:10.1136/bmjinnov-2015-000038
Copyright 2015 by All India Institute of Medical Sciences.
1
Downloaded from http://innovations.bmj.com/ on July 6, 2015 - Published by group.bmj.com
HEALTH IT, SYSTEMS AND PROCESS INNOVATIONS
on wait time should be met by means of providing
accurate information and realistic estimates of wait
times and steps in the patient’s journey.8 18 Data generated by RFID systems can be used to inform patients,
as well as staff, about their progress in the surgical
trajectory.
A first step to improve the efficiency of the surgical
trajectory and to improve patient satisfaction is to
acquire insight on the current patient and information
flow. Therefore, the objective of this study is threefold: (1) measure wait times for families and patients
undergoing eye surgery during surgical day care, (2)
characterise current information flow between staff
and patients, and between staff from different departments, and (3) define the requirements for a technological information system that manages the patient’s
journey.
METHODS
This study was conducted at the main surgical
centre (including four operating rooms—ORs) in the
Rotterdam Eye Hospital and was divided into three
parts: observations, RFID tracking and interviews.
Observations
Adult patients admitted for surgical day care were followed and observed during eight random weekdays.
Children (<18 years), emergency patients and clinical
patients (ie, patients who need to stay during the
night) were excluded. First, five adults were shadowed
to get an insight on the surgical day care trajectory.
Each patient went through 12 phases after registering
at the hospital, with each phase representing a specific
location: (1) waiting room, (2) intake room, (3)
waiting room, (4) dressing room, (5) (day) ward I,
(6) holding, (7) OR, (8) recovery, (9) (day) ward I or
II, (10) dressing room, (11) waiting room and (12)
checkout room. At nine phases (excluding the waiting
room), actions were performed by staff or patients
(eg, changing clothes, handover, time-out, administering medication, performing surgery). Duration of
actions performed at these nine phases was recorded
by two researchers (one stationed at the ward and one
at the surgical centre). No identifiable patient data or
data on the surgical procedure were collected; information was collected only on the type of anaesthesia
used, and the time of arrival and departure at the OR.
The latter were obtained from the hospital information system (these times are manually recorded by the
nurse anaesthetist at the OR).
Patients were grouped based on the type of anaesthesia administered: general anaesthesia (GA) versus
local or topical anaesthesia (LTA) as the type of anaesthesia especially influences the recovery in the postoperative phases (recovery and postoperative ward).
Durations of actions performed at the ward ( preoperative and postoperative), holding, OR and recovery were calculated.
RFID tracking
RFID technology was used to automatically track the
patient’s location and measure the length of stay
per phase. Adult patients admitted for surgical day
care were tracked during 52 successive weekdays
using active RFID technology. Again, children, emergency patients and clinical patients were excluded.
The active RFID tag ( pulse rate 0.8, frequency
433.92 MHz, power 1 mW, weight 24 g) was attached
to the patient’s wristband (see figure 1A), and was
tracked by readers which were placed at eight locations
shown in figure 1B. The readers (GW3D, RePoint, the
Netherlands) and controllers (to store the data locally)
were integrated in the ceiling and connected to the
hospital’s existing wired network. The location of the
tags was determined by its signal strength as multiple
nearby readers could detect the signal. Rough data
were pushed and stored at the stand-alone server (Dell
OptiPlex 790) that was placed at the nursing station.
Figure 1 (A) Active RFID tag attached to the patient’s identification wrist band. (B) Layout of the surgical trajectory and location of
the RFID readers. RFID, Radio Frequency IDentification; OR, operating room.
2
Wauben LSGL, et al. BMJ Innov 2015;0:1–8. doi:10.1136/bmjinnov-2015-000038
Downloaded from http://innovations.bmj.com/ on July 6, 2015 - Published by group.bmj.com
In total, 198 patients were included in the observations (137 GA, 61 LTA). Table 1 shows the duration
Wauben LSGL, et al. BMJ Innov 2015;0:1–8. doi:10.1136/bmjinnov-2015-000038
00:17
00:13
00:27
00:01
00:16
00:18 (00:10)
00:13 (00:05)
00:30 (00:12)
00:01 (00:02)
00:18 (00:07)
45
58
61
61
41
00:04–00:58
00:03–00:23
00:08–4:19
00:01–00:56
00:07–00:40
00:14
00:11
00:54
00:17
00:19
00:16 (00:07)
00:11 (00:04)
1:00 (00:33)
00:16 (00:09)
00:20 (00:06)
Median
Average (SD)
*n=
Average (SD)
*n=
Day ward preoperative (eg, intake, change clothes, clinical actions)
107
Holding (eg, handover, time out, apply intravenous drip)
126
OR (ie, surgery)
137
Recovery (eg, wait to wake up, extubate, apply pain management)
132
Day ward postoperative (eg, clinical actions, change clothes, checkout meeting)
80
*Owing to manual tracking of multiple patients by one observer some patients were missed.
OR, operating room.
Observations
Phase/room (action)
RESULTS
Table 1 Observations: duration of actions [h:mm] per phase
Escorts accompanying patients, ward nurses and
nurses from the holding/recovery (=holding/recovery
nurses) were interviewed during the RFID tracking
part. We have chosen to interview the escorts instead
of the patients, as the latter have to wait during the
entire trajectory and we did not want to disturb the
patients. The escorts were interviewed 5–10 min after
the patient left the ward. Nurses were interviewed
during breaks or off-peak moments. One researcher
used a semistructured approach and asked open questions concerning: their previous experience with the
hospital, current information flow between staff and
patients/escorts, current information flow between
ward nurses and holding/recovery nurses (using the
current information systems), and their desired future
requirements. The interviews took a maximum of
15 min and notes were taken.
The current information system used at the ward is
a magnetic whiteboard, which is placed across the
registration desk. Coloured cards (male/female/child),
including name and type of anaesthesia, are placed in
different columns representing the different locations/
phases. When a patient moves to a different phase the
card is moved accordingly. The current information
system used at the holding and recovery is a printed
OR schedule on which the nurses mark the progress
of an individual patient using highlighters.
General anaesthesia (n=137, 69%)
Interviews
Median
Minimum–maximum
Local/topical anaesthesia (n=61, 31%)
Minimum–maximum
At the end of the research period, data were collected
and analysed.
Patients received the RFID tag at the registration
desk and the nurse at day ward (=ward nurse) collected the tag during the checkout meeting. After use,
the tags were cleaned with alcohol and could be used
again (on the same day) to track other patients. Again,
no patient data or data on the surgical procedure were
collected; only data on the type of anaesthesia, and
time of arrival and departure at the OR were collected. Patients were grouped based on the type of
anaesthesia (GA vs LTA).
Standard descriptive statistical methods were used
to generate length of hospital stay and length of stay
per phase (ie, preoperative ward, holding, OR, recovery and postoperative ward) using IBM SPSS Statistics
V.20 for Mac. Additionally, wait times per phase were
calculated. For the recovery and postoperative ward
‘wait-recovery time’ was calculated as wait time and
recovery time (recovering from surgery and anaesthesia) could not be separated. Mann-Whitney U tests
were performed to calculate significant differences in
wait times per phase between the two types of
anaesthesia.
00:07–1:08
00:05–00:26
00:09–1:19
00:00–00:12
00:05–00:35
HEALTH IT, SYSTEMS AND PROCESS INNOVATIONS
3
Downloaded from http://innovations.bmj.com/ on July 6, 2015 - Published by group.bmj.com
HEALTH IT, SYSTEMS AND PROCESS INNOVATIONS
of actions per phase. The average duration of actions
performed at the OR, recovery and postoperative day
ward took longer for GA than for LTA.
All patients followed the same trajectory along eight
locations. Based on this set trajectory, these locations
represented in figure 1B were selected for placement
of the readers for the RFID tracking part of this study.
RFID tracking
In total, 829 patients admitted for surgical day care
received a tag. However, 207 patients were excluded
as the tag was not detected by the reader in the OR
corridor (n=154), type of anaesthesia was unknown
(n=29), the patient did not wear or had removed the
tag (n=20), or the recorded OR time was less than a
minute (n=4) indicating a technical flaw. In total, 622
patients (=75.0%; 405 GA, 217 LTA) were included
in the analysis.
In line with hospital policy, patients were asked to
arrive and register an average of 2 h before the
planned surgery. Table 2 shows that in practice,
66.9% (n=271) of GA patients and 59.0% (n=128)
of LTA patients arrived early compared with the
Table 2
planned arrival time, on average 00:18 and 00:24
early, respectively.
Surgery performed under GA took between 00:17
and 3:59, an average of 1:05 (SD 00:33, median
00:57). Table 2 shows that surgery performed under
GA started late in most cases (n=312). Twelve first
case surgeries started more than 1 h late, which was
caused by adding patients to the OR schedule (n=3),
changing the order of patients (n=2), or for no specific reason (n=7). Surgery performed under LTA
took between 00:06 and 2:16 with an average of
00:35 (SD 00:17, median 00:31) and started late in
most cases (n=139). Six first case surgeries started
more than 1 h late, which was caused by adding
patients to the OR schedule (n=2) or for no given
specific reason (n=4).
On average, GA patients spent 7:01 in hospital and
LTA patients 4:17 (table 2). Figure 2 shows the wait
times and wait-recovery times per phase.
Mann-Whitney U tests showed significant differences
in wait times between GA and LTA at the preoperative
ward ( p=0.014), at the recovery ( p<0.001) and at
the postoperative ward ( p<0.001). No significant differences were found at the holding ( p=0.0496). For
Early and late: arrival of patients [h:mm:ss], time spent in the hospital, start of surgery and start of first surgery
General anaesthesia (n=405, 65%)
Local/topical anaesthesia (n=217, 35%)
Arrival patient
Early
Late
Early
Late
Average (SD)
Median
Maximum
Missing
n=271 (66.9%)
0:18:19 (0:18:28)
0:13:06
2:04:35
n=4 (1.0%)
n=130 (32.1%)
0:18:31 (0:19:55)
0:11:20
1:55:40
n=128 (59.0%)
0:23:43 (0:28:53)
0:18:06
4:09:57
n=1 (0.5%)
n=88 (40.5%)
0:21:47 (0:20:33)
0:13:50
1:22:39
General anaesthesia (n=405)
Local/topical anaesthesia (n=217)
Start surgery
Early
Late
Early
Late
Average (SD)
Median
Maximum
Missing
In time
n=83 (20.5%)
0:36:22 (0:47:33)
0:21:00
4:29:00
n=1 (0.3%)
n=9 (2.2%)
n=312 (77.0%)
0:34:25 (0:38:31)
0:21:00
4:49:00
n=73 (33.6%)
0:28:48 (0:32:31)
0:18:00
2:45:00
n=1 (0.5%)
n=4 (1.8%)
n=139 (64.1%)
0:40:27 (0:38:22)
0:33:00
3:15:00
General anaesthesia (n=128: 57 morning
schedule, 71 afternoon schedule)
Local/topical anaesthesia (n=54: 2 morning
schedule, 52 afternoon schedule)
Start first surgery
Early
Early
Over 5 min late
In time
n=18 (14.1%)
n=106 (82.8%)
n=99 (77.3%), median 0:17:00
n=4 (3.1%)
n=18 (33.3%)
n=33 (61.1%)
n=30 (55.6%), median 0:36:30
n=3 (5.6%)
Time spent in hospital
General anaesthesia (n=405)
Local/topical anaesthesia (n=217)
Average (SD)
Median
Minimum–maximum
7:01:01 (1:47:08)
6:46:30
1:50:30–14:25:37
4:16:39 (1:29:24)
3:54:28
1:21:28–10:49:55
4
Late
Late
Wauben LSGL, et al. BMJ Innov 2015;0:1–8. doi:10.1136/bmjinnov-2015-000038
Downloaded from http://innovations.bmj.com/ on July 6, 2015 - Published by group.bmj.com
HEALTH IT, SYSTEMS AND PROCESS INNOVATIONS
Figure 2 Boxplot summaries for wait time and wait-recovery time per phase (median, IQR, minimum and maximum values,
o=outlier, *=extreme case) and average, SD, median and number of patients not having to wait per phase.
GA patients the total percentage of wait and waitrecovery time during the entire hospital stay ranged
from 0% to 87.0% with an average of 68.2%. For
LTA patients, this ranged between 20.8% and 85.7%
with an average of 64%.
Interviews
In total, 30 escorts, 9 ward nurses (out of 15) and 8
holding/recovery nurses (out of 10) were interviewed.
Escorts
Most patients’ escorts (n=23) had previous experience with the hospital and all escorts felt comfortable
asking the nurse(s) questions. Although 13 escorts
noticed the whiteboard, only one used it. Eighteen
escorts received information on the duration of the
surgical procedure and the arrival time at the postoperative ward, and eight escorts received information
on what time to go home. In the future, most escorts
would like to be informed about: progress at the surgical centre (n=19), arrival time at the postoperative
ward (n=22) and general information about the surgical procedure (n=16). Twenty-one escorts would
prefer a public screen in the waiting room to a personal device to portray the progress information.
They did not have any privacy concerns related to this
Wauben LSGL, et al. BMJ Innov 2015;0:1–8. doi:10.1136/bmjinnov-2015-000038
public screen and did not mind their names being
visible to other patients and escorts.
Day ward nurses
Most problems experienced concerned the holding
asking the ward to bring a patient (n=7) or the recovery asking to pick up a patient (n=6). Furthermore,
nine nurses indicated that the whiteboard is not
updated regularly. In the future, they would like to be
informed (via a technological information system)
about: registration of the patient (n=7), intake
meeting conducted (n=9), patient ready for the
holding (n=8), patient ready to be picked up from the
recovery (n=8) and patient ready for checkout (n=8).
Holding/recovery nurses
Only few problems arose related to the patient flow
and the paper OR schedule: only one nurse indicated
that the schedule is not marked when a patient is
requested from the ward or has arrived at the recovery. The OR schedule is always marked when the
patient arrives at the holding. In the future, most
nurses would like to be informed (via a technological
information system) about: patient on their way to the
holding (n=7), and ward nurses on their way to pick
up the patient at the recovery (n=6). Six nurses also
indicated that a digital information system could
5
Downloaded from http://innovations.bmj.com/ on July 6, 2015 - Published by group.bmj.com
HEALTH IT, SYSTEMS AND PROCESS INNOVATIONS
replace the phone calls between the holding/recovery
and the ward.
DISCUSSION
This study showed that both observations and RFID
tracking are practical tools to measure wait times for
patients undergoing eye surgery during surgical day
care. However, using RFID has the advantage that
tracking and time recording are performed automatically and in real time. The results showed that wait
times were long; on average 66.7% of the entire hospital stay was wait and wait-recovery time, and most
patients had to wait in each phase of their surgical
journey.
Significant differences were found between GA and
LTA for wait times at the preoperative and postoperative ward, and at the recovery. No specific reason
could be found for the differences at the preoperative
ward; these were not caused by the outliers or by the
LTA patients arriving early. The difference in wait and
recovery time in the postoperative phase is largely
caused by the time to recover from surgery and anaesthesia (at the recovery and at the ward). Patients receiving LTA, basically do not need to recuperate at the
recovery and can go straight back to the ward. The
postoperative trajectory is expected to affect the
patient satisfaction less as here the patients and escorts
play an important role as indicated by themselves when
they are ready to leave the hospital.20
For patients, wait time starts once they arrive at the
hospital. From the moment the patients register until
the start of the surgery, the patients expect to wait the
indicated time (anticipated wait) or less: in this case an
average of 2 h, including the total time spent at the preoperative ward and at the holding. In this study, 69.5%
of patients (295 GA, 137 LTA) had to wait longer than
anticipated, which reduces patient satisfaction.5 8 The
longer wait was partly caused by patients arriving early,
surgery starting late, sporadic communication between
the ward nurses and the patients/escorts, and intermittent information exchange between the ward and the
surgical centre. The latter was supported by the observations and discussions with hospital’s management,
showing that currently most ward nurses experienced
information problems related to bringing and picking
up patients from the surgical centre. It also revealed
that the phone calls between the ward and the surgical
centre were redundant and disruptive for the ward
nurses (although they are so used to these disruptions
that they consider it as the normal way of working).
Furthermore, the ward nurses also found questions by
the escorts concerning the patient’s progress disruptive. Overall, this leaves the ward nurses less time to
perform their clinical tasks with concentration.
Real-time information about the patient flow can
support communication between departments concerning transfer of patients and can help nurses to
better anticipate and/or to automatically reschedule the
6
surgical procedure to limit long wait times. Providing
real-time realistic information about wait times and
providing reasons for delays could also improve patient
satisfaction with wait time.5 6 18 20 21 Shaikh et al22
have shown that most respondents would prefer a
display with a time tracker to provide information
about their wait time when visiting the emergency
department. A display, automatically presenting the
phase of the patient to the escorts and the estimated
wait times, could also reduce the number of questions
concerning the patient’s progress, stimulate active
involvement and actions of the patients/escorts (eg, go
to the intake room themselves without a nurse assisting
them) and reduce anxiety.13 20 22 Kim et al23 have
shown that mean wait times were shortened when
patients were automatically allocated to examination
rooms; this also increased workflow efficiency by
reducing staff effort and consequently, reducing
costs. However, automatic presentation of the patient’s
phase first requires a technological system. RFID technology is already used in the healthcare
domain12 13 15 16 18 19 23 and this study showed that
RFID is able to record and show real-time data on the
patient’s location and time spent in the different
phases. Although the technology can be designed in
such a way that its influence on daily routine is limited,
the organisation, its working routines and protocols
have to change as well.13 In order for such a system to
be used and adopted, the system should be designed by
actively involving staff in designing an intuitive and
simple system that relieves staff from redundant tasks,
and fits in with the particular context and
workflow.13 14 18 19 24 25
Patient Tracking System
Based on the results of this study, a ‘Patient Tracking
System’ was designed in close cooperation with the
ward nurses, patients/escorts and the hospital’s management. Figure 3 shows the user interface of the
Patient Tracking System that replaces the whiteboard at
the ward and the extra display that will be placed in
the waiting room. The Patient Tracking System automatically displays the phase in which a patient is in,
and in the near future, this system will also empower
patients by including predictions about, for example,
when the patient can get dressed to go to the holding
or when the patient can go home. The aim of the
Patient Tracking System is to provide transparency for
patients and staff into the surgical trajectory. The
Patient Tracking System is expected to reduce intermittent communication between departments, improve
the efficiency of the process between the ward and the
holding/recovery, reduce wait times, and improve
patient and staff satisfaction.
During this project, we also encountered some organisational and technical challenges. First, 84% of tags
were not returned and were lost, which is high compared to Stahl et al,16 who only lost 5% of tags.
Wauben LSGL, et al. BMJ Innov 2015;0:1–8. doi:10.1136/bmjinnov-2015-000038
Downloaded from http://innovations.bmj.com/ on July 6, 2015 - Published by group.bmj.com
HEALTH IT, SYSTEMS AND PROCESS INNOVATIONS
Figure 3 User interface of the Patient Tracking System. The patient cards include the patient’s name, the time a patient arrived in a
specific phase and a coloured dot representing the responsible ward nurse for that specific patient.
Potential reasons for this loss were inattentiveness of the
staff, unclear instructions to the staff, unawareness of
the costs and reuse of the tags, and the collection
process not being integrated into daily routines, protocols and checklists. Second, signals transmitted by the
tags were read through the walls or were not seen by the
reader in the OR corridor, which is a common problem
in RFID tracking.14 15 For the newly developed system,
using the tags as readers as well as transmitters solves
these problems. This increases the number of readers
and thereby, the accuracy and reliability of tracking.
This study was limited by excluding children, emergency patients and surgical procedural data. However,
we deliberately excluded these data as we wanted to
demonstrate the benefits of the RFID system first
without changing the current working routine too
much. Based on the results of this study, all patients’
routes have been standardised, enabling us to include
all patients. The tracking data were not yet used to
immediately improve the communication between the
departments or reduce wait times; it only provided
indirect information. However, the Patient Tracking
System, which is now implemented in the hospital, directly informs the patients and nursing staff. The next
Wauben LSGL, et al. BMJ Innov 2015;0:1–8. doi:10.1136/bmjinnov-2015-000038
step is to change routines, for example, by requesting
patients to arrive earlier than the 2 h prior to surgery
and ward nurses automatically collecting LTA patients
from the recovery once the patient enters this phase in
the Patient Tracking System.
Author affiliations
Department of BioMechanical Engineering, Faculty
of Mechanical, Delft University of Technology,
Maritime and Materials Engineering, Delft,
The Netherlands
2
Faculty of Industrial Design Engineering, Delft
University of Technology, Delft, The Netherlands
3
Rotterdam University of Applied Sciences, Research
Centre Innovations in Care, Rotterdam, The
Netherlands
4
Rotterdam Eye Hospital, Rotterdam Ophthalmic
Institute, Rotterdam, The Netherlands
5
Erasmus University Rotterdam, Institute of Health
Policy & Management, Rotterdam, The Netherlands
6
Singapore National Eye Centre, SingHealth,
Singapore, Singapore
7
Duke-NUS Graduate Medical School, Health
Services & Systems Research, Singapore, Singapore
1
7
Downloaded from http://innovations.bmj.com/ on July 6, 2015 - Published by group.bmj.com
HEALTH IT, SYSTEMS AND PROCESS INNOVATIONS
Acknowledgements The authors would like to thank Repoint
BV for providing the RFID hardware and the design of the user
interface of the Patient Tracking System, LMA Vankan, MSc, for
her assistance during the observations, and JV Sluiman, MSc,
for his assistance during the observations, interviews and the
design of the user interface of the Patient Tracking System.
Funding This work was supported by the ‘Provincie Zuid
Holland’, Project ID: CRZH101005.
12
13
Competing interests None.
Provenance and peer review Not commissioned; externally
peer reviewed.
14
REFERENCES
15
1 Keunen JE, Verezen CA, Imhof SM, et al. Increase in the
demand for eye-care services in the Netherlands 2010–2020.
Ned Tijdschr Geneeskd 2011;155:A3461.
2 Zheng YF, Cheng CY, Lamoureux EL, et al. How much eye
care services do Asian populations need? Projection from the
Singapore Epidemiology of Eye Disease (SEED) study. Invest
Ophthalmol Vis Sci 2013;54:2171–7.
3 Gollogly HE, Hodge DO, St Sauver JL, et al. Increasing
incidence of cataract surgery: population-based study.
J Cataract Refract Surg 2013;39:1383–9.
4 Harnett MJ, Correll DJ, Hurwitz S, et al. Improving efficiency
and patient satisfaction in a tertiary teaching hospital
preoperative clinic. Anesthesiology 2010;112:66–72.
5 DeLucia PR, Mork KS, Ott TE, et al. Measurement of the
relationship between patient wait time and patient satisfaction
at each stage of an appointment. 51st Annual Meeting of the
Human Factors and Ergonomics Society, HFES 2007.
Baltimore, MD, 2007.
6 Buetow S. Patient experience of time duration: strategies for
‘slowing time’ and ‘accelerating time’ in general practices.
J Eval Clin Pract 2004;10:21–5.
7 Aiken LH, Sermeus W, Van den Heede K, et al. Patient safety,
satisfaction, and quality of hospital care: cross sectional surveys
of nurses and patients in 12 countries in Europe and the
United States. BMJ 2012;344:e1717.
8 Thompson DA, Yarnold PR, Williams DR, et al. Effects of
actual waiting time, perceived waiting time, information
delivery, and expressive quality on patient satisfaction in the
emergency department. Ann Emerg Med 1996;28:657–65.
9 Sieber TJ, Leibundgut DL. Operating room management and
strategies in Switzerland: results of a survey. Eur J Anaesthesiol
2002;19:415–23.
10 Nederlandse Vereniging van Ziekenhuizen. Gezonde Zorg:
Brancherapport Algemene Ziekenhuizen 2012, 2012.
11 van Veen-Berkx E, Elkhuizen SG, Kalkman CJ, et al. Successful
interventions to reduce first-case tardiness in Dutch university
8
16
17
18
19
20
21
22
23
24
25
medical centers: results of a nationwide operating room
benchmark study. Am J Surg 2014;207:949–59.
Yao W, Chu CH, Li Z. The adoption and implementation of
RFID technologies in healthcare: a literature review. J Med Syst
2012;36:3507–25.
Ting SL, Kwok SK, Tsang AH, et al. Critical elements and
lessons learnt from the implementation of an RFID-enabled
healthcare management system in a medical organization.
J Med Syst 2011;35:657–69.
Fisher JA, Monahan T. Evaluation of real-time location
systems in their hospital contexts. Int J Med Inform
2012;81:705–12.
Liu CC, Chang CH, Su MC, et al. RFID-initiated workflow
control to facilitate patient safety and utilization efficiency in
operation theater. Comput Methods Programs Biomed
2011;104:435–42.
Stahl JE, Holt JK, Gagliano NJ. Understanding performance
and behavior of tightly coupled outpatient systems using RFID:
initial experience. J Med Syst 2011;35:291–7.
Norten A. Predicting nurses’ acceptance of radiofrequency
identification technology. Comput Inform Nurs
2012;30:531–7.
Kamel Boulos MN, Berry G. Real-time locating systems (RTLS)
in healthcare: a condensed primer. Int J Health Geogr
2012;11:25.
Martínez Pérez M, Cabrero-Canosa M, Vizoso Hermida J,
et al. Application of RFID technology in patient tracking and
medication traceability in emergency care. J Med Syst
2012;36:3983–93.
Freeman K, Denham SA. Improving patient satisfaction by
addressing same day surgery wait times. J Perianesth Nurs
2008;23:387–93.
Johnson MB, Castillo EM, Harley J, et al. Impact of patient
and family communication in a pediatric emergency
department on likelihood to recommend. Pediatr Emerg Care
2012;28:243–6.
Shaikh SB, Witting MD, Winters ME, et al. Support for a
waiting room time tracker: a survey of patients waiting in an
urban ED. J Emerg Med 2013;44:225–9.
Kim JY, Lee HJ, Byeon NS, et al. Development and impact of
radio-frequency identification-based workflow management in
health promotion center: using interrupted time-series analysis.
IEEE Trans Inf Technol Biomed 2010;14:935–40. .
Greenhalgh T, Robert G, Macfarlane F, et al. Diffusion of
innovations in service organizations: systematic review and
recommendations. Milbank Q 2004;82:581–629.
Lorenzi NM, Novak LL, Weiss JB, et al. Crossing the
implementation chasm: a proposal for bold action. J Am Med
Inform Assoc 2008;15:290–6.
Wauben LSGL, et al. BMJ Innov 2015;0:1–8. doi:10.1136/bmjinnov-2015-000038
Downloaded from http://innovations.bmj.com/ on July 6, 2015 - Published by group.bmj.com
Tracking surgical day care patients using
RFID technology
L S G L Wauben, A C P Guédon, D F de Korne and J J van den
Dobbelsteen
BMJ Innov published online April 3, 2015
Updated information and services can be found at:
http://innovations.bmj.com/content/early/2015/04/03/bmjinnov-2015000038
These include:
References
Email alerting
service
Topic
Collections
This article cites 23 articles, 3 of which you can access for free at:
http://innovations.bmj.com/content/early/2015/04/03/bmjinnov-2015000038#BIBL
Receive free email alerts when new articles cite this article. Sign up in the
box at the top right corner of the online article.
Articles on similar topics can be found in the following collections
Other anaesthesia (1)
Health IT, systems and process innovations (3)
Notes
To request permissions go to:
http://group.bmj.com/group/rights-licensing/permissions
To order reprints go to:
http://journals.bmj.com/cgi/reprintform
To subscribe to BMJ go to:
http://group.bmj.com/subscribe/


© Copyright 2026