ABC
docz
Explore
Log in
Create new account
Download
Report
business and industrial
company
annual report
2014 annual report - Investors & Media
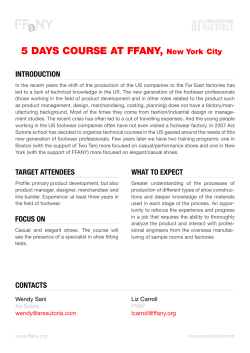
5 DAYS COURSE AT FFANY, New York City
- Forensic ITC Services
important!
Document 266688
Document 166033
HOME SWEET HANDMADE
Independent Bank Group, Inc. Announces Q4 & Year
0 – Ministry of Economy, 2014 © Republic of Turkey
LEONARDO DA VINCI PATTERN MAKING AN EDITORIAL CONCEPT OF THE
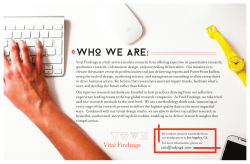
Who We Are:
© Copyright 2026
About abcdocz
DMCA / GDPR
Report