
COMMUNITY HEALTH ASSESSMENT
NASSAU COUNTY COMMUNITY HEALTH ASSESSMENT 2005-2010 (Revised May, 2007) Healthy Births The Face of AIDS The Face of AIDS Today Seeking Solutions Childhood Obesity Lead Abatement THOMAS R. SUOZZI ABBY J. GREENBERG, MD COUNTY EXECUTIVE ACTING COMMISSIONER OF HEALTH Contents Page List of Figures and Tables....................................................................................................................... iv Introduction Executive Summary.......................................................................................................................... vi Focus on Disparities................................................................................................................ vii Section One – Populations at Risk ......................................................................................................... 1 A. Demographics ............................................................................................................................ (a) History and Geography ................................................................................................. (b) Population Size and Characteristics ............................................................................. (c) Race and Ethnicity ........................................................................................................ (d) Age and Sex.................................................................................................................. (e) Income, Employment, Educational Attainment, Housing.............................................. 1 1 1 1 2 3 B. Health Status 1) Births.................................................................................................................................... (a) Prenatal Care, Low Birthweight .................................................................................... (b) Infant Deaths................................................................................................................. (c) Focus on Teen Pregnancy and Births ...................................................................... 4 4 5 6 2) Early Childhood ................................................................................................................... 7 (a) Immunization, Asthma .................................................................................................. 7 (b) Focus on Lead Poisoning .......................................................................................... 8 (c) Childhood Obesity......................................................................................................... 9 (d) Oral Health .................................................................................................................... 10 3) Adults................................................................................................................................... 11 (a) Communicable Disease, Tuberculosis.......................................................................... 11 (b) STD’s ............................................................................................................................ 12 (c) Focus on HIV/AIDS...................................................................................................... 13 (d) Injury ............................................................................................................................. 15 (e) Cancer........................................................................................................................... 16 (f) Focus on Aging ........................................................................................................... 17 4) Health Behaviors ................................................................................................................. 19 (a) Leading Causes of Death ............................................................................................. 19 (b) Smoking and Tobacco, Obesity .................................................................................... 21 C. Access to Care........................................................................................................................... 23 D. Local Health Care Environment ................................................................................................. 25 Section Two – Local Public Health System Capacity Profile .................................................................. 27 Section Three – Problems and Issues in the Community....................................................................... 29 Section Four – Local Public Health Priorities.......................................................................................... 31 Section Five – Opportunities for Action................................................................................................... 33 References .............................................................................................................................................. 36 ii Appendices ............................................................................................................................................. 37 Appendix 1 – Demographics .......................................................................................................... 38 Appendix 2 – Births ....................................................................................................................... 49 Appendix 3 – Teen Pregnancy and Family Planning ..................................................................... 56 Appendix 4 – Early Childhood ........................................................................................................ 63 Appendix 5 – Adults and Health Behaviors .................................................................................... 69 Appendix 6 – Local Public Health System...................................................................................... 86 Appendix 7 – Community Health Assessment Indicators .............................................................. 99 Appendix 8 – New York State Department of Health Data Resources .......................................... 112 Appendix 9 – New York State Partner Data Resources ................................................................ 113 Appendix 10 – National Public Health Data Resources .................................................................. 114 Appendix 11 – Glossary ................................................................................................................... 116 Appendix 12 – Comments and Suggestions Form........................................................................... 120 Disclaimer................................................................................................................................................ 121 Nassau County Map........................................................................................................ Inside Back Cover iii List of Figures and Tables Page FIGURES Figure Figure Figure Figure Figure 1 – Nassau County Residents, by Race and Hispanic Origin, 1960-2000 (Chart).................... 2 2 – Comparison of Age, Nassau County, NYS and US, 2000 (Chart) ...................................... 2 3 – Nassau County Residents, by Age, 2000 (Graph) .............................................................. 3 4 – Trend in Early Prenatal Care in Nassau County, by Mother’s Age, 1993-2002 (Graph)..... 4 5 – Percentage of Low Birthweight Births (<2500 Grams) in Nassau County, by Race and Hispanic Origin, 1993-2002 (Graph) .................................................................................... 4 Figure 6 – Infant Deaths in Nassau County, by Race and Hispanic Origin, 1993-2002 (Graph) ......... 5 Figure 7 – Infant Death Rates, by Community, 2000-2002 (Map) ........................................................ 5 Figure 8 – Teen Birth Rates, by Selected Communities, in Nassau County, 1993-2002 (Chart)......... 6 Figure 9 – Percent of Children That Meet Recommended Standard of Immunization in Nassau County, 1997-2004 (Chart) ................................................................................. 7 Figure 10 – Incidence Rates of Elevated Lead Levels (>10ug/dl), Selected Communities vs. Rest of County, 1997-2001 (Graph)................................................................................................. 8 Figure 11 – Percent Overweight WIC Children (Age 2-5) in Nassau County, by Race and Hispanic Origin, 1997-2003 (Chart)..................................................................................... 9 Figure 12 – Tuberculosis Case Rates in Nassau County, by Race and Hispanic Origin, 1992-2004 (Chart) ............................................................................................................... 11 Figure 13 – Chlamydia and Gonorrhea Rates, Nassau County vs. Upstate NY, 1994-2003 (Graph) ... 12 Figure 14 – Number of Early Syphilis Cases, by Sex, Nassau County, 1992-2004 (Chart)................... 12 Figure 15 – AIDS Incidence and Death Rates, Nassau County, 1982-2003 (Graph) ............................ 13 Figure 16 – Rates of Women Diagnosed with AIDS in Nassau County, by Race and Hispanic Origin, 1982-2003 (Graph) ................................................................................... 13 Figure 17 – Presumed Living with AIDS and HIV, Nassau County, As of December 31, 2003 (Map)... 14 Figure 18 – Proportion of Injury Deaths (by Age) in Nassau County, 1992-2000 (Graph)..................... 15 Figure 19 – Cancer Deaths in Females, Nassau County, 1976-2001 (Graph)....................................... 17 Figure 20 – Senior Population Projections, by Age Group, Nassau County, 2000-2015 (Chart)........... 18 Figure 21 – Disability Status, 65 Year and Older Population, Nassau County, 2000 (Chart) ................ 18 Figure 22 – Age-Adjusted Death Rates in Nassau County, by Race and Hispanic Origin, 1994-2002 (Graph) ................................................................................... 19 Figure 23 – Leading Causes of Death, by Race and Hispanic Origin, Nassau County, 2002 (Chart)......................................................................................................................... 20 Figure 24 – Leading Causes of Death vs. Actual Causes of Death, United States, 2000 (Chart) ......... 20 Figure 25 – 2003 Admissions to Alcohol and Drug Treatment Programs, Nassau County, by Resident Zip Code (Map)................................................................................................ 21 Figure 26 – Components of the Local Public Health System (Chart) ..................................................... 27 TABLES Table Table Table Table 1 – 2003 Median Household Income (Top 15 Counties in the U.S.) .......................................... 3 2 – Nassau County Birth Profile (2002) ...................................................................................... 4 3 – Oral Health of 3rd Graders, Nassau County vs. New York State, 2002-2004....................... 10 4 – Annual Sex and Age-Adjusted Cancer Incidence and Mortality Rates, Nassau County vs. Upstate NY, by Race, 1997-2001.......................................................... 16 Table 5 – 60+ Population in Nassau County, by Race and Hispanic Origin, 1990-2000 (Table)......... 18 Table 6 – 2002 Death Rates, by Rank (Age-adjusted to the U.S. 2000 Standard Population) ............ 19 iv INTRODUCTION Executive Summary This year’s Community Health Assessment has been reorganized and reformatted, first to be more readable, and second, to clearly identify what we believe to be the most important public health issues. We have also used color graphics and geographical information system (GIS) mapping for the first time. We have placed the complete report on our web site: (www.nassaucountyny.gov/ official/ county/agencies/Health), where we have included additional features including health reports on the county’s three towns and two cities. In the coming months and years we hope to add additional detailed community level health data, because in Nassau County, the most important public health issues are best understood and tackled at the community or neighborhood level. This is a report on the health of the County, but it is in fact several reports. It is, of course, a study of the County’s 1.3 million persons in aggregate, and at this level Nassau is very healthy. For many important measures we are at historic lows (tuberculosis, measles) or highs (childhood vaccination coverage), and meet or exceed national Healthy People 2010 goals. If we look beyond health measures, we see similar success in areas such as education, income and public safety. However, there are substantial differences between the County as a whole and communities that contain its neediest residents. The health of these “selected” communities of Freeport, Hempstead Village, Inwood, Long Beach, Roosevelt and Uniondale, Westbury is poorer by almost every measure currently available. One community, Roosevelt, has the highest rates of AIDS, teenage pregnancy and sexually transmitted disease in the County, and among the highest in the state. Notes on Methods and Data Sources: The report makes use of standard assessment practices of collecting, organizing, analyzing and/or interpreting data to develop concise presentations, sometimes in graphic statistical formats, to bring clarity to each topic. The overall goal of the report is to assist in setting identifiable public health priorities, establishing goals, setting strategy, determining opportunities and measuring progress. There are also differences in health status based on race and ethnicity. Infant mortality, cancer mortality and homicide rates are much higher for blacks than whites. Latinos have higher rates of teen pregnancies, tuberculosis and deaths from injuries. The causes of these disparities are numerous and complex, and include differences in income, education, housing, access to health care, as well as racism. Reducing or eliminating these disparities is one of the most important national and local public health goals. The report is based primarily on data sets from the New York State Department of Health, including the Bureau of Biometrics (Vital Statistics), Statewide Planning and Research Cooperative System (SPARCS), and disease registries for cancer, communicable disease, tuberculosis, AIDS/HIV and STD’s. It also uses data from the New York State Department of Labor, New York State Office of Alcohol and Substance Abuse Services (OASAS), Behavioral Risk Factor Surveillance System (BRFSS) and the U.S. Census Bureau This is also a report on priorities, goals and opportunities. Some are clearly evident in the tables and graphs: arresting the nascent rise in syphilis among men who have sex with men; reducing teen pregnancy (almost always unplanned); reducing rates of new HIV infection in minority women; and continuing efforts to reduce smoking and prevent non-smokers from starting. Other priorities have been identified at community forums, or in discussions with community leaders. These include improving access to care for the poor and uninsured and strengthening the public health capacity to respond to emergencies, (including bioterrorism). In each of these areas, we have identified opportunities, not only for the local health department (LHD), but also for the many public and private agencies, health care providers, and community-based organizations that comprise our public health system. Selected Communities are defined as those zip codes that were identified (using the NYSDOH AIDS Institute Community Need Index, NYS Perinatal Risk Assessment Indicators, the U.S. Census, data from the NYSDOH, NCDOH and NCDSS) to have disproportionately higher rates for many diseases and have adverse social and economic conditions. More information regarding sources and definitions can be found in the Glossary and Resources sections of the Appendix. vi Executive Summary FOCUS ON DISPARITIES There are substantial health disparities and inequities between racial and ethnic groups, and in different communities in Nassau County. Minority groups bear a disproportionate burden of illness and premature death. • The difference in the infant death rate is decreasing but is still substantial. In 1993 it was 4 times greater in nonHispanic blacks compared to non-Hispanic whites and in 2002 it was 2 times greater. • The estimated prevalence of HIV in blacks is over 20 times greater than whites and 3.5 times greater in Hispanics than whites. • On average, from 1982-2003 when compared to white women, the rate of AIDS diagnosed in black women was 13 times greater and 2 times greater in Hispanic women compared to white women. The rate in black men was 6 times greater and 1.5 times greater in Hispanic men then when compared to white men. • The average homicide mortality rate from 1999-2002 in blacks was nearly 9 times greater than for whites. Likewise, a disproportionate burden of illness and premature death is concentrated in certain communities. • Infant death rates in the selected communities have been more than twice that of the rest of the county since 1980. • The rate of Chlamydia infection in the selected communities is rising and in 2004 was more than 3 times the rate in the rest of the county. • Although the disparity in the rate of gonorrhea has decreased, in 2004 the selected communities had rates 3 times greater than the rest of the county. • The rate of HIV/AIDS is 4 times greater in the selected communities compared to the rest of the county. • The average asthma discharge rate for 2000-2002 in young children (age 0 to 4) was 2.5 times greater in the selected communities (excluding Long Beach) compared to Nassau County as a whole. • In 2000 the diabetes discharge rate in the selected communities on average was over 1.5 times greater compared to Nassau County as a whole. • The overall 5-year incidence trend of childhood lead poisoning is decreasing; however the average incidence rate is double in the selected communities compared to the rest of the county. Social and economic factors associated with poorer healthcare are more common in the selected communities and among racial/ethnic minorities. • The average household median income is on average 22% less in the selected communities compared to the rest of the county. • In Nassau County, the selected communities rank as the top seven communities requiring public assistance. • 6 of the 7 selected communities rank high on the Community Need Index (see Appendix: Exhibit 1DEM 9) and are designated as high risk for adverse perinatal outcomes (see Appendix: Exhibit 1DEM 10). On average, from 1993-2002: • The percentage of black and Hispanic women initiating early prenatal care was 25% and 23% less than non-Hispanic white women, respectively. • In the “rest of the County”, the percentage of women initiating early prenatal care is 23% greater than those living in the selected communities. • The percentage of low birth weight births to black women is more than twice that of non-Hispanic whites and Hispanics. HEALTH DISPARITIES BY RACE, 2002 WHITE Life Expectancy All Causes of Death (Mortality)* All Male Female All Male Female Cardiovascular Mortality* Cancer Mortality (All Cancer Sites)* AIDS Mortality* Homicide Mortality* Infant Mortality†** 79.6 77.2 81.8 744.8 887.6 641.7 299.1 181.9 1.3 1.5 3.7 BLACK 75.7 72.0 78.5 973.0 1238.2 826.2 386.2 196.8 13.4 14.1 12.2 ALL RACES 79.6 77.2 81.8 743.0 886.2 641.8 299.6 177.6 3.6† NA 4.8 PROPORTIONAL DIFFERENCE (BLACK vs. WHITE) 1.0 0.9 1.0 1.3 1.4 1.3 1.3 1.1 10.6 9.4 3.3 *Rates per 100,000 population age adjusted to the 2000 US standard population. **Rate per 1,000 live births. †Crude rate. vii NASSAU COUNTY DEPARTMENT OF HEALTH COMMUNITY HEALTH ASSESSMENT 2005 – 2010 Section I - POPULATIONS AT RISK DEMOGRAPHICS Brief History by 13.1% and the population of the United States increased by 57%. While there has been some fluctuation in the County population during the forty year period (e.g., in 1970, the resident total climbed to 1,428,080 and in 1990 there was a decline to 1,287,348); the 2000 recorded census is a return to the 1960 level. Nassau County’s origin can be traced back as far as 1643 when settlers from New England crossed the Long Island Sound to seek more land. Forty years later, New York State was divided into 12 counties. Long Island was made up of three of these (Kings, Queens and Suffolk). Queens County included western Long Island and two towns, which would eventually become Nassau County (Hempstead and Oyster Bay). During the American Revolutionary War, pro-revolutionists split from royalists in Hempstead to form the Town of North Hempstead. The decision in 1898, by the three towns, to secede from Queens County led to the founding of Nassau County on January 1, 1899. In 1910, the city of Glen Cove seceded from the Town of Oyster Bay and in 1922, the City of Long Beach followed suit by seceding from the 1 Town of Hempstead . Population Characteristics Nassau County is undergoing a rapid demographic shift, even as the total population has remained the same. The population is significantly older than it was twenty or even ten years ago, and it is becoming far more ethnically, racially and economically diverse. While the County ranks among the top 15 counties in the nation in terms of median household income 3 , the difference between affluent and poorer communities is pronounced (see Appendix: Exhibit 1DEM 8). Geography Race and Hispanic Origin Nassau County is made up of five subdivisions, which include three towns (Hempstead, North Hempstead and Oyster Bay) and two cities (Glen Cove and Long Beach). It lies between Queens County, a borough of New York City, on the west; and Suffolk County on the east. The county has a total area of 453 square miles. Almost 37% of the County, or 166 square miles, is water. In 1960, when the U.S. Census began to classify race, blacks accounted for 3.3% of the total population and whites for 96.7%. By 2000, the non-white population had increased to 20.7% of the total, (blacks 10.1%, Asians 4.7% and “Other” was 5.9%). Individuals of Hispanic origin (of any race) accounted for 10.0% of the population. In the 40 years between 1960 and 2000, the number of white residents decreased by almost 200,000 or 15.9% (Figure 1), while the number of blacks increased from 42,320 to 134,673 (218%). In 1980 (the first census to record Hispanic origin) the number of persons of Hispanic origin in the County was 43,286. By 2000, twenty years later, that number had more than tripled to 133,282. The Asian population increased as well, from 40,941 in 1990 to 63,130 in 2000. Twenty-three percent of the population speaks a primary language other than English in the home. Population Size In 2000, there were 1,334,544 people, 447,387 households, and 347,172 families living in Nassau County, making it more populated than 10 U.S. states 2 . It is the 27th largest county in the nation and the sixth largest county in New York State. The size of the County’s population has remained at the same level since 1960. Over the same period, New York State’s population increased 1 Figure 1 NASSAU COUNTY RESIDENTS BY RACE & HISPANIC ORIGIN 1960-2000 Race is White, Black, Asian and Other. Other includes race not stated. Hispanic is counted separately from race. In 1960, White included all categories except Black. Source: U.S. Census 2000 Age and Sex increased to 38. Seniors (aged 65 years and older) increased by 148% (80,847 to 200,841). Nassau County’s population is older than either New York State or the U.S. on a whole. Fifteen percent of the residents of the County were aged 65 years and older, compared to 12.9% for New York State and 12.4% for the U.S (Figures 2 and 3). The number of elder seniors (85 year and over) increased from 3,560 to 22,209 (524%). In 1960, half of the County’s population was under 30 years old but by 2000, the median age had Figure 2 COMPARISON BY AGE NASSAU COUNTY, NYS & U.S. 2000 In 1990, women outnumbered men in the total population by 7.0% (692,227 females vs. 642,317 males). Within the black population, the number of women exceeded that of men by 17.4% (59,969 vs. 51,088 males). By contrast, men of Hispanic origin outnumber their female counterparts by 4.1% (39,984 males vs. 38,422 females). By 2000, there were 7.8% more women than men living in Nassau County, largely due to an increase in the number of Source: U.S. Census 2000 2 NUMBER (in thousands) Figure 3 YEAR Source: U.S. Census, 1960, 1970, 1980, 1990 and 2000. African American women versus their male counterparts (73,484 vs. 61,189, respectively). (See Appendix: Exhibits 1DEM 5, 6 and 7.) $43,393. In New York State, the 2003 median household income was $43,464 and in the U.S it was $46,195. Income The 2000 Census indicated that 5.2% of County residents (68,631, up from 12,936 or 3.6% in 1980) live below the federally designated poverty level ($18,400). 5 The median household income (in 2003 inflationadjusted dollars)4 in Nassau County was $80,647, placing it in the top ranking counties (6/3219) in the US and Puerto Rico (Table 1). The median household income has almost doubled since 1990, when it was Employment In February 2005, there were 650,500 people employed and 30,000 (4.4%) unemployed in Nassau County. Suffolk County, New York State and the United States had unemployment percentages of 4.8%, 5.6% and 5.8%, respectively 6 in February 2005. Table 1 2003 MEDIAN HOUSEHOLD INCOME (Top 15 Counties in the U. S.) Median Geographic Area Household Income Somerset County, N J 89,289 Howard County, MD 88,555 Prince William County, VA 82,926 Morris County, NJ 82,025 Fairfax County, VA 80,753 Nassau County, NY 80,647 Santa Clara County, CA 76,544 Montgomery County, MD 76,439 Rockland County, NY 72,276 Collin County, TX 71,458 McHenry County, IL 70,956 Suffolk County, NY 70,281 Fairfield County, CT 70,083 Fort Bend County, TX 69,848 Contra Costa County, CA 69,835 Source: U.S. Census American Community Survey Educational Attainment The percentage of high school graduates in Nassau County increased marginally from 84% in 1990 to 86.7%, in 2000. Residents with bachelor's degrees grew from 30% to 35.4% in Nassau County in the same time period. By comparison, 27.4% of New York State residents had bachelor's degrees or higher. Rank 1 2 3 4 5 6 7 8 9 10 11 12 13 14 15 Housing There are 447,387 households and 347,172 families living in 458,151 housing units in Nassau County (compared to 423,795, 355,437 and 434,151, respectively, in 1980). The housing density is 1,598 housing units per square mile. Fully, 73% (327,134) of the County’s housing units were built prior to 1960. 3 HEALTH STATUS BIRTHS Assuring the health of mothers and infants is significant to the public health mission. Infant mortality is one of the most important indicators of a population's health and one for which there are substantial social disparities. Low birthweight, poor nutrition and tobacco/substance abuse are independent risk factors for infant deaths and other adverse outcomes. Unintended pregnancies are also more likely to have poor outcomes. Figure4 4 Figure TREND IN EARLY PRENATAL CARE BY MOTHER’S AGE NASSAU COUNTY 1993-2002 Table 2 Age < 20 NASSAU COUNTY BIRTH PROFILE Age ≥ 20 (2002) Nassau County U.S. Birth rate* 12.1 13.9 Fertility rate** 61.2 64.8 Low birthweight (<2500 grams) 7.6% 7.8% ***Early prenatal care 86.9% 83.7% 18.3% 34.0% Characteristic Births to unmarried mothers *Births per 1,000 population. ***Beginning in 1st trimester. Source: New York State Department of Health While there has been some improvement since 1993, only 56% of all women under 20, regardless of race or ethnicity, sought prenatal care in the 1st trimester (Figure 4). **Births per 1,000 women aged 15-44. Low Birthweight Prenatal Care Low birthweight infants are those who weigh less than 2,500 grams (5.5 lbs.) at birth. The Nassau rate (7.6%) is about the same as the State (7.8%) and the nation (7.8%) in 2002, but greater than Healthy People 2010 objective (5.0%). Black women and teenagers are at greater risk of having low birthweight babies than other women (Figure 5). In 2002, almost 85 women out of 100 began their prenatal care in the 1st trimester (see Appendix: 2BIR 2). Among white, non-Hispanic women the number who sought care was 87 out of 100. Black, non-Hispanic and women of Hispanic origin are at 72% and 73%, respectively, (see Appendix: 2BIR 1). Figure 5 PERCENTAGE OF LOW BIRTHWEIGHT BIRTHS (<2500 GRAMS) IN NASSAU COUNTY BY RACE AND HISPANIC ORIGIN 1993-2002 4 Figure 7 Infant Deaths INFANT DEATH RATES* BY COMMUNITY 2000-2002 In 2002 the infant death rate for Nassau County fell below the healthy people 2010 objective of 5.0 per 1,000 live births to 4.8. However, the rate for black non-Hispanics remains high (12.8). It exceeds that of white non-Hispanics (3.4) by almost four times and doubles that of Hispanics (6.3), (Figure 6). Figure 7 shows the infant death rate by community. Infant death rates tend to be higher in the communities with greater numbers of black non-Hispanics, or the selected communities, (see Appendix: Exhibit 1DEM 8 and 10). *Rates per 1,000 Live Births 0–5 6–9 10 – 14 15 – 18 Hispanic women have birth outcomes comparable to white women despite being younger, poorer, less educated, and having less access to medical care. This “Hispanic paradox” in birth outcomes is not fully understood but may be related to better nutrition, less smoking and cultural factors related to community and family support. Source: New York State Department of Health Figure 6 INFANT DEATHS IN NASSAU COUNTY BY RACE AND HISPANIC ORIGIN 1993-2002 5 FOCUS ON Teen Pregnancy and Births Adolescent sexual activity is extremely common. Nationally, two thirds of high school students reported having had sexual intercourse by the time they finished twelfth grade. This puts many teenage girls at high risk for unintended pregnancy and sexually transmitted infections, including HIV. Adolescent pregnancy and childbearing decreases the likelihood of completing high school, reduces employment opportunities and increases poverty and poor health outcomes for mother and child. In Nassau County, there have been substantial reductions in teen pregnancies and births. Over a twenty year period from 1982 to 2002, the teen pregnancy rate decreased 51% (62.1 to 30.3) and in the past ten years the birth rate decreased 26% (18.4 to 13.7) (see Appendix: Exhibit 3TPFP 4). Abortions decreased 73%, but still account for 52% of all teen pregnancies. While overall teen pregnancy and birth rates have declined, there are substantial racial, ethnic and socioeconomic differences in teen pregnancies and births in Nassau County. Teen birth rates are much higher in low-income communities and among minorities. The teen birth rate in the select communities was 44.9 per 1,000 teens in 2002 compared to 6.1 for the rest of the county (Figure 8). Teen pregnancy rates in 2002 were 76.2 in blacks, 67.8 in Hispanics and 21.5 in whites. In 2002, the birth rate in black teens was 35.4, in Hispanics 46.1 and whites 12.1. Teens in general are less likely to receive adequate prenatal care. Low birthweight, the greatest single risk factor for infant death, is highest in low-income communities and among teens. The health and social implications of teen pregnancy are far-reaching. Teens are more likely to be diagnosed with a STD during pregnancy and their babies are more likely to be hospitalized and have childhood health problems. Later in life these children are at a higher risk for child abuse and for low educational and vocational achievement. Teen mothers are less likely to complete high school and more likely to have fewer employment prospects. Figure 8 RATE (per 1,000 age 15-19 year women) TEEN BIRTH RATES* BY SELECTED COMMUNITIES IN NASSAU COUNTY 1993-2002 Selected Communities 60 Rest of County 50 Nassau County 40 30 20 10 0 1993 1994 1995 1996 1997 1998 1999 YEAR *Annual number of live births to women aged 15-19 per 1,000 female population aged 15-19. Source: New York State Department of Health Vital Statistics. 6 2000 2001 2002 HEALTH STATUS EARLY CHILDHOOD Immunization connection. According to the CDC, the risks of thimerosal in vaccines have not been scientifically proven, whereas the risks of not vaccinating children on time are significant. Use of thimerosal in the production of vaccines has diminished; and “with the exception of some influenza vaccine, none of the vaccines used to protect preschool children against 12 infectious diseases contain more than trace amounts of thimerosal.”7 Nassau County has very high immunization rates, even with the growing complexity of the recommended schedule (Figure 9). The County has almost no recorded cases of vaccine preventable disease (VPD) (see Appendix: Exhibit 4EC 3). Pertussis is the only VPD growing in prevalence, but this reflects change in diagnostic tests and surveillance. As a result of a change made in 2003 by the New York State Department of Health requesting that probable cases of pertussis be reported, the number of cases has increased reflecting probable and confirmed cases of pertussis. Asthma In the 2003 Behavioral Risk Factor Surveillance System (BRFSS) survey, it was estimated that 16.4% of children in Nassau County households have been diagnosed with asthma and 11.8% had asthma at the time of the survey. Using hospitalizations as an indicator, it appears that asthma impacts the 0-4 year age group most severely. Hospitalizations for children between ages 0-4 averaged 400 per year for a rate of 33.5 per 10,000 population (compared to 55.1 for 19971999). Asthma hospitalization rates are higher in the selected communities for this age group (see Appendix: Exhibit 4EC 4). While hospitalization rates for children ages 0-4 are improving, the burden of asthma still exists. It is the leading cause of 8 school absenteeism. Thimerosol and Vaccines Vaccinations account for much of the decrease in childhood morbidity and mortality and are among the most effective public health tools. Recently, controversy has arisen regarding vaccine safety, particularly regarding the mercury-containing preservative thimerosal. Some groups have suggested that autism may be caused by the thimerosol found in many vaccines. The purported link between autism and vaccines has been studied in the United States and abroad. Thus far none of the studies have supported this Figure 9 7 FOCUS ON Lead Poisoning Rates of lead poisoned children have declined substantially in Nassau County. In the five-year period between 1997 and 2001, the number of lead poisoned children (blood lead levels >10 μg/dl) decreased 39%, and 49% in the selected communities (Figure 10). This improvement was due to the combined effects of parental education, lowering of maternal lead burden, and aggressive investigation by the NCDOH. A critical factor in the decline of blood lead levels both nationally and locally has been the decline in the number of homes with lead-based paint. Nevertheless, lead poisoning remains a common serious condition of early childhood. In 2001, 155 children had a lead level >10 μg/dl, 22 children had levels > 20μg/dl. A lead level >10 μg/dl may have long-term cognitive effects. Most cases are caused by ingestion of peeling, lead-based paint in housing built prior to 1960, when lead paint was outlawed. A growing percent of cases are caused by exposure to foreign cosmetics, herbal remedies, paints and other lead-containing products. The New York State Department of Health’s Plan to Eliminate Childhood Lead Poisoning by 2010 focuses on (1) identifying and abating homes where children have been poisoned, (2) lead testing at ages one and two for all children, (3) education for all new parents about preventing lead exposures, (4) using prevention coalitions and intensive intervention to eliminate community-level disparities in targeted high-risk populations, and (5) increase activities associated with primary prevention that result in controlling potential lead hazards before a child is poisoned. RATE (Per 100 100Children 0 - <6 Screened) Figure 10 8 WIC program as having the highest percentage of overweight 2 to 5 year olds in the NYS WIC system. A total of 24.1% were overweight. White non-Hispanics were 22.3, black non-Hispanics were 16.4%; and Hispanics were 28.4% (Figure 11). According to a recently published report by Trust for America’s Health 9 , New York State had the 3rd highest level for overweight low-income children, ages 2-5 and the 9th highest overweight high school student level. Childhood Obesity In New York State and Nassau County, there are no measurements of early childhood obesity except for the Special Supplemental Nutrition Program for Women, Infants and Children (WIC). In New York State, it is estimated that 16.1% of children age 2-5 years are overweight and another 16.1% are obese The 2003 CDC Pediatric Nutrition (BMI > 30). Surveillance Report identified the Nassau County Figure 11 9 Oral Health the LHD oversaw completion of questionnaires and examinations on 309 third graders in nine Nassau County schools 11 . Table 3 shows the differences found in the schools. children in lower socio-economic schools had poorer oral health and less access to dental care. For example, more than twice as many children had untreated tooth decay in low SES schools (36.2% vs. 17.8%). Dental caries is the most common chronic childhood disease 10 . The impact of tooth decay on a child’s function to eat, speak, grow and learn led to the surveillance of 3rd graders across the country. In 2002 and 2003, as part of a NYSDOH initiative, Table 3 ORAL HEALTH OF 3RD GRADERS NASSAU COUNTY vs. NEW YORK STATE 2002-2004 Nassau County NYS Healthy People 2010 Objective All 50.4 51.3 N\A High SES status 44.5 43.1 N\A Low SES status 57.8 59.7 N\A All 25.6 31.5 21.0 High SES status 17.8 21.1 21.0 Low SES status 36.2 39.6 21.0 All 26.9 29.9 50.0 High SES status 32.3 41.3 50.0 Low SES status 20.0 19.6 50.0 All 65.7 80.3 N\A High SES status 60.3 76.3 N\A Low SES status 75.8 84.2 N\A All 84.2 73.5 N\A High SES status 93.4 86.6 N\A Low SES status 66.5 61.1 57.0 All 30.9 18.8 N\A High SES status 37.6 29.7 N\A Low SES status 16.9 10.3 N\A Indicator With caries experience With untreated caries (tooth decay) With dental sealants With dental insurance With at least one dental visit in last year Reported taking flouride tablets on a regular basis SES is a measure of those eligible for free lunches or reduced-price lunches. Source: NYSDOH 10 HEALTH STATUS ADULTS Tuberculosis rates are disproportionately higher among Asians and Hispanics. In the last decade, rates in Hispanics rose from 9.0 in 1996 to a high of 25.5 in 2001, but have since decreased to. 14.5. Asians have had a consistently high rate of the disease, from 31.9 in 1993 to 27.1 in 2004. The rate among whites has not risen above 4.0 since 1992 (Figure 12). One of the ten essential services of public health is the protection of the community from the threat of infectious or communicable diseases. In Nassau County, surveillance and timely intervention have contributed to a significant reduction in most of these diseases. (See Appendix: Exhibit 5AD 1). Tuberculosis There has been a decrease in tuberculosis at the national, state and local level (see Appendix: Exhibit 5AD 12) but the rates still fail to meet the Healthy People 2010 objective of 1.0 per 100,000 population. The incidence of tuberculosis in Nassau County rose from a previous low of 5.4 cases per 100,000 population in 1986 to a peak of 10.3 in 1993 and then steadily declined to an historic low of 4.2 in 2003. The percentage of tuberculosis cases in foreign-born persons has steadily increased from 47% in 1993 to 74% in 2004 (see Appendices: Exhibits 5AD13 & 5AD 14). Geographically, 38.5% of the total tuberculosis cases reported in 2004 were in the seven selected communities, while only 17% of Nassau’s total population resides in these communities. Figure 12 TUBERCULOSIS CASE RATES IN NASSAU COUNTY BY RACE & HISPANIC ORIGIN 1992-2004 11 reflection of better diagnostic tests, testing guidelines and the availability of urine testing for women. The most dramatic increases have occurred in the selected communities (see Appendix: Exhibit 5AD 16). STD’s Gonorrhea rates in Nassau County have decreased from 47.6 per 100,000 population in 1994 to 32.7 in 2003. While all communities have shown decreases, the selected communities of the county, still have higher rates than Nassau County as a whole (see Appendix: Exhibit 5AD 15). STD rates, in general, are lower in the County than the rest of Upstate New York (Figure13). Chlamydia, which became a reportable disease in New York State in June 2000, has seen an increase in rates from 2001 to 2003. This may be a Early syphilis cases in Nassau County reached their height in 1993 during the region’s crack epidemic when there were 62 cases in women and 76 cases in men (Figure 14). Syphilis cases decreased until 2001. The recent resurgence in early syphilis has disproportionately occurred in men who have sex with men. Figure 13 Source: New York State Department of Health and Nassau County Department of Health Figure 14 12 FOCUS ON HIV/AIDS In Nassau County, AIDS first appeared as a disease of gay men, intravenous drug users and persons infected through blood products. AIDS cases increased steadily until 1995 when highly active anti-retroviral therapy (HAART) became widely available (Figure 15). Before HAART, the life expectancy (from the date of infection) for an HIV-infected person was estimated to be 12 to 14 years. Since HAART, life expectancy has increased. Over the past 20 years the relative proportion of risk factors has changed (Appendix 5AD 17), as have the demographics of the epidemic. Even as AIDS rates decreased, the rate among women of color remained fairly stable, while the rate for white women decreased (Figure 16). By 2003, black women were over 30 times more likely to be diagnosed with AIDS than white women and over twice more likely than Hispanic women. Overall, AIDS and HIV infection are highly concentrated in the selected communities (Figure 17). Figure 15 AIDS INCIDENCEAND ANDDEATH DEATH RATES AIDS INCIDENCE RATES* NASSAU COUNTY NASSAU COUNTY 1982-2003 1982-2003 RATE (PER 100,000 population) population) *RATE (per 100,000 30.0 Incidence Rate Incidence Rate Death Rate Death Rate 25.0 20.0 15.0 10.0 5.0 2003 2002 2001 2000 1999 1998 1997 1996 1995 1994 1993 1992 1991 1990 1989 1988 1987 1986 1985 1984 1983 1982 0.0 YEAR Source: New York State Department of Health Figure 16 RATES OF WOMEN DIAGNOSED WITH AIDS IN NASSAU COUNTY BY RACE AND HISPANIC ORIGIN 1982-2003 White 70.0 Hispanic 60.0 50.0 40.0 30.0 20.0 10.0 YEAR OF DIAGNOSIS Source: New York State Department of Health 13 2003 2002 2001 2000 1999 1998 1997 1996 1995 1994 1993 1992 1991 1990 1989 1988 1987 1986 0.0 1982-1985 RATE (per 100,000 population) Black Figure 21 Figure 17 PRESUMED LIVING WITHAIDS AIDS AND HIV CASES PRESUMED LIVING WITH & HIV NASSAU COUNTY NASSAU COUNTY (As of December 31, 2003) (As of December 21, 2003) Rates per 100,000 population 0 – 120 121 – 240 241 – 360 361 – 480 480 – 600 601 – 720 NOTE: The cumulative data represents cases diagnosed through December 31, 2003. HIV reporting began in June 2000. Rates are based on 2000 Census population. The New York State Department of Health (NYSDOH) indicates the following possible reasons for any discrepancy between the cumulative zip code information listed in this table and other tables that show a cumulative number of presumed living cases for 2002: 1) Zip code data does not include state prison inmates because the residence for inmates is based on the location of the prison rather than the person's usual address 2) Zip code data is not released when there are less than three cases for that zip code. 3) Many cases are reported without a zip code. In some instances zip codes may not even be available after surveillance is done on the case. Source: New York State Department of Health 14 for 15-44 year olds and the second leading cause for 514 year olds and all age categories 45 years and over. Injury Injuries are an important cause of hospitalizations and deaths in Nassau County. The percentage of deaths due to injury is highest in 15-24 year olds followed closely by 25-39 year olds (Figure 18). From 1999-2001, motor vehicle traffic deaths were the leading cause of deaths due to injury in Nassau County for ages 10-24 year olds and 45-64 year olds and the second leading cause for 25-44 year olds and those 65 years and older. Motor vehicle traffic injuries were the leading cause of hospitalizations The rate of hospitalizations due to selfinflicted/suicide injuries, from 1999-2001, was highest among 15-19 year olds and higher in females than males, however the death rate was highest in 20-24 year olds and in males. Hospitalizations and deaths due to assault/homicide injuries were highest in 20-24 year olds and higher males than females. (See Appendix: Exhibits 5AD 20, 5AD 21 and 7CHAI 10). Figure 18 PERCENT OF DEATHS DUE TO INJURY (BY AGE) IN NASSAU COUNTY PROPORTION OF INJURY DEATHS 1992-2000(BY AGE) IN NASSAU COUNTY 1992-2000 15 The second and third leading causes of cancer death in men were prostate and colorectal cancers. Breast and colorectal cancers were the second and third leading causes of cancer deaths in women. Cancer 12 Cancer is the second leading cause of death in Nassau County. In 2002, the age-adjusted cancer death rate was 222.2 per 100,000 population, surpassed only by heart disease (295.0 per 100,000 population). The burden of cancer on selected communities can be seen best when the data are viewed by race (Table 4). In the period 1997-2001, black men were 22% more likely than white males to be diagnosed with cancer, primarily due to the higher incidence of prostate cancer in black men (309.6 per 100,000 in black men vs. 160.9 in whites). Black men also have higher incidence rates of lung cancer (91.6 vs. 80.7) and colorectal cancer (84.3 vs. 73.3,). Black men were also more likely to die from cancer than white men. The most dramatic difference is seen with prostate cancer where the age adjusted death rate in black men was 69.3 per 100,000 vs. 25.7 for white males. Deaths from cancer have decreased steadily in the County since 1976 (see Appendix: Exhibit 5AD 22). In men, the annual age-adjusted cancer mortality rate of 295.3 per 100,000 for the period 1976-1981 decreased to 222.2 for the period 1997-2001. In women, the rate decreased from 195.3 to 165.4. Lung cancer was the leading cause of cancer death in both men and women between 1997 and 2001. While there has been a substantial decline in lung cancer deaths in men (which can probably be attributed to the decreases in smoking rates over the last 20 years), female cancer rates increased from 1976 to 2001. There is some evidence that female lung cancer rates may be leveling off (Figure 19). There is little difference in cancer mortality between white and black women (166.9 per 100,000 white Table 4 AVERAGE ANNUAL SEX & AGE-ADJUSTED CANCER INCIDENCE & MORTALITY RATES NASSAU COUNTY VS. UPSTATE NEW YORK, BY RACE 1997-2001 RACE SITE ALL SITES MALES Mortality Incidence FEMALES Mortality Incidence LUNG MALES Mortality Incidence FEMALES Mortality Incidence PROSTATE Mortality Incidence BREAST Mortality Incidence COLORECTAL MALES Mortality Incidence FEMALES Mortality Incidence WHITE NASSAU # RATE BLACK UPSTATE NY # RATE ALL* NASSAU # RATE UPSTATE NY # RATE NASSAU # RATE UPSTATE NY # RATE 1,271 3,411 220.5 575.7 11,061 27,061 246.3 579.7 101 285 275.2 702.1 724 1,711 315.1 651.8 1,397 3,814 222.2 583.2 11,876 29,443 248.1 587.5 1,318 3,481 166.9 471.9 11,091 27,243 174.2 456.6 107 252 169.3 381.8 648 1,406 184.3 379.7 1,447 3,849 165.4 461.7 11,826 29,271 173.9 453.7 349 481 59.3 80.7 3,345 4,286 72.5 91.7 28 39 63.1 91.6 225 284 91.0 109.6 383 528 59.5 80.8 3,594 4,615 73.0 92.3 318 465 39.9 59.7 2,731 3,768 43.7 61.7 22 27 34.8 42.7 138 182 38.9 50.7 343 498 39.0 57.4 2,885 3,991 43.1 60.8 139 979 25.7 160.9 1,188 7,507 29.1 158.6 16 124 69.3 309.6 112 649 65.5 258.6 156 1,148 27.0 171.7 1,303 8,438 30.3 166.7 232 1,056 30.5 148.5 1,785 8,110 28.8 140.4 22 75 32.4 105.8 117 400 31.6 103.4 258 1,172 30.3 144.3 1,916 8,729 28.9 139.0 142 430 24.7 73.3 1,217 3,445 27.4 75.1 11 33 29.2 84.3 72 175 31.9 70.4 156 477 25.0 74.3 1,297 3,685 27.5 75.2 133 438 16.1 55.2 1,272 3,522 18.9 54.9 13 34 21.8 55.6 71 181 20.8 51.7 148 484 16.3 55.1 1,351 3,763 18.9 55.0 *Includes all other races, unknown and not stated. # equals the average annual cases (rounded to the nearest whole number) for the specified period, 1997-2001. Source: New York State Department of Health Cancer Registry 16 females vs. 169.3 for black females). White females were more likely than black females to be diagnosed with a cancer, but this is likely a function of higher screening rates, especially for breast cancer. In two of the leading cancers, the death rates for black females were higher while the incidence rates were lower than in white females. For breast cancer, the death rate for black females was 32.4 per 100,000 vs. 30.5 for white females; even though the incidence rate in white females was 40% higher that that of black women (105.8 blacks vs. 148.5 whites). In colorectal cancer, the death rate was 35% higher for black women than their white counterparts while the incidence rates were almost the same (55.6 black women vs. 55.2 white women). Figure 19 CANCER DEATHS IN FEMALES NASSAU COUNTY 1976-2001 FOCUS ON AGING Nassau County, like much of the United States, is getting older. From 1990 to 2000, the senior population (aged 65 years and older) increased from 182,899 to 200,841, and proportionately, from 14.2% to 15.0% of the county’s population. The change in the racial and ethnic composition of seniors mirrors that seen in the total population of the county (Table 5). The United States Census expects this trend to continue. Projections through 2015 indicated that this group would grow to 202,882 with the 85+ population increasing by 65% to over 36,000 (Figure 20). An aging population will put new and increased burdens on health and social service providers. Rates of physical and cognitive disabilities are highest among the elderly and increase with age (Figure 21). The elderly living at home will demand a variety of services (meals, home health aids) and a greater proportion will move into assisted living housing and long-term care facilities. As the life expectancy of the very old increases, the health care system will have to adapt to the greater prevalence of chronic illnesses including cancer, coronary artery disease, arthritis and dementia. While much of this care will be paid for by Medicare and personal savings, Medicaid is the primary payer for long-term nursing care. 17 Figure 20 Figure 20 SENIOR POPULATION PROJECTIONS BY AGE GROUP COUNTYIN NASSAU COUNTY PROJECTED SENIORNASSAU POPULATION 2000-2015 BY AGE 80 60 40 20 0 60-64 65-69 70-74 75-79 80-84 85 + 2000 56,084 52,348 53,613 44,487 28,184 22,209 2005 61,995 46,948 43,194 42,421 32,174 29,384 2010 76,029 52,204 39,523 34,853 30,703 34,686 2015 81,075 63,315 44,334 32,685 25,951 36,597 AGE RANGE Source: NYSIS Populations Projections: http://www.nysis.cornell.edu and NC Senior Citizen Affairs Table 5 POPULATIONIN IN NASSAU NASSAU COUNTY 60+60+ POPULATION COUNTY BY RACE AND ETHNICITY BY RACE AND HISPANIC ORIGIN, 1990-2000 1990-2000 1990 2000 White 244,578 230,385 -- 5.8 Black 11,158 16,020 + 43.6 Asian 2,742 6,140 + 112.0 Hispanic Origin 6,080 9,024 + 48.0 259,520 256,925 Race/Ethnicity Total Population % Change -1.0% Source: U.S. Census Figure 21 DISABILITY STATUS DISABILITY STATUS 65 YEAR AND OLDER POPULATION* 65 YEAR AND OLDER NASSAU COUNTY POPULATION* 25% 20% PERCENT NUMBER (in thousands) 100 15% 10% 5% 0% Sensory Physical Mental TYPE OF DISABILITY Source: U.S. Census 18 Self-care Go outside home HEALTH STATUS HEALTH BEHAVIORS Leading Causes of Death Table 6 The number of deaths in Nassau County has been at the same level for the past ten years. In 2002, reported deaths equaled 11,307 (vs. 11,296 in 1993.) The age-adjusted death rate (which shows what mortality levels are when no change occurs in the age composition of the population, over time) was 743.0 per 100,000 population (using the U.S. 2000 Census standard population) compared to 845.3 for the U.S. By race, the rate for whites was 744.8 vs. 973.0 for blacks. The death rate for blacks exceeded that of whites by a ratio of 1.3, which means that the risk of death for blacks is 31% higher than that for whites (Figure 22). These rates parallel those of the nation: the white population is 829.0 and the black population is 1,083.3, per 100,000 for a ratio of 1.3. The age-adjusted death rate for those of Hispanic origin was 704.3, compared to 629.3 for the entire nation. (A full discussion of differences by race and Hispanic origin in Nassau County can be found in the section FOCUS ON: Disparities.) 2002* DEATH RATES BY RANK (Age-adjusted to the U.S. 2000 Standard Population) Causes of Death Heart Disease Cancer - Male Cancer - Female CVD** CLRD*** Unintentional Injury Diabetes Mellitus Suicide Cirrhosis of Liver AIDS Homicide Nassau County 295.0 222.2 165.4 29.3 28.4 22.1 11.7 5.2 5.0 3.1 2.7 (1) IN NASSAU COUNTY AGE-ADJUSTED DEATH RATES AGE-ADJUSTED DEATH RATES IN NASSAU COUNTY BY AND HISPANIC HISPANICORIGIN ORIGIN BY RACE AND 1994-2002 1994-2002 Total White RATE RATE (Per 100,000 Population*) 283.6 238.6 167.4 38.4 34.8 21.5 19.7 6.6 7.2 10.9 5.0 U.S. 240.8 238.9 163.1 56.2 43.5 36.9 25.4 10.9 9.4 4.9 6.1 *Nassau County & NYS rates are the average of 2000-2002 deaths. **Cerebrovascular Disease (stroke). ***Chronic lower respiratory disease. Source: National Center for Health Statistics and NYSDOH Figure 22 (per 100,000 population) NYS Black 1200.0 Hispanic 1000.0 800.0 600.0 400.0 200.0 0.0 1994 1995 1996 1997 1998 1999 2000 2001 2002 YEAR (1) Rates per Standard 100,000 population *Per U.S.are 2000 Populationage-adjusted to the US 2000 standard population. Source: New York State Department of Health & Nassau County Department of Health 19 Figure 23 Figure 23 LEADING CAUSES OF DEATH BY RACE AND HISPANIC ORIGIN NASSAU COUNTY Leading Causes of Death By Race & Hispanic Origin 20022002 Nassau County, *Chronic Lower Respiratory Disease Source: New York State Department of Health When one looks at the underlying social, behavioral and environmental causes of death, a different picture emerges. For example, almost 20% of U.S. deaths can be attributed to tobacco use, and its effect on the heart, lungs, vascular and other organs. According to the Centers for Disease Control (CDC), the most common actual causes of death in the United States in 2000 were tobacco (435,000), poor diet/physical activity (400,000), alcohol consumption (85,000), microbial agents, i.e. - influenza and pneumonia, (75,000), toxic agents, i.e.- pollutants and asbestos, (55,000), motor vehicle accidents (43,000), firearms (29,000), sexual behavior (20,000) and illicit drug use (17,000) (Figure 24). Figure 24 LEADING CAUSES VS. ACTUAL CAUSES OF DEATH IN THE UNITED STATES Leading Causes of Death+ United States, 2000 Actual Causes of Death++ United States, 2000 Percent (of all deaths) Percent (of all deaths) *Chronic lower respiratory disease. **Examples include influenza, pneumonia, etc. ***Examples include pollutants and asbestos. +McGinnis JM, Foege WH; JAMA 1993; 270(18): 2207-12 ++Mokdad AH, Marks JS, Stroup DF, Gerberding JL. Actual causes of death in the United States, 2000. JAMA. 2004; 291(10): 1238-1246 20 Smoking and Tobacco More than 440,000 premature deaths occur each year as a result of smoking, the leading cause of preventable death in the United States. Smoking is a major risk factor for many of the most common causes of death, including heart disease, stroke, cancer, lung and vascular diseases to tobacco use. The National Center for Health Statistics has reported that in 2002, an estimated 22.5% of all adults in the United States were actively smoking. Nationally, 25.2% of all men and 20% of all women were “current smokers”. In New York State 20.3% of all adults reported being “current smokers”. 13 The proportions of male and female smokers are closer than the national percentages, 21.8% of men and 19% of women. Within the racial and ethnic groups, 21.6% of the whites, 20.7% of the black population and 15.9% of those of Hispanic origin were “current smokers”. It is estimated that in Nassau County 17.7% of adults surveyed reported are “current smokers”, including 18.7% of women and 16.9% of men. 57.6% of the “current smokers” reported having attempted to quit. Obesity The Centers for Disease Control (CDC) indicated in 2004 that the factors of “poor diet and physical inactivity” that contribute to overweight and obesity rose by 33 percent over the past decade and may soon overtake tobacco as the leading preventable cause of death 14 in the United States. In Nassau County, the proportion of overweight and obese (BMI >25) persons more than doubled, from 1994 15 to 2000-2002, from an estimated 24% to 52%, respectively. At the same time, approximately 76% of the adult population in Nassau County “participated in leisure time physical activity or exercise during the last 30 days” (see Appendix: Exhibit 7CHAI 6). 21 22 HEALTH STATUS ACCESS TO CARE However, lack of insurance or underinsurance remains a major problem for many of the poor and middle class. There is no accurate count of the number of Nassau residents without health insurance. While 434,372 residents were enrolled in an HMO in 2003, the number of residents with other insurance can only be estimated. In 2003, the U.S. Census estimated that 15.5% of all people in the nation were uninsured. Using the same percentage for Nassau County, the number of uninsured would equal more than 200,000. (In the same year, the Nassau County comptroller’s office estimated that there were more than 300,000 who were uninsured or underinsured for prescription drugs.) Access, according to the Institute of Medicine, is “the timely use of personal health services to achieve the best possible health outcomes” 16 and assuring access to care is an essential public health service. In Nassau, access is dependent on many factors, including finances, having health insurance, transportation and available physicians. It is also dependent on having a health care system that can accommodate and respond to a population that is becoming more and more diverse. Increasingly, Nassau needs providers that accept Medicaid as well as reduced payments for the poor, speak many languages, understand different cultures, and recognize the effects of social conditions on a patient’s health. Healthcare Providers U.S. Census estimates show higher percentages of blacks and Hispanics are uninsured, nationally 19.4% of all blacks and 32.7% of all Hispanics. In NYS, it is estimated that 17% of the State’s 18-64 year old population has no health insurance coverage and the percentage of uninsured blacks is 20.0% and Hispanics 36.8% (see Appendix 7 – Community Health Assessment Indicators). In 2004, there were 7,988 registered licensed physicians, 732 physician’s assistants, 965 nurse practitioners and 1,988 licensed dentists in Nassau County according to the New York State Education Department. (County numbers reflect the licensee’s primary mailing address, which may or may not be the licensee’s office practice address). There are 12 hospitals in Nassau County with a 4,531 bed capacity. The combined admissions, in 2003, were 198,612 and the number of ER visits was 427,348. The Nassau Health Care Corporation (NHCC), parent company of the Nassau University Medical Center, provides additional health care services through its seven health centers; five full service community centers, one satellite and one school based clinic. The NHCC health center sites are located in the selected communities and draw patients from those communities (see APPENDIX: Exhibit 6LPHS 1,2 and 3). The uninsured of Nassau County include the working poor who are not eligible for “safety net” insurance plans and a growing number of undocumented immigrants and homeless persons who may have no mechanism at all for accessing health care. The consensus among community leaders is that these numbers are growing. Financial Barriers First and foremost, there are financial barriers to accessing care. Although the County has one of the highest median household incomes, many residents live in poverty. In 2003, 92,319 persons in the County were eligible for Medicaid. Significantly, 47% (50,906) of the County's Medicaid eligible residents lived in the seven selected communities (see Appendix: Exhibit 1DEM 12). The New York State Department of Health lists 35 available nursing facilities with a total of 7,919 certified beds in Nassau County, as of 2004 (see Appendix: Exhibit 6LPHS 5&6). Access to Providers Through a combination of “safety net” provisions within the public health system (including Medicaid and Medicare, Child Health Plus, Family Health Plus, other NYS insurance plans, not-for-profit hospitals and clinics, and private “pro-bono” care), many Nassau County residents are able to obtain medical care. In Nassau, access to private physicians improved with the advent of the Child Health Plus and Medicaid managed care programs, but many beneficiaries still rely on episodic emergency room or clinic care. There are relatively few 23 5. options for subsidized care (NHCC’s community health centers and teaching clinics, residency clinics at many of the other hospitals, Planned Parenthood). The Nassau Partnership for Healthy Communities (NPHC) is working to improve access to private practice medical specialists. Structural Barriers a. Community outreach and facilitated enrollment into qualified insurance plans. Transportation is a structural barrier. There is a lack of adequate public transportation for the County in general. There are relatively few routes, and bus schedules are infrequent. Families without an automobile may be effectively barred from accessing medical services other than the NHCC Health Centers which are located in the selected communities. Hospitals are located throughout the County, but most are not located in low income communities. b. Increased access to primary care. c. Personal Barriers The 2000 U. S. Census verifies that Nassau County has a large number of foreign born residents (18%) compared to the United States as a whole (11%). Immigrants, especially undocumented also face language barriers when entering the health care system. Either or both factors can result in the individual not getting treatment when it is needed. Lack of access to care can facilitate spread of infectious disease in the community (see Appendix: Exhibit 5AD 13 and 5AD 14). Initiatives to Address Access Barriers Some of the major initiatives being taken to address the barriers to access In Nassau County are: 1. Enactment of a hospital charity care ordinance, (passed in 2002) that assures “emergency inpatient or outpatient medical care, including ancillary services, to a person who is uninsured” and meets all qualifications. 2. County support of the Nassau Health Care Corporation (a public benefits corporation), which operates community health centers located in the selected communities. 3. Community-wide education and intervention strategies that address smoking, obesity and asthma. 4. Issuance of a countywide affinity discount drug card. Active involvement in county and regional coalitions that address the needs of the uninsured and underinsured, in particular the Nassau Partnership for Healthy Communities, a Healthy Communities Access Program (HCAP). The major initiatives include: 24 Assurance of linguistically/ culturally qualified service. HEALTH STATUS LOCAL HEALTH CARE ENVIRONMENT There are many social, economic and environmental factors that contribute to the population’s overall good health, including an exceptional drinking water supply, high quality housing, an excellent regional economy with low unemployment, and top-ranked public schools. Environmental laws and regulations are tightly enforced and Nassau was largely spared the long-term environmental insults from heavy industry and manufacturing. There are many parks, beaches and recreation areas maintained by the state and county. The quality of medical care is good and in some disciplines local hospitals are among the best in the state. Nassau county residents are well educated (almost 87% have high school diplomas and 35% have bachelor’s degrees or higher) and the median and average household income are among the highest in the nation for any county. Housing and Other Physical Threats and Health Poor quality housing conditions (exposure to lead paint, mold, overcrowding, etc.) have been associated with infectious disease, injury, lead poisoning and asthma in children. Three quarters of the County’s houses are more than 40 years old. Where repairs and remediation of problems fail to take place, there is potential for health problems. At issue too in areas of Nassau County, and across the nation, is the number of new immigrants living in overcrowded conditions that have the potential to further exacerbate many health issues. Homelessness is a very real threat to health. The Nassau Suffolk Coalition for the homeless estimates that there are 40,000 homeless persons in the combined counties of Nassau and Suffolk and another 200,000 at risk of becoming homeless. However, there are other features of the social and environmental landscape that contribute to health problems. Many of the racial, ethnic and geographic health disparities described in earlier sections are in part due to environmental disparities, such as differences in economic and educational opportunity, poor housing, exposure to hazardous materials or working conditions, less access to health care (including mental health and substance abuse treatment), institutional racism and ethnic discrimination. Gang violence is a source of physical health threats in some communities in Nassau. Homicide and assault rates are higher among ethnic and racial minorities, and in the select communities Environment and Health Nassau County ranks high in environmental protection by conducting ongoing enforcement of environmental laws, regulations and ordinances and by investigating and resolving environmental emergencies. (A full description of the role of the LHD Environmental Health Division can be found in Section II – Local Health System Profile.) Racial Residential Segregation and Health Historic housing practices, ranging from post WWII mandated mortgage restrictions to racial steering, have left Nassau County highly segregated. One report found that although “economically segregated housing is prevalent on Long Island, African Americans, in particular, are victims of racial steering.” 17 U.S. Census data shows two thirds of Long Island’s cities, towns and villages remain largely white with less than 1% black residency. Ninety percent of Long Island’s black residents live in just 20% of its communities (e.g. Roosevelt, Hempstead Village). However, a disproportionate number of EPA superfund sites and brownfields are in communities of color. Although exposure to toxic chemicals from these sites is rare and unlikely (due to remediation and treatment of drinking water), their presence stunts economic development and often is seen as a blight on the community. Education and Health Racial residential segregation indices of the U.S. Census measures the isolation of a population from other populations by considering racial/ethnic clustering (regardless of income) and the concentration of a racial/ethnic population compared to other populations. Some have found a correlation between segregation and mortality, birth outcomes and tuberculosis. Although Nassau has some of the top public schools in the nation, two of the most troubled districts in the state serve Roosevelt and Hempstead Village. Although it is hard to qualify the health impact of poor education, it almost certainly lessens economic opportunity, depresses property values and discourages new business ventures. 25 Cultural Competence of the Health Care Workforce A culturally competent workforce is an important part of providing excellent medical care. According to the National Center for Cultural Competence: 18 1) Diverse cultures perceive illness and disease and their causes differently; 2) There are differences in the belief systems relating to health and healing; 3) Behavior related to getting health care and attitudes toward health care providers is cultural; 4) Personal experiences affect a patient’s attitudes toward health care systems and providers; and 5) There is an under-representation of providers from diverse cultural and linguistic backgrounds in the existing health care system. September, 2004, the Sullivan Commission on Diversity in the Health Workforce found that while blacks, Native Americans and Hispanics make up more than 25% of the U.S. population, they represent only 9% of the nation’s nurses, 6% of doctors and 5% of dentists. It can be assumed that the percentages are about the same or less in Nassau County. While it may not be necessary to have the workforce mirror the population demographically, it is important that providers be proficient in relating to the cultures (racial, linguistic) within their practices. Most organizations within the Nassau County Public Health System have provided their staff with cultural competency training and seek to ensure that the lessons are implemented. 26 Section II – LOCAL HEALTH SYSTEM CAPACITY PROFILE Essential Public Health Services problems; researching for new insights and innovative solutions; monitoring health status; and informing, educating and empowering people. However, the system was weakest evaluating effectiveness, accessibility and quality; mobilizing community partnerships; developing policies and plans; linking people to needed services and assuring a competent workforce. In 1994 the CDC and other public health organizations described ten essential public health services that should be obtainable in every community in the United States. They are: Monitor health status to identify community health problems. Diagnose and investigate health problems and health hazards in the community. Inform, educate and empower people about health issues. Mobilize community partnerships to identify and solve health problems. Develop policies and plans that support individual and community health efforts. Enforce laws and regulations that protect health and ensure safety. Link people to needed personal health services and assure the provision of health care when otherwise unavailable. Assure a competent public health and personal health care workforce. Evaluate effectiveness, accessibility, and quality of personal and population-based health services. Research for new insights and innovative solutions to health problems. The National Public Health Standards Program (NPHPSP) Figure 26 COMPONENTS OF THE LOCAL PUBLIC HEALTH SYSTEM Private Non-Profit Associations Other Public Provider Agencies Official Public Health Agencies Community Based Organizations Performance The Essential Public Health Services became the basis for development of the National Public Health Performance Standards Program (NPHPSP). The purpose of the NPHPSP is to assess the capacity and performance of every community’s public health system. This includes the “use of the public health system as the unit of analysis for performance and capacity assessment” 19 . A public health system consists of the Federal, State and local health department and laboratories and also includes all those organizations that contribute to the delivery of essential public health services (Figure 26). Educational Institutions Personal Health Services Industry Private Industry Population-based Services Individual Services Local Health Department Overview The Nassau County Department of Health was established in 1938 pursuant to Article IX of the County Government Law, and operates under the New York State Public Health Law and Titles 10 and 6 of the Official Compilation of Codes, Rules and Regulations of the State of New York. In 2001, using the NPHPSP Local Public Health System Performance Assessment Instrument, the Nassau County Department of Health and its partners performed an assessment of the Nassau County Health System (see Appendix: Exhibit 6 LPHS 8). The System performs best in the traditional public health activities of enforcing laws and regulations; diagnosing and investigating health The Vision - The Nassau County Department of Health will lead a public health system that works to create healthy communities. 27 The Mission - The Nassau County Department of Health promotes and protects the health of the residents of Nassau County. The mission is accomplished through direct services and community partnerships in the following focus areas: syphilis and chlamydia. These activities are done in partnership with health care providers, community-based organizations, the faith community, schools and other county agencies. The division collects HIV/AIDS and STD statistics and assists newly infected individuals in notifying their sexual and needle-sharing contacts through its Partner Notification Assistance Program (PNAP). Prevention of environmental health hazards through assessment, regulation and remediation. Investigation and control of communicable diseases, including agents of bioterrorism. Promotion of healthy behaviors through education, outreach and training. Promotion of equal access to culturally and linguistically appropriate health care and allied services. Development and dissemination of local health data. Creation of innovative solutions to public health problems In addition, the LHD contracts the Nassau University Medical Center to provide clinical preventative services and treatment for STDs and TB at its community health centers. Community & Maternal Child Health Services - The Division of Community & Maternal Child Health Services provides support to community-based programs and facilitates coordination and integration of services to children and families. It includes: Local Health Department Divisions: Administration - Overall leadership and direction of the LHD are provided by the Administration unit. Also in this category are the administrative support functions of fiscal, human resources, Article 6 reporting, community health assessment planning, information technology and public information. Environmental Health - The Division of Environmental Health protects the community from environmental pollution, unsanitary conditions or unsafe environmental practices. It monitors safe drinking water, food, and indoor and ambient air quality. It investigates complaints, conducts tobacco compliance checks, responds to emergency spills and incidents, controls and regulates the storage, handling and disposal of hazardous material and toxic chemicals and monitors the abatement of household lead hazards. It inspects radiological health diagnostic equipment, food service establishments, and provides training to food handlers and participates in food-borne outbreak investigations. It oversees recreational facilities including children’s camps, pools and bathing beaches, certifies lifeguards and tattoo artists, conducts mosquito control surveillance and coordinates the County’s Pesticide Policy. Community Health Worker Program Office of Children with Special Health Care Needs ♦ Early Intervention Program ♦ Pre School Program ♦ Physically Handicapped Children’s Program Office of Emergency Medical Services and Bioterrorism Preparedness Perinatal Services Network Women, Infants & Children Program (WIC) Program Public Health Laboratories - The Division of Public Health Laboratories provides essential analytic and diagnostic laboratory services to assess the status of community health in Nassau County and maintains the necessary technical expertise and instrumentation to evaluate disease outbreaks, monitor disease control programs, and test for the presence of bacterial and chemical contaminants in the environment. Six specialized clinical and environmental laboratory units provide: Disease Control - The Division of Disease Control protects the public from the spread of communicable or infectious diseases by investigating reports of these diseases, surveillance for diseases and taking actions to prevent potential outbreaks. Some of the actions taken to prevent outbreaks include: immune globulin prophylaxis for those exposed to hepatitis A, immunizations for those exposed to measles, and confirmation of treatment for those infected with tuberculosis (TB). The Division maintains a 24-hour medical consultation service for notifiable diseases. Division of HIV and STD Control - Activities of this division focus on risk reduction, education, and early identification of those infected with HIV, gonorrhea, 28 Serodiagnostic screening and confirmatory testing for communicable diseases Immune status evaluation for communicable diseases Comprehensive cultural and microscopic capabilities for identifying the pathogenic agents of communicable diseases Capabilities for tracking foodborne illnesses Identification of disease carrying insects Capabilities for the identification of bacterial and chemical agents in water, air, soil, dust, and consumer products Environmental screening for critical agents of bioterrorism (i.e. - anthrax) Spectrometric "fingerprinting" of unknown chemical agents to address chemical spills or other environmental emergencies involving toxic and hazardous materials Section III – PROBLEMS AND ISSUES IN THE COMMUNITY A Discussion of the Unmet Health Needs of the Residents of Nassau County Other “safety net” providers include Winthrop University Hospital’s school-based health center at Hempstead High School and two charitable clinics (Rotacare and the Community Wellness Center). Nassau hospitals such as Long Beach, South Nassau Communities Hospital and the North Shore University Long Island Jewish Health System operate clinics with sliding fee scales. These institutions provide charitable, uncompensated care, but some are located outside of the selected communities and may at times be difficult to access by those in need. As a whole, Nassau County’s residents receive quality health care, live in adequate housing, have essential social supports and are protected from most environmental hazards. Sometimes hidden in the overall data, however, are the increasing numbers of those who suffer disparities in health care. Health Status – Disparities As pointed out in the Executive Summary, disparities and inequalities are most prevalent in underserved communities and among racial and ethnic minorities. The most evident of these health disparities are in infant mortality, HIV/AIDS, STD’s, chronic disease, teen pregnancy and violence. The root of the causes are socio-economic factors which are numerous and complex, and include differences in income, education, exposure to hazardous materials or working conditions, housing conditions, access to health care (including mental health and substance abuse treatment), as well as discrimination founded in institutional racism and ethnic differences. Reducing or eliminating disparities is one of the most important goals for the Nassau County public health system and should be addressed at all levels. An even larger problem exists in accessing medical specialty services and diagnostic evaluations, arranging surgical procedures and obtaining medications. These types of services typically require payment on the part of uninsured patients, for at least a portion of the total charges. Although many facilities offer discounts to the uninsured for services, the high cost of medications, diagnostic procedures and specialist services creates barriers for the uninsured resulting in delayed care or no care at all. The Public Health System – Gaps In 2002, under the auspices of the CDC, the LHD undertook an evaluation of the local public health system and its ability to provide the ten essential public health services. This qualitative assessment was based on input by health care providers, advocates, community organizations and LHD personnel. Four of the ten essential public health services were identified as being in definite need of improvement. The summary scores, 0 % (least effective) to 100% (most effective), were: Health Care Safety Net – Access to Care It is estimated that 14-20% of the County’s residents are uninsured or underinsured. The estimate includes those persons not legally eligible for public health insurance programs, working adults who do not qualify for public assistance but yet do not receive insurance through their employers, and persons who choose not to be insured (many young adults, students and some elderly). Many residents rely on subsidized or charity care provided by local hospitals and occasional “pro bono” primary care provider sites. Historically, the Nassau County government (through the Nassau County Medical Center and the Health Department clinics) provided free or subsidized care to residents in need. In 1999, the Nassau Health Care Corporation took over these operations. NHCC (Nassau University Medical Center with hospital outpatient clinics, seven community health centers, and a nursing home) provides a full range of services, including general medicine (adult and pediatric primary and preventive care), maternity, gynecology, family planning, HIV, TB, STD, mammography, immunizations and dental. Services at the Health Centers are provided on a sliding fee scale based on family size and income. The locations and hours of operation are listed in Appendix: Exhibit 6LPHS3. • • • • Evaluate effectiveness, accessibility and quality of personal and population-based health services - 25%. Mobilize community partnerships to identify and solve health problems - 29%. Develop policies and plans that support individual and community health efforts 42%. Link people to needed personal health services and assuring provision of health care when otherwise unavailable - 44%. Collaboration and partnership is particularly critical for the LHD. With loss of staff and services throughout Nassau’s public health system, it is necessary to develop, sustain and/or increase partnerships with public and private agencies, health care providers and community and faith based 29 organizations. Most of the unmet needs in the health care delivery system can be viewed as a malfunction in leveraging non-governmental resources in the face of diminishing LHD capabilities. For a discussion of services provided by the Local Health Department and its partners, refer to Section II of this report. For a listing of community partners and their missions see Appendix: Exhibit 6LPHS7. 30 Section IV – LOCAL PUBLIC HEALTH PRIORITIES The local public health priorities listed below reflect organizational and community needs and the input of the LHD’s partner agencies (see Appendix: Exhibit 6LPHS7 for a list of organizations). • Reducing health disparities • Reducing the burden of chronic diseases through community prevention programs • Improving bioterrorism response capabilities • Strengthening public health infrastructure • Improving the health care safety net (focus on cultural competency) and to more than 12,000 low-income participants. WIC also provides training in parenting skills (i.e. – to reduce child abuse) and runs a breast-feeding education initiative for minority women. The STD Control Bureau works with Planned Parenthood to address the increase in syphilis among Latino men in the Village of Hempstead through outreach and education. The HIV Bureau continues to partner with the Black Leadership Commission on AIDS to address the ongoing HIV epidemic in AfricanAmerican communities. emergency The MHTF will oversee two grant programs to support community efforts in this area. The first will fund community-based and faith-based organizations that organize monthly health forums that promote healthy behaviors or assist persons in managing chronic diseases (i.e., diabetes, heart disease). The second grant will support programs designed to reduce health disparities related to HIV infection, cancer and obesity. Reducing health disparities - The LHD has developed partnerships with community-based organizations, health care providers and other County agencies to reduce health and health care disparities by improving access to and the quality of health care services for all County residents. This effort was aided by the Minority Health Task Force (MHTF) report that made eight specific recommendations to make health care more equitable and accessible to all residents, especially the poor and uninsured. The LHD’s annual budget includes $5 million for the Nassau Health Care Corporation to provide essential public health services to residents at six health centers located in communities with large minority populations. In 2005, over 65,000 patient visits were made. One of the ways the LHD focuses attention on health disparities is by issuing reports, such as the Community Health Assessment. Attention is called to seven communities in the County that are most in need and also have the largest numbers of minority (racial and ethnic) populations. These “selected” communities have disproportionately higher rates for many diseases and more adverse social and economic conditions. Reducing the burden of chronic diseases through the community prevention programs The LHD has been focusing on helping residents to improve their personal health behaviors. The Bureau of Health Promotion and Disease Prevention identifies needs and develops programs that promote healthy living and prevent disease, the most cost-effective ways to stay healthy. With increased health care costs and an aging population, all residents benefit from the Bureau’s prevention activities. By working with local hospitals, health care providers, schools, community, nonprofit and faith based organizations, the LHD can leverage resources and develop initiatives and programs that target underserved and health disparate communities. Many LHD programs are specifically designed to reduce disparities. The Community Health Worker Program (CHWP), located in the Village of Hempstead, provides outreach, education, and home-based case management services to at-risk pregnant woman and their families. CHWP works in collaboration with community, health care providers, the Economic Opportunity Commission’s Healthy Start Program and the Nassau County Perinatal Services Network. The Perinatal Services Network (PSN) provides residents and providers with information and resources to help improve birth outcomes and access to prenatal-perinatal health care services. This is accomplished through a consortium of more than 30 health and human services providers that work together to identify gaps in services and recommend systematic changes to improve prenatal care. Smoking is the single greatest cause of preventable death and illness in Nassau. The LHD is continuing to expand its efforts to prevent or reduce tobacco use. Residents are offered a comprehensive, no-cost tobacco cessation program that supports and empowers participants to become tobacco-free. Now, residents can also receive free stop-smoking medication. The “Quitting for Your Family” program trains health care providers to identify pregnant women and new parents who smoke and helps them to quit. The LHD participates in the Tobacco Action Coalition of Long Island (TACLI) which promotes anti-tobacco youth advocacy and sponsors counter-marketing programs. The Women, Infant and Children’s Nutrition Program (WIC) provides nutritional counseling and food vouchers 31 The LHD is the lead agency for naturally occurring and man-made disease outbreaks. and is part of the Cities Readiness Initiative, whose intent is to reduce the time it takes to provide prophylactic medication to the population after an outbreak through a network of other agencies, employers and municipalities. The Communicable Disease Control division has trained staff to provide post exposure testing and treatment for outbreaks Childhood asthma is a leading cause of morbidity in the county and disproportionately affects minority communities. The LHD initiated a new program to reduce the frequency and severity of asthma episodes in low-income children through home visits and case management. Working with the Asthma Coalition of Long Island, the visits educate families about asthma triggers and provide them with the knowledge, skills, motivation, and supplies necessary to help protect their children from allergens. Strengthening public health infrastructure Monitoring health status to identify community health problems and then informing people (the public, other government agencies, health care professionals and other organizations) about health issues are two core public health services. There is also an ongoing need to make better use of internal data to monitor and improve program activities. While unhealthy behaviors play a major role in premature morbidity and mortality, local data necessary to effectively target resources has not been available. The LHD responded by conducting the County’s firstever comprehensive community health survey, which will provide important information about the risk factors and health problems affecting our communities. The results will be used to help improve public health programs through the development of strategic plans and targeted prevention programs, identification of trends in unhealthy behaviors over time and by supporting community policies that promote health and prevent disease. Enhancements have been made to the LHD's website, making it easier to find information important to the public. The data section has been updated to include the 2005-2010 CHA along with other LHD reports and links to many useful websites. The website also contains descriptions and contact information for the many programs operated by our LHD. Improvements are ongoing. Improving bioterrorism and emergency response capabilities - Through planning, drills, exercises and training, the LHD has greatly strengthened the public health system’s ability to respond to bioterrorism and other public health emergencies, such as a potential influenza epidemic. The Public Health Emergency Response Plan (part of the County’s all hazards plan) allows for coordination with the Nassau County Office of Emergency Management, Nassau County Police, HAZMAT and other emergency response agencies. It provides for lines of communication with Federal, State and local governmental agencies, hospitals, water districts and other organizations. Several Point of Distribution (POD) exercises and drills, done in cooperation with other agencies and local hospitals, have tested various parts of the emergency response. Future exercises will test continuity of operations among first responders, decontamination capabilities and surge capacity mobilization. An Office of Epidemiology has been created within the LHD. Its role is to improve the LHD’s data collection and management capabilities to be able to provide useful information. The Office will be working with the NYSDOH to obtain data to be used for program assessment and analysis. The Office will be responsible for the development and dissemination of reports to other agencies and the public. The use of the Geographic Information System (GIS) is being expanded in the LHD. Examples of how this technology has been used in the past include mapping of the rabies raccoon and Early Intervention cases. We will be converting more databases onto the County’s GIS system. Improving the health care safety net (focus on cultural competency) - In partnership with the MHTF, the Nassau Partnership for Healthy Communities, and CBOs, the LHD is promoting cultural competency training, particularly for safety net providers. Planned Parenthood and Winthrop Hospital are among the organizations that have already performed self assessments and/or have obtained specific training to become more culturally competent in their understanding of culture in the workplace and heighten their performance and productivity. Monitoring and surveillance activities of communicable diseases are in place to allow for better identification of a bioterrorism event. Local hospitals have been involved in the planning and have “drilled” on response to biological and chemical agents. Four Nassau County hospitals are participating in the NYSDOH pilot syndromic surveillance system, which helps to identify unusual clusters of disease. Awareness has been raised about the potential for a bioterrorist event in the health care provider community and the participation of this community has been solicited to assist in emergency planning. The LHD has formed a Medical Reserve Corps made up of licensed health care professionals who have volunteered to provide services during emergencies. The MHTF recommended that all staff in Health and Human Services agencies receive cultural competency training. The LHD has provided training to Executive staff and supervisors and has integrated it into its new employee orientation materials. 32 Section V – OPPORTUNITIES FOR ACTION Strengthen the Health Care Safety Net (Local and state financing, local and state health, health care providers, coalitions). In Nassau, a combination of clinics, hospitals, and private practices provide care to Nassau’s in need communities. The Nassau Health Care Corporation (NHCC) is the largest safety net provider and receives almost $20 million to support this effort. Through its anticipated reorganization and affiliation with the North Shore-Long Island Jewish Health System, there will be substantial opportunities to strengthen and expand the community health centers, improve prison health services, provide subsidized medications to ambulatory patients, and improve the hospital’s standing in the community. Subsidies to the NHCC should be contingent on meeting these basis community needs. Introduction: Nassau’s overall health compares favorably to other large counties, but the health of those in communities with large numbers of poor and minorities is far worse than that of the County as a whole. Among the reasons, cited previously in this report, are poverty, insufficient access to health care, unhealthy behaviors, inadequate housing and low educational attainment (see Appendix: Exhibit 1DEM8). Nassau has a long-standing commitment to public health. The county was one of the first suburban counties in the United States to establish a public hospital (Meadowbrook Hospital), followed by the creation of the A. Holly Patterson county nursing home (1952) and later a network of community health clinics under the Health Department (LHD). Over the past twenty years, Nassau has been a leader among suburban counties in confronting environmental hazards (ground water protection, marine environments), communicable diseases (AIDS, West Nile Virus), infant mortality (Infant Mortality Prevention Program, Perinatal Services Network), early childhood development (Early Intervention Program) and access to health care (Nassau County Charity Care Law). Provide Better Health Information on Community and Subpopulation Levels (Local and state agencies, local research universities and/or foundations). The use of better computer technology for analysis of electronic health information and new web presentations provide opportunities for the LHD to further its mission of distributing public health information in a timely and efficient manner. In particular, the provision of data on the health of small communities and health behaviors could enhance public health and health care planning in the region. To this end, the LHD is completing its first Behavioral Risk Factor Surveillance Survey (BRFSS) and is participating in the publication of the Long Island Social Health Index. However, the County still needs to conduct a Youth Risk Behavior Survey (YRBS) to complement these two studies. The LHD, as the leader of the local public health system, is responsible for setting public health priorities and identifying Opportunities for Action -- policies, programs, and community initiatives that have the greatest chance of making a real and lasting difference to the County’s health. These are referenced below by type of intervention (policy, program, county financial support/subsidy) or the part or parts of the public health system (local or state government, health providers, community-based organizations, etc.) most capable of taking the action. Expand HIV Prevention Programs (County and state support; state policy; health agencies and CBOs). AIDS continues to disproportionately affect African Americans. Although rates of AIDS and AIDS mortality have fallen due to better treatment, the proportion of cases among African Americans and Hispanics has increased. Underused prevention opportunities include providing condoms in schools, establishing needle exchange programs, expanding HIV testing sites and supporting “Prevention for Positives” case management programs. Health and Health Care Disparities Reducing or eliminating health disparities is a top priority for County Executive Suozzi’s administration. Maximize Enrollment in Health and Social Service Programs (County Health and Human Service agencies, managed care organizations, community-based organizations (CBOs), health providers). New York State has public health insurance programs (Medicaid, Child Health Plus, Family Health Plus, and subsidized insurance plans for small businesses), but many Nassau residents do not apply or enroll. A better understanding of barriers to participation, and closer coordination between County agencies, facilitated enrollers, health care providers and CBOs could increase enrollment in these programs, as well as WIC, food stamps and other entitlement services. Demographic Shifts Nassau is undergoing a rapid demographic shift reflected by growing racial and ethnic minority communities, and a rising proportion of persons over age 65. These changes will put new demands upon the medical, social services and education systems in the County. 33 Promote Culturally Competent Health Care (Health care providers, local and state health agencies). The MHTF also strongly recommended that all health care providers conduct internal assessments and develop systems and training to make their institutions and employees cognizant and sensitive to the cultural beliefs and practices of their patients. The LHD endorses that recommendation, and has supported these activities through the Nassau Partnership for Healthy Communities. providing more exercise and healthier food in the schools. The LHD will be encouraging school districts to adopt healthy dietary practices, limit the sale of sodas and candy in vending machines, and increase the time devoted to vigorous exercise during the school day. Promoting physical activity beyond school years is a multi-billion dollar industry. Potential local public health interventions include promoting non-vehicular commuting (bike and walk to public transportation, and worksite physical activity programs). Create Point of Entry System for Long Term Care in Nassau County (NYS Office of the Aging and NYS Department of Health). The development of a Point of Entry System for Long Term Care will seek proposals from counties for offering information, assistance and screening for all long term care services. Phase Two Point of Entry will provide a comprehensive needs assessment, authorization for publicly-funded long term care services and case management assistance. Reduce High Risk Sexual Behavior (Local programs, local and state financial support). Some of the most striking health disparities (rates of HIV infection, hepatitis B, syphilis and teen pregnancy) are tied to high-risk sexual behavior, including unprotected intercourse. While rates of most sexually transmitted diseases and teen pregnancies have been declining for the past 20 years, rates in minority communities are still disproportionately high. Many different parts of the health care system, including health care providers, schools, religious institutions, and community based organizations will need to continue to provide accurate information and teach skills to teens and young adults. It is equally important to assure free or low cost family planning services (including emergency contraception) through Title X family planning programs. Unhealthy Behaviors Certain behaviors put individuals and communities at risk for poor health and increased rates of disease and premature death from chronic disease. Changing dangerous and unhealthy behaviors is difficult and requires the sustained commitment of many different groups and agencies, with success measured over the course of years or even decades. Provide Substance Abuse Treatment and Services (Local programs, state policy). Drug and alcohol abuse and addiction cause substantial morbidity and social and economic burdens to society. Nassau needs to increase the number of inpatient detoxification and treatment facilities and promote the use of buphenorphine (an opiate agonist-antagonist) as an alternative to long-term methadone treatment. Build on successes in tobacco control (Local and state financial support, state policies, local programs). Despite recent reductions in the prevalence of smoking, tobacco is still the foremost cause of preventable deaths and illness in Nassau County. Approximately 18% of adults in Nassau County smoke (2003 NYS Expanded BRFSS). The LHD endorses various measures to further reduce smoking, and prevent initiation, including increasing the tax on tobacco products, continuing enforcement of the Adolescent Tobacco Use Prevention Act. (ATUPA) restricting tobacco sales to minors and funding counter-marketing campaigns. A portion of the States Attorney Generals’ settlement award should be dedicated to tobacco control efforts. Public Health Infrastructure The threat of bioterrorism, newly emerging infectious diseases and a potential influenza pandemic have brought about new, unprecedented responsibilities for public health agencies which call for an assessment of core capacities and a recognition of the need for capacity building to contend with the growing importance of preventing or reducing chronic disease, especially those tied to unhealthy behaviors. Encourage Exercise and Healthy Diets (Programs and environmental intervention; schools, local and state health, local planning agencies). The percentage of Nassau County adults who are overweight or obese is now over 50%. More alarming, a growing percentage of school-age children in New York State are overweight (20%). Stopping and reversing this trend will require a change in policies, programs and environmental interventions, although few of them have proven effective. One of the few promising interventions is Establish or Expand Public Health Coalitions and Partnerships (Local government, professional organizations, health care providers, academia, CBOs). Because so many different organizations share at least some of a public health mission, coalitions and partnerships are effective mechanisms for focusing interest, leveraging resources, and implementing creative solutions. The LHD should develop or continue 34 partnerships focused on oral health, chronic disease control and prevention, health disparities and health care access. Coalitions are also important for attracting outside funding for local initiatives. programs to prevent spills and clean up existing contaminants, the LHD will review and provide opinions on any policy or proposal that will impact on the aquifers. Improve Emergency Response Capabilities (State and local health agencies, emergency management, fire, police, EMS, health care providers). Since the late 1990’s, there has been growing awareness of the threat posed by natural or man-made (bioterrorism) epidemics, and the role that public health would play in identifying the outbreak, mitigating its effect, and communicating about the threat. The LHD will continue to develop and modify its emergency response plans in conjunction with Nassau County OEM, train LHD and other HHS staff in disaster response and incident command, and test our capabilities through drills and exercises. Provide Public Health Input for Land Use, Planning and Transportation (Regional Planning Association, private developers, Metropolitan Transportation Association, towns and villages). The growth of Long Island depended on private automobiles, which in turn guided many of the planning decisions over the past 50 years. However, automobile traffic is the foremost cause of air pollution on Long Island, and development that favors the use of private cars also deters people from walking and exercising. County Executive Suozzi has advocated for the development of walkable communities, the reinvigoration of downtowns, and the expansion of public transportation. The LHD will champion efforts that increase physical activity (walk to school program) and promote safe walking and biking (the Long Island Non-Motorized Transportation Study). Make Public Health Data and Information More Available (State and local health agencies, academic institutions). An effective public health system depends on accurate and timely information on the population’s health, including the appearance of new diseases, disease trends, program effectiveness and the prevalence of health determinants and behaviors. Even yearly updates are often out-of-date and do not adequately serve the needs of public health partners, political leaders or the community at large. The LHD should increase the resources directed at data collection, conducting epidemiological analysis and improving its communication capabilities, particularly using Web and geographic information systems (GIS) technology. Maternal and Child Health Work Towards Lead Poisoning Elimination (State and local health, medical professionals, builders and renovators). Lead levels, and instances of lead poisoning (lead >20 mg/dl) have declined in Nassau County, and we are at the point that we can look towards eliminating lead poisoning. This will require continued surveillance for and investigation of low-level poisoning, oversight of abatement efforts, education of homeowners who are renovating old homes and vigilance for the sale of lead-containing products sold as medicines, cosmetics or children’s toys. Environmental Health Add Fluoride to Public Water Supplies (Local policies and programs; health department, oral health coalition). The Centers for Disease Control selected fluoridation of public water supplies as one of the most important public health initiatives of the 20th century, yet not one of the 54 water districts serving Nassau County currently adds fluoride. Even at a time where fluoride is available in tablets, toothpastes and in dental sealants, water fluoridation protects and improves children’s oral health. According to the American Dental Association, despite the wide availability of fluoride from other sources, water fluoridation can reduce dental decay by 20-40%. The LHD, as part of the Nassau Oral Health Coalition, will engage politicians, health professionals, community leaders and water districts to reexamine the public health benefits of water fluoridation. Effectively Manage the Early Intervention (EI) and Pre-School Programs. The most expensive public health programs (excepting Medicaid and other health insurance programs) are EI and Pre-School. Every child suspected of having a developmental delay needs a prompt and accurate evaluation, and when eligible, receive effective treatment or services until the delay resolves or the child leaves the program. The LHD needs to work with school districts, service providers and parents to ensure that minority children are properly referred for evaluation and that services are provided in an equitable manner, without regard to community or school district. Re-establish MCH public health nursing program. One of the great traditions in public health is nurses assisting new mothers in caring for their babies. Several recent studies have shown that home visiting (especially when done by trained nurses) is highly effective in increasing maternal skills, preventing child abuse, preventing unintended pregnancies and boosting the child’s educational attainment. The LHD will pursue funding to reestablish a public health nursing program directed at assisting new, “high-risk” mothers. Continue Proactive Measures to Protect Sole Source Aquifer (State and local policies; state and local programs; Department of Environmental Conservation, NYSDOH, LHD, water districts, environmentalists). Long Island has one of the great water supplies on the east coast. Policies and regulations need to provide for its continued purity. In addition to continuing its various 35 References 1 Wikipedia. http://www.worldhistory.com. 2 U. S. Census Bureau. http://www.census.gov/. 3 ibid. 4 U.S. Census, American Community Survey 2003 5 U. S. Census Bureau. http://www.census.gov/ New York State Department of Labor. 6 7 Centers for Disease Control (CDC) National Immunization Program 8 NYSDOH, www.health.state.ny.us. 9 Trust for America’s Health, “F As in Fat: How Obesity Policies are Failing in America” http://www.healthyamericans.org 10 New York State Oral Health Surveillance System. 11 Schools included in the survey were: Centennial Avenue School, Roosevelt NY, Franklin School, Hempstead, NY, Fulton School, Hempstead, NY, Harry D. Daniels, Roosevelt NY, Kennedy School, Great Neck, NY, Lido Elementary, Long Beach, NY, MG Rhodes School, Hempstead, NY, Stratford Road School, Plainview, NY, and Walnut Street School, Uniondale, NY 12 New York State Department of Health Cancer Registry. 13 The Behavioral Risk Factor Surveillance System estimates are based on a survey conducted by telephone interview. 14 U.S. Department of Health and Human Services (HHS), www.hhs.gov/news/press/2004pres/20040309.html. 15 NYSDOH-BRFSS County Level Prevalence Estimates for 1994-1998, issued December 2000. (Female BMI≥27.3, Male BMI≥27.8) 16 IOM. Medicare: A Strategy for Quality Assurance. Vol.1. Lohr, K.N., ed. Washington, DC: National Academy Press, 1998 17 Erase Racism, www.eraseracismny.org 18 Georgetown University Center for Child and Health Development, http://gucchd.georgetown.edu/nccc 19 National Public Health Performance Standards Program (NPHPSP) Local Public Health System Performance Assessment Instrument (5B). 36 APPENDICES 37 APPENDIX 1 – Demographics Exhibit 1DEM 1 – Population, Nassau County vs. New York State, 1960-2000 (Graph)..........................39 Exhibit 1DEM 2 – Trend in White Residency, by County Subdivision, 1960-2000 (Graph) ......................39 Exhibit 1DEM 3 – Trend in Black Residency, by County Subdivision, 1960-2000 (Graph) ......................40 Exhibit 1DEM 4 – Trend in Hispanic Residency, by County Subdivision, 1980-2000 (Graph) .................40 Exhibit 1DEM 5 – Population Pyramid, Total Population by Age and Sex, 2000 (Graph)......................41 Exhibit 1DEM 6 – Population Pyramid, Blacks by Age and Sex, 2000 (Graph)........................................41 Exhibit 1DEM 7 – Population Pyramid, Hispanics by Age and Sex, 2000 (Graph) ..................................41 Exhibit 1DEM 8 – Characteristics of Selected Communities in Nassau County (Table).........................42 (a) Demographic ...............................................................................................................42 (b) Housing ..........................................................................................................................42 (c) Economic.......................................................................................................................43 (d) Social..............................................................................................................................43 (e) Health .............................................................................................................................44 Exhibit 1DEM 9 – Community Need Index for Nassau County, 2000 (Table) ..........................................45 Exhibit 1DEM10 – Perinatal Risk Assessment by Zip Code, 2000-2002 (Table) .........................................46 Exhibit 1DEM11 – Public Assistance Recipients in Nassau County, 2001-2003 (Table)...........................47 Exhibit 1DEM12 – Medicaid Eligible Recipients in Nassau County, 2001-2003 (Table) ..........................48 38 Exhibit 1DEM 1 POPULATION NASSAU COUNTY vs. NEW YORK STATE 1960-2000 Nassau County New York State 20,000 NUMBER (in thousands) 17,500 15,000 12,500 10,000 7,500 5,000 2,500 1960 1970 1980 1990 2000 YEAR Source: U.S. Census Exhibit 1DEM 2 TREND IN WHITE RESIDENCY IN NASSAU COUNTY BY COUNTY SUBDIVISION 1960-2000 800 NUMBER (in thousands) 700 No. Hempstead Hempstead Oyster Bay Long Beach Glen Cove 600 500 400 300 200 100 1960 1970 1980 YEAR Source: U.S. Census 39 1990 2000 Exhibit 1DEM 3 TREND IN BLACK RESIDENCY IN NASSAU COUNTY BY COUNTY SUBDIVISION 1960-2000 No. Hempstead Hempstead Oyster Bay Long Beach Glen Cove NUMBER (in thousands) 100 80 60 40 20 1960 1970 1980 1990 2000 YEAR Source: U.S. Census Exhibit 1DEM 4 TREND IN HISPANIC RESIDENCY IN NASSAU COUNTY BY COUNTY SUBDIVISION 1980-2000 NUMBER (in thousands) 100 80 60 40 20 1980 1990 2000 YEAR Source: U.S. Census 40 No. Hempstead Hempstead Oyster Bay Long Beach Glen Cove Exhibit 1DEM 5 Exhibit 1 DEM 6 NASSAU COUNTY BLACK POPULATION BY AGE AND SEX 2000 85+ 80-84 Females Males 75-79 70-74 65-69 60-64 55-59 AGE 50-54 45-49 40-44 35-39 30-34 25-29 20-24 15-19 10-14 05-09 00-04 6 4 2 0 2 4 6 PERCENT Source: U.S. Census 2000 Exhibit 1DEM 7 NASSAU COUNTY HISPANIC POPULATION BY AGE AND SEX 2000 85+ 80-84 Females Males 75-79 70-74 65-69 60-64 55-59 AGE 50-54 45-49 40-44 35-39 30-34 25-29 20-24 15-19 10-14 05-09 00-04 6 Source: U.S. Census 2000 4 2 0 PERCENT 41 2 4 6 Exhibit 1DEM 8 COMMUNITIES IN NASSAU COUNTY SELECTED BY DEMOGRAPHIC, HOUSING, ECONOMIC, SOCIAL AND HEALTH CHARACTERISTICS (In rank order of the Community Needs Index1) DEMOGRAPHICS ZIP CODE REGION/ COMMUNITY CNI1 (HIGH & MED ONLY) NYS Perinatal Avg.Decile Rank2 United States New York State Nassau County 11575 Roosevelt H 9.3 AGE Population U.S. Census 2000 RACE Median Age % White % Black ETHNICITY % Asian % Other % Hispanic Origin 281,421,906 35.3 75.1 12.3 3.6 9.0 18,976,457 36.0 67.9 15.9 5.5 10.7 12.5 15.1 1,334,544 38.0 79.3 10.1 4.7 5.7 10.0 15,975 31.7 8.2 78.8 0.5 12.5 16.2 31.0 11550 Hempstead Village H 8.8 59,022 29.6 27.8 50.9 1.3 20.0 11553 Uniondale H 8.6 34.8 26.7 56.1 2.1 15.1 22.6 11096 Inwood H 8.3 23,452 7,975 7,975.0 34.3 49.6 28.8 2.1 19.5 27.5 33.3 11520 Freeport H 8.1 44,026 34.6 42.6 32.9 1.4 23.1 11050 Port Washington H NA 28,545 39.6 84.0 2.2 8.5 5.3 11.7 11590 Westbury H 7.6 42,507 35.5 59.4 23.9 5.6 11.1 22.0 11561 Long Beach M 6.4 39,582 40.0 85.5 5.6 2.2 6.7 11.8 11003 Elmont M 7.0 40,507 35.9 45.6 35.4 8.5 10.5 13.3 11542 Glen Cove M NA 27,693 38.7 80.9 6.2 4.1 8.8 19.4 11570 Rockville Centre M NA 27,827 39.9 84.3 9.8 1.5 4.4 7.8 11554 East Meadow M NA 37,458 38.6 85.3 4.3 6.7 3.7 7.0 11552 11558 11001 West Hempstead Island Park Floral Park M M M NA NA NA 23,309 8,553 25,511 37.3 39.5 39.1 71.5 91.1 83.1 18.0 0.9 4.6 4.4 1.4 7.9 6.1 6.6 4.4 9.2 13.6 7.3 HOUSING ZIP CODE REGION/ COMMUNITY CNI1 (HIGH & MED ONLY) NYS Perinatal Avg.Decile Rank2 United States New York State Nassau County HOUSING CHARACTERISTICS Housing Units Households Families 105,539,122 72,261,780 105,480,101 7,060,595 4,673,485 7,056,860 447,387 347,172 Housing Unit Density (Per Sq. Mile) 458,151 1,598.0 11575 Roosevelt H 9.3 4,104 3,362 4,234 2,343.5 11550 Hempstead Village H 8.8 15,999 11,808 16,417 3,903.9 11553 Uniondale H 8.6 6,146 4,933 6,321 2,271.4 11096 Inwood H 8.3 2,594 1,912 2,676 1,905.8 11520 Freeport H 8.1 13,504 9,911 13,819 2,770.5 11050 Port Washington H NA 10,450 7,799 10,708 1,083.6 11590 Westbury H 7.6 12,438 9,899 12,660 2,016.6 11561 Long Beach M 6.4 16,632 9,230 18,072 5,148.6 11003 Elmont M 7.0 9,902 7,842 10,151 3,691.5 11542 Glen Cove M NA 9,826 6,944 10,105 1,446.1 11570 Rockville Centre M NA 10,114 7,248 10,357 2,887.0 11554 East Meadow M NA 12,185 9,648 12,374 1,972.9 11552 11558 11001 West Hempstead Island Park Floral Park M M M NA NA NA 7,400 3,011 8,888 6,007 2,262 6,736 7,518 3,094 9,098 2,013.7 1,387.0 3,371.1 42 Exhibit 1DEM 8 (cont’d) ECONOMIC ZIP CODE REGION/ COMMUNITY CNI1 NYS Perinatal Avg.Decile Rank2 ECONOMIC CHARACTERISTICS % % % % Individuals Families Age 18 65 & Older Below Below Below Below Poverty Poverty Poverty Poverty Household Median Income Family Median Income Per Capita Income United States $ 41,994 $ 50,046 $ 21,587 12.4 9.2 16.1 9.9 New York State $ 43,393 $ 51,691 $ 23,389 14.6 11.5 19.6 11.3 (HIGH & MED ONLY) $ 72,030 $ 81,246 $ 32,151 5.2 3.5 5.8 5.6 11575 Roosevelt Nassau County H 9.3 $ 57,252 $ 56,528 $ 17,349 14.5 10.4 14.3 13.5 11550 Hempstead Village H 8.8 $ 46,291 $ 48,488 $ 16,134 17.0 13.8 16.7 15.5 11553 Uniondale H 8.6 $ 61,232 $ 67,264 $ 19,069 8.9 6.1 7.7 12.6 11096 Inwood H 8.3 $ 41,569 $ 47,325 $ 16,087 15.2 13.9 17.5 13.9 11520 Freeport H 8.1 $ 55,943 $ 61,658 $ 21,201 10.8 8.1 11.4 7.6 11050 Port Washington H NA $ 85,086 $ 102,064 $ 47,448 5.5 4.0 5.5 4.6 11590 Westbury H 7.6 $ 71,147 $ 74,520 $ 24,151 7.7 4.7 6.8 6.9 11561 Long Beach M 6.4 $ 57,657 $ 70,086 $ 32,127 8.7 5.7 9.1 10.0 11003 Elmont M 7.0 $ 62,511 $ 68,646 $ 22,111 7.5 5.4 8.3 6.5 11542 Glen Cove M NA $ 56,635 $ 64,237 $ 26,818 8.8 5.9 9.8 9.1 11570 Rockville Centre M NA $ 79,679 $ 102,184 $ 40,039 5.2 3.0 5.8 5.7 11554 East Meadow M NA $ 67,185 $ 74,691 $ 27,076 3.8 2.3 3.3 4.2 11552 11558 11001 West Hempstead Island Park Floral Park M M M NA NA NA $ $ $ 71,155 65,214 71,295 $ $ $ 76,897 71,568 82,667 $ $ $ 26,100 26,655 29,419 4.7 8.1 1.7 3.5 5.4 2.9 4.5 7.4 1.6 4.3 10.3 6.7 SOCIAL SOCIAL ZIP CODE REGION/ COMMUNITY CNI 1 (HIGH & MED ONLY) NYS Perinatal % Avg.Decile Female 2 Rank Householder SOCIAL CHARACTERISTICS % High School Graduate % Bachelor's Degree or Higher % Other Than English Spoken at Home United States 36.1 80.4 24.4 17.9 New York State 42.1 79.1 27.4 28.0 Nassau County 35.0 86.7 35.4 23.2 Public Assistance Recipients 3 Rank Medicaid Eligible Recipients 4 Rank 11575 Roosevelt H 9.3 50.9 71.6 14.6 22.1 1 1 11550 Hempstead Village H 8.8 52.0 67.6 16.5 36.6 2 2 11553 Uniondale H 8.6 44.9 73.0 19.2 35.9 3 3 11096 Inwood H 8.3 50.0 68.2 9.8 36.4 7 NA 11520 Freeport H 8.1 42.4 72.9 20.6 36.8 4 4 11050 Port Washington H NA 36.1 90.5 53.2 30.5 NA NA 5 11590 Westbury H 7.6 35.5 76.9 28.0 38.7 5 11561 Long Beach M 6.4 43.9 89.3 38.0 21.0 6 7 11003 Elmont M 7.0 40.7 79.7 21.3 38.7 9 8 11542 Glen Cove M NA 38.9 77.8 27.9 38.1 8 9 11570 Rockville Centre M NA 38.9 90.7 49.4 14.5 NA NA 11554 East Meadow M NA 33.3 86.5 29.0 21.3 NA NA 11552 11558 11001 West Hempstead Island Park Floral Park M M M NA NA NA 33.4 40.3 35.3 87.2 83.3 88.8 33.2 19.5 34.6 21.2 24.5 21.2 NA NA NA NA NA NA 43 Exhibit 1DEM 8 (cont’d) HEALTH ZIP CODE REGION/ COMMUNITY CNI1 NYS Perinatal Avg.Decile Rank2 HEALTH CHARACTERISTICS TEENS (15-19) Presumed Living with HIV/AIDS Rate8 Asthma Discharge Rate (Age 0-4)9 % Disabled 21-64 Years % Disabled 65 Years+ 43.0 114.7 60.6 19.2 41.9 31.7 530.7 66.1 21.0 40.3 30.4 15.3 132.7 48.0 15.5 31.4 123.9 71.3 719.9 133.8 33.5 40.8 Infant Mortality Rate5 Pregnancy Rate6 United States 7.0 83.6 New York State 5.9 57.4 Nassau County 4.8 15.6 (HIGH & MED ONLY) H 9.3 Birth Rate7 11575 Roosevelt 11550 Hempstead Village H 8.8 9.4 76.5 46.1 542.2 174.0 24.9 38.6 11553 Uniondale H 8.6 7.6 112.6 60.3 405.1 129.1 22.0 40.2 11096 Inwood H 8.3 11.9 122.9 75.0 125.4 130.6 28.7 39.6 11520 Freeport H 8.1 7.3 85.1 52.1 336.2 86.6 22.6 38.2 11050 Port Washington H NA 0.9 12.8 7.9 87.6 13.7 27.4 11590 Westbury H 7.6 7.5 89.3 54.4 272.9 22.1 37.1 11561 Long Beach M 6.4 5.3 45.0 21.5 139.0 19.9 38.8 11003 Elmont M 7.0 8.1 47.1 20.8 153.1 22.7 40.2 11542 Glen Cove M NA 5.5 45.9 48.4 133.6 NA 15.3 32.8 11570 Rockville Centre M NA 3.0 29.8 12.6 150.9 NA 12.7 30.6 NA 90.2 NA 81.1 11554 East Meadow M NA 4.7 14.2 5.4 122.8 NA 14.2 30.6 11552 11558 11001 West Hempstead Island Park Floral Park M M M NA NA NA 5.4 6.5 3.3 34.3 21.5 21.6 14.8 8.1 6.9 180.2 163.7 70.6 NA NA NA 13.6 13.6 12.0 32.0 30.8 31.9 All data are from the U.S. Census 2000 except where noted. 1 The Community Needs Index (CNI) is a composite measure of ten variables (rates for AIDS cases, newborn seroprevalence, HIV hospital discharges and indicators of high risk behaviors such as teenage pregnancy, low birthweight, sexually transmitted diseases and drug-related hospital discharges). It was developed by the NYSDOH AIDS Institute as a tool to target zip codes for HIV prevention purposes (see Exhibit 1DEM 9). 2 The 2000-2002 Perinatal Risk Assessment by Zip Code is an index from the NYSDOH Vital Statistics (based on % low birthweight, % out-ofwedlock births, % Medicaid births, % late/no prenatal care, infant mortality (death) rate, teen birth rate, teen pregnancy rate and total abortion ratios) to determine zip codes of need. The average decile ranking is 10.0 for most need and 0.0 for least need. (See Exhibit 1DEM 10). 3 The Public Assistance Recipients Rank is based on the rate per 1,000 population for zip codes housing the most public assistance recipients. #1 has the most and #10 has the least on the top ten list (see Exhibit 1DEM 12). 4 The Medicaid Eligible Recipients Rank is based on the rate per 1,000 population for zip codes housing the most Medicaid eligible recipients. #1 has the most and #10 has the least on the top ten list (see Exhibit 1DEM 13). 5 The Infant Mortality Rate is the number of infant deaths under 1 year of age per 1,000 live births. The United States 2002 data are from the National Center for Health Statistics (NCHS). Nassau County and New York State are 2002 data and the zip code data are an average of 2000-2002 from the NYSDOH. 6 The Teen Pregnancy Rate is the number of teen (age 15-19) pregnancies per 1,000 female population (age 15-19). Nassau County, New York State and the zip code data are an average of 2000-2002 from the NYSDOH. The U. S. data is an estimate by the Alan Guttmacher Institute, www.guttmacher.org. 7 The Teen Birth Rate is the number of live births to women (age 15-19) per 1,000 female population (age 15-19). Nassau County, New York State and the zip code data are an average of 2000-2002 from the NYSDOH. The U.S. data are 2002. 8 Rates for Nassau County, NYS and zip codes are based on data which are cumulative for cases diagnosed through December 31, 2003. HIV reporting began in June 2000. U.S. data are from the June 14, 2002 MMWR, 49(53), 1-102, “Summary of Notifiable Diseases in the United States, 2000”. 9 Nassau County, NYS and the zip code data are 2000-2002 average rate for asthma hospitalizations for 0-4 year olds. U.S. data is the estimated annual rate of physician office visits and hospital outpatient department visits in 1999 for asthma as the first-listed diagnosis in 0-4 year olds. National Ambulatory Medical Care Survey — United States, 1980–1999 and National Hospital Ambulatory Medical Care Survey — 1995–1999 44 Exhibit 1DEM 9 The Community Need Index (CNI) was developed to assist HIV prevention programs in targeting their efforts. The CNI is a composite measure that includes rates for AIDS cases, newborn seroprevalence, HIV hospital discharges and indicators of high risk behaviors such as teenage pregnancy, low birthweight, sexually transmitted diseases and drug-related hospital discharges. The ten variables included in the index are currently collected at the ZIP code level by the NYSDOH. COMMUNITY NEED INDEX FOR NASSAU COUNTY Risk Indicator Rates – HIV Infection/Illness Rates – AIDS Case Rates 25 Highest Ranking ZIP Codes a Refer to glossary for definitions. b 1996 Population estimates are from Claritas Inc. c All newborns residing in a zip code area that has no reported parents may not have tested, nor all tests completed, therefore it is possible that one or more HIV-positive newborns may reside there. d The 80th percentile of an indicator rate is the score above which 20% of the ZIP codes do not follow county boundaries. e Bold indicates rates that are among the top twenty percent within their category in the CNI statistical area. f Underscore indicates rates that are based on small denominations and high data variability in a 3 year period. Source: New York State Department of Health AIDS Institute 45 Exhibit 1DEM 10 PERINATAL RISK ASSESSMENT BY CODE* ZIP CODE PERINATAL DECILE RANK BY ZIP NASSAU COUNTY NASSAU COUNTY 2000-2002 2000-2002 2000-2002 Zip Code Community Total Pregnancies 15-44 Vital Statistics Risk Indicators Total Births 15-19 15-44 %LBW 15-19 %OOW %MA %PNC Average Inf. Mort. Birth Rate Preg. Rate Decile Rank** Rate 15-19 15-19 11575 Roosevelt 1,398 219 896 126 10.2 62.1 47.8 8.0 15.6 71.3 123.9 9.3 11550 Hempstead 5,080 617 3,404 372 10.2 59.4 55.1 5.7 9.4 46.1 76.5 8.8 1,707 194 1,182 106 8.9 47.9 40.1 4.3 7.6 47.8 87.5 8.6 429 61 335 36 9.6 44.2 42.5 7.6 11.9 49.2 83.4 8.3 2,855 320 2,049 194 9.7 46.6 40.4 4.5 7.3 46.7 77.1 8.1 11553 Uniondale 11096 Inwood 11520 Freeport 11590 Westbury 2,737 306 2,134 188 7.7 40.3 42.1 3.4 7.5 49.3 80.2 7.6 11003 Elmont 2,148 144 1,607 65 7.8 29.2 26.9 5.3 8.1 16.7 37.1 7.0 11561 Long Beach 1,718 116 1,313 53 9.5 20.9 16.3 4.1 5.3 21.6 47.2 6.4 Nassau County 58,393 3,981 47,866 1,708 7.6 18.6 20.0 2.5 5.2 15.3 30.4 New York State 1,014,253 125,142 1,080,275 59,120 7.8 36.3 41.3 6.2 6.0 31.7 57.4 *Age-specific comparison of pregnancy, birth count and vital statistics risk indicators for Upstate NY zip codes with 100+ pregnancies in 2000-2002. **Decile Rank based on % Low birthweight, % Out-of-wedlock births, % Medicaid births, % Late/no prenatal care, Infant mortality rate, Teen birth rate, Teen pregnancy rate and Total abortion ratios. Source: New York State Department of Health Vital Statistics 46 Exhibit 1DEM 11 PUBLIC ASSISTANCE RECIPIENTS IN NASSAU COUNTY 2001-2003 RECIPIENTS COMMUNITY 2001 Hempstead 2002 TOTAL 2001-2003 % of TOTAL 2003 AVG. YEARLY RATE* RANK 2,474 2,196 2,260 6,930 25.7% 39.1 2 Roosevelt 901 828 989 2,718 11.2% 56.7 1 Freeport 763 780 872 2,415 9.9% 18.4 4 Westbury 562 538 592 1,692 6.7% 13.3 5 Uniondale 422 480 437 1,339 5.0% 19.4 3 Long Beach 347 286 358 991 4.1% 8.4 6 Elmont 219 214 253 686 2.9% 5.7 9 Inwood 240 196 197 633 2.2% 8.3 7 Glen Cove 173 165 184 522 2.1% 6.3 8 Baldwin 152 141 162 455 1.8% 4.7 10 SELECTED COMMUNITIES 6,253 5,824 6,304 18,381 71.6% 18.0 Rest of County 2,180 2,100 2,496 6,776 28.4% 2.3 NASSAU COUNTY 8,433 7,924 8,800 25,157 100.0% 6.3 *Per 1,000 population (U.S. Census 2000) Source: Nassau County Department of Social Services 47 Exhibit 1DEM 12 MEDICAID ELIGIBLE RECIPIENTS* IN NASSAU COUNTY 2001-2003 RECIPIENTS COMMUNITY TOTAL 2001-2003 %of TOTAL AVG. YEARLY RATE** RANK 2001 2002 2003 10,050 10,134 13,646 33,830 15.3% 191.1 2 Freeport 5,036 5,225 7,580 17,841 8.1% 135.8 4 Westbury 3,634 3,760 5,675 13,069 5.9% 102.5 5 Uniondale 2,995 3,183 4,493 10,671 4.8% 154.6 3 Roosevelt 2,944 3,089 4,050 10,083 4.6% 210.4 1 Long Beach 2,918 2,903 3,525 9,346 4.2% 78.7 7 Elmont 2,451 2,613 4,001 9,065 4.1% 74.6 8 Valley Stream 1,790 2,005 3,445 7,240 3.3% 63.9 10 Glen Cove 1,803 1,771 2,487 6,061 2.7% 73.0 9 Great Neck 1,331 1,392 2,004 4,727 2.1% 79.5 6 34,952 36,075 50,906 121,933 55.2% 116.2 27,846 29,561 41,413 98,820 44.8% 33.5 62,798 65,636 92,319 220,753 100.0% 55.1 Hempstead SELECTED COMMUNITIES Rest of County NASSAU COUNTY *Includes all Public Assistance and Medical Assistance Categories **Per 1,000 population (U.S. Census 2000) Source: Nassau County Department of Social Services 48 APPENDIX 2 – Births (Natality) Exhibit 2BIR 1 – Prenatal Care in Nassau County, by Race and Ethnicity, 1993-2002 (Graph) ............50 Exhibit 2BIR 2 – Percent of Mothers Initiating Prenatal Care in the 1st Trimester, by Selected Community, 1993-2002 (Graph) ..........................................................................................50 Exhibit 2BIR 3 – Births with Early Prenatal Care in Nassau County, by Mother’s Age and Race, 1985-2002 (Table) ..............................................................................................51 Exhibit 2BIR 4 – Births with Early Prenatal Care in Nassau County, by Mothers < 20, by Selected Communities, 1980-2002 (Table) ...................................................................52 Exhibit 2BIR 5 – Early Prenatal Care to Mothers <20 in Nassau County, by Race and Ethnicity, 1993-2002 (Graph) ................................................................................................53 Exhibit 2BIR 6 – Infant Mortality Rates, Nassau County, Upstate NY and the US, 1950-2002 (Graph) .................................................................................................................53 Exhibit 2BIR 7 – Infant Mortality Rates, By Race and Hispanic Origin, Nassau County and United States, 1975-2002 (Table) .................................................................................54 Exhibit 2BIR 8 – Infant Mortality Rates, By Region, Nassau County, Other Counties, Upstate NY, NYS and the United States (Table) ................................................................55 49 Exhibit 2BIR 1 EARLY PRENATAL CARE* BY MOTHER'S RACE AND ETHNICITY 1993-2002 PERCENT OF LIVE BIRTHS PERCENT OF BIRTHS 100.0 White, Non Hispanic Black, Non Hispanic Hispanic Asian, All except Hispanic Nassau County 80.0 60.0 40.0 20.0 0.0 1993 1994 1995 1996 1997 1998 1999 2000 2001 2002 YEAR *Initiated within the first trimester Source: New York State Department of Health Exhibit 2BIR 2 % OF MOTHERS INITIATING PRENATAL CARE IN 1ST TRIMESTER BY SELECTED COMMUNITIES Select Communities 1993-2002 Other Communities PERCENT OF LIVE BIRTHS 100 Nassau County HP 2010 Objective 80 60 40 20 0 1993 1994 1995 1996 1997 YEAR Source: New York State Department of Health 50 1998 1999 2000 2001 2002 Exhibit 2BIR 3 BIRTHS WITH EARLY PRENATAL CARE* IN NASSAU COUNTY BY MOTHER'S AGE AND RACE 1985-2002 NUMBER OF BIRTHS WITH EARLY PRENATAL CARE BY AGE AND RACE AGE < 20 AGE 20 + ALL AGES YEAR WHITE BLACK OTHER TOTAL WHITE BLACK OTHER TOTAL WHITE BLACK OTHER TOTAL 1985 177 179 2 358 11,713 986 281 12,980 11,890 1,165 283 13,338 1990 245 169 1 415 13,975 1,366 473 15,814 14,220 1,535 474 16,229 1995 219 138 5 362 12,605 1,308 576 14,489 12,824 1,446 552 14,851 1996 211 133 5 349 12,545 1,286 611 14,442 12,756 1,419 598 14,791 1997 200 108 8 316 12,217 1,278 657 14,152 12,420 1,386 665 14,471 1998 233 126 8 367 12,150 1,436 689 14,275 12,383 1,562 697 14,642 1999 226 117 4 349 12,045 1,440 674 14,182 12,271 1,557 678 14,531 2000 207 93 5 305 11,707 1,396 739 13,885 11,914 1,489 744 14,190 2001 200 106 5 312 11,131 1,363 714 13,246 11,331 1,469 719 13,558 2002 213 100 11 324 11,211 1,369 936 13,540 11,424 1,469 947 13,864 PERCENT OF ALL BIRTHS WITH EARLY PRENATAL CARE BY AGE AND RACE AGE < 20 ALL AGES AGE 20 + YEAR WHITE BLACK OTHER TOTAL WHITE BLACK OTHER TOTAL WHITE BLACK OTHER TOTAL 1985 55.7 46.4 28.6 49.8 91.9 67.5 84.4 89.3 91.0 63.1 83.2 87.3 1990 67.1 55.4 25.0 61.1 92.9 72.2 83.3 90.3 92.2 69.3 82.9 89.1 1995 57.0 52.9 45.5 55.2 89.0 71.3 80.9 86.7 88.2 69.0 80.3 85.5 1996 56.9 55.2 83.3 56.5 89.2 72.7 83.8 87.2 88.4 70.6 83.9 86.1 1997 58.0 49.5 72.7 55.0 88.0 70.3 82.4 85.6 89.4 70.2 83.9 86.9 1998 59.2 51.9 53.3 56.0 88.4 73.9 85.1 86.4 89.8 73.6 84.0 87.5 1999 64.4 54.7 33.3 60.2 88.7 74.4 83.4 86.7 89.8 74.7 85.3 87.7 2000 55.3 46.5 41.7 52.0 87.1 70.2 80.3 84.7 86.3 68.1 79.8 83.6 2001 57.1 50.7 45.5 54.6 86.9 71.2 77.4 84.4 86.1 69.2 77.1 83.4 2002 60.2 49.0 57.9 56.1 87.8 74.2 84.6 85.9 87.0 71.7 84.2 84.9 *Mothers who received care during the first three months of pregnancy Totals may include unknowns. Source: New York State Department of Health 51 Exhibit 2BIR 4 BIRTHS IN NASSAU COUNTY WITH EARLY PRENATAL CARE TO MOTHERS < 20 BY SELECTED COMMUNITIES 1980-2002 NUMBER OF BIRTHS WITH EARLY PRENATAL CARE TO MOTHERS UNDER 20 SELECTED COMMUNITIES YEAR TOTAL 11520 11550 11096 11561 11590 11575 11553 Selected Freeport Hempstead Inwood Long Beach Westbury Roosevelt Uniondale Communities Rest of County Nassau County 1980 48 50 7 19 7 37 NA 168 165 333 1985 45 62 6 27 15 29 NA 184 166 350 1990 40 80 3 14 26 47 NA 210 197 407 1995 46 84 6 18 22 30 17 223 142 365 1996 39 69 5 11 31 25 20 200 154 354 1997 53 52 7 17 17 22 23 191 128 319 1998 49 83 4 18 35 22 19 230 137 367 1999 45 73 3 13 36 20 17 207 142 349 2000 31 76 5 6 40 17 18 193 112 305 2001 43 60 5 9 39 27 25 208 104 312 2002 36 69 5 12 41 17 22 202 122 324 PERCENT OF ALL BIRTHS WITH EARLY PRENATAL CARE TO MOTHERS UNDER 20 SELECTED COMMUNITIES YEAR TOTAL 11520 11550 11096 11561 11590 11575 11553 Selected Freeport Hempstead Inwood Long Beach Westbury Roosevelt Uniondale Communities Rest of County Nassau County 1980 48.5 45.4 66.7 63.3 29.2 58.1 NA 49.4 48.4 48.9 1985 57.0 45.3 37.5 58.7 32.6 47.5 NA 47.8 52.2 49.8 1990 53.3 60.6 75.0 66.7 60.5 62.7 NA 60.0 62.3 61.1 1995 56.1 53.9 54.5 72.0 37.9 62.5 51.5 54.0 57.3 55.2 1996 57.4 59.0 55.6 52.4 50.0 53.2 62.5 55.9 57.5 56.7 1997 57.6 51.0 50.0 63.0 50.0 53.7 59.0 54.6 56.1 55.2 1998 62.0 61.5 50.0 56.3 61.4 43.1 51.4 57.6 53.5 56.0 1999 68.2 59.3 27.3 52.0 66.7 54.1 53.1 59.5 61.2 60.2 2000 50.0 58.5 45.5 35.3 56.3 44.7 52.9 53.2 50.0 51.9 2001 58.1 53.6 41.7 56.3 62.9 54.0 73.5 57.8 49.3 54.6 2002 60.0 50.7 38.5 54.5 70.7 40.5 57.9 54.7 58.4 56.1 Communities are defined by zip codes beginning with 1990. Prior to 1990, the communities are described by census tract. Source : New York State Department of Health 52 Exhibit 2BIR 5 EARLY PRENATAL CARE TO MOTHERS <20 IN NASSAU COUNTY BY RACE AND ETHNICITY 1993-2002 PERCENT OF TEEN BIRTHS 100.0 White, Non Hispanic Black, Non Hispanic Hispanic Asian, All except Hispanic 80.0 60.0 40.0 20.0 0.0 1993 1994 1995 1996 1997 1998 1999 2000 2001 2002 YEAR Source: New York State Department of Health Exhibit 2BIR 6 INFANT MORTALITY RATES NASSAU COUNTY, UPSTATE NY AND US 1950-2002 30 Nassau County Upstate NYS United States 20 15 10 HP 2010 Objective 5 YEAR Source: New York State Department of Health, National Center for Health Statistics 53 2002 2001 2000 1999 1998 1997 1996 1995 1994 1993 1992 1991 1990 1989 1988 1987 1986 1985 1984 1983 1982 1981 1980 1979 1978 1977 1976 1975 1970 1960 0 1950 RATE (per 1,000 Live Births) 25 Exhibit 2BIR 7 INFANT MORTALITY RATES BY RACE AND HISPANIC ORIGIN NASSAU COUNTY AND UNITED STATES 1975-2002 2010 Objective = 4.5* WHITE YEAR Nassau County BLACK United States Nassau County ALL RACES** United States Nassau County HISPANIC*** United States Nassau County United States 1975 11.3 14.2 29.1 26.2 13.4 16.1 NA NA 1976 12.2 13.3 32.0 25.5 14.3 15.2 NA NA 1977 10.3 12.3 30.7 23.6 12.4 14.1 NA NA 1978 9.4 12.0 33.3 23.1 11.9 13.8 NA NA 1979 9.6 11.4 32.5 21.8 12.1 13.1 NA NA 1980 9.6 11.0 24.7 21.4 11.2 12.6 NA NA 1981 9.1 10.5 29.1 20.0 11.2 11.9 NA NA 1982 8.3 10.1 27.7 19.6 10.7 11.5 NA NA 1983 8.5 9.7 22.1 19.2 10.0 11.2 NA 9.5 1984 6.8 9.4 22.7 18.4 8.8 10.8 NA 1985 7.2 9.3 22.4 18.2 9.1 10.6 NA 1986 8.0 8.9 25.4 18.0 10.1 10.4 NA NA 1987 7.0 8.6 31.2 17.9 10.1 10.1 NA NA 1988 6.6 8.4 23.3 18.5 8.7 9.9 NA NA 1989 7.8 8.1 26.6 18.6 10.2 9.8 NA NA 1990 5.7 7.6 21.8 18.0 7.6 9.2 NA 1991 5.9 7.3 15.7 17.6 7.3 8.9 6.9 NA 1992 4.9 6.9 18.2 16.8 6.7 8.5 4.7 NA 1993 4.0 6.8 15.1 16.5 5.5 8.4 5.1 NA NA NA 8.8 7.5 1994 4.6 6.6 21.4 15.8 6.8 7.9 4.1 1995 4.2 6.3 13.1 15.1 5.3 7.6 6.7 6.3 1996 3.8 6.0 16.7 14.2 5.4 7.2 5.6 6.1 1997 3.2 6.0 15.2 14.2 4.9 7.2 5.5 6.0 1998 3.9 6.0 15.1 14.3 5.4 7.2 6.7 5.8 1999 4.0 5.8 11.6 14.6 5.0 7.1 6.2 5.7 2000 4.4 5.7 12.8 14.1 5.7 6.9 5.7 5.6 2001 4.3 5.7 11.8 14.0 5.2 6.8 5.1 5.4 2002 3.7 5.8 12.2 14.4 4.8 7.0 6.3 5.6 *Rates are per 1,000 live births. **Includes unknown and other races. ***HISPANIC is not a race and is not included in the ALL RACES total. NA = No available data. Source: NYSDOH Vital Statistics and National Center for Health Statistics 54 Exhibit 2BIR 8 INFANT MORTALITY RATES BY REGION NASSAU COUNTY, OTHER COUNTIES, UPSTATE NY, NYS AND THE US 1950-2002 2010 Objective = 4.5* YEAR 1950 1955 1960 1965 1970 1975 1976 1977 1978 1979 1980 1981 1982 1983 1984 1985 1986 1987 1988 1989 1990 1991 1992 1993 1994 1995 1996 1997 1998 1999 2000 2001 2002 NASSAU COUNTY # RATE 334 20.2 467 18.3 487 19.3 406 19.3 276 15.9 170 13.4 187 14.3 160 12.4 154 11.9 163 12.2 154 11.4 159 11.4 154 10.7 144 9.9 127 8.7 139 9.1 150 9.6 169 10.2 149 8.7 180 10.2 138 7.6 130 7.3 121 6.7 98 5.5 121 6.8 95 5.3 96 5.4 83 4.9 93 5.4 85 5.0 97 5.7 84 5.2 79 4.8 WESTCHESTER SUFFOLK NA NA NA NA NA NA NA NA UPSTATE NY NYC NYS US RATES 18.2 15.0 12.7 11.8 11.3 11.1 10.2 10.9 11.0 9.3 9.9 9.2 8.6 9.2 8.4 9.1 7.1 6.5 6.3 7.1 6.1 5.4 4.5 5.1 5.2 4.2 4.9 3.8 4.5 17.7 11.4 12.4 10.0 11.9 10.3 9.6 8.8 8.7 9.0 8.7 9.9 7.4 7.8 8.0 8.1 8.4 7.2 6.6 5.5 5.9 6.4 5.1 6.2 4.7 5.9 4.6 4.6 5.1 *Rates are per 1,000 live births Source : NYSDOH and Center for Health Statistics 55 25.0 26.5 26.3 25.8 21.8 17.9 18.1 17.0 16.0 15.7 15.1 14.5 14.5 13.6 12.8 12.8 12.4 12.7 13.2 13.1 11.5 11.3 10.0 9.8 8.7 8.6 7.7 7.0 6.6 6.6 6.3 5.6 5.8 24.6 22.5 22.3 21.3 17.7 14.2 14.0 12.2 12.3 11.9 10.5 10.6 10.3 9.9 9.4 9.1 9.2 9.0 8.7 8.5 7.8 7.6 7.6 7.0 6.8 6.7 6.3 6.5 5.9 6.0 6.3 5.9 6.0 24.8 24.3 24.1 23.4 19.6 15.8 15.8 14.3 13.9 13.5 12.5 12.3 12.2 11.5 10.9 10.7 10.6 10.7 10.7 10.6 9.5 9.3 8.7 8.3 7.7 7.6 6.9 6.7 6.2 6.3 6.3 5.7 5.9 29.2 NA 26.0 NA 20.0 16.1 15.2 14.1 13.8 13.1 12.6 11.9 11.5 11.2 10.8 10.6 10.4 10.1 9.9 9.8 9.2 8.9 8.5 8.4 7.9 7.6 7.2 7.2 7.2 7.1 6.9 6.8 7.0 APPENDIX 3 - Teen Pregnancy and Family Planning Exhibit 3TPFP 1 – Teen Birth and Pregnancy Rates, Nassau County, Upstate NY and 1980-2002 (Table) ................................................................................................................57 Exhibit 3TPFP 2 – Trend in Teen Pregnancy Rates, Nassau County, Upstate NY, United States, 1980-2002 (Graph).....................................................................................58 Exhibit 3TPFP 3 – Trend in Teen Birth Rates, Nassau County, Upstate NY, United States, 1980-2002 (Graph) ..............................................................................................................58 Exhibit 3TPFP 4 – Teen Pregnancy Outcomes, Nassau County, 1980-2002 (Table) ................................59 Exhibit 3TPFP 5 – Pregnancy Outcomes, Nassau County, By Age and Race, 2002 (Table) .................60 Exhibit 3TPFP 6 – All Pregnancy Outcomes, Nassau County, 1980-2002 (Table).....................................61 Exhibit 3TPFP 7 – Trend in Pregnancy Outcomes, Nassau County, 1980-2002 (Graph) .........................62 Exhibit 3TPFP 8 – Induced Terminations of Pregnancy, By Race, Nassau County, 1991-2000 (Graph) ..............................................................................................................62 56 Exhibit 3TPFP 1 TEEN BIRTH AND PREGNANCY RATES* NASSAU COUNTY, UPSTATE NEW YORK AND UNITED STATES: 1980-2002 BIRTH RATES PREGNANCY RATES YEAR NASSAU UPSTATE US NASSAU UPSTATE 1980 10.6 27.2 53.0 38.5 57.9 1981 11.8 28.0 52.2 54.4 63.9 1982 13.2 29.1 52.4 62.1 67.8 1983 13.9 29.4 51.4 56.2 65.9 1984 12.8 29.2 50.6 54.9 66.1 1985 14.1 29.7 51.0 56.9 66.6 1986 13.9 29.5 50.2 53.8 64.9 1987 14.3 30.0 50.6 58.3 66.0 1988 14.7 31.4 53.0 54.5 67.0 1989 15.8 33.5 57.3 50.0 70.5 1990 16.5 34.4 60.3 54.3 69.5 1991 16.6 34.7 59.0 54.4 67.3 1992 15.8 33.5 58.2 47.1 64.4 1993 18.4 34.2 59.0 49.4 64.3 1994 18.2 34.5 58.2 49.6 64.3 1995 18.0 32.9 56.0 48.6 61.5 1996 16.8 32.2 53.5 47.4 61.2 1997 15.2 30.5 51.3 40.0 57.3 1998 17.2 30.6 50.3 38.2 54.7 1999 15.1 29.7 48.8 37.1 52.9 2000 14.5 27.5 47.7 35.7 49.7 2001 14.1 26.0 45.3 34.6 46.7 2002 13.7 24.4 42.9 30.3 44.2 *Rates per 1,000 women between 15 and 19 years old. Source : New York State Department of Health 57 Exhibit 3TPFP 2 *RATE (per 1,000 15-19 year old women) TEEN PREGNANCY RATES* NASSAU COUNTY, UPSTATE NY AND US 1990-2002 1980-2002 Nassau Upstate NY U.S. 140.0 120.0 100.0 80.0 60.0 40.0 20.0 2002 2001 2000 1999 1998 1997 1996 1995 1994 1993 1992 1991 1990 1989 1988 1987 1986 1985 1984 1983 1982 1981 1980 0.0 YEAR Source: New York State Department of Health and National Center for Health Statistics Exhibit 3TPFP 3 TEEN BIRTH RATES* NASSAU COUNTY, UPSTATE NY AND US 1990-2002 1980-2002 Nassau *RATE (per 1,000 15-19 year old women) 70.0 Upstate NY U.S. 60.0 50.0 40.0 30.0 20.0 10.0 YEAR Source: New York State Department of Health and National Center for Health Statistics 58 2002 2001 2000 1999 1998 1997 1996 1995 1994 1993 1992 1991 1990 1989 1988 1987 1986 1985 1984 1983 1982 1981 1980 0.0 Exhibit 3TPFP 4 TEEN* PREGNANCY OUTCOMES NASSAU COUNTY 1980-2002 YEAR LIVE BIRTHS % % TOTAL PREGNANCIES 1980 678 27.4% 1,726 69.8% 2,474 1981 702 21.3% 2,487 75.5% 3,293 1982 754 22.4% 2,515 74.7% 3,366 1983 776 24.8% 2,281 72.8% 3,135 1984 674 23.2% 2,172 74.9% 2,900 1985 711 24.2% 2,151 73.1% 2,942 1986 685 25.7% 1,902 71.3% 2,666 1987 677 24.4% 2,032 73.4% 2,770 1988 663 26.7% 1,785 71.8% 2,487 1989 679 31.5% 1,444 67.0% 2,155 1990 674 29.9% 1,543 68.4% 2,257 1991 672 30.4% 1,498 67.8% 2,208 1992 629 33.6% 1,207 64.4% 1,874 1993 725 37.4% 1,167 60.3% 1,936 1994 697 37.0% 1,141 60.5% 1,885 1995 685 36.9% 1,122 60.4% 1,857 1996 637 35.4% 1,126 62.6% 1,800 1997 575 37.5% 917 59.8% 1,533 1998 655 44.8% 764 52.3% 1,461 1999 580 40.8% 815 57.3% 1,422 2000 587 40.5% 836 57.7% 1,448 2001 571 40.4% 812 57.4% 1,415 2002 578 45.2% 670 52.3% 1,280 ITOPS *Teens: Females under 20 years old ITOPS : Induced termination of pregnancies STOPS : Spontaneous termination of pregnancies Source : New York State Department of Health 59 Exhibit 3TPFP 5 PREGNANCY OUTCOMES* BY AGE AND RACE NASSAU COUNTY 2002 AGE RACE UNDER 20 NUMBER 20-24 % NUMBER 25-29 % NUMBER 30-34 % NUMBER 35-39 % NUMBER 40 + % NUMBER ALL AGES % NUMBER % INDUCED TERMINATIONS OF PREGNANCIES WHITE 257 41.1 390 24.7 254 8.1 217 3.8 190 5.1 83 8.8 1,391 8.8 BLACK 222 50.6 307 40.6 214 31.1 164 22.0 118 22.0 37 21.4 1,062 31.8 OTHER 34 61.8 34 26.0 23 6.6 32 6.6 27 9.9 14 21.5 164 12.1 TOTAL** 670 52.3 1,040 37.3 695 15.8 575 8.1 428 9.2 177 14.3 3,585 16.7 WHITE 354 56.5 1,125 71.1 2,699 86.2 5,121 89.9 3,162 84.6 668 70.5 13,129 83.5 BLACK 204 46.5 425 56.1 440 64.0 522 69.9 355 66.2 102 59.0 2,048 61.3 OTHER 19 34.5 91 69.5 318 91.1 422 87.2 232 84.7 43 66.2 1,125 82.8 TOTAL** 578 45.2 1,647 59.1 3,465 79.0 6,077 85.5 3,755 80.6 814 65.9 16,336 76.2 LIVE BIRTHS SPONTANEOUS TERMINATIONS OF PREGNANCIES WHITE 15 2.4 67 4.2 179 5.7 357 6.3 386 10.3 197 20.8 1,201 7.6 BLACK 13 3.0 25 3.3 34 4.9 61 8.2 63 11.8 34 19.7 230 6.9 OTHER 2 3.6 6 4.6 8 2.3 30 6.2 15 5.5 8 12.3 69 5.1 TOTAL** 32 2.5 98 3.5 225 5.1 457 6.4 475 10.2 244 19.8 1,531 7.1 TOTAL PREGNANCIES WHITE 626 1,582 3,132 5,695 3,738 948 15,721 BLACK 439 757 688 747 536 173 3,340 OTHER 55 131 349 484 274 65 1,358 1,280 2,785 4,385 7,109 4,658 1,235 21,452 TOTAL** * Numbers and percentages of total outcomes for that age and race **Note that totals include unknowns and may be greater than the sum of the categories Source: New York State Department of Health 60 Exhibit 3TPFP 6 ALL PREGNANCY OUTCOMES NASSAU COUNTY 1980-2002 YEAR LIVE BIRTHS % ITOPS % STOPS % TOTAL PREGNANCIES 1980 13,539 60.8% 7,389 33.2% 1,327 6.0% 22,255 1981 13,957 55.8% 9,547 38.2% 1,489 6.0% 24,993 1982 14,387 55.5% 9,979 38.5% 1,541 6.0% 25,907 1983 14,551 59.0% 8,767 35.5% 1,357 5.5% 24,675 1984 14,833 60.1% 8,573 34.7% 1,285 5.2% 24,691 1985 15,247 60.4% 8,526 33.8% 1,452 5.8% 25,225 1986 15,567 61.6% 8,185 32.4% 1,510 6.0% 25,262 1987 16,504 63.4% 8,154 31.3% 1,393 5.3% 26,051 1988 17,072 65.8% 7,592 29.3% 1,290 5.0% 25,954 1989 17,700 67.9% 6,903 26.5% 1,464 5.6% 26,067 1990 18,180 66.7% 7,653 28.1% 1,407 5.2% 27,240 1991 17,864 66.1% 7,861 29.1% 1,295 4.8% 27,020 1992 18,065 68.6% 6,893 26.2% 1,379 5.2% 26,337 1993 17,931 68.2% 6,717 25.5% 1,657 6.3% 26,305 1994 17,903 69.2% 6,388 24.7% 1,582 6.1% 25,873 1995 18,084 70.3% 6,129 23.8% 1,501 5.9% 25,714 1996 17,722 71.5% 5,723 23.1% 1,332 5.4% 24,777 1997 17,100 73.0% 4,971 21.2% 1,370 5.8% 23,441 1998 17,186 75.6% 4,136 18.2% 1,399 6.2% 22,721 1999 16,935 75.0% 4,205 18.6% 1,431 6.3% 22,571 2000 16,979 73.5% 4,754 18.6% 1,380 6.0% 23,113 2001 16,260 74.4% 4,227 20.6% 1,364 6.2% 21,851 2002 16,336 76.2% 3,585 19.3% 1,531 7.1% 21,452 ITOPS : Induced termination of pregnancies STOPS : Spontaneous termination of pregnancies Source : New York State Department of Health 61 Exhibit 3TPFP 7 TREND IN PREGNANCY OUTCOMES NASSAU COUNTY 1990-2002 1980-2002 % OF TOTAL PREGNANCIES 80% 70% LIVE BIRTHS 60% ITOPS 50% STOPS 40% 30% 20% 10% 2002 2001 2000 1999 1998 1997 1996 1995 1994 1993 1992 1991 1990 1989 1988 1987 1986 1985 1984 1983 1982 1981 1980 0% YEAR Source: New York State Department of Health Exhibit 3TPFP 8 INDUCED TERMINATIONS OF PREGNANCY BY RACE NASSAU COUNTY 1991-2000 60 PERCENT OF ITOPS* White Black 50 Other** 40 30 20 10 0 1991 1992 1993 1994 1995 1996 1997 1998 1999 2000 YEAR * ITOPS percent within each racial category ** 'Other' does not include 'Not stated'. The percent ITOPS where race was 'not stated' was 3.5% in 1991, 3.8% in 1992, 21.4% in 1993, 32.1% in 1994, 38.6% in 1995, 36.2% in 1996, 34.4% in 1997, 25.4% in 1998, 32.9% in 1999 and 42.5% in 2000. Source: New York State Department of Health 62 APPENDIX 4 - Early Childhood Exhibit 4EC 1 – CDC Recommended Immunization Schedule for the United States, 2005 ..................64 Exhibit 4EC 2 – Proportion of Completely Immunized Children/Youth, Nassau County, 2000-2004 (Table) ...................................................................................................................65 Exhibit 4EC 3 – Reported Cases of Vaccine Preventable Diseases, Nassau County, 1985-2004 (Table) ...................................................................................................................66 Exhibit 4EC 4 – Asthma Hospital Discharges (Age 0-4) in Nassau County, By Selected Communities, 2000-2002 (Table) .........................................................................................67 Exhibit 4EC 5 – New Cases of Elevated Blood Lead Levels, Nassau County, 1991-2004, (Graph)....................................................................................................................................67 Exhibit 4EC 6 – New Cases and Rates of Blood Lead Levels (>10ug/dl), By Selected Communities, Nassau County, 1997-2001 (Table) ............................................................68 63 Exhibit 4EC 1 Source: Centers for Disease Control (CDC) 64 Exhibit 4EC 2 PROPORTION OF COMPLETELY IMMUNIZED CHILDREN/YOUTH* NASSAU COUNTY 2000-2004 SCHOOL YEAR 2000-2001 Age 2001-2002 % Age 2003-2004 % Age % Pre- Kindergarten 94 Pre- Kindergarten 95 Pre- Kindergarten 92 All Pre-Kindergartens 94 All Pre-Kindergartens 94 All Pre-Kindergartens 92 Headstarts 76 Headstarts 92 Headstarts 90 Kindergarten 97 Kindergarten 97 Kindergarten 97 Grade 1 -2 94 Grade 1-3 95 Grade 1 96 Grades 3-10 95 Grades 4-11 95 Grades 2-5 95 Grades 11-12 96 Grade 12 95 Grade 6 96 Grade 7 92 Grade 8 91 Grades 9-10 93 Grades 11-12 94 % of Total 95 % of Total *Pre-Kindergarten through Grade 12 Source: NYS School Immunization Survey 65 95 % of Total 94 Exhibit 4EC 3 REPORTED CASES OF VACCINE-PREVENTABLE COMMUNICABLE DISEASES NASSAU COUNTY 1985-2004 COMMUNICABLE DISEASES* YEAR Haemophilus Influenza Measles Mumps Pertussis** Rubella 1985 10 4 17 6 6 1986 12 6 17 19 5 1987 7 1 18 14 3 1988 9 1 19 4 0 1989 8 26 10 17 3 1990 7 43 22 19 0 1991 2 23 4 9 0 1992 4 5 8 10 0 1993 7 3 1 16 11 1994 20 9 0 11 0 1995 7 0 2 9 0 1996 0 5 2 13 1 1997 8 2 2 11 2 1998 8 0 0 4 5 1999 8 2 1 7 17 2000 12 0 3 12 0 2001 8 2 2 4 0 2002 12 0 1 7 1 2003 29 1 0 69 0 2004 15 0 0 51 0 *There have been no reported cases of polio during this time period. **Probable pertussis (whooping cough) cases became reportable as of 2003. Source: Nassau County Department of Health 66 Exhibit 4EC 4 ASTHMA HOSPITAL DISCHARGES (Age 0-4) IN NASSAU COUNTY BY SELECTED COMMUNITIES 2000-2002 2010 Objective = 25.0* Zip Code Discharges 2000-2002 Community 11550 Hempstead 11575 Population 2001 Avg. Yearly Discharge Rate* 184 3,525 174.0 Roosevelt 52 1,295 133.8 11096 Inwood 17 434 130.6 11553 Uniondale 52 1,343 129.1 11590 Westbury 73 2,698 90.2 11520 Freeport 76 2,925 86.6 11003 Elmont 18 1,616 81.1 Total 472 13,836 113.7 Rest of County 733 69,849 35.0 Nassau County 1,205 83,685 48.0 *Rate per 10,000 Source: New York State Department of Health Exhibit 4EC 5 NEW CASES OF ELEVATED* BLOOD LEAD LEVELS NASSAU COUNTY 1991-2004 NEW CASES NUMBER OF NEW CASES 500 NUMBER CHELATED** 400 300 200 100 0 1991 1992 1993 1994 1995 1996 1997 1998 1999 2000 YEAR *Elevated blood lead levels are >10ug/dl. **# of chelated for 1991 and 1993 are not available. Source: Nassau County Department of Health Childhood Lead Poisoning Prevention Program. 67 2001 2002 2003 2004 Exhibit 4EC 6 CASES AND RATES OF BLOOD LEADLEAD LEVELS >10ug/dl NEWNEW CASES AND INCIDENCE RATES OF BLOOD LEVELS >10ug/dl BYBY SELECTED COMMUNITIES IN NASSAU COUNTY SELECT COMMUNITIES IN NASSAU COUNTY 1997-2001 1997-2001 NUMBER OF CASES SELECTED COMMUNITIES YEAR TOTAL 11520 11550 11096 Selected 11561 11590 11575 11553 Freeport Hempstead Inwood Long Beach Westbury Roosevelt Uniondale Communities Rest Nassau of County County 1997 23 38 5 7 16 6 7 102 122 225 1998 12 34 6 5 7 9 3 76 84 166 1999 14 22 6 2 8 8 2 62 78 144 2000 16 24 3 3 14 17 5 82 84 184 2001 16 19 0 0 13 3 1 52 92 155 RATE/PER 100 CHILDREN SCREENED* SELECTED COMMUNITIES YEAR TOTAL Selected 11520 11550 11096 11561 11590 11575 11553 Freeport Hempstead Inwood Long Beach Westbury Roosevelt Uniondale Communities Rest Nassau of County County 1997 1.5 1.6 1.7 0.8 1.1 0.9 1.0 1.3 0.6 0.8 1998 0.8 1.4 2.0 0.6 0.5 1.4 0.4 1.0 0.4 0.6 1999 0.9 1.0 2.4 0.3 0.6 1.4 0.3 0.8 0.4 0.5 2000 1.3 1.3 1.5 0.5 1.2 3.5 1.0 1.4 0.6 0.7 2001 1.3 1.1 0.0 0.0 1.0 0.7 0.2 0.9 0.7 0.5 *Children yearsold old. *Children aged aged 0-<6 0-6 years Source: New York State Department of Health 68 APPENDIX 5 – ADULTS and HEALTH BEHAVIORS Exhibit 5AD 1 – Annual Number or Cases of Selected Reportable Communicable Diseases, Nassau County, 1990-2003 (Table) .....................................................................................70 Exhibit 5AD 2 – Campylobacteriosis Rates, Nassau County and Upstate NY, 1995-2003 (Graph)......71 Exhibit 5AD 3 – Cryptosporidiosis Rates, Nassau County and Upstate NY, 1995-2003 (Graph) ...........71 Exhibit 5AD 4 – E Coli 0157:H7 Rates, Nassau County and Upstate NY, 1995-2003 (Graph).................72 Exhibit 5AD 5 – Giardiasis Rates, Nassau County and Upstate NY, 1995-2003 (Graph) ........................72 Exhibit 5AD 6 – Hepatitis A Rates, Nassau County and Upstate NY, 1995-2003 (Graph) ......................73 Exhibit 5AD 7 – Listeriosis Rates, Nassau County and Upstate NY, 1995-2003 (Graph)..........................73 Exhibit 5AD 8 – Meningococcal Infection Rates, Nassau County and Upstate NY, 1995-2003 (Graph).................................................................................................................74 Exhibit 5AD 9 – Pertussis Rates, Nassau County and Upstate NY, 1995-2003 (Graph) ...........................74 Exhibit 5AD 10 – Salmonellosis Rates, Nassau County and Upstate NY, 1995-2003 (Graph) ................75 Exhibit 5AD 11 – Burden of Chronic Hepatitis C, Nassau County, Selected Communities and Upstate NY (January 1, 2003 through March 1, 2005) (Graph)...........................75 Exhibit 5AD 12 – Tuberculosis Case Rates, Nassau County, Upstate NY and the US, 1981-2004 (Graph)...............................................................................................................76 Exhibit 5AD 13 – Reported Cases of Tuberculosis, Nassau County, 1993-2004 (Graph)........................77 Exhibit 5AD 14 – Tuberculosis Cases by Region of Origin, 2000-2004 (Graph) ........................................77 Exhibit 5AD 15 – Gonorrhea Rates, Nassau County, Selected Communities and Upstate NY, 1999-2004 (Graph) ..............................................................................................................78 Exhibit 5AD 16 – Chlamydia Rates, Nassau County, Selected Communities and Upstate NY, 2000-2004, (Graph)..............................................................................................................78 Exhibit 5AD 17 – Reported AIDS Cases by Risk Factor, Nassau County, 1982-2003 (Graph) ................79 Exhibit 5AD 18 – AIDS Cases, by Race and Hispanic Origin, 1982-2003 (Graph) ...................................80 Exhibit 5AD 19 – Burden of HIV/AIDS, by Selected Communities in Nassau County (Cases reported through 2003) (Graph)..........................................................................80 Exhibit 5AD 20 – Hospitalizations (2001-2003) and Deaths (1999-2001) Due to Unintentional Injuries, Summary Statistics and Leading Causes by Age (Tables) ..............................81 Exhibit 5AD 21 – Hospitalizations (2001-2003) and Deaths (1999-2001) Due to Injury, Motor Vehicle Traffic Leading Causes By Age, Assault/Homicide Injuries Summary Statistics, Self Inflicted/Suicide Injuries Summary Statistics (Tables) .............................82 Exhibit 5AD 22 – Cancer Deaths and Rates, Nassau County, 1976-2001 (Table)...................................83 Exhibit 5AD 23 – Cancer Cases and Rates, Nassau County, 1976-2001 (Table) ....................................84 Exhibit 5AD 24 – Leading Cause of Death by Age Group, Nassau County, 2002 (Table)....................85 69 Exhibit 5AD 1 ANNUAL NUMBER OF CASES OF SELECTED REPORTABLE COMMUNICABLE DISEASES NASSAU COUNTY 1990-2003 DISEASE AIDS ** CAMPYLOBACTERIOSIS CHLAMYDIA CRYPTOSPORIDIOSIS E. COLI 0157:H7 INFECTION ENCEPHALITIS, OTHER GIARDIASIS GONOCOCCAL INFECTION HAEMOPHILUS INFLUENZA HEPATITIS A HEPATITIS B HEPATITIS C (Non A/Non B) LEGIONELLOSIS LYME DISEASE MALARIA MEASLES MENINGITIS, ASEPTIC MENINGOCOCCAL INFECTION MUMPS PERTUSSIS RUBELLA SALMONELLOSIS SHIGELLOSIS STREP GROUP A, INVASIVE STREP GROUP B INVASIVE STREP PNEUMONIA SYPHILIS: EARLY SYPHILIS: LATE TUBERCULOSIS TYPHOID FEVER WEST NILE VIRUS YERSINIOSIS 1990 1991 1992 1993 1994 1995 1996 1997 1998 1999 2000 230 154 242 168 289 273 313 261 262 279 265 267 355 193 289 188 209 196 157 203 119 192 16 7 6 198 641 8 38 24 5 5 176 16 0 82 9 2 12 0 299 107 3 9 12 8 221 341 3 52 20 0 5 164 24 5 86 8 2 13 1 284 73 25 15 2 6 201 272 10 58 28 3 4 121 10 2 69 9 2 11 2 291 66 30 14 11 6 178 364 8 59 19 1 5 110 17 0 100 7 0 4 5 215 96 27 23 11 6 201 384 9 35 15 1 3 107 11 2 24 7 1 8 17 217 79 30 9 3 11 0 186 262 32 18 21 175 82 4 19 17 197 84 7 33 8 141 90 6 7 14 7 18 10 109 76 3 6 8 93 1,183 7 51 50 9 113 1,245 2 83 55 7 184 840 4 62 54 6 168 770 7 88 35 8 189 623 20 56 33 0 188 95 106 43 59 11 20 17 0 225 32 25 211 8 14 8 0 306 46 5 62 8 8 10 0 228 41 133 15 3 70 16 1 16 11 232 93 181 12 9 65 9 0 11 0 297 68 172 81 41 100 86 94 132 270 122 4 62 185 100 2 0 32 199 95 2 13 13 8 16 12 13 ** Does not include prison inmates for all years. 2000 through 2003 are provisional data. Source: New York State Department of Health 70 2001 249 163 1,219 19 6 16 15 19 30 192 132 423 467 13 8 43 60 23 21 1 3 11 6 86 48 19 19 0 2 21 4 0 70 4 0 9 2002 2003 119 62 177 186 1,353 1,678 10 4 9 6 37 13 146 135 500 440 13 27 46 31 17 14 5 1 4 12 82 75 11 11 0 1 172 162 7 4 7 2 0 0 4 10 71 0 1 0 189 230 174 241 64 78 40 30 39 39 57 82 140 133 117 6 15 16 0 0 94 94 65 56 4 3 3 4 11 17 10 6 4 Exhibit 5AD 2 CAMPYLOBACTERIOSIS RATES* NASSAU COUNTY AND UPSTATE NY 1995-2003 25.0 Nassau County *RATE (per 100,000 population) Upstate New NY York 20.0 15.0 10.0 5.0 0.0 1995 1996 1997 1998 1999 2000 2001 2002 2003 YEAR Upstate NY excludes New York City. Source: New York State Department of Health Exhibit 5AD 3 CRYPTOSPORIDIOSIS RATES* NASSAU AND UPSTATE NY 1995-2003 25.0 Nassau County *RATE (per 100,000 population) Upstate New NY York 20.0 15.0 10.0 5.0 0.0 1995 1996 1997 1998 1999 YEAR Upstate NY excludes New York City. Source: New York State Department of Health 71 2000 2001 2002 2003 Exhibit 5AD 4 E COLI 0157:H7 RATES* E COLI RATES* NASSAU COUNTY AND UPSTATE NY 1995-2003 25.0 Nassau County *RATE (per 100,000 population) NY York Upstate New 20.0 15.0 10.0 5.0 0.0 1995 1996 1997 1998 1999 2000 2001 2002 2003 YEAR Upstate NY excludes New York City. Source: New York State Department of Health Exhibit 5AD 5 GIARDIASIS RATES* NASSAU COUNTY AND UPSTATE NY 1995-2003 25.0 Nassau County *RATE (per 100,000 population) Upstate New NY York 20.0 15.0 10.0 5.0 0.0 1995 1996 1997 1998 1999 YEAR Upstate NY excludes New York City. Source: New York State Department of Health 72 2000 2001 2002 2003 Exhibit 5AD 6 HEPATITIS A RATES* NASSAU COUNTY AND UPSTATE NY 1995-2003 25.0 Nassau County *RATE (per 100,000 population) Upstate NY New York 20.0 15.0 10.0 5.0 0.0 1995 1996 1997 1998 1999 2000 2001 2002 2003 YEAR Upstate NY excludes New York City. Source: New York State Department of Health Exhibit 5AD 7 LISTERIOSIS RATES* NASSAU COUNTY AND UPSTATE NY 1996-2003 Nassau County 25.0 *RATE (per 100,000 population) Upstate NY New York 20.0 15.0 10.0 5.0 0.0 1996 1997 1998 1999 YEAR Upstate NY excludes New York City. Source: New York State Department of Health 73 2000 2001 2002 2003 Exhibit 5AD 8 MENINGOCOCCAL INFECTION RATES* NASSAU COUNTY AND UPSTATE NY 1995-2003 25.0 Nassau County RATE (per 100,000 population) Upstate New York 20.0 15.0 10.0 5.0 * 0.0 1995 1996 1997 1998 1999 2000 2001 2002 2003 YEAR Upstate NY excludes New York City. Source: New York State Department of Health Exhibit 5AD 9 PERTUSSIS RATES* NASSAU COUNTY AND UPSTATE NY 1995-2003 Nassau County 25.0 *RATE (per 100,000 population) Upstate NY New York 20.0 15.0 10.0 5.0 0.0 1995 1996 1997 1998 1999 YEAR Upstate NY excludes New York City. Source: New York State Department of Health 74 2000 2001 2002 2003 Exhibit 5AD 10 SALMONELLOSIS RATES* NASSAU COUNTY AND UPSTATE NY 1995-2003 25.0 Nassau County *RATE (per 100,000 population) Upstate New NY York 20.0 15.0 10.0 5.0 0.0 1995 1996 1997 1998 1999 2000 2001 2002 2003 YEAR Upstate NY excludes New York City. Source: New York State Department of Health Exhibit 5AD 11 BURDEN OF CHRONIC HEPATITIS C NASSAU COUNTY, SELECTED COMMUNITIES & UPSTATE NY* (January 1, 2003 through March 1, 2005) 11096 - Inwood 11520 - Freeport 60.00 11550 - Hempstead RATE (per 10,000 Population) 11553 - Uniondale 50.00 11561 - Long Beach 11575 - Roosevelt 11590- Westbury 40.00 Selected Communities 30.00 Rest of County Nassau County 20.00 Upstate NY 10.00 0.00 *Cases reported from January 1, 2003 through March 1, 2005. Rates were based on 2000 U.S. Census population. Source: New York State Department of Health 75 Exhibit 5AD 12 TUBERCULOSIS CASE RATES NASSAU COUNTY, UPSTATE NY & THE U.S. 1981-2004 Source: New York State Department of Health and Nassau County Department of Health 76 Exhibit 5AD 13 REPORTED CASES OF TUBERCULOSIS NASSAU COUNTY 1993-2004 150 Foreign Born New Cases U.S. Born New Cases NUMBER 125 100 75 50 25 0 1993 1994 1995 1996 1997 1998 1999 2000 2001 2002 2003 YEAR Source: Nassau County Department of Health, Tuberculosis Control Bureau Exhibit 5AD 14 TUBERCULOSIS CASES BY REGION OF ORIGIN 2000-2004 Mexico & Central America 18% South America 11% Carribean 11% Europe 5% East Asia 5% S.E. Asia 6% US Born 29% Africa 4% Source: Nassau County Department of Health, Tuberculosis Control Bureau 77 Middle East (S.W. Asia) 1% Indian (Subcontinent) 10% 2004 Exhibit 5AD 15 GONORRHEA RATES* NASSAU COUNTY, SELECTED COMMUNITIES AND UPSTATE NY 1999-2004 Nassau County Selected Communities Rest of County Upstate NY *RATE (per 100,000 population) 175 150 125 100 75 50 25 0 1999 2000 2001 2002 2003 2004 YEAR Source: New York State Department of Health Exhibit 5AD 16 CHLAMYDIA RATES* NASSAU COUNTY, SELECTED COMMUNITIES AND UPSTATE NY 2000-2004 Nassau County Selected Communities *RATE (per 100,000 population) 500 Rest of County Upstate NY 400 300 200 100 0 2000 2001 2002 YEAR Source: New York State Department of Health 78 2003 2004 Exhibit 5AD 17 REPORTED AIDS CASES BY RISK FACTOR NASSAU COUNTY 1982-2003 MSM 100% IDU 90% 80% MSM/IDU Heterosexual 60% 50% Blood Products 40% Adult Unknown 30% 20% Pediatric 10% YEAR Source: New York State Department of Health 79 2003 2002 2001 2000 1999 1998 1997 1996 1995 1994 1993 1992 1991 1990 1989 1988 1987 1986 1985 1984 1983 0% 1982 PERCENT 70% Exhibit 5AD 18 AIDS CASES BY RACE AND HISPANIC ORIGIN 1982-2003 White Black Hispanic Origin 350 NUMBER OF CASES 300 250 200 150 100 50 2003 2002 2001 2000 1999 1998 1997 1996 1995 1994 1993 1992 1991 1990 1989 1988 1987 1986 1985 1984 1983 1982 0 YEAR Source: New York State Department of Health Exhibit 5AD 19 BURDEN OF HIV/AIDS* BY SELECTED COMMUNITIES IN NASSAU COUNTY 11096 - Inwood 180 11520 - Freeport 11550 - Hempstead 160 RATE (per 10,000 population) 11553 - Uniondale 140 11561 - Long Beach 11575 - Roosevelt 120 11590 - Westbury 100 Selected Communities 80 Rest of County 60 Nassau County 40 20 0 *Cases reported through 2003 80 Exhibit 5AD 20 Hospitalizations Due to Unintentional Injury Leading Causes by Age Deaths Due to Unintentional Injury Leading Causes by Age NASSAU COUNTY 2001 - 2003 NASSAU COUNTY 1999 - 2001 Ages 0-4 Cause Fall Poisoning Hot Object/Scald Motor Vehicle Traffic Struck By, Against μ 109 30 18 16 9 Ages 10-14 μ Cause Fall 90 Motor Vehicle Traffic 50 Struck By, Against 25 Pedal Cyclist, Non-Traffic 18 Poisoning 9 Ages 20-24 Cause Motor Vehicle Traffic Fall Poisoning Struck By, Against Cut/Pierce Ages 45-64 Cause Fall Motor Vehicle Traffic Poisoning Overexertion Cut/Pierce μ 158 54 19 16 13 μ 782 287 79 52 40 Ages 5-9 Cause Fall Motor Vehicle Traffic Struck By, Against Pedal Cyclist, Non-Traffic Natural/Environmental μ 78 24 10 10 9 Ages 15-19 Cause Motor Vehicle Traffic Fall Struck By, Against Poisoning Overexertion 135 67 29 21 15 Ages 25-44 Cause Motor Vehicle Traffic Fall Poisoning Cut/Pierce Overexertion μ 430 386 109 61 57 Ages 65+ Cause Fall Motor Vehicle Traffic Poisoning Struck By, Against Natural/Environmental μ 4,052 299 69 53 50 Ages 0-4 Cause * μ μ = Mean Annual Frequency. *Data based on frequencies less than six not reported Source: NYSDOH, Bureau of Injury Prevention μ * Ages 10-14 Cause Motor Vehicle Traffic * μ 3 * Ages 20-24 Cause Motor Vehicle Traffic Poisoning * μ 10 4 * Ages 45-64 Cause Motor Vehicle Traffic Poisoning Fall Transport, Non-Traffic Fire/Flame μ 22 16 8 6 2 Ages 5-9 Cause * μ * Ages 15-19 μ Cause Motor Vehicle Traffic 10 * * Ages 25-44 Cause Poisoning Motor Vehicle Traffic Transport, Non-Traffic Fall Fire/Flame 33 30 4 4 2 Ages 65+ Cause Fall Motor Vehicle Traffic Fire/Flame Suffocation Poisoning μ 68 38 8 4 2 μ μ = Mean Annual Frequency. *Data based on frequencies less than six not reported Source: NYSDOH, Bureau of Injury Prevention 81 Exhibit 5AD 21 Hospitalizations Due to Injury Motor Vehicle Traffic Subcategories Leading Causes by Age Deaths Due to Injury Motor Vehicle Traffic Subcategories Leading Causes by Age NASSAU COUNTY 2001 - 2003 NASSAU COUNTY 1999 - 2001 Ages 0-4 μ Cause Occupant 9 Pedestrian 6 * * Ages 10-14 Cause Pedestrian Occupant Pedal Cyclist Motorcyclist Ages 20-24 Cause Occupant Motorcyclist Pedestrian Pedal Cyclist μ 21 14 11 3 Ages 15-19 Cause Occupant Pedestrian Pedal Cyclist Motorcyclist Cause * 89 25 7 7 99 26 19 6 Ages 45-64 μ Cause Occupant 175 Pedestrian 61 Motorcyclist 23 Pedal Cyclist 9 Ages 65+ μ Cause Occupant 221 Pedestrian 57 Pedal Cyclist 3 Motorcyclist 2 μ * Ages 10-14 μ Cause 2 Pedestrian * * μ Ages 25-44 μ Cause Occupant 265 Pedestrian 65 Motorcyclist 54 Pedal Cyclist 19 μ Ages 0-4 Ages 5-9 μ Cause Pedestrian 10 Occupant 10 Pedal Cyclist 3 * Ages 20-24 Cause Occupant Motorcyclist * μ 5 2 * Ages 45-64 μ Cause Occupant 10 Pedestrian 9 * * μ = Mean Annual Frequency. *Data based on frequencies less than six not reported Source: NYSDOH, Bureau of Injury Prevention Ages 5-9 Cause * Ages 15-19 μ Cause Occupant * μ * 7 * Ages 25-44 μ Cause Occupant 11 Pedestrian 8 Motorcyclist 5 * * Ages 65+ Cause Occupant Pedestrian * μ 21 13 * μ = Mean Annual Frequency. *Data based on frequencies less than six not reported Source: NYSDOH, Bureau of Injury Prevention 82 Exhibit 5AD 22 CANCER DEATHS AND RATES IN NASSAU COUNTY(1) 1976-2001 1976-1981 SITE OF CANCER Avg. Yrly Deaths Avg. Adj. Rate(2) 1982-1986 Avg. Yrly Deaths Avg. Adj. Rate(2) 1987-1991 Avg. Yrly Deaths Avg. Adj. Rate(2) 1992-1996 Avg. Yrly Deaths Avg. Adj. Rate(2) 1997-2001 Avg. Yrly Deaths Avg. Adj. Rate(2) MALES ALL CANCER SITES LUNG AND BRONCHUS 1,704 509 PROSTATE 142 COLORECTAL 252 PANCREAS 102 NON-HODGKIN'S LYMPHOMAS 53 LEUKEMIAS 68 BLADDER 65 STOMACH 68 ESOPHAGUS 47 BRAIN & NERVOUS SYSTEM 45 KIDNEY 50 LIVER 21 MELANOMA 28 MYELOMA 23 ORAL CAVITY & PHARYNX 45 295.3 82.8 32.8 46.8 17.8 7.7 10.7 13.4 12.3 7.6 5.9 7.8 3.7 3.9 3.8 6.9 1,482 435 142 222 78 54 57 56 65 37 34 37 21 26 21 37 280.0 77.6 33.6 44.4 14.1 9.9 10.6 12.1 12.5 6.4 5.4 6.3 3.9 4.5 4.0 6.0 1,493 434 166 209 83 66 59 46 53 37 34 35 27 29 25 34 267.9 73.5 35.5 40.0 14.1 11.1 10.0 9.4 9.6 5.9 5.3 5.9 4.9 4.9 4.5 5.8 1,439 189.5 38.6 40.5 25.2 10.3 11.2 6.7 6.2 4.7 5.4 3.2 2.8 2.9 2.5 2.2 2.7 1,514 412 165 186 83 67 60 50 55 40 37 33 29 28 24 27 244.6 66.6 32.7 32.1 13.8 11.2 10.5 9.3 9.6 6.2 5.5 5.3 4.8 4.7 4.0 4.2 1,397 182.7 39.0 36.6 20.7 10.5 10.7 6.5 6.2 5.2 4.6 3.7 3.4 2.4 2.7 2.7 2.6 1,447 383 156 156 89 68 66 48 44 42 35 34 32 30 28 20 222.2 59.5 27.0 25.0 13.9 10.7 10.4 8.4 7.0 6.5 5.3 5.3 4.9 4.6 4.4 3.0 FEMALES ALL CANCER SITES 225 BREAST 360 COLORECTAL 255 PANCREAS OVARY (1) (2) 1,644 LUNG AND BRONCHUS 92 104 NON-HODGKIN'S LYMPHOMA 55 LEUKEMIAS 60 UTERUS, (corpus) 55 STOMACH 61 BRAIN & NERVOUS SYSTEM 34 MYELOMA 20 KIDNEY 25 CERVIX UTERI 26 LIVER 15 BLADDER 24 195.3 25.7 41.5 31.7 11.1 11.8 6.6 7.4 6.5 7.5 3.9 2.5 3.0 3.0 1.8 3.1 1,493 248 328 227 80 85 43 51 38 44 31 25 21 18 12 21 196.4 31.9 42.6 30.4 10.5 11.0 5.6 7.0 5.0 6.0 4.1 3.3 2.7 2.4 1.6 2.9 1,499 310 319 198 82 90 52 47 39 42 26 23 24 18 17 21 Top 15 Cancers, ranked by death rate 1997-2001 Annual average rate per 100,000 sex and age-adjusted to the 2000 U.S. population Source: New York State Department of Health, Cancer Registry, January, 2004 83 328 296 175 89 88 54 50 44 38 30 29 20 21 22 22 343 258 148 94 84 65 52 34 33 25 25 23 19 20 21 165.4 39.0 30.3 16.3 10.5 9.7 7.4 6.1 3.8 3.8 3.0 2.8 2.6 2.4 2.3 2.2 Exhibit 5AD 23 CANCER CASES AND RATES IN NASSAU COUNTY(1) 1976-2001 1976-1981 SITE OF CANCER Avg. Yrly Cases Avg. Adj. Rate(2) 1982-1986 Avg. Yrly Cases Avg. Adj. Rate(2) 1987-1991 Avg. Yrly Cases Avg. Adj. Rate(2) 1992-1996 Avg. Yrly Cases Avg. Adj. Rate(2) 1997-2001 Avg. Yrly Cases Avg. Adj. Rate(2) MALES ALL CANCER SITES 3,081 LUNG AND BRONCHUS 604 PROSTATE 418 COLORECTAL 535 PANCREAS 109 NON-HODGKIN'S LYMPHOMAS 113 LEUKEMIAS 100 BLADDER 247 STOMACH 92 ESOPHAGUS 53 BRAIN & NERVOUS SYSTEM 60 KIDNEY 85 LIVER 27 MELANOMA 80 MYELOMA 34 ORAL CAVITY & PHARYNX 118 512.2 96.4 84.0 92.0 18.9 16.4 15.7 42.6 16.2 8.4 8.0 12.6 4.7 11.5 5.6 16.9 2,890 531 438 498 79 121 93 247 91 41 54 91 25 91 37 93 518.0 91.9 90.0 91.3 14.2 20.1 16.1 44.8 16.5 6.8 8.7 14.6 4.7 15.2 6.5 15.3 3,154 533 642 508 91 134 88 255 86 35 56 96 31 87 38 90 537.8 89.1 115.9 88.4 15.0 21.6 15.0 43.6 14.9 5.4 9.0 15.3 5.2 14.0 7.0 14.5 3,604 440.8 50.1 136.5 58.9 12.4 20.2 16.1 9.8 24.6 7.6 5.7 5.1 7.6 9.3 2.4 11.5 3,636 521 1,047 473 93 158 97 260 94 47 60 117 35 92 40 84 574.9 82.9 161.1 78.0 15.1 25.8 16.4 43.1 15.8 7.4 9.2 18.4 5.6 14.5 6.5 13.3 3,814 452.5 54.4 145.0 53.7 11.1 20.0 15.9 10.0 29.1 7.8 6.5 4.4 8.2 8.7 2.5 11.7 3,849 528 1,148 477 104 163 104 301 91 46 60 125 50 120 39 83 583.2 80.8 171.7 74.3 15.9 25.4 16.4 47.0 14.4 7.1 9.1 18.7 7.6 18.2 6.1 12.5 FEMALES ALL CANCER SITES LUNG AND BRONCHUS 294 BREAST 991 COLORECTAL 541 PANCREAS 157 NON-HODGKIN'S LYMPHOMA 100 UTERUS, (corpus) (2) 95 OVARY LEUKEMIAS (1) 3,361 85 238 STOMACH 74 BRAIN & NERVOUS SYSTEM 46 MYELOMA 34 KIDNEY 46 CERVIX UTERI 72 LIVER 16 BLADDER 88 395.2 33.2 115.9 65.3 11.5 18.0 11.8 10.6 26.5 9.1 5.5 4.1 5.5 8.5 2.0 10.5 3,120 325 948 456 87 141 99 74 180 60 45 33 49 51 11 88 413.2 42.0 126.8 60.4 11.5 18.5 12.9 10.4 22.5 8.2 6.0 4.3 6.3 7.2 1.4 11.5 3,420 403 1,043 466 98 156 125 74 197 58 43 40 61 65 19 92 453 1,137 451 94 159 129 78 236 65 50 37 66 64 21 97 498 1,173 484 115 143 154 80 238 58 46 48 79 64 24 109 461.7 57.4 144.3 55.1 12.9 17.4 18.3 9.7 28.8 6.5 6.0 5.4 9.5 8.3 2.7 12.4 Top 15 Cancers, ranked by death rate 1997-2001 (1AD 20 - CANCER DEATHS & RATES IN NASSAU COUNTY, 1976-2001) Annual average rate per 100,000 sex and age-adjusted to the 2000 U.S. population Source: New York State Department of Health, Cancer Registry, January, 2004 84 Exhibit 5AD 24 LEADING CAUSE OF DEATH BY AGE GROUP NASSAU COUNTY 2002 Age Group Cause of Death # Deaths 0-14 Years 131 Disorders related to premature birth Birth defects Unintentional Injury Cancer Symptoms related to unexplained death Homicide 54 15 10 7 5 5 15-24 Years 71 Unintentional Injury Homicide Suicide Cancer Heart Disease 44 12 11 3 1 25-44 Years 299 Cancer Heart Disease Unintentional Injury Suicide HIV/AIDS Homicide 75 68 64 23 22 19 44-64 Years 1,224 Cancer Heart Disease Unintentional Injury CVD (Stroke) CLRD Cirrhosis 655 341 50 45 38 35 65+ Years 7,312 Heart Disease Cancer CVD (Stroke) CLRD Diabetes Total Unintentional Injury (Falls = 62) Falls Source: New York State Department of Health Vital Statistics 85 4,172 1,956 431 416 163 106 62 APPENDIX 6 – LOCAL PUBLIC HEALTH SYSTEM Exhibit 6LPHS 1 – 2003 Nassau County Hospital Profiles ..............................................................................87 Exhibit 6LPHS 2 – Hospitals in Nassau County (Map)...................................................................................88 Exhibit 6LPHS 3 – Nassau Health Care Corporation Community Health Centers...................................89 Exhibit 6LPHS 4 – HIV/AIDS Service Providers ................................................................................................90 Exhibit 6LPHS 5 – Nassau County Nursing Homes ........................................................................................91 Exhibit 6LPHS 6 – Nursing Homes in Nassau County (Map) ........................................................................93 Exhibit 6LPHS 7 – Community Partners and Collaborations .......................................................................94 Exhibit 6LPHS 8 – National Public Health Performance Standards Program (NPHPSP) Performance Assessment Summary Scores, Nassau County Health System and New York State, 2001 (Graph)............................98 86 Exhibit 6LPHS 1 2003 NASSAU COUNTY HOSPITAL PROFILES Long Beach Medical Center 455 East Bay Drive, Long Beach, NY 11561 Long Beach Medical Center includes a 203-bed community teaching hospital, a 200-bed sub acute and skilled nursing facility, home-health agency and numerous outpatient services. The Family Care Center provides primary and specialty medical care for people with limited financial resources. Admissions: 5,742, ER Visits: 14,852 Mercy Medical Center 1000 N. Village Avenue, Rockville Centre, NY 11570 Mercy Medical Center is sponsored by the Diocese of Rockville Centre and is one of five acute care hospitals within Catholic Health Services of Long Island. It is a 387-bed Level II Trauma Center serving the healthcare needs of residents of Nassau County and surrounding areas. It is best known for its maternal and child health services; oncology; physical medicine and rehabilitation; orthopedics; and behavioral health services. Mercy is a member of LIHN. Admissions: 14,407, ER Visits: 40,652 Nassau University Medical Center 2201 Hempstead Turnpike, East Meadow, NY 11554 The Nassau University Medical Center, a Level I Regional Trauma Center, is part of the Nassau Health Care Corporation which also includes a skilled nursing facility and seven community health centers. The medical center is a 631-bed tertiary care teaching hospital, and it is affiliated with the Health Sciences Center of the State University of New York at Stony Brook and Lenox Hill Hospital. Admissions: 22,091, ER Visits: 82,521 New Island Hospital 4295 Hempstead Turnpike, Bethpage, NY 11714 New Island Hospital is a 223-bed acute care facility that, since 1999, has existed as a joint venture between Winthrop South Nassau Health System and Catholic Health Services of Long Island. It offers inpatient, outpatient, and emergency services. Sleep medicine and hyperbarics/wound care are two of its more specialized services. New Island is currently a member of the Long Island Health Network (LIHN) – a group of hospitals that have voluntarily joined together to improve patient care through ensuring best practice standards in patient care, decreasing lengths of stay, and costs. Admissions: 8,733, ER Visits: 35,442 North Shore/LIJ Health System 200 Community Drive, Great Neck, NY 11021 The North Shore/LIJ Health System serves Long Island, Queens and Staten Island and is headquartered in Great Neck, NY. The system is comprised of 17 hospitals, including three tertiary hospitals, a children’s hospital and a psychiatric facility, hospice and home care services, a medical research institute and other health-related facilities. In Nassau County, the five hospitals that are part of the NSLIJ System are: North Shore University Hospital – Manhasset (849 beds) Glen Cove Hospital (281 beds) Syosset Hospital (116 beds) Franklin Hospital (305 beds) Plainview Hospital (240 beds) Admissions: 84,278, ER Visits: 144,000 (These are combined figures for the five North Shore/LIJ System hospitals located in Nassau County) St. Francis Hospital 100 Port Washington Boulevard, Roslyn, NY 11576 St. Francis Hospital, The Heart Center is sponsored by the Diocese of Rockville Centre and is one of five acute care hospitals within Catholic Health Services of Long Island. It is New York’s only specialty designated cardiac center and performs more cardiac procedures than any other hospital in the Northeast. It has a 279-bed capacity and is a member of the LIHN. Admissions: 18,596, ER Visits: 18,117 South Nassau Communities Hospital One Healthy Way, Oceanside, NY 11572 South Nassau Communities Hospital is a 429-bed acute care hospital, providing inpatient, ambulatory, home health, restorative, preventive, and emergency medical care. South Nassau is partner with Winthrop-University Hospital in the Winthrop South-Nassau University Health System and a member of the New York-Presbyterian Healthcare System. Admissions: 15,047, ER Visits: 42,485 Winthrop-University Hospital 259 First Street, Mineola, NY 11501 Winthrop-University Hospital is a 591-bed acute care facility providing medical, surgical, pediatric, and obstetrical services and is also designated as a Level I Regional Trauma Center. Since 1996, it has been affiliated with South Nassau Communities Hospital under the parent corporation called Winthrop South Nassau University Health System, Inc. It is Long Island’s first voluntary and oldest not-for-profit hospital in Nassau and Suffolk Counties and is also a member of the LIHN. Admissions: 29,718, ER Visits: 49,279 87 Exhibit 6LPHS 2 HOSPITALS in NASSAU COUNTY 6 Η 10 Η 9 Η 7 Η Η8 12 Η ® 3 Η 4 Η ® 2 Η 5 Η ® 7 Η 11 Η1 1 – Long Beach Medical Center 2 – Mercy Medical Center (Catholic Health Services of Long Island) 3 – Nassau University Medical Center (NHCC) 4 – New Island Hospital 5 – Franklin Hospital (NSUH) 6 – Glen Cove Hospital (NSUH) 7 – North Shore University Hospital (NSUH) Long Beach Rockville Centre 8 – Plainview Hospital (NSUH) 9 – Syosset Hospital (NSUH) 10 – St. Francis Hospital (Catholic Health Services of Long Island) 11 – South Nassau Communities Hospital (New York Presbyterian Healthcare System) 12 – Winthrop University Hospital (New York Presbyterian Healthcare System East Meadow Bethpage Franklin Square Glen Cove Manhasset 88 Plainview Syosset Roslyn Oceanside Mineola Exhibit 6LPHS 3 COMMUNITY HEALTH CENTERS NASSAU HEALTH CARE CORPORATION Elmont Health Center 161 Hempstead Turnpike, Elmont, NY 11003 (516) 571-8200 Services: Primary Care/Specialty Hours: M,W,TH,F – 9am-12pm & 1pm-4pm, Tues – 5pm-8pm Freeport-Roosevelt Health Center 460 Main Street, Freeport, NY 11520 (516) 571-8600 Services: Primary Care/Specialty Hours: M,W,TH,F – 9am-12pm & 1pm-4pm, Tues – 5pm-8pm Hempstead Health Center 100 Main Street, Hempstead, NY (516) 572-1300 Services: Primary Care/Specialty Hours: M,W,TH,F – 9am-12pm & 1pm-4pm, Tues – 5pm-8pm Inwood-Lawrence Health Center 270 Lawrence Avenue, Lawrence, NY (516) 571-7874 Services: Primary Care/Specialty Hours: M,W,TH,F – 9am-12pm & 1pm-4pm, Tues – 5pm-8pm Westbury/New Cassel Health Center 682 Union Avenue, Westbury, NY (516) 571-9500 Services: Primary Care/Specialty Hours: M,W,TH,F – 9am-12pm & 1pm-4pm, Tues – 5pm-8pm Long Beach Satellite Center 615 Riverside Boulevard, Long Beach, NY (516) 571-7795 Roosevelt Jr.-Sr. High School School-Based Program One Wagner Avenue, Roosevelt, NY (516) 867-8551 NORTH SHORE UNIVERSITY HOSPITAL HEALTH SYSTEM NSLIJ Pediatric Mobile Health Center Mobile Site: 120 Greenwich Street, Hempstead, NY 11550 (888) 207-3714 Services: Pediatric Care Hours: M,T,TH – 9am-5pm, W,F – 1pm-5pm PLANNED PARENTHOOD Glen Cove Center 110 School Street, Glen Cove, NY 11542 (516) 750-2500 Services: Primary Care, OB/GYN & Family Planning Hours: M – 1pm-7:30pm, T – 9:30am-4pm, W – 1pm-7pm, TH – 10am-5pm, F – 10am-12pm, S – 9am-1pm Hempstead Center 540 Fulton Avenue, Hempstead, NY 11550 (516) 750-2500 Services: Primary Care, OB/GYN & Family Planning Hours: M-TH – 9am-8pm, F,S – 9am-4pm Massapequa Center 35 Carmans Road, Massapequa, NY 11758 (516) 750-2500 Services: Primary Care, OB/GYN & Family Planning Hours: M, W – 9:30am-6pm, T,TH – 9:30am-4pm, S – 9:30am-12pm 89 Exhibit 6LPHS 4 HIV/AIDS SERVICES African-American Health, Education & Development Foundation (AHEAD) (516) 538-0656 Education, information & advocacy AIDS Drug Assistance Program (ADAP) 1-800-542-2437 Assists with payment for certain HIV-related drugs and outpatient care Catholic Charities (516) 623-4420 Dental program Hempstead, NY Albany, NY Freeport, NY The Center for Rapid Recovery (516) 292-6449 Substance abuse program Hempstead, NY Circulo de la Hispanidad (516) 292-2433, 292-6853, 889-3869 Case-management, housing resources and transportation Hempstead, NY Long Beach, NY Economic Opportunity Commission of Nassau County, Inc. (EOC) (516) 292-9710 Provides financial assistance, food pantry Hempstead, NY Education Assistance Corporation (E.A.C.) (516) 489-7733 HIV/AIDS Meals-on-Wheels program Hempstead, NY Federation Employment & Guidance Service, Inc. (FEGS) (516) 485-5710, 496-7550 Mental health and client advocacy Hempstead, NY Syosset, NY Five Towns Community Center, Inc. (516) 505-9177 Case Management, pre-release and corrections outreach, alcohol & substance abuse program Hempstead, NY Hispanic Counseling Center (516) 538-2613 Mental Health, alcohol & substance abuse program Hempstead, NY Long Island Association for AIDS Care (LIAAC) 1-877-TO-LIAAC Case management, client advocacy, alcohol and substance abuse program, prevention education programs, legal clinic, emergency financial assistance, food pantry, home delivered meal program Huntington, NY Long Island Minority AIDS Coalition (631) 225-5500 Health education, treatment adherence Lindenhurst, NY Nassau County Youth Board (516) 227-7104 Teen peer education program Uniondale, NY Nassau-Suffolk Law Services (516) 292-8100 Legal support Hempstead, NY New York State Department of Health AIDS Institute 1-800-462-6785 Anonymous testing and counseling Hempstead, NY NHCC Nassau University Medical Center (NUMC) (516) 572-6506 Ambulatory/Outpatient medical treatment, confidential testing and counseling • NHCC Freeport-Roosevelt Health Center (516) 571-8600 • NHCC Westbury-New Cassel Health Center (516) 571-9500 Primary medical care, confidential testing and counseling East Meadow, NY Freeport, NY Westbury, NY North Shore University Hospital at Manhasset ((516) 562-4280 Center for AIDS Research and Treatment Ambulatory/Outpatient medical treatment, mental health and alcohol & substance abuse program Manhasset, NY Planned Parenthood of Nassau County, Inc. (516) 750-2500 Confidential testing, counseling and supportive program for women and men Hempstead, NY 90 Exhibit 6LPHS 5 NASSAU COUNTY NURSING HOMES A. HOLLY PATTERSON ENTENDED CARE FACILITY 875 Jerusalem Avenue, Uniondale, NY 11553 (516) 572-1400 Certified Beds: 889 BAYVIEW NURSING AND REHABILITATION CENTER One Long Beach Road, Island Park, NY 11558 (516) 432-0300 Certified Beds: 185 BEACH TERRACE CARE CENTER 640 West Broadway, Long Beach, NY 11561 (516) 431-4400 Certified Beds: 182 BELAIR CARE CENTER, INC. 2478 Jerusalem Avenue, Bellmore NY 11710 (516) 826-1160 Certified Beds: 102 CENTRAL ISLAND HEALTHCARE 825 Old Country Road, Plainview, NY 11803 (516) 433-0600 Certified Beds: 202 COLD SPRING HILLS CENTER FOR NURSING AND REHABILITATION 378 Syosset-Woodbury Road, Woodbury, NY 11797 (516) 622-7700 Certified Beds: 672 DALEVIEW CARE CENTER 574 Fulton Street, Farmingdale, NY 11735 (516)964-9800 Certified Beds 142 EAST ROCKAWAY PROGRESSIVE CARE FACILITY 243 Atlantic Avenue, Lynbrook, NY 11563 (516) 599-2744 Certified Beds: 100 FRANKLIN HOSPITAL MEDICAL CENTER 900 Franklin Avenue, Valley Stream, NY 11580 (516) 256-6700 Certified Beds: 120 FULTON COMMONS CARE CENTER, INC. 60 Merrick Avenue, East Meadow, NY 11554 (516) 222-9300 Certified Beds: 280 GARDEN CARE CENTER 135 Franklin Avenue, Franklin Square, NY 11010 (516) 775-2100 Certified Beds: 150 GLEN COVE CENTER FOR NURSING AND REHABILITATION 6 Medical Plaza, Glen Cove, NY 11542 (516) 671-9010 Certified Beds: 154 GLENGARIFF CORPORATION Dosoris Lane, Glen Cove, NY 11542 (516) 676-1100 Certified Beds: 262 GRACE PLAZA NURSING AND REHABILITATION CENTER 15 St Pauls Place, Great Neck, NY 11021 (516) 466-3001 Certified Beds: 214 GRANDELL REHABILITATION AND NURSING CENTER 645 W. Broadway, Long Beach, NY 11561 (516) 889-1100 Certified Beds: 278 HEMPSTEAD PARK NURSING HOME 800 Front Street, Hempstead, NY 11550 (516) 705-9700 Certified Beds: 251 HIGHFIELD GARDENS CARE CENTER OF GREAT NECK 199 Community Drive. Great Neck, NY 11021 (516) 365-9229 Certified Beds: 200 KOMANOFF CTR FOR GERIATRIC & REHAB MEDICINE 375 East Bay Drive, Long Beach, NY 11561 (516) 897-1220 Certified Beds: 200 MARQUIS CARE CENTER 2 Medical Plaza, Glen Cove, NY 11542 (516) 671-0858 Certified Beds: 102 MAYFAIR CARE CENTER 100 Baldwin Road, Hempstead, NY 11550 (516) 538-7171 Certified Beds: 200 91 Exhibit 6LPHS 5 (cont’d) NASSAU COUNTY NURSING HOMES MEADOWBROOK CARE CENTER, INC 320 West Merrick Road, Freeport, NY 11520 (516) 377-8200 Certified Beds: 280 NASSAU EXTENDED CARE FACILITY One Greenwich Street, Hempstead, NY 11550 (516) 565-4800 Certified Beds: 280 NORTH SHORE UNIVERSITY HOSPITAL CENTER FOR EXTENDED CARE & REHABILITATION 300 Community Drive, Manhasset, NY 11030 (516) 562-8000 Certified Beds: 256 OCEANSIDE CARE CENTER, INC. 2914 Lincoln Avenue, Oceanside, NY 11572 (516) 536-2300 Certified Beds: 100 PARK AVENUE EXTENDED CARE FACILITY 425 National Boulevard, Long Beach, NY 11561 (516) 431-2600 Certified Beds: 240 PARKVIEW CARE AND REHABILITATION CENTER, INC. 5353 Merrick Road, Massapequa, NY 11758 (516) 798-1800 Certified Beds: 169 ROCKVILLE NURSING CENTER, INC. 41 Maine Avenue. Rockville Centre, NY 11570 (516) 536-7730 Certified Beds: 158 ROCKVILLE SKILLED NURSING & REHABILITATION CENTER, LLC 50 Maine Avenue, Rockville Centre, NY 11570 (516) 536-8000 Certified Beds: 66 SANDS POINT CENTER FOR HEALTH & REHABILITATION 1440 Port Washington Boulevard, Port Washington, NY 11050 (516) 719-9400 Certified Beds: 180 SOUTH SHORE HEALTHCARE 275 West Merrick Road, Freeport, NY 11520 (516) 623-4000 Certified Beds: 100 SUNHARBOR MANOR 255 Warner Avenue, Roslyn Heights, NY 11577 (516) 621-5400 Certified Beds: 266 TOWNHOUSE EXTENDED CARE FACILITY 755 Hempstead Turnpike, Uniondale, NY 11553, (516) 565-1900 Certified Beds: 280 WHITE OAKS NURSING HOME 8565 Jericho Turnpike, Woodbury, NY 11797 (516) 367-3400 Certified Beds: 200 WOODBURY NURSING HOME 8533 Jericho Turnpike, Woodbury, NY 11797 (516) 692-4100 Certified Beds: 123 WOODMERE REHABILITATION & HEALTH CARE CENTER, INC. 121 Franklin Place, Woodmere, NY 11598 (516) 374-9300 Certified Beds: 336 92 Exhibit 6LPHS 6 NURSING HOMES in NASSAU COUNTY 13 ▲ ▲ 12 19 ▲ ▲ 6 29 14 ▲ 33 ▲ ▲ 34 ▲ 17 ▲ ▲ 31 5 ▲ 23 ▲ ▲ 10 ▲ 16 ▲ ▲ 20 ▲ 32 ▲ 22 ▲ ▲ 11 35 4 26 28 8 ▲ ® ▲ ▲ ▲ 27 ▲ 24 7 ▲ 1 9▲ ® 21 30 ▲ ▲ ▲ ® 2 ▲ ▲ ▲▲▲ 18 15 3 25 1 – A.Holly Patterson Extended Care Facility 2 – Bayview Nursing and Rehabilitation Center 3 – Beach Terrace Care Center 4 – Belair Care Center, Inc. 5 – Central Island Healthcare 6 – Cold Spring Hills Nursing & Rehabilitation Center 7 – Daleview Care Center 8 – East Rockaway Progressive Care Facility 9 – Franklin Hospital Medical Center 10 – Fulton Commons Care Center, Inc. 11 – Garden Care Center 12 – Glen Cove Center for Nursing & Rehabilitation 13 – Glengariff Corporation 14 – Grace Plaza Nursing & Rehabilitation Center 15 – Grandell Rehabilitation & Nursing Center 16 – Hempstead Park Nursing Home 17 – Highfield Gardens Care Center of Great Neck (Operated by Wedgewood Care Center, Inc.) 18 – Komanoff Center for Geriatric & Rehab Medicine 19 – Marquis Care Center 20 – Mayfair Care Center 21 – Meadowbrook Care Center, Inc. 22 – Nassau Extended Care Facility 23 – NSUH Center for Extended Care & Rehabilitation 24 – Oceanside Care Center, Inc. 25 – Park Avenue Extended Care Facility 26 – Parkview Care & Rehabilitation Center, Inc. 27 – Rockville Nursing Center, Inc. 28 – Rockville Skilled Nursing & Rehabilitation Center 29 – Sands Point Center for Health & Rehabilitation 30 – South Shore Healthcare 31 – Sunharbor Manor 32 – Townhouse Extended Care Facility 33 – White Oaks Nursing Home 34 – Woodbury Nursing Home 35 – Woodmere Rehabilitation & Health Care Center Uniondale Island Park Long Beach No. Bellmore Plainview Woodbury Farmingdale Lynbrook Valley Stream East Meadow Franklin Square Glen Cove Glen Cove Great Neck Long Beach Hempstead Great Neck 93 Long Beach Glen Cove Hempstead Freeport Hempstead Manhasset Oceanside Long Beach Massapequa Rockville Centre Rockville Centre Port Washington Freeport Roslyn Heights Uniondale Woodbury Woodbury Woodmere EXHIBIT 6LPHS 7 COMMUNITY PARTNERS AND COLLABORATIONS Mobilizing community partnerships is one of the ten essential public health services. partnerships, collaborations and advisory groups that contribute to our overall mission. Organization Below is a partial listing of LHD Mission ADVISORY GROUPS Nassau County HIV Commission (516) 571-2019 Community member advisory board to the LHD which works actively with county leaders to educate the public on HIV/AIDS infection prevention. Nassau County Minority Health Task Force (516) 571-2260 Collaboration of the community, health care providers, county government officials, NCDMH and the LHD to eliminate health care disparities and improve the quality of care for minorities. Nassau Suffolk Hospital Council, Inc. (NSHC) (631) 435-3000 To enhance health care for all Long Islanders by representing the interests of its 23 member hospitals before lawmakers, regulatory agencies, the media, and the public. ADVOCACY AND POLICY American Cancer Society (ACS) (516) 921-6016 Work together in support of New York State’s Clean Indoor Air Act and cancer care and treatment. Health & Welfare Council of Long Island (HWCLI) (516) 483-1110 To respond to the needs of vulnerable families and individuals by promoting the development of public policies and services. IPRO, Inc, (516) 326-7767 Oversight responsibility for all planning, data collection, analysis and reporting for the NYSDOH statewide monitoring contracts to assess and improve the value of health care services received by consumers. Nassau Suffolk Adult Immunization Coalition (516) 571-1680 To increase the adult immunization level. National Black Leadership on AIDS (NBLCA) (212) 614-0023 Increase awareness and community involvement to develop preventative solutions for HIV/AIDS. Tobacco Action Coalition of Long Island (631) 231-5864 x11 To increase the acceptance of non-smoking as the social norm through media advocacy, policy initiatives and existing tobacco education and control programs. 94 COMMUNITY HEALTH American Heart Association (516) 777-8447 Promote “Search Your Heart”, a faith based healthy heart awareness/education initiative to reduce heart disease in minority populations. Coalition to Eliminate Racial and Ethnic Disparities in Healthcare and A.H.E.A.D. (516) 538-0656/(631) 225-5500 To improve cultural competency among health care providers. Coalition for Community Well Being, Aubrey Lewis, MD (516) 565-1203 Participate in health fair screenings and conferences. Coordinated School Health Center (BOCES) (631) 242-1128 To promote healthy schools and strengthen coordination and support for healthy schools. Cornell Cooperative Extension of Nassau County (CCE) 516 292-7990 To provide communities with nutrition, parenting, agriculture, workplace wellness, and youth development programs. Economic Opportunity Commission of Nassau County (EOC) (516) 292-9710 To provide low-income and minority individuals of the county the opportunity for education, training, employment, health care and decent housing. Long Island Association for AIDS Care (LIAAC) 1-877-TO-LIAAC Under contract to provide HIV prevention services. Long Island Minority AIDS Coalition (LIMAC) (631) 225-5500 Under contract to provide HIV prevention services. Long Island Non Motorized Traffic Study (LINMTS) (631) 952-6632 Promotion of safe pedestrian, bicycle and other nonmotorized transportation through education, engineering and policy development. Nassau-Suffolk Ryan White HIV Health Services Planning Council (631) 940-3711 Work with the Policy Advisory and Comprehensive Service Plan Development Committees to ensure the provision of emergency services to HIV-positive individuals. New York State Public Health Association (518) 427-5835 To support the improvement of community and environmental health through education and prevention. Perinatal Services Network (516) 572-0954 Comprised of member organizations which provide health, social, economic, legal and other relevant services, Information and referrals to pregnant and parenting women regardless of citizenship or ability to pay. EDUCATIONAL INSTITUTIONS Adelphi University (516) 877-4413 VITAL SIGNS Project to analyze the social health of Long Island's peoples and communities with particular focus on disparities amidst affluence. Hofstra University (516) 463-5883 Internship affiliation. New York College of Osteopathic Medicine (NYCOM) (516) 686 3777 Partner in emergency preparedness. SUNY Farmingdale (631) 420-2060 Partner in oral health initiative. SUNY Stony Brook (631) 444-2341 Placement for preventative medicine residents. 95 ENVIRONMENTAL HEALTH Beach Information Network LHD and beach operators regarding the beaches. Cedar Creek Health Risk Assessment Committee To monitor health concerns in the area because of the existence of the sewage treatment plant. Coalition to Save Hempstead Harbor Organization collects surface water samples and submits to the LHD Lab for analysis for use in the LHD’s beach water monitoring program. Friends of the Bay Organization collects surface water samples in the Oyster Bay area and submits to the LHD Lab for analysis for use in the LHD’s beach water monitoring program. Nassau County Soil and Water Conservation District (516) 454-4872/0900 To conserve soil and water resources, control sediment and erosion, reduce floodwater, preserve natural resources, assist in the drainage and irrigation of agricultural lands, preserve wildlife and protect public lands. Members are appointed by the Nassau County legislature. New York State Restaurant Association (NYSRA) (516) 752-0707 To improve worker safety, especially related to indoor air quality. Greater Long Island Clean Cities Coalition (631) 969-3700 To advance economic, environmental and energy security by supporting decisions to adopt practices that contribute to the reduction of petroleum consumption and developing public and private partnerships to promote alternative fuels and vehicles, fuel blends, fuel economy, hybrid vehicles and idle reduction awareness. Long Island Groundwater Research Institute Marine Sciences Research Center Stony Brook University 631-632-8674 Fundamental research designed to increase the understanding of the processes that characterize the coastal ocean and the atmosphere and to apply research to solve problems that result from uses and misuses of the environment. Long Island Veterinarian Association, Rabies Control The LHD exchanges information regarding rabies control. share information HEALTH CARE PROVIDERS Asthma Coalition of Long Island (ACLI) (631) 231-5864 x12 To reduce the burden of asthma through awareness/education and disease management initiatives. Nassau Partnership for Healthy Communities (NPHC) (516) 465-3186 To improve quality of and access to health care for poor and underserved communities. Nassau University Medical Center (NUMC) (516) 572-0123 Under contract to provide essential public health services through its community health centers. Planned Parenthood of Nassau County (PPNC) (516) 750-2500 Work jointly to reduce HIV infection and unintended pregnancy. PROFESSIONAL SOCIETIES 96 Nassau County Medical Society (NCMS) (516) 832-2300 To preserve the doctor-patient relationship, to assure access to quality medical care for all, and to voice the ethical perspective of physicians in their provision of medical care. American Academy of Pediatrics – (AAP NY Chapter 2) (516) 326-0310 To achieve optimal physical, mental and social health and well-being for all infants, children, adolescents and young adults by supporting the professional needs of its members. 97 Exhibit 6LPHS 8 NATIONAL HEALTH PERFORMANCE NPHPSP PUBLIC PERFORMANCE ASSESSMENTSTANDARDS SUMMARY PROGRAM SCORES PERFORMANCE ASSESSMENT SUMMARY SCORES NASSAU COUNTY HEALTH SYSTEM AND NEW YORK STATE 2001 NASSAU COUNTY NEW YORK STATE* 100 90 80 SCORES 70 60 50 40 30 20 10 0 ES1 ES2 ES3 ES4 ES5 ES6 ES7 ES8 ES9 ES10 ESSENTIAL PUBLIC HEALTH SERVICES *New York State Local Aggregate Score. Source: CDC Public Health Practice Program Office, Division of Public Health Systems Development and Research, (800)7477649 ES 1 ES 2 ES 3 ES 4 ES 5 ES 6 ES 7 ES 8 ES 9 ES 10 Monitor health status to identify community health problems. Diagnose and investigate health problems and health hazards in the community. Inform, educate and empower people about health issues. Mobilize community partnerships to identify and solve health problems. Develop policies and plans that support individual and community health efforts. Enforce laws and regulations that protect health and ensure safety. Link people to needed personal health services and assure provision of health care when otherwise unavailable. Assure a competent public health and personal health care workforce. Evaluate effectiveness, accessibility and quality of personal and population-based health services. Research for new insights and innovative solutions to health problems. 98 APPENDIX 7 - Community Health Assessment Indicators Exhibit 7CHAI 1 – New York State Community Health Indicators Overview ............................................100 Exhibit 7CHAI 2 – Cancer, Nassau County, 1997-2001 (Table) ..................................................................101 Exhibit 7CHAI 3 – Child and Adolescent Health, Nassau County, 2000-2002 (Table) ............................102 Exhibit 7CHAI 4 – Cirrhosis and Diabetes, Nassau County, 2000-2002 (Table) ........................................103 Exhibit 7CHAI 5 – Family Planning and Natality, Nassau County, 2000-2002 (Table) .............................104 Exhibit 7CHAI 6 – Health Risks and Health Behaviors, 2000-2002 (Table) .................................................105 Exhibit 7CHAI 7 – Heart Disease and Stroke, Nassau County, 2000-2002 (Table) ...................................106 Exhibit 7CHAI 8 – HIV/AIDS and Sexually Transmitted Diseases, Nassau County, 2000-2002 (Table) ................................................................................................................107 Exhibit 7CHAI 9 – Infectious Diseases and Immunization, Nassau County, 2000-2002 (Table) ................................................................................................................108 Exhibit 7CHAI 10 – Injury Mortality and Morbidity, Nassau County, 2000-2002 (Table) ..........................109 Exhibit 7CHAI 11 – Maternal and Infant Health, Nassau County, 2000-2002 (Table) .............................110 Exhibit 7CHAI 12 – Respiratory Diseases, Nassau County, 2000-2002 (Table) ..........................................111 99 Exhibit 7CHAI 1 New York State County Health Assessment Indicators Overview The New York State County Health Assessment Indicator (CHAI) Reports consist of a series of tables presenting selected public health indicators by health topic areas. These public health indicators and presentation format were developed with input from state and local health department representatives. The health topic areas are as follows: Cancer, Child/Adolescent Health, Cirrhosis/Diabetes, Family Planning and Natality, Health Behaviors, Heart Disease and Stroke, HIV/AIDS and Sexually Transmitted Disease, Immunization and Infectious Diseases, Injury Mortality/Morbidity, Maternal and Infant Health and Respiratory Diseases. Several resources were used in compiling these tables including: • • • • • • New York State birth, death, and fetal death files for mortality and natality rates. Statewide Planning and Research Cooperative Systems (SPARC) files, based on hospital discharges, for information on morbidity. Department of Health disease registries, including cancer, AIDS/HIV, communicable disease, and sexually transmitted disease. Program-based systems. (STD) The Expanded Behavioral Risk Factor Surveillance System (Expanded BRFSS), based on a household telephone survey, for information on health behaviors. Other non-health department sources such as the US Census Bureau Small Area Data Set and the NYS Departments of Education, Labor, and Motor Vehicles. Most indicators are presented using the last three years of available data for the numerator, and the three-year average for the county and state rates. The mid-year population (2001 for 2000-2002 rate) was used for the denominator in generating these rates. County rates were compared to New York State, New York State (excl. NYC) for "upstate" counties, or New York City for "city" counties/boroughs, and tested to see whether the two rates were "significantly" different at the 95% level. A quartile ranking of the county rate, in relation to the rates of all 62 NYS counties, was also included for each indicator (1most favorable, 4- least favorable). The Healthy People 2010 Goal is also presented, if available. Mortality and hospitalization-based indicators are presented as both crude and age-adjusted rates. The standard population used for adjustment was the 2000 United States population. Age-adjustment allows for the comparison of rates between counties because they are less influenced by differences in the county age distribution. Behavior/Risk Indicators were generated using the Expanded BRFSS. The Expanded BRFSS was a telephone-based survey collecting information on self-reported health risk behaviors in adult New Yorkers. The Expanded BRFSS was conducted from July 2002 through 2003 in 38 localities (individual counties and county groupings) comprising the entire state. The Expanded BRFSS questionnaire was constructed of standard BRFSS items and modules developed by the Centers for Disease Control and Prevention. Questionnaire development began with the selection of a common set of core items and modules to be asked in each of the 38 localities. Each locality was then allowed to select optional items and modules of particular interest to their respective area to complete the balance of their specific questionnaire. Expanded BRFSS-based indicators present the weighted percent and its 95% confidence interval. Statewide Expanded BRFSS data are available only on items contained in the "core" questionnaire. For county-selected optional items, the Expanded BRFSS results are compared to statewide BRFSS data. Quartile ranks are based on county or county groupings that collected that item on their questionnaire. Rates based on fewer than 20 events in the numerator will be highlighted (*) as unstable. The numerator and rates are suppressed if based on one or two events. 100 Exhibit 7CHAI 2 CANCER NASSAU COUNTY 1997-2001 Indicator 5 Year Total County Rate NYS Rate Sig.Dif. NYS Rate exc NYC Sig.Dif. Quartile HP2010 Goal HP2010 Goal Met? AGE-ADJUSTED INCIDENCE -Colon and Rectum 4,806 63.1 62.2 No 63.5 No 2nd N/A N/A -Lung and Bronchus 5,131 67.0 67.1 No 73.6 Yes 1st N/A N/A -Female Breast 5,864 144.3 131.4 Yes 139.0 Yes 4th N/A N/A -Prostate 5,742 171.7 163.6 Yes 166.7 No 3rd N/A N/A AGE-ADJUSTED MORTALITY -Colon and Rectum 1,519 20.0 22.3 Yes 22.5 Yes 1st 13.9 No -Lung and Bronchus 3,632 47.3 50.1 Yes 55.3 Yes 1st 44.9 No 233 3.1 2.3 Yes 2.7 No 3rd 2.5 No 1,290 30.3 28.9 No 28.9 No 3rd 22.3 No 96 2.4 3.0 No 2.5 No 2nd 2.0 No -Ovary 419 9.7 9.1 No 9.7 No 3rd N/A N/A -Prostate 778 27.0 30.5 Yes 30.3 Yes 1st 28.8 Yes -Melanoma of the Skin -Female Breast -Cervix Uteri AGE-ADJUSTED CANCER INCIDENCE AND PERCENT EARLY STAGE DIAGNOSIS -Colon and Rectum N/A 41% 40% No 43% Yes 2nd 50% No -Lung and Bronchus N/A 26% 26% No 27% No 2nd N/A N/A -Melanoma of the Skin N/A 85% 81% No 82% No 2nd 90% No -Female Breast N/A 66% 66% No 68% No 3rd 75% No -Cervical N/A 55% 55% No 58% No 3rd 65% No -Ovary N/A 24% 24% No 23% No 2nd N/A N/A -Prostate N/A 90% 87% Yes 87% Yes 1st 95% No % women 18+ years with pap smear in past 3 years (BRFSS)(a) N/A N/A 84.8 ± 1.9 N/A N/A N/A 90 Yes % women 40+ years with mammography screening in past 2 years(BRFSS)(b) 78.5 ± 5.8 77.6 ± 1.6 78.2 ± 1.5 2nd 70 Yes *: Fewer than 20 events in the numerator; therefore rate is unstable, s: Total suppressed for confidentiality, #: 95% confidence interval for BRFSS/Expanded BRFSS indicators Definition: (a) Percentage of female respondents who indicated they have had a pap smear in the past 3 years. (b) Percentage of female respondents aged 50 or older who indicated they have had a mammogram and breast exam in the past 2 years. Data notes: For cancer mortality statistics, deaths are grouped according to ICD codes recorded on death certificates. All deaths received a ICD-9 code before year 1999 and a ICD-10 code thereafter. Standard Site Analysis categories for mortality data are available on the SEER Cause of Death Recode web page. Incidence and Stage at Diagnosis Data are based on reports from hospitals and other health facilities that diagnose and treat cancer patients. All primary tumors receive a ICD-O-3 code indicating the anatomic site of origin. Standard Site Analysis categories for cancer data analysis are available on the SEER Incidence Site Recode web page. These data include only invasive malignant tumors. Data are presented for a five-year time period. Stage at diagnosis is determined based on the clinical information received from reporting facilities. Early stage is defined as invasive cancers that are limited to the tissue of origin. Patients for whom stage at diagnosis is unknown are not included in the calculation of percent of cancers diagnosed at an early stage. Source: New York State Department of Health 101 Exhibit 7CHAI 3 CHILD AND ADOLESCENT HEALTH NASSAU COUNTY 2000-2002 3 Year Total County Rate NYS Rate Sig. Dif. NYS Rate exc NYC Sig. Dif. Quartile HP2010 Goal HP2010 Goal Met? 1-4 years 44 21.9 26.7 No 27.0 No 2nd 25 Yes 5-9 years 21 7.5 12.3 No 11.4 No 2nd 14 Yes 10-14 years 32 11.2 14.6 No 13.6 No 2nd 17 Yes 1,202 47.9 66.0 Yes 35.7 Yes 4th 25 No 5-14 years 716 12.7 22.2 Yes 10.2 Yes 4th N/A N/A 0-17 years 2,008 20.6 31.8 Yes 15.8 Yes 4th 17 No Gastroenteritis hospitalization rate per 10,000 (0-4 yrs) 640 25.5 32.2 Yes 19.1 Yes 3rd N/A N/A Otitis media hospitalization rate per 10,000 (0-4 yrs) 254 10.1 6.5 Yes 4.3 Yes 4th N/A N/A Pneumonia hospitalization rate per 10,000 (0-4 yrs) 1,201 47.8 50.6 No 40.6 Yes 3rd N/A N/A % children born in 1998 & 1999 screened for lead by age 2 22,600 66.2 N/A N/A 63.7 Yes 3rd N/A N/A 339 0.6 N/A N/A 1.8 Yes 1st N/A N/A Indicator Childhood Mortality (per 100,000) Asthma Hospitalization rate per 10,000 0-4 years Incidence rate among children <72 months of age with a confirmed blood lead levels>=10ug/dl tested in 2000 and 2001(a) *: Fewer than 20 events in the numerator; therefore rate is unstable s: Total suppressed for confidentiality Definition: The rates are the number of deaths per 100,000 children in the specific age group. The number of hospitalizations for asthma in a particular age group per 10,000 population in that age group. The ICD-9 code for asthma is 493. The number of hospitalizations for gastroenteritis among children ages 0-4 years per 10,000 children in the specific age group. The ICD-9 codes for gastroenteritis are: 008.6, 008.8, 009.0-009.3, and 558.9. The number of hospitalizations for otitis media among children ages 0 - 4 years per 10,000 children in the specific age group. The ICD-9 codes for otitis media are: 381 - 382. The number of hospitalizations for pneumonia- among children ages 0 - 4 years per 10,000 children in the specific age group. The ICD-9 codes for pneumonia are: 480 - 486. (a) The proportion of children newly identified with a confirmed elevated blood lead level of 10µg/dL or greater per 100 children screened in the given time frame. Data notes: Vital Records: Information is extracted from birth, death and fetal death certificates. When percentages are calculated records with missing information for the indicator of interest are excluded from the calculation. Population based rates use population estimates provided by the US Census Bureau. ICD-10 codes are used for cause of death. Statewide Planning and Research Cooperative System-SPARCS: Data on hospitalization are collected through the hospital inpatient discharge data system. Each hospitalization receives an ICD-9 code at discharge which indicates the primary reason for the hospitalization. Data are not available on events that did not result in a hospitalization, such as cases that were only treated in a hospital emergency room. The New York State Lead Poisoning Prevention Program: This program collects and analyzes statewide data on the extent and severity of childhood lead poisoning. The Indicator "% of children screened by age two" represents the Birth Cohort Screening Rate: This rate represents the total number of children that had been tested at least once for elevated blood lead levels before age twenty four months in a given birth year divided by the total number of births in the respective birth year (birth cohort). This proportion is then multiplied by 100 to represent the average screening rate per 100 children born in a given year by age two by geographic area. Incidence rate: The number of children identified for the first time with a confirmed elevated blood lead level before age 72 months who had never been identified previously with a confirmed elevated blood lead level (≥10µg/dL) divided by the number of children that had a screening test in that given test year. Only children who did not previously have a confirmed elevated blood lead level are included in the screening denominator. This proportion is then multiplied by 100 to represent the average number of children newly identified per 100 children tested in the given time frame. Total State lead rates are exclusive of New York City (NYC) because the New York State Childhood Lead Registery does not include NYC records. Comparable data generated by NYC staff are not available due to differences in methodology. Source: New York State Department of Health 102 Exhibit 7CHAI 4 CIRRHOSIS & DIABETES NASSAU COUNTY 2000-2002 Indicator 3 Year Total County Rate NYS Rate Sig.Dif. NYS HP2010 Sig.Dif. Quartile Rate Goal exc NYC HP2010 Goal Met? CIRRHOSIS Mortality rates per 100,000 (ICD10 K70,K73-K74) Crude 227 5.6 7.4 Yes 7.9 Yes 1st N/A N/A Age-adjusted 227 4.9 7.2 Yes 7.3 Yes 1st N/A N/A Crude 975 2.4 3.2 Yes 2.5 No 2nd N/A N/A Age-adjusted 975 2.2 3.1 Yes 2.3 No 2nd N/A N/A Hospitalization rates per 10,000 (ICD9 571) DIABETES Mortality rate per 100,000 (ICD10 E10E14) Crude 551 13.7 20.5 Yes 19.8 Yes 1st N/A N/A Age-adjusted 551 11.7 19.7 Yes 18.0 Yes 1st N/A N/A Crude 5,830 14.5 18.9 Yes 14.3 No 3rd N/A N/A Age-adjusted 5,830 13.2 18.5 Yes 13.6 Yes 2nd N/A N/A Crude 72,982 181.6 191.5 Yes 177.7 Yes 2nd N/A N/A Age-adjusted 72,982 157.3 186.4 Yes 164.7 Yes 2nd N/A N/A County Rate CI # NYS Rate 5.8 ± 1.9 7.2 1st N/A N/A Hospitalization rate per 100,000 (Primary dx ICD9 250) Hospitalization rate per 100,000 (Any dx ICD9 250) - Behavior/Risk Indicator (2003) Diabetes prevalence rate per 100 adults CI # ± 0.6 Upstate 6.6 CI # ± 0.5 *: Fewer than 20 events in the numerator; therefore rate is unstable, s: Total suppressed for confidentiality, #: 95% confidence interval for BRFSS/Expanded BRFSS indicators Definition: The number of deaths due to Cirrhosis per 100,000 population. The codes used for the Cirrhosis mortality are ICD-10 codes: K70, K73-K74. ** The number of hospitalizations due to Cirrhosis per 10,000 population. The ICD9 code for Cirrhosis is: 571. ** The number of deaths due to diabetes per 100,000 population. The ICD-10 codes used for diabetes are: E10-E14. ** The number of hospitalizations due to diabetes per 10,000 population. The ICD 9 code used for Diabetes is: 250. Only hospitalizations with diabetes as the primary diagnosis are included. The percent of adults that reported they have been told by a health professional that they have diabetes. Data notes: Expanded BRFSS: All data relates to adults 18 years of age or older. The Expanded BRFSS was a telephone-based survey that collects information on self-reported health related behaviors. Between July 2002 and July 2003, the Expanded BRFSS was conducted in 38 localities (individual counties and county groupings) comprising the entire state. Also, see previous. ** The standard population used for age adjustment was the 2000 US population. Source: New York State Department of Health 103 Exhibit 7CHAI 5 FAMILY PLANNING AND NATALITY NASSAU COUNTY 2000-2002 Sig. Dif. Sig. HP2010 Quartile Dif. Goal HP2010 Goal Met? County Rate 65,995 82.1 93.8 Yes 77.4 Yes 4th N/A N/A - 10-14years 83 0.6 1.7 Yes 1.0 Yes 2nd N/A N/A - 15-17 years 1,485 19.5 42.2 Yes 28.0 Yes 1st 43 Yes - 15-19 years 4,061 33.7 68.8 Yes 47.4 Yes 1st N/A N/A 11,254 22.8 20.8 Yes 23.4 Yes 2nd 6 No 594 1.2 2.7 Yes 2.4 Yes 1st N/A N/A % of births to women 35+ years 13,397 27.1 18.7 Yes 19.6 Yes 4th N/A N/A Fertility rate (Birth/pop 15-44 years per 1,000) 49,319 61.3 60.2 Yes 58.5 Yes 4th N/A N/A 594 2.8 6.6 Yes 5.3 Yes 1st N/A N/A 2,264 132.6 110.7 Yes 78.2 Yes 4th N/A N/A 12,501 25.3 48.5 Yes 26.8 Yes 3rd N/A N/A Pregnancy Rate (15-44 years) per 1,000 NYS Rate NYS Rate exc NYC 3 Year Total Indicator Teen Pregnancy Rate per 1,000 % of Births within 24 months of previous pregnancy % of births to teens (10-17 years) Teen birth rate (Births 10-17/pop 10-17 per 1,000) Abortion Ratio (induced abortions per 100 live births) 15-19 years All ages *: Fewer than 20 events in the numerator; therefore rate is unstable, s: Total suppressed for confidentiality Definition: Pregnancies are the sum of the number of live births, induced terminations of pregnancies, and all fetal deaths. Pregnancy rates are the number of pregnancies in a particular age group per 1,000 females in that same age group. Birth Interval: The percentage of total births to women that had had a previous pregnancy within 24 months of the current birth. The percent of total births that were to females in particular age groups. The number of live births per 1,000 female population aged 15-44. The number of live births to teens aged 10-17 per 1,000 female population 10-17. The abortion ratio is the number of induced abortions per 100 live births in particular age groups. Data notes: Vital Records: Information is extracted from birth, death and fetal death certificates. When percentages are calculated records with missing information for the indicator of interest are excluded from the calculation. Population based rates use population estimates provided by the US Census Bureau. ICD-10 codes are used for cause of death. Source: New York State Department of Health 104 Exhibit 7CHAI 6 HEALTH RISKS AND HEALTH BEHAVIORS NASSAU COUNTY 2000-2002 Indicator 3 Year Total County Rate NYS Rate Sig. Dif. NYS Rate exc NYC Sig. Dif. Quartile HP2010 Goal HP2010 Goal Met? % children underweight (0-4 years, low SES) 543 7.1 7.4 No 6.4 Yes 3rd N/A N/A % children overweight (2-4 years, low SES) 768 21.2 16.3 Yes 14.2 Yes 4th N/A N/A Upstate CI # - Behavior/Risk Indicator (2003) - County Rate CI # NYS Rate CI # % adults overweight or obese (BMI 25+) 52.1 ± 4.8 56.7 ± 1.2 57.6 ± 1.1 1st N/A N/A % adults that participated in leisure time physical activity in last 30 days 75.6 ± 4.3 74.6 ± 1.0 77.6 ± 1.0 3rd N/A N/A % adults smoking cigarettes 17.7 ± 3.5 20.3 ± 0.9 22.1 ± 0.9 1st 12 No for one day or longer 57.6 ± 10.9 58.0 ± 2.3 55.6 ± 2.3 2nd 75 No % adults that binge drink 10.8 ± 2.8 14.1 ± 0.8 15.2 ± 0.9 1st N/A N/A N/A ± 0.0 25.8 ± 1.4 N/A N/A N/A % adult smokers that tried to quit smoking % adults eating 5 or more servings of fruit or vegetables daily N/A N/A *: Fewer than 20 events in the numerator; therefore rate is unstable, s: Total suppressed for confidentiality, #: 95% confidence interval for BRFSS/Expanded BRFSS indicators Definition: The percent of respondents that reported they ate at least five or more servings of fruits and vegetables in the past day. The percent of respondents with body mass index (BMI) equal to or greater than 25. BMI is defined as weight in kilograms divided by height in meters squared w/h2. The percent of respondents who report they participated in some type of physical activity during their leisure time at least one in the last 30 days. The percent of respondents who report having five or more drinks on an occasion, one or more times in the past 30 days. The percent of respondents who have smoked 100 cigarettes in their lifetime and reported smoking every day or some days. The percent of respondents who tried to quit smoking for one day or longer during the past 12 months. Underweight is defined as < 5th percentile based on 2000 CDC growth chart percentiles for weight-for-length for children under 2 years of age and BMI-for-age for children 2 years of age and older. Overweight defined as at or above the 95th percentile based on BMI-for-age. Data notes: Expanded BRFSS: All data relates to adults 18 years of age or older. The Expanded BRFSS was a telephone-based survey that collects information on self-reported health related behaviors. Between July 2002 and July 2003, the Expanded BRFSS was conducted in 38 localities (individual counties and county groupings) comprising the entire state. Pediatric Nutrition Surveillance System - WIC Program: This data system in the Division of Nutrition provides nutrition related information on low-income infants and children enrolled in the WIC Program Source: New York State Department of Health 105 Exhibit 7CHAI 7 HEART DISEASE AND STROKE NASSAU COUNTY 2000-2002 3 Year Total Indicator County Rate NYS Rate Sig. Dif. NYS Rate exc NYC Sig. Dif. Quartile HP 2010 Goal HP 2010 Goal Met? CARDIOVASCULAR DISEASE Mortality rates per 100,000 (ICD10 I00-I99) Crude 15,965 397.3 358.6 Yes 369.8 Yes 3rd N/A N/A Mortality rates per 100,000 (ICD10 I00-I99) Age-adjusted 15,965 339.2 341.1 No 331.5 Yes 3rd N/A N/A Premature death (ages 35-64) 1,538 92.2 119.1 Yes 108.2 Yes 1st N/A N/A Pretransport mortality 5,927 147.5 132.4 Yes 168.3 Yes 2nd N/A N/A Hospitalization rates per 10,000 (ICD9 390-459) Crude 14,126 35.2 30.4 Yes 32.1 Yes 4th N/A N/A Hospitalization rates per 10,000 (ICD9 390-459) Age-adjusted 14,126 30.1 29.5 Yes 29.3 Yes 4th N/A N/A DISEASES OF THE HEART Mortality rates per 100,000 (ICD10 I00-I09, I11, I13, I20-I51) Crude 13,597 338.4 288.2 Yes 289.2 Yes 3rd N/A N/A Mortality rates per 100,000 (ICD10 I00-I09, I11, I13, I20-I51) Age-adjusted 13,597 288.9 274.0 Yes 259.4 Yes 4th N/A N/A Premature death (ages 35-64) 1,217 73.0 91.2 Yes 87.3 Yes 1st N/A N/A Pretransport mortality 5,308 132.1 107.0 Yes 133.0 No 3rd N/A N/A Hospitalization rates per 10,000 (ICD9 390-398, 402, 404-429) Crude 32,749 81.5 70.9 Yes 76.7 Yes 3rd N/A N/A Hospitalization rates per 10,000 (ICD9 390-398, 402, 404-429) Age-adjusted 32,749 70.1 68.9 Yes 70.7 No 2nd N/A N/A CORONARY HEART DISEASE Mortality rates per 100,000 (ICD10 I11, I20-I25) Crude 12,104 301.3 251.8 Yes 233.8 Yes 4th N/A N/A Age-adjusted 12,104 256.9 239.4 Yes 209.6 Yes 4th 166 No Premature death (ages 35-64) 1,070 64.2 81.9 Yes 70.3 Yes 1st N/A N/A Pretransport mortality 4,948 123.1 95.5 Yes 110.9 Yes 3rd N/A N/A Hospitalization rates per 10,000 (ICD9 402, 410-414, 429) Crude 32,749 81.5 70.9 Yes 76.7 Yes 3rd N/A N/A Hospitalization rates per 10,000 (ICD9 402, 410-414, 429) Age-adjusted 32,749 70.1 68.9 Yes 70.7 No 2nd N/A N/A CEREBROVASCULAR DISEASE (STROKE) Mortality rates per 100,000 (ICD10 I60-I69) Crude 1,384 34.4 40.4 Yes 52.2 Yes 1st N/A N/A Mortality rates per 100,000 (ICD10 I60-I69) Age-adjusted 1,384 29.3 38.4 Yes 46.6 Yes 1st 48 Yes Hospitalization rates per 10,000 (ICD9 430-438) Crude 14,126 35.2 30.4 Yes 32.1 Yes 4th N/A N/A Hospitalization rates per 10,000 (ICD9 430-438) Age-adjusted 14,126 30.1 29.5 Yes 29.3 Yes 4th N/A N/A Upsta te CI # ± 0.5 2nd N/A N/A - Behavior/Risk Indicator (2003) - County Rate % of adults with diagnosis of heart attack, stroke, or angina 8.0 % of adults with cholesterol checked in the last 5 years . % of adults ever told they have high blood pressure 22.3 CI # ± 2.4 ± 3.8 NYS Rate CI # 6.9 ± 0.5 7.6 76.5 ± 1.5 N/A N/A N/A 80 No 25.3 ± 1.3 N/A N/A 4th 16 No *: Fewer than 20 events in the numerator; therefore rate is unstable, s: Total suppressed for confidentiality, #: 95% confidence interval for BRFSS/Expanded BRFSS indicators Definition: Mortality rate is the number of deaths per 100,000 population. Hospitalization rate is the number of hospitalizations per 10,000 population. The standard population used for age adjustment was the 2000 US population. (BRFSS) % of respondents who reported they had been told by a health professional they had ever had a heart attack, stroke or angina in their lifetime. % of respondents who reported they had their cholesterol checked in the last 5 years. % of respondents who reported they had been told by a health professional they had high blood pressure. Source: New York State Department of Health 106 Exhibit 7CHAI1 8 HIV/AIDS AND SEXUALLY TRANSMITTED DISEASES NASSAU COUNTY 2000-2002 Indicator 3 Year Total County Rate NYS Rate Sig.Dif. NYS Rate exc NYC Sig.Dif. Quartile HP2010 Goal HP2010 Goal Met? HIV/AIDS AIDS case rate per 100,000 403 10.0 31.3 Yes 9.6 No 3rd N/A N/A AIDS mortality rate per 100,000 131 3.3 11.1 Yes 3.1 No 3rd N/A N/A AIDS mortality rate age-adjusted 131 3.1 11.0 No 3.1 No 3rd N/A N/A 43 0.9 3.4 Yes 1.2 Yes 3rd N/A N/A HIV positive newborns rate per 1,000 tested (1999-2001) SEXUALLY TRANSMITTED DISEASES Early Syphillis rate per 100,000 25 0.006 0.047 Yes 0.004 No 4th N/A N/A 1,391 0.3 1.1 Yes 0.8 Yes 3rd N/A N/A 371 1.5 4.5 Yes 3.5 Yes 3rd N/A N/A -All Ages 640 0.3 0.7 Yes 0.5 Yes 2nd N/A N/A -15-19 years 144 1.1 2.1 Yes 1.6 Yes 3rd N/A N/A -20-24 years 225 2.0 3.2 Yes 2.8 Yes 3rd N/A N/A 1,935 0.9 2.7 Yes 1.6 Yes 1st N/A N/A -15-19 years 692 5.7 15.5 Yes 10.3 Yes 1st N/A N/A -20-24 years 718 7.1 14.3 Yes 9.5 Yes 2nd N/A N/A 415 5.2 7.2 Yes 5.3 No 3rd N/A N/A Gonorrhea rate per 1,000 -All Ages - 15-19 years Chlamydia rate per 1,000 Males Chlamydia rate per 1,000 Females -All Ages Pevlic inflammatory disease (PID) hospitalization rate per 10,000 women ages 15-44 years *: Fewer than 20 events in the numerator; therefore rate is unstable, s: Total suppressed for confidentiality Definition: AIDS Mortality: Information on deaths is extracted from death certificates. Each death receives an ICD-10 code indicating the primary cause of death. The codes for AIDS are ICD-10 codes: B20-B24. The mortality rates are per 100,000 population. Both crude and adjusted rates are presented. The standard population used for adjustment was the 2000 US population. AIDS Case Rate: Information on AIDS cases comes from the NYS AIDS Case Surveillance Registry. AID case rates are presented as rates per 100,000 population. ** Newborn HIV Seropositive Rate: The New York State Department of Health tests specimens from the Newborn Screening Program for HIV antibodies. The seropositive rate is the number of positive results per 1,000 tested. The presence of HIV antibodies in newborns indicates infection of the mother and not necessarily infection of the infant. Syphilis, Gonorrhea and Chlamydia: Early Syphilis includes any of the first three stages of syphilis (primary, secondary or latent of less than 1 year duration). Rates for syphilis are rates per 100,000 population. Gonorrhea and chlamydia are rates per 1,000 population in the particular age and sex grouping. The number of hospitalizations with a primary diagnosis of Pelvic Inflamatory Disease (PID) per 10,000 women ages 15-44 years using the following ICD-9 codes: 098.10, 098.16, 098.17, 098.30, 098.36-098.37, 098.39, 098.86, 614.0-614.5, 614.7- 614.9, 615.0, 615.4, 615.9. Data notes: (See previous) ** The standard population used for age adjustment was the 2000 US population. Source: New York State Department of Health 107 Exhibit 7CHAI 9 INFECTIOUS DISEASES AND IMMUNIZATION NASSAU COUNTY 2000-2002 Indicator Pneumonia/flu hospitalizations in adults 65+ years per 10,000 (ICD9 480-487) 3 Year Total County Rate NYS Rate Sig.Dif. NYS HP2010 Sig.Dif. Quartile Rate Goal exc NYC HP2010 Goal Met? 11,168 184.6 184.6 No 188.7 Yes 2nd N/A N/A Measles incidence per 100,000 s 0.0* 0.1 No 0.0 No 2nd 0.0 Yes Rubella incidence per 100,000 s 0.0* 0.0 No 0.0 No 2nd 0.0 Yes Pertussis incidence per 100,000 25 0.6 2.0 Yes 3.0 Yes 1st N/A N/A H. Influenza incidence per 100,000 34 0.8 0.9 No 1.0 No 2nd 0.0 No Hepatitis A incidence per 100,000 149 3.7 4.1 No 2.4 Yes 4th 4.5 Yes Hepatitis B incidence per 100,000 61 1.5 N/A N/A 1.3 No 3rd N/A N/A 229 5.7 8.5 Yes 3.6 Yes 4th 1.0 No 40 1.0 1.2 No 2.0 Yes 2nd N/A N/A Salmonella incidence per 100,000 605 15.1 14.5 No 13.0 Yes 3rd N/A N/A Shigella incidence per 100,000 567 14.1 6.3 Yes 5.2 Yes 4th N/A N/A Lyme disease incidence per 100,000 216 5.4 25.0 Yes 41.3 Yes 3rd 9.7 Yes CI # Upstate CI # Tuberculosis incidence per 100,000 E. Coli incidence per 100,000 County Rate CI # % of adults 65+ years with flu shot in last year 72.3 ± 8.7 68.0 ± 64.2 N/A N/A 3rd 90.0 No % of adults 65+ years that ever received pneumonia shot 72.1 ± 8.6 61.7 ± 58.3 N/A N/A 3rd N/A N/A - Behavior/Risk Indicator (2003) - NYS Rate *: Fewer than 20 events in the numerator; therefore rate is unstable, s: Total suppressed for confidentiality, #: 95% confidence interval for BRFSS/Expanded BRFSS indicators Definitions: The number of hospitalizations for pneumonia and flu among persons ages 65 or older per 10,000 population in this age group. The ICD-9 codes included are: 480-487. Rates are the number of reported cases of a disease per 100,000 population.. Tuberculosis rates exclude prison inmates. The percent of respondents age 65 or older who indicated they had had a flu vaccination in the past 12 months. The percent of respondents age 65 or older who indicated they had a pneumococcal pneumonia vaccination in their lifetime. Data notes: (See previous) Source: New York State Department of Health 108 Exhibit 7CHAI 10 INJURY MORTALITY AND MORBIDITY NASSAU COUNTY 2000-2002 NYS Rate exc NYC HP Sig.Dif. Quartile 2010 Goal HP 2010 Goal Met? 3 Year Total County Rate NYS Rate Suicide Mortality Rate per 100,000-Crude 213 5.3 6.7 Yes 7.6 Yes 1st N/A N/A Suicide Mortality Rate per 100,000- Age-Adjusted 213 5.2 6.6 Yes 7.4 Yes 1st N/A N/A Suicide Mortality Rate per 100,000-Ages 15-19 years 11 4.4* 5.5 No 6.6 No 2nd N/A N/A -Crude 1,644 4.1 4.4 Yes 5.0 Yes 1st N/A N/A - Age-Adjusted 1,644 42.9 44.2 No 50.3 Yes 2nd N/A N/A 252 10.1 9.8 No 10.8 No 2nd N/A N/A Homicide Mortality Rate per 100,000-Crude 101 2.5 5.1 Yes 2.9 No 3rd N/A N/A Homicide Mortality Rate per 100,000-Age-Adjusted 101 2.7 5.1 Yes 3.0 No 3rd 3.0 Yes Assault Hospitalization Rate per 10,000-Crude 762 1.9 3.7 Yes 1.9 No 4th N/A N/A Assault Hospitalization Rate per 10,000-Age-Adjusted 762 20.8 37.2 Yes 19.2 Yes 4th N/A N/A Unintentional Injury Mortality Rate per 100,000-Crude 922 22.9 21.7 No 26.4 Yes 1st N/A N/A Unintentional Injury Mortality Rate per 100,000-Age-Adj. 922 21.8 21.2 No 25.4 Yes 1st N/A N/A -Crude 24,172 60.2 55.2 Yes 58.3 Yes 3rd N/A N/A - Age-Adjusted 24,172 552.2 539.6 Yes 550.3 No 2nd N/A N/A 1,006 18.9 23.7 Yes 18.9 No 3rd N/A N/A - 10-14 years 535 18.8 21.3 Yes 19.2 No 2nd N/A N/A - 15-24 years 1,468 31.8 27.9 Yes 28.3 Yes 3rd N/A N/A - 25-64 years 7,604 35.6 36.7 Yes 36.1 No 2nd N/A N/A 13,559 224.1 210.9 Yes 230.0 Yes 2nd N/A N/A Motor Vehicle Mortality Rate per 100,000-Crude 358 8.9 8.4 No 10.7 Yes 2nd N/A N/A Motor Vehicle Mortality Rate per 100,000-Age-Adjusted 358 8.8 8.3 No 10.6 Yes 2nd 9.2 Yes -Crude 564 14.0 13.3 No 15.8 Yes 2nd N/A N/A - Age-Adjusted 564 13.1 12.9 No 14.9 Yes 2nd 20.8 Yes -Crude 4,195 10.4 7.9 Yes 8.2 Yes 4th N/A N/A - Age-Adjusted 4,195 103.4 78.2 Yes 80.1 Yes 4th N/A N/A 8 0.4* 0.6 No 0.9 No 2nd N/A N/A 1,982 4.9 4.9 No 7.0 Yes 1st N/A N/A Indicator Sig.Dif. Self-Inflicted Injury Hospitalization Rate per 10,000 -Ages 15-19 years Unintentional Injury Hospitalization Rate per 10,000 - <10 years - 65+ years Non-Motor Vehicle Mortality Rate per 100,000 Traumatic Brain Injury Hospitalization Rate per 10,000 Work Related Injury Mortality Rate per 100,000 (Crude) Alcohol Related Motor Vehicle Injuries and Deaths per 100,000 *: Fewer than 20 events in the numerator; therefore rate is unstable, s: Total suppressed for confidentiality Data notes: (See previous) Source: New York State Department of Health 109 Exhibit 7CHAI 11 MATERNAL AND INFANT HEALTH NASSAU COUNTY 2000-2002 Indicator 3 Year County Total Rate NYS Rate NYS Rate Sig.Dif. exc NYC HP Sig.Dif. Quartile 2010 Goal HP 2010 Goal Met? % of births to women 25+ years w/out H.S. education 2,134 5.0 8.6 Yes 4.9 No 3rd N/A N/A % births to out of wedlock mothers 9,213 18.6 36.6 Yes 28.6 Yes 1st N/A N/A 19,306 39.0 41.5 Yes 39.3 No 3rd N/A N/A 2,394 4.8 3.7 Yes 3.9 Yes 4th N/A N/A 41,545 85.3 73.1 Yes 77.6 Yes 4th 90 No 1,200 2.5 6.2 Yes 5.0 Yes 1st N/A N/A % adequate prenatal care (Kotelchuck) 35,755 74.5 62.1 Yes 68.2 Yes 2nd 90 No % Caesarian (Cesarean) section 15,087 30.5 26.1 Yes 27.2 Yes 4th N/A N/A 6,104 12.3 9.8 Yes 11.0 Yes 4th N/A N/A - Infant (<1 year) 260 5.3 6.0 Yes 6.1 Yes 2nd 4.5 No - Neonatal (<28 days) 189 3.8 4.2 No 4.3 No 2nd 2.9 No 71 1.4 1.8 No 1.7 No 2nd 1.5 Yes - Fetal death (>20 weeks gest) 232 4.4 7.2 Yes 5.4 Yes 1st 4.1 No - Perinatal (20 wks gest - 28 days of life) 421 8.0 11.2 Yes 9.6 Yes 1st N/A N/A - Perinatal (28 wks gest - 7 days of life) 275 5.3 6.3 Yes 6.1 Yes 2nd 4.5 No 5 10.1* 16.3 No 7.2 No 4th 3.3 No % low birthweight (<2.5 Kg) 3,748 7.6 7.8 No 7.3 Yes 3rd 5 No % low birthweight singleton births 2,459 5.0 5.8 Yes 5.1 No 2nd N/A N/A 799 1.6 2.0 Yes 1.9 Yes 1st 1 No % Premature Births - 32 - 36 weeks gestation 4,603 9.4 9.5 No 9.0 Yes 4th 6.4 No % Premature Births - <37 weeks gestation 5,402 11.0 11.5 Yes 10.9 No 3rd 7.6 No % births w/5 minute APGAR <6 4,270 8.6 12.0 Yes 15.8 Yes 1st N/A N/A % of births w/complications during labor & delivery 32,345 65.4 57.7 Yes 52.4 Yes 4th 20 No Neonatal drug related discharge rate per 10,000 births 119 24.0 54.6 Yes 47.7 Yes 3rd N/A N/A % first births % of births that were multiple births % births w/early prenatal care % births w/late or no prenatal care % Repeat Caesarian (Cesarean) section Mortality Rates (per 1,000 births) - Postneonatal (1 month to 1 year) Maternal mortality per 100,000 births % Premature Births - <32 weeks gestation *: Fewer than 20 events in the numerator; therefore rate is unstable, s: Total suppressed for confidentiality Definition: The number of out of wedlock births is imputed by examining statistical information on the certificate of live birth. Also included in the calculation of out of wedlock births is any birth with a paternity affidavit filed. Only the first of multiple births is considered a first time birth The percent of total births to women who began prenatal care within the first three months of pregnancy (first trimester). The percent of total births to women who began prenatal care within the last 3 months of pregnancy (3rd trimester) or not at all. The percentage is based on the Kotelchuk Index. Births to women who began care in the first trimester and have completed at least 80% of the expected prenatal visits are considered to have had early and adequate care. * Data notes: *Kotelchuk Index: The Kotelchuk Index is an adequacy of prenatal care index that takes into account the number of prenatal care visits received and number of expected by age of gestation at delivery, and incorporates a category that distinguishes women who have had more prenatal visits than would be expected (Adequacy Plus Category). Source: New York State Department of Health 110 Exhibit 7CHAI 12 RESPIRATORY DISEASES NASSAU COUNTY 2000-2002 Indicator 3 Year Total County Rate NYS rate Sig. Dif. NYS Rate exc NYC Sig. Dif. HP Quartile 2010 Goal HP 2010 Goal Met? CLRD (COPD) mortality rate per 100,000 Crude 1,313 32.7 34.4 No 46.1 Yes 1st N/A N/A Age-Adjusted 1,313 27.6 33.1 Yes 41.6 Yes 1st N/A N/A Crude 6,255 15.6 17.4 Yes 19.5 Yes 1st N/A N/A Age-Adjusted 6,255 13.3 16.9 Yes 18.0 Yes 1st N/A N/A Total Population - Crude 5,366 13.4 20.5 Yes 11.5 Yes 4th N/A N/A Total Population - Age-adjusted 5,366 13.3 20.8 Yes 11.5 Yes 4th N/A N/A 0-4 years 1,202 47.9 66.0 Yes 35.7 Yes 4th 25.0 No 0-17 years 2,008 20.6 31.8 Yes 15.8 Yes 4th 17.3 No 5-64 years 3,129 9.9 16.3 Yes 9.0 Yes 4th 7.7 No 65+ years 1,035 17.1 24.7 Yes 15.0 Yes 3rd 11.0 No Asthma mortality rate per 100,000 Crude 37 9.2 17.7 Yes 11.4 No 2nd N/A N/A Asthma mortality rate per 100,000 Age-Adjusted 37 8.2 17.3 Yes 10.7 No 2nd N/A N/A CI # Upstate CI # ± 0.6 7.9 ± 0.6 1st N/A N/A COPD (CLRD) hospitalization rate per 10,000 Asthma Hospitalization rates per 10,000 - Behavior/Risk Indicator (2003) % of adults with current asthma County Rate 6.3 CI # NYS Rate ± 2.3 7.9 *: Fewer than 20 events in the numerator; therefore rate is unstable, s: Total suppressed for confidentiality, #: 95% confidence interval for BRFSS/Expanded BRFSS indicators Definitions: The prevalence of currently diagnosed asthma was based on answers to two questions: 1) Did a health professional tell you that you had asthma? and 2) Do you still have asthma? Mortality: Data are collected from death certificates. All deaths receive an ICD-10 code indicating the primary reason for the death. The ICD-10 codes used for the rates in this section are as follows: asthma : codes J45-J46, Chronic Lower Respiratory Disease (CLRD): codes J40-J47. The mortality rates are rates per 100,000 persons. ** The number of hospitalization per 10,000 with a primary diagnosis, using the following ICD-9 codes: Asthma: code 493; Chronic Obstructive Pulmonary Disease (COPD): codes 490-494,496. ** Data notes: (See previous) ** The standard population used for age adjustment was the 2000 US population. Source: New York State Department of Health 111 APPENDIX 8 – NEW YORK STATE DEPARTMENT OF HEALTH DATA RESOURCES Public health data sets relating to counties or specific health issues can be accessed through the NYSDOH website: http://www.health.state.ny.us/nysdoh/chac/nysdoh_program_data.htm AIDS/HIV AIDS Surveillance Quarterly Updates and AIDS in New York State Reports. Has data at the state and regional levels Behavioral Risk Factor Surveillance System (BRFSS) Reports State-level adult behavior risk survey finding relating to physical activity, oral cancer risks, fetal alcohol syndrome, skin cancer, diabetes, among others. Communicable disease statistics Reported cases, and rates of communicable diseases by county and in New York State. Community Health Data Set Series of tables, maps and graphs containing health statistics for 18 health-related data categories organized by county of residence. Most of the indicators are presented via a 3-year table (T), table+10year trend plots (T+TR, to access a trend chart, click on the highlighted county name in the 3-year table), bar chart/map (M), and trend graph (G). Tables show, where possible, the last 3 years of information for County, Region, and New York State. Maps highlight the top 5 and bottom 5 counties for each indicator. County Health Indicator Profile Selected county-level indicators relating to socio-demographic, perinatal health, mortality, hospitalizations, and disease morbidity. Cancer Cancer Incidence by zip-code, cancer booklets, and county-level maps Health care utilization - Managed Care Reports - Medicaid Statistics Data on quality of managed care plans in New York State. Medicaid reports/profiles by demographic group and by county. Hospital discharge data/ SPARCS annual report Each SPARCS Annual Report contains a narrative, appendices, and standardized statistical tables. The narrative describes the background of SPARCS, the data sources for the report, and the data displayed. The statistical tables include discharges, patient days, and average length of stay data aggregated by age, sex, expected primary source of reimbursement, service category, disposition of patient, county of residence/hospitalization, discharge rate, federal DRG, average total charge of stay, principal diagnostic categories, surgical procedure categories, federal MDC, and total length of stay Lead County-level and selected zip-code level data on incidence of elevated blood lead levels in children under six years. Vital Statistics 1997, 1998 and 1999 data: state and county-level data relating to population, live births, pregnancies, and fetal deaths, mortality. Profiles for cities and villages with populations greater than15,000. 112 APPENDIX 9 - NEW YORK STATE PARTNER DATA RESOURCES Kids Well-being Indicators' Clearinghouse (KWIK) User-friendly, and queriable; county-specific, children's health, education and well-being indicators utilized by New York States' health and human services agencies. The indicators are based on the Council on Children and Families Touchstones/KidsCount Data Book. New York State Chartbook of Mental Health Information: The 2000 edition of the chartbook is a comprehensive look at the system; it includes demographics, client characteristics, service work-load, expenditures, and revenues. NYS Council on Children and Families Touchstones/KIDS Count Touchstones is a tool to help guide local efforts on improving outcomes for children. The Touchstone Databook is a compilation of children's wellbeing indicator data bsed on the six areas in which New York State aims to improve the lives of its children (i.e. economic security, physical and emotional health, education, citizenship, family and community). Data was collected as part of the Annie E. Casey's Kids Count project. The data will be accessible through the Kids's Well-being Indicator Clearinghouse (KWIC). New York State Data Center Provides population estimates by county, town, village, and city; county migration data, state and county economic census data; and county business pattern data. It also provides links to other data sources. New York State Department of Labor Has a wealth of state, county, region, and MSA labor statistics, including employment and unemployment statistics, employment by sector, recent labor market trends, earnings, occupational projections, and a directory of labor market information. NYS Department of Education The school report cards and statistical reports provide useful data by school and school district, including performance and accountability measures (regent test score results), enrollment, demographics (e.g. race/ethnicity), drop-out and attendance rates, and students enrolled in school lunch program. NYS Office of Real Property Services Municipal Profiles Provides school, property sales and tax information by county and municipality. PRISMS: Prevention Risk Indicator Services Monitoring System Is a data warehouse from the New York State Office of Alcohol and Substance Abuse Services (OASAS) data warehouse for communitylevel information for alcohol and substance abuse services. Has information on 62 risk indicators and ten consequences indicators is provided in tables organized under three general domains for each county: community risk, youth risk and early consequences of alcohol and substance Abuse (ASA).Risk indicators are individual measures of a risk factor that are combined into risk constructs. Consequences indicators are measures of problems youth are experiencing as a result of ASA use. 113 APPENDIX 10 - NATIONAL PUBLIC HEALTH DATA RESOURCES American FactFinder Accesses data from the Censuses of Population and Housing, the American Community Survey, and the Economic Census. Users can search Census STF databases, with metadata description, and format the results to create customized tables (or download to spreadsheets), construct reference maps to show boundaries and features for geographic entities, and produce quick thematic maps to reveal geographic patterns in statistical data. Anne E. Casey Foundation Has links to KIDS COUNT, a project of the Annie E. Casey Foundation. This is a national and state-by-state effort to track the status of children in the United States. Behavioral Risk Factor Surveillance System (BRFSS):State-level data on adult substance use, tobacco use, diet and other preventive health practices and risk behaviors that are linked to chronic diseases, injuries and preventable infectious diseases. County-level synthetic data estimates for selected risk indicators may be accessed by local health departments. Child Health USA 2000 Amasses secondary data on health status and service needs of children. Report provides over 50 health status indicators and includes information on infants, children, and adolescents, health service utilization, state-specific and local data, as well as information on the nation's progress towards meeting the Healthy People objectives. Child Trends Has national trends and research data on over 70 key indicators of child and youth well-being including demographic, health, social and emotional development, income-assets and work, education and skills, and family and community. Children's Defense Fund Has data and information related to child poverty, education, and child care costs. Federal Interagency Council on Statistical Policy More than 70 agencies in the U.S. Federal Government produce statistics of interest to the public. This site provides easy access to the full range of county- and state-level statistics and information produced by these U.S. government agencies for public use. Among the postings are county level data on immigration, crime, and poverty estimates. Healthy People 2000 The Healthy People 2000 main web site describes the overall agenda for achievement of national health objectives, priority areas, progress to date, lead agencies, data sources, publications, and more. Healthy People 2010 Healthy People 2010 released in January, 2000 presents 467 objectives to improve the health of Americans by the year 2010. It is a statement of national health objectives designed to identify the most significant preventable threats to health and to establish national goals to reduce these threats. Background information and the entire HP 2010 document are available online. Kids Count Has data and information on child well-being indicators. Also links to state Kids Count Data publications. 114 National Survey of America's Families Provides a comprehensive look at the well-being of adults and children and reveals sometimes striking differences among the 13 states studied in depth. The survey pays particular attention to low-income families, and reporting on important aspects about their lives and how they differ from the lives of children and adults in families with higher incomes. It is a part of New Federalism, a multi-year research project of the Urban Institute. The survey is representative of the non-institutionalized, civilian population of persons under age 65 in the nation as a whole and in 13 states, including Massachusetts and New York. Site visitors can retrieve and download survey results. Peristats PeriStats is an interactive perinatal data resource developed by the March of Dimes that provides maternal, infant and child health-related data with state-level and some county-level indicators. State Health Facts Online A resource developed by Kaiser Family Foundation contains the latest state-level data on demographics, health, and health policy, including health coverage, access, financing, and state legislation. United Way State of Caring Index Measures the health and well-being at the state and national levels using 32 social and economic indicators in six key areas: Economic and financial well-being; Education; Health; Voluntarism/Charity/Civic Engagement; Safety; Natural Environment and Other factors. Youth Risk Behavior Surveillance System (YRBS) State-level and New York City data by gender in six categories of health-risk behaviors. These include: unintentional and intentional injuries; tobacco use alcohol and other drug use; sexual behavior; unhealthy dietary behavior and physical activity. 115 APPENDIX 11 – GLOSSARY Access to health care “The timely use of personal health services to achieve the best possible outcomes.” It can include, but is not limited to, availability of information, care, public or private insurance coverage, transportation, culturally and linguistically competent care, and other factors that affect personal and cultural decisions related to seeking health care services. (IOM) Abortion Ratio Annual number of induced abortions per 1,000 live births occurring during the year. (NYSDOH) Age The number of complete years an individual has lived. The age classification is based on the age of the person at his or her last birthday. (US Census) Age-Adjusted Death Rate Death rate of a group calculated as a weighted average of the age specific death rate of the same group. The age distribution of a population for a given period of time is called the standard population. In this report the standard population is the census count of the United States in 2000. . (US Census) AIDS Case Rate (Other) Cumulative number of AIDS cases from the AIDS Case Registry for other than (MSM) men who have sex with men (intravenous drug use cases, heterosexual contact cases) aged 15-54 per 100,000 population aged 15-54. (NYSDOH AIDS Institute Community Need Index) Asian A person having origins in any of the original peoples of the Far East, Southeast Asia, or the Indian subcontinent, for example, Cambodia, China, India, Japan, Korea, Malaysia, Pakistan, the Philippine Islands, Thailand, and Vietnam. (US Census 2000) Baby Boom People born during 1946 to 1964 (post-WWII) are referred to as "baby boomers" or the baby-boom generation. (US Census) Birth Rate The average annual number of births during a year per 1,000 population. Also know as the crude birth rate. (NYSDOH) Black (or African American) A person having origins in any of the black racial groups of Africa. Over time, the terminology used for this race category has included Black, Negro, and African American. It includes written entries such as African American, Afro American, Kenyan, Nigerian, Haitian or Caribbean American. (US Census 2000) Cocaine Discharge Rate Average of three years cocaine-related hospital discharges for persons aged 15-54 per 100,000 population aged 15-54. (NYSDOH AIDS Institute Community Need Index) Crude Birth Rate See Birth Rate Family A group of two or more people who reside together and who are related by birth, marriage, or adoption. (US Census) Family Household A family household consists of a householder and one or more people living together in the same household who are related to the householder by birth, marriage, or adoption. All people in a household who are related to the householder are regarded as members of his or her family. people not related to the householder are not included as part of the householder's family in census tabulations. In 1950 and 1960, a household enumerated in the census could contain more than one family. Thus, there were more families than family households. From 1970 to 2000, each family household in the census could contain only one family, resulting in an equal number of families and family households. (US Census) 116 Female Householder, No Husband Present A woman maintaining a family household with no husband of the householder present. (US Census) Fertility Rate Annual number of live births per 1,000 female population, aged 15-44. (NYSDOH) Haemophilus influenzae (Hib) Haemophilus influenzae type b or Hib - A gram-negative, rod-shaped bacterium of the genus Haemophilus that occurs in the human respiratory tract and causes acute respiratory infections, acute conjunctivitis, and purulent meningitis; type b is the most common pathogenic form of the bacterium. It is very serious and usually strikes children under 5 years old. (CDC) Head of Household See Householder Health Insurance Coverage A person is considered covered by health insurance at some time during the year if he or she was covered by at least one of the following types of coverages: 1. Employment/union 2. Privately purchased (not related to employment) 3. Medicare 4. Medicaid 5. Military health care (military, CHAMPUS, CHAMPVA, VA, Indian Health Services) 6. Someone outside the household 7. Other An individual can have more than one type of coverage during the year. (US Census) Hispanic or Latino Origin People who identify with the terms Hispanic or Latino are those who classify themselves in one of the specific Hispanic or Latino categories listed on the decennial census questionnaire-"Mexican, Mexican-Am, Chicano, "Puerto Rican," or "Cuban"-as well as those who indicate that they are "other Spanish Hispanic, or Latino." Origin can be viewed as the heritage, nationality group, lineage, or country of birth of the person or the person's parents or ancestors before their arrival in the united States. People who identify their origin as Spanish, Hispanic, or Latino may be of any race. (US Census 2000) HIV Discharge Rate (female) Average of three years HIV-related hospital discharges for females aged 1554 per 100,000 female population aged 15-54. (NYSDOH AIDS Institute Community Need Index) HIV Discharge Rate (male) Average of three years HIV-related hospital discharges for males aged 15-54 per 100,000 male population aged 15-54. (NYSDOH AIDS Institute Community Need Index) Household One person or a group of people living in a housing unit. (US Census) Housing Unit A housing unit is a house, an apartment, a mobile home, a group of rooms, or a single room that is occupied or intended for occupancy, as separate living quarters. Separate living quarters are those in which the occupant(s) live separately from any other people in the building and which have direct access from outside the building or though a common hall. (US Census) Infant Mortality Rate The number of deaths to infants less than 1 year of age occurring during the year per 1,000 births. (NYSDOH) LHD Local health department (Nassau County Department of Health) 117 Life Expectancy at Birth The average number of years a hypothetical group of people born in a specified year would live if they experienced over their lifetime the mortality rates at each year of age that occurred in the specified year (e.g., 1900 or 2000). (US Census) Low Birthweight (LBW) Live births with birthweight less than 2,500 grams. Median Age The median divides the age distribution into two equal parts, one-half of the population falling below the median age and one-half above the median. (US Census) Morbidity The prevalence of a disease in a population. Mortality rate The ratio of deaths in an area to the population of that area, can be crude or age-adjusted. MSM Case Rate Cumulative number of AIDS cases (for a specific period of time) for men who have sex with men aged 15-54 per 100,000 male population aged 15-54. (NYSDOH AIDS Institute Community Need Index) Newborn Seroprevalence Since 1987, all newborns in NYS have been tested anonymously for the presence of HIV antibody. HIV antibody in newborns indicates that the mothers of these babies are infected. (NYSDOH AIDS Institute Community Need Index) National Public Health Performance Standards Program. NPHPSP Opioid Discharges Average of three years opioid-related hospital discharges for persons aged 15-54 per 100,000 population aged 15-54. (NYSDOH AIDS Institute Community Need Index) Per Capita Income The per capita income for an area is defined as the total personal income in an area, divided by the number of people in that area. The Census Bureau derived per capita income by dividing the total income of a particular group by the total population in that group (excluding patients or inmates in institutional quarters). Pertussis Also known as whooping cough, is a highly contagious disease that is one of the leading causes of vaccine-preventable deaths. There are 30-50 million cases per year, and about 300,000 deaths per year. Virtually all deaths occur in children under one year of age. 90% of all cases occur in developing countries. It is caused by certain species of the bacterium Bordetella - usually B. pertussis, but some cases are caused by B. parapertussis. Pregnancy Rate Annual number of pregnancies per 1,000 female population aged 15-44. (NYSDOH) Prevention An active process that promotes the personal, physical and social well-being of individuals and families to reinforce positive health behaviors and lifestyles that minimize morbidity and maximize the overall quality of life. Primary care can be viewed as a form of prevention as its proper use can result in fewer hospitalizations for conditions such as asthma, diabetes, chronic obstructive pulmonary disease, and congestive heart failure, which are affected by the level of care given on an outpatient basis. (CDC) Population Projections A calculation of population size derived for future dates using assumptions about future trends and data from population censuses, administrative records, sample surveys, and/or other sources. (US Census) 118 Race As per the U.S. Census, prior to 1980, race was determined either solely by the observation of the enumerator or by a combination of enumerator observation and self-identification. These categories reflect social usage and should not be interpreted as being scientific or anthropological in nature. Furthermore, the race categories include both racial and national-origin groups. Rubella A mild contagious eruptive disease caused by a virus and capable of producing congenital defects in infants born to mothers infected during the first three months of pregnancy. Also called German measles. (CDC) Sexually Transmitted Disease (STD) Syphilis, gonorrhea or chlamydia. Standard Population The age distribution of a population for a given period of time Teenage Birth Rate Annual number of live births to women aged 15-19 per 1,000 female population aged 15-19. Teen Pregnancy Rate Annual number of pregnancies to women aged 15-19 per 1,000 female population aged 15-19. A person having origins in any of the original peoples of Europe, the Middle East, or North Africa. It includes people who indicate their race as White or reports entries such as Irish, German, Italian, Lebanese, Near Easterner, Arab or Polish. Special Supplemental Program for WOMEN, INFANTS and CHILDREN. White WIC Years of Life Lost (YLLs) A measure of premature mortality. The measure subtracts the person’s age at death from the life expectancy for someone that age in a standard population. The younger the age at death, the greater the Years of Life Lost. Since many younger deaths could be prevented or postponed this measure has implications for prevention efforts. 119 APPENDIX 12 - COMMENTS AND SUGGESTIONS FORM Periodic updates are made to the Community Health Assessment. Your comments and suggestions are invited. Proposed changes should be submitted to: Carolyn Ashe Management Analyst Nassau County Department of Health 240 Old Country Road, Room 513 Mineola, NY 11501 Phone: (516) 571-3344 Fax: (516) 571-1666 Email: [email protected] Referenced section #, section part, name and page number: _____________________________________________ A description of your proposed change: ______________________________________________________________________________________________ ______________________________________________________________________________________________ ______________________________________________________________________________________________ ______________________________________________________________________________________________ ______________________________________________________________________________________________ Rationale (relate experiences, research, data, etc. that are the basis for your comment or suggestion). ______________________________________________________________________________________________ ______________________________________________________________________________________________ ______________________________________________________________________________________________ ______________________________________________________________________________________________ ______________________________________________________________________________________________ ______________________________________________________________________________________________ ______________________________________________________________________________________________ Your name (optional) Position (optional) ______________________________________________________________________________________________ Organization (optional) Mailing address (optional) ______________________________________________________________________________________________ Phone (optional) Fax (optional) ______________________________________________________________________________________________ Date Email (optional) Attach additional pages if necessary. 120 Disclaimer • While the Nassau County Department of Health makes every effort to insure that information included here is accurate and reliable, it does not guarantee or warrant that the information that is published here or on the web site is complete, accurate or up-to-date. The Nassau County Department of Health assumes no responsibility for the use or application of any posted material. This publication and/or web site is intended solely for the purpose of electronically providing the public with general health-related information and convenient access to data resources. The Nassau County Department of Health assumes no responsibility for any error, omissions or other discrepancies in the electronic and printed versions of documents. • The Nassau County Department of Health cannot provide individual advice or counseling, whether medical, legal, or otherwise. If you are seeking specific advice or counseling, you should contact a licensed practitioner or professional, a social services agency representative, or an organization in your local community. • The Nassau County Department of Health web site links to web sites maintained by other entities. Reasonable precautions are taken to link only to web sites which are appropriate, accurate and maintained by reputable organizations. However, those web pages are not under the Nassau County Department of Health's control and the Nassau County Department of Health is not responsible for the information or opinions expressed in those linked sites. 121 NASSAU COUNTY, NY Albertson 11507 Searington Atlantic Beach 11509 Atlantic Beach Estates Baldwin 11510 Baldwin Harbor Bayville 11709 Bellmore 11710 Bethpage 11714 Carle Place 11514 Cedarhurst 11516 East Meadow 11554 East Norwich 11732 East Rockaway 11518 Bay Park East Williston 11596 Elmont 11003 Farmingdale 11735 Floral Park 11001 Bellerose Terrace, Floral Park Centre, South Floral Park Franklin Square 11010 Freeport 11520 Garden City 11530 Garden City South, Stewart Manor Glen Cove (city) 11542 Glen Head 11545 Brookville, Old Brookville Glenwood Landing 11547 Great Neck 11020,11021, 11023, 11024 Great Neck Estates, Great Neck Garden, Great Neck Plaza, Harbor Hills, Kensington, Kings Point, Lake Success. Russell Gardens, Saddle Rock, Thomaston, University Gardens Greenvale 11548 Hempstead (village) 11550 Hewlett 11557 Hewlett Bay Park, Hewlett Harbor, Hewlett Neck Hicksville 11801 Inwood 11096 Island Park 11558 Barnum Island, Harbor Isle Jericho 11753 Lawrence 11559 Levittown 11756 Locust Valley 11560 Lattingtown Matinecock Long Beach (city) 11561 Lido Beach Lynbrook 11563 Malverne 11565 Manhasset 11030 Flower Hill, Munsey Park, Strathmore, Massapequa 11758 East Massapequa, West Amityville Massapequa Park 11762 Merrick 11566 Mill Neck 11765 Mineola 11501 New Hyde Park 11040 Garden City Park, Herricks Oceanside 11572 Old Bethpage 11804 Old Westbury 11568 Oyster Bay (hamlet) 11771 Centre Island, Cove Neck , Oyster Bay Cove, Plainedge, Upper Brookville Bayville Centre Island Cove Neck Mill Neck Locust Valley Glen Cove Oyster Bay Upper Brookville Sands Point Glen Head Port Washington Manorhaven Sea Cliff Oyster Bay Cove East Norwich Old Brookville Glenwood Landing Syosset Muttontown Kings Point Greenvale Great Neck Roslyn Manhasset Woodbury Brookville Old Westbury Roslyn Heights Jericho Albertson New Cassel Williston Park Carle Place Mineola New Hyde Park Laurel Hollow Westbury Plainview Hicksville Bethpage Old Bethpage Salisbury Levittown Garden City Floral Park Elmont East Meadow Franklin Square Hempstead Uniondale West Hempstead Lakeview Valley Stream Woodmere Hewlett Cedarhurst Inwood Lawrence Atlantic Beach Farmingdale Malverne Rockville Lynbrook Centre East Rockaway Roosevelt Massapequa Wantagh Merrick Bellmore Massapequa Seaford Park Freeport Baldwin Oceanside Island Park Long Beach Lido Beach Selected Communities Plainview 11803 Point Lookout 11569 Port Washington 11050 Baxter Estates, Manorhaven, Port Washington North, Sands Point Rockville Centre 11570 Roosevelt 11575 Roslyn 11576 East Hills,Roslyn Estates, Roslyn Harbor, Roslyn Heights 11577 Sea Cliff 11579 Seaford 11783 Point Lookout Jones Beach Rest of County Syosset 11791 Muttontown, Laurel Hollow, Locust Grove Uniondale 11553 Valley Stream 11580,11581 Wantagh 11793 West Hempstead 11552 Lakeview Westbury 11590 New Cassel, Salisbury Williston Park 11596 Woodbury 11797 Woodmere 11598 Woodsburgh THOMAS R. SUOZZI County Executive NASSAU COUNTY LEGISLATURE KEVAN ABRAHAMS District 1 ROGER H. CORBIN Deputy Presiding Officer District 2 JOHN J. CIOTTI District 3 DENISE FORD District 4 JOSEPH SCANNELL District 5 FRANCIS X. BECKER SR. District 6 JEFFREY W. TOBACK District 7 VINCENT T.MUSCARELLA District 8 RICHARD J. NICOLELLO District 9 LISANNE G. ALTMANN District 10 CRAIG M. JOHNSON District 11 PETER J. SCHMITT Minority Leader District 12 NORMA L. GONSALVES District 13 DAVID MEJIAS District 14 DENNIS DUNNE SR. District 15 JUDITH A. JACOBS Presiding Officer District 16 EDWARD P. MANGANO District 17 DIANE YATAURO District 18 DAVID W. DENENBERG District 19
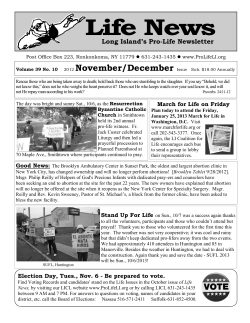

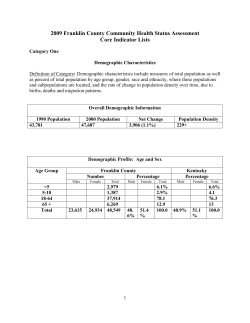


© Copyright 2026