
SEIKO ABUBAKARI - Kwame Nkrumah University of Science
KWAME NKRUMAH UNIVERSITY OF SCIENCE AND TECHNOLOGY, KUMASI COLLEGE OF HEALTH SCIENCES FACULTY OF PHARMACY AND PHARMACEUTICAL SCIENCES DEPARTMENT OF PHARMACEUTICAL CHEMISTRY CHEMICAL STABILITY AND A NOVEL QUININE SYRUP FORMULATION FOR PEDIATRIC DRUG USE By SEIKO ABUBAKARI (BSc. Chemistry Hons) A THESIS SUBMITTED IN PARTIAL FUFILMENT OF THE REQUIREMENT OF THE DEGREE OF MASTER OF PHILOSOPHY IN PHARMACEUTICAL CHEMISTRY AUGUST, 2014 i DECLARATION I, Seiko Abubakari, declare that this experimental work was done at Department of Pharmaceutical Chemistry,KNUST and that any assistance obtained has been duly acknowledged. This work has not been submitted anywhere for the award of any degree. HEAD OF DEPARTMENT SUPERVISOR Signature……………………….. Signature……………………. Date…………………………….. Date………………………… DR. ISAAC AYENSU DR. MRS. ABENA BROBBEY CANDIDATE Signature…………………………… Date………………………………… SEIKO ABUBAKARI i Abstract Malaria is a public health problem worldwide, especially in tropical Africa where it kills around a million of people a year, of which 75% are children under 5 years of age, drug assessment in this group is lower which complicate the choice of appropriate treatment. Quinine is re-emerging as an important drug in the treatment of multiple-drug resistant or severe Plasmodium falciparum malaria. Chemical stabilities of brands of quinine syrup on the market were studied as well as the formulated product. Changes in percentage contents and pH were used as a tool for the study. UV-spectrophotometer was used for the analysis. This was done by preparing different concentrations of pure quinine sulphate in 0.1 M HCl solution and their respective absorbance determined at 250 nm. A calibration curve was plotted and the equation obtained was used for the quantification of quinine sulphate syrups bought from market. Two sets of each brand were analyzed. The analysis was done for a period of one week on each set. Brands A and D passed percentage content of 95 – 105 % on first sets of analysis, however, failed on the second sets. Brand A had a percentage breakdown of 3.76 and D 0.81% with pH changing within a range of 2.50 – 2.94. Brands B and E failed percentage content and had 13.97% and 1.34% percentage breakdown respectively with pH range of 4.78 – 5.69. Brand C also failed percentage content with percentage breakdown of 8.87% and having its pH changing within a range of 2.50 – 2.94. Quantitative solubility of quinine sulphate was established in citric acid, citrate buffer and in water using UV-spectrophotometer at 250 nm. Quinine sulphate had a solubility of ii 20.20 mg/ml in citric acid, 2.20 mg/ml in water and 12.67, 5.00, 0.0563, 0.153 and 0.188 mg/ml respectively in citrate buffer of pH 2, 3, 4, 5 and 6. Quinine sulphate syrup was eventually formulated. The formulation was done in a citrate buffer of pH 2 as the vehicle. This was necessitated by the outcome of the solubility test performed on the salt. The product had a pH of 2.30 with syrup strength of 40 mg of quinine sulphate per 5 ml. Anise water prepared from anise oil was effectively used to mask the taste. The product had a better stability when packaged in amber bottle than in plain bottle. The amber bottled product passed percentage content on the two sets of its analysis with virtually 0% breakdown and had a pH changing within 2.30 – 2.40. Plain bottled product on the other hand, failed percentage content and had a percentage breakdown of 12.73% with pH range of 2.30 – 2.60. Comparatively, the syrup strength of the formulated product of 40 mg/5ml (amber bottled product) stands at advantage over the market products of a reduced toxic effect in case of accidental overdose and again its high stability will also ensure accurate dosage delivery to avoid underdose. Key words: Quinine sulphate, Citric acid, Citrate buffer, UV-spectrophotometer, pH, solubility, chemical stability, plain and amber bottled products. iii DEDICATION I dedicate this work to my dear mother of blessed memory Mrs. Rahmatu Alhassan iv ACKNOWLEDGEMENT 1 would like to thank Almighty Allah for seeing me through this course successfully. My heartfelt gratitude goes to my supervisor; Dr. Mrs. Abena Brobbey for her unflinching support and kindness; her patience and guidance helped me greatly in carrying this work. My appreciation goes to my family, friends and course mates who assisted and supported me in diverse ways. And again to Mr. Francis Osei Boateng of Akoma Pharmaceuticals LTD for his immense contribution towards the success of the work. Finally, I would also like to thank in a special way all the staff and technician of the department especially Mr.Rashid for their assistance and support during my study. v TABLE OF CONTENTS DECLARATION .......................................................................................................... i Abstract ........................................................................................................................ ii DEDICATION............................................................................................................ iv ACKNOWLEDGEMENT ........................................................................................... v TABLE OF CONTENTS ........................................................................................... vi LIST OF FIGURES ............................................................................................................. xi Abbreviations....................................................................................................................... xii CHAPTER ONE .......................................................................................................... 1 1.0.0.0 INTRODUCTION ........................................................................................... 1 1.2.0.0 Justification ...................................................................................................... 6 1.3.0.0 Objectives of the study .................................................................................... 7 CHAPTER TWO ......................................................................................................... 8 2.0.0.0 Literature review.............................................................................................. 8 2.1.0.0 History of Quinine ........................................................................................... 8 2.1.1.0 Chemical structure ......................................................................................... 10 2.1.2.0 Synthetic quinine ........................................................................................... 11 2.1.3.0 Mechanism of action against P. falciparum .................................................. 13 2.1.4.0 Dosing and indication .................................................................................... 13 2.1.5.0 Adverse effects .............................................................................................. 14 2.1.6.0 Non-abortifacient ........................................................................................... 15 2.1.7.0 Disease interactions ....................................................................................... 16 2.1.8.0 Nonmedical uses of quinine; Beverages ........................................................ 16 2.1.9.0 Scientific Research ........................................................................................ 16 2.2.0.0 Malaria ........................................................................................................... 17 2.2.1.0 Antimalarial drugs ......................................................................................... 20 2.2.2.0 Plasmodium resistance to Antimalaria drugs ................................................ 23 2.2.3.0 Treatment of malaria ..................................................................................... 24 2.2.4.0 Prophylaxis of malaria ................................................................................... 26 vi 2.3.0.0 Stability of pharmaceutical products ............................................................. 27 2.3.1.0 Types of stability ........................................................................................... 28 2.3.2.0 Factors affecting drug stability ...................................................................... 29 2.2.2.1 Effect of temperature on drug stability .......................................................... 29 2.3.2.2 Effect of humidity .......................................................................................... 30 2.3.2.3 Effect of oxygen ............................................................................................ 30 2.3.2.4 Effect of light ................................................................................................. 31 2.3.3.0 Factors related to the product ........................................................................ 31 2.3.3.1 The active pharmaceutical ingredient and excipients .................................... 31 2.3.3.2 Manufacturing process .................................................................................. 32 2.3.3.3 Packaging....................................................................................................... 32 2.3.4.0 Forms of drug instability ............................................................................... 32 2.3.4.1 Chemical instability ....................................................................................... 32 2.3.4.2 Microbiological instability ............................................................................ 33 2.3.4.3 Physical instability ......................................................................................... 33 2.3.5.0 Stability testing methods ............................................................................... 34 2.3.5.1 Accelerated stability testing........................................................................... 34 2.3.5.2 Real time stability studies .............................................................................. 34 2.3.6.0 Importance of stability testing ....................................................................... 35 2.4.0.0 Solutions for oral administration ................................................................... 35 2.4.1.0 Advantages and disadvantages of pharmaceutical solutions for oral administration ............................................................................................................ 36 2.4.1.1 Advantages .................................................................................................... 36 2.4.1.2 Disadvantages ................................................................................................ 36 2.4.2.0 Drug solubility ............................................................................................... 37 2.4.3.0 Factors affecting the solubility of therapeutic agents .................................... 38 2.4.4.0 Formulation methods to enhance/optimise the solubility of therapeutic agents ................................................................................................................................... 40 2.4.4.1 Appropriate selection of drug salt ................................................................. 40 2.4.4.2 Optimisation of the pH of the formulation .................................................... 40 2.4.4.3 Use of co-solvents ......................................................................................... 41 vii 2.4.5.0 Excipients used in pharmaceutical solutions for oral administration ............ 42 2.4.5.1 The vehicle .................................................................................................... 42 2.4.5.2 Co-solvents .................................................................................................... 43 2.4.5.3 Buffers ........................................................................................................... 43 2.4.5.4 Sweetening agents ......................................................................................... 44 2.4.5.5 Viscosity-enhancing agents ........................................................................... 44 2.4.5.6 Antioxidants................................................................................................... 46 2.4.5.7 Preservatives .................................................................................................. 47 2.4.5.8 Flavours ......................................................................................................... 47 2.4.5.9 Colours........................................................................................................... 48 2.4.6.0 Types of pharmaceutical solutions ................................................................ 48 2.4.7.0 Oral syrups ..................................................................................................... 49 CHAPTER THREE ................................................................................................... 50 3.0.0.0. Methodology. ................................................................................................ 50 3.1.0.0. Instruments and materials. ............................................................................ 50 3.2.0.0 Samples .......................................................................................................... 50 3.3.0.0 Reagents preparation ..................................................................................... 52 3.3.1.0 Standardization of 0.1 M HClO4 ................................................................... 52 3.3.1.1 Preparation ..................................................................................................... 52 3.3.1.2 Standardization .............................................................................................. 52 3.3.2.0 Preparation of a 0.1 M hydrochloric acid ...................................................... 52 3.3.3.0 Citrate buffer preparation .............................................................................. 53 3.3.4.0 Preparation of anise water ............................................................................. 53 3.4.0.0 Assay of pure quinine sulphate sample by non-aqueous titration ................. 53 3.5.0.0 Identification .................................................................................................. 54 3.5.1.0 Melting point determination .......................................................................... 54 3.5.2.0 Colour under UV-light................................................................................... 54 3.5.3.0 Sulphate test ................................................................................................... 54 3.6.0.0 Stability studies.............................................................................................. 55 3.7.0.0 Solubility profile of quinine sulphate ............................................................ 55 viii 3.8.0.0 Quinine syrup formulation............................................................................. 55 3.9.0.0. UV-Spectrophotometric method of analysis ................................................ 56 CHAPTER FOUR ..................................................................................................... 57 4.0.0.0 Results and Calculations ................................................................................ 57 4.1.0.0 Identification Test .......................................................................................... 57 4.2.0.0 UV-method of analysis .................................................................................. 59 4.2.1.0 Sample calculation of the prepared concentrations; ...................................... 60 4.3.0.0 Solubility profile of quinine sulphate ............................................................ 61 4.3.1.0 Sample calculations; ...................................................................................... 62 4.4.0.0 Stability studies of quinine syrups ................................................................. 63 4.4.1.0 Percentage content; Sample calculations ....................................................... 67 CHAPTER FIVE ....................................................................................................... 69 5.0.0.0 Discussion, Conclusion and Recommendations ............................................ 69 5.1.0.0 Discussions .................................................................................................... 69 5.1.1.0 Identification test and assay........................................................................... 69 5.1.2.0 Solubility profile of quinine sulphate ............................................................ 70 5.1.3.0 Stability studies.............................................................................................. 70 5.1.4.0 UV-analysis ................................................................................................... 72 5.1.5.0 Formulated product........................................................................................ 72 5.2.0.0 Conclusion ..................................................................................................... 74 5.3.0.0 Recommendations ......................................................................................... 75 5.4.0.0 Reference ....................................................................................................... 75 Appendix ................................................................................................................... 84 ix LIST OF TABLES TABLE 1; STABILITY TYPES ................................................................................................ 28 TABLE 2; BRANDS OF SYRUP USED ..................................................................................... 51 TABLE 3; PURE QUININE SULPHATE SAMPLE ...................................................................... 52 TABLE 4; IDENTIFICATION OF PURE QUININE SAMPLE ........................................................ 57 TABLE 5; STANDARDIZATION OF 0.1 M HCLO4 USING POTASSIUM HYDROGEN PHTHALAT 57 TABLE 6; TITRATION RESULTS OF PURE QUININE SAMPLE WITH 0.1 M HCLO4 .................. 58 TABLE 7; RESULTS SHOWING PREPARED CONCENTRATIONS AND THE CORRESPONDING ABSORBANCES ................................................................................................................... 59 TABLE 8; SOLUBILITY PROFILE OF QUININE SULPHATE; ..................................................... 61 TABLE 9; STABILITY STUDIES OF FIRST SET, WEEK 0 .......................................................... 63 TABLE 10; STABILITY STUDIES FIRST SET, WEEK 1 ............................................................. 63 TABLE 11; STABILITY STUDIES SECOND SET, WEEK 0 ......................................................... 64 TABLE 12; STABILITY STUDIES SECOND SET, WEEK 1 ......................................................... 64 TABLE 13; FORMULATED PRODUCT; 1ST SET, WEEK 1 ......................................................... 65 TABLE 14; FORMULATED PRODUCT; 1ST SET, WEEK 2 ......................................................... 65 TABLE 15; FORMULATED PRODUCT; 2ND SET, WEEK 1 ........................................................ 66 TABLE 16; FORMULATED PRODUCT; 2ND SET, WEEK 2 ........................................................ 66 TABLE 17; PERCENTAGE DETERIORATION (%D) ................................................................ 67 x LIST OF FIGURES FIGURE 1: STRUCTURE OF QUININE ................................................................................... 10 FIGURE 2: SCHEME SHOWING SYNTHESIS OF QUININE ...................................................... 13 FIGURE 3: LIFE CYCLE OF THE MALARIA PARASITE. ……………………………..………. 18 FIGURE 4; CALIBRATION CURVE OF PURE QUININE SULPHATE IN 0.1 M HCL ..................... 60 FIG 5: UV-SPECTRUM OF PURE QUININE SULPHATE SHOWING WAVELENGTHS OF ABSORPTION ....................................................................................................................... 60 Figure 6: UV-spectrum of pure quinine sulphate………………………………………..61 Figure 7: UV-spectrum of quinine sulphate syrup from market…………………………61 FIGURE 8; BREAKDOWN PRODUCTS OF QUININE ................................................................ 72 xi Abbreviations ADR: Adverse Drug Reaction BHA: Butylatedhydroxyanisole BHT: Butylatedhydroxytoluene BNF: British National Formulary BP: British Pharmacopoeia BPACA: Best Pharmaceutical for Children Act EMEA: European Medicines Evaluation Agency FDA: Food and Drug Administration G6PD: Glucose-6-Phosphate Dehydrogenase HIV: Human Immunodeficiency Virus IM: Intramuscular IUPAC: International Union of Pure and Applied Chemistry IV: Intravenous P: Plasmodium PI: Product Information PR: Rectal UNICEF: United Nations International Children’s Emergency Fund USP: United State Pharmacopoeia UV: Ultra Violet WHO: World Health Organization xii CHAPTER ONE 1.0.0.0 INTRODUCTION Quinine is a natural white crystalline alkaloid having antipyretic (fever-reducing), antimalarial, analgesic (painkilling), and anti-inflammatory properties and a bitter taste. It is a stereoisomer of quinidine which, unlike quinine, is an anti-arrhythmic [1]. Quinine was the first effective treatment for malaria caused by Plasmodium falciparum, appearing in therapeutics in the 17th century. It remained the anti-malarial drug of choice until the 1940s, when other drugs such as chloroquine that have fewer unpleasant side effects replaced it. Since then, many effective anti-malarials have been introduced, although quinine is still used to treat the disease in certain critical circumstances, such as severe malaria, and in impoverished regions due to its low cost [2]. Malaria, however, remains an important cause of morbidity and mortality in children and adults in tropical countries. Mortality, currently estimated at over a million people per year, of which 75% are children under 5 years of age, drug assessment in this group is lower which complicate the choice of appropriate treatment [28]. Most authorized or licensed oral medicines are intended for adults and are presented as tablets or capsules, often in a unit intended as a single adult dose [3]. The pediatric patient group with the highest incidence of unlicensed drug prescriptions in Ghana is neonates, with 90% of babies in neonatal intensive care receiving at least one unlicensed or offlabel drug prescription [4]. The problem is not only the lack of pediatric formulations, but also the lack of product information for pediatric use. The development of pediatric formulations, 1 particularly those suitable for very young children, can be challenging to the pharmaceutical scientist [5]. As there is only limited knowledge available on the acceptability of different dosage forms, administration volumes, dosage form size, taste, and importantly, the acceptability and safety of formulation excipients in relation to the age and development status of the child [6]. In general, for oral administration, liquid formulations should be administered whenever appropriate as they are easy to administer and swallow, but there are some limitations and disadvantages. The major challenge for liquid formulations is drug hydrolysis which compromises the chemical stability. The dose volume is a major consideration for the acceptability of a liquid formulation. Typical target dose volumes for pediatric liquid formulations are 5 ml for children under 5 years and 10 ml for children of 5 years and older [6]. Poorly soluble drugs require the addition of co-solvents and surfactants. Unfortunately some solubilisers such as ethanol and propylene glycol are not desirable for administration to children. In addition, preservatives, antioxidants, sweeteners, are added to avoid drug or dosage form instability and to improve the organoleptic properties of the formulation. Although those excipients are called “inactive ingredients”, many have some effects and can produce adverse reactions in patients [7]. Of crucial importance is the ability to mask the unpleasant taste with sweeteners and flavours. In case of very bitter drugs (e.g. ranitidine HCl, prednisolone Na, quinine), this approach is not achievable and more sophisticated formulation approaches are required, bringing higher technical challenges and consequently, research and development will be more lengthy and costly. Furthermore, liquids are not the dosage forms of choice in resourcelimited settings because of their higher weight resulting in higher expenses during 2 transport. Suppositories are often used as drug delivery system in case of nausea or vomiting, in case of oral administration rejection due to the bad taste or in case a medication is readily decomposed in gastric fluid. However, compliance may be lower than for oral dosage forms, as the rectal route of administration is poorly accepted by patients and caregivers in certain countries and cultures [6]. Moreover, drug absorption can be decreased secondary to defecation of the drug or to incomplete dissolution depending on the solubility of the drug and the lower fluid volume in the rectum [8]. Additionally, depending on the nature of the suppository base, stability problems can occur at elevated temperatures in the tropical countries. Compared with liquid formulations, solid preparations exhibit higher drug stability as well as higher drug content per single dosage forms [9]. Most commonly used excipients such as cellulose derivatives, starches, lactose are non-toxic and safe for use in children. However, the problem with tablets (the most popular solid dosage form) is a dosing issue as most commercially available tablets are in doses that are significantly too high for the pediatric population. Multiple dosage forms based on small solid particles like pellets, granulates, powders and sprinkles could offer a solution for this dosing problem [9]. They are suitable for pediatric use since they are usually mixed with food (solid or liquid) for easy swallowing. However, none of the fast dispersing dosage forms products, has a license for children less than 6 years of age due to the dose strength available, many of these technologies are proprietary and consequently their use will require licensing agreements, and development costs are higher than for conventional oral dosage forms [10]. The lack of pediatric formulations is dictated by two major limitations, being technology and market conditions. The pediatric population is categorised into various groups 3 because neonates, infants, children and adolescents have different body composition (for example percentage of body water and fat) and have body organs in different stage of development [11]. As pediatric formulations must allow accurate administration of the dose to patients of widely varying age and weight, the development of age-adapted dosage forms is a formidable challenge for formulation scientists. Moreover, a bitter or metallic taste of the drug can lead to its rejection by children [12]. The second challenge is related to the economic reality of the pediatric market, which is relatively small at about 20 to 25 % of the total adult market. Owing to the high cost of developing drugs, the manufacturers are compelled to address the large markets first. This often means postponing or omitting drug development of pediatric formulations [13]. Developing pediatric drugs requires additional clinical studies and many reasons are given by the pharmaceutical industry for not testing drugs in children e.g. ethical issues, technical and methodological concerns [14]. However, the real reason is that it is time consuming and expensive to perform trials in children, and without a legal obligation and/or financial incentives to do so they are unlikely to happen [15]. As a consequence of the lack of pediatric drug formulations, health professionals working with children are forced into a situation whereby they often need to use unlicensed drugs or licensed drugs in ways not covered by the license (off label), to ensure that children receive an appropriate treatment [16]. Unlicensed drug use is defined as modifications to a licensed medicine. In practice the licensed drug is modified into extemporaneous prepared medicines. Extemporaneous preparation describes the manipulation by pharmacists of various drug and chemical 4 ingredients using traditional compounding techniques to produce suitable medicines. The use of these techniques is widespread in pediatric pharmacy practice. This involves crushing tablets, opening capsules, suspending the drug with various excipients in a liquid, diluting the drug with a bulking agent (e.g. lactose) to a specific strength and supplying the powder mixture in a sachet or as a capsule to the patient [16]. It was in the midst of all those challenges that pharmaceutical companies in Ghana introduced to the market quinine syrup as part of the effort to address some of the problems bedeviled the pediatric population in the treatment of malaria. Since then, there have been a number of such products in almost every pharmacy shops and health centers across the width and breadth of the country. The challenge, however posed, is counterfeiting/sub-standard quinine drugs which may lead to drug resistance which has been slow/not seen in this part of the globe. Surprisingly, quinine salt used in most of the brands is the sulphate. The sulphate is cheap, easy to get, less bitter and has same therapeutic effect as other salts, disclosed by a manufacturer, though admitted to its solubility problems, accounts for its extensive use in the country and in most part of the world. It is of importance to investigate the contents and stabilities of brands on the market to ensure safety of patients and continuous use of quinine for malaria treatment. This work seeks to assay samples of brands on the market, study their stabilities and formulate a product of less complexity. 5 1.2.0.0 Justification Malaria is a public health problem worldwide, especially in tropical Africa where it kills around a million of people a year, of which 75% are children under 5 years of age, drug assessment in this group is lower which complicate the choice of appropriate treatment. Quinine remains an important anti-malarial drug almost 400 years after its effectiveness was first documented. However, its continued use is challenged by its poor tolerability, poor compliance with complex dosing regimens, and the availability of more efficacious anti-malarial drugs. Parasite drug resistance is probably the greatest problem faced by malaria control programs worldwide and is an important public health concern. Over the years, malaria parasites have developed resistance to a number of commonly used anti-malarial drugs. However the development of resistance to quinine has been slow. Quinine is therefore reemerging as an important drug in the treatment of multiple-drug resistant or severe Plasmodium falciparum malaria. Liquid dosage forms (syrups) will undoubtedly enhance quinine compliance, but comes with its associated problems such as stability resulting from drug hydrolysis and solubility (depending on the chemical nature of the drug) which are both pH dependant. It is therefore prudent to have quinine syrup formulation with carefully selected parameters that will enhance patient compliance, especially children and the aged. This will save mothers or care givers from the ordeal they go through when administering quinine. 6 1.3.0.0 Objectives of the study The objectives of the research work are; 1. To study the chemical stability of brands of quinine syrups on the market 2. To study the solubility profile of quinine in citric acid water and in citrate buffer 3. To formulate quinine sulphate syrup 4. To study the stability of the formulated product 7 CHAPTER TWO 2.0.0.0 Literature review 2.1.0.0 History of Quinine Quinine is an effective muscle relaxant, long used by the Quechua, who are indigenous to Peru, to halt shivering due to low temperatures. The Peruvians would mix the ground bark of cinchona trees with sweetened water to offset the bark's bitter taste, thus producing tonic water [1]. According to a legend, an Indian with a high fever was lost in an Andean jungle. Thirsty, he drank from a pool of stagnant water and found that it tasted bitter. Realizing that the water had been contaminated by the surrounding quina-quina trees he thought he was poisoned. Surprisingly, his fever soon abated, and he shared this accidental discovery with fellow villagers, who thereafter used extracts from the quina-quina bark to treat fever [17]. Quinine has been used in un-extracted form by Europeans since at least the early 17th century. It was first used to treat malaria in Rome in 1631. During the 17th century, malaria was endemic to the swamps and marshes surrounding the city of Rome. Malaria was responsible for the deaths of several popes, many cardinals and countless common Roman citizens. Most of the priests trained in Rome had seen malaria victims and were familiar with the shivering brought on by the febrile phase of the disease. The Jesuit brother Agostino Salumbrino (1561–1642), an apothecary by training who lived in Lima, observed the Quechua using the bark of the cinchona tree for that purpose. While its 8 effect in treating malaria (and hence malaria-induced shivering) was unrelated to its effect in controlling shivering from rigors, it was still a successful medicine for malaria. At the first opportunity, Salumbrino sent a small quantity to Rome to test as a malaria treatment. In the years that followed, cinchona bark, known as Jesuit's bark or Peruvian bark, became one of the most valuable commodities shipped from Peru to Europe [18]. When King Charles II was cured of malaria at the end of the 17th Century with quinine, it became popular in London [19]. It remained the anti-malarial drug of choice until the 1940s, when other drugs took over [2]. The form of quinine most effective in treating malaria was found by Charles Marie de La Condamine in 1737 [20]. Quinine was isolated and named in 1820 by French researchers Pierre Joseph Pelletier and Joseph Bienaimé Caventou [21]. The name was derived from the original Quechua (Inca) word for the cinchona tree bark, quina or quina-quina, which means "bark of bark" or "holy bark". Prior to 1820, the bark was first dried, ground to a fine powder, and then mixed into a liquid (commonly wine) which was then drunk. Quinine also played a significant role in the colonization of Africa by Europeans. Quinine had been said to be the prime reason Africa ceased to be known as the "white man's grave". A historian has stated, "it was quinine's efficacy that gave colonists fresh opportunities to swarm into the Gold Coast, Nigeria and other parts of West Africa" [22]. To maintain monopoly on cinchona bark, Peru and surrounding countries began outlawing the export of cinchona seeds and saplings beginning in the early 19th century. The Dutch government persisted in its attempt to smuggle the seeds, and by the 1930s 9 Dutch plantations in Java were producing 22 million pounds of cinchona bark, or 97% of the world's quinine production [22]. During World War II, Allied powers were cut off from their supply of quinine when the Germans conquered the Netherlands and the Japanese controlled the Philippines and Indonesia. The United States had managed to obtain four million cinchona seeds from the Philippines and began operating cinchona plantations in Costa Rica. Nonetheless, such supplies came too late; tens of thousands of US troops in Africa and the South Pacific died due to the lack of quinine [22]. Despite controlling the supply, the Japanese did not make effective use of quinine, and thousands of Japanese troops in the southwest Pacific died as a result [23]. 2.1.1.0 Chemical structure Quinine contains two major fused-ring systems: the aromatic quinoline and the bicyclic quinuclidine [1]. Figure 1: Structure of quinine (Friedrich et al. 1874) Its systematic IUPAC Name is (R)-(6-Methoxyquinolin-4-yl)((2S,4S,8R)-8- vinylquinuclidin-2-yl)methanol, with the molecular formula C20H24N2O2 and a molar mass of 324. Among its physical properties are; slightly soluble in water, odorless, 10 slightly flammable, with a melting point of 1770C, boiling point of 66.40C and sensitive to light, otherwise very stable [25]. 2.1.2.0 Synthetic quinine Cinchona trees remain the only economically practical source of quinine. However, under wartime pressure, research towards its synthetic production was undertaken. A formal chemical synthesis was accomplished in 1944 by American chemists R.B. Woodward and W.E. Doering [24]. Since then, several more efficient quinine total syntheses have been achieved, but none of them can compete in economic terms with isolation of the alkaloid from natural sources. The first synthetic organic dye, mauveine, was discovered by William Henry Perkin in 1856 while he was attempting to synthesize quinine [55]. 11 12 Figure 2: Scheme showing synthesis of Quinine [24]. [26] 2.1.3.0 Mechanism of action against P. falciparum As with other quinoline anti-malarial drugs, the mechanism of action of quinine has not been fully resolved. The most widely accepted hypothesis of its action is based on the well-studied and closely related quinoline drug, chloroquine. This model involves the inhibition of hemozoin biocrystallization, which facilitates the aggregation of cytotoxic heme. Free cytotoxic heme accumulates in the parasites, causing their deaths [1]. 2.1.4.0 Dosing and indication As of 2006, quinine is no longer recommended by the WHO as first-line treatment for malaria, and should be used only when artemisinins are not available [27] [28]. Quinine is a basic amine and is always presented as a salt. Various existing preparations include the hydrochloride, dihydrochloride, sulfate, bisulfate and gluconate. This makes quinine dosing complicated, since each of the salts has a different weight. The following amounts of each salt form contain equal amounts of quinine: 100 mg of quinine base is equivalent to; 13 169 mg of quinine bisulfate 122 mg of quinine dihydrochloride 111 mg of quinine hydrochloride 121 mg of quinine sulfate 160 mg of quinine gluconate All quinine salts may be given orally or intravenously (IV); quinine gluconate may also be given intramuscularly (IM) or rectally (PR). The main problem with the rectal route is that, the dose can be expelled before it is completely absorbed; in practice, this is corrected by giving a half dose again. The IV dose of quinine is 8 mg/kg of quinine base every eight hours; the IM dose is 12.8 mg/kg of quinine base twice daily; the PR dose is 20 mg/kg of quinine base twice daily. Treatment should be given for seven days. For at least the IV formulation, a loading dose of 20 mg/kg is required [29]. The BNF states the following oral dose for malarial and muscle cramps: Adult treatment; malaria, 300 mg – 600 mg daily, muscle cramp, 200 mg – 300 mg daily and Children; malarial, 30 mg/kg daily quinine sulphate [30]. The United States guidelines for treatment of malaria states 10 mg/kg bodyweight three times daily for a period of three or seven days depending on where infections were acquired as pediatric dose. 2.1.5.0 Adverse effects Quinine can, in therapeutic doses, cause cinchonism; in rare cases, it may even cause death (usually by pulmonary edema). Cinchonism is much less common when quinine is 14 given by mouth, but oral quinine is not well tolerated (quinine is exceedingly bitter and many patients will vomit after ingesting quinine tablets): Other drugs such as Fansidar (sulfadoxine with pyrimethamine) or Malarone (proguanil with atovaquone) are often used when oral therapy is required. Quinine ethyl carbonate is tasteless and odourless, but is available commercially only in Japan. Blood glucose, electrolyte and cardiac monitoring are not necessary when quinine is given by mouth [31]. Quinine can cause paralysis if accidentally injected into a nerve. It is extremely toxic in overdose, and the advice of a poisons specialist should be sought immediately. Quinine in some cases can lead to constipation, erectile dysfunction, or diarrhea [32]. Some studies have related the use of quinine and hearing impairment, particularly highfrequency loss. Although some studies suggest that this high-frequency hearing impairment is reversible, it has not been conclusively established whether such impairment is temporary or permanent [33]. 2.1.6.0 Non-abortifacient Despite popular belief, quinine is not an effective abortifacient (a substance that may induce abortion) (in the US, quinine is listed as pregnancy category D). Pregnant women who take toxic doses of quinine will suffer from renal failure before experiencing any kind of quinine-induced abortion [34]. Indeed, quinine is the only drug recommended by the WHO as first-line treatment for uncomplicated malaria in pregnancy [35]. 15 2.1.7.0 Disease interactions Quinine can cause hemolysis in G6PD deficiency (an inherited deficiency), but this risk is small and the physician should not hesitate to use quinine in patients with G6PD deficiency when there is no alternative. Quinine can also cause drug-induced immune thrombocytopenic purpura. Symptoms can be severe enough to require hospitalization and platelet transfusion, with several cases resulting in death [36]. Quinine can cause abnormal heart rhythms, and should be avoided if possible in patients with atrial fibrillation, conduction defects or heart block. 2.1.8.0 Nonmedical uses of quinine; Beverages In some areas, nonmedical use of quinine is regulated. For example, in the United States and Germany, quinine is limited to between 83 and 85 parts per million. Quinine is a flavour component of tonic water and bitter lemon. On the soda gun behind many bars, tonic water is designated by the letter "Q" representing quinine. According to tradition, the bitter taste of anti-malarial quinine tonic led British colonials in India to mix it with gin, thus creating the gin and tonic cocktail, which is still popular today in many parts of the world, especially the UK, United States, Canada, Australia, and New Zealand [37]. 2.1.9.0 Scientific Research Quinine is used in photochemistry as a common fluorescence standard, because of its relative constant and well-known fluorescence quantum yield. The UV absorption peaks 16 around 350 nm. Fluorescent emission peaks at around 460 nm (bright blue/cyan hue) [38]. Quinine and quinidine are used as the chiral moiety for the ligands used in sharpless asymmetric dihydroxylation. The role of cinchona alkaloids (especially quinine) in organic chemistry was firmly established with the discovery of their potential as resolving agents by Pasteur in 1853, which ushered in an era of racemate resolutions by the crystallization of diastereomeric, salts [39]. Today, there are countless examples in which cinchona alkaloids are used as chiral resolving agents [40]. Besides the classical resolution process, significant progress has also been made in the past two decades in the field of cinchona-based enantioseparation, as well as in their use as enantioselective analytical tools. The considerable effort made to accomplish the stereoselective synthesis of quinine over the past 150 years, which was initially triggered by the supply problem caused by political vagaries of the producing countries, has also undoubtedly laid the foundation for much of modern organic chemistry [41]. However, possibly the most interesting application of cinchona alkaloids in chemistry resides in their ability to promote enantioselective transformations in both homogeneous and heterogeneous catalyses. 2.2.0.0 Malaria Malaria is a disease caused by protozoan parasites of the genus Plasmodium. Four plasmodia species commonly infect humans: P. falciparum, P. malariae, P. vivax and P. ovale. All four species are found in the tropics and sub-tropics around the world. The vast 17 majority of clinical disease and practically all malaria-related deaths in Africa are due to P. falciparum [42]. Human infection results from the bite of the female mosquito. Disease symptoms appear following a complicated life cycle of the malaria parasites as shown in figure 3: Mosquitoes inject parasites (sporozoites) into the blood circulation. These reach the liver in a matter of minutes and start to reproduce, becoming hepatic schizonts which subsequently rupture and release parasites (merozoites) into the bloodstream. These merozoites rapidly infect red blood cells. The time from mosquito bite to hepatic schizont rupture is generally between 1 and 2 weeks. Figure 3: Life cycle of the malaria parasite. (From Wirth et al., 2002) 18 In the red blood cells parasites consume haemoglobin, multiply and develop into schizonts. Rupture of the schizonts releases more merozoites into the blood stream to invade yet more red blood cells, causing malaria symptoms (fever) and the infective biomass to expand. This asexual life-cycle from the invasion of red blood cells by merozoites until schizont rupture takes 48 h for P. falciparum. The female mosquitoes become infected by biting an infected human and ingesting blood containing male and female gametocytes. In the mosquito gut the gametocytes fuse to form a zygote, which develops into new sporozoites to complete the life-cycle [43]. Malaria clinical manifestations range from a self-limiting fever to a severe illness. Since the malaria symptoms may mimic many other infectious diseases, investigations of the blood film is necessary to confirm the diagnosis and assess parasite density. Children with malaria typically develop fever, vomiting and headache, while symptoms of severe malaria include prostration, impaired consciousness, severe anemia, hypoglycemia and multiple convulsions [44]. Each year an estimated 300 to 500 million clinical cases of malaria including 2-3 million severe attacks occur, making it one of the most common infectious disease worldwide. In many malaria areas, especially sub-Saharan Africa, malaria is ranked among the most frequent causes of morbidity and mortality among children. About 700.000 to 900.000 children in sub-Saharan Africa aged under 5 years died of the disease in 2000, accounting for 16 to 20% of deaths in that age group. Nearly all of deaths (94%) were in areas with high intensity transmission in the central regions of Africa, i.e. two thirds (68%) of these deaths occurred in rural areas and a quarter (26%) in urban areas [45]. For all of sub-Saharan Africa, including populations not exposed to 19 malaria, malaria caused permanent neurological damage in approximately 7% of the patients [46]. 2.2.1.0 Antimalarial drugs Antimalarial drugs are classified by the stage of the parasitic life cycle they affect and the kind of chemical group to which they belong [47]. The principal antimalarials, classified according to parasitic life cycle include: 1. Blood schizontocides act on the erythrocytic stages of the parasite that are directly responsible for the clinical symptoms of the disease. They can produce a clinical cure or suppression of infection by susceptible strains of all 4 species of malaria parasite but, since they have no effect on exoerythrocytic forms, do not produce a radical cure of relapsing forms of ovale or vivax malarias. 2. Tissue schizontocides act on the exoerythrocytic stages of the parasite and are used for causal prophylaxis to prevent invasion of the blood cells, or as anti-relapse drugs to produce radical cures of vivax and ovale malarias. 3. Gametocytocides destroy the sexual forms of the parasite to interrupt transmission of the infection to the mosquito vector. 4. Sporontocides have no direct effect on the gametocytes in the human host but prevent sporogony in the mosquito. 20 Antimalarial drugs are classified by the chemical group to which they belong, which in turn determines the stage of the life cycle they affect. The principal antimalarials, classified according to drug group and activity are: 1. The 4-methanolquinoline derivatives, such as the cinchona alkaloids and mefloquine. The main cinchona alkaloid quinine and its optical isomer quinidine are rapid-acting blood schizontocides with some gametocytocidal activity. Mefloquine also acts as a blood schizontocide. 2. The 4-aminoquinolines, such as chloroquine, hydroxychloroquine, and amodiaquine, are rapid-acting blood schizontocides with some gametocytocidal activity. 3. The 8-aminoquinolines, such as primaquine and tafenoquine, are tissue schizontocides; primaquine also has gametocytocidal activity and some activity at other stages of the parasite's life cycle. 4. The biguanides, such as proguanil and chlorproguanil, have dihydrofolate reductase inhibitory activity and thus inhibit folate synthesis in the parasite. They are tissue schizontocides and slow-acting blood schizontocides with some sporontocidal activity. 5. The diaminopyrimidines, such as pyrimethamine. Pyrimethamine is a dihydrofolate reductase inhibitor and has actions similar to those of the biguanides. It is usually administered with other antimalarials that inhibit different stages of folate synthesis, such as a sulfonamide or sulfone, to form synergistic combinations. 21 6. The dichlorobenzylidine such as lumefantrine, a blood schizontocide is given in combination with the artemisinin derivative artemether. 7. The hydroxynaphthoquinones, such as atovaquone. Atovaquone has blood schizontocidal activity and is usually given in combination with proguanil. 8. The 9-phenanthrenemethanols, such as the blood schizontocide halofantrine. 9. The sesquiterpene lactones, such as artemisinin and its derivatives, act mainly as blood schizontocides. 10. The sulfonamides, such as sulfadoxine and sulfametopyrazine, which are dihydropteroate synthase inhibitors and thus inhibit folate synthesis. They act mainly as blood schizontocides and are usually administered with pyrimethamine. 11. The tetracyclines, such as doxycycline and tetracycline, are blood schizontocides and also have some activity against tissue forms. 12. The lincosamide, clindamycin, which is also sometimes used, has a similar action to the tetracyclines. 13. The sulfone, dapsone, which has similar antimalarial actions and uses to the sulfonamides. The naphthyridine derivative pyronaridine is under investigation for its use as an antimalarial. The quinolone antibacterials, the 4-piperazinoquinoline derivatives, piperaquine and hydroxypiperaquine, have also been studied for their antimalarial 22 activity. The 9-aminoacridines, such as mepacrine, are no longer used in the treatment of malaria. The differing mechanisms of action of antimalarial drugs sometimes allow the use of combinations of antimalarials to improve efficacy. Such combinations may have a simple additive effect or, more commonly, the drugs used may potentiate each other, for instance by acting at sequential steps in the parasite's folic acid pathway (e.g. pyrimethamine with sulfadoxine or dapsone). Alternatively, a combination may be complementary, when the drugs involved act against different stages in the life cycle of the parasite (e.g. the use of chloroquine with primaquine to produce radical cure of P. vivax or P. ovale infections). The rationale behind the use of such combinations may be to enhance efficacy, particularly when drug resistance is a problem, or it may be an attempt to delay the development of resistance to one or more of the drugs concerned [47]. 2.2.2.0 Plasmodium resistance to Antimalaria drugs Resistance of Plasmodium to antimalarial drugs, in particular the spread of strains of P. falciparum resistant to chloroquine, is of great concern. Chloroquine resistance in P. falciparum now occurs virtually everywhere that P. falciparum malaria is transmitted, with the exception of certain parts of Central America and limited areas of the Middle East and Central Asia. Resistance in P. falciparum to proguanil and pyrimethamine is apparent in many endemic areas. Cross-resistance between proguanil and pyrimethamine may also occur. Resistance in P. falciparum to the combination pyrimethaminesulfadoxine (Fansidar) has spread rapidly in South-East Asia, but also occurs in other parts of the world including parts of South America and Africa. Mefloquine resistance is 23 frequent in some areas of South-East Asia; it has also occurred in the Amazon region of South America and, sporadically, in Africa. Resistance to quinine, halofantrine, and artemisinin derivatives has also been noted. Cross-resistance between halofantrine and mefloquine may occur, as evidenced by reduced responses to halofantrine in some patients who have experienced treatment failure with mefloquine. The emergence of multiple drug resistance in P. falciparum makes the selection of effective prophylaxis and treatment difficult. Resistance in P. vivax to chloroquine and primaquine has also been reported in several parts of the world. Knowledge of the extent of resistance in terms of the geographical distribution and degree of resistance is important for the selection of appropriate control measures and for the development of policies for the rational use of antimalarial drugs. Effective drugs and drug combinations need to be selected according to local patterns of drug resistance. Indiscriminate and uncontrolled use of drugs should be prevented and adequate doses should be given to delay the selection of resistant strains. Malaria control strategies also need to involve other measures such as vector control and health education [47]. 2.2.3.0 Treatment of malaria Malaria is a serious and potentially fatal disease, particularly in the case of falciparum malaria and especially in non-immune individuals. It is such a problem in many parts of the world that a global partnership named Roll Back Malaria has been founded by WHO, United Nations Development Programme, UNICEF, and the World Bank with the aim of 24 significantly reducing the world's malaria burden and halving the number of deaths due to malaria by 2010. Prompt diagnosis and effective treatment of malaria are crucial. Treatment is with a blood schizontocide, selected with due regard to the prevalence of specific patterns of drug resistance in the area of infection. In the case of vivax and ovale malarias, subsequent treatment with a tissue schizontocide is needed where it is considered appropriate to prevent relapse. Antimalarials are generally given by mouth, although in order to obtain rapid response in patients with severe or complicated falciparum malaria it may be necessary to give parenteral therapy initially, the patient being transferred to oral therapy when feasible. In severe or complicated falciparum malaria including cerebral malaria, parenteral treatment is required to produce adequate blood concentrations as quickly as possible. Chloroquine should be given if the infection is known to be sensitive to it. In chloroquine-resistant malaria, or where sensitivity to chloroquine is not known, quinine is usually given intravenously, starting with a loading dose; intravenous artesunate or intramuscular artemether may alternatively be used; intravenous quinidine may be used if parenteral quinine or artemisinin derivatives are not available. Patients of all ages need to be closely monitored while undergoing parenteral therapy and treatment is changed to an orally administered antimalarial as soon as the patient's condition permits. When there are only minimal health care facilities and parenteral therapy is not possible, artemisinin or artesunate suppositories may be given; the nasogastric route may also be used. Supportive therapy in patients with severe or complicated malaria needs to be directed at reducing hyperpyrexia, controlling convulsions, maintaining fluid balance, and correcting 25 hypoglycaemia. Since iron might be involved in the pathogenesis of cerebral malaria, the iron chelator desferrioxamine has been tried in addition to standard antimalarial therapy, but any benefit is yet to be established and WHO advises against its use. Anecdotal reports of the value of corticosteroids in cerebral malaria have not been substantiated by controlled studies and they have no place in the management of this condition. Other approaches such as the use of hyperimmune serum or monoclonal antibody to tumour necrosis factor have also been unsuccessful [47]. 2.2.4.0 Prophylaxis of malaria Chemoprophylaxis of malaria may refer to absolute prevention of infection (causal prophylaxis) or to suppression of parasitaemia and its symptoms (clinical prophylaxis). Causal prophylaxis is provided by tissue schizontocides which destroy the exoerythrocytic forms of the parasite. Clinical prophylaxis is provided by blood schizontocides which, if continued until all exoerythrocytic forms of the parasite are destroyed, will ultimately produce a suppressive cure. In P. falciparum infections this would be achieved by about a month after the last infected bite, but relapses with P. vivax and P. ovale may still occur after standard clinical prophylactic regimens due to the presence of latent exoerythrocytic forms (hypnozoites). The continuing increase in the prevalence of strains of P. falciparum resistant to chloroquine and other antimalarials, along with growing evidence of toxicity of some regimens, make recommendations for malaria prophylaxis increasingly difficult. 26 Absolute protection cannot be guaranteed by any chemoprophylactic regimen currently in use and the importance and effectiveness of methods of avoiding bites from infected mosquitoes, such as the use of protective clothing, bed netting, insect repellents, and insecticides must be stressed. WHO recommends the following measures to protect against mosquito bites: application of an effective insect repellent to exposed skin between dusk and dawn when mosquitoes commonly bite accommodation in buildings with screens over doors and windows use of mosquito nets at night, preferably impregnated with pyrethroid insecticides such as permethrin or deltamethrin and use of anti-mosquito sprays or insecticide dispensers, or mosquito coils in bedrooms at night [47] 2.3.0.0 Stability of pharmaceutical products Many pharmaceutical substances are known to deteriorate during distribution and storage particularly in hot, humid climate. Nonetheless, little precise information is available on the degradation characteristics of many long-established substances. More is known of the stability of recently introduced substances since relevant data are generated as a condition of registration to support proposed expiry date. Stability may therefore be defined as the time from the date of manufacture and packaging of the formulation until its chemical or biological activity is not less than a predetermined level of labeled 27 potency and its physical characteristics have not changed appreciably or deleteriously. Although there are exceptions, 90% of labeled potency generally is recognized as the minimum acceptable potency level. The assurances that packaged product will be stable for its anticipated shelf-life come from an accumulation of valid data on the drug in its commercial package. This stability involves selected parameters that, taken together, form the stability profile. Pharmaceutical products are expected to meet their specifications for identity, quality, purity, and strength throughout their defined storage conditions [48]. 2.3.1.0 Types of stability There are five types of stability that are usually considered for each drug [60]; Table 1; stability types Type of stability Conditions maintained throughout the shelf-life of the drug product Chemical Each active ingredient retains its chemical integrity and labeled potency, within the specified limits Physical The original physical properties, including appearance, palatability, uniformity, dissolution and suspendability are retained Microbiological Sterility or resistance to microbial growth is retained according to the specified requirements. Antimicrobial agents that are present retain effectiveness within the specified limits. Toxicological No significance increase in toxicity occurs Therapeutic The therapeutic effect remains unchanged [48] 28 Terms commonly associated with stability include; period of stability, expiry or expiration date and shelf life. The period of stability of a drug is the time period from the date of manufacture of the drug till the time that its chemical or biological activity is not less than 90% of the stated potency and its physical properties have not changed deleteriously [49]. The expiry date of a pharmaceutical product indicates the date up to, and including, which the product is expected to remain within the acceptable limits if stored as specified. The shelf-life, also known as validity period of a pharmaceutical product is the period during which the product, if stored appropriately, is expected to remain within specifications as determined by stability studies done on the product. It is used to determine the expiry date of a product [49]. 2.3.2.0 Factors affecting drug stability Many factors affect the stability of drug products. These include environmental factors such as heat or temperature, moisture (humidity), oxygen and light; and product related factors such as packaging, manufacturing process, active ingredients and excipients. 2.2.2.1 Effect of temperature on drug stability Temperature fluctuation in the storage facility may not only speed up chemical reaction but also cause “breathing” of the container resulting to air and moisture transport into the product. It is evidenced that with each 10°C rise in temperature, the speed of many 29 chemical reactions increases about two to three times. Hence an increase in temperature can cause significant increase in the decomposition rate of a product. High temperature may also lead to racemization of an optically active drug product resulting in the formation of an inactive racemic mixture with loss of therapeutic activity. It is therefore necessary that drug products are stored under defined temperature ranges. Some products like vaccines, biological products, and reconstituted injectable preparations require a storage temperature of about 5°C or below. 2.3.2.2 Effect of humidity It is very important that moisture is excluded from pharmaceutical products. This is because not only does water affect the rate of decomposition but also the kinetics of decomposition. A very humid environment can cause hydrolysis of pharmaceutical products leading to instability. Compounds that contain unsaturated carbons, ester, amide, glycoside or lactam linkages are susceptible to hydrolysis. Many substances however contain water in the adsorbed form and the British Pharmacopoeia gives specified limits for such products. Protection against hydrolysis can be achieved by either formulating in non-aqueous vehicles or adding a buffer (since hydrolysis of drugs in solution may be catalysed by H+ or OH- ions). 2.3.2.3 Effect of oxygen Oxygen is a major cause of drug instability. This is because most drugs exist in the reduced form so the presence of oxygen poses a potential stability problem to these drugs. In the presence of light or heat, oxygen causes oxidation of many drugs, especially 30 those that are light sensitive. Oxidation of drugs manifests itself in changes in colour, smell or consistency of the product, or by formation of crystals. In order to prevent oxidation of drugs, light-resistant containers may be used; and nitrogen or carbon dioxide may be used to replace oxygen in pharmaceutical containers [49]. 2.3.2.4 Effect of light Photochemical decomposition of drugs is a common occurrence in pharmacy. Light can cause oxidation-reduction, ring rearrangement or modification and polymerization of drugs, especially at shorter wavelengths of light. Pharmaceutical products can be protected from light by the use of coloured (such as amber-coloured) glass containers and storing them away from light. Tablets can also be coated with polymer films containing UV absorbers. 2.3.3.0 Factors related to the product Some factors associated with the product itself have been found to lead to stability problems. Some of these are discussed below [49]. 2.3.3.1 The active pharmaceutical ingredient and excipients The physical and chemical properties of an active drug substance can affect the stability of the drug product. If a drug in itself is unstable, it may sometimes be difficult to achieve a finished stable formulation. The particular crystal form of the drug, polymorphism, particle size and presence of water or other solvents can all affect drug stability. Excipients can also make drugs unstable. 31 2.3.3.2 Manufacturing process The process of manufacturing can lead to product instability if good manufacturing processes are not followed. For example, if photosensitive drugs are exposed to light, they are likely to break down even before they are released unto the market. 2.3.3.3 Packaging The nature and properties of packaging materials used are important in order to protect pharmaceutical products from instability. Light-sensitive products for example, should not be stored in plain containers as this would encourage photochemical decomposition. Alkali glass containers can also interact with drugs and cause hydrolysis by the release of hydroxyl ions. 2.3.4.0 Forms of drug instability Drug instability may be classified under chemical, microbial and physical instability. 2.3.4.1 Chemical instability The most common reactions that cause chemical instability of pharmaceutical products are hydrolysis, oxidation and reduction. The presence of light can catalyse oxidation and photochemical degradation. Moisture can lead to hydrolysis of the product. Therefore for light sensitive drugs, adequate lighting and temperature are necessary during the manufacturing process and storage to prevent product degradation. Temperature and pH are major factors affecting hydrolysis of drugs in the liquid state. Buffering agents can be 32 used to prevent changes in pH upon storage. The addition of antioxidants can also prevent oxidation; and refrigeration slows down the rate of chemical reactions [49]. 2.3.4.2 Microbiological instability Microbial growth commonly occurs in medicines, especially liquid formulations. Contamination of drugs by microorganisms could lead not only to spoilage but also toxicity. The presence of microbes can cause changes in the organoleptic properties of the drug, that is, changes in smell, appearance, taste and texture. These could range from turbidity to bad odour and taste. Microbial contamination can also have adverse effects on the chemical stability of drugs. 2.3.4.3 Physical instability Physical instability can manifest as change in appearance of the drug (change in colour, viscosity and precipitation). Dispersed systems like suspensions can lead to physical instability. Therefore suspended particles should not settle too rapidly and particles that settle to the bottom of the container must not form any solid mass that cannot be easily redispersed into a uniform mixture upon shaking. Temperature can affect the viscosity of preparations. For example, refrigeration can increase viscosity and cause precipitation of the active drug or excipients. Uneven particle size can affect dissolution and bioavailability of some drugs. Larger particles would have lower solubility and slower dissolution rates, hence lower bioavailability. 33 2.3.5.0 Stability testing methods There are two main methods of testing the stability of pharmaceutical products. These are accelerated stability testing and real time stability testing. 2.3.5.1 Accelerated stability testing In this method, drugs are exposed to high stress conditions to enhance the rate of degradation, hence reducing the time required for testing. High temperatures (37°C-40°C and up to 50°C-55°C), high humidity and exposure to light are included in the design of accelerated stability studies. This study provides a basis for determining the provisional shelf-life of a drug product. Therefore real-time stability study is also required to confirm product stability over a specific period under certain conditions [1].Accelerated stability tests help in rapid detection of deterioration in different initial formulations of the same product, the prediction of shelf-life and the provision of a rapid means of quality control, which ensures that no unexpected change occurred during storage of the drug product. 2.3.5.2 Real time stability studies It is a long term stability studies. It involves evaluation of the physical, chemical, biological, biopharmaceutical and microbiological properties of a drug product during and beyond the expected shelf-life (and under likely storage conditions in the intended market). The purpose of real time stability testing is to establish shelf-life, confirm a provisional shelf-life and to recommend appropriate storage conditions. 34 2.3.6.0 Importance of stability testing Stability tests provide evidence on how the quality of a drug product would vary with time under the influence of certain environmental conditions such as temperature, light and moisture. This helps to recommend appropriate storage conditions for products and shelf- life to be determined, hence ensuring the safety and efficacy of pharmaceutical products. Accurate dosing can be guaranteed and the development of toxic side effects from toxic metabolites of a deteriorated product or even death can be prevented when the stability of drugs is studied. 2.4.0.0 Solutions for oral administration Pharmaceutical solutions may be generally defined as liquid preparations in which the therapeutic agent and the various excipients are dissolved in the chosen solvent system. Pharmaceutical solutions may contain a range of excipients, each with a defined pharmaceutical purpose [50]. Examples of these include; The vehicle, usually purified water Co-solvents Preservatives Sweeteners Rheology (viscosity) modifiers Antioxidants Colours Flavours 35 Buffers to regulate the pH of the formulation 2.4.1.0 Advantages and disadvantages of pharmaceutical solutions for oral administration 2.4.1.1 Advantages Therapeutic agents can easily be administered orally to individuals who have difficulty in swallowing, e.g. elderly patients and infants The therapeutic agent is dissolved in the formulation and is therefore immediately available for absorption. Providing the drug does not precipitate within the gastrointestinal tract, the bioavailability of pharmaceutical solutions is greater than that of oral solid-dosage forms Taste-masking of bitter therapeutic agents may be readily achieved 2.4.1.2 Disadvantages Pharmaceutical solutions for oral administration are unsuitable for therapeutic agents that are chemically unstable in the presence of water The poor solubility of certain therapeutic agents may prohibit their formulation as pharmaceutical solutions. Pharmaceutical solutions are expensive to ship and are bulky for the patient to carry due to the associated mass of the product. 36 2.4.2.0 Drug solubility In pharmaceutical solutions both the therapeutic agent and the excipients are legally required to be present in solution over the shelf-life of the formulated product. As a result pharmaceutical solutions are termed homogeneous. One of the major challenges to the pharmaceutical scientist is the attainment of homogeneity in the formulation, due primarily to, in many cases, the limited aqueous solubility of the therapeutic agent. Initially there are possible scenarios regarding the formulation of pharmaceutical solutions of a therapeutic agent for oral administration; The aqueous solubility of the therapeutic agent is high at the selected pH of the formulation. Under these circumstances the therapeutic agent may be readily incorporated into the vehicle and formulated as an oral solution, The aqueous solubility of the therapeutic agent is moderate at the selected pH of the formulation, i.e. the aqueous solubility is less than the requested concentration of the therapeutic agent. Under these circumstances the solubility of the therapeutic agent in the formulation must be enhanced using co-solvents and related methods. The aqueous solubility of the therapeutic agent is low at the selected pH of the formulation. The difference between the aqueous solubility of the therapeutic agent and the required concentration is too great to be bridged by the use of cosolvents and the related methods or the concentration of co-solvents or surfactants in the solubilised formulation may be toxic when administered orally. 37 The drug may therefore be formulated as an alternative-dosage form, e.g. a suspension. 2.4.3.0 Factors affecting the solubility of therapeutic agents The solubility properties of drug molecules in a particular solvent system are sometimes difficult to predict and have been reported to be dependent, at least in part, on several physicochemical properties, including molecular weight, volume, and radius of gyration, density, number of rotatable bonds, hydrogen bond donors and hydrogen bond acceptors. Furthermore, the properties of the solid state, e.g. crystal habit, crystalline/amorphous properties will also affect the solubility of the therapeutic agent. There are some empirical relationships between the physicochemical properties and the solubility of the therapeutic agents that influence formulation strategies, as follows; The solubilities of a chemically related series of therapeutic agent are inversely related to their melting points. Therefore, as the melting point of the therapeutic agent is increased, the solubility would be expected to decrease. The solubility of a therapeutic agent is directly affected by both the type of chemical substituent groups and the substituent position. The solubility of therapeutic agents containing hydrophilic groups (e.g. OH, COO, ammonium ion) will accordingly be greater than those containing lipophilic substituent groups, e.g. methyl, ethyl, ethoxy or chlorine groups. Ortho-substituted compounds are generally more soluble than those of the meta and para isomers [51]. 38 The solubilities of therapeutic agents that are either acids or bases are pH-dependent. The solubility of acids and bases increases as the degree of ionisation increases and may be easily calculated using the following equation; pH = pKa + log [(S-S0)/S0] …………………….. for acids pH = pKa – log [(S0/S-S0)] ……………………… for bases (where S refers to the solubility of the drug and So is the intrinsic solubility, i.e. the solubility of the unionised form of the drug). From these equations two invaluable conclusions may be drawn: – At pH values above the pKa, the solubility of acidic drugs increases. – At pH values below the pKa, the solubility of basic drugs increases. In simple terms the solubility of acidic compounds increases as the pH of the solution is increased (above the pKa) and the solubility of basic compounds increases as the pH is lowered below the pKa. Determination of the solubility properties of zwitterionic compounds, i.e. those that exhibit both acidic and basic properties, is more complicated than for simple acids or bases. However, in common with simple acids and bases, the solubility of zwitterionic therapeutic agents is affected by pH. At basic pH values the therapeutic agent behaves primarily as an acid whereas at low pH values the molecule behaves as a base. The pH range at which the therapeutic agent exhibits minimal solubility lies between the pKa values of the acidic and basic groups. 39 Quinine for example, having two pKa values will exhibits its lowest solubility between pH of 4.1 and 8.5 and highest solubility below pH 4. 2.4.4.0 Formulation methods to enhance/optimise the solubility of therapeutic agents It should be noted that the prerequisite for pharmaceutical solutions is the exclusive presence of dissolved therapeutic agent. The underlines are measures employed to optimise the formulation of pharmaceutical solutions; 2.4.4.1 Appropriate selection of drug salt Majority of therapeutic agents are commercially available to the pharmaceutical scientist in a range of salt forms, each form exhibiting a different aqueous solubility. The differences in solubility may be accredited, at least in part, to the crystal properties of the salt, which, in turn, affect the energy required to dissociate solute–solute bonds. Therefore, unless a specific salt form is specified or in the absence of a pharmaceutical approved salt of a therapeutic agent, the formulation scientist should select the salt that provides the required solubility in the dosage form [50]. 2.4.4.2 Optimisation of the pH of the formulation The solubility of an ionised therapeutic agent is a function of both the pKa of the compound and the pH of the formulation. Importantly, the acceptable pH range of solutions for oral administration is large, ranging from circa 5 to 8 pH units. Therefore, a common formulation strategy involves the selection of a pH value for the formulation that optimises the ionisation and hence solubility of the therapeutic agent. Control of the 40 pH in the formulation is achieved using a buffer that does not adversely affect the solubility of the therapeutic agent. 2.4.4.3 Use of co-solvents Co-solvents are primarily liquid components that are incorporated into a formulation to enhance the solubility of poorly soluble drugs to the required level. In the formulation of pharmaceutical solutions for oral administration, aqueous solutions are preferred due to the lack of toxicity of water as the vehicle. However, if the solubility of the therapeutic agent renders this approach inappropriate, the incorporation of co-solvents within the formulation offers a pharmaceutically acceptable approach. Commonly employed cosolvents include glycerol, propylene glycol, ethanol and poly (ethylene glycol). Prediction of the solubility of therapeutic agents in mixed solvent systems (the vehicle, water and the chosen co-solvent) is difficult, due to the effects of many variables on the solubility. In practice the pharmaceutical scientist should measure the solubility of the chosen therapeutic agent in a series of mixed solvents to determine the most suitable solvent system for the given purpose. The final choice of the co-solvent system for a particular formulation involves consideration of the solubility of the therapeutic agent in the vehicle, the toxicity of the vehicle and the cost of the formulation. Indeed, it should be noted that the range of concentrations of each co-solvent used in oral formulations is primarily limited by concerns regarding toxicity [50]. 41 2.4.5.0 Excipients used in pharmaceutical solutions for oral administration Excipients in pharmaceutical formulations are physiologically inert compounds that are included in the formulation to facilitate the administration of the dosage form, e.g. pourability, palatability, to protect the formulation from issues regarding physical and chemical stability and to enhance the solubility of the therapeutic agent. Pharmaceutical solutions commonly contain a wide range of excipients, the details of which are provided below 2.4.5.1 The vehicle The preferred and most commonly used vehicle in solutions for oral administration is Purified Water USP, due to the low cost and low toxicity of this ingredient. Under normal circumstances tap (drinking) water should not be used due to the possibility of chemical imcompatibities within the formulation. The main features of Purified Water USP are as follows: It is prepared by distillation, ion exchange methods or by reverse osmosis. The solid residue (obtained after evaporation) is less than 1 mg per 100 ml of evaporated sample. It must not be used for the preparation of parenteral formulations. In the case of parenteral formulations Water for Injections BP must be used 42 2.4.5.2 Co-solvents As defined previously, co-solvents are employed to increase the solubility of the therapeutic agent within the formulation. The main co-solvents that are used in the formulation of oral solutions are glycerol, alcohol, propylene glycol, polyethylene glycol, etc. 2.4.5.3 Buffers Buffers are employed within pharmaceutical solutions to control the pH of the formulated product and, in so doing, optimise the physicochemical performance of the product. Typically pH control is performed: to maintain the solubility of the therapeutic agent in the formulated product. The solubility of the vast number of currently available drugs is pH-dependent and, therefore, the solubility of the therapeutic agent in the formulation may be compromised by small changes in pH to enhance the stability of products in which the chemical stability of the active agent is pH-dependent. The concentration (and hence buffer capacity) of buffer salts employed in the formulation of oral solutions should be selected to offer sufficient control of the pH of the formulation but yet should be overcome by biological fluids following administration. This latter property is particularly appropriate for parenteral formulations to ensure that there is no irritation or damage following injection. 43 Examples of buffer salts used in pharmaceutical solutions include: acetates (acetic acid and sodium acetate): circa 1–2% citrates (citric acid and sodium citrate): circa 1–5% Phosphates (sodium phosphate and disodium phosphate): circa 0.8–2%. It must be remembered that the buffer system used in solution formulations should not adversely affect the solubility of the therapeutic agent, e.g. the solubility of drugs may be affected in the presence of phosphate salts. 2.4.5.4 Sweetening agents Sweetening agents are employed in liquid formulations designed for oral administration specifically to increase the palatability of the therapeutic agent. The main sweetening agents employed in oral preparations are sucrose, liquid glucose, glycerol, sorbitol, saccharin sodium and aspartame. The use of artificial sweetening agents in formulations is increasing and, in many formulations, saccharin sodium is used either as the sole sweetening agent or in combination with sugars or sorbitol to reduce the sugar concentration in the formulation. The use of sugars in oral formulations for children and patients with diabetes mellitus is to be avoided. 2.4.5.5 Viscosity-enhancing agents The administration of oral solutions to patients is usually performed using a syringe, a small-metered cup or a traditional 5-ml spoon. The viscosity of the formulation must be sufficiently controlled in order to ensure the accurate measurement of the volume to be 44 dispensed. Furthermore, increasing the viscosity of some formulations may increase the palatability. Accordingly there is a viscosity range that the formulation should exhibit to facilitate this operation. Certain liquid formulations do not require the specific addition of viscosity-enhancing agents, e.g. syrups, due to their inherent viscosity. The viscosity of pharmaceutical solutions may be easily increased (and controlled) by the addition of non-ionic or ionic hydrophilic polymers. Examples of both of these categories are shown below: non-ionic (neutral) polymers – cellulose derivatives, e.g.: methylcellulose hydroxyethylcellulose hydroxypropylcellulose – polyvinylpyrrolidone ionic polymers – sodium carboxymethylcellulose (anionic) – sodium alginate (anionic). 45 2.4.5.6 Antioxidants Antioxidants are included in pharmaceutical solutions to enhance the stability of therapeutic agents that are susceptible to chemical degradation by oxidation. Typically antioxidants are molecules that are redox systems that exhibit higher oxidative potential than the therapeutic agent or, alternatively, are compounds that inhibit free radicalinduced drug decomposition. Typically in aqueous solution antioxidants are oxidised (and hence degraded) in preference to the therapeutic agent, thereby protecting the drug from decomposition. Both water-soluble and water-insoluble antioxidants are commercially available, the choice of these being performed according to the nature of the formulation. Examples of antioxidants that are commonly used for aqueous formulations include: sodium sulphite, sodium metabisulphite, sodium formaldehyde sulphoxylate and ascorbic acid. Examples of antioxidants that may be used in oil-based solutions include: butylated hydroxytoluene (BHT), butylated hydroxyanisole (BHA) and propyl gallate. Typically antioxidants are employed in low concentrations (0.2% w/w) and it is usual for the concentration of antioxidant in the finished product to be markedly less than the initial concentration, due to oxidative degradation during manufacture of the dosage form. Antioxidants may also be employed in conjunction with chelating agents, e.g. ethylenediamine tetraacetic acid, citric acid, that act to form complexes with heavymetal ions, ions that are normally involved in oxidative degradation of therapeutic agents [50]. 46 2.4.5.7 Preservatives Preservatives are included in pharmaceutical solutions to control the microbial bioburden of the formulation. Ideally, preservatives should exhibit the following properties: possess a broad spectrum of antimicrobial activity encompassing Gram-positive and Gram-negative bacteria and fungi be chemically and physically stable over the shelf-life of the product have low toxicity. A wide range of preservatives is available for use in pharmaceutical solutions for oral use, including the following: benzoic acid and salts (0.1–0.3%) sorbic acid and its salts (0.05–0.2%) alkyl esters of parahydroxybenzoic acid (0.001–0.2%). Usually a combination of two members of this series is employed in pharmaceutical solutions, typically methyl and propyl parahydroxybenzoates (in a ratio of 9:1). The combination of these two preservatives enhances the antimicrobial spectrum. 2.4.5.8 Flavours These are employed whenever the unpalatable taste of a therapeutic agent is apparent, even in the presence of the sweetening agents. The flavours may be of natural origin (e.g. peppermint, lemon, herbs and spices) and are available as oils, extracts, spirits or aqueous solutions. A wide range of synthetic flavours are available that offer advantages over 47 their natural counterparts in terms of purity, availability, stability and solubility. Certain flavours are also associated with a (mild) therapeutic activity. For example, many antacids contain mint due to the carminative properties of this ingredient. Alternatively other flavours offer a taste-masking effect by eliciting a mild local anaesthetic effect on the taste receptors. Examples of flavours in this category include peppermint oil, chloroform and menthol. The concentration of flavour in oral syrups is that which is required to provide the required degree of taste-masking effectively. 2.4.5.9 Colours These are generally natural or synthetic water-soluble, photo-stable ingredients that are selected according to the flavour of the preparation. For example, mint-flavoured formulations are commonly a green colour, whereas in banana-flavoured solutions a yellow colour is commonly employed. Such ingredients must not chemically or physically interact with the other components of the formulation. 2.4.6.0 Types of pharmaceutical solutions Oral solutions are administered to the gastrointestinal tract to provide systemic absorption of the therapeutic agent. Due to the resilience of the gastrointestinal environment, oral solutions may be formulated over a broad pH range. However, unless there are issues regarding the solubility or stability of the therapeutic agent, the usual pH of oral solutions is circa 7.0. There are three principal types of solution formulations that are administered orally: oral solutions, oral syrups and oral elixirs. In addition, other solution formulations are employed for a local effect, e.g. mouthwashes/gargles and enemas. 48 2.4.7.0 Oral syrups Syrups are highly concentrated, aqueous solutions of sugar or a sugar substitute that traditionally contain a flavouring agent, e.g. cherry syrup, cocoa syrup, orange syrup, raspberry syrup. An unflavoured syrup is available that is composed of an aqueous solution containing 85% sucrose. Therapeutic agents may either be directly incorporated into these systems or may be added as the syrup is being prepared. If the former method is employed, it is important to ensure that the therapeutic agent is soluble within the syrup base. It should also be remembered that the choice of syrup vehicle must be performed with due consideration to the physicochemical properties of the therapeutic agent. For example, cherry syrup and orange syrup are acidic and therefore the solubility of acidic or some zwitterionic therapeutic agents may be lowered and may result in precipitation of the drug substance. Under these circumstances, the physical stability of the preparation will have been compromised and the shelf-life of the product will have been exceeded. The use of acidic syrups may additionally result in reduced chemical stability for acidlabile therapeutic agents. The major components of syrups are as follows: ■ Purified water ■ Sugar (sucrose) or sugar substitutes (artificial sweeteners). ■ Preservatives ■ Flavours ■ Colours 49 CHAPTER THREE 3.0.0.0. Methodology. 3.1.0.0. Instruments and materials. Eutech instrument pH 510, T90+ UV/vis spectrometer pH/mV/ion/0C/0F meter, Adamanalytical weighing balance, W A 210; 210/0.0001g, Buchi Water bath, Volumetric flasks (1000 ml, 500ml, 200 ml, 100 ml, 50 ml), Conical flasks, Measuring beakers, Pipettes, No. 1 Whatman filter paper, Funnels, Stirring rod, Test tubes, Boiling tubes, Melting point capillary tubes, Stuart melting point SMP 10 apparatus and Chromato-VUE C-70G UV-viewing system. All the above materials and equipments/instruments were obtained from KNUST Department of Pharmaceutical Chemistry. 3.2.0.0 Samples Hydrochloric acid (36% w/w) (BDH), Perchloric acid (70%), Acetic anhydride, Glacial acetic acid (BDH), Ethanol, Anise oil, Sucrose, Citric acid, Sodium citrate, Sodium hydroxide, Barium chloride, Benzoic acid, Sulphuric acid, Oracet blue and Pnaphthobenzein. The above reagents were obtained from KNUST Department of Pharmaceutical Chemistry, with the exceptions of Anise oil from Department of Pharmaceutics KNUST, Sucrose was bought from market, Sodium citrate and citric acid from Akoma Pharmacy in Kumasi. 50 Table 2; Brands of syrup used Code Syrup Strength/5ml(mg) Batch number Manufacturing Expiry Date Date Omer Investment Ltd D 50 0072 Dec 2013 Dec 2015 Pokupharma Ltd C 50 QS 003 Jan 2014 Jan 2017 Propharm Chemist Ltd E 50 Q 023 Jan 2014 Jan 2016 Aspee Pharmaceutical Ltd A 75 037 Feb 2014 Feb 2016 Kama Industries Ltd B 75 AM0212 May 2012 Name of Manufacturer The brands were bought from different pharmacy shops on the Kumasi market. 51 Apr 2015 Table 3; Pure quinine sulphate sample Sample Batch Number Quinine sulphate 341187 Manufacturing Date Expiry Date 17 Jun 2013 15 Jun 2016 100.4 Assay % 3.3.0.0 Reagents preparation 3.3.1.0 Standardization of 0.1 M HClO4 3.3.1.1 Preparation 900 ml of glacial acetic acid was measured into a 1L volumetric flask. 8.5 ml of 70% perchloric acid was slowly added with continuous and efficient mixing. 30 ml acetic anhydride was slowly added and the volume adjusted to 1L with glacial acetic acid. The solution was left to stand for 24 hours. 3.3.1.2 Standardization 0.5 g of potassium hydrogen phthalate was accurately weighed into a 250 ml conical flask and 25 ml of glacial acetic acid was added. The solution was warmed to dissolve the salt. It was then cooled and titrated with the 0.1 M perchloric acid using Oracet blue as the indicator. 3.3.2.0 Preparation of a 0.1 M hydrochloric acid 8.6 ml of 36% stock hydrochloric acid was measured into 1L volumetric flask containing about 100 ml of distilled water. It was allowed to cool and the volume adjusted to the mark with more distilled water. It was then stoppered, shaken and labeled accordingly. 52 3.3.3.0 Citrate buffer preparation About 105 g of citric acid was weighed and transferred quantitatively with distilled water into a 1L volumetric flask. The flask was stoppered, shaken vigorously to ensure complete dissolution and homogeneity. The solution was adjusted with distilled to the mark (0.5M citric acid), stoppered, shaken and labeled accordingly. The various pH of the buffer were prepared from this solution. This was done by taken 100 ml of the citric acid solution and adjusting the pH with sodium citrate solution. 3.3.4.0 Preparation of anise water 5 ml of anise oil was measured into 100 ml volumetric flask; 70 ml of ethanol was added and made to the mark with purified water to form concentrated anise water. 1 ml of this solution was taken and diluted to 40 ml with purified water. This solution was used to mask the quinine syrup [52]. 3.4.0.0 Assay of pure quinine sulphate sample by non-aqueous titration 0.2 g of quinine sulphate was accurately weighed and dissolved in 20 ml of acetic anhydride. The resulted solution was titrated against 0.1 M perchloric acid using pnaphthobenzein as indicator. Each ml of perchloric acid is equivalent to 24.90 mg of total quinine (alkaloid) salt [54]. 53 3.5.0.0 Identification 3.5.1.0 Melting point determination Capillary tube sealed at one end was partly filled with pure quinine sulphate sample. The tube was gently tapped at the sealed end to ensure well packed column, about 3 mm in height. The filled end was placed in the melting point determination equipment/apparatus with the plateau temperature set at 2150C. The temperature at which the sample began to melt and the temperature it completely melt were noted. 3.5.2.0 Colour under UV-light 0.1 g of pure quinine sulphate was weighed and dissolved in 3 ml of sulphuric acid (H2SO4) and further adjusted the volume to 100 ml with distilled water; the resulted solution was examined under UV-light at 366 nm. 1 ml of hydrochloric acid was again added to the solution and the changed in colour noted [53]. 3.5.3.0 Sulphate test About 45 mg of pure quinine sulphate sample was dissolved in 5 ml of 0.1 M HCl solution. 1 ml of barium chloride solution was added and observation made. Similar test was performed on the brands of quinine sulphate syrup bought from the market. This was done by taken 5 ml of individual syrups and dissolved in 5 ml of 0.1 M HCl solution. 1 ml of barium chloride solution was added to the resulted solutions and changes observed [53]. 54 3.6.0.0 Stability studies Stabilities of five different brands of quinine sulphate syrups on the Ghanaian markets were studied. Two sets of each brand of the same batch number were bought, one from each set of brands was selected and their pH’s and the corresponding percentage content determined, for a period of two weeks. The second sets were taken through the same process also for two weeks. The change in pH and corresponding content over the period of studied were noted. 3.7.0.0 Solubility profile of quinine sulphate Sufficient amount of pure quinine sulphate was weighed and dissolved in 20 ml of buffer solutions of different pH values to form their respective saturated solutions. The resulted solutions were filtered and the amount of quinine sulphate in the filtrate analyzed using UV-spectrophotometer. A known concentration of each filtrate was prepared by taken 5 ml from the filtrate and diluted to 100 ml with 0.1 M HCl solution (blank), 1 ml of this solution was taken and again diluted to 100 ml with the blank solution. The resulted solutions were then analyzed with UV-spectrophotometer at 250 nm. The respective absorbances were taken and their concentrations calculated from a calibration curve. 3.8.0.0 Quinine syrup formulation For 500 ml of quinine syrup, 441.7 g of sucrose was weighed and boiled together with benzoic acid in enough purified water to make it to 500 ml mark (syrup base). It was filtered to remove undissolved benzoic acid and other insoluble particles. It was allowed to cool to room temperature. 4000 mg of quinine sulphate powder was weighed and 55 dissolved in 300ml citrate buffer of pH 2. About 200 ml of the syrup base was incorporated into the quinine solution. Few milliliters of anise water to mask the taste were added to make it to the 500 ml mark. This was packaged in 100 ml volumes of plain and amber bottles. This preparation had 40 mg per 5 ml. In another preparation, 441.7 g of sucrose was weighed and boiled in citrate buffer of pH 2. It was allowed to cool to room temperature. 2210 mg of quinine sulphate powder was weighed and dissolved in the syrup base. The volume was adjusted with anise water and citrate buffer to make it to the 500 ml mark. This preparation had 26 mg per 5 ml without a preservative. 3.9.0.0. UV-Spectrophotometric method of analysis 0.1 g of quinine sulphate powder was weighed and dissolved in 100 ml of 0.1 M HCl solution to obtain 0.1 w /v% stock solution. From this stock solution, the following concentrations; 0.001% 0.0005% 0.00025% 0.000125% and 0.0000625% were prepared by serial dilutions. The absorbances of these solutions at 250 nm were obtained with 0.1 M HCl as blank. A calibration curve was plotted and the equation obtained was used for the quantification of the syrup brands and the formulated product. This was done by preparing a known concentration of the various brands and their absorbances obtained at 250 nm. 56 CHAPTER FOUR 4.0.0.0 Results and Calculations 4.1.0.0 Identification Test Table 4; Identification of pure quinine sample Parameters Observations Remarks Melting Point 225 - 2270C Passed Colour Under UV-light Blue colour disappear on Passed addition of 1 ml HCl Sulphate test White precipitate formed Passed Table 5; standardization of 0.1 M HClO4 using potassium hydrogen phthalate Burette Readings/cm3 1st Determination 2nd Determination Initial Readings/cm3 0.00 0.00 Final Readings/cm3 24.20 24.10 Titre/cm3 24.20 24.10 Average titre = (24.20 + 24.10)/2 = 24.15 cm3 C8H5O4K + HClO4 C8H6O4 + KClO4 Milliequivalence Calculation 1M C8H5O4K ≡ 1M HClO4 57 204.14g C8H5O4K in 1000ml ≡ 1M HClO4 20.414g C8H5O4K in 1000ml ≡ 0.1M HClO4 2.0414g C8H5O4K in 100ml ≡ 0.1M HClO4 0.020414g C8H5O4K in 1ml ≡ 0.1M HClO4 Amount of C8H5O4K weighed = 0.500 g Volume of 0.1 M HClO4 ≡ 0.500 g of C8H5O4K = 24.15 cm3 Amount of C8H5O4K equivalent to 24.15 cm3 of 0.1 M HClO4 = (24.15 x 0.020414)/1 ml = 0.4929981 g Factor of HClO4 = 0.500/0.4929981 = 1.0142 Table 6; Titration Results of pure quinine sample with 0.1 M HClO4 Burette Readings/cm3 1st determination 2nd determination Blank determination Initial Readings/cm3 0.00 8.10 16.10 Final Readings/cm3 8.10 16.10 16.20 Titre/cm3 8.10 8.00 0.10 Average titre = (8.10 + 8.00)/2 = 8.05 cm3 Each ml of perchloric acid (0.1 M) VS is equivalent to 24.9 mg alkaloid salt 58 Actual volume of HClO4 = (8.05 – 0.10) x F (HClO4) = 7.95 ml x 1.014 = 8.063 ml Amount of quinine = 8.063 x 24.9 mg = 200.77 mg Percentage purity of quinine sulphate = (200.77 x 100)/200 = 100.4% 4.2.0.0 UV-method of analysis Table 7; Results showing prepared concentrations and the corresponding absorbances Absorbance Concentration/w/v% 0.874 0.001 0.502 0.0005 0.317 0.00025 0.224 0.000125 0.175 0.0000625 59 4.2.1.0 Sample calculation of the prepared concentrations; (0.1 %w/v) x V = (0.001 %w/v) x 100 ml V = (0.001 x 100)/0.1 = 1 ml 1 ml of the stock solution (0.1 %w/v) was taken and diluted to 100 ml to obtain the 0.001 %w/v. Calibration curve of Quinine sulphate in 0.1 M HCl 1 y = 744.1x + 0.13 R² = 1 abs 0.8 0.6 0.4 0.2 0 0 0.0002 0.0004 0.0006 0.0008 0.001 0.0012 Concentration (%w/v) Figure 4; calibration curve of pure quinine sulphate in 0.1 M HCl Fig 5: UV-spectrum of pure quinine sulphate showing wavelengths of absorption 60 Fig 6: UV-spectrum of pure quinine sulphate Fig 7: UV-spectrum of quinine sulphate syrup from market 4.3.0.0 Solubility profile of quinine sulphate Table 8; Solubility profile of quinine sulphate; Citrate Buffer pH Solubility/mg/ml Solubility/mg/5 ml 2 12. 67 63.40 3 5.00 25.00 4 0.0536 0.269 5 0.153 0.766 6 0.188 0.941 Distilled Water 2.20 11.000 Citric Acid 20.20 101.000 The solubilities were determined using the equation from the calibration curve above. 61 4.3.1.0 Sample calculations; Citrate Buffer at pH 2 Measured absorbance = 0.602, General equation; Y = 744.1 X + 0.13 Y = absorbance, X = concentration in w/v % 0.602 = 744.1 X + 0.13, X = (0.602 - 0.13)/744.1 = 6.343 x 10⁻⁴ w/v % Solubility in 5 ml = (6.343 x 10⁻⁴/5.00 x 10-4) x 50 mg = 63.34 mg/5ml = 12.67 mg/ml 62 4.4.0.0 Stability studies of quinine syrups Table 9; Stability studies of first set, week 0 Brands Percentage Content % 3 pH 4 5 Mean content percentage 1 2 A 102.40 101.70 102.50 103.00 102.40 102.40 ± 0.58 2.66 B 108.31 107.62 109.00 108.30 108.32 108.31 ± 0.61 5.65 C 76.33 76.33 77.00 76.33 75.66 76.33 ± 0.59 2.90 D 100.00 98.90 99.90 99.00 99.45 99.45 ± 0.62 2.92 E 83.32 83.30 83.34 83.00 83.64 83.32 ± 0.28 5.69 Table 10; Stability studies first set, week 1 Brands Percentage Content % 3 pH 4 5 Mean content percentage 1 2 A 103.28 101.00 102.12 102.28 102.14 102.14 ± 0.76 2.72 B 95.00 94.14 96.06 94.00 93.15 94.07 ± 0.82 5.16 C 71.76 71.76 71.52 72.00 71.76 71.76 ± 0.21 2.86 D 95.24 95.60 95.42 95.34 95.50 95.42 ± 0.17 2.92 E 77.18 77.10 78.00 77.14 76.28 77.14 ± 0.76 5.22 63 Table 11; Stability studies second set, week 0 Brands Percentage Content % pH 1 2 3 4 5 Mean content percentage A 98.64 99.00 98.38 99.00 98.18 98.64 ± 0.46 2.57 B 94.15 94.34 95.00 93.68 94.53 94.34 ± 0.60 5.16 C 67.46 66.92 68.00 67.50 67.42 67.46 ± 0.48 2.94 D 99.00 98.64 98.28 99.10 98.18 98.64 ± 0.51 2.91 E 83.00 83.98 82.00 81.96 80.96 81.98 ± 0.90 4.78 Table 12; Stability studies second set, week 1 Brands Percentage Content % pH 1 2 3 4 5 Mean content A 89.10 88.70 89.00 88.40 88.30 88.70 ± 0.44 2.88 B 79.12 77.32 78.44 78.00 78.22 78.22 ± 0.81 4.19 C 67.20 66.30 68.10 67.10 67.30 67.20 ± 0.80 3.00 D 37.62 38.00 37.24 37.34 37.90 37.62 ± 0.41 3.11 E 78.40 76.88 77.94 78.00 78.48 77.94 ± 0.79 5.13 64 percentage Table 13; Formulated product; 1st set, week 1 Condition/ Type bottle Percentage content % of pH 1 2 3 4 5 Mean % content Plain bottle 77.41 78.00 76.82 77.50 77.32 77.41 ± 0.52 Amber bottle 102.00 102.62 102.43 103.00 102.31 102.31 ± 0.72 2.46 2.31 Table 14; Formulated product; 1st set, week 2 Condition/ Type bottle Percentage content % of 1 2 64.56 65.00 64.78 64.46 65.10 64.78 ± 0.34 2.60 Amber bottle 99.00 99.36 99.18 99.25 99.11 99.18 ± 0.17 2.20 Plain bottle 3 pH 4 5 65 Mean % content Table 15; Formulated product; 2nd set, week 1 Condition/ Type bottle Percentage content % of pH 1 2 3 4 5 Mean % content Plain bottle 76.07 75.14 77 76.10 76.04 76.07 ± 0.82 Amber bottle 103.00 102.34 102.68 102.99 102.34 102.67 ± 0.41 2.52 2.31 Table 16; Formulated product; 2nd set, week 2 Condition/ Type bottle Percentage content % of pH 1 2 3 4 5 Mean % content Plain bottle 48.00 46.08 47.04 47.08 47.00 47.04 ± 0.84 Amber bottle 100.60 101.00 100.80 101.20 100.40 100.80 ± 0.39 66 2.60 2.40 Table 17; Percentage deterioration (%D) Brands Percentage content Percentage content 1st set week 1 2nd set week 1 %D 1st set week 2 2nd set week2 %D A 102.40 98.64 3.76 102.14 88.70 13.44 B 108.31 94.34 13.97 94.07 78.22 15.85 C 76.33 67.46 8.87 71.76 67.20 4.56 D 99.45 98.64 0.81 95.40 37.62 57.78 E 83.32 81.98 1.34 77.14 77.94 -0.80 Plain bottle 77.41 64.68 12.73 64.78 47.04 17.74 Amber bottle 102.31 102.67 -0.36 100.80 -1.62 4.4.1.0 Percentage content; Sample calculations Percentage content calculations From Beer-Lambert’s law: A = abc, where A = Absorbance at 250 nm a = A (1%, 1 cm) b = Path length 67 99.18 c = concentration From the calibration curve; Y = 744.1 X + 0.13 For Y =? a = 744.1, b = 1, c=x Percentage content of first set of brands, second week. Brand; (A), Abs = 0.510 X = (0.510 – 0.13)/744.1 = 5.11 x 10⁻⁴ w/v% % content = (5.11 x 10⁻⁴/0.0005) X 100 = 102.14% 68 CHAPTER FIVE 5.0.0.0 Discussion, Conclusion and Recommendations 5.1.0.0 Discussions 5.1.1.0 Identification test and assay The analysis of drugs in quality assurance is done in relation to reference standards. Since these standards serve as benchmark, their identification and purity is essential to the subsequent work. An intense blue colour of quinine sulphate solution (dissolved in dilute sulphuric acid) was observed under UV-light at 366nm, which disappeared on addition of 1ml HCl. This was in agreement with the British pharmacopoeia (BP). The melting point determination gave 225 – 2270C as against the literature range of 225 – 2330C. Furthermore, the UV-spectrum of the run sample had a maximum absorption at 250 nm, which also agrees with literature value. A sulphate test on the sample also produced a white precipitate confirming the presence of sulphate in the pure quinine sample as well as in the syrup brands. The pure quinine sample had a percentage content of 100.4%, which fell within the permissible range of BP. i.e. 95.0% to 105.0%. The authenticity and purity of the quinine sulphate sample was therefore enough to be used as a reference standard for the analysis. 69 5.1.2.0 Solubility profile of quinine sulphate Table 9 gives quantitative solubility of quinine sulphate in citric acid, citrate buffer and distilled/purified water. From the table, quinine sulphate is more soluble in citric acid and decreases as the pH of the buffer increases to pH 6. However, there is a slight increase from pH 5 to 6 over pH 4. The salt again showed marked solubility in water over pH 4, 5 and 6. Even though, quinine is a weak dibasic amine having pKa values of 4.1 and 8.5 and is soluble in acidic medium below pKa 4.1. The level of solubility within this region depends on the level of ionisation. Quinine solubility increases as ionisation increases and is much greater at low pH values (i.e. the lower the pH, the higher the level of ionisation and hence the greater the solubility). This accounted for the solubility trend observed in table 9. 5.1.3.0 Stability studies The results obtained from tables 9 – 12 indicate change in percentage content of the various brands of quinine sulphate syrup bought from the market and the corresponding change in pH. The study was done for a period of one week for each set of brands. First set week 0, indicates results obtained from first time of analysis of first set of selected brands. Week 1 indicates results obtained of a week after the first analysis on the same set of brands. First week’s analysis (week 0’s) of first and second sets of brands gave the following percentage degradations/deteriorations and the respective pH change: brand A had 3.7% degradation with pH changing from 2.66 to 2.57; brand B also had 13.97% 70 deterioration and pH changing from 5.6 to 5.16; brand C deteriorated by 8.87% having its pH also changing from 2.90 to 2.94; brand D degraded by 0.81% with pH changing from 2.92 to 2.91 and brand E, 1.34% with changing pH from 4.69 to 4.78. The above results indicate that any change in pH observed affects the content of the active ingredients. However, a pH of a formulation is as a result of a totality of excipients and active ingredients in the formulation. The direction of pH change is a function of the kind of degradation that occurs within the formulation. A critical scrutiny of the stability tables shows a decrease in percentage content from set to set and week after week analysis. The pH, however, had a mixed trend depending on the kind of degradation. This point to the fact that, oxidative degradation of quinine at the vinyl group portion will lead to the formation of quinetine and gemoquinic acid which may lead to a decrease in pH of the formulation. On the other hand, the quinuclidine and the quinoline rings of quinine may be oxidised to form the 2-hydroxyquinine and the dihydroxyquinine which in turn may lead to an increase in pH of the formulation. 71 N HO O O N HO O OH N N Quinetine 2-Hydroxyquinine O O OH N HO OH O O OH N N Gemoquinic acid OH 2,3-Dihydroxyquinine Figure 8; Breakdown products of quinine 5.1.4.0 UV-analysis 0.1 M HCl solution was used as the solvent (reference sample). This was necessitated by the free solubility nature of quinine sulphate in HCl solution. The conjugation and the chromophoric nature of quinine made it possible for its analysis and again had no interaction with the syrup excipients at 250 nm. 5.1.5.0 Formulated product The formulation was done in a citrate buffer of pH 2 as the vehicle. This was necessitated by the outcome of the solubility test done on the salt. The product had a pH of 2.30 with syrup strength of 40 mg of quinine sulphate per 5 ml. Anise water prepared from anise oil was effectively used to mask the taste. At week 1, product stored in plain bottle had a pH 72 of 2.46 with percentage content of 77.41% whereas product stored in amber bottle had changed to 2.31 with percentage content of 102.31%. Week 2 on the same set saw plain bottled product changing from 2.46 to 2.60 with content degrading to 66.78% whiles amber bottled product also changed from 2.31 to 2.20 with percentage content of 99.18%. Second set analysis of the formulated product (i.e. two weeks after formulation of new set) gave the following: plain bottled product had a pH of 2.52 and percentage content of 76.04%; amber bottled product however maintained a pH of 2.31 with a percentage content of 102.67%. From table 16, product stored in plain bottle had a percentage content of 47.04% with pH of 2.60 and amber bottled product also had a percentage content of100.80% with pH changing to 2.40. Generally, the formulated product stored in amber bottle had higher percentage content and was more stable than products in plain bottles. This was because quinine is susceptible to light degradation (i.e. catalyzed by light). Photo degradation might be the major cause of the level of decomposition of plain bottled products. Amber bottles are able to exclude light of wavelength less than 470 nm and so afford considerable protection of compounds sensitive to UV light. This accounted for the stability trend observed in the amber bottled products. The usual pH of oral solution is 7.0. The formulated pH of 2.30, even though small and acidic, the pH is however, accepted over a broad range if there are issues regarding solubility or stability of the therapeutic agent as in the case of penicillins [50]. 73 The formulated product was studied for a period of two weeks. The rational for the studied period was that, quinine regimen is done for seven days and so, if a formulation is able to maintain its potency level after two weeks of exposure (i.e. opening and take sample for analysis leading to air and moisture transport into the containing vessel), then, such a product can be said to be stable within its formulation. Quinine exhibits narrow margin between effective dose and toxic dose. The recommended dose of 10 mg/kg bodyweight three times daily for a period of seven days for treatment of malaria is so high that many patients experience cinchonism. 15 mg/kg bodyweight daily has proven effective with no significant toxic effect [56]. However, below, the stated dose has proven otherwise. The syrup strength of the formulated product of 40 mg/5ml however stands at advantage over the market products of a reduced toxic effect in case of accidental overdose. Its high stability will also ensure accurate dosage delivery to avoid underdose. 5.2.0.0 Conclusion The pure quinine sulphate sample had an intense blue colour under UV-light, melting point of 225 - 2270C, a percentage purity of 100.4% and produced white precipitate in few drops of barium chloride solution. Chemical stabilities of quinine syrup brands from market were established. Brands A and D passed percentage content of 95 – 105 % on their first sets of analysis, however, failed on the second sets and also had low pH values. Brands B and E failed percentage content but had an improved pH. Brand C also failed percentage content with low pH value. 74 Quantitatively, the solubility profile of quinine sulphate was successfully established in citric acid, citrate buffer (of pH 2 – 6) and in water as: 20.20 mg, 12.67 mg, 5.00 mg, 0.05 mg, 0.15 mg, 0.19 mg and 2.20 mg respectively per ml of their solutions. Quinine sulphate syrup was successfully formulated with syrup strength of 40 mg/5 ml and pH of 2.30 with a well masked taste. The stability of quinine sulphate syrup was achieved in a citrate buffer of pH 2.30 and is susceptible to light degradation. 5.3.0.0 Recommendations The formulated product is recommended for patients who have difficulty in swallowing quinine tablets or reject because of quinine bitterness. It is again recommended for pediatrics that required less dosage for treatment and can be stored and be re-used provided it is not place under light. Further works other salts are recommended to improve upon the pH and again perform clinical trials to ensure adequate dose volume for pediatrics. 5.4.0.0 Reference 1. Friedrich A. Flückiger and Daniel Hanbury, Pharmacographia: A history of the principal drugs of vegetable origin, met with in Great Britain and British India (London, England: Macmillan and Co., 1874), pages 302-331: Cortex Cinchonæ 2. Loren, Humphrey (2000). Quinine and Quarantine. 75 3. Nahata, M.C., 1999. Pediatric drug formulation: challenges and potential solutions. 4. Choonara, I., Conroy, S., 2002. Unlicensed and off-label drug use in children: Implication for safety. Drug safety 25: 1-5. 5. Tan, E., Cranswick, N.E., Rayner, C.R., Chapman, C.B., 2003. Dosing information for paediatric patients: are they really “therapeutic orphans”? Med. J. Aust. 179(4): 195-198. 6. EMEA, Committee for Medicinal Products for Human use (CHMP), 2006. Reflection paper: Formulations of choice for the pediatric population. 7. Pawar, S., Kumar, A., 2002. Issues in the Formulation of Drugs for Oral Use in children, Role of Excipients. Pediatr. Drugs 4(6): 371-379. 8. De Boer, A.G., Moolenaar, F., de Leede, L.G.J., Breimer, D.D., 1982. Rectal drug administration: Clinical pharmacokinetic consideration. Clin. Pharmacokinet. 7: 285-311. 9. Breitkreutz, J., Wessel, T., Boos, J., 1999. Dosage forms for peroral drug administration to children. Ped. & Perinat. Drug Ther. 3: 25-33. 10. Nunn, T., Williams, J., 2005. Formulation of medicines for children. Br. J. Clin. Pharmacol. 59 (6): 674-676. 76 11. EMEA (European Medicines Evaluation Agency), 2001. Note for guidance on clinical investigation of medicinal products in the pediatric population. CPMP/ICH/2711/99 – January 2001. 12. Giacoia, G.P., Taylor-Zapata, P., Mattison, D., 2007. Need for appropriate formulations for children: The National Institute of Children and Human Development-Pediatric Formulations Initiative, Part 1. Int. J. Pharm. Compounding 11(1): 5-8. 13. Gupta, M., Wu, D., Barrett, J.S., 2006. Pediatric Pharmacotherapy: Issues and Challenges. AAPS Newsmagazine 9 (4): 16-19. 14. Conroy, S., 2006. Unlicenced and off-label drug usage in children in Europe. In Jacqz- 15. Aigrain, E., Choonara, I., Paediatric Clinical Pharmacology, Taylor & Francis Group, NY, p 3-16. 16. Brion, F., Nunn, A.J., Rieutord, A., 2003. Extemporaneous (magistral) preparation of oral medicines for children in European hospitals. Acta Paediatr. 92: 486-490. 17. David B, Jacoby RMY: Encyclopedia of Family Health. Third edition. 2005 77 18. Toovey S "The Miraculous Fever-Tree. The Cure that Changed the World Fiametta Rocco; Harper Collins, San Francisco, 2004, 348 pages, Paperback, ISBN 0-00-653235-7". Travel Med Infect Dis 2 (2): 109–10. 19. Rocco, Fiametta, 2004. Quinine: malaria and the quest for a cure that changed the world. New York, NY: Perennial. 20. De la Condamine (1738) "Sur l'arbre du quinquina" (On the quinquina tree) Histoire de l'Académie royale des Sciences, 226-243 21. Pelletier and Caventou (1820) "Suite: Des recherches chimiques sur les quinquinas" (Continuation: Chemical research on quinquinas), Annales de Chimie et de Physique, vol. 15, pages 337-365. 22. Conner, Clifford D. (2005). A People's History of Science: Miners, Midwives, and 'Low Mechanicks'. New York: Nation Books. pp. 95–96. ISBN 1-56025-748-2. Also cites Porter, Roy (1998). The Greatest Benefit to Mankind: A Medical History of Humanity. New York: W. W. Norton. pp. 465–466. ISBN 0-393-04634-6 78 23. Lt. Gen. Leonard D. Heaton, ed. (1963). "8". Preventive Medicine in World War II: Volume VI, Communicable Diseases: Malaria. Washington, D.C.: Department of the Army. pp. 401 and 434. 24. Woodward R, Doering W (1944). "The Total Synthesis of Quinine". J Am Chem Soc 66 (849) 25. [Online] Available at: (http://www.cornellbiochem.wikispace.com/quinine.html) Accessed, 17 July 2014 26. [Online] Available at: (http://www.synarchive.com/syn/2) Accessed, 15 April 2014 27. Dorndorp A, Nosten F, Stepniewska K, et al. (2005). "Artesunate verus quinine for treatment of severe falciparum malaria: a randomised trial". Lancet 366 (9487): 717–25. 28. WHO 2006 "Guidelines for the treatment of malaria" [online] Available at: (http://apps.who.int/malaria/docs/TreatmentGuidelines2006.pdf) accessed, 2010 29. Barennes H, et al. (1996). "Efficacy and pharmacokinetics of a new intrarectal quinine formulation in children with Plasmodium falciparum malaria". Brit J Clin Pharmacol 41 (5): 389. 79 30. BNF 5.4.1 Antimalarial, National Poisons Information Service (New Castle centre) [online] Available at: (www.bnf.org/bnf/bnfcurrent/31767.htm) Accessed 05/06/2014 31. Jamaludin A, Mohamad M, Navaratnam V, et al. (1988). "Relative bioavailability of the hydrochloride, sulphate and ethyl carbonate salts of quinine". Br J Clin Pharmacol 25 (2): 261–3. PMC 1386482. PMID 3358888. 32. Optically active isomers of quinine and quinidine and their respective biological action [online] Available at: (wwwfreepatentsonline.com6844355.html) Accessed 26/1/2009 33. Roche RJ, Silamut K, Pukrittayakamee S, Looareesuwan S, Molunto P, Boonamrung S, White NJ. (1990.) "Quinine induces reversible high-tone hearing loss", Br J Clin Pharmacol, 29(5):780-2. 34. Dannenberg AL; Behal, FJ; Johnson, J; Johnson, Jamie (1983). "Use of quinine for self-induced abortion". The Southern Medical Journal 76 (7): 846–849. doi:10.1097/00007611-198307000-00007. PMID 6867792. 35. Yeka A, Achan J, D'Alessandro U, Talisuna AO (2009). "Quinine monotherapy for treating uncomplicated malaria in the era of artemisinin-based combination therapy: an appropriate public health policy?". Lancet Infect Dis 9 (7): 448–452. 36. "NPS warns on quinine". Auspharm e News, 6 January 2010. 80 37. Charming, Cheryl (2006). Miss Charming's Guide for Hip Bartenders and Wayout Wannabes. USA: Sourcebooks, Inc. p. 189. ISBN 978-1-4022-0804-1. 38. "Basic Concepts in Fluorescence" [online] Available at: (ww.olympumicro.co/primer/techniques/fluorescence/fluorescenceintro.html) accessed July 15, 2014 39. Pasteur, L. (1853) Acad. Sci., 37, 162; Pasteur, L. (1853) Liebigs Ann. Chem.,88, 209. 40. Newman, P. (1981) Optical Resolution Procedures for Chemical Compounds: Acids, vol. 2, Optical Resolution Information Center, Manhattan College, Riverdale, NY, pp. 7–22; (b) Jacques, J., Collet, A., and Wilen, S.H. (1981) Enantiomers, Racemates and Resolutions, John Wiley & Sons, Inc., New York, pp. 254, 257; (c) Sheldon, R.A. (1993) Chirotechnology, Marcel Dekker, New York, Chapter 6; (d) Kozma, D. (2002) CRC Handbook of Optical Resolutions via Diastereomeric Salts, CRC Press, Boca Raton, FL 41. Kaufmann, T.S. and Rúveda, E.A. (2005) Angew. Chem. Int. Ed., 44, 854; (b)Weinreb, S.M.(2001) Nature, 411, 429; (c) Nicolaou, K.C. and Sorensen, E.J. (1996) in Classics in Total Synthesis: Targets, Strategies, Methods, Wiley-VCH Verlag GmbH, Weinheim, Chapter 15. 81 42. Marsh, K., Makani, J., 2004. Malaria. In Principles of Medicine in Africa, 3rd edition. Edited by Parry, E., Godfrey, R., Mabey, D., Gill, G., 284-304, Cambridge. 43. Ashley, E., McGready, R., Proux, S., Nosten, F., 2006. Malaria. Travel Med. Inf. Dis. 4:159-173. 44. Greenwood, B.M., Bojang, K., Whitty, C.J.M., Targett, G.A.T., 2005. Malaria. The lancet 365: 1487-1498. 45. Rowe, A. K., Rowe, S.Y., Snow, R.W., Korenromp, E.L., Joanna RM Armstrong Schellenberg, Stein, C., Nahlen, B.L, Bryce, J., Black, R.E., Steketee, R.W., 2006. The burden of malaria mortality among African children in the year 2000. Int J Epidem. 35: 691-704. 46. WHO Roll Back Malaria Info sheet. “Children and Malaria”. [online] Available at: (http://www.who.int/malaria/malariaininfants.html) accessed 2005. 47. Sweetman Sc (Ed), Martindale: The complete drug reference, London; pharmaceutical press Electronic version (2005). 48. Lippincott Williams and Wilkins (2005), Remington, “The Science and Practice of Pharmacy” 21st Edition Page 102549. Olaniyi A. A. (2000), Principles of Drug Quality Assurance and Pharmaceutical Analysis 82 (1st Edition) Published by MosuroPublishers, 5 OluwareObasaStreet, Ibadan. Pages 89-105. 50. “Solutions for oral administration” [Online] Available at: (http://www.ft_pharm_dosage_sample.com) Accessed, 12 June 2014 51. Francis A Carey (2003), Organic Chemistry (fifth edition) pg 995 52. British Pharmacopoiea. (2009). (Electronic.). Version: 11.0 53. British Pharmacopoiea. (2013). (Electronic.). Version: 17.0 54. United State Pharmacopoeia. (2007). Electronic Version for Arabswell 55. Kaufman, Teodoro S.; Rúveda, Edmundo A. (2005). "Die Jagd auf Chinin: Etappenerfolge und Gesamtsiege". Angewandte Chemie, Int. Ed. 117 (6): 876– 907. Dorndorp A, Nosten F, Stepniewska K, et al. (2005). "Artesunate verus quinine for treatment of severe falciparum malaria: a randomised trial". Lancet 366 (9487): 717–25. 56. “Quinine dosage” [Online] Available at www.ncbi.nlm.nih.gov/pubmed/12055811) accessed August 5, 2014 83 Appendix Solution preparations Preparation of 0.1 M HCl solution Percentage purity = 36% density = 1.18 36.5 g ≡ 1000 ml ≡ 1.0 M HCl 3.65 g ≡ 1000 ml ≡ 0.1 M HCl V (HCl) at 100% = (3.65/1.18) X (100/36) = 8.59 ml ≈ 8.6 ml Therefore 8.6 ml HCl measured Preparation of 0.5 M citric acid (C6H8O7) Percentage purity = 99.9% 210 g ≡ 1000 ml ≡ 1.0 M C6H8O7 105 g ≡ 1000 ml ≡ 0.5 M C6H8O7 Weight at 100% = (100/99.9) X 105 = 105.10 ≈ 105 g 84 105 g of C6H8O7 weighed Syrup base preparation Sucrose : water = 667 : 1000 %w/w ≡ 66.7% sucrose For 500 ml of sucrose, Syrup density = 1.315 – 1.333 Average density = 1.324 Volume of water required = 1000/1.324 = 755.29 ml 667 g of sucrose ≡ 755.29 ml 500 ml = (500/755.29) X 667 441.55 g of sucrose Calibration curve concentrations Sample calculations The following concentrations; 0.001%, 0.0005%, 0.00025%, 0.000125% and 0.0000625%w/v were prepared from 0.01 w/v% stock solution as follows; 85 0.0005 w/v % CiVi = CfVf 0.001 V = 0.0005 x 100 V = (0.0005 x 100)/0.001 V = 50 ml 50 ml of 0.001 w/v % solution was taken and made up to 100 ml using 0.1 M HCl 0.00025 w/v % 0.0005 V = 0.00025 x 100 V = (0.00025 x 100)/0.0005 V = 50 ml 50 ml of 0.0005 w/v % solution was taken and topped up to 100 ml with the 0.1 M HCl 0.000125 w/v % 0.00025 V = 0.000125 x 100 V = (0.000125 x 100)/0.00025 V = 50 ml 86 50 ml of 0.00025 w/v % solution was taken and topped up to 100 ml with the 0.1 M HCl solution 0.0000625 w/v % 0.000125 V = 0.0000625 x 100 V = (0.0000625 x 100)/0.000125 V = 50 ml 50 ml of 0.000125 w/v % solution was taken and made up to 100 ml using the 0.1 M HCl solution. Sample calculations on solubilities Citrate Buffer at pH 6 Measured absorbance = 0.137 General equation; Y = 744.1 x + 0.13 Y = absorbance, x = concentration in w/v % 0.137 = 744.1 x + 0.13 X = (0.137 – 0.13)/744.1 = 9.407 x 10⁻⁶ w/v % Solubility in 5 ml = (9.407 x 10⁻⁶/5.00 x 10-4) X 50 87 = 0.941 mg/5ml = 0.188 mg/ml Citrate Buffer at pH 4 Measured absorbance = 0.132 General equation; Y = 744.1 x + 0.13 Y = absorbance, x = concentration in w/v % 0.132 = 744.1 x + 0.13 X = (0.132 - 0.13)/744.1 = 2.688 x 10⁻⁶ w/v % Solubility in 5 ml = (2.688 x 10⁻⁶/5.00 x 10-4) X 50 = 0.269 mg/5ml = 0.054 mg/ml Citrate Buffer at pH 3 Measured absorbance = 0.316 General equation; Y = 744.1 x + 0.13 Y = absorbance, x = concentration in w/v % 88 0.316 = 744.1 x + 0.13 X = (0.316 - 0.13)/744.1 = 2.499 x 10⁻⁴ w/v % Solubility in 5 ml = (2.499 x 10⁻⁴/5.00 x 10-4) X 50 = 25 mg/5ml = 5.0 mg/ml Citric acid at pH 1.61 Measured absorbance = 0.882 General equation; Y = 744.1 x + 0.13 Y = absorbance, x = concentration in w/v % 0.882 = 744.1 x + 0.13 X = (0.882 - 0.13)/744.1 = 1.102 x 10⁻³ w/v % Solubility in 5 ml = (1.102 x 10⁻³/5.00 x 10-4) X 50 = 101 mg/5ml = 20.20 mg/ml 89 Distilled water Measured absorbance = 0.212 General equation; Y = 744.1 x + 0.13 Y = absorbance, x = concentration in w/v % 0.212 = 744.1 x + 0.13 X = (0.212 - 0.13)/744.1 = 1.102 x 10⁻⁴ w/v % Solubility in 5 ml = (1.102 x 10⁻⁴/5.00 x 10-4) X 50 = 11.00 mg/5ml = 2.20 mg/ml Sample calculations on percentage content From Beer-Lambert’s law A = abc, where A = Absorbance at 250 nm a = A(1%, 1 cm) b = Path length 90 c = concentration From the calibration curve; Y = 744.1 x + 0.13 For Y =?, a = 744.1, b = 1, c = x Percentage content of the first set of brands within the first week; Brand; Aspee (A), Abs = 0.510 X = (0.510 – 0.13)/744.1 = 5.11 x 10⁻⁴ w/v% % content = (5.11 x 10⁻⁴/0.0005) X 100 = 102.14% Brand; Kama (B), Abs = 0.481 X = (0.481 – 0.13)/744.1 = 4.72 x 10⁻⁴ w/v% % content = (4.72 x 10⁻⁴/0.0005) X 100 = 94.34% Formulated product; Abs = 0.510 X = (0.510 – 0.13)/744.1 91 = 5.11 x 10⁻⁴ w/v% % content = (5.11 x 10⁻⁴/0.0005) X 100 = 102.14% Pokupharma; (C), Abs = 0.414 X = (0.414 – 0.13)/744.1 = 3.82 x 10⁻⁴ w/v% % content = (3.82 x 10⁻⁴/0.0005) X 100 = 76.33% Omer; (D), Abs = 0.500 X = (0.500 – 0.13)/744.1 = 4.97 x 10⁻⁴ w/v% % content = (4.97 x 10⁻⁴/0.0005) X 100 = 99.45% Propharm; (E), Abs = 0.440 X = (0.440 – 0.13)/744.1 = 4.17 x 10⁻⁴ w/v% 92 % content = (4.17 x 10⁻⁴/0.0005) X 100 = 83.32% Samples of formulated products Plain bottled product 93 Amber bottled produc Tables showing percentage contents and remarks of various brands and the formulated product over the period of study First batch first week analysis Brands % Content Remarks A 102.40 passed B 108.31 Failed C 76.33 Failed D 99.45 Passed E 83.32 Failed FPdt 102.14 Passed 94 First batch second week analysis Brands % Content Remarks A 102.14 passed B 94.07 Failed C 71.76 Failed D 95.42 Passed E 77.14 Failed FPdt 99.18 Passed Second batch first week analysis Brands % Content Remarks A 98.64 Passed B 94.34 Failed C 67.46 Failed D 98.64 Passed E 81.98 Failed FPdt 102.67 Passed 95 Second batch second week anaysis Brands % Content Remarks A 88.70 Failed B 78.22 Failed C 67.20 Failed D 37.62 Failed E 77.94 Failed FPdt 100.80 Passed Key FPdt = formulated product % content = percentage content Spectrum showing combined spectra of various concentrations prepared for the calibration curve. 96


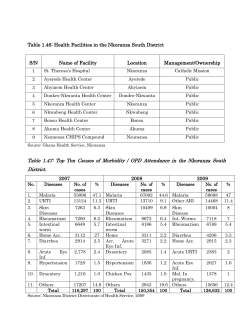


© Copyright 2026