
Effects of humic acid on copper adsorption onto few
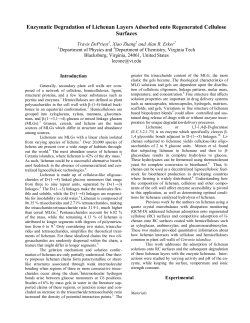
CARBON
7 5 ( 2 0 1 4 ) 2 2 7 –2 3 5
Available at www.sciencedirect.com
ScienceDirect
journal homepage: www.elsevier.com/locate/carbon
Effects of humic acid on copper adsorption onto
few-layer reduced graphene oxide and few-layer
graphene oxide
Shuang Yang a, Lingyun Li b, Zhiguo Pei a,*, Chunmei Li a, Xiao-quan Shan a, Bei Wen a,
Shuzhen Zhang a, Lirong Zheng c, Jing Zhang c, Yaning Xie c, Rixiang Huang d
a
State Key Laboratory of Environmental Chemistry and Ecotoxicology, Research Center for Eco-Environmental Sciences, Chinese Academy of
Sciences, PO Box 2871, Beijing 100085, China
b
Supervision and Testing Center for Vegetable Quality, Ministry of Agriculture, The Institute of Vegetables and Flowers, Chinese Academy of
Agricultural Sciences, Beijing 100081, China
c
Beijing Synchrotron Radiation Laboratory, Institute of High Energy Physics, Chinese Academy of Sciences, Beijing 100049, China
d
Department of Geology, Baylor University, One Bear Place #97354, Waco, TX 76798, USA
A R T I C L E I N F O
A B S T R A C T
Article history:
The effects of humic acid (HA) on copper (Cu(II)) adsorption onto few-layer reduced
Received 16 October 2013
graphene oxide (FRGO) and few-layer graphene oxide (FGO) were investigated using a batch
Accepted 29 March 2014
equilibration method, micro-Fourier transform infrared spectroscopy, and extended X-ray
Available online 5 April 2014
absorption fine structure spectroscopy (EXAFS). The results showed that HA was adsorbed
on FRGO through p–p interaction. The adsorbed HA introduced O-containing functional
groups and negative charges to FRGO surfaces, increasing Cu(II) adsorption through
chemical complexation and electrostatic attraction. In contrast, HA was adsorbed onto
FGO mainly through polar interactions, due to its rich O-containing functional groups.
The adsorbed HA had little effect on Cu(II) adsorption onto FGO because the shielding effect
of HA on Cu(II) adsorption was offset by newly introduced adsorption sites of HA on FGO.
EXAFS results suggested that Cu(II) was adsorbed on FRGO and FGO mainly through the
coordination with their O-containing functional groups. When HA was added at pH 4.0
and 6.0, more Cu(II) was adsorbed on HA-coated FRGO. At pH 8.0, a portion of Cu(II) in
solution precipitated on FRGO surface, while the presence of HA led to the formation of
FRGO-HA-Cu ternary surface complexes instead of Cu(II) precipitation.
Ó 2014 Elsevier Ltd. All rights reserved.
1.
Introduction
Graphene-based nanomaterials (GBNs) are ideal twodimensional materials with thickness of only one atomic
layer, and have recently attracted considerable attention
* Corresponding author: Fax: +86 10 62923563.
E-mail address: [email protected] (Z. Pei).
http://dx.doi.org/10.1016/j.carbon.2014.03.057
0008-6223/Ó 2014 Elsevier Ltd. All rights reserved.
due to their distinct and unique physicochemical properties
[1]. GBNs are considered promising candidates in many areas
of nanotechnological applications, including their use as
sorbents for the removal of recalcitrant contaminants from
water [2–8]. However, rapid increase in the production and
228
CARBON
7 5 ( 2 0 1 4 ) 2 2 7 –2 3 5
application of GBNs has triggered serious concerns about
their potential adverse effects on both the environment and
human health due to their inevitable release into the environment [9].
Humic acid (HA) is ubiquitous in natural waters and has
been found to interact with nanomaterials in the environment [10]. The interactions between HA and nanomaterials
not only alter the surface properties and environmental
behavior of these nanomaterials, but also affect the adsorption of coexisting contaminants [10,11]. Hyung et al. [12]
revealed that dissolved organic matter (DOM) could bind
with carbon nanotubes in aquatic systems through p–p interaction, and the steric and electrostatic stabilization offered
by DOM greatly enhanced their stability and transport in
water [13]. Shi et al. [14] reported that the presence of HA
helped inhibit the formation of fullerene aggregates and
increased its dispersion in solution, consequently atrazine
adsorption on fullerenes was enhanced. Additionally, HA
could also coat on the surface of titanium dioxide and ferroferric oxide nanoparticles, making removal of heavy metals
from water more effective [15,16]. As for GBNs, little information is available regarding the interactions between GBNs
and HA, and their subsequent effects on the adsorption of
coexisting contaminants. Previous studies usually examined
the adsorption of contaminants by GBNs in single solute system [17–22]. Results showed that graphene oxide was an
effective adsorbent for the removal of heavy metal from
water due to the coordination between metal ion and O-containing functional groups of graphene oxide [17–19]. In addition, the adsorption of lead on graphene was attributed to
the occurrence of electrostatic and Lewis acid–base interactions [23].
Though knowledge regarding HA interactions with carbon
nanotubes is noteworthy and can help interpret the interactions between HA and GBNs, differences between carbon
nanotubes and GBNs need to be considered. Compared to carbon nanotubes, GBNs are open layered structure and contain
carbons of different saturation degrees and oxidation states.
As a result, the differences in properties among GBNs are pronounced. Therefore, it is necessary to study the interactions
between HA and GBNs with different structures and properties, and to examine their effects on the adsorption of coexisting contaminants.
In this work, we chose few-layer reduced graphene oxide
(FRGO) and few-layer graphene oxide (FGO) with different pelectron density and O-containing functional groups as
adsorbents to examine the interactions of HA with FRGO
and FGO and their effects on Cu(II) adsorption. Cu(II) is an
essential element for life at low concentration, but is toxic
at high concentrations. It can be detected in most natural
settings and accumulate in soils to a high level through
the land application of fertilizers, sewage sludge, or wastewater irrigation [18]. The objectives of this study were (i) to
examine the adsorption of HA on FRGO and FGO, (ii) to
investigate the adsorption of Cu(II) on FRGO and FGO in
the absence and presence of HA, and (iii) to provide an
insight into the mechanisms of Cu(II) adsorption on FRGO
and FGO using extended X-ray absorption fine structure
spectroscopy (EXAFS).
2.
Experimental
2.1.
Materials
FGO was prepared by a modified Hummers method [24],
and FRGO was obtained by thermal exfoliation/reduction
using graphite oxide as a precursor [25]. Detailed process
has been provided in the ‘‘Supplementary data’’. Cu(NO3)2,
NaNO3, NaOH and HNO3 are of analytical grade and were
used as received. HA was isolated from a commercial peat
(Klasmann–Deilmann GmbH, Germany) according to the
procedure of the International Humic Substances Society
[26]. The obtained HA was dried, pulverized gently in a mortar to pass through a 0.25-mm sieve, and stored in a glass
vial at room temperature before use. The elemental compositions of HA are shown in Table S1. Solid-state 13C nuclear
magnetic resonance (NMR) spectrum was acquired using
cross-polarization and magic angle spinning on a 300-MHz
NMR spectrometer (Varian, San Francisco). Spectra were
acquired at a frequency of 75 MHz for 13C magic angle spinning rate of 13 kHz, contact time of 2 ms, 4 s recycle delay.
The number of scans was from 5000 to 10,000 per sample.
The results showed that percentages of aliphatic and aromatic carbon are 50.2% and 36.6%, respectively (Fig. S1
and Table S2).
2.2.
Characterization of FRGO and FGO
The surface functional groups of FRGO and FGO were determined by X-ray photoelectron spectroscopy (XPS) (PerkinElmer PHI 550 ESCA/SAM, U.S.) and Boehm titration [27,28].
Scanning electron microscope (SEM) images were obtained
on a field emission scanning electron microscope (SU-8020).
Transmission electron microscope (TEM) images were collected with a H-7500 (Hitachi, Japan). The size and thickness
of FRGO and FGO were measured by means of atomic force
microscopy (AFM) (Veeco Instrument Inc., Plainview, N.Y).
Nitrogen specific surface areas of FRGO and FGO were estimated using an accelerated surface area system and Brunauer–Emmett–Teller (BET) equation to adsorption of N2 at
77 K.
2.3.
Adsorption of HA on FRGO and FGO
HA solution (60.0 mg L 1) was prepared in 0.01 M NaNO3
solution, to which 0.1 g L 1 NaN3 was added to suppress
the potential growth of bacteria. The obtained HA solutions
were filtered through 0.22 lm membrane filter before use.
Adsorption of HA on FRGO and FGO as a function of solution
pH were performed by mixing a certain amount of FRGO
or FGO with 20.0 mL 0.01 M NaNO3 solution containing
30.0 mg L 1 HA in 50.0 mL polyethylene centrifuge tubes.
The pH was adjusted from 4.0 to 10.0 by the addition of
0.1 M HNO3 or NaOH. The suspension was rotated continuously for 24 h at 23.0 ± 1 °C (apparent equilibrium was
reached before this time, Fig. S2a). After centrifugation at
10,000 rpm for 20 min and filtration with a 0.22 lm membrane filter, HA concentrations in the filtrate were determined by an ultraviolet and visible spectrophotometer (U-
CARBON
3010, Hitachi, Japan) at 256 nm and calibrated with a total
organic carbon analyzer (Shimadzu, Japan). Preliminary
results showed no significant loss of HA after centrifugation
and filtration.
2.4.
HA
Adsorption of Cu(II) on FRGO and FGO as affected by
All adsorption experiments were conducted in triplicate
using a batch equilibration method at 23.0 ± 1 °C. Prior to
the initiation of Cu(II) adsorption, a certain amount of FRGO
or FGO was transferred to 50.0 mL polyethylene centrifuge
tubes, mixed with 10.0 mL different concentrations of HA
solution, and rotated continuously for 24 h. Afterwards,
different volumes of Cu(II) stock solution were added to
the tubes. The final volume of the equilibrium solution
was adjusted to 20.0 mL with 0.01 M NaNO3 solution. The
initial concentrations of Cu(II) were 0.1–2.5 mM, and the
initial concentrations of HA were 0, 15.0 and 30.0 mg L 1.
The suspension pH was adjusted to 5.0 ± 0.1 by addition of
0.1 M HNO3 or 0.1 M NaOH. The suspension was rotated
continuously for 24 h to ensure complete adsorption
(apparent equilibrium was reached before this time,
Fig. S2b). After centrifugation and filtration, the concentrations of Cu(II) in the filtrate were determined by inductively
coupled plasma atomic emission spectrometry (ICP-AES)
(IRIS Advantage, Thermo Elemental). The adsorbed Cu(II)
was calculated from the differences between the initial
and final equilibrium concentrations. Mass balance calculations were conducted by determining Cu(II) left in the equilibrium solution after Cu(II) adsorption onto FRGO or FGO,
and the adsorbed Cu(II) on FRGO or FGO, which was
extracted with 5.0% HNO3 solution (30 mL) for three times.
The total recovery was calculated from the sum of Cu(II) in
the solution phase and the adsorbed Cu(II) on FRGO or
FGO divided by the initial amount of Cu(II) added. The average recoveries of Cu(II) were P97.0% for both FRGO and FGO,
indicating that the loss of Cu(II) in the adsorption process
was negligible.
The pH effect on Cu(II) adsorption on FRGO or FGO in the
absence and presence (15.0 and 30.0 mg L 1) of HA was
conducted using a batch adsorption approach as mentioned
above. The initial concentration of Cu(II) was 0.2 mM. After
equilibrium was reached, suspension was centrifuged and
filtered, and Cu(II) concentrations in the filtrate were determined by ICP-AES.
2.5.
229
7 5 (2 0 1 4) 2 2 7–23 5
Electrophoretic mobilities (EPMs) measurement
The suspension for EPMs measurement was prepared by
mixing a certain amount of FRGO or FGO with 20.0 mL
0.01 M NaNO3 solution including different concentrations
of HA (0, 15.0 and 30.0 mg L 1). The solution pH was
adjusted using 0.1 M HNO3 or NaOH. The suspension was
rotated continuously for 24 h at room temperature
(23.0 ± 1 °C). The EPMs were determined on a ZetaSizer
Nano ZS (Malvern Instruments, Worcestershire, U.K.). Five
independent EPMs measurements were collected for each
sample to ensure accurate and reproducible data.
2.6.
Micro-Fourier
spectroscopy
transform
infrared
(l-FTIR)
l-FTIR spectra were recorded on NICOLET in 10 MX (Thermo
Scientific). Samples for l-FTIR analysis were prepared by mixing a certain amount of FRGO or FGO with 20.0 mL HA solution in polyethylene centrifuge tubes. After equilibrium, the
suspensions were centrifuged, and the supernatant was discarded. HA-adsorbed FRGO or FGO were washed with 0.01 M
NaNO3 solution, and then freeze-dried overnight. Microsamples were pressed on a diamond bracket and l-FTIR spectra
were measured. The resolution for l-FTIR spectra was
4 cm 1, and a total of 100 scans were collected for each spectrum. Difference spectra of HA-adsorbed samples were
obtained by subtracting the spectrum of sole FRGO or FGO
from the corresponding spectrum of HA-adsorbed FRGO or
FGO.
2.7.
X-ray absorption spectroscopy
The adsorbed samples were prepared according to above
adsorption procedures, where the initial concentrations of
Cu(II) and HA were 0.2 mM and 30.0 mg L 1, respectively.
Three pH values (4.0, 6.0 and 8.0) were selected in the experiments. After centrifugation, the supernatant was discarded.
Cu K-edge (8979 eV) X-ray absorption spectra of these wet
pastes were collected at 1W1B beamline of the Beijing Synchrotron Radiation Facility using a Si (1 1 1) double-crystal
monochromator. Data for all adsorption samples were collected in fluorescence mode under ambient conditions. An
average of three scans was performed to achieve an adequate
signal to noise ratio. The data were Fourier transformed over
˚ 1. Fitting was performed in k-space
k-region of 3.3–12.0 A
yielding optimal values for coordination numbers (N) and
atomic distances (R), energy offset (E0), and Debye–Waller factors (r2). Phase shifts and backscattering amplitudes were
obtained from theoretical calculations using FEFF 8.0 [29].
Data analysis was performed using program WinXAS 3.1.
2.8.
Isotherm models
Adsorption data were fitted to Freundlich and Langmuir equations using software Origin 7.5. Freundlich and Langmuir
equations can be expressed as Q = KfCn and Q = KLQmaxC/
(1 + KLC), respectively, where Q (mg g 1) is the amount of
adsorbed Cu(II) by FRGO and FGO, C (mg L 1) is the equilibrium concentration in solution, Kf is an empirical constant
related to adsorption capacity (mg(1 n) g 1 Ln), n is Freundlich
exponent, Qmax is maximum adsorption capacity (mg g 1),
and KL is adsorption equilibrium constant.
3.
Results and discussion
3.1.
Characterization of FRGO and FGO
The surface morphology of FRGO and FGO was characterized
by SEM and TEM. It is found that both FRGO and FGO are closely agglomerated together as thin and randomly aggregated
nanosheets (Fig. S3), and have typically wrinkled, sheet-like
7 5 ( 2 0 1 4 ) 2 2 7 –2 3 5
Adsorption of HA on FRGO and FGO
280
285
Binging energy (ev)
290
20
0
6
8
10
pH
Fig. 2 – Adsorption of HA on FRGO and FGO as a function of
solution pH. Initial concentration of HA was 30.0 mg L 1 in
0.01 M NaNO3 solution. Data are means of three separate
experiments. Error bars represent standard deviation.
shown in Fig. 2. Considering the different surface properties
of FRGO and FGO, it is significant that HA was adsorbed on
FRGO and FGO with different adsorption mechanisms. FRGO
has rich p electrons and hydrophobic surface. It is speculated
that p–p interaction and/or hydrophobic interaction are the
main driving force [12]. Compared to FRGO, FGO contains
fewer p-electrons, but more O-containing groups on its surfaces. It is possible that HA is adsorbed on FGO through polar
interactions with these functional groups of FGO.
To reveal the adsorption mechanisms of HA on FRGO and
FGO, a l-FTIR study was performed (Fig. 3). For FRGO, peak at
1581 cm 1 was assigned to benzene ring C@C stretching vibration (Fig. 3a). Peaks that appeared at 1734 and 1245 cm 1 were
the results of carboxyl C@O and epoxy C–O stretching vibrations, respectively. For HA, peak at 3367 cm 1 was assigned
to the –OH stretching vibration. The shoulder peak at
1713 cm 1 was assigned to the C@O stretch of –COOH group,
and the peak at 1632 cm 1 corresponded to the aromatic
C@C stretching vibration and the ketone C@O stretching vibration of HA [32,33]. When HA was adsorbed on FRGO (Fig. 3d), it
was found that the peaks of HA attributable to hydroxyl group
(3367 cm 1) and to carboxyl group (1713 cm 1) exhibited no
significant shift, suggesting that these polar groups were not
involved in adsorption. As a result, the shift of peak at
1632 to 1596 cm 1 can be attributed to the occurrence of
p–p interaction between aromatic moiety of HA and FRGO
surface. It is noticeable that p–p interaction weakens the
double band character of aromatic rings of HA and causes a
XPS intensity
288.9
287.3
285.9
XPS intensity
a
40
4
284.6
The adsorption of HA on FRGO and FGO as a function of pH is
shown in Fig. 2. The results show that the adsorption of HA on
both FRGO and FGO are pH-dependent, where their adsorption capacities decrease as pH increases. Compared to FRGO,
the pH-dependency of HA adsorption on FGO is more pronounced. This suggests the primary contribution of polar
interactions to the adsorption of HA, as FGO has higher density of polar groups (Fig. 1). With increasing solution pH, the
functional groups on both FGO/FRGO and HA become more
deprotonated (Fig. S6), the electrostatic repulsion between
them inhibits the adsorption of HA on FRGO and FGO, consistent with previous observations about HA adsorption on other
adsorbents [13,31].
In the examined pH range, it is found that FRGO showed
much larger adsorption capacity compared to that of FGO.
This is possibly because the relatively lower surface area of
FGO does not provide sufficient adsorption sites for HA. Interestingly, in terms of surface area normalized adsorption
capacity, the adsorption of HA on FGO was higher than that
on FRGO at pH < 6.5 (Fig. S7), which was opposite to the trend
FRGO
FGO
280
b
288.5
3.2.
60
286.8
structures (Fig. S4). BET analysis shows that the specific surface areas (ABET) of FRGO and FGO are 589.5 and 75.3 m2 g 1,
respectively. The thickness and size of FRGO and FGO were
measured by AFM (Fig. S5). The results show that the thickness of FRGO is 1.872 nm, corresponding to about 5 layers of
graphene, which is close to the calculated result (about 4.4
layers of graphene) using the scaling law: layer number = 2600/ABET [30]. The lateral length of FRGO is in the range
of 0.3–1.2 lm. For FGO, its thickness is 1.158 nm (about 3 layers of graphene), and the lateral length is 0.7–2.0 lm.
XPS provides useful information about surface functional
groups of FRGO and FGO. In Fig. 1a, the spectrum of FRGO
shows a dominant peak of sp2 C@C at 284.6 eV, which was
attributed to the graphitic structure. Several small peaks of
C–O at 285.9 eV, C@O at 287.3 eV, and OAC@O at 288.9 eV were
assigned to carbon atoms attached to different oxygen-containing moieties. The spectrum of FGO shows three types of
carbon bonds: the carbon sp2 C@C at 284.8 eV in the basal
plane of FGO, the carbon in C–O at 286.8 eV and the carbonyl
carbon in C@O at 288.5 eV (Fig. 1b). These results indicated
that the surface of FGO had large numbers of functional
groups.
284.8
CARBON
Adsorbed HA (mg g -1)
230
285
290
Binging energy (ev)
Fig. 1 – C1s XPS spectra of FRGO (a) and FGO (b).
d
e
f
g
3000
1622 1596 1584 1632 1581
1387 1383
1245
1245
3389
3380
3367
c
3410
4000
b
7 5 (2 0 1 4) 2 2 7–23 5
1645 1624
3393
Absorbance
3367
a
1729 1721 1725 1713 1734 1713 1734
3394
CARBON
2000
1000
Wavenumber (cm -1)
Fig. 3 – l-FTIR spectra of FRGO (a), HA (b), HA-adsorbed FRGO
(c), difference spectrum of HA adsorbed on FRGO (d), FGO (e),
HA-adsorbed FGO (f), and difference spectrum of HA
adsorbed on FGO (g).
red-shift of C@C stretching vibration bands (Fig. 3d). This finding is supported by Hyung and Kim [12], who indicated that p–
p interaction was the main driving force for the adsorption of
natural organic matter on multi-walled carbon nanotubes.
Furthermore, when HA is adsorbed on FRGO through p–p interaction, the hydrophobic surface of FRGO will be shielded by
the aromatic moiety of HA, leaving the polar moiety of HA
(carboxyl and phenolic groups, etc.) free in the opposite direction. The EMPs results revealed that ionization of these
adsorbed HA further increased the surface negatively charged
density of FRGO (Fig. S6a). As a result, the adsorbed HA
enhanced the steric and electrostatic stabilization of FRGO
and facilitated the dispersion of FRGO in aqueous solution.
As shown in Fig. S8, suspension of FRGO alone became transparent quickly after settling. When HA and FRGO were mixed
together, it is found the aqueous solution appeared dark and
turbid even after settling for 4 days, suggesting FRGO
remained suspending in solution in the presence of HA.
Compared to FRGO, l-FTIR results reveal that HA has different adsorption mechanism on FGO due to its less p electron
density and rich O-containing functional groups. For FGO, the
broad peak at 3380 cm 1 corresponded to –OH stretching
vibration (Fig. 3e). In low wavenumbers range, FTIR spectra
of FGO showed carboxyl C@O (1725 cm 1), aromatic C@C
(1622 cm 1), and carboxyl O@CAO (1383 cm 1) stretching
vibrations. When HA was adsorbed on FGO (Fig. 3f), the bands
of FGO at 3380 and 1725 cm 1 were shifted to 3389 and
1721 cm 1, suggesting the interaction between HA and FGO.
The difference spectrum of HA adsorbed on FGO was shown
in Fig. 3g, where the –OH stretching vibration, carboxyl C@O
and ketone C@O stretching vibration of HA shifted significantly from 3367, 1713 and 1632 to 3410, 1729 and
1645 cm 1, respectively, indicating that these polar functional
groups were involved in the adsorption of HA on FGO [34,35].
The effect of HA on the electrokinetic properties of FGO is
reported in Fig. S6. It is shown that the increase of HA concentrations had a negligible effect on the EMPs of FGO, consistent
with the result of Chowdhury et al. [36]. Addition of HA,
231
however, enhanced the stabilization of FGO in water
(Fig. S8). Because HA did not affect the EMPs of FGO, steric
repulsion imparted by the adsorbed HA macromolecules
may be the dominant mechanism in FGO stabilization [36,37].
3.3.
Effects of HA on Cu(II) adsorption
Adsorption isotherms of Cu(II) on FRGO and FGO in the
absence and presence of HA are shown in Fig. 4. Freundlich
and Langmuir models were applied to fit the adsorption data.
At the 95% confidence interval, it was found that the R2 values
of the Langmuir model were higher than those of the Freundlich model, indicating that the Langmuir model fitted the
adsorption data better than the Freundlich model (Table 1).
The Qmax values of Cu(II) adsorption on FRGO and FGO in
the absence of HA were 11.40 and 73.36 mg g 1 (Table 1),
respectively, suggesting that FGO was a more effective adsorbent for Cu(II) due to its numerous O-containing functional
groups [17,19]. Table S3 shows the amount of different O-containing functional groups (such as carboxyl, lactone, and
hydroxyl groups) on FGO. It was found that the content of carboxyl groups was higher than the sum of lactone and hydroxyl groups. Considering the strong complexation capability of
carboxyl groups, it was possible that carboxyl groups played a
more important role in Cu(II) adsorption than other O-containing functional groups.
When HA was added, it was found that the adsorption of
Cu(II) on FRGO increased with increasing initial HA concentrations from 0 to 30.0 mg L 1, suggesting that HA facilitated the
adsorption of Cu(II) on FRGO (Fig. 4a). Qmax was used to compare the adsorption of Cu(II) (Table 1). Obviously, Qmax values
increased from 11.40 to 18.60 mg g 1 when HA concentrations
increased from 0 to 30.0 mg L 1. As mentioned above, HA was
adsorbed on FRGO mainly through p–p interaction between
the aromatic fractions of HA and the aromatic surfaces of
FRGO, leaving O-containing functional groups (carboxyl and
phenolic groups, etc.) of HA available. Undoubtedly, the
adsorbed HA introduced more O-containing functional groups
and negative charges to FRGO surface, increasing the adsorption of Cu(II) through chemical complexation and electrostatic
attraction. In addition, the adsorbed HA increased FRGO dispersion in solution and made more adsorption sites on FRGO
available (Fig. S8), which also facilitated the adsorption of
Cu(II) on FRGO to some extent.
Compared to FRGO, the presence of HA had little effects on
the adsorption of Cu(II) on FGO (Fig. 4b), despite much HA had
been adsorbed on FGO at pH 5.0 (Fig. 2). To date, very limited
studies were available regarding the effects of HA on metal
adsorption on FGO [17,38]. As mentioned above, HA was
adsorbed on FGO through polar interactions. Obviously, these
adsorbed HA shielded the surface of FGO and occupied parts
of surface sites on FGO, which would decrease the adsorption
of Cu(II). Meanwhile, the adsorption of HA also introduced
new adsorption sites for metal adsorption because HA had
various functional groups that can bind Cu(II) [39]. Depending
on the properties of used HAs, HAs could impart different
effects on metal adsorption on FGO [17,38]. For example, Zhao
et al. [17] suggested that HA with high aromatic content
(57.0%) effectively shielded the FGO surface with its aromatic
moiety, and decreased the adsorption of cadmium and cobalt
7 5 ( 2 0 1 4 ) 2 2 7 –2 3 5
Adsorbed amount (mg g-1)
CARBON
a
20
16
12
8
-1
0 mg L HA
-1
15.0 mg L HA
-1
30.0 mg L HA
4
0
0
5
10
15
20
25
Adsorbed amount (mg g -1)
232
b
80
60
40
0 mg L-1 HA
15.0 mg L-1 HA
30.0 mg L-1 HA
20
0
0
30
-1
20
40
60
80
100
Eqilibrium concentrations (mg L-1 )
Eqilibrium concentrations (mg L )
Fig. 4 – Adsorption isotherms of Cu(II) on FRGO (a) and FGO (b) in the absence and presence of different concentrations of HA
in 0.01 M NaNO3 background electrolyte at pH 5.0 ± 0.1. Data are means of three separate experiments. Error bars represent
standard deviation. The solid lines are Langmuir model simulation, and the dashed lines are Freundlich model simulation.
Table 1 – Parameters for Langmuir and Freundlich models of Cu(II) adsorption on FRGO and FGO in the absence and presence
of HA.
HA concentrations (mg L 1)
Langmuir
Freundlich
Qmax
KL
R2
FRGO
0
15.0
30.0
11.40
13.40
18.60
0.49
0.65
0.46
0.99
0.99
0.97
FGO
0
15.0
30.0
73.36
79.64
82.91
0.11
0.09
0.09
0.97
0.98
0.99
n
R2
4.23
5.40
6.40
0.30
0.29
0.34
0.93
0.95
0.98
16.58
14.43
15.84
0.33
0.37
0.37
0.95
0.98
0.97
Kf
Statistical confidence interval was set at the 95% level.
a
20
10
-1
0 mg L HA
-1
15.0 mg L HA
-1
30.0 mg L HA
4
6
pH
8
10
that FA increased the adsorption sites on FGO surface and
facilitated the adsorption of Cu(II).
It is possible that solution pH may affect the surface
charge of adsorbents and the ionic species of metals. Therefore, the adsorption of Cu(II) on FRGO and FGO with or without HA at different equilibrium solution pH were also studied
(Fig. 5). In the single solute system, it is observed that adsorption of Cu(II) increased at pH 4.0–7.5, and then maintained
high loading level at pH > 7.5 (Fig. 5). The pH dependence of
adsorption reactions of Cu(II) was due, in part, to the
Adsorbed amount(mg g-1)
Adsorbed amount(mg g -1)
on FGO. In our case, the aromatic and carboxylic contents of
the HA are 36.6% and 13.1%, respectively. No striking changes
in Cu(II) adsorption on FGO by HA coating indicated that the
shielding effect of HA on Cu(II) adsorption was offset by the
newly introduced adsorption sites of HA on FGO (Fig. 4). To
further verify this conclusion, we chose fulvic acid (FA) to
study the effect of FA on Cu(II) adsorption on FGO. Compared
to HA, FA has higher polarity, lower aromaticity and is more
hydrophilic (Table S1) [38]. As shown in Fig. S9, the presence
of FA increased the adsorption of Cu(II) on FGO, suggesting
60
b
40
20
0
-1
0 mg L HA
-1
15.0 mg L HA
-1
30.0 mg L HA
4
6
8
pH
Fig. 5 – Effect of pH on Cu(II) adsorption on FRGO (a) and FGO (b) in the absence and presence of different concentrations of HA.
Initial concentrations of Cu(II) was 0.2 mM in 0.01 M NaNO3 background electrolyte. Data are means of three separate
experiments. Error bars represent standard deviation.
CARBON
preferential adsorption of hydrolyzed Cu(II) species in comparison to free Cu ion [40]. Another reason was that an
increase of solution pH increased the number of negatively
charged sites on FRGO and FGO, which further promoted
the adsorption of cationic Cu(II) (Fig. S6). When HA was
added, it was found that HA increased the adsorption of Cu(II)
significantly at pH < 8.0 on FRGO. At pH above 8.0, HA had little effect on the adsorbed amount of Cu(II) on FRGO (Fig. 5a).
In comparison, the presence of HA had negligible effects on
the adsorption of Cu(II) on FGO over the entire pH range
(Fig. 5b).
3.4.
233
7 5 (2 0 1 4) 2 2 7–23 5
EXAFS analysis
EXAFS was used to identify the surface complexation and the
coordination environment of adsorbed Cu(II) on FRGO and
FGO. Identification of such complex formation provides an
insight into the adsorption mechanisms and species of Cu(II).
The k3-weighted EXAFS spectra for the adsorbed Cu(II) on
FRGO and FGO at pH 4.0, 6.0 and 8.0, and reference sample
of aqueous Cu(II) ions are presented in Fig. 6a. Except sample
FRGO at pH 8.0, it was found that spectra of all samples were
dominated by a single sinusoidal wave mainly from the backscattering off of O atoms in the first atomic shell.
The corresponding radial structure functions (RSFs) are
shown in Fig. 6b. For all adsorbed samples, two peaks were
˚ . The first peak
observed in the RSF spectra at 1.5 and 2.5 A
˚
in the RSF spectra occurring at 1.5 A corresponds to the
backscattering oxygen atoms of the first shell. When Cu(II)
was adsorbed on FRGO without HA at pH 4.0 and 6.0, the
EXAFS fitting reveals that the Cu–O shell consists of 3.90
˚
and 4.01 O atoms at an effective Cu–O distance of 1.94 A
˚ is evidenced from Cu–C
(Table 2). The second peak at 2.5 A
backscatter. The best fit of the second shell leads to 2.32
˚ , respecand 3.0 C atoms at a bond distance of 2.92 and 2.91 A
tively, suggesting that Cu(II) was adsorbed on FRGO surfaces
mainly through the coordination with O-containing functional groups of FRGO rather than Lewis acid–base interaction
[23]. When solution pH was increased to 8.0 (Fig. 6b), the mag˚ ) increased. Compared to
nitude of the second peak (at 2.5 A
that at pH 4.0 and 6.0, it is found that this peak is a combination of Cu–C and Cu–Cu backscatter, including 7.0 C atoms at
˚ , and 3.60 Cu(II) atoms at a bond disa bond distance of 2.90 A
˚ (Table 2). The Cu–Cu bond distance is very
tance of 2.92 A
close to that in Cu(OH)2 [41]. Therefore, it is speculated that
a portion of Cu may precipitate from aqueous solution onto
FRGO surface at high pH range.
When Cu(II) was adsorbed on FRGO in the presence of HA
at pH 4.0 and 6.0, the fitting results showed that the coordinated C atom numbers of the second peak increased from
2.32 and 3.0 to 3.31 and 3.80, suggesting that more Cu(II)
was adsorbed on the coated HA (Table 2). When solution pH
was increased to 8.0, interestingly, it was found that the
˚ decreased compared to
intensity of the second peak at 2.5 A
that in the absence of HA (Fig. 6). The second shell was best
˚
fitted with 3.60 C atoms at an average distance of 2.94 A
(Table 2). This result indicated that the adsorbed HA increased
the amount of adsorption sites on FRGO and caused most of
Cu(II) to be adsorbed as FRGO-HA-Cu ternary surface complexes rather than precipitation.
When Cu(II) was adsorbed on FGO without HA, it is found
that an increase of solution pH had little effect on these RSF
spectra (Fig. 6). Fitting results show that 3.7 O atoms at a
˚ occur in the first shell peak and
bond distance of 1.94 A
a
b
FRGO pH 4
FRGO pH 6
χ(k) * k 3
FT magnitude
FRGO pH 8
FRGO-HA pH 8
FGO pH 4
FGO pH 6
FGO pH 8
Aqueous Cu
4
6
8
10
12
0
2
4
6
8
Fig. 6 – Raw (solid) and fitted (dashed) EXAFS spectra (v-function) (a) and Fourier transformation of EXAFS spectra (b) for the
adsorbed Cu(II) on FRGO and FGO at pH 4.0, 6.0 and 8.0, and Cu(II) reference compound of aqueous Cu(NO3)2.
234
CARBON
7 5 ( 2 0 1 4 ) 2 2 7 –2 3 5
Table 2 – EXAFS fitting results for adsorbed Cu on FRGO and FGO in the absence and presence of HA.
Samples
Cu–O shell
Cu–C shell
Cu–Cu shell
˚ )a
R (A
(±0.02)
Nb
(±20%)
˚ 2)c
r2 (A
(±0.0005)
˚ )a
R (A
(±0.02)
Nb
(±20%)
˚ 2)c
r2 (A
(±0.0005)
˚ )a
R (A
(±0.02)
Nb
(±20%)
˚ 2)c
r2 (A
(±0.0005)
FRGO
pH 4.0
pH 6.0
pH 8.0
1.94
1.94
1.95
3.90
4.01
4.20
0.003
0.005
0.004
2.92
2.91
2.90
2.32
3.00
7.00
0.006
0.007
0.008
2.92
3.60
0.01
FRGO-HA
pH 4.0
pH 6.0
pH 8.0
1.94
1.94
1.95
3.80
3.88
3.90
0.004
0.005
0.004
2.91
2.90
2.94
3.31
3.80
3.60
0.01
0.01
0.009
FGO
pH 4.0
pH 6.0
pH 8.0
1.95
1.94
1.94
3.58
3.76
3.82
0.003
0.005
0.005
2.90
2.92
2.91
2.52
3.43
2.92
0.006
0.010
0.011
FGO-HA
pH 4.0
pH 6.0
pH 8.0
1.95
1.94
1.94
3.57
3.78
3.84
0.003
0.004
0.004
2.90
2.90
2.92
2.69
3.45
3.17
0.009
0.011
0.009
Blank cells: no data. Estimated standard deviations of the least square fitting routine are given in parentheses.
Bond distances.
b
Coordination number.
c
Debye Waller factor.
a
˚ occur in the second
3.0 C atoms at a bond distance of 2.91 A
shell peak (Table 2). Compared to FRGO, the RSF spectra of
adsorbed Cu(II) on FGO at pH 8.0 was significantly different,
where the second peak mainly arose from Cu–C backscatter.
The results suggest that most of Cu(II) in solution was
adsorbed on FGO surfaces instead of precipitation because
more adsorption sites were available on GO surfaces. The
complexation information of Cu(II) on FGO in the presence
of HA was also examined (Table 2). It is found that the fitting
data are similar to that without HA, suggesting that Cu(II) was
adsorbed through the coordination with O-containing functional groups. However, it was difficult to distinguish these
functional groups from FGO or from the coated HA by EXAFS
alone.
4.
Conclusions
The present study showed HA was adsorbed on both FRGO
and FGO through different mechanisms, and consequently
exerted different effects on the adsorption of Cu(II) on FRGO
and FGO. The results suggested that HA was adsorbed on
FRGO mainly through p–p interaction. The adsorbed HA introduced O-containing functional groups and negative charges
to FRGO surface, increasing the adsorption of Cu(II) through
complexation and electrostatic attraction. While HA was
adsorbed on FGO through polar interactions. On the one
hand, these adsorbed HA shielded the surface of FGO and
occupied parts of surface sites on FGO, which would decrease
the adsorption of Cu(II). On the other hand, the adsorbed HA
can introduce new adsorption sites for Cu(II) adsorption onto
the FGO surface. Depending on the properties of HA, HA could
impart different effects on Cu(II) adsorption on FGO. In this
study, the results suggest that HA had little effect on Cu(II)
adsorption onto FGO. EXAFS results suggest that O-containing
functional groups of FRGO and FGO were the main
adsorption sites for Cu(II). Compared to FGO, FRGO had fewer
O-containing functional groups on its surfaces, which led to a
portion of Cu(II) precipitate on FRGO surfaces at pH 8.0. The
addition of HA increased the amount of adsorption sites on
FRGO, causing most of Cu(II) to be adsorbed on FRGO surfaces
as FRGO-HA-Cu ternary surface complexes at the examined
pH range.
Acknowledgments
This work was funded by National Natural Science Foundation of China (21277159), National Key Basic Research Program of China (973 Program) (2014CB441102), and National
Natural Science Foundation of China (41071308). The authors
thank Mr. Michael Nguyen for his improvement of the English
in this manuscript.
Appendix A. Supplementary data
Supplementary data associated with this article can be found,
in the online version, at http://dx.doi.org/10.1016/j.carbon.
2014.03.057.
R E F E R E N C E S
[1] Novoselov KS, Geim AK, Morozov SV, Jiang D, Zhang Y,
Dubonos SV. Electric field effect in atomically thin carbon
films. Science 2004;306:666–9.
[2] Zhao GX, Jiang L, He YD, Li JX, Dong HL, Wang XK. Sulfonated
graphene for persistent aromatic pollutant management.
Adv Mater 2011;23:3959–63.
CARBON
7 5 (2 0 1 4) 2 2 7–23 5
[3] Wu T, Cai X, Tan SZ, Li HY, Liu JS, Yang WD. Adsorption
characteristics of acrylonitrile, p-toluenesulfonic acid, 1naphthalene sulfonic acid and methyl blue on graphene in
aqueous solutions. Chem Eng J 2011;173:144–9.
[4] Ramesha GK, Vijaya KA, Muralidhara HB, Sampath S.
Graphene and graphene oxide as effective adsorbents toward
anionic and cationic dyes. J Colloid Interface Sci
2011;361:270–7.
[5] Chandra V, Park J, Chun Y, Lee JW, Hwang IC, Kim KS. Waterdispersible magnetite-reduced graphene oxide composites
for arsenic removal. ACS Nano 2010;4:3979–86.
[6] Mishra AK, Ramaprabhu S. Functionalized graphene sheets
for arsenic removal and desalination of sea water.
Desalination 2011;282:39–45.
[7] Chandra V, Kim KS. Highly selective adsorption of Hg2+ by a
polypyrrole-reduced graphene oxide composite. Chem
Commun 2011;47:3942–4.
[8] Kozlov SM, Vines F, Go¨rling A. On the interaction of polycyclic
aromatic compounds with graphene. Carbon
2012;50(7):2482–92.
[9] Sanchez VC, Jachak A, Hurt RH, Kane AB. Biological
interactions of graphene-family nanomaterials: an
interdisciplinary review. Chem Res Toxicol 2012;25:
15–34.
[10] Yang K, Xing BS. Sorption of phenanthrene by humic acidcoated nanosized TiO2 and ZnO. Environ Sci Technol
2009;43:1845–51.
[11] Tian XL, Li TT, Yang K, Xu Y, Lu HF, Lin DH. Effect of humic
acids on physicochemical property and Cd(II) sorption of
multiwalled carbon nanotubes. Chemosphere
2012;89:1316–22.
[12] Hyung H, Fortner JD, Hughes JB, Kim JH. Natural organic
matter stabilizes carbon nanotubes in the aqueous phase.
Environ Sci Technol 2007;41:179–84.
[13] Hyung H, Kim JH. Natural organic matter (NOM) adsorption
to multiwalled carbon nanotubes: effect of NOM
characteristics and water quality parameters. Environ Sci
Technol 2008;42:4416–21.
[14] Gai K, Shi BY, Yan XM, Wang DS. Effect of dispersion on
adsorption of atrazine by aqueous suspensions of fullerenes.
Environ Sci Technol 2011;45:5959–65.
[15] Chen QQ, Yin DQ, Zhu SJ, Hu XL. Adsorption of cadmium(II)
on humic acid coated titanium dioxide. J Colloid Interface Sci
2012;367:241–8.
[16] Liu JF, Zhao ZS, Jiang GB. Coating Fe3O4 magnetic
nanoparticles with humic acid for high efficient removal
of heavy metals in water. Environ Sci Technol
2008;42:6949–54.
[17] Zhao G, Li JX, Ren XM, Chen CL, Wang XK. Few-layered
graphene oxide nanosheets as superior sorbents for heavy
metal ion pollution management. Environ Sci Technol
2011;45:10454–62.
[18] Yang ST, Chang YL, Wang HF, Liu GB, Chen S, Wang YW, et al.
Folding/aggregation of graphene oxide and its application in
Cu2+ removal. J Colloid Interface Sci 2010;351:122–7.
[19] Sun YB, Wang Q, Chen CL, Tan XL, Wang XK. Interaction
between Eu(III) and graphene oxide nanosheets investigated
by batch and extended X-ray absorption fine structure
spectroscopy and by modeling techniques. Environ Sci
Technol 2012;46:6020–7.
[20] Deng XJ, Lv LL, Li HW, Luo F. The adsorption properties of
Pb(II) and Cd(II) on functionalized graphene prepared by
electrolysis method. J Hazard Mater 2010;183:923–30.
[21] Gao W, Majumder M, Alemany LB, Narayanan TN, Ibarra MA,
Pradhan BK, et al. Engineered graphite oxide materials for
application in water purification. ACS Appl Mater Interfaces
2011;3:1821–6.
235
[22] Madadrang CJ, Kim HY, Gao GH, Wang N, Zhu J, Feng H, et al.
Adsorption behavior of EDTA-graphene oxide for Pb(II)
removal. ACS Appl Mater Interfaces 2012;4:1186–93.
[23] Huang ZH, Zheng XY, Lv W, Wang M, Yang QH, Kang FY.
Adsorption of lead(II) ions from aqueous solution on lowtemperature exfoliated graphene nanosheets. Langmuir
2011;27:7558–62.
[24] Chen CM, Yang QH, Yang YG, Lv W, Wen YF, Hou PX, et al.
Self-assembled free-standing graphite oxide membrane. Adv
Mater 2009;21:3007–11.
[25] Chen CM, Zhang Q, Yang MG, Huang CH, Yang YG, Wang MZ.
Structural evolution during annealing of thermally reduced
graphene nanosheets for application in supercapacitors.
Carbon 2012;50:3572–84.
[26] Swift RS. Organic matter characterization. In: Sparks DL,
editor. Methods of soil analysis. Part 3. Chemical methods.
Soil Sci. Soc. Am. Book Series, vol. 5. Madison, WI: SSSA;
1996. p. 1018–20.
[27] Boehm HP. Some aspects of the surface chemistry of carbon
blacks and other carbons. Carbon 1994;32:759–69.
[28] Boehm HP. Surface oxides on carbon and their analysis: a
critical assessment. Carbon 2002;40:145–9.
[29] Zabinsky SI, Rehr JJ, Ankudinov A, Albers RC, Eller MJ.
Multiple-scattering calculations of X-ray absorption spectra.
Phys Rev B 1995;52:2995–3009.
[30] Guo F, Creighton M, Chen YT, Hurt R, Ku¨laots I. Porous
structures in stacked, crumpled and pillared graphene-based
3D materials. Carbon 2014;66:476–84.
[31] Li FS, Yuasa A, Ebie K, Azuma Y, Hagishita T, Matsui Y. Factors
affecting the adsorption capacity of dissolved organic matter
onto activated carbon: modified isotherm analysis. Water Res
2002;36:4592–604.
[32] Pe´rez MG, Martin-Neto L, Saab SC, Novotny EH, Milori D,
Bagnato VS, et al. Characterization of humic acids from a
Brazilian Oxisol under different tillage systems by EPR, 13C
NMR, FTIR and fluorescence spectroscopy. Geoderma
2004;118:181–90.
[33] Amir S, Jouraiphy A, Meddich A, Gharous ME, Winterton P,
Hafidi M. Structural study of humic acids during composting
of activated sludge-green waste: elemental analysis, FTIR
and 13C NMR. J Hazard Mater 2010;177:524–9.
[34] Hartono T, Wang SB, Ma Q, Zhu ZH. Layer structured graphite
oxide as a novel adsorbent for humic acid removal from
aqueous solution. J Colloid Interface Sci 2009;333:114–9.
[35] Lin-Vien D, Colthup NB, Fateley WG, Grasselli JG. The
handbook of infrared and raman characteristic frequencies
of organic molecules. New York: Academic; 1991.
[36] Chowdhury I, Duch MC, Mansukhani ND, Hersam MC,
Bouchard D. Colloidal properties and stability of graphene
oxide nanomaterials in the aquatic environment. Environ Sci
Technol 2013;47:6288–96.
[37] Fu HY, Zhu DQ. Graphene oxide-facilitated reduction of
nitrobenzene in sulfide-containing aqueous solutions.
Environ Sci Technol 2013;47:4204–10.
[38] Li J, Zhang SW, Chen CL, Zhao GX, Yang X, Li JX, et al.
Removal of Cu(II) and fulvic acid by graphene oxide
nanosheets decorated with Fe3O4 nanoparticles. ACS Appl
Mater Interfaces 2012;4:4991–5000.
[39] Wang XL, Lu JL, Xing BS. Sorption of organic contaminants by
carbon nanotubes: influence of adsorbed organic matter.
Environ Sci Technol 2008;42:3207–12.
[40] McLean JE, Eledsoe BE. Behavior of metals in soils. Ground
water issue, EPA/540/S-92/018; The United States
Environmental Protection Agency: Washington, DC; 1992.
[41] Cheah SF, Brown Jr GE, Parks GA. XAFS study of Cu model
compounds and Cu2+ sorption products on amorphous SiO2,
c-Al2O3, and anatase. Am Miner 2000;85:118–32.


© Copyright 2026