
Provisional PDF - Chemistry Central Journal
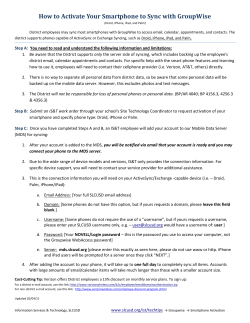
Khatri et al. Chemistry Central Journal (2015) 9:29
DOI 10.1186/s13065-015-0109-0
RESEARCH ARTICLE
Open Access
Diverse models for anti-HIV activity of purine
nucleoside analogs
Naveen Khatri1, Viney Lather2 and A K Madan1*
Abstract
Background: Purine nucleoside analogs (PNAs) constitute an important group of cytotoxic drugs for the treatment of
neoplastic and autoimmune diseases. In the present study, classification models have been developed for the prediction
of the anti-HIV activity of purine nucleoside analogs.
Results: The topochemical version of superaugmented pendentic index-4 has been proposed and successfully utilized
for the development of models. A total of 60 2D and 3D molecular descriptors (MDs) of diverse nature were selected
for building the classification models using decision tree (DT), random forest (RF), support vector machine (SVM), and
moving average analysis (MAA). The values of most of these descriptors for each of the analogs in the dataset were
computed using the Dragon software (version 5.3). An in-house computer program was also employed to calculate
additional MDs which were not included in the Dragon software. DT, RF, and SVM correctly classified the analogs into
actives and inactives with an accuracy of 89 %, 83 %, and 78 %, respectively. MAA-based models predicted the anti-HIV
activity of purine nucleoside analogs with a non-error rate up to 98 %. Therapeutic active spans of the suggested
MAA-based models not only showed more potency but also exhibited enhanced safety as revealed by comparatively
high values of selectivity index (SI). The statistical importance of the developed models was appraised via
intercorrelation analysis, specificity, sensitivity, non-error rate, and Matthews correlation coefficient.
Conclusions: High predictability of the proposed models clearly indicates an immense potential for developing
lead molecules for potent but safe anti-HIV purine nucleoside analogs.
Keywords: Anti-HIV activity, Superaugmented pendentic topochemical index, Balaban-type index from
Z-weighted distance matrix, Moving average analysis, Purine nucleoside analogs, Support vector machine
Background
The drug design and development process involves the use
of a variety of computational techniques, such as (quantitative) structure-activity relationships [(Q)SAR], molecular
mechanics, quantum mechanics, molecular dynamics, and
drug-receptor docking [1, 2]. (Q)SAR studies are based on
the premise that biological response is a function of the
chemical structure [3, 4]. (Q)SAR models reveal a relationship between the structural characteristics of the compounds and their biological activity or environmental
behavior [5, 6]. (Q)SAR models predict chemical behavior
and simulate adverse effects in laboratory animals, tissues,
and cells directly from the chemical structure. This will
naturally minimize the need to conduct animal tests so as
* Correspondence: [email protected]
1
Faculty of Pharmaceutical Sciences, Pt. B. D. Sharma University of Health
Sciences, Rohtak 124001, India
Full list of author information is available at the end of the article
to comply with the regulatory requirements for human
health and eco-toxicology endpoints [7, 8]. The main hypothesis in (Q)SAR is that similar chemicals have similar
properties, and even a minor structural change(s) will
result in a change in property value(s) [9]. SAR represents
classification models that are used when an empirical
property is characterized in a (+1/−1) manner, such as soluble/insoluble, active/inactive, toxic/non-toxic, permeable/
impermeable, inhibitor/non-inhibitor, ligand/non-ligand,
substrate/non-substrate, mutagen/non-mutagen, polar/
non-polar, or carcinogen/non-carcinogen [10–15]. In silico
screening constitutes a vital cost-effective high-throughput
process for providing a rapid indication of potential hazards for use in lead prioritization [16].
Machine learning (ML) constitutes a vital area of artificial intelligence (AI) in which models are simply generated by extracting rules and functions from relatively
large datasets. ML comprises diverse methods and
© 2015 Khatri et al.; licensee Springer. This is an Open Access article distributed under the terms of the Creative Commons
Attribution License (http://creativecommons.org/licenses/by/4.0), which permits unrestricted use, distribution, and
reproduction in any medium, provided the original work is properly credited. The Creative Commons Public Domain
Dedication waiver (http://creativecommons.org/publicdomain/zero/1.0/) applies to the data made available in this article,
unless otherwise stated.
Khatri et al. Chemistry Central Journal (2015) 9:29
algorithms such as decision trees, general CHAID
models, k-nearest neighbors, random forests, Bayesian
methods, Gaussian processes, artificial neural networks
(ANN), artificial immune systems, kernel algorithms,
and support vector machines (SVMs). ML algorithms
extract relevant information from empirical dataset
through computational/statistical techniques and generate a set of rules, functions, or procedures that allow
them to predict the properties of novel objects which
have not been included in the learning set. (Q)SAR
models derived through ML algorithms are subsequently applied during the drug development process
so as to optimize the therapeutic activity, target selectivity, and related physico-chemical and biological properties of the selected molecules [10, 17, 18]. The
advantage of AI approaches is that they can be easily
applied to learn from examples and to evolve suitable
prophesy models in spite of the limited understanding of
the underlying molecular processes. The AI approach is
also beneficial whenever computational simulations based
on fundamental physical models are too expensive to perform [19, 20].
AIDS is one of the most urgent global health problems and is the leading cause of death in Africa and the
fourth leading cause of death across the world. Highly
active antiretroviral therapy (HAART) has gained considerable success in Western countries. The anti-HIV
drug evolution process resembles a crystal ball and
involves a plenty of astonishment, expectations, and
disappointments. Unfortunately, we continue to be
dependent on the predictions of the crystal ball. All of
the currently available anti-HIV drugs are far from
ideal, and we still face problems of acute and chronic
side effects, patient compliance issues, drug resistance,
cost, and potency. Hopes of long-term management
and eradication depend on increasing available therapeutic options [21, 22].
Purine nucleoside analogs (PNAs) constitute an important group of cytotoxic drugs for the treatment of
neoplastic and autoimmune diseases [23]. 9-[4-α(Hydroxymethyl)cyclopent-2-ene-1-α-yl]guanine (CBV),
(−)-β-D-(2R,4R)-1,3-dioxolane-guanosine (DXZ), 3′-azido-3′deoxy-guanosine (AZG), and 2′-C-methylguanosine are all known for their reverse transcriptase inhibiting
activity [24]. 3,9-Dihydro-9-dioxo-5H-imidazo(1,2-A) purine nucleosides synthesized from these nucleosides have
shown improved anti-HIV activity [25].
In the present study, models of diverse nature have
been developed through decision tree (DT), random forest (RF), support vector machine (SVM), and moving
average analysis (MAA) using molecular descriptors
(MDs) as independent variables for the prediction of the
anti-HIV activity of purine nucleoside analogs in human
peripheral blood mononuclear (PBM) cells.
Page 2 of 10
Methods
Dataset
A dataset comprising 36 purine nucleoside analogs was
selected for the present investigation (Fig. 1 and Table 1).
The anti-HIV activity of these analogs in human PBM
cells has been reported in terms of EC50 (effective concentration against 50 % of cell population) by Amblard
et al. [25]. The nucleoside analog DXZ possessing an
EC50 value of 0.51 μM is well known for its anti-HIV
activity. DXZ was considered as a reference compound
[24]. Accordingly, analogs possessing EC50 values of
≤0.51 μM were considered to be active and analogs possessing EC50 values of >0.51 μM were considered to be
inactive for the purpose of the present study.
Molecular descriptors
The MDs used in the current study include constitutional, physico-chemical, topostructural, topochemical,
and topological charge indices, walk and path counts,
information-based indices, and a wide variety of 3D
descriptors. The majority of 2D and 3D MDs utilized in
the present study were calculated using the Dragon software (version 5.3). Most of these MDs are reviewed in
the textbook by Todeschini and Consonni [26]. An in-
Fig. 1 Basic structures of purine nucleoside analogs from serial
number 1 to 36 [25]
Khatri et al. Chemistry Central Journal (2015) 9:29
Page 3 of 10
Table 1 Relationship between molecular descriptors and anti-HIV activity in human PBM cells
Serial
Basic
Substituent (R)
number structure
of
compound
A2
1
3-[4-(Hydroxymethyl)-2-cyclopent-1-yl]
0.919
0.922
I
A4
A23
A37
Anti-HIV activity in human PBM cells
(EC50)
Predicted
3.287
9.61
2.16
Reported [25]
A2
A4
A23
A37
+
+
±
−
+
2
I
3-(β-D-1,3-Dioxolanyl)
9.982
2.254 +
+
±
−
+
3
I
3-(3-Azido-2,3-dideoxy-β-D-erythro-pentofuranosyl) 0.903
4.599
50.599
2.197 +
+
+
−
+
4
I
3-(β-D-2-C-Methyl-ribofuranosyl)
0.848
0.001
615.521
2.332 −
−
−
−
−
5
II
4-MeO-Ph
0.973 11.666
4.866
1.596 −
−
−
−
−
6
II
4-Me-Ph
0.972 11.15
5.338
1.614 −
−
−
−
−
7
II
4-Br-Ph
0.97
3.883
1.631 −
−
−
−
−
3.1
11.545
8
II
4-NEt2-Ph
0.976 14.051
43.583
1.531 −
−
+
+
+
9
II
4-NMe2-Ph
0.976 12.597
43.44
1.573 −
−
+
+
+
10
II
2-Thiophenyl
0.968
9.999
5.937
1.655 −
−
−
−
−
11
II
3-Thiophenyl
0.969 10.637
5.223
1.641 −
−
−
−
−
12
III
Et
0.945
6.157
7.307
1.938 −
−
−
−
−
13
III
Ph
0.971
9.869
2.313
1.674 −
−
−
−
−
14
III
4-MeO-Ph
0.974 11.602
4.849
1.627 −
−
−
−
−
15
III
3-MeO-Ph
0.974 10.545
5.38
1.652 −
−
−
−
−
16
III
2-MeO-Ph
0.97
9.834
6.121
1.678 −
−
−
−
−
17
III
4-Me-Ph
0.973 11.081
5.436
1.648 −
−
−
−
−
18
III
4-Cl-Ph
19
III
20
III
2,4-F-Ph
0.971 10.969
35.94
1.672 −
−
±
−
−
21
III
4-NEt2-Ph
0.974 13.458
44.566
1.555 −
−
+
+
+
44.599
1.601 −
−
+
−
−
−
−
−
−
−
4-F-Ph
0.971 11.307
4.712
1.661 −
−
−
−
−
0.971 10.929
5.132
1.655 −
−
−
−
−
22
III
4-NMe2-Ph
0.976 12.544
23
III
2-Thiophenyl
0.969
9.92
24
III
3-Thiophenyl
0.97
9.951
5.261
1.675 −
−
−
−
−
25
III
4-N3-Ph
0.961 12.091
4.532
1.611 −
−
−
−
−
26
III
4-CN-Ph
0.975 12.57
4.893
1.626 −
−
−
−
−
27
IV
Ph
0.939
6.494
1.645 −
−
−
−
−
28
IV
4-MeO-Ph
0.889
1.923
39.143
1.609 −
−
±
−
−
29
IV
4-NEt2-Ph
0.907
4.048
357.424
1.551 +
+
+
+
+
0.566
6.049
1.69
30
IV
4-NMe2-Ph
0.901
2.76
344.712
1.589 +
+
+
+
+
31
V
Et
0.878
0.018
993.843
1.986 −
−
−
−
−
32
V
4-MeO-Ph
0.937
0.982 1972.793
1.663 −
−
−
−
−
33
V
4-NEt2-Ph
2.345
0.94
16,083.229 1.594 −
−
−
−
−
34
V
4-NMe2-Ph
0.983
0.939 12,785.121 1.639 −
−
−
−
−
35
V
2-Thiophenyl
0.123
0.923 2081.689
1.72
−
−
−
−
−
36
V
3-Thiophenyl
0.122
0.923 2059.054
1.706 −
−
−
−
−
+, active; −, inactive; ±, transitional
house computer program was also employed to calculate
MDs which were not included in the Dragon software.
Initially, MDs with significant degenerate values were
omitted from the large pool of MDs calculated through
both the Dragon software and the in-house computer
program. For the remaining MDs, a pairwise correlation
analysis was carried out (one of any two indices with r ≥
0.90 was excluded to minimize redundant information).
The abovementioned exclusion technique was utilized to
decrease the correlation and collinearity between MDs.
Khatri et al. Chemistry Central Journal (2015) 9:29
Finally, 60 MDs, enlisted in Table 2, were short-listed for
the development of models.
Page 4 of 10
Table 2 List of molecular descriptors
Code Name of descriptor
A1
Eccentricity index, ECC
A2
Spherocity index, SPH
A3
Molecular connectivity topochemical index, χA
A4
Shape profile no. 20, SP20
A5
Shape profile no. 07, SP07
A6
Shape profile no. 08, SP08
A7
Eccentric adjacency topochemical index
A8
Radial distribution function - 10.5/weighted by atomic masses,
RDF105m
A9
Second Zagreb index M2, ZM2
A10
Augmented eccentric connectivity topochemical index, Aξc
A11
Mean information content on the distance magnitude, IDM
A12
Molecular profile no. 10, DP10
A13
Molecular profile no. 11, DP11
A14
Molecular profile no. 12, DP12
A15
Molecular profile no. 13, DP13
A16
Molecular profile no. 14, DP14
A17
Radius of gyration (mass weighted), RGyr
A18
Eccentric connectivity topochemical index, ξc
A19
Connective eccentricity topochemical index, Cξ
A20
Average vertex distance degree, VDA
A21
Mean square distance index (Balaban), MSD
A22
Schultz molecular topological index, SMTI
A23
Superaugmented pendentic topochemical index-4, SA∫P-4c
Random forest
A24
Gutman MTI by valence vertex degrees, GMTIV
RF is a well-known ensemble of unpruned trees generated through the systematic use of bootstrap samples of
the training data for building forests (multiple trees) and
random subsets of variables to facilitate the best possible
bifurcation at each node [31, 32]. In the present study,
the RFs were grown with the R program (version 2.10.1)
using the random forest library.
A25
Xu index, Xu
A26
Mean Wiener index, WA
A27
Superadjacency topochemical index, ∫AC(G)
A28
Harary H index, Har
A29
Quasi-Wiener index (Kirchhoff number), QW
A30
First Mohar index, TI1
A31
Weiner’s topochemical index, Wc
A32
Reciprocal hyper-detour index, Rww
A33
Distance/detour index, D/D
A34
All-path Wiener index, Wap
A35
Superaugmented eccentric connectivity topochemical index-3, SAcξc3
A36
Wiener-type index from Z-weighted distance matrix
(Barysz matrix), WhetZ
A37
Balaban-type index from Z-weighted distance matrix (Barysz matrix),
JhetZ
A38
Maximal electrotopological negative variation, MAXDN
A39
Molecular electrotopological variation, DELS
A40
Superaugmented eccentric connectivity topochemical index-4, SAcξc4
A41
Three-path Kier alpha-modified shape index, S3K
A42
Centralization, CENT
Statistical methods
Decision tree
DT is a common method that provides both classification and predictive functions simultaneously. A single
DT was grown for the prediction of anti-HIV activity
and to identify the importance of various MDs used for
the present study. A cutoff value dividing the compounds of the dataset into active and inactive with
regard to anti-HIV activity was assigned to each MD for
every compound. Then, a single MD is identified that split
the entire training set into two or more homogenous
subsets and shows the lowest possible false assignment before being chosen as parent node. The molecules at each
parent node are classified, based on the MD value, into
two child nodes, and the resulting child nodes or subsets
are split into sub-subsets, generally using different MDs.
The majority vote of the molecules reaching the same terminal node in the training set decides the prediction for a
molecule to reach a given terminal node. In this manner,
DT created an interactive branching topology in which the
branch taken at each intersection is determined by a rule
related to a MD of the molecule, and lastly, each terminating leaf of the tree is assigned to a particular category, i.e.,
A (active) or B (inactive) [27–30]. In the present study,
RPART library was added in R program (version 2.10.1) to
grow DT.
Support vector machine
SVM is a relatively new classification technique. SVM
involves drawing a boundary between groups of samples that fall into different classes. The SVM methodology comprised reducing the pool of 30 descriptors to
a smaller size by eliminating the related variables,
followed by development of classification models [33,
34]. Statistica v. 7.0 was used for the generation of
SVM models. The classification models were generated
using the training set of compounds followed by the
validation of the best model using the test set of compounds [35]. Every third compound of the dataset was
included in the test set. SVM model validity was also
checked by cross-validation, i.e., leave-one-out method.
SVM models were also validated by tenfold cross-
Khatri et al. Chemistry Central Journal (2015) 9:29
Table 2 List of molecular descriptors (Continued)
A43
Distance/detour ring index of order 9, D/Dr09
A44
Molecular connectivity index, χ
A45
Eigenvalue 11 from edge adjacency matrix weighted by
resonance integrals, EEig11r
A46
Average geometric distance degree, AGDD
A47
Absolute eigenvalue sum on geometry matrix, SEig
A48
Eccentric adjacency index, ξΑ
A49
3D-MoRSE - signal 26/unweighted, Mor26u
A50
3D-MoRSE - signal 25/weighted by atomic Sanderson
electronegativities, Mor25e
A51
Augmented eccentric connectivity index, Aξc
A52
First component size directional WHIM index/unweighted, L1u
A53
K global shape index/weighted by atomic Sanderson
electronegativities, Ke
A54
Superpendentic index, ∫P
A55
Mean information content on the leverage magnitude, HIC
A56
H total index/weighted by atomic van der Waals volumes, HTv
A57
R maximal autocorrelation of lag 1/weighted by atomic
Sanderson electronegativities, R1e+
A58
R total index/weighted by atomic polarizabilities, RTp
A59
Superaugmented eccentric connectivity index-1, SAξc1
A60
Weiner’s index, W
Most of the Dragon descriptors are largely defined in ref. [26]
validation. The kernel type that was adopted in the
present work was the polynomial function. The first
task was the assignment of each molecule to one class,
namely ‘actives’ or ‘inactives’ based on the cutoff value
(EC50 = 0.51 μM) of the reference compound.
Moving average analysis
MAA was utilized so as to facilitate the construction of
single MD-based models for predicting the anti-HIV
activity of purine nucleoside analogs. For the selection
and evaluation of range-specific characteristics, exclusive activity ranges were determined from the frequency distribution of therapeutic response level. This
was accomplished by initially plotting the relationship
between index values and anti-HIV activity and subsequently identifying the active range by scrutinizing the
resultant data by maximization of moving average with
regard to active purine nucleoside analogs (<35 % = inactive, 35 % to 65 % = transitional, and >65 % = active)
[36]. Biological activity was assigned to each analog
involved in the dataset, which was subsequently compared with the reported anti-HIV activity (Table 1).
Average values of EC50 and selectivity index (SI) were
calculated for each range of the proposed models.
Page 5 of 10
Model validation
DT-based models were validated using the tenfold
cross-validation (CV) method [37]. The performance
of the proposed models was evaluated by calculating
the overall accuracy of prediction, sensitivity, specificity, non-error rate (arithmetic mean of sensitivity and
specificity) [38, 39], and Matthews correlation coefficient (MCC) [40]. MCC is generally regarded as being
one of the best statistical techniques which account for
both over- and underprediction. MCC takes both sensitivity and specificity into account, and its value ranges
from −1 to +1. Higher values of MCC indicate better predictions [41, 42]. The statistical importance of MDs used
in building predictive models was also appraised by
intercorrelation analysis. The degree of correlation was
appraised by Spearman’s rank correlation coefficient ‘r’.
Pairs of MDs with r ≥ 0.97 are considered to be highly
inter-correlated while those with 0.68 ≤ r ≤ 0.97 to be appreciably correlated; MDs with 0.36 ≤ r ≤ 0.67 are weakly
correlated whereas the pairs of MDs with low r values
(<0.35) are not inter-correlated [43, 44].
Results and discussion
AIDS is the fourth leading cause of death worldwide.
Inhibition of the human immunodeficiency virus and
sustained suppression of viral replication reduce morbidity and prolong life in patients with HIV infection. This
virus is therefore a major target for the structure-based
inhibitors design.
Finding that the structure of a molecule has an important role in its therapeutic activity coupled with the
need for safer potent drugs to be developed with minimum animal sacrifice, expenditure, and time loss has led
to the origin of structure-activity relationship (SAR)
studies [45]. The inherent problem in the development
of a suitable correlation between chemical structures
and biological activity can be attributed to the nonquantitative nature of chemical structures. MDs translate chemical structures into characteristic numerals
and facilitate (Q)SAR studies [46, 47].
In the present study, the relationship between antiHIV activity and the structure of purine nucleoside analogs has been investigated and suitable models developed using diverse classification techniques, i.e., DT,
RF, SVM, and MAA. DT was built from a set of 60
MDs enlisted in Table 2. The MD at the originating
node is the most significant, and the significance of
MD decreases with the gradual increase in the tree
height [27–30]. The classification of purine nucleoside
analogs as inactive and active using a single tree, based
on the Balaban-type index from Z-weighted distance
matrix, A37, JhetZ index, and mean information content on the distance magnitude, A11, IDM index, has
Khatri et al. Chemistry Central Journal (2015) 9:29
been depicted in Fig. 2. The DT identified the Balabantype index from Z-weighted distance matrix, A37, JhetZ
index, as the most important index.
A37, i.e., the Balaban-type index from Z-weighted distance matrix, JhetZ index, is based on the Barysz matrix
and was developed by Barysz et al. It may be expressed
as per the following:
!
q XG
1
pffiffiffiffiffiffiffiffi
JB ¼
edges
ðμ þ 1Þ
Si Sj
where SiSj represents the product of the distance sums
of the adjacent pairs of vertices i and j in a graph G. The
cycloatomic number of the graph is represented by μ,
and it indicates the number of independent cycles in the
graph [48, 49].
The DT classified the analogs with an accuracy of
>99.9 % in the training set. The sensitivity, specificity,
non-error rate, overall accuracy of prediction, and MCC
of the tenfold cross-validated set was of the order of
75 %, 93 %, 84 %, 89 %, and 0.68, respectively (Table 3).
A high value of MCC simply indicates the robustness of
the proposed DT-based model.
A11, i.e., mean information content on the distance
magnitude, IDM index, is one of the information indices
reported by Bonchev et al. It may be expressed as per
the following:
Page 6 of 10
I W ¼ −
D
XG n
n
log2
W
W
where W is the Wiener index, kn is the number of distances of equal n value in the triangular submatrix D,
and G is the maximum distance value [50].
The RFs were grown utilizing 60 MDs as enlisted in
Table 1. The RF classified purine nucleoside analogs with
regard to anti-HIV activity with an accuracy of 83 % and
the out-of-bag (OOB) estimate of error was 17 %. The sensitivity, specificity, non-error rate, accuracy of prediction,
and MCC value of the RF-based model for the tenfold
cross-validated set were found to be 62.5 %, 89 %, 75.7 %,
83 %, and 0.52, respectively (Table 3). A high value of
MCC simply indicates the robustness of the proposed RFbased model.
SVM-based classification models were built utilizing a
small pool of topological descriptors as specified in the
Methods section. The dataset was divided into a training
and a test set based on a random test set selection comprising 27 compounds in the training and 9 compounds
in the test set, respectively. The models were built using
the training set molecules and subsequently validated by
test set molecules. The SVM model for the training set
resulted in a specificity of 100 % and an accuracy of prediction of 93 %. The sensitivity, specificity, non-error
rate, overall accuracy of prediction, and MCC of the test
set was of the order of 50 %, 86 %, 68 %, 78 %, and 0.36,
respectively (Table 3).
Four single index-based models were developed using
MAA (Table 4). The Balaban-type index from Zweighted distance matrix: index A37, identified as the
most important index by the decision tree, was used to
construct a model for the prediction of the anti-HIV
activity of purine nucleoside analogs. Three more indices, i.e., spherocity index, SPH, A2; shape profile no.
20, SP20, A4; and superaugmented pendentic topochemical index-4, SA∫P-4c, A23, were also used to develop the models for predicting the anti-HIV activity of
purine nucleoside analogs.
A2, i.e., spherocity index, SPH, is one of the geometrical descriptors given by Robinson et al. and may be
expressed as:
ΩSPH ¼
Fig. 2 A decision tree for distinguishing active purine nucleoside
analogs (A) from inactive analogs (B)
n¼1
kn
3λ3
ðλ1 þ λ2 þ λ3 Þ
1≥ΩSPH ≥ 0
where λ1, λ2, and λ3 are the eigenvalues of the autocovarience matrix used in the principal component analysis of the molecule. The ΩSPH value ranges from unity
for totally spherical molecules to zero for totally flat
molecules [51].
A4, i.e., shape profile no. 20, SP20, is one of the Randic
molecular profiles described by Randic and may be
expressed as:
Khatri et al. Chemistry Central Journal (2015) 9:29
Page 7 of 10
Table 3 Confusion matrix for anti-HIV activity of purine nucleoside analogs in human PBM cells
Model
Description
Ranges Number of compounds predicted Sensitivity
(%)
Active
Inactive
Decision tree
Training set
Active
08
00
Inactive
00
28
06
02
Inactive
02
26
Active
05
03
Inactive
03
25
Active
04
02
Inactive
00
21
Active
01
01
Inactive
01
06
Tenfold cross-validated set Active
Random forest
Support vector machine Training set
Test set
Specificity
(%)
Nonerror
rate
(%)
Overall
accuracy
of
prediction
(%)
MCC
100
100
100
>99.9
1.00
75
93
84
89
0.68
62.5
89
75.7
83
0.52
66.7
100
83.3
93
0.78
68
78
0.36
50
86
The recognition rate of decision tree-, random forest-, and support vector machine-based models is also shown
S ¼ N þ 1 Rx þ 2 R=2!x2 þ
þ 4 R=4!x4 …
S ¼ 1 S;
1
2
S;
3
S;
4
2
R=3!x3
n
… R=n!xn
S…
3
… nS
where N is a constant indicating the size of the system.
R, 2R, 3R… are the averages of the row sums in the 1D,
D, 3D… matrix, respectively. D is the geometry distance
matrix of a structure [52].
A23, i.e., superaugmented pendentic topochemical
index-4, is the topochemical version of the topological descriptor (superaugmented pendentic index-4) reported by
Dureja et al. [53]. Superaugmented pendentic index-4 is
expressed as:
Table 4 Proposed MAA models for the prediction of anti-HIV activity of PNAs in human PBM cells
Descriptor Nature of
range in the
proposed
model
Descriptor
value
A2
<0.901
A4
A23
A37
Lower
inactive
Number of compounds
in each range
Sensitivity
(%)
Specificity
(%)
Nonerror
rate
(%)
Overall
accuracy
of
prediction
(%)
100
81.5
91.7
Total Correctly
predicted
3
3
63
MCC Average
EC50 (μM) of
correctly
predicted
compounds
in each
range
0.75
67.1
Average SI
of correctly
predicted
compounds
in each
range
15.205
Active
0.901 to 0.922
5
5
0.182
825.741
Upper
inactive
>0.922
28
25
33.613
66.665
Lower
inactive
<2.76
9
9
78.855
6.544
0.182
825.741
Active
2.76 to 4.599
5
5
Upper
inactive
>4.599
22
19
Lower
inactive
<9.61
18
18
Transitional
9.61 to 43.43
4
Active
43.44 to
357.424
7
6
Upper
inactive
>357.424
7
7
Active
1.531 to 1.589
Inactive
>1.589
NA not applicable
63
100
100
96
81.5
98
91.7
96.9
0.75
0.91
NA
5
5
24
21
17.47
43.186
18.056
36.560
4.138
102.32
0.141
859.542
100
63
100
81.5
91.7
0.75
100
0.134
920.339
37.201
31.408
Khatri et al. Chemistry Central Journal (2015) 9:29
P−4 X n pi m i
Gk;n ¼
i¼1 e4
i
Superaugmented pendentic topochemical index-4 may
be defined as the summation of the quotients of the
product of all the non-zero row elements in the chemical pendent matrix and product of chemical adjacent
vertex degrees and the fourth power of the chemical eccentricity of the concerned vertex for all vertices in a
hydrogen-suppressed chemical molecular graph and may
be expressed as:
SA
Z
P−4 Gk;n
c
¼
Xn p mic
ic
i¼1 e4
ic
Table 5 Intercorrelation matrix
A4
A23
A37
100
90
80
70
60
50
40
30
20
10
0
A2
A4
A23
A37
Lower
Inactive
Transitional
Active
Upper
Inactive
Nature of Ranges
Fig. 3 Average EC50 of anti-HIV activity of correctly predicted PNAs
in various ranges of MAA-based models
where pic is the chemical pendenticity and is obtained by
multiplying all the non-zero row elements in the chemical pendent matrix, ΔPc, of a chemical graph (Gk,n)c.
ΔPc is a sub-matrix of the chemical distance matrix and
is obtained by retaining the columns corresponding to
pendent vertices. mic is the augmented chemical adjacency
and is defined as the product of chemical degrees of all
the vertices vj adjacent to vertex vi. eic is the chemical eccentricity of vertex vi, and n is the number of vertices in
graph G [54–56].
The results of the intercorrelation analysis (Table 5)
reveal that the pairs A2:A23 and A23:A37 were not correlated while the pairs A4:A23, A4:A37, and A2:A37
were found to be weakly correlated. The accuracy of prediction for all the four MAA-based models varies from
91.7 to 96.9 %, indicating high predictability (Table 4).
The average EC50 value of the correctly predicted analogs in the active ranges in MAA-based models varied
from 0.134 to 0.182 μM. Such a low average EC50 value
signifies high potency of the active ranges (Fig. 3).
Drug safety evaluation is the key part of drug discovery
and development process to identify those that have an
appropriately balanced safety-efficacy profile for a given
indication [57]. The therapeutic index (TI), certain safety
factor (CSF), protective index (PI), therapeutic window
(TW), and selectivity index (SI) are some of such important parameters that can be used to achieve this balance. TI may be defined as the ratio of LD50/ED50,
where LD50 is defined as the single dose of a therapeutic
agent that can be likely to cause death in 50 % of the
animal population and ED50 is defined as the single dose
A2
EC50 (µM)
Z
A2
A4
A23
A37
1.00
0.85
−0.13
−0.62
1.00
−0.39
−0.47
1.00
−0.11
1.00
of a therapeutic agent that can be likely to cause a particular effect to occur in 50 % of the animal population
[58–60]. Similarly, SI is calculated for a drug molecule
in the case of cell studies, and it may be defined as the
ratio of CC50 to EC50, where CC50 and EC50 represent
cytotoxic and effective concentrations, respectively. It is
an indirect measure of the safety of a drug. A high value
of SI simply indicates low toxicity and more safety. A
high value of SI is a desirable property for any drug candidate so as to minimize toxicity. Therefore, such safety
parameters should be determined in the initial stages of
the drug discovery process to avoid much costlier latestage failures [61]. Active ranges of the proposed MAAbased models exhibited high degree of selectivity towards infected human PBM cells as indicated by a
greater value of SI for active ranges compared to inactive
ranges (Fig. 4). As a consequence, active ranges identified by MAA models have both the desired requirements
of a drug molecule, i.e., high potency and safety. Model
validation by confusion matrix shows the sensitivity of
the models of the order of 63 % to 100 % (Table 4). High
values of MCC simply indicate the robustness of the
proposed MAA-based models.
The present modeling studies may be of great utility
for providing lead molecules through exploitation of
Selectivity Index (SI)
SA
Page 8 of 10
1000
900
800
700
600
500
400
300
200
100
0
A2
A4
A23
A37
Lower
Inactive
Active
Transitional
Upper
Inactive
Nature of Ranges
Fig. 4 Average SI against PBM cells of correctly predicted PNAs in
various ranges of MAA-based models
Khatri et al. Chemistry Central Journal (2015) 9:29
active ranges in single MD-based models. The proposed
models are unique and differ widely from conventional
QSAR models. Both systems of modeling have their advantages and limitations. In the instant modeling, the system adopted has a distinct advantage of identification of
narrow active ranges, which may be erroneously skipped
during regression analysis in conventional QSAR. Since
the ultimate goal of modeling is to provide lead structures,
therefore, active ranges of the proposed models can play a
vital role in providing lead structures [62]. Therefore,
active ranges of the proposed models can naturally play a
vital role in providing lead structures.
Conclusions
Diverse techniques such as DT, RF, SVM, and MAA
were successfully used to develop models for anti-HIV
purine nucleoside analogs. Models based on DT, RF, and
SVM statistical approaches show an accuracy of prediction up to the order of 89 %. The overall accuracy of
prediction of MAA-based models varies from 91.7 % to
96.9 % with regard to the anti-HIV activity of purine nucleoside analogs in human PBM cells. High values of
sensitivity, specificity, and MCC indicate the robustness
of the proposed models. Good predictability, high potency, and safety of the active ranges in the proposed
MAA-based models will naturally provide ease in furnishing lead structures for the development of potent
but safe anti-HIV purine nucleoside analogs.
Competing interests
The authors declare that they have no competing interests.
Page 9 of 10
6.
7.
8.
9.
10.
11.
12.
13.
14.
15.
16.
17.
18.
19.
20.
21.
22.
23.
Authors’ contributions
AKM proposed the subject, designed the study and supervised the entire
work. Major work was carried out by NK. Modeling through support vector
machine was carried out by VL. NK prepared the draft of the manuscript.
AKM modified the manuscript. All the authors read and approved the final
manuscript.
24.
25.
Author details
1
Faculty of Pharmaceutical Sciences, Pt. B. D. Sharma University of Health
Sciences, Rohtak 124001, India. 2JCDM College of Pharmacy, Barnala Road,
Sirsa 125055, India.
26.
27.
Received: 12 May 2015 Accepted: 19 May 2015
28.
References
1. Jurs P. Quantitative structure property relationships. In: Gasteiger J, editor.
Handbook of chemoinformatics, vol. 3. Weinheim: Wiley-VCH; 2003.
p. 1314–35.
2. Ivanciuc O. Drug design with artificial intelligence methods. In: Meyers RA,
editor. Encyclopedia of complexity and systems science. Berlin: Springer;
2009. p. 2113–39.
3. Hansch C. On the structure of medicinal chemistry. J Med Chem.
1976;19(1):1–6.
4. Bagchi MC, Maiti BC, Mills D, Basak SC. Usefulness of graphical invariants in
quantitative structure—activity correlations of tuberculostatic drugs of the
isonicotinic acid hydrazide type. J Mol Model. 2004;10:102–11.
5. Mon J, Flury M, Harsh JB. A quantitative structure—activity relationships
(QSAR) analysis of triarylmethane dye tracers. J Hydrology.
2006;316:84–97.
29.
30.
31.
32.
33.
Sabljic A. Quantitative modeling of soil sorption for xenobiotic chemicals.
Environ Health Perspect. 1989;83:179–90.
Guidance on information requirements and chemical safety assessment Chapter
R.6: QSARs and grouping of chemicals. https://echa.europa.eu/documents/10162/
13632/information requirements r6 en.pdf. Accessed 24 May 2015
International QSAR Foundation. http://www.tm.durusau.net/?p = 13346.
Accessed 26 Aug 2012
Hansch C. A quantitative approach to biochemical structure activity
relationships. Acc Chem Res. 1969;2:232–9.
Ivanciuc O. Weka machine learning for predicting the phospholipidosis
inducing potential. Curr Top Med Chem. 2008;8:1691–709.
Zhang S, Golbraikh A, Oloff S, Kohn H, Tropsha A. A novel automated lazy
learning QSAR (ALL-QSAR) approach: method development, applications,
and virtual screening of chemical databases using validated ALL-QSAR
models. J Chem Inf Model. 2006;46:1984–95.
Plewczynski D, Von Grotthuss M, Spieser SAH, Rychlewski L, Wyrwicz LS,
Ginalski K, et al. Target specific compound identification using a support
vector machine. Comb Chem High Throughput Screen. 2007;10:189–96.
Klon AE, Diller DJ. Library fingerprints: a novel approach to the screening
of virtual libraries. J Chem Inf Model. 2007;47:1354–65.
Vogt M, Bajorath J. Introduction of an information—theoretic method to
predict recovery rates of active compounds for Bayesian in silico screening:
theory and screening trials. J Chem Inf Model. 2007;47:337–41.
Schneider N, Jäckels C, Andres C, Hutter MC. Gradual in silico filtering for
druglike substances. J Chem Inf Model. 2008;48:613–28.
Modi S. Positioning ADMET in silico tools in drug discovery. Drug Discov
Today. 2004;9:14–5.
Frank E, Hall M, Trigg L, Holmes G, Witten IH. Data mining in bioinformatics
using Weka. Bioinformatics. 2004;20:2479–81.
Witten IH, Frank E. Data mining: practical machine learning tools and
techniques. 2nd ed. San Francisco: Morgan Kaufmann; 2005. p. 525.
Mjolsness E, DeCoste D. Machine learning for science: state of the art and
future prospects. Science. 2001;293:2051–5.
Duch W, Swaminathan K, Meller J. Artificial intelligence approaches for
rational drug design and discovery. Cur Pharm Des. 2007;13:1–12.
Stefania F, Maria LB, Laura DL, Angela R, Anna MM, Zeger D, et al. New
4-[(1-benzyl-1H-indol-3-yl)carbonyl]-3-hydroxyfuran-2(5H)-ones, β-diketo acid
analogs as HIV-1 integrase inhibitors. Arch Pharm. 2007;340(6):292–8.
Glesby MJ. Drug development: an overview. 1998. http://www.acria.org/
files/ ACRIA %20 Update %20 Winter %20 1998.pdf. Accessed 15 Mar 2012
Robak T, Lech-Maranda E, Korycka A, Robak E. Purine nucleoside analogs as
immunosuppressive and antineoplastic agents: mechanism of action and
clinical activity. Curr Med Chem. 2006;13(26):3165–89.
Parikh UM, Koontz DL, Chu CK, Schinazi RF, Mellors JW. In vitro activity of
structurally diverse nucleoside analogs against human immunodeficiency
virus type 1 with the K65R mutation in reverse transcriptase. Antimicrob
Agents Chemother. 2005;49(3):1139–44.
Amblard F, Fromentin E, Detorio M, Obikhod A, Rapp KL, McBrayer TR, et al.
Synthesis, antiviral activity and stability of nucleoside analogs containing
tricyclic bases. Eur J Med Chem. 2009;44(10):3845–51.
Todeschini R, Consonni V. Handbook of molecular descriptors. Weinheim:
Wiley-VCH; 2000.
Tong W, Hong H, Fang H, Xie Q, Perkins R. Decision forest: combining the
predictions of multiple independent decision tree models. J Chem Inf
Comp Sci. 2003;43:525–31.
Asikainen A, Kolehmainen M, Ruuskanen J, Tuppurainen K. Structure-based
classification of active and inactive estrogenic compounds by decision tree,
LVO and κNN methods. Chemosphere. 2006;62:658–73.
Wagener M, Geerestein VJ. Potential drugs and nondrugs: prediction and
identification of important structural features. J Chem Inf Comp Sci.
2000;40:280–92.
Dureja H, Gupta S, Madan AK. Topological models for prediction of
pharmacokinetic parameters of cephalosporins using random forest,
decision tree and moving average analysis. Sci Pharm. 2008;76:377–94.
Zhang Q-U, Aires J. Random forest prediction of mutagenicity from empirical
physicochemical descriptors. J Chem Inf Mod. 2007;47:1–8.
Prasad AM, Iverson LR, Liaw A. Newer classification and regression tree
techniques: bagging and random forests for ecological prediction.
Ecosystems. 2006;9:181–99.
Smola AJ, Schölkopf B. A tutorial on support vector regression. Stat Comput.
2004;14:199–222.
Khatri et al. Chemistry Central Journal (2015) 9:29
34. Vapnik V, Lerner A. Pattern recognition using generalized portrait method.
Autom Remote Control. 1963;24:774–80.
35. Sanchez VD. Advanced support vector machines and kernel methods.
Neurocomputing. 2003;55:5–20.
36. Gupta S, Singh M, Madan AK. Predicting anti-HIV activity: computational
approach using novel topological indices. J Comp Aided Mol Des.
2001;15:671–8.
37. McLachlan GJ, Do KA, Ambroise C. Analyzing microarray gene expression
data. New York: Wiley; 2004.
38. Han L, Wang Y, Bryant SH. Developing and validating predictive decision
tree models from mining chemical structural fingerprints and high-throughput
screening data. BMC Bioinformatics. 2008;9:401.
39. Ballabio D, Consonni V. Classification tools in chemistry. Part 1: linear
models. PLS-DA. Anal Methods. 2013;5:3790–8.
40. Matthews BW. Comparison of the predicted and observed secondary
structure of T4 phage lysozyme. Biochim Biophys Acta. 1975;405:442–51.
41. Baldi P, Bruank S, Chauvin Y, Andersen CAF, Nielsen H. Assessing the
accuracy of prediction algorithms for classification: an overview.
Bioinformatics. 2000;16:412–24.
42. Carugo O. Detailed estimation of bioinformatics prediction reliability
through the fragmented prediction performance plots. BMC Bioinformatics.
2007;8:380.
43. Mason RO, Lind DA, Marchal WG. Statistics: an introduction. New York:
Harcourt Brace Jovanovich; 1983.
44. Congelosi VE, Taylor PE, Rice PF. Basic statistics: a real world approach. St.
Paul: West Publishing Co; 1983.
45. Martin YC. Quantitative drug design. New York: Dekker Press; 1978.
46. Balaban AT, Motoc J, Bonchev D, Mekennyan O. Topological indices for
structure—activity correlations. Top Curr Chem. 1983;114:21–55.
47. Basak SC, Bertlsen S, Grunwald GD. Application of graph theoretical
parameters in quantifying molecular similarity and structure activity
relationships. J Chem Inf Comp Sci. 1994;34:270–6.
48. Balaban AT. Topological indices based on topological distances in
molecular graphs. Pure Appl Chem. 1983;55:199–206.
49. Barysz M, Jashari G, Lall RS, Srivastava VK, Trinajstic N. On the distance matrix
of molecules containing heteroatoms. In: King RB, editor. Chemical
applications of topology and graph theory. Amsterdam: Elsevier; 1983. p.
222–7.
50. Bonchev D, Trinajsti N. Information theory, distance matrix and molecular
branching. J Chem Phy. 1977;67(10):4517–33.
51. Robinson DD, Barlow TW, Richards WG. Reduced dimensional representations
of molecular structure. J Chem Inf Comp Sci. 1997;37:939–42.
52. Randic M. Molecular shape profiles. J Chem Inf Comp Sci. 1995;35:373–82.
53. Dureja H, Kinkar CD, Madan AK. Superaugmented pendentic indices: novel
topological descriptors for QSAR/QSPR. Sci Pharm. 2009;77:521–37.
54. Goel A, Madan AK. Structure-activity study on anti-inflammatory pyrazole
carboxylic acid hydarzide analogs using molecular connectivity indices. J
Chem Inf Comp Sci. 1995;35:510–4.
55. Kumar V, Sardana S, Madan AK. Predicting anti-HIV activity of 2,3-diaryl-1,
3-thiazolidin-4-ones: computational approach using reformed eccentric
connectivity index. J Mol Mod. 2004;10:399–407.
56. Bajaj S, Sambi SS, Madan AK. Prediction of carbonic anhydrase activation by
tri-/tetrasubstituted-pyridinium-azole drugs: a computational approach
using novel topochemical descriptor. QSAR Comb Sci. 2004;23:506–14.
57. Muller PY, Milton MN. The determination and interpretation of the therapeutic
index in drug development. Nat Rev Drug Discov. 2012;11:751–61.
58. Blazka ME. Acute toxicity and eye irritancy. In: Hayes AW, editor. Principles
and methods of toxicology. 5th ed. Boca Raton: CRC Press Taylor and
Francis Group; 2001. p. 1131–41.
59. Kevin CO, Trevor MP. Drug toxicity and poisoning. In: Goodman LS, Gilman
A, editors. The pharmacological basis of therapeutics. 12th ed. New York:
The McGraw-Hill Books; 2011. p. 73–89.
60. Simmons MA. Mechanisms of drug action and pharmacodynamics. In:
Simmons MA, editor. Pharmacology: an illustrated review. New York: Thieme
Medical Publishers; 2012. p. 26.
61. Madan AK, Bajaj S, Dureja H. Classification models for safe drug molecules.
In: Reisfeld B, Mayeno AN, editors. Computational toxicology, Humana Press,
vol. 2. New York: Springer Science + Business Media; 2013. p. 99–102.
62. Dureja H, Madan AK. Prediction of h5-HT2A receptor antagonistic activity of
arylindoles: computational approach using topochemical descriptors. J Mol
Graph Mod. 2006;25:373–9.
Page 10 of 10
Publish with ChemistryCentral and every
scientist can read your work free of charge
Open access provides opportunities to our
colleagues in other parts of the globe, by allowing
anyone to view the content free of charge.
W. Jeffery Hurst, The Hershey Company.
available free of charge to the entire scientific community
peer reviewed and published immediately upon acceptance
cited in PubMed and archived on PubMed Central
yours you keep the copyright
Submit your manuscript here:
http://www.chemistrycentral.com/manuscript/


© Copyright 2026