
Reprint - Journal Issues
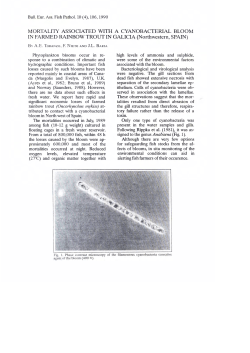
International Journal of Agricultural Policy and Research Vol.3 (5), pp. 222-230,May 2015 Available online at http://www.journalissues.org/IJAPR/ http://dx.doi.org/10.15739/IJAPR.043 Copyright © 2015 Author(s) retain the copyright of this article ISSN 2350-1561 Original Research Article Stock assessment of the bigeye grunt Brachydeuterus auritus (Valenciennes, 1832) in the coastal water of Ivory Coast Accepted 22 April, 2015 Kouadio Justin Konan1*, Tapé Gnahoré Toussaint Joanny1, Soumaïlla Sylla1, Luaia Lianthuam2 and K Lohith Kumar3 1Centre de Recherches Océanologiques, 29, rue des pêcheurs-BP V 18 Abidjan, Côte d’Ivoire. 2Central Inland Fisheries Research Institute, Barrackpore-700120, India. 3Central Island Agricultural Research Institute, Port Blair, A & N Islands, 744101, India. *Corresponding Author E-mail: [email protected], [email protected] Tel.: +225 07 62 52 71 Fax: +225 21 35 11 55 The stock assessment of Brachydeuterus auritus was carried out in the coastal water of Ivory Coast from January to December 2009. Monthly length frequency data were analyzed using FiSAT software and Jones’ Cohort Analysis Model for the estimation of population parameters, total biomass and Maximum Sustainable Yield (MSY). The asymptotic length (L∞) was 25.20 cm, the growth coefficient (K) was 0.58 year -1, and the calculated growth performance index (φ’) was 2.57. The total mortality (Z), the fishing mortality (F) and the natural mortality (M) were 2.01, 0.74 and 1.27 year1,respectively. The exploitation level (E) was 0.37 while the maximum allowable limit of exploitation (Emax) was 0.85. The biomass was 2507 tons, which provided the MSY of 2079 tons. The recruitment pattern was continuous with two major peaks per year. The exploitation level (E = 0.37) and the fishing mortality approximated the precautionary target reference point (0.64 year−1) and was within the precautionary limit reference point (0.84 year−1), suggesting that the big eye grunt stock is exploited at a low rate. Key words: stock assessment, growth parameters, MSY, bigeye grunt, Ivory Coast. INTRODUCTION Determining the status of fish stocks means estimating one or more biological characteristics of the stock, such as abundance (numbers of fish) or biomass (weight), and comparing estimated to reference values that define desirable conditions. An essential characteristic of a fish stock is that its population parameters remain constant throughout its area of distribution and stock assessment should be carried out separately (Wang and Liu 2006). In tropical and subtropical waters, it is not possible to determine age by counting rings in hard parts of the fish body, such as otoliths or scales. The lack of strong seasonality makes the distinction of seasonal rings and year-rings problematic for tropical species. However, with the development of the length based stock assessment methodologies, it is possible to investigate population dynamics of fish stocks in tropical waters (Pauly 1984, Pauly and Morgan 1987). The big eye grunt, Brachydeuterus auritus (Valenciennes, 1831) belonging to the Family of Haemulidae is a semipelagic species inhabiting the coastal waters off the African coast from Morocco to Angola (Salzen 1957). The big eye grunt is considered as one of the most important fishery resources off the Ivorian coast because of its abundance in the landings. The biology and stock details of the species is less known, despite its economic importance and widespread occurrence in the Ivorian waters since the work of Barro (1968). The length at first maturity reported for this species is 13.8 cm (Baro 1968) and fish recruit into the fishery at length of 4 cm (Bannerman 2002). Due to long term exploitation of the fishery resources along coastal waters of Ivory Coast, the growth parameters and mortality of B. auritus could have changed. The present study is to Int. J. Agric. Pol. Res. 223 Figure 1: Map of Ivorian waters, showing the sampling locality of Bracydeuterus auritus estimate population parameters, yield per recruit, biomass and MSY of B. auritus in order to formulate management and conservation policies. MATERIALS AND METHODS Brachydeuterus auritus fishery in Ivory Coast Brachydeuterus auritus is caught by artisanal and industrial fisheries operated along the coast. The artisanal fleet exploits this species in the coastal zone, whereas the trawlers exploit it at depths of 30 to 70 m (Bannerman 2002). In the industrial fishery, B. auritus is mostly landed by the industrial bottom trawlers at the harbour of Abidjan. The fleets are equipped with radar, sounder and ice hold. Most of bottom trawlers are 15-20 m long and have stretch mesh size from 45 to 67 mm with engine horse power ranging from 200 to 600 HP and an average crew size of 15 persons. In 2007, the fleet composed of 18 foreign and 05 national trawlers. Forty fish species are usually recorded at the landing site, 10 species belonging to 9 families represent more than 80% of the total capture and the contribution of B. auritus is 22.95% (FAO 2008). Description of study area The specimens were caught along the coast of Ivory Coast, comprising 550 km coastline and narrow continental shelf of 10,200 km² (Figure 1). Except for some rocky cliffs in the West, the sea bed is characterized by low and sandy bottoms. According to Arfi et al. (1993), the hydro-climatic season influences oceanographic conditions and the availability of fishery resources due to salinity of more than 35 ppt and sea surface temperature (SST) ranging from 23 to 30°C. The SST is characterized by four distinct climatic periods; two dry seasons (December-March and AugustSeptember) and two rainy seasons (April-July and OctoberNovember). The coastal area is greatly affected by the seasonal upwelling which takes place in the Gulf of Guinea. Thus, the period from July to October corresponds to the major upwelling whilst a minor upwelling is usually observed between January and February (Colin 1988). Collection of data The specimens of big eye grunt were collected from commercial catches at the fishing harbour of Abidjan from the industrial bottom trawlers. The specimens were sampled monthly from January to December 2009. The total length of each individual was measured to the nearest 0.1 cm. The length measurements were then grouped into 1 cm class intervals for the construction of monthly length distribution. Analysis of data The data in length and weight of individuals were used to Konan et al. 224 Table 1: Catch at length of the big eye grunt caught by the coastal waters of Ivory Coast from January to December 2009 Size 6 7 8 9 10 11 12 13 14 15 16 17 18 19 20 21 22 23 24 J 0 0 5080 74009 157081 215849 240153 240153 215849 210769 162161 200608 141840 107376 5080 24304 0 0 0 F 0 0 24304 68929 167242 240153 264457 264457 254296 254296 219832 249216 141840 79089 5080 5080 0 0 0 M 0 0 0 39545 177402 298921 328305 352609 250314 288760 229992 167242 171224 88152 72911 0 0 0 0 A 0 0 53688 72911 118634 158179 182483 182483 177402 172322 142938 113554 108474 58768 53688 0 0 0 0 M 0 5080 0 44625 54786 59866 84170 84170 84170 108474 103393 103393 79089 88152 53688 48608 24304 24304 24304 J 0 5080 5080 63848 113554 128795 153099 153099 153099 94330 89250 64946 54786 15241 0 0 0 0 0 estimate the length-weight relationship using the formula (Le Cren, 1951). W =aL b (1) Where, W is the weight (g), L is the total length (cm), a is the intercept and b is the slope. The parameters a and b were estimated by least squares linear regression analysis. In order to check if the b value was significantly different from 3, the t-test was used at p = 0.05. The data analysis (Table 1) was done using ELEFAN I routine of FAO ICLARM Stock Assessment Tools II (FiSAT II) (Gayanilo et al. 1996). The growth parameters were obtained using the Von Bertalanffy Growth Formula (Sparre and Venema 1998), expressed as: - K (t - t0 ) Lt = L 1 - e (2) Where, Lt is the predicted length at age t, L∞, the asymptotic length, K the growth coefficient, and t0 the theoretical age at length zero. The reliability of growth parameters was tested applying the growth performance index (φ’) according to the method of Pauly and Munro (1984), as follows: ' log K 2 log L 10 10 (3) The life span (tmax) that fish of a given population would reach was calculated: t max = 3 / K (4) The total mortality (Z) was estimated using the lengthconverted catch curve method (Sparre and Venema 1998). The natural mortality (M) was estimated using the empirical equation of Pauly incorporated in FiSAT II (Pauly 1980) as follows: J 5080 5080 10161 64946 162161 148018 153099 177402 177402 172322 167242 162161 113554 98313 5080 5080 0 0 0 A 0 0 5080 20321 34464 63848 108473 157081 157081 157081 152001 127697 74009 88152 53688 24304 24304 0 0 S 0 0 0 29384 34464 39545 68929 103393 127697 127697 122617 112456 102295 107376 77992 24304 24304 0 0 O 0 0 0 83072 77992 107376 112456 112456 88152 88152 88152 88152 88152 77992 53688 0 0 0 0 N 0 0 0 10161 20321 30482 35562 40643 40643 40643 40643 25402 20321 5080 5080 0 0 0 0 D 0 0 10161 20321 45723 55884 60964 60964 55884 45723 50803 45723 35562 20321 15241 0 5080 0 0 log M = -0.0066 - 0.279 log L + 0.6543 log K + 0.4634log T 10 10 10 10 (5) Where, T is the mean annual temperature of surface water (being 26°C in this case). (1) The fishing mortality coefficient (F) and exploitation ratio (E) were estimated using the relationships Z-M and E = F/Z respectively. The relative yield per recruit (Y’/R) and biomass per recruit (B’/R) were estimated according to Beverton and Holt (1957) using the Knife-edge selection. The length-based virtual population analysis (VPA) by Jones (1984) was applied to estimate the biomass (tons), the yield (tons), total and fishing mortality and exploitation ratios of B. auritus using the following equations (Jones 1984): (6) NL1 = (NL2 x XL1,L2 +CL1,L2 ) x XL1,L2 Where, NL1 and NL2 are the number (2) of animals for the beginning (L1) and the ending (L2) length interval, CL1, L2 is the catch for the length interval, and X L1, L2 the natural mortality factor for the length interval. L - L M 2 K 1 X = L1, L2 L - L 2 (7) The exploitation rate (E) and the fishing mortality (F) for each length interval are given by (3) E= CL1, L2 N L1 -N L2 F / ZL1, L2 (4) F= 1-F / ZL1, L2 (8) (9) The total mortality (Z) for each length interval was obtained using Int. J. Agric. Pol. Res. 225 250 y = 0.0174x2.98, n = 252 R² = 0.96 Weight (g) 200 150 100 50 0 0 5 10 15 20 25 30 Total length (cm) Figure 2: Length-weight relationship of Brachydeuterus auritus sampled in the Ivorian coast waters Z = M L1, L2 F 1- L1, L2 Z L1, L2 (10) The total biomass (B) was calculated as B= N L1 -N L2 x mean body weight ZL1,L2 (11) The body weight for each length interval was calculated as: Body weight = a x (L1 + L2 ) / 2 b (12) Where, a is the intercept and b is the slope of the lengthweight relationship. The maximum sustainable yield (MSY) for B. auritus was estimated using Cadima’s formula for exploited stocks (Sparre and Venema 1998): (13) MSY = 0.5x (Y + MB) Where, B is the average biomass calculated from cohort analysis in the same year, and M the natural mortality and the Y the annual yield which is given by the formula, Y = WL1,L2 x CL1,L2 (14) The resource status was evaluated using estimates of exploitation rate (E) associated with a maximum sustainable yield (Emax) and by comparing estimates of the fishing mortality rate with target (F opt) and limit (Flimit) biological reference points which were defined as F opt = 0.5M and Flimit = 2/3M following Patterson (1992). RESULTS A total of 3645 specimens with total length ranging from 6 to 24 cm were collected, of which 252 specimens were weighed to obtain length weight (10) relationship (Figure 2). The length-weight equation calculated in exponential form was W = 0.0174 x LT2.98 with a regression coefficient R2 of 0.96. The slope b of this relationship was 2.98, which was not significantly different from 3 (t-test = 0.534, p> 0.05). The restructured form of the length-frequency data is (11)I in Figure 3. The presented as output of ELEFAN asymptotic length (L∞) and the growth coefficient (K) for B. auritus were respectively 25.20 cm and 0.58 year-1. The asymptotic weight obtained was 261.05 g. The growth performance index (φ’) was 2.57 and the longevity (tmax) (12) was 5.17 years. The instantaneous rate of total mortality (Z) from the length-converted catch curves estimated was 2.01 year-1 (Figure 4). The natural mortality (M) and the fishing mortality were 1.27 year-1 and 0.74 year-1 respectively, whereas the exploitation level (E) was 0.37. The fishing mortality rate was above the(13) precautionary target reference point (Fopt = 0.64 year−1) but under the precautionary limit reference point (Flimit = 0.84 year−1). The recruitment pattern showed two major peaks of recruitment for B. auritus in Ivorian waters (Figure 5). The major recruitment occurred from February to April peaking (14) in March (18.24%) and the minor one was observed in September-October. The mid-point of the lower length class (6.5 cm) in the sampled data was used as a length at recruitment. The length at first capture (Lc) was 12.89 cm whereas the lengths at which 25% and 75% of fish are captured were respectively 11.77cm and 14.01 cm. The total catch for 2009 was approximately 16.35 million specimens. The total biomass and the yield values of B. auritus estimated using Jones’ method were 2507 tons and 972 tons respectively, which provided the Maximum Sustainable Yield (MSY) of 2079 tons (Table 2). The relative yield per-recruit (Y'/R) and biomass per-recruit (B'/R) Konan et al. 226 Figure 3: Growth curve superimposed over the restructured length-frequency histograms for Brachydeuterus auritus. Rn = 0.236 Figure 4: Length-converted catch curve of Brachydeuterus auritus sampled in Ivorian coast waters. Solid dots = points used in calculating through least square linear regression. Open dots = point either not fully recruited or nearing L∞ were determined as a function of Lc/L∞ and M/K (Figure 7). The optimum exploitation rate (Emax) which produces maximum and economic sustainable yield was 0.85 whereas the exploitation level (E0.1) at which the marginal increase in relative yield per recruit is 10% was 0.72. The exploitation level (E0.5) which corresponds to 50% of the relative biomass per recruit of the unexploited stock was 0.37. DISCUSSION According to Carlander (1977), the slope b generally lies between 2.5 and 3.5 and growth is assumed to be isometric when it is equal to 3 (Quinn and Deriso 1999). The b value estimated for B. auritus in this study was 2.98 and it was not significantly different from 3, indicating isometric growth for this species. This implies that small specimens in the samples under consideration have the same form and condition as large specimens (Nandikeswari et al., 2014). According to Neilson and Johnson (1980), the isometric growth (b= 3) exists when fish shapes do not change as fish grow. Galucci et al. (1996) highlighted the weakness of ELEFAN-I methods to estimate growth parameters, particularly when length distribution did not indicate any Int. J. Agric. Pol. Res. 227 Figure 5: Recruitment pattern of Brachydeuterus auritus sampled in Ivorian coast waters Table 2. Estimates of the total biomass (tons), the yield (tons) and the MSY (tons) from the length frequency data of Brachydeuterus auritus using the Jones’s Cohort Analysis Model. XL1, L2 = Natural mortality factor, F = Fishing mortality, E = Exploitation rate, Z = Total mortality, MSY= Maximum Sustainable Yield Mid-point 6.5 7.5 8.5 9.5 10.5 11.5 12.5 13.5 14.5 15.5 16.5 17.5 18.5 19.5 20.5 21.5 22.5 23.5 24.5 Catch 5080 15240 113554 592075 1163827 1546918 1792150 1928911 1781992 1760571 1569026 1460552 1131148 834013 401215 131680 77992 24304 24304 XL1, L2 1.06 1.06 1.07 1.07 1.08 1.08 1.09 1.10 1.11 1.12 1.13 1.15 1.178 1.21 1.26 1.35 1.51 1.94 Survivors 120293254 106993276 94525742 82800357 71465864 60491677 50124712 40538689 31859183 24350898 17853854 12494037 8131124 4900412 2646097 1340141 641072 230474 48608 F 0.001 0.002 0.012 0.070 0.151 0.223 0.292 0.363 0.395 0.472 0.526 0.639 0.684 0.746 0.563 0.295 0.298 0.196 1.270 E 0.001 0.001 0.01 0.052 0.106 0.149 0.187 0.222 0.237 0.271 0.293 0.335 0.35 0.37 0.307 0.188 0.19 0.134 0.500 (Z) 1.27 1.27 1.28 1.34 1.42 1.49 1.56 1.63 1.67 1.74 1.8 1.91 1.95 2.02 1.83 1.56 1.57 1.47 2.54 Biomass (kg) 48185 69132 93608 120632 148448 175023 198285 216014 226723 228765 220586 201257 171809 135966 100530 72660 48773 26301 4707 Total 2507 tons Body weight (kg) 0.005 0.007 0.010 0.014 0.019 0.025 0.032 0.041 0.050 0.061 0.074 0.088 0.104 0.122 0.141 0.163 0.186 0.212 0.229 Yield (kg) 23 107 1163 8444 22366 38985 57905 78389 89605 107992 115953 128623 117555 101397 56618 21416 14525 5152 5978 Total 972 tons MSY: 2079 tons separation of age groups. Considering the suitability of length-frequency data used for the estimation of growth parameters for this species, a number of criteria exist for judging this. The presence of modal groups should be discernible from the raw data (Wolff 1989), with apparent shifts in the modal length overtime. These features were observed in the length data used in the present analysis. Furthermore, Pauly (1984) developed a system for assessing length data for growth studies, based on the need to obtain a sufficient number of measurements, well distributed over time. So, a total sample size of 1500 and above accumulated over a period of six months and above, is regarded as excellent for such analysis. The sample used in the present analysis is far in excess of this criterion. The Konan et al. Figure 6: The probability capture curve showing the L 25, L50 and L75 of Brachydeuterus auritus in Ivorian coast waters Figure 7: Relative yield per recruit (Y’/R) and biomass per recruit (B’/R) of Brachydeuterus auritus in the Ivorian coast waters using the Knife-edge option estimated asymptotic length (25.20 cm) and growth coefficient (0.58 year-1) for B. auritus were compared with other studies. These values were not significantly different from those obtained in other areas in Africa. However, the L∞ was slightly higher than those observed by Beck (1974) and Bannerman (2001) in Togolese (23.1 cm) and Ghanaian (23.1 cm) waters, respectively. On the other hand, the K value was higher in Ghanaian waters (0.73 year-1), followed by Ivorian waters (present study) and Togolese waters (0.29). The growth performance index φ’ (2.57) estimated in this study was higher than that of Bannerman (2002) in 228 Ghanaian waters (2.41) and Beck (1974) in Togo waters (2.19). It is assumed that Ivory Coast shares the same stock of big eye grunt with Ghana, Benin and Togo in the Committee for the Eastern Central Atlantic (CECAF) Subregion. Over the past two decades, the growth constant K and the growth performance have greatly increased, with an increase in fishing effort on demersal species, especially on juveniles (Bannerman 2002). In fact, the trawlers often operate relatively close to shore where juveniles are aggregated around the nursery ground in the shallow waters. This greatly causes changes in mean body size of the big eye grunt, because of the removing of species with a high longevity and a large body size (Genner et al., 2010). The high growth obtained in this study could be an adaptation of B. auritus in response to the fishing pressure and ecosystem perturbations. According to Duponchelle and Panfili (1998), some fish species have remarkable adaptations affecting the growth or reproduction (i.e. early sexual maturity, dwarfism and variation of growth) in response to ecosystems perturbations. The total and fishing mortality found in this study (2.01 year-1 and 0.74 year-1, respectively) were lower than those presented by Bannerman (2002), who estimated Z = 2.58 year-1 and F = 1.43 year-1 using the same method. However, the natural mortality was not significantly different (1.27 year-1 and 1.24 year-1 respectively). Based on the fishing mortality, the fishing pressure seems to be higher in Ghanaian waters. The higher natural mortality compared to fishing mortality for B. auritus indicates the unbalanced position in the stock. Jarre-Teichmann and Christensen (1998) found that natural mortality of small pelagic fish is much higher than fishing mortality in the four major eastern boundary current ecosystems. This high natural mortality can be the fact of some predators such as Pseudotolithus senegalensis, Pseudotolithus typus and Sphyraena guachancho which target considerably this species (Anyanwu et al., 1990, Akadjé et al., 2013). Barro (1979) reported that this species spawned once a year, from January to June. So, the critical period of its early life history falls within the upwelling periods (JanuaryFebruary and July-October) where several predators are found for feeding. According to Curry et al. (2000), upwelling ecosystems support a wide diversity of predators and almost 55% of all small pelagic fish in the Benguela Current region are eaten by top predators. However, the effect of the other factors on the natural mortality namely, diseases, competitive interactions, density-dependent factors and other vagaries of nature are unknown. Based on the assumption that a stock is optimally exploited when F=M or E=0.5 (Gulland, 1971), the estimated exploitation level was below the 0.50 optimum level of exploitation, indicating that the stock is not overexploited. This assertion is supported with the obtained relative yield-per-recruit (Y'/R) and relative biomass-per-recruit (B'/R) values established for B. auritus in the present study. Both estimates indicated that the present level of exploitation rate (E = 0.37) was lower than the maximum allowable limit based on the yield-per-recruit Int. J. Agric. Pol. Res. 229 calculation (Emax = 0.85). The specified precautionary target reference point (Fopt) and limit reference point (Flimit) values were also used to evaluate the status of the stock. These biological reference points are considered more appropriate in light of the constraints of the yield per recruit model. The fishing mortality was above the F opt (0.64 year−1) but under the Flimit (0.84 year−1), suggesting that the stock is exploited at a low rate. However, given that the upper 95% confidence interval of F (1.18 year−1 ) exceeded the limit reference point, further expansion of the fishery could be a threat for the stock. On the other hand, the annual yield obtained in 2009 was 2407 tons which was slightly above the MSY from Jones’ Cohort Analysis method (2079 tons), attesting that precautions must be taken since the presence of several juveniles in the catches is a real threat for B. auritus stock. Recruitment has been described as a year-round phenomenon for tropical fish and shrimps species (Weber 1976). In this population, there were one major and one minor recruitment peaks in the year, and they overlapped in time to give a continuous year-round pattern. It is in confirmation with Pauly (1982) suggesting of double recruitment pulses per year for tropical fish species and for short-lived species. Conclusion It is recognized that the first and last steps of VPA sometimes introduce errors into the population estimates and the assumption on terminal F leads to a systematic overestimation of the stock size when the stock is declining. Despite these weaknesses, VPA is a suitable method which provides estimates helpful for management actions (limiting fishing effort, quota, TAC, etc.). Data of one year can provide some information to study the dynamics of population of the species which recruit into the fishery at a length of 4 cm. ACKNOWLEDGEMENTS I am grateful to Dr. Grinson George, Fishery Resources Assessment Division of the Central Marine Fisheries Research Institute, Kochi (India) for his guidance and help. Financial assistance received through CV Raman postdoctoral research fellowship from DST is acknowledged. REFERENCES Akadjé C, Diaby M, Le Loc'h F, Konan KJ, N'Da K (2013). Diet of the barracuda Sphyraena guachancho in Ivory Coast (Equatorial Eastern Atlantic Ocean). Cybium, 37(4):285293. Anyanwu AO, Kusemiju KI (1990). Food of the croakers Pseudotolithus senegalensis and Pseudotolithus typus off the coast of Lagos, Nigeria. J. Fish Biol., 37 (5): 823- 825.Crossref Arfi R, Pezennec O, Cissoko S, Mensah M. 1993. Evolution spatio-temporelle d’un indice caractérisant l’intensité de la résurgence ivoiro-ghanéenne. In: Le Loeuff P, Marchal E, Amon Kothias JB (Eds), Environnement et ressources aquatiques de Côte d’ivoire : I. Le milieu marin. Paris, ORSTOM: pp. 101-112. Bannerman PO (2002). Stock assessment of the big-eye grunt (Brachydeuterus auritus, Val.) fishery in Ghanaian coastal waters. Fish. Res., 59: 197-207.Crossref Barro M (1968). Premières estimations sur la croissance de Brachydenterus auritus (Val., 1834) en Côte d'Ivoire. ORSTOM Doc. Sci. Prov. Centre d'Abidjan (31):18 p. Barro M (1979). Reproduction de Brachydeuterus auritus Val. 1831 (Pomadasyidae) en Côte d’Ivoire. Document scientifique Centre de Recherches Océanographiques. ORSTOM, Dakar 68:57-62. Beck U (1974). Bestandskundliche Untersuchungen an einigen Fischarten der Grundschleppnetzfischerei auf dem Schelf von Togo (West Afrika). MSc. Thesis, Hamburg University 126 p. Beverton RJH, Holt SJ (1957). On the dynamics of exploited fish populations. Ministry of Agriculture, Fisheries and Food, Fisheries Investigations, London, Series 2, 19, 533 p. Carlander K (1977). Handbook of Freshwater Fishery Biology, Vol.1. The Iowa State University Press, Ames, IA, 431 p. Colin C (1988). Coastal upwelling events in front of the Ivory Coast during the FOCAL program. Oceanol. Acta, 11 (2): 125-138. Cury P, Bakun A, Crawford RJM, Jarre A, Quiñones RA, Shannon LJ, Verheye HM (2000). Small pelagics in upwelling systems: patterns of interaction and structural changes in ‘‘wasp-waist’’ ecosystems. ICES J. Mar. Sci., 57: 603-618.Crossref Duponchelle F, Panfili J (1998). Variations in age and size at maturity of female tilapia, Oreochromis niloticus, populations from man-made lakes of Côte d’Ivoire. Environ. Biol. Fish., 52: 453-465.Crossref FAO 2008. FAO (2008). Profil de la pêche par pays, la république de Côte d’Ivoire. FAO, Rome, Italie, 43 p. Gallucci VF, Amjoun B, Hedgepeth J, Lai HL (1996). Sizebased methods of stock assessment of small-scale fisheries. In: Gallucci VF, Saila SB, Gustafson DJ, Rothschild RJ. (Eds), Stock assessment; quantitative methods and applications for small-scale fisheries. Lewis Publishers. Boca Raton, Florida, USA: pp. 9-81. Gayanilo FC, Sparre JrP, Pauly D (1996). The FAO-ICLARM stock assessment Tools (FiSAT) User’s manual. FAO Comput. Inf. Ser. Fish., 8, 126 p. Genner MJ, Sims DW, Southward AJ, Budd GC, Masterson P, McHugh M, Rendle P (2010). Body size-dependent responses of a marine fish assemblage to climate change and fishing over a century-long scale. Global Change Biol., 16: 517-527.Crossref Gulland JA (1971). The fish resources of the oceans. West by fleet survey. Fishing News (Books) Ltd., for FAO, 255 p. Konan et al. Jarre-Teichmann A, Christensen V (1998). Comparative modelling of trophic flows in four large upwelling ecosystems: global vs. local effects. In: Durand MH, Cury P, Mendelssohn R, Roy C, Bakun A, Pauly D (Eds), From Local to Global Changes in Upwelling Systems, ORSTOM, Paris: pp. 423-443. Jones R (1984). Assessing the effects of changes in exploitation pattern using length composition data. FAO Fish. Tech. Pap., 256 p. Le Cren ED (1951). The length-weight relationship and seasonal cycle in gonadal weight and condition in the perch (Perca fluviatilis). J Ani. Eco., 20: 271-279. Nandikeswari R, Sambasivam M, Anandan V (2014). Length Weight Relationship of Terapon jarbua (Forsskal, 1775) from Puducherry Waters. Int. J. Biol. Vet. Agric. Food Eng., 8 (3): 271-275. Nielson LA, Johnson DL (1983). Fisheries techniques. American Fisheries Society, Bethesda, Md, 468 pp. Patterson K (1992). Fisheries for small pelagic species: An empirical approach to management targets. Rev. Fish Biol. Fish., 2(4): 321-338.Crossref Pauly D (1979). Theory and management of tropical multispecies stocks: a review with emphasis on the Southeast Asian demersal fisheries. ICLARM Stud. Rev., 1, 35 p. Pauly D (1980). On the interrelationship between natural mortality, growth parameters and mean environmental temperature in 175 fish stock. J. Con. Int. Expl. Mer., 39 (3): 175-192.Crossref Pauly D (1982). Studying single-species dynamics in a tropical multi-species context. In: Pauly D, Murphy GI (Eds). Theory and management of tropical fisheries. ICLARM Fishbyte, 3:13-14. Pauly D (1984). Fish population dynamics in tropical waters: a manual for use with programmable calculators. . 230 ICLARM Stud. Rev., 8, 325 p. Pauly D, David N (1981). ELEFAN-I BASIC program for the objective extraction of growth parameters from length frequency data. Meeresforchung, 28: 205-211. Pauly D, Morgan GR (1987). Length-based methods in fisheries research. ICLARM Conference Proceedings 13. International Center for Living Aquatic Resources Management, Manila, Philippines, and Kuwait Institute for Scientific Research, Safat, Kuwait. 468 p. Pauly D, Munro JL (1984). Once more on the comparison of growth in fish and invertebrates. ICLARM Fishbyte 2, 21 p. Quinn TII, Deriso RB (1999). Quantitative fish dynamics. Oxford University Press, New York, 542 p. Salzen EA (1957). A trawl survey of the Gold Coast. J. Cons., 23 (1): 72-82.Crossref Sparre P, Venema SC (1992). Introduction to tropical fish stock assessment, part 1: Manual, Food and Agricultural Organization of the United Nations, Rome. FAO Fish. Tech. Pap., 306 (1), 376 p. Sparre P, Venema SC (1998). Introduction to tropical fish stock assessment. Part 1. Manual. FAO Fish. Tech. Pap., 306 (1),407 p. Wang Y, Liu L (2006). Estimation of natural mortality using statistical analysis of fisheries catch-at-age data. Fish. Res., 78: 342-351.Crossref Weber W (1976). The influence of hydrographic factors on the spawning time of tropical fish. In: Tiews K (ed), Fisheries resources and their management in Southeast Asia: pp. 269-281. Wolff M (1989). A proposed method for standardization of the selection of class intervals for length frequency analysis. Fishbyte, 8(1), 5.


© Copyright 2026