
The Alcohol Treatment Centre is an innovative and necessary response... placed on health and police services by severe alcohol intoxication...
The Alcohol Treatment Centre is an innovative and necessary response to the demand placed on health and police services by severe alcohol intoxication exhibited by patrons of the night time economy in Cardiff. It successfully diverts intoxicated patients away from the Emergency Department and therefore reduces their impact on this clinical environment. The consequence is that ambulance services benefit as do the police. The Alcohol Treatment Centre is a necessary response to acute intoxication in the night time economy. Cardiff University Violence & Society Research Group School of Dentistry Cardiff SC Moore ATC Evaluation May 2013 1 Executive Summary The Cardiff Alcohol Treatment Centre (ATC) aims to provide additional capacity to offset the high volume of acutely intoxicated individuals currently attending University Hospital of Wales Emergency Department and who, in consequence, reduce service capacity across ambulance, police and health services with broader implications for the Cardiff community. The ATC is open two evenings each week, targeted at times when attendance for alcoholrelated harm is expected to be high. The ATC pilot successfully diverted patients away from the Emergency Department and was therefore associated with a significant reduction in alcohol-related attendances, a significant reduction in ambulance referrals to the Emergency Department and a significant decrease in ambulance handover times at the Emergency Department. However, evidence also suggests that the additional capacity provided by the ATC across the pilot period was associated with an increase in demand for health services, possibly due to pre-existing unmet need in the night time economy. Data suggests that across the pilot period use of the ATC increased, suggesting a beddingin period where partnership awareness of the ATC increased over time. Across the pilot, clearly defined and effective management structures and procedures were developed, a strong multi-partner approach to acute alcohol intoxication was demonstrated and the Centre benefited from strong leadership and enthusiastic staff. Similarly, communication between partners improved across the pilot period resulting in greater awareness of the ATC, clearer referral pathways and collaboration. The ATC is an exemplary model of service innovation and partnership working that yielded tangible benefits to the local community. The ATC provides a relaxed, orderly environment that benefited from the presence of a police officer. In comparison, ED could become overwhelmed during evening periods, lower priority patients left to wait for long periods who, in turn, could become anxious or aggressive. This is compounded by friends of patients also attending, interfering and impacting on the care environment. Diverting patients to the ATC resulted in the ED becoming less chaotic. The ATC therefore was of benefit to both patients, those escorting them and next of kin. The Civil Contingencies Act 2004 requires that Health Boards make plans and prepare for major emergencies, or major incidents; occurrences that present a threat to the health of the community or disruption to services. The volume of those attending the Emergency Department with alcohol related harm could be defined as sufficient to meet this definition of a major incident, albeit one that has become normalised. The ATC is an essential innovation. Evidence suggests that police officers, working in pairs, were required to escort patients to ED on occasion. This would deplete police resources in the night time economy. The availability of the ATC adjacent to the city centre would mean officers are able to return to duties more rapidly. The administration of patients was paper-based and practitioners were unable to refer to patients’ prior history using data systems. This delayed patient data being entered onto patient management systems. 1 SC Moore ATC Evaluation May 2013 Both Police Officers and Street Pastors play an important role in determining who should be referred into unscheduled care although neither have clinical expertise. In consequence factors unrelated to patients’ presenting symptoms can influence the decision to refer or not. The ATC extends clinical expertise into the night time environment and therefore provides an accessible and potentially safer referral pathway. This is coupled with the general observation that unscheduled care is misused with numerous examples of unnecessary attendances generally. The ATC provides clinical expertise that is effective in providing early and rapid opportunities for triage without requiring attendance at the Emergency Department. Irrespective of the ATC’s success, the development and collaboration that created the pilot is an exemplary example of partnership working. Leadership, innovation, expertise and communication between partners contributed to the identification and service requirements required to offset the impact of alcohol-related harm on the community. The ATC provides a good opportunity to develop systems to address the causes of alcoholrelated harm. There are therefore opportunities for further innovation in terms of intervention and referral and the provision of data concerning patients place of last drink to partners so that both individual and contextual contributors to alcohol related harm can be addressed. However, there is only minimal intervention and referral activity evident in the ED and ATC. Drunk and incapable is no longer a criminal offence and police officers refer the intoxicated into unscheduled care where they typically sober up and are discharged home. It is concluded that the ATC pilot resulted in a net benefit to Health, Ambulance and Police services as well as patients, their families and the community generally. 2 SC Moore ATC Evaluation May 2013 2 Authors Professor Simon Moore is a member of the Violence and Society Research Group based in the School of Dentistry and DECIPHer (Centre for the Development and Evaluation of Complex Interventions for Public Health Improvement) a UKCRC Public Health Research Centre of Excellence, both at Cardiff University. Dr Vas Sivarajasingam is Reader in oral and maxillofacial surgery at Cardiff University and honorary consultant in the Cardiff and Vale NHS Trust. Marjukka Heikkinen is a registered nurse with expertise in the area of substance misuse. All authors declare that they have no conflicting interests that would affect the conclusions presented in this report. Contact details: SC Moore Violence & Society Research Group School of Dentistry Cardiff University Heath Park Cardiff CF14 4XY Email: mooresc2:cardiff.ac.uk Telephone: 029 2074 4246 3 Acknowledgements The authors would like to thank the following for their assistance with the work presented here. Sarah-Jane Bailey Claire Bevan James Brewster-Liddle Susan Brown Tim Davies Nici Evans Conrad Eydmann Dennis Gray Britt Hallingberg Morgan Hart Brian Hayes Chris Holloway Greg Lloyd Iain MacAllister Cardiff Youth Offending Service Divisional Nurse Medicine, Cardiff and Vale University Health Board Cardiff & Vale University Health Board A&E Department Welsh Ambulance Services Headquarters South Wales Police Cardiff Partnership Board Substance Misuse Strategy and Development, Cardiff and Vale University Health Board Deputy Director, National Drug Research Institute, Perth, Australia Violence & Society Research Group, Cardiff University Students Union, Cardiff University London Ambulance Trust Cardiff and Vale University Health Board Welsh Ambulance Service Trust Principal Researcher (Alcohol), Scottish Government 3 SC Moore ATC Evaluation May 2013 Karen McNeil Jo Mower Claire O’Brien James O’Donnell Nick Page Mike Parfitt Wayne Parsons Andrew Phillips Stephen Porter Loretta Reilly Jonathan Shepherd Tim Stockwell Mel Westlake Mo Williams South Wales Police Cardiff & Vale University Health Board A&E Department Violence & Society Research Group, Cardiff University South Wales Police Violence & Society Research Group, Cardiff University Cardiff County Council Cardiff & Vale University Health Board A&E Department Cardiff & Vale University Health Board NHS Wales Informatics Service Cardiff & Vale University Health Board A&E Department Director, Violence & Society Research Group, Cardiff University Centre for Addictions Research, University of Victoria, Canada Cardiff & Vale University Health Board Corporate Governance St John’s Ambulance Senior Research Fellow, Applied Social Science, University of Rowdy Yates Stirling And all those who willing gave their time to this project 4 Glossary of Terms AAI AHW ATC BAI CDM ED ENP ISB LARC PCSO PCT QMAE UHB WAST Acute alcohol intoxication Alcohol Health Worker Alcohol Treatment Centre Brief Alcohol Intervention Clinical Decision Maker Emergency Department Emergency Nurse Practitioner Information Standards Board London Alcohol Recovery Centre Police Community Support Officers Primary Care Trust Quarterly Monitoring Accident and Emergency Central Returns Cardiff and Vale University Health Board Welsh Ambulance Service Trust 4 SC Moore ATC Evaluation May 2013 5 Contents 1 2 3 4 5 Executive Summary ............................................................................................. 1 Authors ................................................................................................................ 3 Acknowledgements.............................................................................................. 3 Glossary of Terms ............................................................................................... 4 Contents .............................................................................................................. 5 5.1 Figures.................................................................................................................... 6 5.2 Tables ..................................................................................................................... 6 6 Introduction .......................................................................................................... 7 6.1 The Need for Healthcare in the Night Time Economy ............................................. 7 6.2 Acute Alcohol intoxication and NHS Targets ......................................................... 14 7 8 9 Defining Success ............................................................................................... 16 Design and Methods .......................................................................................... 17 Findings ............................................................................................................. 18 9.1 Observational and Interview Data ......................................................................... 18 9.2 Descriptive Statistics ............................................................................................. 24 9.3 Analyses ............................................................................................................... 25 9.4 Cost Analysis ........................................................................................................ 33 10 Discussion ......................................................................................................... 35 10.1 11 12 13 14 General Discussion ............................................................................................... 37 Conclusion ......................................................................................................... 41 Recommendations ............................................................................................. 41 References ........................................................................................................ 43 Appendices ........................................................................................................ 47 14.1 NHS Reference Costs ........................................................................................... 47 14.2 Ambulance Handover Costs ................................................................................. 47 5 SC Moore ATC Evaluation May 2013 5.1 Figures Figure 1 – Histogram of breathalyser scores by gender from a survey of the Night Time Economy ............................................................................................................................... 8 Figure 2 – Out-take from the original document presented to Cardiff and Vale Health Board (January 2012) that eventually motivated the partnership commitment to the Alcohol Treatment Centre ................................................................................................................ 11 Figure 3 – Overview of the interrelationships between services in managing acute alcohol intoxication in the Night Time Economy............................................................................... 12 Figure 4 – A trolley bay in the Alcohol Treatment Centre .................................................... 18 Figure 5 – Patient pro-forma for paramedics ...................................................................... 19 Figure 6 – Distribution of Emergency Department recorded assault related injury and severe alcohol intoxication attendances by arrival time................................................................... 24 Figure 7 – Proportion of total attendances, between 8pm and 4am, designated as assaultrelated or presenting with alcohol intoxication as the primary symptom by day of week ...... 24 Figure 8 – Episode duration for patients attending the Emergency Department by patients already in attendance at the Emergency Department at time of arrival ................................ 25 Figure 9 – Density histogram for episode duration for those attending between 8pm and 4am, 16 years of age or older, and excluding patients who did not wait to be seen ............. 28 Figure 10 – Total number of attending patients in the Alcohol Treatment Centre by day ..... 30 Figure 11 – Ambulance handover duration for ambulances attending the Emergency Department by patients already in attendance at the Emergency Department at time of arrival .................................................................................................................................. 31 5.2 Tables Table 1 – Daily descriptive statistics for attendances during evening periods (8pm to 4am) from 31 December 2009 to 1 January 2013 ........................................................................ 26 Table 2 – Time-series regression models assessing the association between ATC being open and control variables on ED attendance outcome measures ...................................... 26 Table 3 – Regression model assessing the association between ATC being open and patient episode duration in ED ........................................................................................................ 28 Table 4 – Mode of arrival at the Alcohol Treatment Centre (where referrer noted) .............. 29 Table 5 – Discharge route from the Alcohol Treatment Centre (where discharge route noted) ........................................................................................................................................... 29 Table 6 – Daily descriptive statistics for evening periods (8pm to 4am) ............................... 32 Table 7 – Association between Alcohol Treatment Centre operation and log ambulance handover time at ED in the evening period.......................................................................... 32 Table 8 – Descriptive statistics for Street Pastor activity ..................................................... 33 Table 9 – Itemised costs for the Alcohol Treatment Centre ................................................. 33 Table 10 – ICD-10 codes for blood alcohol level ................................................................. 40 6 SC Moore ATC Evaluation May 2013 6 Introduction The purpose of this report is to evaluate the pilot of an Alcohol Treatment Centre (ATC) in Cardiff. The evaluation covers the period September 2012 up to and including New Years Eve 2012. This report does primarily considers whether the ATC successfully diverts patients from the Emergency Department and the systems in place to achieve this. The report does not consider clinical outcomes. 6.1 The Need for Healthcare in the Night Time Economy According to official violence data Cardiff continues to be one of the safest cities in the UK [1]. Like most cities, however, Cardiff is characterised by a high density of premises licensed for the on- and off-sale of alcohol. The dominance of licensed premises attracts visitors from across the UK and, accordingly, rates of alcohol-related harm have a significant impact on health services in the local area. The influx of the acutely intoxicated is clustered around Friday and Saturday evenings and other key times [2, 3], and, as with cities across the world, it is further associated with significant events such as sporting events and national holidays [3, 4]. The costs of alcohol misuse in Wales are increasing with the NHS in Wales spending £70M-£85M each year on alcohol-related health problems [5]. Alcohol misuse is one of the most serious public health challenges in Wales. It effects individual health outcomes, local communities and promotes crime. It impacts on health service use and there is now a policy focus in Wales on tackling the health and wider harms associated with alcohol [6]. Approximately 70% of admissions to Emergency Departments (ED) are alcoholrelated at peak times [7]. These additional attendances cause overcrowding in ED and accordingly impact on all patients, staff and the community generally. This increased burden on health services places all patients at greater risk, prolongs pain and suffering, increases patient waits, increases patient dissatisfaction, increases ambulance handover times, decreases physician productivity, increases frustration among staff and promotes violence [8-11]. Alcohol is available in many countries across the world and recent estimates suggest alcohol misuse is accountable for 2.3 million premature deaths each year worldwide [12] plus many other non-fatal conditions including disease, injury and violence [13, 14]. There are numerous immediate risks associated with acute alcohol intoxication (AAI). Alcohol is a central nervous system depressant and therefore promotes irregular breathing, confusion and if left untreated AAI ultimately leads to seizures, coma, respiratory, cardiac arrhythmia and arrest. An attenuated gag reflex can lead to aspiration of the vomitus into the lungs, asphyxiation, pulmonary edema and death. AAI further causes vasodilation at the skin level and therefore increases the rate of heat lost from the body in turn increasing the risk of hypothermia. Alcohol also affects judgement and increases the likelihood of accidents, injury, violence, antisocial behaviour, unsafe sex and therefore sexually transmitted infection. Survey data, collected across the South Wales, suggests that alcohol misuse is normalised. Figure 1 presents breathalyser data from respondents to a survey of alcohol use (N = 1,997) in South Wales [15]. The top 10% of the most intoxicated drinkers surveyed yielded an average BrAC of 106.37μg/100ml (n = 183), three times the UK and US drink driving limits (35 μg/100ml) and above the threshold of severe intoxication (70 μg/100ml) [16]. Of the respondents, 35.93% were female, although this is not a sampling bias as typically there are more men than women in Cardiff’s NTE [3]. For the purposes of this report we define AAI as a state that places individuals at immediate risk of harm and as such require medical assistance. These harms are included above but also include risk of injury and assault [17, 18] and therefore indicate that they should be removed to a place of safety. 7 SC Moore ATC Evaluation May 2013 Figure 1 – Histogram of breathalyser scores by gender from a survey of the Night Time Economy Although the consumption of alcohol is legal for those aged five years and older there exists legislation that both restricts the sale and consumption of alcohol [19], criminalises the misuse of alcohol and the effects of alcohol are further implicated in a range of statutory offences including acts of violence and criminal damage. Alcohol use and misuse therefore figures prominently in the criminal justice system. While the 2003 Licensing Act is currently the primary legislation governing alcohol use and supply the fact that alcohol is implicated in a range of criminal acts means AAI also falls within the 1998 Crime and Disorder Act, 2001 Criminal Justice and Police Act, 2006 Violent Crime Reduction Act, 2003 Anti-social Behaviour Act and others. Alcohol-specific crimes include being drunk and incapable or drunk and disorderly in a public place or on licensed premises, being drunk in charge of a child under seven years of age, buying alcohol for someone who is already drunk, and selling alcohol to a drunken person. For those exhibiting AAI there are a number of referral and awareness schemes available. Currently there are on-going efforts to develop the use of Sobriety Schemes in England and Wales. These Schemes find their origins in the Violent Crime Reduction Act 2006 and the Violent Crime Reduction Act 2006 (Drinking Banning Orders) Regulations 2009. Those who have behaved in a disorderly manner or who have committed a criminal offence while under the influence of alcohol are given the option of a civil court imposed period of sobriety or a tougher criminal punishment. This conditional caution scheme targets low-level offences including drunk and disorderly, criminal damage and public disorder affray and will be facilitated through the Legal Aid, Sentencing and Punishment of Offenders Bill currently progressing through Parliament1. Legislation and associated guidance encourages a partnership approach to managing areas in which alcohol use is prolific. These attempts to control behaviour and respond to the symptoms of alcohol misuse within particular areas further involves partnerships between those who supply alcohol, private security, resident groups, local authorities, and health boards, partnerships that are not necessarily harmonious in their view of the severity, extent and causes of alcohol-related harm [20]. For example, Local Government will often highlight 1 http://www.webcitation.org/6ELrO8vVa 8 SC Moore ATC Evaluation May 2013 a “vibrant” NTE as a positive feature of a city whereas health services might highlight the harms generated in such locations. Of the principal statutory partners involved with managing the NTE only the police will visibly work to reduce levels of disorder and are therefore the only partner engaged directly with crime reduction. In addition to this role, the police are also able to refer onwards those whose behaviour falls under the remit of drunk and disorderly and drunk and incapable. In South Wales this includes the Integrated Offender Interventions Service, that can include treatment for alcohol abuse and substance misuse, developed through partnerships between the Welsh Government, Wales Probation Trust, NOMS Cymru and South Wales Police. However, in terms of managing AAI in the NTE, and irrespective of any offense committed, welfare is primary. Guidance issued by the Association of Chief Police Officers and the National Policing Improvement Agency [21] states “[d]runk and incapable means that an individual has consumed alcohol to the point of being unable to either walk unaided or stand unaided or is unaware of their own actions, or unable to fully understand what is said to them." “As a guide, it is suggested that, if someone appears to be drunk and showing any ‘aspect’ of incapability which is perceived to result from that drunkenness, then that person should be treated as being drunk and incapable.” “A person found to be drunk and incapable should be treated as being in need of medical assistance and hospital and an ambulance should be called.” “If a drunk and incapable person who is under arrest declines or is refused medical treatment, they should, only as a last resort, be taken into custody at a police station.” "The fact that a person has declined or has been refused treatment does not absolve the police or medical services of their responsibility." One reason for the need of clinical expertise in managing AAI is that head injury victims and people with diabetes may appear to be drunk. The risks associated with AAI are, as already noted, numerous and an eleven year audit of deaths in custody by the Independent Police Complaints Commission found a significant proportion involved alcohol or alcohol and drugs (60% in 2008/9) [22]. The first recommendation in this report being “[p]olice forces and local health service providers and commissioners should adopt the ACPO Safer Detention Guidelines (2006) and develop protocols on the care of drunken detainees. Given the strong link between alcohol and deaths in custody the Home Office and Department of Health should pilot alternative facilities for intoxicated people with access to medical provision, with a view to developing a national scheme.” This relationship between deaths in custody and alcohol is not unique to England and Wales, similar patterns are documented in Australia [23], Canada [24] and housing the intoxicated in custody is strongly opposed in Scotland [25]. A systematic review of violence in emergency departments documented an association between increased violence against staff and longer waiting times [11] and, as discussed (Section 6), ED bottlenecks attributable to increased attendances for alcohol-related harm, coupled with a general increase of pressure on available resources [26], contributes to a range of effects including reduced ambulance capacity. It is further known that unnecessary attendances undermine the provision of care in ED [26]. A report ordered by the House of Commons into NHS ambulance services contained the observation that “[d]elays in handing over patients from ambulances to hospitals lead to poor patient experience and reduced capacity in ambulance services. Over one-fifth of patient handovers from ambulance crews to ED staff at hospitals take longer than the 15 minutes recommended in guidance. If ambulances are queuing in hospitals, they are not available to take other calls. Commissioners should take a consistent approach to penalising hospitals that do not adhere to the guidance of 15 minute handovers and the Department should also develop a quality indicator for hospital trusts on hospital handover times” [27]. Opportunities to reduce impact on ED attendances include diverting low priority emergency ambulance 9 SC Moore ATC Evaluation May 2013 (999) calls to NHS Direct and enabling paramedics to either discharge patients or transport them to alternative sources of care [28]. However, the presence of minor injury services and introduction of NHS walk-in centres and NHS Direct has not been shown to have any effect on emergency department attendances [28]. While partnerships are necessary in managing the NTE, the health needs of those exhibiting AAI are urgent leading ACPO to recommend facilities alternative to custody that are able provide healthcare. In Cardiff the only facility offering healthcare is the local ED. This is not the case in some countries, however. There is a long history of “sobering up centres” where those exhibiting public intoxication are diverted into noncustodial quasi-medical detoxification services until sober. The earliest schemes are found in Russia (from 1904), "catch-stations" in the former Czechoslovakia and "drop-in" centres in Denmark and Switzerland. Some are specific to alcohol intoxication, while, for example, those in Denmark and Switzerland also offer needle exchange facilities. While in many jurisdictions public intoxication is a criminal offense, the provision of sobering up services shifts the focus to one of health. This is explicit in the North American 1971 Uniform Alcoholism and Intoxication Treatment Act: “that because alcoholism is an illness, a homeless alcoholic could not avoid being drunk in public and therefore could not be punished for his public intoxication”. The Uniform Alcoholism and Intoxication Treatment Act motivated the development of detoxification centres that accepted clients exhibiting AAI, diverting them from police custody to an healthcare setting. An evaluation of these detoxification centres [29] found evidence for an increase in recidivism and fewer accepting referral to treatment services. Moreover, an overall increase in the number of those exhibiting AAI was noted, suggesting that the additional capacity had also increased demand [29]. The North American detoxification centres also process those who have consumed illicit substances and analyses of presentations found that the characteristics of clients changed from 1984 to 1996. The mean age at admission declined, those who were unemployed increased and there was a 25% decline in those presenting with alcohol intoxication which was coupled with a twofold increase in cocaine use and a fourfold increase in heroin use [30]. In Australia, as in the USA, a series of “sobering-up centres” were established following the publication of the 1991 Royal Commission into Aboriginal Deaths in Custody. The primary motivation was to alleviate the harms due to the then custodial response to public drunkenness, which they accomplished [31]. There are aspects of Australian sobering-up centres that suggest the models developed there may not map directly onto UK needs. In particular, the Australian sobering-up centres are focused on diverting the Aboriginal community away from police custody and are mostly located in rural areas; whereas the Cardiff ATC is focussed on diverting patients away from the ED and is located in a city centre location. However, there is very little available literature on sobering-up centres in the UK [32] and it is worth therefore considering what is regarded as best practice in the Australian context. In a study of 25 projects Strempel, Saggers, Gray and Stearne [33] found key aspects of success included “clearly defined and effective management structures and procedures; trained staff and on-going staff development programs; good multi-strategy and collaborative approaches; strong leadership; and adequate and continuing funding.” Although facilities to divert AAIs away from police custody and hospital ED have been trialled across the UK, the Cardiff ATC is unique in that it is led by nurse practitioners, clinical decision makers (CDM) who are able to assess and discharge patients if necessary. One other long-running project is found in Soho, London by the London Ambulance Service NHS Trust. A “Booze Bus”, an ambulance that can hold up to five patients, was originally used to gather and care for the severely intoxicated. The London Alcohol Recovery Centre (LARC) in Westminster, funded by Westminster PCT, began in 2010, initially operating just in 10 SC Moore ATC Evaluation May 2013 December. From April 2012 to March 2013 the LARC received support to operate on Fridays and Saturdays and from January 2013 Thursdays were also included in routine operation. The motivation was that the severely intoxicated were too vulnerable to be left on their own yet the best treatment was time, allowing them to sober up. Most patients did not therefore require treatment in the ED and would likely disrupt services in ED should they be taken there. LARC was originally developed by the London Ambulance Service and is therefore staffed by paramedics with support from Ambulance Technicians. In addition, Turning Point, a charity providing support for substance misusers and others, supplied an alcohol liaison officer. LARC accepted 180 patients across the ten nights of Christmas 2011 and an additional 41 patients on New Year’s Eve 2011. Patients were referred to the centre by paramedics, police officers and Police Community Support Officers (PCSO). LARC is housed in a NHS Walk-in Centre. Walk-in Centres are designed to complement GP and ED services, providing convenient access to health services for those with minor injuries and illnesses. They also provide advice, for example on matters such as tobacco cessation and sexual health. No formal documentation relating to or evaluation of LARC is available at this time. Figure 2 – Out-take from the original document presented to Cardiff and Vale Health Board (January 2012) that eventually motivated the partnership commitment to the Alcohol Treatment Centre Similar to LARC, the ATC was set up as a response to AAI affecting multiple statutory services across Cardiff and further afield. Figure 2 presents an out-take from the original document presented by Claire Bevan to UHD that began the journey of commitment to the ATC. The ATC was championed by nurse Nici Evans. One of Nici Evans’ roles was, and still is, to ensure UHB meets partnership priorities one of which is alcohol-related harm (“Cardiff, What Matters, 2010:2020 – The 10 Year Strategy”2). A series of general themed meetings were held culminating in the Proud Capital Conference in Cardiff, a conference that facilitated partnership approaches through making available small pots of money for 30 minute “brainstorming” workshops. This event brought together key partners including 2 http://www.webcitation.org/6Eap0GZWn 11 SC Moore ATC Evaluation May 2013 opportunities for financial support from Conrad Eydmann, UHB substance misuse lead, Greg Lloyd from the Welsh Ambulance Trust, James Brewster-Liddle and Wayne Parsons nurse practitioners from UHW ED. It was through these meetings that the primary goals of the ATC were set out. The ATC was developed in part from an earlier project, a collaboration between ED Emergency Nurse Practitioners (ENP) and WAST to establish a triage ambulance. ENPs in Cardiff had, for some time, worked to reduce the impact of AAI on ED and had considerable experience of extending the ED footprint more fully into the NTE. ENPs accompanied paramedics on the triage ambulance and were therefore able to triage those requesting an ambulance, provide minor treatment and discharge where appropriate. The Triage Ambulance brought the ED more into the NTE and provided opportunities for CDMs to determine need, the goal being to reduce some of the unnecessary attendances at ED. Figure 3 – Overview of the interrelationships between services in managing acute alcohol intoxication in the Night Time Economy Referring to Figure 3., those exhibiting AAI and who are judged as requiring unscheduled care can come into contact with a range of agencies. The Street Pastors3 are an interdenominational church-led voluntary organisation that engages with people on the streets to provide support. They are prominent in the NTE and through their patrols can assist those in need. Their intervention can result in a call for an ambulance to escort someone to ED. Similarly, police patrols can either refer AAIs to Street Pastors, freeing police time to manage the NTE, or call an ambulance. Ambulance assistance may be requested directly by members of the public, staff in licensed premises and other affiliated organisations. A 999 call to an ambulance obligates WAST to provide an ambulance and escort the person requiring assistance to a CDM for assessment, unless there is a paramedic practitioner onboard who is able to assess and discharge, if warranted. AAIs can also transit to ED directly using taxis and other private transportation. While Street Pastors have become common sights in towns and cities across England and Wales, they are a voluntary service and therefore have no statutory obligation to provide support. In Cardiff, Street Pastors typically patrol the NTE from 10pm to 4am on Fridays and Saturdays and have been doing so for four years. There are approximately 70 volunteers in Cardiff. The Street Pastor is an inter-denominational response to urban problems (violence and crime), pioneered in 2003 by Rev Les Isaac (Director of the Ascension Trust). Volunteers engage with people on the streets to care, listen and engage in dialogue. Costs are covered by public donations. There are now 250 Street Pastor initiatives across the UK, 3 www.streetpastors.co.uk 12 SC Moore ATC Evaluation May 2013 overseeing 10,000 trained individuals who provide over 600,000 volunteer patrol hours every year. Street Pastors in Cardiff co-operate with premises’ Door Security Staff, Taxi Marshalls and the police. They carry radios and can access CCTV operatives to request surveillance and/or assistance. Radios are further fitted with panic buttons. Street Pastors’ role in the city centre is to seek out the vulnerable and to protect them. Young men and women place themselves at risk through becoming excessively intoxicated, under-dressing in winter, walking barefoot, losing their belongings, friends and sense of direction. They collect broken glass from the street and dispose of it responsibly, hand out flip-flops (some patrons of the NTE will find their choice of footwear becomes uncomfortable and therefore decide to walk barefoot), bottles of water and confectionary. Street Pastors look for those at risk and seek to prevent harm. Volunteers receive training typically over twelve sessions. The topics covered include sociology, education, knowing your community, the police, counselling, drugs awareness, alcohol awareness, solvent awareness, probation, children’s services, youth culture, mentoring and mental health. Police guidance suggests that police officers are experts in who is and who is not drunk. ACPO and NPIA [21] define “drunk” according to the Collins English Dictionary “[i]ntoxicated with alcohol to the extent of losing control over normal physical and mental functions” and “[h]aving drunk intoxicating liquor to an extent which affects steady self-control”. As such, officers can choose to arrest those deemed Drunk and Incapable which “means that an individual has consumed alcohol to the point of being unable to either walk unaided, stand unaided, or is unaware of their own actions, or unable to fully understand what is said to them.” South Wales Police are the lead authority for managing the NTE in Cardiff. Typically, Friday and Saturday evenings will involve approximately 14 officers patrolling the NTE. Officers work in pairs and on the discovery of AAI officers will stay with that person until they can be handed over to another responsible party. Depending on perceived severity this can include Street Pastors and ambulance paramedics. On occasion, officers can also be required to escort patients to ED if there are no ambulances available or if an offender requires clinical attention. Officer presence in the NTE can reduce the likelihood that fractious encounters escalate to assault [34]. Therefore reducing police capacity in the NTE may also affect the prevalence of assault-related injury. Police and Street Pastors have little or no clinical expertise and police officers are guided to place the welfare of people first (see Section 6.1, page 7). Without CDMs and given a degree of risk aversion in those deciding whether to refer to ED or not, a proportion of ED attendances for AAI are likely to be unnecessary. As already noted (see Section 6.1, page 7), AAI can mask underlying injuries, cause dehydration and increase the risk of hyperthermia and one treatment option is to therefore allow the patient time in a safe environment to regain some sobriety in order that a better assessment can be made or they are sufficiently clear minded to find their way home. While CDMs are expected to triage and refer to ED those with suspected underlying injuries irrespective of CDMs’ judgement there will be a proportion of patients who do require a safe environment and can receive expert clinical attention but are unlikely to require anything more than a blanket. If they do transit to the ED then they will either take up clinical space or sit in the waiting room until seen. As AAI can lead to a loss of control over bodily function patients can become covered in their own vomit and faeces. Further, given the known relationship between alcohol and aggression [35-40] and the reduced capacity to comprehend their predicament the delay in receiving clinical attention, while clinically appropriate, can lead to frustration and aggression. The presence of AAI in ED therefore causes a deterioration of the clinical environment and therefore affects all users of this space. In addition, their presence stretches resources causing knock-on effects to the provision of services and ambulance handover times. 13 SC Moore ATC Evaluation May 2013 While the triage ambulance offers the opportunity to divert a proportion of AAIs from ED the requirement of a safe environment means a proportion still transit to ED unnecessarily. ENPs on the ATC project team had had experience of field hospitals and the innovation proposed was for a temporary treatment centre that provided a safe environment and staffed with at least one ENP. Furthermore, alcohol-related harm varies considerably and is usually clustered around significant social events and certain days. Accordingly, the ATC was planned to operate on those evening when the prevalence of AAI was expected to be greatest. In sum, the origins of the ATC were motivated by the multiple effects of AAI on partners and brought together expertise to put in place a solution that, if successful, would reduce AAIrelated attendance at ED. A space adjacent to Cardiff city centre was identified. This space was a church hall donated to the Archdiocese of Cardiff. The hall had been recently purchased and required significant work to allow the ATC to operate in there. Probation services provided manpower under the Community Payback Scheme, a scheme that allows members of the community a say in how offenders pay back the community. In addition, the ATC benefited from donations of time and materials from local builders and merchants suggesting that the ATC is best described as a community response to the problem of AAI in Cardiff. As a clinical space the ATC was subject to scrutiny from Health and Safety, the City Centre Fire Officer, WAST and UHB Risk Assessment Staff and accordingly the ATC fell within UHB governance framework. As the ATC was expected to produce clinical waste it was bound by legislation to ensure that waste was safely disposed of. Finally, ED and WAST collaborated on drafting an operational policy that was subsequently signed-off accordance with UHB policy and procedure. As these aspects of the ATC have received scrutiny they are not discussed further in this report. 6.2 Acute Alcohol intoxication and NHS Targets There are no generally accepted definitions of AAI that describes variation in levels of care provided by health services [26]. Furthermore, the position of severe alcohol intoxication is one that lacks clarity, both in treatment and aftercare. For example, patients who need to wait in ED for test results before a decision is made on a subsequent course of action can be excluded from ED episode duration statistics. Despite AAI requiring time for patients to sober up, no similar opportunity is available in ED reporting and they are therefore included in returns. Furthermore, there is a known under-reporting of alcohol intoxication in ED. Alcohol is only recorded if it is the only major symptom motivating attendance, otherwise, the presenting symptoms are recorded irrespective of alcohol use [41], despite alcohol probably being accountable for as much as 19% to 26% of all ED attendances [42]. Providers of NHS services are required to submit Quarterly Monitoring Accident and Emergency Central Returns (QMAE) to the Department of Health. These returns cover attendances at accident and emergency departments, minor injury units and NHS walk in centres. The Information Standards Board (ISB) approves information standards for the NHS and adult social care in England and accordingly provides guidance on what aspects of ED service delivery are to be recorded [43]. Within the guidance notes the process of recording and reporting attendance statistics is specified as follows (many of these measures are referred to and used in subsequent analyses): Time of Arrival 14 SC Moore ATC Evaluation May 2013 o The time of arrival should be recorded by the clinician (nurse or doctor) carrying out initial triage/assessment or A&E reception whichever is earlier. o For ambulance cases, arrival time is when hand over occurs or 15 minutes after the ambulance arrives at A&E, whichever is earlier. In other words if the ambulance crew have been unable to hand over 15 minutes after arrival that patient is nevertheless deemed to have arrived and the total time clock started Time of Departure o Total time in the Department ends when the patient is admitted, transferred, or discharged home. Admission. Admission is defined as an emergency admission via A&E under admission code 21. Time of admission is defined as the time when such a patient leaves the department to go to: An operating theatre; A bed in a ward (see definition of ward below); An x-ray or diagnostic test or other treatment directly en route to a bed in a ward (as defined below) or operating theatre. However leaving A&E for a diagnostic test or other treatment does not count as time of admission if the patient then returns to A&E to continue waiting for a bed. o Transferred. Transfer is defined as transfer to the care of another NHS organisation or other public/private sector agency (for example social services). Time of transfer is defined as when the patient leaves the department. o Discharged home. Time of discharge home is defined as when the patient's clinical episode is finished, unless they are waiting for hospital arranged transport or social care / social service support. In the latter case the time of departure is the time the patient actually leaves the department. Patients awaiting family or 'private' transport or who wish to make their own arrangements should be considered discharged once the clinical episode is complete whether or not they have actually left the department o Time not recorded: Organisations should not have unknown waits. Any unknown waits which are reported will be excluded from both the numerator and denominator in calculation of the percentage within 4 hour calculation. Within this guidance, exceptions are made for patients who need more than four hours for observation or assessment. “For a few patients, a period of assessment and/or observation of greater than 4 hours before a decision to admit or discharge is made will be beneficial. This group would include some patients awaiting results of investigations, CT, reduction of fractures/dislocations, clinical observation for improvement, time critical diagnostics etc.” “Every effort should be made to accommodate these patients, for their comfort, away from the main A&E in a dedicated observation/assessment ward. If this ward meets the criteria set out above the patient should be treated as admitted for the period required for observation. In most cases the admission will be very short - often much less than 24 hours. However the criteria for deciding if the patient is admitted and the time of admission applies in the same way it would to any other patient being admitted for a 24 hour or longer stay in the hospital.” “However where these patients remain in A&E or are accommodated in an environment that does not meet the criteria set out above to help define a ward they should remain within the total time count until they are either admitted, transferred or discharged.” While one motivation for the ATC might be that the increased capacity would help ED achieve these targets, there are questions on whether they are applicable generally or whether AAIs should be treated as an exception. This is returned to below. 15 SC Moore ATC Evaluation May 2013 7 Defining Success The primary goal of the ATC was to divert AAIs from ED and reduce load on ambulance services. Analysis of ED data on days when the ATC were open and when it was closed was therefore used to determine the impact on ED alcohol-related attendances. The literature concerning health service provision for unscheduled care highlights the complex relationship between statutory partners, in particular ambulance and ED [8, 44-46], and further highlights how patient numbers can affect episode duration and ambulance handover times. Secondary analyses therefore considered how ED episode duration and ambulance handover times varied on days when the ATC were open and when it was closed. While the literature on services similar to the ATC is limited one consistent theme was that the provision of diversionary services saw increased demand for healthcare, or net widening. Secondary analyses therefore considered the total number of attendances for alcoholrelated harm across both ATC and ED for days when the ATC was open and when the ATC was closed. Greater ambulance handover times means that the number of available ambulances is reduced. As ACPO guidelines place welfare as a priority if ambulance capacity is reduced then this may require officers to escort AAIs to ED directly. Secondary analyses therefore considered the volume of police escort referrals to ED for days when the ATC was open and when the ATC was closed. The ATC is an additional service to the usual provision of unscheduled care in Cardiff and therefore attracts additional costs. Diverting AAIs from ED to the ATC would represent a saving to the ED and therefore to explore ATC cost efficiency a breakeven analysis is conducted. This evaluation considers ATC function over the initial pilot period (September 2012 to December 2012). As a pilot, our expectation was that the service would develop across this period, adapting to unforeseen circumstances to improve provision. A key measures of success therefore included evidence of adaptation in both quantitative and qualitative data. In addition to quantitative analyses, an embedded process evaluation was conducted. Data were used to examine how the ATC is implemented and to facilitate interpretation of outcome effects [47]. In line with MRC guidelines [48], this process evaluation provides information on opportunities for ATC refinement through identifying key processes, impacts and outcomes. Following the framework proposed by Steckler [49] and adopting a critical realistic approach [50] to elucidate what works and in what context. The process evaluation covered the following themes: A characteristic of AAI is loss of bodily control and disruptive behaviour. Diverting AAIs away from ED therefore offered the prospect that the environment for other users of that space would improve. Evidence for any such effect was collected through observing both ATC and ED environments for days when the ATC was open and when the ATC was closed. Interviews were conducted with key partners in agencies associated with managing the NTE and the impact of the ATC on their operation was assessed, perceived risks and benefits of the ATC, barriers to implementation and opportunities for sustainability. In the case of Street Pastors, this also included analysis of their routine reports for 2012. 16 SC Moore ATC Evaluation May 2013 8 Design and Methods The project was assessed by the Dental Research Ethics Committee and designated as a service evaluation. Methods involved the analysis of three data types: quantitative analysis of routine data from WAST, South Wales Police and UHB, observational data and semistructured interview data. This approach facilitated methodological triangulation and thus a robust analysis that addressed outcomes discussed in Section 7. Anonymised ED attendance data was accessed from the Cardiff and Vale UHB Information Services. Data covered January 2010 up to 1 January 2013 and included all ED attendances (N = 353,521). Data included the date and time of attendance, time to first clinical contact, episode duration (the time from arrival to discharge), age and sex, whether attendance was due to an assault-related injury, source of referral, arrival mode, outcome and initial complaint. Binary indicators were added into these data to identify key dates. These dates included university and college term times for colleges local to Cardiff, New Years Eve, Freshers’ week (the first two weeks of the academic year), Christmas, Christmas Eve, Boxing Day, Halloween, bank holidays and Black Friday (the last working day before Christmas). Indicators for Freshers’ week applied to the entire range of dates within the defined period. For single day events, attendances in ED were denoted as occurring during that event if they attended between 12noon and midnight on the day of the event or between midnight and 4am the following day. Attendances were organised as a time series by year, month, day, hour and minute of arrival. There is a known under-reporting of alcohol intoxication in ED. Alcohol is only recorded if it is the only major symptom motivating attendance, otherwise, the presenting symptoms are recorded irrespective of alcohol use [41], despite alcohol probably being accountable for as much as 19% to 26% of all ED attendances [42]. This figure rises considerably when assault-related injury is considered [12]. Not only does alcohol increase the severity of injury [12, 51] estimates suggest 50% of perpetrators are intoxicated at the time of the offense [52] and, at peak times, 74% of assault-related attendances are intoxicated [53]. Two indicators were therefore used to determine ATC impact, assault-related injury and alcohol intoxication. Assault-related injury is a field completed at ED reception based on patient self-report. AAI was deduced using the free text portion of ED data where clinicians are able to note characteristics of the primary attending symptom (“alcohol”). Anonymised WAST data was accessed from the Ambulance Informatics Team for all UHW arrivals (N = 103,411), these data were restricted to all attendances at the ATC and UHW ED (98,753). Data included date and time of arrival at hospital, diagnosis and handover time. No handover times were available in the ambulance data for arrivals at the ATC. Event data were added into these data in the same way as the ED data. Interviews were conducted with members of South Wales Police, ED, ATC, UHB and Street Pastors. Interviews were conducted by two researchers and their notes compared to elucidate key themes. Key themes covered in interviews covered the points outlined in Section 7 and were revised after each interview. In some cases interviewees were interviewed a second time when issues emerged that had not been covered in the first interview. Observational work was conducted across three sites. At the ED when the ATC was open, at the ED when the ATC was not open, in the ATC and observers joined the Street Pastors to assess their role activity in the NTE generally. Street Pastor reports were accessed and analysed. These reports are not a part of any formal audit process, but do summarise Street 17 SC Moore ATC Evaluation May 2013 Pastor activity, including some information on who they attended, where they took people and the nature of the complaint. 9 Findings 9.1 Observational and Interview Data 9.1.1 Alcohol Treatment Centre From September 2012 to early November 2012 the ATC opened Wednesdays and Saturdays, thereafter it opened on Fridays and Saturdays. The reason for opening on Wednesdays initially was to capture the effect of students returning to colleges and universities in the Cardiff area and Wednesdays had typically been a day of the week when greater than usual AAI had been observed in ED during these periods. The original ATC proposal was for a physician with support from ENPs and HCAs. This was revised to the final specification whereby the ATC was staffed by ENPs, HCAs with support from St John’s Ambulance. Evidence suggests that nurse practitioners are regarded as safe and effective [28] in the treatment of AAI. Furthermore, it was originally planned that AAIs’ behaviour would be recorded on video cameras and then, once they were sober, have that footage played back to them, an intervention with no evidence for effectiveness. The expectation being that by replaying their state of intoxication to patients when they were sober would motivate them to consider their behaviour and therefore attenuate their future alcohol consumption. This intervention was, however, dropped at the request of the funders. The ATC was housed in a large spacious hall, it was clean, well-lit and comfortable. Privacy screens separated the hall into bays and in each there was one trolley. Trolley heights were adjusted so that they were low, in case AAIs fell. There was trolley space for a maximum of 15 patients, although with additional floor mats capacity could be increased if clinically appropriate. Figure 4 – A trolley bay in the Alcohol Treatment Centre When the ATC was open on Fridays and Wednesdays it was staffed by one ENP and one Healthcare Assistant (HCA). On Saturdays staffing was increased to two ENPs and one HCA. On exceptional evenings when the volume of AAI was expected to be high, for example New Year Eve, staffing was increased further to two ENPs and one HCA. Staff professionalism was impressive, calm yet assertive when needed. All nursing staff worked in the ATC in addition to their normal hours in ED, resulting in some staff working (by choice) in excess of 60 hours in one week. In addition, one police officer was on duty in the ATC and typically St Johns Ambulance provided a further two volunteers. Offenders from probation on 18 SC Moore ATC Evaluation May 2013 the Community Payback Scheme provided some additional support, mostly cleaning. ATC operation evolved over the course of the pilot period. Innovations were in response to barriers in the referral processes. For example, initially ambulance paramedics were unaware of the ATC and what criteria should be used to divert AAIs to the ATC. Accordingly, and referring to Figure 5, the pro-forma was redesigned so that the criteria for referral into the ATC were clearer and paramedics were encouraged to phone ahead to the ATC if they had any doubt. Figure 5 – Patient pro-forma for paramedics Those who have overdosed or have evidence of a head injury are not received into the ATC. However, the ATC does receive those who are likely to have taken illicit substances and suffered minor injuries. Access is further restricted to those over 16 years of age. Further restrictions were in place for those with alcohol dependency problems, psychiatric patients and the homeless. The ATC provides a safe environment for AAIs to sober-up, those with alcohol dependency can experience fitting, cardiovascular disturbances and increased risk of stroke in withdrawal, risks that the ATC was not designed to accommodate. The ability to innovate and adapt as barriers became apparent demonstrates the ATC pilot and the staff involved with it operated successfully. Subsequent sections return to this issue, in particular the innovation of encouraging paramedics and, to a lessor extent, police officers to phone ahead to the ATC for advice on any AAIs. Patients arrived at the ATC by ambulance, escorted by Street Pastors, police officers, occasionally St John’s Ambulance and through self-referral. In all cases, handovers to 19 SC Moore ATC Evaluation May 2013 nursing staff in the ATC occurred in a relaxed fashion and in all cases observed those delivering patients were free to leave the ATC within 10 minutes. This time was typically given over to completing necessary paperwork. If clinical need dictated, patients were referred to ED (e.g. suggested fracture, irregular heartbeat, etc.), although such referrals were direct to speciality therefore obviating the need for the patient to undergo triage in ED. This was further facilitated through telephone communication between ATC ENPs and senior ED staff. The administration of patients was completely paper-based, meaning that practitioners were unable to easily refer to patients’ prior history on existing data systems and that an additional session in ED was required to input patient data onto those systems. This entailed a delay in data becoming available to UHB for analytic purposes. Further, there are mature data sharing agreements between UHB and the police whereby assault-related attendance data is shared so that resources can be targeted at the causes of harm (e.g. risky premises) [1, 54]. There was limited evidence of any behavioural intervention delivered to patients presenting with AAI. While there is a clear need for such interventions and possibly more robust processes for referral into secondary care, the emphasis of the initial ATC pilot was focused on implementing and refining the service. However, patients were given leaflets describing the effects of alcohol misuse, how to reduce risk and contact information on where they might find further support if required. Patients are treated for minor injuries including sutures, glue and tape. Medications used included paracetamol, ibuprofen and lidocaine for local anaesthesia. For dehydration IV fluids were administered; sodium chloride 0.9% from either 500ml or 1000ml bags. Patients presented with the already described symptoms of AAI (vomiting, defecating, loss of consciousness, etc.). While the majority of patients were brought to the ATC from Cardiff city centre there were instances where ambulances and police officers brought patients from across the Cardiff and Vale area. ATC ENPs would seek consultations by telephone from senior consultants in ED if there was any doubt over patient status. Type I, and to a lesser extent Type II, diabetes carries the risk of ketoacidosis, a state that also involves the over-production of acetone. Acetone is expelled through urine and breath and, in the case of the latter, leads to a distinct breath odour that can be confused with a state of intoxication. Symptoms of ketoacidosis can be similar to AAI and includes a flushed face, vomiting, dehydration, confusion and coma. CDMs considered the likelihood of ketoacidosis in all patients with altered consciousness as routine through a BM (BoehringerMannheim) finger-prick blood test to assess glucose levels. Clinical judgement determined when a patient could be discharged from the ATC. On discharge, ATC staff made certain all patients were safe to leave and had somewhere safe to go to, whether that was in the care of friends, family or in a taxi to a known location with sufficient funds to pay for it. They made sure that patients had their belongings and house keys. For some patients who were also students this included collection by campus security. Time of discharge was determined by clinical judgement not with reference to pre-existing targets on when patients should be discharged. All patients are asked about where they had their last alcoholic drink. Only the most severely intoxicated were unable to provide this information. These data are forwarded to the multipartner Cardiff Violent Crime Task Group to inform partnership activity more generally. The majority of patients that attend the ATC are all acutely intoxicated or present with minor injuries. Examples of patients include, on Halloween individuals dressed as Goldilocks, 20 SC Moore ATC Evaluation May 2013 Tarzan and Cinderella. A teacher who passed out in a taxi (the taxi driver became concerned for her welfare who referred her to the police who in turn asked the Street Pastors to escort her to the ATC) who, once conscious, became aggressive in the ATC. On one evening an incident required the presence of six police officers and resulted in a French exchange student sustaining a head injury from a glass bottle. He was escorted to the ATC and on assessment transferred directly to the Intensive Care Unit. A man in his early 20’s was escorted at ATC by Police and became irrational and aggressive. He was later arrested and taken to custody once the CDM determined that it was safe to do so. A 19 year old student was spotted by Street Pastors unconscious behind the refuse bins at Cardiff Central Train Station. He was wet and due to the temperature that evening at serious risk of hypothermia. He was escorted to ATC by ambulance and once his clothes were dry, and he was sufficiently sober, he took a taxi home. He had no memory of the events of that night. 9.1.2 Emergency Department UHW ED provides 24 hour unscheduled care and designated accommodation for the reception of accident and emergency patients [55]. Ambulances arrive at one entrance at the front of ED which is typically staffed by one nurse who assesses patients and directs them accordingly (e.g. to minor injuries). Bottlenecks occur at this stage when the assessment area becomes full and ambulances continue to arrive with patients. ED staff described this part of ED as “chaotic at times”. While observational and interview data is not conclusive, they do suggest the ED showed an improvement in the overall environment when the ATC was open. Observation in ED at times when the ATC was closed found increased levels of disorder. Incidents included one intoxicated patient who attended due to a hand injury becoming abusive to staff and other patients. Hospital security intervened and advised him that if he did not calm down he would face charges of causing public disorder. Two women were observed arguing loudly with one another. Compared to days when the ATC was open we observed a quieter and more orderly ED environment. One nurse commented that the difference on Fridays and Saturdays when the ATC is open was impressive, she said that Saturdays when the ATC were open had become much easier. ED staff commented that AAIs “overloaded” ED, creating long wait times as dealing with AAIs almost always absorbed a lot of “time and resources”. Not only do clinical staff have to attend to “a blurry intoxicated patient” but also often have to deal with their friends, who also cause problems relating to security at ED. In the early weeks of ATC operation, several nurses expressed concern over the risks associated with treating AAIs in the ATC. As the ATC is physically distant from ED concerns were raised that those attending with, for example, head injury, diabetes or other conditions that AAI can mask, might be delayed in reaching ED and therefore specialist care. However, this was balanced with comments from senior staff that such concerns were unwarranted, further supported through the development of a detailed operational policy with explicit exclusion criteria prior to the ATC pilot. Moreover, patients receive potentially more attention in the ATC compared to a busy evening in ED. Observations also found some evidence that the ED was receiving patients with little or no requirement for unscheduled care. One evening a man and a woman came in, she wanted to have a cervical cancer vaccination and he wanted to show someone his thumb, which he had apparently hurt three months earlier. However, as ED receptionists are not CDMs they were unable to turn this couple away and they were registered as usual. As noted in Section 6, Health Boards are subject to reporting requirements and performance targets. For ED, this is most evident in the requirement that patients spend no longer than four hours in the Department before discharge. There are exceptions to this rule, such as 21 SC Moore ATC Evaluation May 2013 patients who are waiting for test results that will affect their path through unscheduled care. However, no exception is made for AAIs, despite the typical treatment being to leave AAIs in a safe environment until they are sufficiently sober for a proper assessment. The reason being that AAI can mask other symptoms (e.g. symptoms associated with head injury). However, AAIs fall outside of the reporting standards detailed above and are therefore included in returns made for quarterly monitoring. While reporting standards could be reassessed so that AAIs can be removed from returns, doing so is complicated by failings to accurately describe alcohol symptoms in routine ED data. Improving how alcohol is recorded in patients presenting to ED and revising reporting standards would provide a clearer picture of the role alcohol plays in health services, would lessen the likelihood that episode duration targets are missed due to appropriately allowing time for patients to sober up and would further provide opportunities for referral for those patients attending with AAI symptoms. This approach to AAIs has two implications. First, the clinical environment may suffer in consequence of AAIs being left to wait. Second, diverting AAIs to the ATC will, by definition, shift patients who would usually wait longer in ED away from the ED and therefore mask any impact of the ATC on patients wait times in the ED more generally. This latter issue is returned to in subsequent sections in respect of analyses concerning episode duration in ED. 9.1.3 Ambulance Service Observational data suggested ambulance resources were being misused by the public, including one example where an ambulance was dispatched to collect a young male adult who, upon arrival at ED, thanked the paramedics for the “lift” and ran off [56]. Otherwise, ambulance handover at the ATC was orderly and the only significant delay was attributable to administrative requirements associated with handing over patients, something that is common to both the ATC and ED. In ED we observed an initial reluctance (September and October 2012) to take patients to ATC by paramedics and some had no knowledge that the ATC was operational. Given that ambulance control was routinely informed when the ATC was open, this might suggest communication barriers in WAST influence paramedic use of the ATC. This reluctance continued through the pilot although declined towards December. One paramedic cited their mortgage payments as one reason to escort patients to ED rather than the ATC, further indicating that the benefits of the ATC had not been communicated across the service and further reinforcing the view that the ATC was perceived as risky by both nurses and paramedics. Furthermore, ambulance crews were critical of “last minute” decisions to change ATC opening hours. This refers to the decision to change ATC opening from Wednesdays and Saturdays to Fridays and Saturdays. However, towards the end of the pilot, paramedics were phoning CDMs at the ATC routinely and if they had any doubt on where their patient should be taken. This innovation in ATC function has precedent and is known to reduce ED attendances more generally [28]. 9.1.4 Street Pastors There was very positive regard for the Cardiff Street Pastors across those who expressed an opinion, particularly in their support of police officers patrolling the NTE. Usually, Street Pastors supported those who were vulnerable until they were deemed safe. Safety here could be that they were reunited with friends, sufficiently sober to find their way home or appropriately referred in the health service. In terms of referrals, there was some uncertainty 22 SC Moore ATC Evaluation May 2013 over who Street Pastors should refer to the ATC. Initially there was a general lack of awareness in Street Pastors over ATC function. This changed over time with the recommendation from clinical practitioners that Street Pastors refer to the ATC all those who might be eligible, rather than Street Pastors stay with those who were vulnerable. Street Pastors viewed having the ATC open would allow them to refer a greater number of patrons there so that they could receive expert clinical attention suggesting the ATC would increase Street Pastor capacity in the NTE and provide the opportunity to attain a rapid clinical decision and therefore reduce risk in the NTE. However, this suggests that Street Pastors decisions to refer into the ATC is not only determined by clinical need but is also informed by their relationship with the ATC. Evidence suggests that the Street Pastors have a positive impact on welfare in the NTE. Those who are vulnerable receive attention and guidance that would not otherwise be available. For example, a 20 year old male student was found by Street Pastors behind the bins at the train station, half dressed, soaking wet and at risk of hyperthermia. However, as noted, AAI can mask complications and there is evidence to support Street Pastors conjecture that the ATC would allow them to refer more into health services than they do at times when the ATC is not open. For example, Street Pastors do not have the requisite clinical skills to reliably determine whether someone requires clinical assistance, they do not routinely test blood glucose levels for example. The ATC facilitates referral and, by implication, reduces the risks associated with AAI and therefore Street Pastor activity. Our view is that Street Pastor activity is an important component in ATC success, if Street Pastors refer as many as they can then this means ATC resources will be potentially wasted. However, if Street Pastors are encouraged to refer only the most vulnerable then this will increase risk in the NTE. It is therefore essential that the referral pathway is structured and agreed. With this in mind opportunities for closer partnership working between Street Pastors and clinical staff should be explored. Street Pastors, police and other agencies involved with managing the NTE, including taxi marshals, paramedics, St John’s Ambulance and door security staff, liaise closely. In amongst this ad hoc network Street Pastors have become central in providing a link between agencies and health services. Other than paramedics, none have formal clinical training. The ATC therefore provides an opportunity for those exhibiting AAI to be rapidly assessed, monitored, treated and discharged and therefore it is essential that the criteria for referral is communicated and reinforced. 23 SC Moore ATC Evaluation May 2013 9.2 Descriptive Statistics Figure 6 – Distribution of Emergency Department recorded assault related injury and severe alcohol intoxication attendances by arrival time From 1 January 2010 to 1 January 2013 there were 351,918 attendances at ED. On average, there are 32.47 (SD = 7.77) ambulance trips to ED each evening period (8pm to 4am). Overall we identified 4,884 alcohol-related attendances and 8,844 assault-related attendances in the available data. Average episode duration for alcohol-related attendances was 258.79 minutes (SD = 248.13) and assault-related attendances was 196.31 minutes (SD = 174.74). Yielding a combined average of 218.64 minutes (SD = 206.31). When the ATC is open it is open from 8pm to 4am. In this evening period, excluding attendances when the ATC is open, the ED receives, on average 83.76 (SD = 21.71) patients. There are, on average, 3.17 (SD = 2.78) attendances where alcohol is reported as a primary symptom, 3.97 (SD = 3.51) attendances designated as being due to an assault-related injury and 0.08 (SD = 0.30) attendances where alcohol is reported as a primary symptom and designated as being due to an assault. Referring to Figure 6 and Figure 7, these attendances are strongly clustered in the evenings of Friday and Saturday. 65.16% of all alcohol- and assault-related attendances arrive by ambulance and 27.5% via private arrangements (e.g. taxi). 10 Saturday Friday Thursday Wednesday Tuesday Monday Sunday 0 5 Percent 15 Evening Attandances Alcohol and Assault-Related by Day Time of Day Assault Alcohol Source: Violence & Society Research Group, Cardiff University Figure 7 – Proportion of total attendances, between 8pm and 4am, designated as assaultrelated or presenting with alcohol intoxication as the primary symptom by day of week 24 SC Moore ATC Evaluation May 2013 Figure 8 shows the relationship between episode duration and the total number of patients admitted to ED. Regressing number of patients in ED onto episode duration yields a significant linear association (B = 0.17, t = 14.41, p < 0.001, n = 376,989) that further suggests the target 240 minute episode duration is exceeded one the number in ED exceeds 148 patients. Extended episode durations are more characteristic of the evening period. Consistent with earlier discussion, those attending where alcohol intoxication was a primary symptom and did wait to be seen by clinical staff had longer episode durations (mean = 307.41 minutes, SD = 270.47, n = 3453) compared to all other patients (mean = 237.41 minutes, SD = 371.75, n = 355,082; t(358,533) = 15.06, p < 0.001). Moreover, 75.5% of all those attending with alcohol as a primary symptom were more likely to attend between the hours of 8pm and 4am (z = 66.93, p < 0.001). Thus the increase in episode duration seen in the evening period is partly attributable to a greater number of AAIs arriving in ED affecting all patients. However, this difference between evening and daytime episode durations could also be attributable to other bottlenecks, such as delays in getting results from diagnostic tests and accessing other services that patients might require. To determine whether the presence of AAIs impacted on other patients’ episode duration the number of AAIs in ED were calculated to the arrival time of all non-AAI patients. A significant and positive relationship was observed controlling for day/evening period (B = 4.64, t = 15.94, p < 0.001) suggesting the increase in episode duration found in the evening period may reflect a general increase across all patients and that is not simply due to AAIs being required to wait longer. Figure 8 – Episode duration for patients attending the Emergency Department by patients already in attendance at the Emergency Department at time of arrival 9.3 Analyses 9.3.1 ED Attendances ED data were restricted to those times when the ATC operates and when assault-related injury and severe alcohol intoxication are most likely (8pm to 4am). Table 1 presents summary statistics, including the average daily attendances between 8pm and 4am by patient type (alcohol- and assault-related) for ED only and for the ED and ATC combined and the number of days (N) for which data were available). 25 SC Moore ATC Evaluation May 2013 Table 1 – Daily descriptive statistics for attendances during evening periods (8pm to 4am) from 31 December 2009 to 1 January 2013 Variable N4 Description Alcohol & Assault UHW Alcohol & Assault Ambulance UHW Total attendances at the Emergency Department designated assault- or alcohol-related Total attendances designated assault- or alcoholrelated (ED & ATC combined) Total attendances at the Emergency Department by ambulance Mean SD Min Max 1098 7.337 5.456 0 46 1098 7.566 5.736 0 46 1098 32.230 9.717 10 98 From 2010 onwards, ED saw a linear increase in total attendances (n = 122,819 in 2010, n = 124,007 in 2011 and n = 127,974 in 2012). This also corresponded with a linear increase in episode duration over the same period (average = 213 mins in 2010, 235 mins in 2011 and 237 mins in 2012). A simple “before and after” analysis of ED data to determine ATC impact is thus complicated by these underlying changes. Time series regression models were therefore specified. Table 2 provides results from four time-series regression models. The data used in these models was constrained to evening periods when the ATC would usually operate (8pm to 4am), and 31 December 2009 to 31 December 2012 (events on 1 January 2013 from midnight to 4am were included in the 31 December totals). Durbin's alternative test suggested moderate serial correlation (χ² > 3.5 and p < 0.05 for each test) and the Cochrane-Orcutt (1949) transformed regression estimator was therefore used to correct for first-order serially-correlated residuals. Table 2 – Time-series regression models assessing the association between ATC being open and control variables on ED attendance outcome measures Alcohol & Assault UHW ATC Alcohol & Assault Ambulance UHWD -2.50* (-2.30) 5.83*** (5.24) -2.53*** (-3.43) Black Friday 3.15 (0.95) 5.77+ (1.71) -0.28 (-0.13) 24 Dec -7.79* (-2.36) -10.44** (-3.09) -4.18+ (-1.87) 25 Dec -4.38 (-1.32) -4.54 (-1.34) -2.20 (-0.98) 26 Dec 1.16 (0.33) 1.11 (0.31) 0.07 (0.03) 24.19*** (7.39) 26.06*** (7.77) 9.79*** (4.41) University 0.51 (1.26) 0.55 (1.34) -0.02 (-0.08) F.Holiday 9.83*** (7.42) 9.94*** (7.32) 4.84*** (5.39) St Patrick's -1.51 (-0.46) -1.70 (-0.51) -0.47 (-0.21) Halloween 17.47*** (5.33) 17.70*** (5.27) 6.86** (3.09) Varsity -0.46 (-0.14) -0.41 (-0.12) -0.64 (-0.29) Freshers 2.80* (2.11) 2.51+ (1.87) 1.92* (2.14) Mon 0.79 (1.28) 0.86 (1.35) 0.35 (0.83) Tue -1.13+ (-1.73) -1.10 (-1.64) -0.20 (-0.46) Wed 0.95 (1.44) 0.85 (1.26) 0.98* (2.20) Thr 0.54 (0.83) 0.55 (0.83) 0.59 (1.35) Fri 10.53*** (16.03) 10.61*** (15.79) 6.71*** (15.10) Sat 15.15*** (24.07) 15.61*** (24.13) 9.16*** (21.46) Constant 7.42*** (14.92) 7.42*** (14.61) 4.25*** (12.65) NYE Day of Week 4 2012 was a leap year, adding an additional day, also included were new year eve 2010 and new year day 2013 26 SC Moore ATC Evaluation May 2013 N 1096 1096 1096 adj. R-sq 0.544 0.568 0.464 C 1.79 1.81 1.89 DW Coefficient (t statistics) + p < 0.10; * p < 0.05; ** p < 0.01; *** p < 0.001 Notes: A – Days when there were no alcohol and assault related attendances are 03 Jan 2010, 19 Feb 2010, 06 July 2010, 06 Dec 2010, 07 Dec 2010, 06 Jan 2011, 22 Feb 2011, 26 April 2011, 06 Jun 2011, 01 Aug 2011, 05 Jun 2012, 21 Jun 2012, 10 Dec 2012 B – The lead descriptor for Holiday (F.Holiday) is missing for the public holiday on New Years Day at the end of the time series C – Durbin-Watson statistic (transformed) D – For alcohol & assault related attendances The results presented in Table 2 (Alcohol & Assault UHW) suggests that when the ATC is open there are statistically fewer alcohol and assault-related attendances in ED, suggesting that the ATC successfully diverts attendances away from ED. However, if the ATC simply diverted patients away from ED then the coefficient on ATC in the Alcohol & Assault equation should be zero. Instead it is positive and significant and therefore we would conclude that the total number of patients (in both ED and ATC) for assault- and alcoholrelated injury increases on days when the ATC is open. This is consistent with the opinion of Street Pastors and previous evaluations of sobering-up centres (Section 6, page 7) suggesting that diversionary schemes such as the ATC would lead to an increase in demand. Consistent with the diversionary success of the ATC, fewer ambulances attended the ED with patients exhibiting assault- or alcohol-related symptoms. Also of note are those factors that promote attendance in ED, ATC and require ambulance services. There were fewer AAIs on Christmas Eve (24 Dec). There were strong increases on New Year’s Eve, evenings before a public holiday, Halloween and a modest increase during Freshers’ week. University term time (University), Black Friday and Varsity (an annual student sporting event) were not systematically associated with increased levels of AAI. A greater prevalence of AAIs is observed on Friday and Saturday evenings. 9.3.2 Emergency Department Patient Episode Duration Episode duration is the time patients spend in ED from initial attendance to discharge. In order to assess any relationship between ATC activity and episode duration individual level patient data were restricted to those equal to or over 16 years of age to exclude paediatric attendances (paediatric attendees are separated from adult attendees in UHW ED). Further, data were restricted to the evening period when the ATC would typically open (8pm to 4am) and those who did not wait to be seen were excluded. Referring to Figure 9, episode duration showed a log-normal distribution and was therefore log transformed. 27 0 .001 Density .002 .003 SC Moore ATC Evaluation May 2013 0 500 1000 Time in mins from arrival to conclusion 1500 Figure 9 – Density histogram for episode duration for those attending between 8pm and 4am, 16 years of age or older, and excluding patients who did not wait to be seen Log episode durations were compared on days when the ATC was open to equivalent days in 2010 and 2011. No significant difference was observed in these values (t < 1). Restricting tests to New Years Eve, Halloween, Freshers Week and evening periods in ED episode durations similarly found no significant differences in log episode duration (t < 1). Moreover, from 2010 to 2012 the ED saw an increase in total attendances (2010 = 244,173, 2011 = 246,277, 2012 = 254,375) and a corresponding increase in episode duration (2010 mean = 231 mins; 2011 mean = 235 mins; 2012 mean 237 mins) suggesting that a steady increase in attendances might mask any effect of the ATC on daily averages over time in these simple effect comparisons. OLS regression was therefore specified, controlling for mode of arrival (emergency ambulance), severity (proxied by whether the patient was subsequently admitted [57]), age on arrival, and day of week, monthly and primary diagnosis dummies. While overall, the linear combination of predictor variables explained variance in the outcome measure (F(72, 39,989) = 83.68, p < 0.001) the overall fit was moderate (adjusted R² = 0.13). However, this result is broadly consistent with expectations and the more robust finding that there fewer assault- and alcohol-related attendances at ED when the ATC was operational. Table 3 – Regression model assessing the association between ATC being open and patient episode duration in ED ATC -0.12** (-3.21) ED present 0.002*** (11.72) Age on visit 0.01*** (24.14) Emergency ambulance 0.51*** (41.73) Admitted 0.26*** (17.08) Day of week dummies Yes Month dummies Yes Diagnosis dummy Yes Constant 4.37*** N 40,062 adj. R-sq 0.129 (122.89) t statistics in parentheses * p < 0.05; ** p < 0.01; *** p < 0.001 28 SC Moore ATC Evaluation May 2013 9.3.3 Alcohol Treatment Centre Activity Data from 268 attendances at ATC were available for analysis. These data identified whether patients had been assaulted, primary symptom, mode of referral and where they had their last alcoholic drink: 14% had been assaulted and 57% presented with AAI. Table 4 – Mode of arrival at the Alcohol Treatment Centre (where referrer noted) Month Oct Nov Dec Total 14 33 70 117 St Pastor 1 6 7 14 Police 2 3 19 24 Public 1 0 0 1 Self 0 0 4 4 Total 18 42 100 160 Ambulance These data indicate that the majority of referrals were from the police, Street Pastors and ambulance service. Intoxication was mentioned as the reason for attendance in 82.63% of cases, the remaining were mostly minor injuries except for one allergic reaction, three with suspected hyperthermia, one convulsion, one overdose and one person experiencing a panic attack. Overall, 14.8% had been involved in an assault. Table 5 – Discharge route from the Alcohol Treatment Centre (where discharge route noted) Month Discharge ED Sept Oct Nov Dec Total 4 12 8 21 45 Home 23 39 54 104 220 Police 0 0 1 2 3 Total 27 51 63 127 268 Of those who were able to provide a location for their last alcoholic drink (n = 149), data indicated that 81.21% had consumed their last alcoholic drink in a licensed premises, 6.71% in a street location, 12.08% had their last alcoholic drink at home. 29 SC Moore ATC Evaluation May 2013 Figure 10 – Total number of attending patients in the Alcohol Treatment Centre by day Figure 10 shows the number of patients admitted to the ATC by day. Consistent with the numbers presented in Table 4, there appeared to be a bedding-in period across the ATC such that the use of the Centre increased as processes were refined, communicated and other partners became more familiar with the ATC. This is further consistent with observations discussed in Section 9.1 where paramedics were found to have some uncertainly over ATC referral pathways. 9.3.4 Police Activity On average there were 0.69 police referrals to the ED each evening for alcohol- or assaultrelated harm (8pm to 4am) over the full ED dataset (min = 0, max = 10). Determining the effect of the ATC on police activity is complicated in that South Wales Police do not routinely record the time that officers would spend in ED with a patient. Therefore, only the binary ED data item denoting whether a patient was referred by the police or not was available for analysis. This descriptor likely includes a variety of scenarios. There may be occasions where an offender’s health poses concern and therefore officers are obliged (see Section 6) to seek advice from a CDM and then may stay with the offender until appropriately treated. On some occasions officers may escort someone to ED when ambulance capacity is stretched, but depart shortly after. Furthermore, officers may refer the severely intoxicated to Street Pastors and paramedics. It is therefore difficult to fully understand the effect of referrals to ED on police time and capacity from what information is available. We can state with certainty that officer time to escort patients to the ED will affect officer capacity in the NTE. Officer capacity varies depending on expected demand but on average about 14 officers working in pairs are in the NTE on a typical Saturday night. Therefore two officers escorting a patient to ED represents a reduction in capacity upwards of 15%. We explored the effect of the ATC on police officer referrals to ED however models (negative binomial regression model) proved to be poorly specified due to a scarcity of data. 30 SC Moore ATC Evaluation May 2013 We also considered SWP arrest data for the offences “drunk and disorderly in a public place” and “drunk and incapable in public place / highway / licensed premises.” In total, for 2012, there were 583 arrests for drunk and disorderly and 3 arrests for drunk and incapable. This reinforces the view that AAI has become normalised, such that the only arrests made are when AAI is accompanied with disorder and might undermine opportunities to develop sobriety schemes to target risky alcohol use. These data are discussed further in the discussion. 9.3.5 Ambulance Activity Ambulance staff are given a target of 15 minutes to hand patients over to ED staff, plus an additional five minutes to restock their ambulance (ED episode duration begins at 15 minutes irrespective of whether the patient is in ED or not [55]). The effect of ATC function on ambulance attendance numbers at ED are presented in Section 9.3.1, page 25). Figure 11 presents the relationship between the number of patients in ED and the effect on ambulance handover. Table 6 presents the average number of patients in ED at ambulance time of arrival for the evening period and the average handover time in the evening period. The average Saturday ambulance referrals (8pm to 4am) to ED for alcohol- or assaultrelated harm when the ATC was not open was 13.57 (SD = 5.73), when the ATC was open it was 9.93 (SD = 4.74; t = 2.37, p < 0.01). On Fridays, when the ATC was not open the average was 11.04 (SD = 5.08) and when the ATC was open the average was 8.14 (SD = 4.30; t = 1.48, p = 0.07). Figure 11 – Ambulance handover duration for ambulances attending the Emergency Department by patients already in attendance at the Emergency Department at time of arrival A t-test on handover time, restricting the data to the evening period and significant dates that the ATC targeted (e.g. New Years Eve, Christmas, Black Friday, public holidays) yielded a near significant effect (t = 1.18, p = 0.12) for handover time at ED on days when the ATC was open (mean = 16.12 mins, SD = 11.13) compared to similar days when the ATC was closed (mean = 17.33 mins, SD = 13.95). However, handover times were log-normally distributed and showed cyclical variation, therefore times were log transformed for further analysis. Handover times were restricted to the evening period and regression models suggest a robust relationship between ATC opening and reduced handover times. 31 SC Moore ATC Evaluation May 2013 Table 6 – Daily descriptive statistics for evening periods (8pm to 4am) Variable Description ED present Average number of patients in ED at ambulance time of arrival N Mean SD Min Max 35,658 99.71 33.66 6 193 Handover Ambulance handover time (minutes) 33,561 17.24 14.94 0.02 260.92 Table 7 – Association between Alcohol Treatment Centre operation and log ambulance handover time at ED in the evening period Patients in ED 0.005*** (29.23) -0.06* (-2.14) Black Friday 0.06 (0.67) Christmas eve -0.11 (-1.28) Christmas day -0.09 (-1.06) Boxing day 0.01 (0.10) NYE -0.05 (-0.55) University term time -0.03** (-3.26) F.Holiday ATC open -0.11** (-3.22) St. Patricks 0.05 (0.55) Halloween 0.03 (0.31) Varsity -0.07 (-0.68) -0.10** (-2.91) Mon 0.02 (1.26) Tue 0.02 (1.37) Wed 0.04* (2.34) Thr 0.02 (1.15) Fri 0.03+ (1.91) Sat -0.00 (-0.02) Constant 2.07*** (109.27) N 33,560 adj. R-sq 0.027 Freshers Day of Week t statistics in parentheses ="+ p<0.10, * p<0.05, ** p<0.01 Table 7 presents results from an OLS regression on log handover time and suggests the number of patients in ED affects handover duration. As the number of patients increases longer handovers are observed, but handover durations are reduced when the ATC is open. Care is needed in interpreting these findings, however, given the low adjusted R² value. 9.3.6 Street Pastors We received reports from Street Pastors covering 154 sessions in total, from 6 January 2012 to 9 February 2013. These reports included information on the number of “drunks” they had assisted, the number of water bottles given out, the number of flipflops given out, the number of violent incidents observed, the number that they escorted to an ambulance and the number taken to the ATC. We combined the ambulance and ATC referrals to provide a measure of total referrals. This figure was then divided by the number of drunks to control for activity in the NTE to provide an index of referral activity. 32 SC Moore ATC Evaluation May 2013 Table 8 – Descriptive statistics for Street Pastor activity N Mean SD Min Max Water bottles 154 11.44 5.63 0 29 Flipflops 154 5.88 4.65 0 23 Drunks Violence 154 6.50 3.15 0 16 154 0.58 0.75 0 4 Ambulance referrals 154 0.90 1.06 0 5 Referral to the ATC 37 2.27 1.48 1 6 154 1.54 2.12 0 10 Space blankets A t-test on referral activity yielded a significantly greater referral activity when the ATC was open (mean = 0.58, SD = 0.46) compared to when the ATC was closed (mean = 0.13, SD = 0.15; t(149) = 9.11, p < 0.001), consistent with the earlier finding that Street Pastors themselves suggested they would be more likely to refer patients into healthcare when the ATC was open. 9.3.7 Referrals There are numerous agencies into which those exhibiting risky alcohol or substance related behaviour can referred to receive treatment. While there exists robust evidence that intervention and referral for alcohol misuse can prevent further harm (see Section 6) there was little evidence that the ACT had in place any substantive intervention or referral policy. Noted in Section 6 were pathways that agencies, in particular the police, are able to use to refer offenders forward to treatment agencies. We therefore accessed the Welsh National Database for Substance Misuse5 to better where referrals into treatment for 2012 for adults 19 years and over were originating and for two of the main services that provide support to those with alcohol use problem: the Drug Intervention Programme (DIP) in East South Wales and the Community Addiction Unit (CAU). Analysis revealed that there were zero referrals from ED to either service, one referral to CAU by SWP and 233 referrals to DIP by SWP. 9.4 Cost Analysis The total cost of the ATC across the initial three months was £60,000, funds for 24 sessions (two each week), yielding an average per-session cost of £2,500. The itemised sessional costs are presented in Table 9 (the number of Health Care Support Workers and ENPs varied by session). Table 9 – Itemised costs for the Alcohol Treatment Centre Item Cost Emergency Nurse Practitioner £451 WAST Triage Vehicle & Paramedic Cover £870 St John’s Ambulance £300 Police Officer £342 Health Care Support Worker £150 Consumables (heating & lighting) are covered in the £300 St John’s Ambulance cost The salary costs detailed above are at overtime rates of “time-and-a-half” and therefore inflate the cost of the ATC somewhat, compared to the expected costs should the ATC be formally implemented. 5 http://wales.gov.uk/splash?orig=/topics/housingandcommunity/safety/substancemisuse/stats/ 33 SC Moore ATC Evaluation May 2013 The cost of an attendance at ED can be derived from the NHS reference costs (Appendix 14.1, page 47). No reference cost exists for AAI, but the cost for “Accident and Emergency Services: Not Leading to Admitted” is £108 and “Accident and Emergency Services: Leading to Admitted” is £157. Of all those assault- or alcohol-related attendances presenting to ED 4.76% are admitted. Weighting these unit costs accordingly gives an approximate unit cost of £110. For the ATC to therefore breakeven it would need to divert 23 patients away from ED on average each session. However, in addition there are saved ambulance journeys. Appendix 14.2 (page 47) provides the unit cost for an “amber” journey as £222. Of all those assault- or alcohol-related attendances presenting to ED, 44.41% arrive by ambulance. Reweighting the unit cost accordingly provides £208.59. For the ATC to therefore breakeven it would need to divert 12 patients away from ED on average each session. There are also additional savings through reducing ambulance wait time. The unadjusted coefficient on ambulance handover time for patients in ED suggests that every patient diverted to the ATC saves 0.031 hours in handover time. There are, on average, 32.48 ambulance trips to ED each evening period, suggesting a total saving per evening of 0.996 hours. Assuming an hourly unit cost of £76 [58] for ambulance waiting times then each patient in the ATC saves £75.70. However, from ED data, the average episode duration of a patient in ED is 218 minutes, or 45% of the time that the ATC is open (8pm to 4am). Thus each patient in the ATC who would have normally gone to the ED cannot be reasonably expected to influence each ambulance handover. Adjusting the initial sum to account for this time suggests a saving per patient of £34.07. Including this estimate suggests the ATC would need to divert 10 patients from ED. Data available from the initial 24 ATC sessions indicates 236 patients attended the ATC. However, analyses presented in Table 2 (page 26) suggests demand increased, there are more patients in the system because of the ATC then there would be otherwise. This is complicated as the ATC took time to become embedded in routine paramedic practice and initially opened on Wednesdays and Saturdays but then switched to Fridays and Saturdays. Thus the average 9.8 patients in the ATC per session will include patients who would not normally go to the ED but is lower due to the bedding in period. Crude estimates based on the equations presented in Table 2 would suggest that for every 10 patients diverted there are at least an additional 20 patients who would not normally be expected to be in the health system. There are additional, intangible, savings. Keeping the drunk and incapable away from ED improves that environment and allows clinical staff to pay more attention to legitimate users. Further, there are legitimate questions concerning the level of risk presented in the NTE. We found that Street Pastors welcomed the ATC as it meant they could refer more easily and further found that there were instances where those in Street Pastor care should have been referred to a CDM but were not. There are, however, additional costs due to the increased demand opening the ATC involves. Table 2 (page 26) provides analyses from which we might reasonably infer that for every patient diverted away from the ED an additional two patients are treated in the ATC. This will imply additional costs but are somewhat mitigated by the unmeasured reduction in risk to those using the NTE. We cannot definitively state that the ATC is cost-effective, however, the above discussion strongly suggests that the continuing bedding in and appropriately targeting high risk evenings when AAI prevalence is expected to be high could yield a cost effective service. 34 SC Moore ATC Evaluation May 2013 10 Discussion The traditional model for unscheduled care is one where the decision to attend is made by those without formal clinical training. The same is true in the NTE, where typically partners including police officers, Street Pastors and the public determine whether someone requires assistance or not and accordingly the decision to refer will be based on contextual factors not necessarily related to clinical need. ACPO guidelines suggest officers should exercise caution and refer to CDMs if alcohol use is expected. On the other hand, Street Pastors were aware that AAIs in ED were impacting on service provision and attempted to stay with patrons until they were deemed sober or until they could be helped by friends. Extending the ED footprint into the NTE therefore provides an accessible service that can rapidly triage, treat and discharge. It effectively minimises non-clinical criteria from healthcare decision in the NTE. Our view, albeit subjective, has a net effect of reducing risk given the extent of alcohol-related harm in the NTE. This is an unanticipated benefit of the ATC. Management of the NTE involves a complex set of relationships between both statutory and non-statutory services. The impact of acute intoxication and injury that emanates from the NTE impacts on health, ambulance and police capacity and in turn affects their ability to respond, not only to events in the NTE but also, through depleting available capacity, to events in the community more generally. This is most apparent in ambulance handover delays at ED. There is also reason to believe police capacity in the NTE is affected, which would be expected to reduce opportunities for officers to intervene early to prevent disorderly behaviour escalating to violence and serious injury. Further, all patients who attend the ED are similarly affected: they wait longer to be seen and suffer the ignominity of a shared space in which the severely intoxicated and disruptive are left to sober up with their friends. The purpose of this report was to evaluate ATC function and, in particular, what benefits, if any, the ATC has on service provision in and around the NTE. In Section 7 (page 16) we defined what we understood would constitute criteria that could be used to asses ATC function. These criteria are now discussed in light of the earlier presented analyses. The primary criterion for success was for the ATC to successfully divert patients away from ED to the ATC. It was expected that doing so would reduce the number of ambulance trips to the ED and therefore improve ambulance function. Both observational, interview and quantitative data agree that while the ATC is open there are fewer AAIs in ED and that the environment is generally improved and "less chaotic". Furthermore, there are fewer patients escorted by ambulance to the ED. The available data may under-estimate impact due to the bedding period the ATC underwent, whereby paramedics, in particular, took time to adapt to the additional capacity provided by the ATC and escort patients there who met the criteria for treatment in the ATC. Piloting services such as the ATC allows practitioners to assess those processes in place and make modifications to improve delivery. We therefore sought evidence of this learning process and looked at how elated agencies reacted to the presence of the ATC. There was clear evidence that the pilot period saw developments in service provision over the duration. This was most notable in the increase in ambulances escorting patients to the ATC and better communication between partners across the police, health and ambulance services. It was expected that if the ATC did divert patients away from the ED that this would have consequences for ambulance handover times, and patient episode durations in ED. 35 SC Moore ATC Evaluation May 2013 We observed a strong positive relationship between the number of patients in ED and ambulance handover times. Accordingly, the reduction in AAIs attending ED also brought about a small but significant reduction in ambulance handover times. Some evidence further suggested that this also extended to episode durations in non-AAI patients attending ED. While there is little empirical evidence from diversionary schemes generally, what was available suggested that the ATC might cause an increase in demand for health services. Data strongly indicate that the additional capacity provided by the ATC also increased demand for health services. However, this was mitigated by the observation that previous limitations in capacity meant that non-statutory services were not referring patients into the health services in order to help prevent bottlenecks in ED. This increased demand might therefore reflect the true extent of the demand for health services and that earlier numbers were restricted due to limitations in capacity. In reviewing guidelines for the police it was clear that ACPO places greater weight on individuals’ welfare, meaning that officers are obliged to ensure the severely intoxicated are safe, receive clinical attention and that custody is the only suitable place for those who are deemed no longer at risk. The implication is that AAI is no longer an offense and has been medicalised and on occasion officers might have to escort those in their custody to ED. With the ATC we therefore reasoned that fewer officers would be required to visit the ED. No systematic relationship between police officer activity and ATC function was observed. It is reasonable to presume, however, that the ATC may, in time, free police officers from the occasional event where they are required to escort AAIs to ED. The ATC is an additional service to the usual provision of unscheduled care in Cardiff and therefore attracts additional costs. Diverting AAIs from ED to the ATC would represent a saving to the ED and therefore to explore ATC cost efficiency a breakeven analysis is conducted. A definitive answer was not available; however estimates suggest that the ATC is capable of providing a cost-effective service in the NTE. A characteristic of those patients the ATC seeks to divert from ED is loss of bodily control and disruptive behaviour. Their effect on the ED environment and other patients is hard to measure and we therefore sought the opinion of staff in the ED. There was strong evidence from observational and interview data that the clinical environment in ED did show marked improvements. Also considered were the broader implications of the ATC including the perceived risks and benefits, barriers to implementation and opportunities for sustainability. There are no obvious policies and procedures in place to refer patients to alcohol health workers or provide brief alcohol interventions. An attempt was made to video record patients as they arrive and play back to them evidence of their severe intoxication. This is an untested intervention and could, without due care, encourage some to drink to the extent that they can obtain such video footage. If the ATC is adopted then efforts should be made to formally develop referral and intervention policies and procedures that are consistent with the considerable evidence based in this area. 36 SC Moore ATC Evaluation May 2013 10.1 General Discussion The police, ambulance and health services are understandably risk averse. Police guidelines explicitly prioritise welfare, ambulance standard operating procedures require that patients on a 999 call are delivered to ED. Under usual conditions those determining need for unscheduled care therefore have little or no clinical expertise. ED therefore passively receives patients whose need for healthcare has not been assessed, the default “admit to decide” arrangement. Alcohol misuse is serious and is further associated with injuries and other conditions that require appropriate clinical expertise to assess and monitor for adverse events. For a significant proportion, however, the best treatment is time, allowing patients to process the alcohol in their system in a safe environment; others will require expert medical attention. Without the ATC the ED is that safe environment, it is where all clinical decisions are made and therefore it becomes the holding space for those who are vulnerable due to their misuse of alcohol and irrespective of the extent of that vulnerability. This is balanced against our finding that Street Pastors would, in the knowledge that AAIs impact on ED and ambulance capacity, occasionally make decisions where those presenting with injuries and an altered state of consciousness were allowed to travel home. This is in context of the Street Pastors’ view that the ATC would allow them to refer more of those they encounter into health services. So while there is a theme of inclusivity in statutory partners, whereby all those deemed at risk are referred and treated as required, non-statutory partners are less risk-averse and are more likely to exclude some who may be at risk. A peculiarity of ED service provision is the targets against which the ED expected to perform. Broadly, all those attending ED are expected to have been processed within four hours with little appreciation of the complexity of AAI. Without the ATC the ED is the only safe environment for those exhibiting AAI in Cardiff and therefore the only environment in which many can be left to sober until their welfare is assured. In this case, the strict application of a maximum episode duration and with no other location for those exhibiting AAI to be discharged to could increase risk. The validity of targets in respect of AAI is therefore baseless and lacks understanding of this condition. Of greater concern is the effect this might have on ED willingness to deliver interventions to those presented while intoxicated. If patients cannot be discharged until such an intervention is delivered then this will further increase the proportion of episodes exceeding the prescribed target of four hours. As there are financial implications involved with exceeding targets it is fair to conclude the current system as a whole is not adequately designed for the treatment of AAI. One option would be to create a class of patient, similar to those patients who need to wait for test results, for those presenting with AAI such that if alcohol is associated with attendance they can be removed from the QMAE episode duration reporting requirements and be given time to determine the extent of their alcohol misuse. Related to the above target anomalies are the mechanisms in place available to record the involvement of alcohol in ED attendances. If a class of patient were created then this would require that alcohol is appropriately recorded, so that further down the line analysts could adjust returns as required. As noted earlier, however, the involvement of alcohol in attendance notes is poor with only those attending with alcohol as the primary symptom being adequately captured. Capturing alcohol in ED is a matter returned to below, however, if reporting standards were revised to account for AAI then this may provide an incentive for practitioners to more reliably capture these data so that the full extent of alcohol-related harm can be determined and therefore fed into partnership and allied referral activities. Although the true extent of AAI in Cardiff cannot be precisely stated from ED data, the available data, coupled with that data available from the ATC, does suggest there are, on 37 SC Moore ATC Evaluation May 2013 occasion, significant numbers presenting. New Years Eve, for example, saw approximately 40 attendances. The Civil Contingencies Act 2004 requires that the UHB plans, prepares and responds to major emergencies, or major incidents. The Department of Health describes a major incident as “[a]ny occurrence that presents serious threat to the health of the community, disruption to the service or causes (or is likely to cause) such numbers or types of casualties as to require special arrangements to be implemented by hospitals, ambulance trusts or primary care organisations”6. Accordingly, there is a major incident plan for Cardiff and Vale University Health Board that specifies how the organisation as a whole should respond. Responses are broadly aligned according to three categories of incident severity: major, mass and catastrophic. The number of those who are severely intoxicated and requiring access to health services is considerable. This report has described how the severely intoxicated impact on services and other members of the community, impacts that are clustered on particular times and days. One might, therefore, define the levels of alcoholrelated harm generated in the NTE as a major incident, albeit one that has become normalised and routine. Consistent with the definition of a major incident, the ATC could therefore be described as a necessary response. In his introduction to NHS Wales Annual Quality Framework 2011/2012 Paul Williams, Chief Executive NHS Wales, stressed the need for “less command and control and centrally driven targets and more freedom for staff to innovate and improve services,” placing public health centre stage and replacing competition with “collaboration, joint working, whole systems thinking and greater emphasis on quality and patient outcomes” [59]. Irrespective of the ATC’s success, those who collaborated and worked to make the Centre operational did so knowing that the pilot might fail. It was their continual innovation, motivation and ability to utilise resources from across the community that brought the ATC to fruition and the ATC is therefore consistent with Paul Williams’ expectations. Further, the cross-partner project group behind the ATC brought together knowledge of the complex interrelationships that propagated the effects of AAI on both health and police services. Numerous events are likely associated with increased levels of alcohol-related harm. If we assume that a proportion of those in the NTE are prone to misuse alcohol, then simply increasing the number in the NTE will have the effect of increasing the numbers experiencing alcohol-related harm. Moreover, events that encourage excessive alcohol use may not affect the number of those in the NTE but might increase levels of intoxication and therefore the number of those experiencing alcohol-related harm. From the data available, and not having reliable data on the number of those visiting the NTE, it is not possible to assess whether the effect of events are due to a greater number of those misusing alcohol or simply a greater number of people exposed to the NTE. Never-the-less, there are opportunities for some reorganisation of events to reduce harm. Freshers’ Week is an obvious example: a week where students are afforded freedom from academic responsibilities and are encouraged to socialise in the NTE. Reassessing how the academic year begins may provide one opportunity to reduce the impact of alcohol-related harm on the community. 10.1.1 Follow-up and Intervention As a pilot, the ATC was focused on service innovation and delivery. It is therefore a logical precursor that the ATC should meet it’s intended goals in respect of treating and caring for AAIs’ immediate needs before looking towards how the system might then be adapted to provide follow-up and interventions. Given that there is little evidence of neither referral nor intervention activity in ED such innovation would be new to those working in unscheduled 6 www.webcitation.org/6EGJyX6nP 38 SC Moore ATC Evaluation May 2013 care and this section therefore considers some of the existing evidence that might steer future delivery. AAIs presenting to unscheduled care are at risk of repeat attendance, with ED usage in 12 months as high as 1.7 visits [60], suggesting brief interventions in ED provide an essential part of the treatment pathway. Currently, there are initiatives that involve training nurses in secondary care to deliver brief alcohol interventions through a collaboration between the Welsh Government, Public Health Wales and Cardiff University. However, not all patients are referred into secondary care, in turn suggesting that interventions in primary care and the ATC in particular are warranted. As noted, the original proposal was to record AAIs as they presented to the ATC and then replay this footage to patients once they were deemed eligible for discharge, a novel approach that has no evidence to suggest it might be expected to reduce future consumption. The footage would then be deleted in order to comply with the extant data protection legislature. This approach was dropped from the ATC pilot. AAI is not adequately recorded in ED data, a fact that will also have repercussions for the delivery of any structured intervention and referral pathway. The typical Alcohol Brief Intervention (ABI) involves initially triaging patients into three categories: no risk, moderate risk and high risk. Those at high risk should be referred to specialist Alcohol Health Worker (AHW), those at no risk are not provided with treatment and those at moderate risk are given an ABI [61]. Trials that have assessed the benefits of such approaches generally find that they are both effective and cost effective [62]. Further, given the type of patients the ATC accepts there exists an unique opportunity for practitioners to directly challenge high risk behaviour generally and alcohol misuse specifically. Particularly as the point where patients are safe to be discharged they are likely to be in a “teachable moment,” a period when brief interventions are most effective [63]. It is therefore of concern that the ATC has sought to implement a brief intervention that involves filming patients and replaying that footage to them, an intervention that has not been formally evaluated and at the expense of existing approaches that are supported by evidence [62]. Untested interventions can have unexpected consequences and it is feasible that AAIs might reinterpret the sight of their inebriation positively with the net effect of that intervention reinforcing future consumption. Without formal testing there will be no means of determining whether the planned video capture exercise is meeting expectations or not. Of concern is the implication of ACPO guidelines in combination with implementation of the ATC. Integrated Offender Interventions Service in South Wales is a partnership approach between the Welsh Government, Wales Probation Trust, NOMS Cymru and South Wales Police to address the complex treatment and support needs for individuals within the Criminal Justice System (CJS). There is therefore existing pathways through which those at risk from substance abuse or alcohol misuse can be appropriately referred. If the ATC attracts those who might have otherwise entered the criminal justice system then such opportunities for referral might be lost. The nature of the ATC suggests that it is a worthwhile venue for alcohol referral and intervention. We observed that some patients were distressed when they sobered sufficiently to appreciate their situation. This suggests that patients are in a “teachable moment”, the time when recipients are naturally reflecting on their use of alcohol and when interventions are expected to work best [63]. A structured approach to interventions in the ATC is available, likely to be cost effective [61] and have been evaluated using robust methods [62]. 39 SC Moore ATC Evaluation May 2013 10.1.2 Measuring Alcohol Currently there are no mechanisms in place to reliably capture the extent of alcohol misuse in patient attending ED or the ATC. Broadly, measuring aspects of alcohol use can facilitate referral, intervention and epidemiological initiatives. For example, standard brief alcohol interventions [62] are usually most effective when targeted at those who are at moderate risk because of their level of consumption. It is wasteful to deliver interventions to those at no or minimal risk and those who are dependent or at high risk benefit most from referral to alcohol health workers [61]. Furthermore, Noted in the WHO report on alcohol and injury, “[r]esearch from hospital emergency departments also suggests that patients who consumed alcohol prior to their injury are more likely to be heavy drinkers and have had prior experience of alcohol-related problems. Furthermore, these patients are unlikely to access health care services apart from emergency departments. The collection of accurate data on drinking patterns of these patients would therefore be useful in determining whether emergency departments can be used as intervention points for these hard to reach population groups” [64]. The ATC therefore provides a unique opportunity to work with a subset of patients whose main contact with health services generally is through ED or the ATC. There are two broad categories of measure. The first relies on self-report and includes the Alcohol Use Disorders Identification Test (AUDIT) [65, 66] and the Fast Alcohol Screening Test (FAST) [67]. There are also simpler derivations of these metrics, including the Single Alcohol Screening Question (SASQ) [68]. The second set are biomarkers and objective measure that are associated with alcohol use. Blood alcohol concentration is associated with and a reliable indicator for alcohol dependence in trauma patients [69]. The bio-markers carbohydrate-deficient transferrin, gamma-glutamyl-transferase, and mean corpuscular volume, however, add little discriminatory power to AUDIT scores in determining alcohol problems in patients attending a ED [70]. Blood or breath alcohol concentration at time of attendance for trauma patients is a good indicator of hazardous drinking when compared against serum gammaglutamyl transferase, aspartate aminotransferase, carbohydrate-deficient transferrin and mean corpuscular volume in 16 to 49 year olds [71]. Subjective estimates by clinical staff, such as olfactory sense, over-estimate the presence of alcohol intoxication in sober patients [72]. There are two reasons why patients should be screened for alcohol in the ATC and ED. First, to determine the extent of alcohol-related harm. Currently it is grossly under-reported and with understanding the extent of the problems associated with alcohol misuse resources are unlikely to be appropriately targeted to challenge these issues. Second, to appropriate the correct treatment of patient. In particular, to determine whether patients would benefit from a brief alcohol intervention or referral to an alcohol health worker. In general, self-report measures (AUDIT, FAST and SASQ) are used to determine the need for intervention or referral. Bio-markers, however, are the only measure that provides an indication of the presence of alcohol at time of attendance. Given that blood or breath alcohol concentration is broadly associated with hazardous drinking and that there already exists ICD-10 [73] alcohol codes to classify the extent of alcohol toxicity, blood or breath alcohol concentration is preferred. Table 10 – ICD-10 codes for blood alcohol level ICD-10 Code Y90.0 Description Blood alcohol level of less than 20 mg/100 ml Y90.1 Blood alcohol level of 20-39 mg/100 ml 40 SC Moore ATC Evaluation May 2013 Y90.2 Blood alcohol level of 40-59 mg/100 ml Y90.3 Blood alcohol level of 60-79 mg/100 ml Y90.4 Blood alcohol level of 80-99 mg/100 ml Y90.5 Blood alcohol level of 100-119 mg/100 ml Y90.6 Blood alcohol level of 120-199 mg/100 ml Y90.7 Blood alcohol level of 200-239 mg/100 ml Y90.8 Blood alcohol level of 240 mg/100 ml or more Y90.9 Presence of alcohol in blood, level not specified 11 Conclusion The Alcohol Treatment Centre is of benefit to the Cardiff community, it reduces risk of harm to those who use the city centre at night, reduces ambulance waiting time at the Emergency Department and therefore improves ambulance capacity in the community, and it successfully diverts those exhibiting severe intoxication away from the Emergency Department. The latter has implications for the clinical environment in the Emergency Department with evidence suggesting a quieter and more orderly environment for all patients. This report concludes that the Alcohol Treatment Centre pilot has successfully demonstrated it’s value. Further work is required to insure only those patients who are eligible for the Centre are admitted, to minimise additional attendances that would not usually require medical assistance. That the Centre staff consider carefully which days the Centre should operate, so that available resources are maximised. More generally, consideration should be given to the context in which those exhibiting alcohol intoxication are recorded in health systems. First, too few of those who are intoxicated are recorded as such in ED systems. Second, there is a conflict between the treatment of drunkenness (typically patients are left to sober up) and the reporting standards that require patients to spend no longer than four hours in the Emergency Department. All partners should consider how best to intervene and refer patients to secondary care for the treatment of underlying alcohol misuse problems. The Centre provides an appropriate context in which patients can be assessed and referred to alcohol health workers as appropriate. Necessary of the considerable burden that alcohol misuse places on health services is to me appropriately addressed. 12 Recommendations That the Alcohol Treatment Centre is adopted, subject to regular evaluation, audit and clinical governance and that dedicated staff are appointed to insure compliance with European Working Time Directives. That more work is completed on existing data to determine which evenings will be the most helpful for the ATC to be opened. That the ATC data is shared with partners in the same manner that ED data is shared: to inform the optimal allocation of resources to target the source of alcohol-related harm. That the medium and long-term outcome of patients attending the ATC is considered and monitored. 41 SC Moore ATC Evaluation May 2013 That partners consult on what brief alcohol intervention is likely to be successful for patients at moderate risk due to their use of alcohol and develop robust referral pathways for those deemed at significant risk. That consideration is given to opportunities to work with the police service in the development of sobriety schemes, whereby statutory powers are used to motivate patients in seeking help with their alcohol use. That ED targets are revised so that those presenting with acute alcohol intoxication can be removed from the standard four hour see-treat-discharge restriction, recognising that these patients require greater time because of their condition. That efforts are made to develop robust methods to accurately record alcohol intoxication levels in those presenting to the ATC and ED and that these data are used to inform intervention and referral. That attention is given to the misuse of unscheduled care resources (either through inappropriate referral or through patients not requiring unscheduled care) both at the ATC and ED, the source of those referrals and opportunities to re-educate to reduce waste. That time is invested with partners, including the police and Street Pastors, to ensure the ATC only receives appropriate referrals, and that the ATC does not become a general holding area for those not requiring clinical attention. That basic data management is improved so that practitioners in the ATC can access patient files and update systems accordingly and ATC data is inputted into systems in a timely manner to inform partnership activity. That partners consider further innovations in the ATC so that a less alcohol-specific remit is considered. For example, provision might be made to treat those presenting with symptoms indicative of the recreational use of illicit substances and there may be opportunities to consider services and advice for those who have engaged in risky sexual intercourse. 42 SC Moore ATC Evaluation May 2013 13 References 1. 2. 3. 4. 5. 6. 7. 8. 9. 10. 11. 12. 13. 14. 15. 16. 17. 18. 19. Florence C, Shepherd JP, Brennan IR, Simon T: Effectiveness of anonymised information sharing and use in health service, police, and local government partnership for preventing violence related injury: experimental study and time series analysis. British Medical Journal 2011, 342:d3313. Moore SC, Brennan I, Murphy S: Predicting and measuring premises-level harm in the night-time economy. Alcohol and Alcoholism 2011, 46(3):357-363. Moore SC, Shepherd JP, Perham N, Cusens B: The prevalence of alcohol intoxication in the night-time economy. Alcohol and Alcoholism 2007, 42(6):629634. Lloyd B, Matthews S, Livingston M, Jayasekara H, Smith K: Alcohol intoxication in the context of major public holidays, sporting and social events: a time-series analysis in Melbourne, Australia, 2000-2009. Addiction in press. Chief Medical Officer publishes guidance on children drinking alcohol [http://wales.gov.uk/newsroom/healthandsocialcare/2010/4172146/] Hopkins S: Alcohol and its impact on our community. Annual Report of the Director of Public Health, Cardiff & Vale University Health Board 2011. The impact of alcohol on the NHS. St Ives, Cambs: Institute of Alcohol Studies; 2007. Baboolal K, Griffiths JD, Knight VA, Nelson AV, Voake C, Williams JE: How efficient can an emergency unit be? A perfect world model. Emergency Medicine Journal 2012, 29(12):972-977. Derlet RW, Richards JR: Overcrowding in the nation’s emergency departments: Complex causes and disturbing effects. Annals of Emergency Medicine 2000, 35(1):63-68. Moore SC, Heikkinen M: Secondary harms and opportunities for moderation. Addiction in press. Stirling G, Higgins J, Cooke MW: Violence in A&E departments: A systematic review of the literature. Accident and Emergency Nursing 2001, 9:77-85. Alcohol and Injuries: Emergency Department Studies in an International Perspective. In. Geneva: World Health Organisation; 2009. Rehm J, Room R, Graham K, Monteiro M, Gmel G, Sempos CT: The relationship of average volume of alcohol consumption and patterns of drinking to burden of disease: an overview. Addiction 2003, 98:1209-1228. Room R, Babor TF, Rehm J: Alcohol and public health. Lancet 2005, 365:519-530. Moore SC, Murphy S, Brennan IR, Moore SN, Shepherd JP, Moore L: An Exploratory Randomised Controlled Trial of a Premises-Level intervention to Reduce Alcohol-Related Harm Including Violence in the United Kingdom. BMC Public Health 2012, 12(412). NIAAA Council Approves Definition of Binge Drinking. NIAAA Newsletter 2004, 3:3. Rehm J, Gmel G, Sempos CT, Trevisan M: Alcohol–related morbidity and mortality. Alcohol Research and Health 2002, 27(1):39-51. Hutchinson TP, Kloeden CN, Lindsay VL: Countermeasures to the problem of accidents to intoxicated pedestrians. Journal of Forensic and Legal Medicine 2010, 17(3):115-119. Humphreys DK, Eisner MP: Evaluating a natural experiment in alcohol policy: the Licensing Act (2003) and the requirement for attention to implementation. Criminology and Public Policy 2010, 9(1). 43 SC Moore ATC Evaluation May 2013 20. 21. 22. 23. 24. 25. 26. 27. 28. 29. 30. 31. 32. 33. 34. 35. 36. 37. 38. Hadfield P, Lister S, Traynor P: ‘This town’s a different town today’: Policing and regulating the night-time economy. Criminology & Criminal Justice 2009, 9(4):465485. Guidance on the Safer Detention and Handling of Persons in Police Custody: Second Edition. In. London: Association of Chief Police Officers and the National Policing Improvement Agency; 2012. Deaths in or following police custody: an examination of the cases 1998/99 – 2008/09 (IPCC Research Series Paper: 17). In. London: Independent Police Complaints Commission; 2010. Biles D, McDonald D, Fleming J: Australian deaths in custody 1980-88: an analysis of aboriginal and non-aboriginal deaths in prison and police custody (Research paper no. 7). In: Deaths in Custody Australia, 1980-1989. edn. Edited by Biles D, McDonald D. Griffith ACT Australia; 1992: 117-206. Giles HG, Sandrin S: Alcohol and deaths in police custody. Alcoholism: Clinical and Experimental Research 1992, 16(4):670-672. Thematic inspection. Medical services for people in police custody. In. Edinburgh: Her Majesty’s Inspectorate of Constabulary for Scotland; 2008. Delivering emergency care services: an integrated approach for delivering unscheduled care in Wales. In. Cardiff: Welsh Assembly Government; 2008. Transforming NHS Ambulance Services. In. London: House of Commons Committee of Public Accounts; 2011. Cooke M, Fisher J, Dale J, McLeod E, Szczepura A, P W, Wilson S: Reducing attendances and waits in emergency departments: a systematic review of present innovations. Report to the National Co-ordinating Centre for NHS Service Delivery and Organisation R & D (NCCSDO) 2004. Fagan RW, Mauss AL: Padding the revolving door - an initial assessment of the Uniform Alcoholism and Intoxication Treatment Act in oractice. Social Problems 1978, 26(2):232-246. McCarty D, Caspi Y, Panas L, Krakow M, Mulligan DH: Detoxification centers: who's in the revolving door? The Journal of Behavioral Health Services and Research 2000, 27(3):245-256. Brady M, Nicholls R, Henderson G, Byrne J: The role of a rural sobering up centre in managing alcohol-related harm to Aboriginal people in South Australia. Drug and Alcohol Review 2006, 25(3):201-206. Griesbach D, Lardner C, Russell P: Managing the needs of drunk and incapable people in Scotland: a literature review and needs assessment. In. Edinburgh: Scottish Government Social Research; 2009. Strempel P, Saggers S, Gray D, Stearne A: Indigenous drug and alcohol projects: elements of best practice (ANCD Research Paper No. 8). In. Canberra: Australian National Council on Drugs; 2004. Sivarajasingam V, Shepherd JP, Matthews K: Effect of urban closed circuit television on assault injury and violence detection. Injury Prevention 2003, 9(4):312-316. Wells S, Graham K: Aggression involving alcohol: relationship to drinking patterns and social context. Addiction 2003, 98:33-42. Graham K, Homel R: Raising the Bar: Preventing Aggression In and Around Bars, Pubs and Clubs. Cullompton: Willan Publishing; 2008. Giancola PR, Zeichner A: Alcohol related aggression in males and females: Effects of blood alcohol concentration, subjective intoxication, personality, and provocation. Alcoholism: Clinical and Experimental Research 1995, 19(1):130134. Chermack ST, Giancola PR: The relation between alcohol and aggression: An integrated biopsychosocial conceptualization. Clinical Psychology Review 1997, 17(6):621-649. 44 SC Moore ATC Evaluation May 2013 39. 40. 41. 42. 43. 44. 45. 46. 47. 48. 49. 50. 51. 52. 53. 54. 55. 56. 57. 58. 59. 60. 61. Bushman BJ, Cooper HM: Effects of alcohol on human aggression: An integrative research review. Psychological Bulletin 1990, 107(3):341-354. Moore SC, Flajšlik M, Rosin PL, Marshall D: A particle model of crowd behavior: Exploring the relationship between alcohol, crowd dynamics and violence. Aggression and Violent Behavior 2008, 13(6):413-422. Gilmore I: Alcohol - can the NHS afford it? In: A report of a Working Party of the Royal College of Physicians. London: Royal College of Physicians; 2001. Simpson T, Murphy N, Peck DF: Saliva alcohol concentrations in accident and emergency attendances. Emergency Medical Journal 2001, 18:250-254. DSCN 04/2007: Quarterly Monitoring of Accident and Emergency Services (QMAE). In.: Information Standards Board for Health and Social Care; 2007. Knight VA, Harper PR: Modelling emergency medical services with phase-type distributions. Health Systems 2012, 1:58-68. Knight VA, Harper PR, Smith L: Ambulance allocation for maximal survival with heterogenous outcome measures. Omega in press. Vile JL, Gillard JW, Harper PR, Knight VA: Predicting ambulance demand using singular spectrum analysis. Journal of the Operational Research Society 2012, 63:1556-1565. Springett J: Appropriate approaches to the evaluation of health promotion. Critical Public Health 2001, 11:139-151. Craig P, Dieppe P, MacIntyre S, Mitchie S, Nazareth I, Petticrew M: Developing and evaluating complex interventions: the new Medical Research Council guidance. British Medical Journal 2008, 337:979-983. Steckler A, Linnan L: Process Evaluation for Public Health Interventions and Research. San Francisco, CA: Jossey-Bass; 2004. Pawson R, Tilley N: Realistic Evaluation. London: Sage; 1997. Shepherd JP, Brickley MR: The relationship between alcohol intoxication stressors and injury in urban violence. British Journal of Criminology 1996, 36(4):546-566. Flatley J, Kershaw C, Smith K, Chaplin R, Moon D: Crime in England and Wales 2009/10. London: Home Office; 2010. Quigg Z, Stuart J, Hughes k, Williams K, Mehta B, Levine M, Buchanan M, Bellis MA: Measuring alcohol-related emergency department attendances amongst young people. In.; 2010. Moore SC: Red Alert. Jane's Police Review 2006, 114(5905):22-23. Quarterly Monitoring of Accident and Emergency (QMAE). In. London: Department of Health; 2008. Snooks H, Wrigley H, George S, Thomas E, Smith H, Glasper A: Appropriateness of use of emergency ambulances. Journal of Accident and Emergency Medicine 1998, 15:212-218. Brennan I, Moore SC, Shepherd JP: Weapons and injury severity: priorities for prevention of non-firearm injury. Injury Prevention 2006, 12:395-399. Pryor S: Trust Board – Operational Performance: September 2008. In.: Welsh Ambulance Services NHS Trust; 2008. NHS Wales: annual quality framework. In.: Welsh Assembly Government; 2011/2012. Crawford MJ, Patton R, Touquet R, Drummond C, Byford S, Barrett B, Reece B, Brown A, Henry JA: Screening and referral for brief intervention of alcoholmisusing patients in an emergency department: a pragmatic randomised controlled trial. Lancet 2004, 364:1334-1339. Barrett B, Byford S, Crawford MJ, Patton R, Drummond C, Henry JA, Touquet R: Cost-effectiveness of screening and referral to an alcohol health worker in alcohol misusing patients attending an accident and emergency department: a decision-making analysis. Drug and Alcohol Depenence 2006, 81:47-54. 45 SC Moore ATC Evaluation May 2013 62. 63. 64. 65. 66. 67. 68. 69. 70. 71. 72. 73. Kaner E, Bland M, Cassidy P, Coulton S, Dale V, Deluca P, Gilvarry E, Godfrey C, Heather N, Myles J et al: Effectiveness of screening and brief alcohol intervention in primary care (SIPS trial): pragmatic cluster randomised controlled trial. British Medical Journal 2013, 346(e8501). Williams S, Brown A, Patton R, Crawford MJ, Touquet R: The half-life of the 'teachable moment' for alcohol misusing patients in the emergency department. Drug and Alcohol Depenence 2005, 77(2):205-208. Alcohol and injury in emergency departments: summary of the report from the WHO collaborative study on alcohol and injuries. In.: World Health Organization; 2007. Babor TF, Higgins-Biddle JC, Saunders JB, Monteiro M: The Alcohol Use Disorders Identification Test: Guidelines for Use in Primary Care. Geneva: World Health Organization: Department of Mental Health and Substance Dependence; 2001. Soderstrom CA, Dischinger PC, Kerns TJ, Kufera JA, McDuff DR, Gorelick DA, Smith GS: Screening trauma patients for alcoholism according to the NLAAA guidelines with alcohol use disorders identification test questions. Alcoholism: Clinical and Experimental Research 1998, 22(7):1470-1475. Hodgson R, Alwyn T, John B, Thom B, Smith A: The fast alcohol screening test. Alcohol and Alcoholism 2002, 37(1):61-66. Canagasaby A, Vinson DC: Screening for hazardous or harmful drinking using one ot two quantity-frequency questions. Alcohol and Alcoholism 2005, 40(3):208-213. Ryb GE, Soderstrom CA, Kufera JA, Dischinger PC, Ho SM: Use of blood alcohol concentration and laboratory tests to detect current alcohol dependence in trauma centre patients. Journal of Trauma-Injury Infection and Critical Care 1999, 47(5):874-879. Neumann T, Gentilello LM, Neuner B, Weiss-Gerlach E, Schürmann H, Schröder T, Müller C, Haas NP, Spies CD: Screening trauma patients with the alcohol use disorders identification test and biomarkers of alcohol use. Alcoholism: Clinical and Experimental Research 2009, 33(6):970-976. Savola O, Niemelä O, Hillbom M: Blood alcohol is the best indicator of hazardous alcohol drinking in young adults and working-age patients with trauma. Alcohol and Alcoholism 2004, 39(4):340-345. Malhotra S, Kasturi K, Abdelhak N, Paladino L, Sinert R: The accuracy of the olfactory sense in detecting alcohol intoxication in trauma patients. Emergency Medical Journal 2012, doi:10.1136/emermed-2012-201548. International Statistical Classification of Diseases and Related Health Problems (10th Revision). In.: World Health Organization. ; 2010. 46 SC Moore ATC Evaluation May 2013 14 Appendices 14.1 NHS Reference Costs Unit cost is determined by dividing total cost by activity National Schedule of Reference Costs 2011-12 AandEMSAD AandEMSNA AandEMinAD AandEMinNA AandEWiCAD AandEWiCNA Description Accident and Emergency Services: Leading to Admitted Accident and Emergency Services: Not Leading to Admitted Accident and Emergency Services: Minor Injury Service: Leading to Admitted Accident and Emergency Services: Minor Injury Service: Not Leading to Admitted Accident and Emergency Services: Walk In Centres: Leading to Admitted Accident and Emergency Services: Walk In Centres: Not Leading to Admitted Activity Unit Cost Total Cost 4,040,760 £157 £635,283,308 10,405,762 £108 £1,126,156,223 199,816 £74 £14,713,583 1,606,657 £60 £97,171,176 92,610 £42 £3,901,387 1,251,374 £42 £52,067,489 14.2 Ambulance Handover Costs Ambulance costs TPCTPARA TPCTPARB TPCTPARC TPCTPARETU TPCTPARO Paramedic Services: Category A / Red Paramedic Services: Category B / Amber Paramedic Services: Category C / Green Paramedic Services: Emergency Transfers / Urgents Paramedic Services: Other 1,925,679 £238 £458,578,782 2,515,971 983,504 £222 £223 £557,682,962 £219,397,713 882,498 425,037 £246 £70 £216,862,211 £29,774,041 47


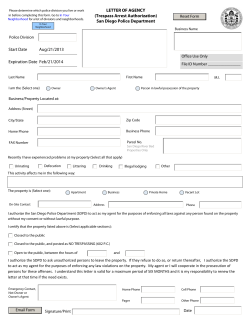

© Copyright 2026