
Effects of Acoustic Treatment on Sound Environment in Public Buildings Henri Kari
Henri Kari
Effects of Acoustic Treatment on Sound
Environment in Public Buildings
School of Electrical Engineering
Thesis submitted for examination for the degree of Master of
Science in Technology.
Espoo 18.10.2012
Thesis supervisor:
Prof. Vesa V¨alim¨
aki
Thesis instructor:
Lic.Sc. (Tech.) Jyrki Kilpikari
A’’
Aalto University
School of Electrical
Engineering
aalto university
school of electrical engineering
abstract of the
master’s thesis
Author: Henri Kari
Title: Effects of Acoustic Treatment on Sound Environment in Public
Buildings
Date: 18.10.2012
Language: English
Number of pages:8+76
Department of Signal Processing and Acoustics
Professorship: Audio Signal Processing
Code: S-89
Supervisor: Prof. Vesa V¨alim¨aki
Instructor: Lic.Sc. (Tech.) Jyrki Kilpikari
The effects of acoustical treatment on the sound environment of three different
types of public-type spaces were investigated in this thesis. The basic theory of
room acoustics and the most common room acoustical parameters are explained
in the work. Acoustical conditions and requirements of public spaces are also
considered.
The three studied places were a classroom, a healthcare space, and an open
plan office. Measurements of common acoustical parameters, such as the reverberation time, the speech transmission index, the rate of spatial decay of sound
pressure level per distance doubling, the clarity, and the strength, were performed
before and after the acoustical treatment. Various methods and materials, such
as ceiling- and wall panels, were used to improve the sound environment of the
studied places. The measured places were in normal use after the acoustical renovation.
The performed measurements show that the acoustical treatment clearly enhances the sound environment in each type of space. In the classroom the speech
intelligibility has increased and the reverberation time has decreased after the
treatment. These changes lead to better learning environment, when students can
hear the teacher better and the teacher is able to talk with normal voice. In the
healthcare space the reverberation time has decreased offering more pleasant sound
environment to the patients. Also, the speech intelligibility has increased, which
helps the communication between the patients and the nursing staff. In the open
plan office the overall sound pressure level has decreased and the speech intelligibility has decreased between workplaces after the treatment. The obtained sound
environment offers more privacy to the employees improving the concentration to
the work.
Keywords: acoustics, acoustic measurements, open plan office, classroom,
healthcare space
¨n
diplomityo
¨
tiivistelma
aalto-yliopisto
¨ hko
¨ tekniikan korkeakoulu
sa
Tekij¨a: Henri Kari
Ty¨on nimi: Akustoinnin vaikutus julkisten tilojen ¨aa¨niymp¨arist¨oo¨n
P¨aiv¨am¨aa¨r¨a: 18.10.2012
Kieli: Englanti
Sivum¨a¨ar¨a:8+76
Signaalink¨asittelyn ja akustiikan laitos
Professuuri: Audiosignaalink¨asittely
Koodi: S-89
Valvoja: Prof. Vesa V¨alim¨aki
Ohjaaja: TkL Jyrki Kilpikari
T¨ass¨a diplomity¨oss¨a tutkittiin akustoinnin vaikutusta kolmen eri tyyppisen
julkisen tilan a¨a¨niymp¨arist¨oo¨n. Huoneakustiikan perusteoria sek¨a yleisimm¨at
huoneakustiset parametrit k¨ayd¨aa¨n l¨api. Ty¨oss¨a k¨asitell¨aa¨n my¨os julkisten tilojen
a¨¨aniymp¨arist¨oj¨a ja akustisia vaatimuksia kyseisille tiloille.
Tutkitut kohteet olivat luokkahuone, terveydenhoitotila ja avotoimisto.
Yleisimm¨at akustiset parametrit, kuten j¨alkikaiunta-aika, puheensiirtoindeksi,
levi¨amisvaimennusaste, selkeys ja voimakkuus, mitattiin tutkituissa tiloissa ennen ja j¨alkeen akustoinnin. Erilaisia tapoja ja materiaaleja, kuten katto- sek¨a
sein¨alevyj¨a, k¨aytettiin parantamaan tilojen akustiikkaa. Mitatut tilat olivat normaalissa k¨ayt¨oss¨a akustisen parannuksen j¨alkeen.
Suoritettujen akustisten mittausten perusteella akustointi parantaa selke¨asti
jokaisen tilatyypin ¨a¨aniymp¨arist¨o¨a. Luokkahuoneessa puheen erotettavuus on
parantunut ja j¨alkikaiunta-aika on lyhentynyt akustoinnin j¨alkeen. N¨aist¨a muutoksista seuraa parempi oppimisymp¨arist¨o, kun oppilaat kuulevat opettajan paremmin ja opettaja voi puhua normaalilla a¨¨anenvoimakkuudella. Terveydenhoitotilassa j¨alkikaiunta-aika lyheni tarjoten potilaille miellytt¨av¨amm¨an a¨a¨niymp¨arist¨on.
My¨os puheen erotettavuus kasvoi, mik¨a parantaa kommunikaatiota potilaiden ja
hoitohenkil¨okunnan v¨alill¨a. Avotoimistossa ¨a¨anipainetaso laski kaikkialla toimistossa ja puheen selkeys laski ty¨opisteiden v¨alill¨a akustoinnin j¨alkeen. Saavutettu
a¨¨aniymp¨arist¨o antaa ty¨ontekij¨oille enemm¨an yksityisyytt¨a lis¨aten keskittymist¨a
ty¨oh¨on.
Avainsanat: akustiikka, akustiset mittaukset, avotoimisto, luokkahuone, terveydenhoitotila
iv
Preface
This thesis has been written between 1.3.2012 - 30.9.2012 for Ecophon business unit
Finland in Pit¨aj¨anm¨aki. Many thanks for Jari Johansson and Jyrki Kilpikari for
making all this possible. Measurements were made in the Piikki¨o comprehensive
school, the Kiinteist¨o Oy Sein¨ajoki’s Y-building, and the Finnish Real Estate Federation office. I would like to thank all the personnel of before mentioned measurement
sites for a fluent collaboration. Also, i would like to thank Finnish Institute of Occupational Health for lending the measurement equipment.
The supervisor of the thesis was Prof. Vesa V¨alim¨aki and the instructor of
the thesis was Lic.Sc.(Tech.) Jyrki Kilpikari. Both of them offered many advices
and encouraged to continue the thesis project. The feedback given on incomplete
versions of this work has been invaluable.
I would also like to thank Pauli Pallaskorpi and Arto Rauta for a logistical help
and important support, Jouko Hakala for numerous advices and instructions, and
all Ecophon personnel for a nice coffee breaks and company.
Great thanks for my parents for all the support during the studentship and for
Elina for the encouragement and endless tolerance to my complaining about this
work.
Finally I would like to thank all of my friends who, undoubtedly, believed that
I would graduate one day.
Pit¨aj¨anm¨aki, 12.9.2012
Henri Kari
v
Contents
Abstract
ii
Abstract (in Finnish)
iii
Preface
iv
Contents
v
Symbols and acronyms
vii
1 Introduction
1.1 Acoustics of public spaces in Finland . . . . . . . . . . . . . . . . . .
1.2 Contents of the thesis . . . . . . . . . . . . . . . . . . . . . . . . . . .
2 Room- and building acoustics
2.1 Room acoustics . . . . . . . . . . . . .
2.1.1 Properties of sound wave . . . .
2.1.2 Sound reflection and refraction
2.1.3 Absorption . . . . . . . . . . .
2.2 Building acoustics . . . . . . . . . . . .
2.2.1 Airborne sound insulation . . .
2.2.2 Step sound insulation . . . . . .
2.2.3 Sound emanating in buildings .
.
.
.
.
.
.
.
.
.
.
.
.
.
.
.
.
.
.
.
.
.
.
.
.
.
.
.
.
.
.
.
.
.
.
.
.
.
.
.
.
.
.
.
.
.
.
.
.
.
.
.
.
.
.
.
.
.
.
.
.
.
.
.
.
3 Room acoustic criteria
3.1 Reverberation time (T60 ) . . . . . . . . . . . . . . . .
3.2 Early decay time (EDT) . . . . . . . . . . . . . . . .
3.3 Speech transmission index (STI, RASTI and STIPA)
3.4 Rate of spatial decay of sound pressure level per
distance doubling (DL2 ) . . . . . . . . . . . . . . . .
3.5 Strength (G) . . . . . . . . . . . . . . . . . . . . . .
3.6 Clarity (C50 ) . . . . . . . . . . . . . . . . . . . . . . .
3.7 Definition (D50 ) . . . . . . . . . . . . . . . . . . . . .
3.8 Center time (Ts ) . . . . . . . . . . . . . . . . . . . .
4 Acoustics of public spaces
4.1 General sound environment and requirements
4.1.1 Classroom . . . . . . . . . . . . . . . .
4.1.2 Healthcare space . . . . . . . . . . . .
4.1.3 Open plan office . . . . . . . . . . . . .
4.2 Acoustical solutions . . . . . . . . . . . . . . .
4.2.1 Acoustic panels and resonators . . . .
4.2.2 Other solutions . . . . . . . . . . . . .
.
.
.
.
.
.
.
.
.
.
.
.
.
.
.
.
.
.
.
.
.
.
.
.
.
.
.
.
.
.
.
.
.
.
.
.
.
.
.
.
.
.
.
.
.
.
.
.
.
.
.
.
.
.
.
.
.
.
.
.
.
.
.
.
.
.
.
.
.
.
.
.
.
.
.
.
.
.
.
.
.
.
.
.
.
.
.
.
.
.
.
.
.
.
.
.
.
.
.
.
1
1
2
3
3
3
4
7
7
8
12
13
14
. . . . . . . . . 14
. . . . . . . . . 16
. . . . . . . . . 17
.
.
.
.
.
.
.
.
.
.
.
.
.
.
.
.
.
.
.
.
.
.
.
.
.
.
.
.
.
.
.
.
.
.
.
.
.
.
.
.
.
.
.
.
.
.
.
.
.
.
.
.
.
.
.
.
.
.
.
.
.
.
.
.
.
.
.
.
.
.
.
.
.
.
.
.
.
.
.
.
.
.
.
.
.
.
.
.
.
.
.
.
.
.
.
.
.
.
.
.
.
21
23
24
25
25
.
.
.
.
.
.
.
26
26
26
28
28
30
30
33
vi
5 Measurement methods and measured
5.1 Devices and programs . . . . . . . .
5.2 Measurement techniques . . . . . . .
5.3 Measured spaces . . . . . . . . . . .
5.3.1 Classroom . . . . . . . . . . .
5.3.2 Healthcare space . . . . . . .
5.3.3 Open plan office . . . . . . . .
spaces
. . . . .
. . . . .
. . . . .
. . . . .
. . . . .
. . . . .
.
.
.
.
.
.
.
.
.
.
.
.
.
.
.
.
.
.
.
.
.
.
.
.
.
.
.
.
.
.
.
.
.
.
.
.
.
.
.
.
.
.
.
.
.
.
.
.
.
.
.
.
.
.
.
.
.
.
.
.
.
.
.
.
.
.
.
.
.
.
.
.
.
.
.
.
.
.
34
34
34
36
36
39
41
6 Results and analysis
44
6.1 Classroom . . . . . . . . . . . . . . . . . . . . . . . . . . . . . . . . . 44
6.2 Healthcare space . . . . . . . . . . . . . . . . . . . . . . . . . . . . . 50
6.3 Open plan office . . . . . . . . . . . . . . . . . . . . . . . . . . . . . . 55
7 Conclusions
63
References
65
Appendix A
69
A Classroom: Pictures of the measured spaces, and the reverberation
time calculations
69
Appendix B
73
B Healthcare space: Pictures of the measured spaces, and the reverberation time calculations
73
Appendix C
76
C Open plan office: Pictures of the measured spaces
76
vii
Symbols and acronyms
Symbols
A
c
C50
CI
dmin
D50
DL2
e
f
G
h
I
LbgA
Ln
Ln,w
Lp
LpE
m
p
P
rd
R
Rw
S
S/N
T20
T30
T60
Ts
V
α
θ
λ
ρ
Absorption area
Speed of sound
Clarity
Step sound spectral weighting factor
Minimum distance between source and microphone
Definition
Rate of spatial decay of sound pressure per distance doubling
Napier’s constant
Frequency
Strength
Impulse response
intensity
A-weighted background noise level
Step sound level
Step sound level index
Sound pressure level
Sound exposure level
Value of modulation transfer function
Sound pressure
Sound power
Distraction distance
Airborne sound insulation
Airborne sound insulation index
Area
Signal-to-noise ratio
Reverberation time [(-5 dB - -25 dB) × 3]
Reverberation time [(-5 dB - -35 dB) × 2]
Reverberation time
Center time
Volume
Absorption index
Angle of the propagating wave
Wavelength
Density of the air
viii
Acronyms
EDT
EN
HAPC
IEC
ISO
ITU-T
MTF
RASTI
SFS
STI
STIPA
WHO
Early decay time
European standard
Heating, plumbing, air-conditioning
International Electrotechnical Commission
International Organization of Standardization
International Telecommunication Union Standardization Sector
Modulation transfer function
Rapid speech transmission index
Finnish Standards Association
Speech transmission index
Speech transmission index for public address
World Health Organization
1
1.1
Introduction
Acoustics of public spaces in Finland
Sound environment is an important part of the indoor environment. Sound environment could often be poor in public-type spaces, such as healthcare spaces, offices,
and schools. These premises could be overly reverberant making the room uncomfortable to be in, or speech privacy could be poor causing confidential subjects to
spread. Or on the contrary, the speech intelligibility could be very low in the spaces
where it is important to understand other people’s words. Acoustics of these kind of
spaces are taken surprisingly poorly into consideration, although people spend half
or more of their day inside these spaces.
Old buildings do not necessarily offer acceptable acoustic conditions for cognitively demanding working or for needed privacy. New buildings could satisfy these
needs but often acoustics is still not taken into account when designing the building. Furthermore, open spaces are becoming more and more popular among schools
and offices due to cost efficiency and aesthetic and modern appearance of the space.
Open spaces do not usually offer speech privacy or privacy for concentration. These
starting points set challenges for improving the sound environment, without ruining
the aesthetic experience of the space.
The urge to improve the sound environments of the spaces is increasing all the
time along the knowledge of acoustics. However, usually other basic environmental
factors such as temperature, draughtiness, and lightness are first improved before it
is acoustics’ turn, although the sound environment has been shown to affect to the
productivity, concentration, stress level, and healing. Thus, the sound environment
should be taken more seriously into account when designing new healthier and more
comfortable spaces to people to work and to live in.
Designing concert halls in terms of acoustics has been done since 19th century
and manufacturing mineral wool, the basic absorption material, has been started
also already at 19th century. Still, treating the public spaces acoustically is not
very common. The scope of this thesis is to show the importance of the acoustics in
different working and living environments by using existing objective measurement
methods.
In this thesis the sound environment of three different types of public-type spaces
were studied by objective measurements. The studied spaces were a classroom, a
healthcare space, and an open plan office. The classroom was located in the Piikki¨o
comprehensive school, the healthcare place was patient room in the Sein¨ajoki hospital, and the open plan office was the bureau of the Finnish Real Estate Federation
in Helsinki. The spaces were renovated acoustically and the measurements were
conducted before and after the acoustical treatment. The measured spaces were
also in normal use or they will be in normal use. From the measurement results the
influence of the realized acoustical treatment to the sound environment was considered. The most common room acoustic criteria, such as the reverberation time,
speech transmission index, rate of spatial decay of sound pressure level per distance
doubling, clarity, and strength, were used to objectively determine the acoustical
2
conditions of the measured spaces and to unravel the changes the acoustical treatment caused. Suggestions for improving the sound environments of the measured
spaces even more are also provided.
1.2
Contents of the thesis
The theory part of the thesis includes the Chapters 2 and 3. The measurement part
of the work contains the Chapters 4 and 5.
In the second chapter the room- and the building acoustic theory is explained.
The room acoustic theory contains the properties of a sound wave and a theory of
a sound reflection, refraction, and absorption.
The third chapter consists of descriptions of the most common room acoustic
criteria. Room acoustic criteria are used to determine the acoustical condition of
the desired space.
The fourth chapter consists of descriptions of acoustics of a classroom, a healthcare space, and an open plan office along with the recommendations for acoustical
conditions from different standards and guidelines. Solutions and possibilities to
realize certain acoustic conditions are also provided.
Two different measurement equipment sets were used to measure the spaces. The
classroom and the healthcare space were measured with the one set of equipment and
the open plan office was measured with the other set. The fifth chapter introduces
all the measurement devices, methods, and techniques used in this thesis. The
measured spaces are also described in the Chapter 5. The descriptions include the
states of all three spaces before and after the acoustical treatment and explanations
what quantities was measured.
The results and the analysis of the data are presented in the Chapter 6. The
discussion and the comparison of the results are also provided along the suggestions
to improve the acoustic conditions of the measured spaces.
Finally, the Chapter 7 concludes the content of the thesis and is followed by
references and appendices.
3
2
Room- and building acoustics
This chapter consists of basic theory of acoustics in general, room acoustics theory,
and building acoustics theory. In addition, the most common room acoustic criteria
are explained.
2.1
Room acoustics
Room acoustics includes the explanation of the sound as a wave motion and properties of a sound wave. Also, the methods how a sound wave interacts with surrounding
space are considered.
2.1.1
Properties of sound wave
Sound in general is longitudinal wave motion of air molecules. Sound wave consists
of consecutive volumes of pressed air and thinned air. In other words sound wave
consists of consecutive pressures and underpressures around normal air pressure
(Figure 1).
Figure 1: Particle velocity and pressure in one-cycle sinusoidal pulse propagating in
the +x-direction. (Rossing 2007)
Sound field in a certain point in space at certain time instant could be determined
by measuring the pressure and particle velocity of the sound. Pressure is usually
more important measure because changes of pressure arouse the auditory perception
in ear and for example the most common acoustical sensor, microphone, is a pressure
sensor. Sound pressure is basically the change in the static air pressure. The unit
of the pressure is Pascal but the sound pressure is usually expressed in decibel-scale
and it is then called sound pressure level:
2
p
Lp = 10 log
[dB],
(1)
p20
4
where p is the sound pressure and p0 is the reference pressure p0 = 20 μPa. If
energy transmission in sound field is investigated, then the particle velocity should
be measured. The particle velocity is the average velocity of the particles in the
medium where the wave propagates. For example, when sound wave propagates in
the air, the air molecules move back and forth with certain average speed which is
the particle velocity (Figure 1). (Lahti 1995; Rossing 2007)
The velocity of the sound wave depends on the medium the wave propagates in.
In fluids the velocity also depends on the temperature. Propagation velocity of the
sound in air could be expressed as:
c = 331.3 + 0.6t [m/s],
(2)
where t is a temperature in Celsius-degrees (Rossing et al. 2002). For example, in
air in 20◦ C the speed of sound is approximately c0 = 343 m/s. By knowing the
speed and the frequency of the sound it is possible to calculate the wavelength of
the sound wave:
c
λ = [m],
(3)
f
where c is the speed of sound and f is the frequency. The frequency of the sound is
a physical quantity, which is often referred to a pitch of a sound, but in detail, the
pitch is a subjective quantity.
Many acoustical calculations are based on the assumption that the sound wave
is a plane wave. The plane wave is a wave where all the wave fronts of the wave are
parallel surfaces and are perpendicular to the direction of the propagation. After
this point when referring to a sound wave it is assumed to be a plane wave. (Rossing
and Fletcher 1995)
2.1.2
Sound reflection and refraction
When sound wave encounters a surface, a part of it will absorb to the obstacle
material, a part will penetrate the surface and refract, and the remaining part will
reflect from the surface and continue propagation to some other direction. Sound
wave reflects from the surface at the same angle as it arrives (Figure 2). The
refraction of the sound wave obeys Snell’s law:
sin(θ1 )
c2
= ,
sin(θ2 )
c1
(4)
where θ1 is the angle of the incident wave, θ2 is the angle of the refracted wave, c1 is
the wave velocity in material 1 (Figure 2) and c2 is the wave velocity in the material
2 (Figure 2).
Normally the refraction of the sound exists when the temperature of the air
changes gradually with the altitude, for example outdoors. This causes the speed of
sound to change gradually along the altitude, thus making the sound wave to refract
multiple times or in other words to bend. (Karjalainen 2000)
In a normal room the sound wave usually reflects multiple times from different
surfaces, for example walls, windows, ceiling, floor, and furniture. If the room has
5
Figure 2: Reflection of a plane wave at an interface between two fluids. (Rossing
2007)
two parallel surfaces (usually opposite walls and floor and ceiling) where the sound
is able to reflect, between those surfaces forms a standing wave, which is called a
natural vibration or a room mode. The frequency of the room mode depends on the
distance of the parallel surfaces. In order to form a mode in a certain frequency, the
distance between the parallel surfaces should be an integer multiple of the half of
the wavelength of the sound:
λ
lp = n [m],
(5)
2
where lp is the distance between the surfaces, n is the integer coefficient and λ is
the wavelength. Using equations 3 and 5 we get the frequency of the formed room
mode:
c
f =n
[Hz].
(6)
2lp
This basic formula is only true for room modes between two parallel surfaces. (Rossing 2007)
In real rooms exists also other types of room modes. Normal room consists of
six surfaces which are parallel in pairs. The above-mentioned one-dimensional case,
where the standing wave is formed between two parallel surfaces, is called axial
mode. When standing wave is formed between four surfaces it consists of a sum of
two standing waves formed between two pairs of surfaces. Thus, it vibrates in two
dimensions and it is called tangential mode. The standing wave is called oblique
mode when it vibrates in all three dimensions and uses all six surfaces of the room.
6
The natural frequencies of the desired room could be calculated from formula:
2
m 2 n 2
c
l
f=
+
+
[Hz],
(7)
2
L
W
H
where L, W , and H are the dimensions of the room in meters and l, m, and n are
integers describing the degree and the position of the mode. Respectively, the mode
frequencies are usually written with three numbers, for example f (0, 1, 1). Axial
modes are obtained from the equation by setting two of the integers l, m, or n zero.
Then the Equation 7 reduces to Equation 6. Tangential modes are also obtained
from the Equation 7 but now by setting only one of the integers zero. Equation
7 is also only true for rectangular shaped rooms. Usually this does not set any
difficulties but it is coming more and more common to use diagonal or tilted walls
in buildings just for aesthetic reasons or to avoid flutter echo. If this is the case,
then more sophisticated methods, for example computer programs, could be used
to model the reflections in rooms. (Uosukainen 2010; Rossing et al. 2002)
In order not to affect to the spectrum of the sound, the room’s natural frequencies
should be as dense as possible. When examining the Equation 7, it could be noticed
that the mode density increases as the frequency increases. Thus, it is usually
appropriate to explore only the individual modes at the lower frequencies. Schroederfrequency is the theoretical limit for considering individual room modes:
T60
fs = 2000
[Hz],
(8)
V
where T60 is the reverberation time of the room and V is a volume of the room.
Below the Shroeder-frequency the mode density is so low that individual room modes
could be distinguished from each other and thus become significant. Individual
modes could affect significantly to the sound pressure level of certain positions in
the room, for example if a loudspeaker is placed at the maximum of the mode, the
corresponding frequency will be emphasized.
Between two parallel walls is also possible to form a flutter echo. A flutter echo
is formed when a sound is reflecting multiple times from the parallel walls and it
is perceived as a series of fast consequent echoes. With diffusers, absorption panels
or non-parallel walls it is possible to prevent or suppress the flutter echo. (Rossing
2007)
Diffusers are randomly irregular or uneven surfaces. When a sound wave arrives
to the diffuser it will reflect to multiple directions, creating more diffuse sound field
to the room. This also prevents flutter echoes from developing. Every uneven surface
will affect to the diffuseness of the room, and also commercial diffusers are available
for treating the room. Totally diffuse sound field does not actually exist, but it
is defined as a field which consists of infinite number of plane waves which arrive
evenly from every direction and do not correlate with each other. This means that
in diffuse field the energy do not flow to anywhere on an average. (Lahti 1995)
Many of the basic acoustical measurement- and calculation methods are based on
the assumption of the diffuse field. Usually normal rooms could be considered as a
diffuse without affecting to the measurement- or calculation results significantly.
7
2.1.3
Absorption
When a sound wave is absorbed to the material, the acoustical energy is transformed
to the heat energy. The sound is transformed to heat because pores of the material
generate friction to the particle vibration inside the material. Porous materials, such
as mineral wool, have usually a high ratio of absorption. The ratio of absorption is
defined as:
Ii − Ir
α=
,
(9)
Ii
where Ii is the incident intensity and Ir is the reflected intensity as illustrated in
Figure 3. (Hongisto 2011)
Figure 3: Towards the structure focuses sound intensity Ii , from the structure reflects
back sound intensity Ir . To the other side of the structure propagates sound intensity
It . Adopted from (Hongisto 2011).
The best location to place an absorbent (for example an acoustical panel) is
the place where the particle velocity of the sound wave is at maximum, because
absorption is based on the motion of the molecules in the absorbent. In normal
rooms the sound pressure at the wall is at the maximum and the particle velocity
at the minimum. The maximum point of the particle velocity is at the quarter a
wavelength from the wall. Thus, the absorption panel should be as thick as quarter
a wavelength of the desired frequency. At lower frequencies this could be impossible.
For example, when f = 50 Hz, λ/4 = 1.7 m, but already at 500 Hz the wavelength
is only 17 cm. All the higher frequencies will of course absorb to the panel and also
the lower frequencies to some extent. Tolerable absorption is achieved already when
the thickness of the absorption material is only one tenth of the wavelength (Figure
4). (Taina 2006)
2.2
Building acoustics
Building acoustics includes explanations of airborne sound insulation and step sound
insulations. In addition, sound emanating in buildings is considered.
8
Figure 4: A sound wave hitting to the wall, which contains additional absorption
material. Adopted from (Taina 2006).
2.2.1
Airborne sound insulation
Airborne sound insulation describes different construction components’, such as outdoor walls’, partition walls’, and floors’, or individual elements’, such as windows’,
doors’, and ventilators’ ability to insulate noise. The physical quantity of sound
insulation is expressed as:
Pi
R = 10 log
[dB],
(10)
Pt
where Pi is the incident sound power focusing on the investigated structure and Pt
is the transmitted sound power. (Lahti 1995)
The sound insulation could be measured in situ or in a specific laboratory. The in
situ measured values of sound insulation are usually considerably lower than values
measured in the laboratory. The main reason to that is the flanking transmission,
where the sound propagates through the measured component but also around it
for example via the frame of the building. The part of the penetrated sound and
the part of the flanking transmission is impossible to determine. The accuracy of
the measurement is also usually lower when performed in the field. (Lahti 1995)
Airborne sound insulation is measured in the laboratory which consists of two
adjacent rooms where the measured component is in between the rooms (Figure 5).
The first room is a transmission room and the second room is a receiver room. In
the transmission room a loudspeaker emits broadband or bandwidth-limited noise
and produces incident sound power Pi to the measured surface. In the receiver room
the investigated sound penetrable surface acts as a sound source and the penetrated
sound power is finally absorbed in the surfaces of the room. The incident sound
power could be calculated from the equation:
Pi =
p21 S [W],
4ρc
(11)
where p21 is a spatial average of the squared sound pressure in transmission room
(1), ρ is the density of the air, c is the velocity of the sound in the air, and S is
9
the area of the investigated component. The transmitted sound power equals to the
absorbed sound power in receiver room (2):
Pt =
p22 A [W],
4ρc
(12)
where A is the absorption area of the receiver room. From these equations we get
the basic formula for the sound insulation:
2 p1 S
.
(13)
R = 10 log
p22 A
When the spatial averages of the squared sound pressures are replaced with the
corresponding average sound pressure levels (L1 and L2 ) in rooms 1 and 2, the
Equation 13 reduces to:
S
R = L1 − L2 + 10 log
.
(14)
A
Now the absorption area of the receiver room could be determined by measuring the
reverberation time of the room (see Section 3.1) and the equation reduces further
to:
V
R = L1 − L2 + 10 log S − 10 log 0.161
,
(15)
T
where the Sabine’s formula (Equation 18) is used. (Lahti 1995; Hongisto 2011)
Figure 5: Sound insulation measurement laboratory. Adopted from (Lahti 1995).
Sound insulation depends on the frequency and is usually measured in five or
seven whole octave bands. The large number of measured values are the reason
why airborne sound insulation index Rw has been developed. It represents the
construction component’s ability to insulate sound with a single value and it is
10
based on international standard ISO 717-1: Acoustics. Rating of sound insulation
in buildings and of building elements. Part 1: Airborne sound insulation. The
airborne sound insulation index is determined by fitting a certain reference curve
(defined in ISO 717-1) to the measured sound insulation curve (Figure 6) and then
taking the value of the reference curve from 500 Hz point. The fitting is done by
moving the reference curve in 1 dB steps until the sum of the unwanted deviations
decreases below 32.0 dB. The unwanted deviations are the points where the values
of measured sound insulation go below the corresponding points at the reference
curve (illustrated with black vertical lines in Figure 6). The shape of the reference
curve is always the same, only the vertical position is changed in the procedure. If
the airborne sound insulation index is measured in the field, it is expressed as Rw .
(Hongisto 2011; ISO 717-1:1996 1996; Hirvonen 2007a)
Figure 6: The determination of the sound insulation index Rw . The dashed line is
the ISO 717-1 reference curve and it is placed to the highest possible position where
the sum of unwanted deviations is below 32.0 dB. The value of Rw is taken from the
reference curve at 500 Hz. An unwanted deviation happens when measured value is
below the reference curve (black vertical lines). Adopted from (Hongisto 2011).
The sound insulation of a thin slab, for example a wall panel, could be divided
into five regions in frequency domain (Figure 7). In the first part the frequency is
so low that no eigenmodes exist. In the second part exists the first eigenmode and
the sound insulation of the panel is weak because of the resonance. The third region
consists of modes and some forced oscillation occurs. Its sound insulation depends
mainly of the mass per area of the panel. In part four is located the threshold
frequency of the coincidence. In that frequency the velocity of the wave oscillating
in the panel equals to the velocity of the airborne sound wave and the airborne
sound wave couples to the panel and penetrates it perfectly. It means that the sound
11
insulation in that frequency region is very low. Above the threshold frequency of
coincidence the stiffness of the panel is dominating and only eigenmodes exist.
Figure 7: The behaviour of the sound insulation of a thin slab in different frequency
regions. Adopted from (Hongisto 2011).
A twofold wall structure is a good choice when a better sound insulation is
wanted. The twofold wall structure means that two individual panels are assembled
one after another, the way that an air gap is formed between the panels. The air
gap could contain absorption material and supporting studs as in partition walls,
but it could also be totally empty like windows usually are.
Normally, the different sides of the twofold wall structure are in mechanical connection with each other via metallic or wooden studs and rails. Then the structure
is called coupled structure. If the halves of the structure are completely isolated
from each other the structure is called uncoupled structure. This kind of structure
makes very high sound insulation values possible.
The sound insulation of the uncoupled structure improves when total mass is
increased, the thickness of the air gap is increased, and when the amount or absorption index of the absorption material in the air gap is increased. The same rules are
also true for coupled structures but in much smaller scale. The characteristics of the
coupling structures mainly affects to the sound insulation of the coupled structure.
12
For example, the influence of the amount of the absorption material is negligible if
the studs are wooden. The sound insulation of the coupled structure is increased
when the number of studs or rails decreases, the dynamical stiffness of the studs is
decreased (the flexibility of the studs is increased), and when the attaching of the
panels to the studs gets weaker (the number of screws is decreased or the tightness
of the screws is decreased). (Hongisto 2011; Hirvonen 2007a)
2.2.2
Step sound insulation
Step sounds are structure-borne noises which are produced by walking, dropping
objects to the floor, or moving furniture etc. When the structure experiences this
kind of hit it gets the surrounding air to vibrate and the hit could be perceived as
an airborne sound in the other side of the structure.
Unlike airborne sound insulation, step sound insulation is an absolute quantity
because it is determined by using a calibrated sound source, thus determining the
output power is unnecessary. The sound source is standardised step sound device,
which creates the step-like sounds by dropping 0.5 kg hammers to the floor from 40
mm height 10 times per second. The sound pressure level in the other space caused
by the step sound device is measured in desired frequency bands. Thus, the step
sound insulation of the measured structure is the better the lower the measured
sound pressure levels are. Usually the sound pressure levels are measured in a space
below the space where the step sound device is, but sometimes it is necessary to
measure the pressure levels above or next to the transmitting room.(Hongisto 2011;
ISO 140-7:1998 1998; Hirvonen 2007a)
The quantity used to describe the step sound insulation is normalized step sound
level:
A2
Ln = L2 + 10 log
[dB],
(16)
A0
where L2 is the measured equivalent sound pressure level in the receiver room, A2
is the absorption area of the receiver room, and A0 the reference absorption area
A0 = 10 m2 . The smaller the step sound level the better the step sound insulation.
The absorption area of the receiver room could be determined by measuring the
reverberation time of the room (see Section 3.1).
Like airborne sound insulation the step sound insulation could also be expressed
with one-number quantity, step sound level index Ln,w . The method to determine
the index is similar as with the airborne sound insulation. The reference curve is
again moved to the position where the sum of the unwanted deviations is 32 dB at
maximum. Then the value of Ln,w is read from the reference curve at 500 Hz point.
This time the unwanted deviation occurs when the measured sound pressure level
is above the reference curve. (ISO 717-2:1996 1996; Hirvonen 2007a)
The real step sounds and the sounds created by the step sound device do not
correspond very well, thus the spectral weighting factor CI is created. In standard
ISO 717-2: Acoustics. Rating of sound insulation in buildings and of building elements. Part 2: Impact sound insulation CI is defined in frequency bands 100 Hz 2500 Hz and CI,50−2500 in frequency bands 50 Hz - 2500 Hz. CI,50−2500 is calculated
13
from measured and normalized sound pressure levels and step sound level index as
follows:
2500
CI,50−2500 = 10 log
10Ln,i /10 − 15 − Ln,w [dB],
(17)
i=50
where Ln,i are measured step sound levels in different frequency bands, and Ln,w
is the step sound level index. The sum of the step sound level index and spectral
weighting factor Ln,w + CI,50−2500 is discovered to be more equivalent to subjective experience of the step sound insulation than the step sound level index alone.
(Hongisto 2011; Hirvonen 2007a)
2.2.3
Sound emanating in buildings
The measured sound insulation of a structure between two rooms in a building
is practically always lower than the corresponding value measured in the laboratory. The reason to this is that sound emanates to the other room straight through
the structure dividing the rooms but also along the other structures and junctions
around the room (Figure 8). The sound emanates in frame of the building as a
structure-borne sound. The sound could also emanate through the pipes, wires, and
air conditioning pipes.
Figure 8: The different paths of emanating sound through only one junction. (Hirvonen 2007a)
Flanking transmission means all the transmission paths of the sound, which
do not go directly through the structure dividing the spaces. Also, the holes or
cracks in the structure weakens the sound insulation, but these are either design or
construction mistakes and could usually be treated afterwards.
Structure-borne sound attenuates mainly in the junctions of the different structures. The attenuation depends on the mass of the structures and the stiffness of the
junctions. Additionally, the structure-borne sound could be attenuated by creating
joints to the structures, where the structure is cut with for example air or mineral
wool layer. (Hongisto 2011; Hirvonen 2007a)
14
3
Room acoustic criteria
Room acoustic criteria are objective quantities which could be measured to determine the acoustical conditions of the space. Each criterion represents a different
acoustical property of the measured space. Multiple criteria are used together to
determine the acoustics of the space, as none of the criteria alone could describe the
acoustics diverse and accurate enough.
3.1
Reverberation time (T60 )
When a sound source emits a sound in a room, creating a certain sound field and
sound pressure level in the room, and is suddenly stopped, sound pressure level
starts to decrease. Within a certain amount of time the sound pressure level has
decreased 60 dB (to one millionth) from the original level. This time is called a
reverberation time, T60 . The above described definition of the the reverberation
time is also illustrated in Figure 9. The reverberation time is a property of the
envelope of the impulse response of the acoustic system consisting of a sound source
and a room. (Lahti 1995) The reverberation time is probably the most commonly
measured acoustical parameter when analysing acoustical behaviour of the room.
Figure 9: Definition of the reverberation time T60 . (Hongisto 2011)
W. C. Sabine has developed the equation which describes the relation of the
reverberation time, the volume and the absorption area of the room:
T60 = 0.161
V
[s],
A
(18)
where T60 is the reverberation time, V is a volume of the room and A is an absorption
area of the room, which is defined with equation:
A=
n
i=1
αi Si [m2 ],
(19)
15
where αi are absorption ratios of the materials in the room and Si are areas of the
corresponding materials. Ideally the Equation 18 is accurate in the diffuse field only.
In practice, rooms which are not too large or complicated and contain only small
amount of absorptive materials can be considered as diffuse. (Lahti 1995)
The impulse response of the ideal room is decaying exponentially and T60 could
be determined from the envelope of the room’s impulse response. Often the signalto-noise ratio is not high enough to obtain the whole 60 dB drop on the decay
curve. Therefore the value of T60 is normally achieved by measuring the decay time
between -5 dB and -35 dB and multiplying it by two or between -5 dB and -25
dB and multiplying it by three. To distinguish the different calculation methods,
T60 is sometimes called T30 or T20 correspondingly. These methods are illustrated
in Figure 10. The reverberation time can be calculated from the total impulse
response of the room or for example octave band filtered responses. In the first case
the reverberation time represents the average decay time of the room and in the
latter case it represents the decay time on desired frequency band. Reverberation
times in different frequency bands could vary significantly. (Lahti 1995)
Figure 10: Definitions of different methods to determine the reverberation time.
Adopted from (Hirvonen 2007a).
A few different methods exists to select the points (for example -5 dB and -35 dB)
from the decay curve. The simplest way is to just pick those two individual points
from the decay curve and calculate the time elapsed between them. However, that
method depends largely on the shape of the curve and varies significantly between
different measurements due to the noisiness of the signal. Second method is to fit
a line to the decay curve using for example the least squares method and to pick
16
the corresponding points from that line (Figure 11). Now the line represents more
average value of the curve than two individual points. The third and the most
accurate method is to use backwards integration, called Schroeder-integration:
⎛ ∞
⎞
h2 (τ )dτ
⎜t
⎟
⎟ [dB],
L(t) = 10 log ⎜
(20)
∞
⎝
⎠
2
h (τ )dτ
0
where h is a measured impulse response. Schroeder-integration is based on the
relationship between the ensemble average of all possible individual decay curves
and the corresponding impulse response:
y 2 (t)e =
∞
|h(τ )|2 dτ =
t
∞
0
|h(τ )|2 dτ −
t
|h(τ )|2 dτ,
(21)
0
where y 2 (t)e is the time average of the squared decay curves and h(τ ) is the impulse
response of the system. (Schroeder 1965)
Figure 11: Determining the reverberation time with ordinary root-mean-square detector and fitted line (lower curve) and determining the reverberation time with
Schroeder-integration -method (upper curve). (Lahti 1995)
In Schroeder-integration the impulse response is integrated backwards from 5 dB
above the noise floor of the decay curve to the beginning of the direct sound (Figure
11). The obtained curve is much smoother that the original decay curve and a line
could again be fitted to the curve using the least squares method and then the two
points could be picked from the line. (Lahti 1995; Peltonen 2000)
3.2
Early decay time (EDT)
Early decay time (EDT) is a similar quantity as T60 and it is determined with
the same methods from the decay curve. The difference between EDT and T60
17
is the evaluation interval. EDT is determined on the decay curve from 0 dB to
-10 dB and then multiplied by six (Figure 10). (Jordan 1970) In ideal exponential
decay -case EDT equals to T60 . Measured values of EDT have a larger variance
than corresponding values of T60 because the first reflections can differ significantly
depending on measurement position. Also, the short integration period makes EDT
more vulnerable to errors and accurate determination of the direct sound more
important. (Peltonen 2000)
EDT considers the early part of the reverberation, including the first distinct
reflections, which have more subjective importance to perceived reverberance than
the late part (Barron 1995). If the value of EDT is high, it indicates much reverberation and low clarity. Correspondingly, if the value of EDT is low it indicates
more clarity and less reverberation. EDT is also used when calculating the speech
transmission index (Section 3.3).
3.3
Speech transmission index (STI, RASTI and STIPA)
Speech transmission index (STI) is an objective measure of a speech intelligibility
between a speaker and a listener. The distinctness and thus the intelligibility of the
speech in a room depends on the ratio of the background noise and the level of the
speech, reverberation time, the distance between the speaker and the listener, and
the directivity and the orientation of the speaker. (Hongisto 2011)
STI is a number which represents the quality of the speech transmission when
considering syllabic distinctness. The value of the STI can vary between 0.00 and
1.00. The higher the value the better the syllabic distinctness is. Value of 1.00
represents the perfect speech transmission channel between the speaker and the
listener and value of 0.00 respectively represents the worst possible case, where not a
single syllable from the speak is possible to understand. (Hongisto 2011; Karjalainen
2008)
It has been shown that to the intelligibility of the speech mainly affects the reverberation time and the background noise of the room. From this starting point the
concept of the modulation transfer function (MTF) has been developed. The MTF is
used to characterize the sound transmission system by sending a test signal through
the speaker to listener -system and inspecting the reduction of the modulation index of the intensity envelope of the travelled signal relative to the corresponding
index of the original signal. The test signals used with modulation transfer function
are basically octave band filtered sine wave modulated noise. Test signals are used
in seven octave bands (125, 250, 500, 1000, 2000, 4000, and 8000 Hz) and also 14
different modulation frequencies are used (0.63, 0.80, 1.00, 1.25, 1.60, 2.00, 2,50,
3.15, 4.00, 5.00, 6.30, 8.00, 10.00, and 12.50 Hz). These octave bands represent the
frequency band of the normal speech and the modulation frequencies represent the
temporal variations of the normal speech. (Houtgast and Steeneken 1985) The value
of the modulation transfer function could be calculated from the equation:
m(F, f ) = 1
·
1 + [T (f )2πF/13.8]2 1 +
1
10[−S/N (f )]/10
,
(22)
18
where T (f ) is the early decay time (EDT, see Section 3.2) in a certain frequency
band f , F is the modulation frequency, and S/N is the signal-to-noise ratio (S/N =
Ls − LN , where Ls is the level of the signal and LN is the level of the noise) of the
room in a certain frequency band. It could be seen that the Equation 22 consists of
two parts. The first part represents the effect of the reverberation time and the latter
part represents the effect of the background noise to the MTF. From Equation 22 is
possible to calculate 98 different m-values (one for each octave band and modulation
frequency combination).
To obtain the STI-value, the m-values calculated from the Equation 22 should
be converted to apparent signal-to-noise ratios (S/N ) with equation:
m
[dB].
(23)
S/N = 10 log
1−m
If S/N > 15 dB, S/N = 15 dB. Correspondingly if S/N < −15 dB, S/N =
−15 dB. After this the STI-value could be calculated from the equation:
7
14
1 1
ST I =
wj
S/N (Fi , fj )
,
(24)
15 +
30
14
j=1
i=1
where the weight factors wj of the octave bands are 0.13, 0.14, 0.11, 0.12, 0.19,
0.17, and 0.14. The latter part of the equation is simply the weighted mean of the
apparent signal-to-noise ratios. The STI’s dependencies on the background noise
and the reverberation time are illustrated in Figures 12 and 13. STI-values could be
classified to five different classes, whose names verbally describe the quality of the
speech intelligibility. The classes are presented in Table 1. (Hongisto 2011)
Table 1: Speech intelligibility quality based on STI-value. (IEC 60268-16:1988 1988)
STI value
0.00 - 0.30
0.30 - 0.45
0.45 - 0.60
0.60 - 0.75
0.75 - 1.00
Quality
bad
poor
fair
good
excellent
RASTI (Rapid speech transmission index) is a reduced version of STI. RASTI
was developed for more convenient measurement procedure, as measuring STI was
fairly time consuming because all the 14 modulation frequencies should be determined in all the 7 octave bands. When using RASTI, only two octave bands (500
Hz and 2000 Hz) and nine modulation frequencies (1.00 Hz, 2.00 Hz, 4.00 Hz, and
8.00 Hz in 500 Hz band and 0.70 Hz, 1.40 Hz, 2.80 Hz, 5.60 Hz, and 11.2 Hz in 2000
Hz band) are used. RASTI substantially reduced the measurement time of the STI.
19
Figure 12: STI’s dependency of the signal-to-noise ratio of the speech LSN , assuming
that the space is anechoic and the signal-to-noise ratio is frequency independent.
(Hirvonen 2007a)
Figure 13: STI’s dependency of the early decay time and of the signal-to-noise ratio
of the speech LSN , assuming both frequency independent. (Hirvonen 2007a)
However, RASTI has proven to be rather unreliable when comparing to STI. (Mapp
2005)
STIPA (Speech transmission index for public address) is also a reduced version
of STI. Originally STIPA was developed for testing the quality of the public address
systems, but it has later proven to be quite an accurate version of STI. In Figure
14 is compared the calculated values of the STI and STIPA values. From the figure
could be seen that the correspondence between STI and STIPA is nearly perfect.
Standard IEC 60268-16 describes a STIPA-method which uses six octave bands and
12 modulation frequencies. The 125 Hz and 250 Hz octave bands are combined and
20
1.60 Hz and 8.00 Hz modulation frequencies are omitted. The largest difference to
STI is that only two modulation frequencies is used for each octave band. In Table 2
is a comparison of the usage of the octave bands and modulation frequencies in STI,
RASTI, and STIPA. When using STIPA a dedicated test signal is used. The test
signal consists of octave band filtered amplitude modulated noise. According to IEC
60268-16 the test signal should be played from the source which directivity is as close
as possible to a real human head. IEC 60268-16 recommends using a loudspeaker
which cone diameter is at most 100 mm and refers to the artificial mouth described
in ITU-T Recommendation P.51 (ITU-T P.51 1996). However, a new ISO-standard
considering open plan offices produces instructions for using omnidirectional sound
source instead, because the direction of a talking person at a workstation is not
constant and the orientation of the source affects the result quite little. (ISO 33823:2012 2012; Hongisto et al. 2007) By recording the test signal at desired positions
the STIPA could be calculated with the method described above (equations 22, 23,
and 24).
Figure 14: STI values calculated using STIPA excitation signal compared to STI
values calculated using the full 98 combinations of modulated noise. (Steeneken
et al. 2001)
Distraction distance (rD ) is a measure related closely to STI. It describes how
many meters from the speaker the distraction, caused by the speech, is significant.
The distraction distance is obtained from the STI versus distance -curve, at the
point where the value of STI falls below 0.50. (ISO 3382-3:2012 2012)
21
Table 2: Comparison of the usage of the frequency bands and modulation frequencies
of the different STI measuring methods (STI, RASTI and STIPA).
STI
Modulation frequency (Hz)
Octave
band
125 Hz
250 Hz
500 Hz
1000 Hz
2000 Hz
4000 Hz
8000 Hz
0.63
•
•
•
•
•
•
•
0.80
•
•
•
•
•
•
•
1.00
•
•
•
•
•
•
•
1.25
•
•
•
•
•
•
•
1.60
•
•
•
•
•
•
•
2.50
•
•
•
•
•
•
•
3.15
•
•
•
•
•
•
•
4.00
•
•
•
•
•
•
•
5.00
•
•
•
•
•
•
•
6.30
•
•
•
•
•
•
•
8.00
•
•
•
•
•
•
•
10.00
•
•
•
•
•
•
•
12.50
•
•
•
•
•
•
•
6.30
8.00
10.00
12.50
RASTI
Modulation frequency (Hz)
Octave
band
0.63
125 Hz
250 Hz
500 Hz
1000 Hz
2000 Hz
4000 Hz
8000 Hz
0.80
1.00
1.25
1.60
•
2.00
2.50
3.15
•
•
4.00
5.00
•
•
•
•
•
•
STIPA
Modulation frequency (Hz)
Octave
band
0.63
125/250 Hz
500 Hz
1000 Hz
2000 Hz
4000 Hz
8000 Hz
3.4
2.00
•
•
•
•
•
•
•
0.80
•
•
1.00
•
1.25
•
1.60
2.00
2.50
3.15
4.00
•
•
•
•
5.00
•
6.30
•
8.00
10.00
12.50
•
•
Rate of spatial decay of sound pressure level per
distance doubling (DL2 )
Spatial decay rate of sound pressure level per distance doubling (DL2 ) is a measure
which represents the attenuation of the sound when distance from the source is
increasing:
(25)
DL2 = Lp (r1 ) − Lp (r2 ) [dB],
where Lp (r1 ) and Lp (r2 ) are sound pressure levels in certain positions and r2 = 2r1 .
DL2 could also be achieved by determining the slope of the spatial sound distribution
curve. Curve of spatial sound distribution of the sound pressure level is determined
by measuring sound pressure levels of the A-weighted pink noise in different distances
from the source and plotting the results to a sound pressure level versus logarithmic
22
distance scale (Figure 15). When using logarithmic distance scale the curve should
be linear, as the decay of the sound pressure is supposed to be exponential. The Aweighted pink noise is used because its frequency spectrum is similar to the spectrum
of normal speech. The accurate value of the slope of the spatial sound distribution
curve should be calculated by fitting a line to the measurement points using the
least squares method.
Figure 15: The definition of the rate of spatial decay per distance doubling, DL2 .
Adopted from (Hongisto 2011).
In a free space (for example outdoors or in the anechoic chamber) DL2 = 6 dB,
thus it equals to free space attenuation. In more complex spaces (for example in open
plan offices, classrooms, industrial halls) DL2 is usually something else. Normally,
the spatial sound distribution curve could be divided into two parts:
• Near region, where DL2 is at most 6 dB and is usually smaller. The reasons to
this are the reflections from the floor and the nearest furniture increasing the
sound pressure levels. Near region covers usually the distance up to 4 meters
or to the nearest obstacle affecting the propagation of sound.
• Far region, which is outside of the near region. In far region sound pressure levels could change strongly depending on the obstacles in the room, the amount
of absorption and the position of the measurement point.
In normal rooms the values of DL2 could be between 0 dB and 15 dB. DL2 could
also be predicted with room acoustical computer models or with regression equation
23
models. The reliable modeling of the DL2 requires that the absorption indices of
the room surfaces are known. (ISO 3382-3:2012 2012; Hongisto 2011)
3.5
Strength (G)
Sound strength (G) is a room acoustical parameter, which describes the perceived
”loudness” in the measured space (Hak et al. 2010). It is defined as the sound
pressure level caused by an omnidirectional sound source on the stage, measured at
a listener position in the hall, with reference to the sound pressure level at 10 m
distance from the same sound source in a free field (ISO 3382-1:2009 2009). Basically
strength is a similar parameter as normal sound pressure level, but with a different
reference level (Beranek 2011). With stationary signal G is expressed as:
G = Lp(listener) − Lp(dir,10m) [dB],
(26)
where Lp(listener) is the sound pressure level at a listener position and Lp(dir,10m) is the
sound pressure level measured at 10 m from the same sound source in a free field.
Lp(dir,10m) could be achieved by knowing the sound power level Lw of the source:
Lp(dir,10m) = Lw − 31 dB.
(27)
Measuring the sound power level of the used sound source requires access to
either a reverberation room or an anechoic room. This makes the measuring often
more difficult, thus the value of G is possible to achieve with more convenient manner
by using only measured impulse responses:
G = LpE(listener) − LpE(dir,10m) [dB],
(28)
where
⎛ ∞
LpE(listener)
⎜0
= 10 log ⎜
⎝
p(listener) (t) dt
⎛ ∞
LpE(dir,10m)
⎜0
= 10 log ⎜
⎝
2
p20
2
⎞
⎟
⎟ [dB],
⎠
p(dir,10m) (t) dt
p20
(29)
⎞
⎟
⎟ [dB],
⎠
(30)
where LpE(listener) is the sound exposure level of p(listener) , LpE(dir,10m) is the sound
exposure level of the p(dir,10m) , p(listener) is the instantaneous sound pressure of the
impulse response from the listener position, p(dir,10m) is the instantaneous sound
pressure of the impulse response from 10 m distance in a free field, and p0 = 20 μPa
(ISO 3382-1:2009 2009). Still, as LpE(dir,10m) could be difficult to measure it could
be determined by measuring the impulse response in 1 m distance and scaling it
appropriately:
24
LpE(dir,10m) = LpE(dir,1m) + 20 log
1
10
dB,
(31)
where LpE(dir,1m) is the sound exposure level in 1 meter distance (ISO 3382-1:2009
2009). Now we can write:
⎛ ∞
2
⎞
p
(t) dt
⎟
⎜ 0 (listener)
⎟ + 20 dB.
⎜
G = 10 log ⎝ ∞
⎠
p(dir,1m) 2 (t)
(32)
0
Usually G is expressed as an average of the mid-frequency octave bands (1000
Hz and 500 Hz) and is then written as Gmid . The change of G along the distance
from the source illustrates the diffuseness of the sound field in the room.
The expected value of strength in ideal conditions is:
T
Gexp = 10 log
+ 45 dB,
(33)
V
where T is the reverberation time and V is the volume of the room (Rossing 2007).
3.6
Clarity (C50 )
Clarity, i.e. early-to-late index, marked as C50 or C80 , is the ratio between early
received sound energy (first 50 ms or 80 ms of the impulse response) and the rest of
the sound energy (time after the 50 ms or 80 ms):
te
Cte = 10 log 0∞
p(t)2 dt
[dB],
(34)
p(t)2 dt
te
where p(t) is the instantaneous sound pressure of the impulse response measured at
the measurement point and te is the desired time window (50 ms or 80 ms) (ISO
3382-1:2009 2009). The 50 ms time value is considered to suite best for determining
the speech’s clarity and 80 ms value is more suitable for music. Because clarity
is a ratio of early and late energy, high values of it indicate the presence of the
direct sound and early reflections to be higher than the late reverberation. This
corresponds to subjectively perceived clarity of the sound. Low values of clarity
accordingly indicate an unclear and excessively reverberant sound. (Peltonen 2000)
Under ideal conditions the expected value of clarity could be calculated:
Cexp = 10 log e(1.104/T ) − 1 [dB],
(35)
where T is the reverberation time (Rossing 2007).
25
3.7
Definition (D50 )
Definition (D50 or D80 ) is the ratio of early received sound energy (first 50 ms or 80
ms of the impulse response) and the total energy of the impulse response:
te
Dte = 10 log 0∞
0
p(t)2 dt
,
p(t)2
(36)
dt
where p(t) is the instantaneous sound pressure of the impulse response measured at
the measurement point and te is the desired time window (50 ms or 80 ms) (ISO
3382-1:2009 2009). The 50 ms time value is considered to suite best for determining
the definition of speech and 80 ms value is more suitable for music. Definition
represents the distinctness, clarity and intelligibility of speech or music (Peltonen
2000). Definition is related to the clarity by the following equation (ISO 3382-1:2009
2009):
Dt e
Cte = 10 log
[dB],
(37)
1 − Dte
and the largest difference between clarity and definition is that the definition is
expressed as a percentage, whereas the clarity is expressed in dB.
Under ideal conditions the expected value of definition is (Peltonen 2000):
Dexp = 10 log ekte .
(38)
3.8
Center time (Ts )
Center time (Ts ) is the time of the center of gravity of the squared impulse response:
∞
t p(t)2 dt
Ts = 0∞
0
[s],
(39)
p(t)2 dt
where t is the time instant and p(t) is the instantaneous sound pressure of the
impulse response. Center time avoids the discrete division of the impulse response
into early and late energy parts (ISO 3382-1:2009 2009). A low value of center time
indicates that most of the sound energy arrives early and high value corresponds to
situation where energy arrives late after the direct sound. Low values of Ts indicate
sound to be clear, while high values indicate a reverberant sound. (Rossing 2007;
Peltonen 2000)
In diffuse conditions the expected value of the center time is:
Ts,exp =
T
[s],
13.8
where T is the reverberation time (Rossing 2007).
(40)
26
4
Acoustics of public spaces
This chapter consists of review of the acoustic classification of buildings and descriptions of typical sound environments, acoustical requirements and recommendations
of classroom, healthcare space, and open plan office. Also, solutions for enhancing
the sound environments of the before mentioned spaces are provided.
4.1
General sound environment and requirements
In Finnish standard SFS 5907: Acoustic classification of spaces in buildings different
building types have been divided into four classes, A, B, C, and D, based on their
acoustical condition. Class A is the most demanding to achieve and class D is the
lightest class. Class C corresponds to the minimum requirements of new buildings
for those parts which are defined in Finnish building regulations, part C1-1998. In
room acoustics class C corresponds to the typical acoustical conditions in buildings.
Class D represents acoustical conditions of old buildings containing less satisfactory
sound environment. The classification includes determination of airborne sound
insulation, step sound insulation, the reverberation time, and speech transmission
index values. The recommendations in following sections are values of acoustical
class A or B. (SFS 5907:2006 2006)
Buildings and spaces could also be divided into three indoor air classes, S1, S2,
and S3, according to indoor air classification of Finnish Indoor Air Association.
Class S3 corresponds to Finnish land use and building law and health protection
law. Class S1 is the most satisfactory class. Indoor air classification includes desired
values for temperature, air quality, lighting, and acoustics. (Indoor Air Association
2008)
4.1.1
Classroom
A classroom in this context refers to an elementary or an upper comprehensive
school classroom. These kinds of classrooms are usually arranged in the way that
the teacher is mainly talking in the front of the class and pupils are sitting either in
rows or in small groups.
The starting point for an acoustical design in classrooms is a demand for a good
speech intelligibility and a low background noise. Noise levels has been shown to
correlate with the reverberation time, thus decreasing the reverberation time is also
desirable (Canning and James 2012). Noise has been shown to be the most distracting factor concerning the speech intelligibility in classrooms (Smirnowa and
Ossowski 2005; Kristiansen et al. 2011; Bj¨orkholts 1988). Attenuation of noise and
improvement of the speech intelligibility sets a contradiction for the acoustical treatment of the room. To attenuate noise an adequate amount of absorbing material
should be used. However, if too large amount of absorbing material is installed the
speech transmission index will start to decrease especially in the rear parts of the
room due to decreasing speech level (Nilsson 2010; Smirnowa and Ossowski 2005).
Standard SFS 5907 (SFS 5907:2006 2006) sets target values for the speech transmission index and for the reverberation time in classrooms, which are 0.80 and 0.50
27
- 0.60 s correspondingly. To achieve these targets at least 30% of the maximum area
of ceiling and walls should be covered with absorbing material, which is preferably
installed on the ceiling and on the back wall of the room (Figure 16) (Smirnowa and
Ossowski 2005). However, Canning and James suggest as short reverberation time as
possible in all octave bands (Canning and James 2012) and that requires basically at
least the whole ceiling to be covered with acoustic panels. In addition, to have good
STI-values throughout the classroom, the middle part of the ceiling could be covered
with more reflective material to allow reflections from the teacher to the rear part
of the room, especially in larger rooms (length > 8 m) (Hirvonen 2007b). Low frequency absorbers has also shown to enhance the learning environment by improving
the low frequency clarity. For example, the fundamental frequency of a male’s voice
is normally slightly over 100 Hz and normal acoustic panels absorb rather poorly
in that frequency region. (Canning and James 2012) The low frequency treatment
could be realized with thick low frequency absorbing panels placed above the normal
acoustic ceiling around the edges of the room (Figure 16) or with different kinds of
bass traps (see Section 2.1.3).
Teacher’s speaking conditions should also be taken into account. To offer a
support to the voice of the teacher, a reflecting surface should be placed above
the teacher (fig. 16) (Sala and Viljanen 1995). Also, when the value of strength
parameter of the room is high enough, the room amplifies the speech of the teacher
(Brunskog et al. 2009).
To determine acoustical conditions of the classroom the reverberation time,
strength, clarity, speech transmission index, and background noise level should be
measured.
Figure 16: Optimal acoustical treatment of a classroom. Adopted from (Ecophon
Saint-Gobain 2006).
28
4.1.2
Healthcare space
A good sound environment in hospital wards is undeniably important. Excessive
noise could affect negatively to the quality of sleep and the overall health of patients
and the stress level of the personnel (Salandin et al. 2011; Busch-Vishniac et al.
2005; MacLeod et al. 2007; Hagerman et al. 2005). The lack of privacy could be
also a problem. One of the most important matters concerning patient rooms is to
offer enough tranquillity and privacy to the healing patients. In addition, the speech
intelligibility is important as most of the data and knowledge transmission between
people in hospitals is performed orally (MacLeod et al. 2007).
In healthcare spaces exists a large amount of different noise sources. The most
typical noise sources are personnel tasks, operating noise of the devices, portable
carts, HPAC, and different device alarms (Salandin et al. 2011). Background noise
level depends also on the type of the space. For example in restrooms the background
noise level is generally lower than in intensive care units.
Hospital environment requirements set challenges to the acoustical treatment.
The acoustic materials installed in the healthcare space should be durable, cleanable,
fire safe, in many cases moisture resistant, have a low particle emission, and have
a high absorption rate. These are usually the reasons why ceilings and walls in
hospitals are hard.
World Health Organization (WHO) recommends the maximum equivalent background noise level to be Leqmax = 30 dB in patient’s sickrooms and as low as
possible in medical treatment rooms (WHO 1999). Finnish standard SFS 5907:2006
recommends corresponding values to be Leqmax = 29 dB in patient’s rooms and
Leqmax = 38 dB in treatment rooms (SFS 5907:2006 2006). Recommendations for
reverberation times are T60 = 0.6 s in patient’s rooms and T60 = 0.4 s in resting or
treatment rooms (SFS 5907:2006 2006). It is quite general that background noise
levels in hospital wards exceed the recommendations of WHO (Ryherd et al. 2008;
Salandin et al. 2011; Busch-Vishniac et al. 2005).
To determine the acoustical conditions in healthcare spaces at least the reverberation time, strength, clarity, and speech transmission index should be measured.
4.1.3
Open plan office
Open plan office is an office which contains multiple workstations separated only
with screens or with nothing. The lack of actual walls between individual workstations sets certain problems in acoustics. The occupants are all the time affected by
activities surrounding them. Poor acoustic conditions can cause distraction, loss of
concentration, and a lack of speech privacy.
Noise has shown to be the largest problem in open plan offices and the most
distracting individual noise factor is speech. Especially in cognitively demanding
tasks other people’s speech could be very disturbing. The loudness of the speech
is not considered as harmful as the distinctness of the speech. This is the reason
why the acoustical planning of open plan offices generally aims to low values of STI
and high values of DL2 . A certain contradiction still exists, because STI between
occupants working together should be high, whereas STI between the occupant and
29
the rest office should be low. (Haapakangas et al. 2008; Ker¨anen et al. 2008; ISO
3382-3:2012 2012)
Figure 17: Different ways where the sound propagates from a workstation to another
in an open plan office. (Chu and Warnock 2002)
A solution to decent acoustical conditions in open plan offices is sound absorbing acoustic ceiling, sound absorbing walls, high enough sound absorbing screens
between the workstations, and in some cases the use of a masking sound in an appropriate level could be considered. Screens between individual workstations should
be sound absorbing and at least 170 cm high when performing cognitively demanding
tasks (Ker¨anen et al. 2012). The ceiling and the screen absorptions are also important because the sound propagates from workstation to another over the screens by
diffracting and by reflecting from the ceiling (Figure 17).
The masking sound could be either natural (for example HPAC-system’s sound)
or artificial (masking sound system). HPAC-system’s sound pressure level is usually
too low in Finnish offices because Finnish building regulations recommends sound
pressure level for HPAC-systems in offices to be only 33 dB (Hirvonen 2008). The
masking sound system consists of a large number of loudspeakers installed on the
ceiling and a central unit producing the sound. The sound pressure level of the
masking sound should normally be 40 dB - 45 dB and its spectrum should correspond to the normal speech spectrum (Figure 18) (Hirvonen 2008). An appropriate
masking sound reduces the value of STI significantly, thus it improves the speech
privacy (Ker¨anen et al. 2008).
According to the new open plan office standard ISO 3382-3:2012: Acoustics Measurement of room acoustic parameters - Part 3: Open plan offices, to determine
the acoustical conditions of a certain office at least STI, DL2 , and rd (see Section
3) should be measured. The reverberation time should also be measured but it
is questionable whether it provides any relevant information in the case of open
plan office. Example target values to measured quantities for good conditions are
DL2 ≥ 7 dB and rd ≤ 5 m according to ISO 3382-3:2012.
30
Figure 18: The spectrum of speech sound (1 m from the source) and the masking
sound spectrum. (Ker¨anen et al. 2008)
4.2
Acoustical solutions
Acoustics of a room could be improved by using different kinds of absorbing materials. The most common way of using absorbing materials is acoustic ceiling consisting
of acoustic panels. Wall- and other absorbers could also be used to further improve
the room absorption.
Acoustic materials could be divided into five absorption classes, A, B, C, D, and
E, according to standard EN 11654: Sound-absorbing materials for use in buildings
- Evaluation of acoustic absorption. Class A represents the highest absorption and
class E the lowest. The requirements of absorption classes are presented in Figure
19. (Hirvonen 2007a)
4.2.1
Acoustic panels and resonators
To adjust the acoustic conditions in a room different kinds of acoustic panels or
resonators could be used. Different solutions are manufactured either from fibrous-,
perforated-, or solid panel-type material. Special low frequency absorbers, called
bass traps, could be based on any of foregoing absorber types.
Fibrous absorbers
Fibrous absorbers are normally made of high absorptive porous materials, such as
mineral wool which includes glass wool, rock wool, and slag wool. The principles of
sound absorption are presented in Section 2.1.3. Generally, fibrous absorptive panels
absorb higher frequencies better than lower. Lower frequencies require thicker panel.
Thicker panels absorb all frequencies better, because the sound wave has a longer
31
Figure 19: EN 11654 classification for absorption materials. The example material
(marked with circles) achieves class B, because the sum of the deviations of the
measurement results under the reference curve is smaller than 0.10. Adopted from
(Hongisto 2011).
path to travel inside the material. Acoustic panels made of fibrous materials are
often covered with some acoustically transparent material, such as thin fabric, to
achieve more aesthetic appearance and to prevent particle emission. (Rossing et al.
2002)
Acoustic panels could be mounted directly on the ceiling or on the wall. Other
possibility is to build suspended ceiling where an air space is left between the panels
and the reflecting surface behind. The particle velocity of the sound wave is zero
at the reflecting surface, thus moving the panel away from the surface allows the
particle velocity and thus the absorption to be greater. Suspended ceiling improves
the absorption especially at lower frequencies and the same method could also be
used when mounting panels to the walls. (Rossing et al. 2002; Rossing 2007)
Perforated absorbers
In addition to fibrous panels, perforated panels such as perforated gypsum or metal
boards are used. The small holes in the panel form small Helmholtz resonators,
which absorb the sound at their resonance frequency. The frequency range of effective absorption could be altered by changing the thickness of the panel, the thickness
of the air gap behind the panel, and the size and placement of the holes in the panel.
Perforated absorbers could also be backed with fibrous material to improve the total
absorption and they are installed in the same manner as the fibrous panels. (Rossing
et al. 2002)
32
Panel absorbers
Panel absorber consists of a cavity sealed with a thin rigid panel or diaphragm
and possible absorbing material inside the cavity. The thin panel starts to vibrate
and resonate along the sound wave and using the sound energy in internal friction.
This kind of absorber operated best at lower frequencies. The frequency range of
the panel absorber could be tuned with the panel mass and with the size of the
cavity. The possible absorbing material inside the cavity enhances the absorption of
the absorber. The difference between the panel absorber and the perforated panel
absorber is illustrated in Figure 20. (Rossing et al. 2002)
Figure 20: (a) Panel absorber placed away from a reflecting wall. (b) Perforated
panel absorber backed by porous material. (Rossing et al. 2002)
Bass traps
Low frequency absorbers, so called bass traps, could be either Helmholtz resonators,
cavity resonators as panel absorbers or absorption panels made of rigid and thick
glass wool or similar porous material. Helmholtz resonators work in a fairly narrow
frequency band, whereas panel absorbers filled with absorption material, like glass
wool, operate in a wider range. Bass traps based on thick porous material have the
widest frequency range and the absorption could be improved using a membrane
with the porous material. Bass traps are usually used to treat the room in the
frequencies below 300 Hz and they are normally placed in the corners of the room
where all the room modes have their maximum, thus improving the absorption.
(Winer 2004; Rossing et al. 2002)
33
4.2.2
Other solutions
Some acoustical treatment could be realized also with other elements than actual
absorption panels or absorbers. Curtains are for example very common in normal
rooms regardless of the purpose of the room. Normal curtains are too light to have
a noticeable absorption, thus to achieve a better absorption thicker and heavier
curtains should be used. Folded cotton curtain, which has a mass of 330 g/m2 ,
absorbs mainly higher frequencies starting from about 1 kHz. However, the rate of
absorption is over 0.8 after 2 kHz (Hongisto 2011).
Carpet could also be used to increase the overall absorption in rooms. Carpets
absorb sound energy mainly in higher frequencies starting from about 1 kHz. Unlike
the curtains, the rate of absorption of carpet stays under the value of 0.5 in all
frequencies (Hongisto 2011). In addition, carpets attenuate the noise resulting from
furniture movements and walking.
Diffusers are used mainly in listening rooms or in home theatres to provide a
more diffuse sound field in the room. Diffusers can help to reduce flutter echoes.
The working principle of diffusers is explained in Section 2.1.2.
All normal furniture and people in the room also absorb sound energy. For
example in chairs the thicker the upholstering they contain the greater the absorption
is. Beds and soft couches work also as absorbers.
34
5
Measurement methods and measured spaces
This chapter consists of a description of used measurement devices and software.
The used measurement techniques are also explained. In addition, the measured
spaces, classroom, healthcare space, and open plan office, are described. Floor plans,
measurement positions, and descriptions of spaces’ acoustical conditions before and
after the acoustical treatment are provided.
5.1
Devices and programs
Measurements were carried out using an integrated impulse response method using logarithmic sine-sweep as a stimulus. Measurement setup in healthcare spaces
and in classroom consisted of Lenovo X200 laptop containing Room Eq Wizard 5.0
-room measurement program, Genelec 8030A active loudspeaker (Figure 21) and
Norsonic Nor140 precision sound measurement device (Figure 21), which contained
Nor1209 pre-amplifier and Nor1225 microphone capsule. In open plan office measurements were carried out with otherwise the same equipment but the loudspeaker
was omnidirectional Norsonic Nor270 (Figure 22) and Norsonic Power Amplifier
Nor280 (Figure 22) was also used. Norsonic sound level measurement device was
used as a microphone in impulse response measurements and it was calibrated before each measurement with class 1 Norsonic Nor1251 calibrator (Figure 21). Laptop
contained Conexant 20561 SmartAudio HD soundcard, which influence to measurements was minimized by calibrating the measurement software with the soundcard’s
frequency response. STIPA and all sound pressure levels were measured directly with
Norsonic Nor140 sound level meter. Reverberation times were calculated from measured impulse responses by Room Eq Wizard and strength values were calculated
from measured impulse responses with Microsoft Excel. Spatial decay rates were
also calculated with Microsoft Excel.
5.2
Measurement techniques
Impulse responses of the rooms in healthcare spaces and in classroom were measured placing the sound source on the floor to the corner of the room the way that
the emitted sound spreads throughout the room by reflecting from the corner. In
open plan office the omnidirectional sound source was placed 120 cm above the floor
to the place of the workers head. Impulse responses were measured in 4 to 8 different positions in the room with the microphone and then averaged to obtain a
spatial average of the room’s impulse response. Two measurements were conducted
and averaged in each measurement position. The total reverberation time (T60 ),
reverberation times in octave bands (T60 i ), strength (G), and clarity (C50 ) were
calculated from the obtained impulse response. In impulse response measurements
the minimum distance between the source and the microphone is:
V
dmin = 2
,
(41)
cT
35
Figure 21: Measurement devices for the healthcare space and for the classroom.
From left: class 1 calibrator Norsonic Nor 1251, sound level meter Norsonic Nor140,
and loudspeaker Genelec 8030A.
where V is the volume of the room, c is the speed of sound and T is an estimation
of the expected reverberation time (ISO 3382-2:2008 2008).
STIPA was measured by placing the sound source to the place of a possible
talker in the room, playing the STIPA excitation signal trough it and measuring the
STIPA value in the place of the possible listener with Norsonic measurement device.
Three measurements were conducted and averaged in each measurement position to
obtain a reliable value.
Rate of spatial decay of sound pressure level per distance doubling (DL2 ) was
Figure 22: Measurement devices for the open plan office. From left: Lenovo X200
laptop, sound level meter Norsonic Nor140, Norsonic Power Amplifier Nor280, and
omnidirectional loudspeaker Norsonic Nor270.
36
measured by placing the sound source to the place of a possible talker in the room,
playing pink noise through it and measuring the A-weighted equivalent sound pressure levels in different distances from the source. Ten second integration time was
used and at least two measurements were made and averaged in each measurement
position. Background noise levels were measured in the same manner as DL2 measurements.
5.3
5.3.1
Measured spaces
Classroom
Measured classroom was a small ordinary rectangular classroom in the Piikki¨o comprehensive school. The floor plan of the room is illustrated in Figure 23.
Before the acoustical treatment the room contained a large blackboard (4.00 m
× 1.23 m) on the back wall, a noticeboard (3.00 m × 1.23 m) on the side wall, large
windows (4.52 m × 1.35 m) on the other side wall, an air conditioning device (2.10 m
× 1.10 m × 0.77 m, metallic cover), and a sink. All the walls were made of concrete.
On the floor was wall-to-wall plastic mat. The classroom contained suspended ceiling
consisting of class D perforated gypsum panels (Gyptone BIG Quattro 47, 12 mm ×
12 mm rectangular perforation, perforating percent 6%, absorption ratios presented
in Figure 24) covering 64% of the ceiling area, while the remaining 36% was covered
with solid gypsum board. The overall depth of the suspended ceiling (from the lower
surface of ceiling to the lower surface of panel) was 100 mm and on the top of the
panels was thin acoustical felt. The classroom was measured when it was empty and
when it was furnished with normal classroom furniture. Pictures of the measured
classroom before the treatment are illustrated in Appendix A.
Figure 23: Measured classroom floor plan and measurement positions.
37
Figure 24: Absorption indices in octave bands of the Gyptone BIG Quattro 47
-perforated gypsum panel (www.gyptone.fi).
After the treatment the room was measured with two different acoustical solutions. In the first condition the classroom was identical to the before condition,
except it contained suspended ceiling consisting of class A absorbing glass wool
panels (Ecophon Master Rigid Dp, absorption ratios presented in Figure 25) covering 95% of the ceiling area and additional bass absorbers (Ecophon Extra Bass,
absorption ratios presented also in Figure 25) placed above the suspended ceiling
encircling the room at the edges of the ceiling (covering 120 cm wide area from the
walls). Above the teacher position was no additional bass absorbers. The ceiling
was installed below the former perforated gypsum -ceiling and the overall depth of
the new suspension was 10.5 cm. The second condition was identical to the first
condition, except that the noticeboard on the side wall was replaced with 420 cm
× 135 cm class A absorbing wall panel (Ecophon Wall Panel C, absorption ratios
presented in Figure 26). Again room was measured when it was empty and when
it was furnished. Pictures of the measured classroom after the treatment are also
presented in Appendix A.
The reverberation time, rate of spatial decay of sound pressure level per distance
doubling, strength, clarity, and speech transmission index were measured. Sourceand measurement positions are illustrated in the Figure 23. In the reverberation
time, strength, and clarity measurements the source (S1 and S2 in the Figure 23)
was placed on the floor in the corner of the room facing towards the corner. The
reverberation time, strength, and clarity were measured in all eight points marked
with X in the Figure 23 with two source positions (S1 and S2) and then averaged.
Two consecutive measurements were taken in each measurement point and averaged.
38
In DL2 and STI measurements the source (S3 in the Figure 23) was placed 120
cm above the floor on the supposed position of the teacher. DL2 was determined
measuring sound pressure levels in different distances from source towards the door
(marked with squares in Figure 23). Two measurements were averaged in each
position. STI-values were measured in six positions around the classroom (marked
with small circles in Figure 23). Three measurements were averaged in each position.
Figure 25: Absorption indices in octave bands of the Ecophon Master Rigid Dp glass
wool panel and additional Ecophon Extra Bass bass absorber (www.ecophon.fi).
Figure 26: Absorption indices in octave bands of the Ecophon Wall Panel
(www.ecophon.fi).
39
5.3.2
Healthcare space
Measured healthcare space was small two-person patient room in the joint-stock
property company Kiinteist¨o Oy Sein¨ajoki’s new Y-building in Sein¨ajoki. Actually,
two geometrically completely identical (with the exception of they were mirror images from each other) rooms were measured. The floor plans of the measured spaces
are illustrated in Figure 27. The room number 1 contained suspended ceiling consisting of class A absorbing panels (Ecophon Focus A, absorption ratios presented
in Figure 28) covering 85% of the ceiling area, and the room number 2 contained
suspended ceiling consisting of class C perforated gypsum panels (Knauf Plaza G1,
6 mm circular perforation, perforating percent 10.2%, absorption ratios presented
in Figure 29) covering the same area as in the room number 1. The air space above
the acoustical panels was 60 cm. The room number 2 contained large window on
the opposite wall of the door, whereas the room number 1 contained only a small
ventilation window on the corresponding wall. The rooms contained only fixtures
including three cupboards, two small shelves, a sink, and a drawer. The ceiling
material was only high absorbing material in the rooms. Pictures of the measured
rooms are presented in Appendix B.
Figure 27: Measured patient rooms. Positions of the sound sources are marked with
S1 and S2. Microphone positions are marked with numbers 1-8. (a) The room with
the class A glass wool absorbing panels. (b) The room with the class C perforated
gypsum panels.
40
Figure 28: Absorption indices of Ecophon Focus A panel in octave bands
(www.ecophon.fi). Red line: Overall depth of system (from the lower surface of
ceiling to the lower surface of panel): 200 mm, dashed line: Overall depth of system: 50 mm.
Figure 29: Absorption indices of Knauf Plaza G1 panel in octave bands
(www.knauf.fi). Measurements are made with 200 mm overall depth of system
(from the lower surface of ceiling to the lower surface of panel) and no additional
mineral wool installed.
The reverberation time, clarity, and speech transmission index in several positions were measured. Source- and measurement positions are illustrated in Figure
27. In the reverberation time and the clarity measurements the source (S1 in the
Figure 27) was placed on the floor in the corner of the room facing towards the
corner. The reverberation time, strength, and clarity were measured in all eight
points marked in the Figure 27 and then averaged. Two consecutive measurements
were taken in each point and averaged. Speech transmission index was measured
in points 1, 4, and 6 when the source was placed 50 cm from the wall and 90 cm
above the floor (S2 in the Figure 27). Three measurements were averaged in each
measurement position. Source was in the place of the hypothetical laying patient’s
head. Measurement point 4 represents a sitting person near the foot of the bed,
41
point 6 represents the other laying patient’s head and point 1 represents a person
entered the room.
5.3.3
Open plan office
Measured open plan office was part of the bureau of the Finnish Real Estate Federation (Suomen Kiinteist¨oliitto) in Helsinki. The measured space contained four
open plan office rooms which all open up to the same corridor. The corridor ceiling
was suspended ceiling containing 25 mm mineral wool panels covering 50% of the
ceiling area. The floor plan of the measured space is illustrated in Figure 30. All
rooms were 355 cm high and the corridor was 252 cm high. Three of the rooms were
two-person rooms and one of the rooms was four-person room. Between the workstations in two-person rooms were 170 cm high screens and in four-person room the
screens were 200 cm high forming small booths for employees. Between the rooms
were roughcasted brick walls (containing unused doors between the room 336 and
the room below and between rooms 338 and 339, and rooms 338 and 336, see Figure
30). The corridor wall was made of concrete and the floor was parquet in every
room and in the corridor. Pictures of the office before and after the treatment are
presented in Appendix C.
Before the acoustical treatment the office contained the above mentioned corridor
ceiling, class C absorbing screens, and 2-5 mm thick Decocoat acoustic spray coating
covering 55% of the ceiling area. Above the spray coating was also 20 mm thick
mineral wool panels and then 20 mm air space, thus the total absorption class of
the ceiling material is B. Absorption indices of Decocoat acoustic spray coating are
presented in Figure 31.
After the acoustical treatment the office contained all above mentioned acoustical
solutions and additional class A Ecophon Wall Panel C -panels assembled to the
walls of office rooms and corridor. In rooms the panels were attached on the wall
from desk level to the corner of the ceiling and wall. Practically all free wall surfaces
were covered with wall panels. In the corridor on the unbroken wall (left wall in the
Figure 30) was installed 480 cm × 135 cm absorptive wall panel. Absorption indices
of Ecophon wall panel are presented in Figure 32.
The reverberation time, speech transmission index, rate of spatial decay of sound
pressure level per distance doubling, strength, and clarity were measured. The reverberation time, strength, and clarity were measured only in room 338. Omnidirectional sound source was placed into room 338 or room 336 to the place of the office
worker’s head 120 cm above the floor. Source and measurement positions are illustrated in Figure 30. The reverberation time, strength, and clarity were measured
in four positions marked with X in Figure 30 and averaged. Two consecutive measurements were made in each position and averaged. Speech transmission index was
measured in all numbered positions as well as DL2 . In STI and DL2 measurements
three measurements were averaged in each position.
42
Figure 30: Measured open plan office. Numbered rooms (336, 338, 339, 340) were
measured.
43
Figure 31: Absorption indices of Decocoat acoustic spray coating in octave bands
(www.decocoat.fi).
Figure 32: Absorption indices of Ecophon Wall Panel in octave bands
(www.ecophon.fi).
44
6
Results and analysis
Measurement results and their analysis are reported in this chapter. Measured
results are compared to existing recommendations. Also, discussion and suggestions
of possible improvements for acoustics of the measured spaces are presented.
6.1
Classroom
Reverberation times (T60 ), A-weighted background noise levels (LbgA ), DL2 -values,
strength values (G), and clarity values (C50 ) of the furnished and the empty classroom before and after (with and without the absorbing wall panel) the acoustical
treatment are presented in the Table 3. Reverberation times in octave bands of corresponding situations are presented in Figure 33. STI-values of empty and furnished
classroom before and after (with and without the wall panel) acoustical treatment
are presented in Figures 35a, 35b, and 35c correspondingly. Also, STI-values as
a function of the distance are presented in the Figure 36. Expected reverberation
times of the empty classroom calculated with Sabine’s formula (18) are presented
in Figure 34. The calculation of reverberation times is presented in Appendix A.
Table 3: Reverberation times (T60 ), A-weighted background noise levels (LbgA ),
DL2 -values, strength values (G), and clarity values (C50 ) of the furnished and empty
classroom before and after (with (w.p.) and without (no w.p.) the wall panel) the
acoustical treatment.
T60
LbgA
DL2
G
C50
(s)
(dB)
(dB)
(dB)
(dB)
Empty room
before
after
no w.p. w.p.
0.9
0.57
0.47
39.6
35.1
34.8
1.2
1.4
2.9
15.0
11.5
12.1
3.8
9.9
10.4
Furnished room
before
after
no w.p. w.p.
0.75
0.45
0.38
39.6
35.0
34.8
1.3
3.6
4.0
12.8
12.8
15.4
4.3
9.2
11.0
Reverberation times in octave bands have decreased significantly after the acoustical treatment even without the wall panel (Figure 33). With the ceiling treatment
and the wall panel the difference is over 0.4 s. The difference between the case
without the wall panel and the case with the wall panel is about 0.1 s in mid and
high frequency regions. In lower frequency region the values of the reverberation
time are nearly the same with or without the wall panel. This is due to the poor
absorbing ability of the wall panel in lower frequencies (see Figure 26 in Appendix
A). From the Figure 33 could be seen that after the treatment the reverberation
times in lower frequency region have decreased to the same level or below the mid
and high frequency values. The reason to this is the used additional bass absorbers
45
above the ceiling. Without the bass absorbers the ceiling’s ability to absorb low
frequencies would be weaker.
Figure 33: Reverberation times in octave bands of the measured empty and furnished classroom before and after (with and without the wall panel) the acoustical
treatment.
Figure 34: Calculated reverberation times in octave bands of the empty classroom
before and after (with and without the wall panel) the acoustical treatment.
The calculated reverberation times (Figure 34) are quite near the actual measured values. However, the effect of the wall panel is much smaller in calculated case
than in measured case. Although the calculated values are not exactly the same as
46
the measured values, the calculations could be used to have a rough idea about the
magnitude of the reverberation times in the classroom. The fact that the absorptive material is not evenly distributed around the classroom explains the differences
between the calculated and the measured values of the reverberation time.
After the acoustical treatment the STI-values in the classroom are generally
about 0.15 higher than before the treatment (Figures 35 and 36). The additional
wall panel affects mainly to the STI-values in the area near the wall panel increasing
them (the values on top of the floor plan in Figure 35c). The change of the STI
along the distance is almost constant, thus it is independent from the acoustical
treatment (Figure 36).
(a) STI-values of the classroom before the treatment.
(b) STI-values of the classroom after the treatment.
(c) STI-values of the classroom after the treatment with added wall panel.
Figure 35: Speech transmission indices of measured classroom (a) before, (b) after
the acoustical treatment and (c) after the treatment with additional absorptive wall
panel.
47
Figure 36: STI-values of the three middle-points (from the teacher position to the
door) of empty and furnished classroom before and after (with and without the wall
panel) the treatment.
Furniture affects mainly the reverberation time (Figure 33) and the spatial sound
distribution (Figure 37). Reverberation times in octave bands have decreased about
0.2 seconds before the treatment due to the furniture and slightly less after the
treatment. The decrease is caused by the scattering effect of the furniture (Nilsson
et al. 2006; Nilsson 2006), which enhances the absorbing ability of the acoustic
ceiling. The value of DL2 has increased significan after the treatment when the
room was furnished. Also, when the additional wall panel was installed, the DL2 value is still higher in furnished case than in empty case, but the difference is smaller
because in empty case the value of DL2 was already better. Before the treatment the
furniture did not have significant effect to the DL2 . The above mentioned scattering
effect could be seen also from these results. The STI-values in furnished room in
all cases are higher due to the shorter reverberation time, although the difference
is very small (Figures 35 and 36). Also, the strength of the furnished room is
about 2 dB smaller than in empty room in all cases and clarity is slightly higher in
the furnished room before the treatment and slightly lower in the furnished room
after the treatment (Table 3). The small differences in clarity values correspond
48
to the small differences in STI-values, as both of them represent the clarity or the
distinctness of the speech. Before the treatment clarity and STI values were both
slightly higher in furnished case and after the treatment clarity values were lower in
furnished case, whereas only some of the STI-values were lower in the corresponding
case.
Figure 37: Spatial sound distribution curves of measured empty and furnished classroom before and after (with and without the wall panel) the acoustical treatment.
Used sound power level was different in each measurement pair.
The reverberation time of the classroom with perforated gypsum ceiling (Table
3) does not meet the recommendation from standard SFS 5907, which is 0.5 s - 0.6
s (see Section 4.1.1), whether it is furnished or not. STI recommendation from the
same standard is 0.80. Classroom with gypsum ceiling clearly does not meet this
recommendation either. Even just in front of the teacher the STI is only 0.71 (Figure
35a). After the treatment the reverberation time in empty classroom without the
wall panel is 0.57 s, thus it is in the recommended region. However, in empty room
49
with wall panel and in furnished room reverberation times are under 0.5 s, thus they
are too short under standard SFS 5907. STI-values in front of the teacher after the
treatment are over 0.8 meeting the recommendation in standard SFS 5907, but in
other parts of the classroom the values are under 0.8.
Otherwise the acoustical treatment has improved the sound environment of the
classroom to the acceptable level but the STI-values in the rear part of the classroom
are still too low. One reason to this could be the air conditioning device in the back
of the room which creates clearly audible noise. Improvement suggestion for these
problems is to encase the air conditioning device, if possible, with noise attenuators
at input and output channels.
50
6.2
Healthcare space
Reverberation times (T60 ), A-weighted background noise levels (LbgA ), and clarity
values (C50 ) of both measured rooms with and without furniture are presented in the
Table 4. Also, the reverberation times in octave bands are presented in Figure 38.
STI-values of both rooms with and without furniture (in furnished case also with
open and closed curtains around the patient’s beds) are presented in Figure 40.
Expected reverberation times of empty rooms calculated with Sabine’s formula (18)
are presented in Figure 39. The calculations of reverberation times are presented in
Appendix B.
Table 4: Reverberation times (T60 ), A-weighted background noise levels (LbgA ),
and clarity values (C50 ) of the two measured patient rooms, one with glass wool
suspended ceiling and another with perforated gypsum suspended ceiling.
T60
LbgA
C50
Room with glass wool
empty
furnished
0.76 s
0.44 s
27.5 dB
27.6 dB
6.5 dB
10.5 dB
Room with perforated gypsum
empty
furnished
0.87 s
0.52
31.4 dB
29.3 dB
4.4 dB
7.6 dB
Figure 38: Reverberation times of the two measured patient rooms in octave bands,
with and without furniture.
The difference between measured reverberation times in empty cases is clear but
not very large (Figure 38). The difference is almost constant at lower frequencies
51
but at the higher frequencies the reverberation times are approaching each other due
to glass wool’s better ability to absorb low frequencies. Because all the absorption
material is placed on the ceiling, in the empty case the horizontal room modes are
strong and produce strong reverberation between the walls, thus the ceiling does not
affect so much to the reverberation. Sound scattering would cause absorbing ceiling
to be more effective, as more sound will reflect to the ceiling (Nilsson et al. 2006;
Nilsson 2006). In the empty cases there were practically no scattering objects in
the rooms. Thus, the sound field parallel to the ceiling dominates the reverberation
making ceiling treatment ineffective (Nilsson 2006). In furnished cases the difference between measured reverberation times is even smaller. Additional furniture,
including two beds, acted as an absorbent decreasing the reverberation time. Also,
the scattering effect of the furniture enhances the absorbing ability of the ceiling.
Especially in the room with perforated gypsum ceiling the reverberation time has
decreased significantly.
One reason why the difference of the reverberation times of the gypsum- and
glass wool room is quite small is the fact that the difference of absorption indices of
perforated gypsum panels and glass wool panels is not very large (Figures 28 and
29 in Appendix A). In Figure 38, the high spike at 125 Hz in the reverberation time
of the furnished room with glass wool ceiling is probably an error in measurements,
because there should not be any reason why the furniture would increase the reverberation time at one octave band so dramatically. Also, apart from the 125 Hz
point, the reverberation time -curve follows the shape of the other curves, thus it
refers also to the measurement error.
Figure 39: Calculated reverberation times of both empty patient rooms.
The calculated reverberation times of the empty rooms (Figure 39) are very short
compared to measured values, especially at lower frequencies (Figure 38). However,
with glass wool above 500 Hz the difference between the measured and calculated
52
values is only 0.2 - 0.3 s. Large difference is due to the shape of the room and the
placing of the absorption material. Sabine’s formula works poorly when the room
is low compared to the other dimensions, all the absorption material is placed on
the one surface (Rossing 2007; Nilsson 2006) and no scattering objects exist in the
room. Thus, the calculated values of reverberation times are not reliable in empty
case. However, in the furnished cases above 500 Hz the calculated values of the
reverberation time correspond quite well to the measured values. Correspondence
is higher due to the furniture, which scatters the sound field preventing the horizontal modes from dominating the overall sound field. Based on these results, the
calculations could be used to predict the reverberation times at the higher frequency
region, but not in the lower frequency region. Furthermore, the additional furniture
have not been taken into account in calculations as an additional absorption area.
Adding the absorption area of the furniture would decrease the calculated values of
the reverberation time even more, leading to more unrealistic results.
Figure 40: Speech transmission indices of both measured patient rooms, empty and
furnished with open and closed curtains. (a) The room with the glass wool ceiling.
(b) The room with the perforated gypsum ceiling.
Speech transmission index values are clearly smaller in the room with the perforated gypsum ceiling (Figures 40 and 41), although the difference is rather small,
especially when the rooms were empty. In the empty cases the background noise
level in the room with gypsum ceiling was higher (Table 4) and the reverberation
time was longer (Table 4 and Figure 38). These are the main factors decreasing the
STI-values, thus the longer reverberation time is not alone responsible for the lower
53
STI-values. In furnished cases STI-values are still higher in the room with glass wool
ceiling but the difference is smaller. The background noise level in the room with
gypsum ceiling was still slightly higher but now the difference of the reverberation
times was smaller. This causes the difference of the STI-values between the two
rooms to be smaller than in empty cases. The effect of the curtains around the
patient’s beds to the STI-values is negligible.
Figure 41: Speech transmission indices of both measured patient rooms, empty
and furnished with open and closed curtains. Measurement position numbering is
presented in Figure 27.
Unlike speech transmission index, clarity is independent from background noise
level. Thus, clarity could be used to determine the speech intelligibility in empty
and furnished cases regardless of the background noise levels. In empty case clarity
is 1.1 dB higher in the room with glass wool ceiling (Table 4), meaning that the
speech clarity is still greater, whether the background noise is present or not. In
furnished case clarity is 2.9 dB higher in the room with glass wool ceiling. This
implies that the glass wool ceiling improves speech intelligibility greatly when the
furniture in the room enhances the absorbing ability of the ceiling. Furthermore, in
both rooms the value of clarity has increased due to the furniture’s scattering effect.
The recommendation for the patient room reverberation time in standard SFS
5907 is 0.6 s (see Section 4.1.2), thus both rooms have too long reverberation time
when they are empty, but when furnished the reverberation times meet the standard
recommendation (Table 4). Background noise levels in room with glass wool ceiling
meet the recommendations from WHO and SFS 5907, which are 30 dB and 29 dB
correspondingly (see Section 4.1.2). In the room with gypsum ceiling the background
noise levels are slightly higher than in the recommendations. However, the measured
values exceed the recommendations only less than 2 dB. In the empty room measurements the hospital building was still under construction, so the furnished room
54
background noise levels correspond more to the reality.
In patient’s rooms the low STI-values between the beds are desirable to provide
privacy to the patients. This sets a contradiction with the reverberation time, because decreasing the reverberation time will increase the speech transmission index.
Solution to this could be heavy curtains installed between the patients and absorption panels installed to the wall opposite to the beds of patients. Curtain will reduce
the direct sound from patient to another and the absorption panels will reduce the
reflections between the patients. On the other hand, a communication should be
possible between the patients if necessary, thus the sound insulating structure between the patients should be mobile or foldaway.
55
6.3
Open plan office
Reverberation times (of room 338) (T60 ), A-weighted background noise levels (LbgA ),
DL2 -values, distraction distances (rd ), strength values (G) (of room 338), and clarity values (C50 ) (of room 338) before and after acoustical treatment are presented
in Table 5. STI-values before and after the treatment are presented in Figure 42,
reverberation times in octave bands of the room 338 are presented in Figure 44, and
STI and DL2 -curves of the entire office are illustrated in Figures 43 and 47 correspondingly. Sound pressure levels in each measurement position, before and after
the treatment, are illustrated in Figures 45 and 46. Expected DL2 and rd -values and
STI-curves of the room 338 and the whole office calculated with Finnish Institute of
Occupational Health open plan office modelling tool (Ker¨anen et al. 2007), (http://
www.ttl.fi/en/work_environment/physical_factors/acoustictool/) are presented in Figures 49 and 48 correspondingly.
Table 5: Reverberation times (T60 ) (of room 338), A-weighted background noise
levels (LbgA ), DL2 -values, strength values (G) (of room 338), distraction distances
(rd ), and clarity values (C50 ) (of room 338) of the measured open plan office before
and after acoustical treatment.
T60
LbgA
DL2
rd
G
C50
Before
0.39 s
30.4 dB
18.2 dB
5.3 m
16.3 dB
8.0 dB
After
0.29 s
30.1 dB
20.7 dB
4.2 m
13.0 dB
10.4 dB
Speech transmission index values in room 338 has remained fairly constant except
at the measurement point 2 (Figure 30, above the sound source) the value has
increased 0.07 after the treatment (Figure 42). That is probably due to the decreased
reverberation time as the background noise level has remained constant (Table 5).
At the first position in room 339 (point 7 in Figure 30) the STI-value has decreased
significantly, 0.32, and at the rest positions (point 8 and 9 in Figure 30) STI-values
have also decreased 0.12 and 0.13 correspondingly (see Figure 42). The reason to this
is the large absorptive wall panel installed on the corridor wall. Before the treatment
sounds from the room 338 were reflected to the rooms 339 and 340 directly from the
hard corridor wall. After the treatment the installed wall panel absorbs the majority
of the sounds from the room 338. STI-values of measurement positions 2, 7, 8, and
9 before and after the treatment are also illustrated in the Figure 43. The sound
insulation of the unused door between rooms 338 and 339 was poor, thus insulating
the door would decrease the STI values in room 339 even more.
The value of the clarity in the room 338 after the treatment has increased 2.4 dB
(Table 5), whereas the STI-values have remained fairly constant (Figure 42). This
56
(a) Before
(b) After
Figure 42: Speech transmission indices of measured open plan office (a) before and
(b) after the acoustical treatment. Sound source is marked with S1.
indicates that the total distinctness of the speech in the room 338 has improved,
even though the STI-values have not changed significantly.
The distraction distances of the whole office before and after the treatment (Table
5) are very short. The actual walls between different office rooms affect to the STIvalues decreasing them, thus decreasing the distraction distance. The wall panel
on the corridor wall decreases STI-values decreasing also the distraction distance.
The distraction distance measured inside only one office room at the time would be
greatly longer. Because of the actual walls between the office rooms the distraction
distances of the office are not comparable with distraction distances of traditional
open plan offices. The distraction distances of the office have been determined from
the Figure 43.
The reverberation time of the room 338 was already rather short and it was
decreased by 0.1 s (Table 5) after the treatment. The difference is small but clear
and because the reverberation time was already short the difference is not expected
to be very large. The change of the reverberation time in octave bands was also
clear (Figure 44). Above 500 Hz the difference is nearly constant, 0.15 s, and below
57
Figure 43: Speech transmission indices of measured open plan office before and after
the acoustical treatment (measurement points 2, 7, 8, and 9).
500 Hz the difference is larger, except 63 Hz band. Before the treatment the office
contained fairly poor absorbing screens and the ceiling as only absorption materials,
so the absorption at higher frequencies was greater because the space did not contain
practically any low frequency absorbing materials. After the treatment the installed
wall panels improved the low frequency absorption and it could be seen as a decrease
of the reverberation time at lower frequencies in Figure 44. Reverberation was
not a problem in the office, whereas the excessive sound spreading was, thus the
reverberation time does not offer much additional information in this context.
Figure 44: Reverberation times of the measured open plan office before and after
the acoustical treatment.
58
Installed absorption panels have decreased sound pressure levels of the entire
office by 2-8 dB (Figures 45 and 46). Sound pressure levels have decreased 2-4 dB
in the room 338 when using sound source S1. Additionally, as it could be seen from
Figures 45 and 46, sound pressure level decreases the more the further away from the
sound source it is measured. In the furthest office room (number 340) the difference
is already 6 dB. This implies that the sound propagation from one office room to
another has reduced significantly. For example, in Figure 46 the difference of sound
pressure levels is even 8 dB between rooms 336 and 338.
Figure 45: A-weighted sound pressure levels in measurement positions 2-10 using
source S1 (see Figure 30 for position numbering) before and after the acoustical
treatment.
Figure 46: A-weighted sound pressure levels in measurement positions 1-4 using
source S2 (see Figure 30 for position numbering) before and after the acoustical
treatment.
59
DL2 -value of the entire office has increased by 2.5 dB, which is not a very large
difference (Table 5). The value of DL2 of the entire office was already very high due
to the actual walls between the office rooms. The presence of the walls could be
seen from Figure 47 (b) where the sound pressure level decreases rapidly after every
two consecutive points in both curves. Because the floor plan of the measured office
is not a traditional open plan office floor plan, the DL2 results are not comparable
with traditional open office results.
Figure 47: Spatial sound distribution curves of measured open plan office before
after the acoustical treatment. (a) Linear fitting to determine the DL2 -value. (b)
Sound pressure levels versus distance from the source.
The modelled values of DL2 of the entire office (Figure 48) are very small compared to measured values (Table 5), because the model assumes the space to be a
traditional open office, which the measured office is not. Therefore, the modelled
results are not reliable when considering the entire office. However, when analysing
only one individual room the model produces results (Figure 49), which are quite
near the measured results (Table 6). In Figure 50 are illustrated spatial sound distribution curves of room 338 before and after the treatment. The figure includes
two pairs of curves, the first pair is spatial sound distribution measured at positions 1 and 2, and the second pair is measured at positions 1 and 4 (see Figure 30
for position numbering). The corresponding DL2 -values are presented in Table 6.
These values of DL2 are remarkably smaller than the corresponding values of the
entire office (Table 5) and correspond more to values of traditional open plan offices.
Furthermore, when comparing the modelled DL2 -values of the room 338 (Figure 49)
to the measured values (Table 6) it could be seen that they are close to each other,
so in this case the model produces more reliable results. However, determining DL2
based on measurements at only two points is inaccurate and not very reliable. That
60
could be seen from Figure 50, where the curves of different measurement paths differ
from each other.
(a) Before
(b) After
Figure 48: Calculated values of DL2 , rd , and STI of entire office before and after
the acoustical treatment. Open plan office modelling tool (Ker¨anen et al. 2007).
Table 6: Measured DL2 values of the room 338 before and after the treatment in
two different paths.
DL2
Points 1 - 2
Before After
4.3 dB 5.0 dB
Points 1 - 4
Before After
4.7 dB 6.3 dB
The realized acoustical treatment has clearly improved the sound environment
in the measured open plan office by decreasing the reverberation time, decreasing
speech intelligibility between rooms, decreasing sound propagation from work space
to another, and lowering the overall sound pressure levels. Especially the absorptive
wall panel in the corridor has a large impact on attenuating the sounds between
the office rooms. The decreased reverberation time could make phone using more
61
pleasant in the office. However, the clarity of speech in the room 338 has increased.
This could be desirable if all workers in the room collaborated, but if they do independent work the increased clarity could be distracting. Further actions to improve
the sound environment even more could be to insulate all the unused doors between
the office rooms and use free hanging absorption units, if possible, to increase the
total absorption area.
(a) Before
(b) After
Figure 49: Calculated values of DL2 , rd , and STI of office room 338 before and after
the acoustical treatment. Open plan office modelling tool (Ker¨anen et al. 2007).
62
Figure 50: Spatial sound distribution curves of room 338 of the measured office
before and after the treatment. See Figure 30 for the measurement position numbering.
63
7
Conclusions
In this thesis the effects of the acoustical treatment to the sound environment of
the three types of public spaces were studied. The places were a classroom in a
comprehensive school, a patient room in medical center, and an open plan office.
The acoustical renovation was performed to the classroom and to the open plan office
and the measurements were made before and after the renovation. In medical center,
two identical patient rooms with different acoustical treatment were measured.
The acoustical treatment has clearly improved the sound environment in the
each type of space covered by this thesis. The working environment has improved
in the treated spaces and they are now more comfortable to be in than before. As a
continuation for the research a subjective part should be performed in the measured
spaces by interviewing the employees and the patients about the sound environment
and the acoustics of the space, and how it affects to the general work environment.
Generally the employees of the treated spaces were satisfied about the acoustics but
the real and more accurate survey should be done.
The classroom had a suspended perforated gypsum ceiling before the treatment,
and after the treatment it contained a suspended glass wool ceiling with additional
bass absorbers on top of it and a large absorptive wall panel. The sound environment
has improved significantly after the acoustical treatment. The reverberation time
was shortened greatly, 0.4 s - 0.5 s in every frequency band. Furthermore, the
values of speech transmission index were increased by 0.15 everywhere in the room
and the values of clarity were increased by over 6 dB. The effect of the additional
installed bass absorbers could also be seen from the decreased reverberation times
at the low frequency region where the reverberation time has decreased 0.5 s. The
installed absorptive wall panel increased the overall absorption area decreasing the
reverberation time but also it removed the flutter echo between the side walls. Now
the classroom fulfils the standard SFS 5907 recommendation for the reverberation
time. STI-values in the front part of the classroom are also in accordance with
the standard recommendations, but in the rear part the values are too low. The
speech intelligibility could be improved further by muting the air conditioning device,
because the reverberation time is already quite low. However, STI-values will be
increased slightly when pupils are in the classroom. Wall-to-wall carpet would also
reduce the noise from moving chairs and tables.
The first of the measured patient rooms contained a suspended glass wool ceiling
and the second room contained a suspended perforated gypsum ceiling. The sound
environment in the room with the glass wool ceiling was clearly better than in the
room with the perforated gypsum ceiling. The reverberation times were lower in
every frequency band and STI and clarity -values were higher in the room with the
glass wool ceiling. High speech intelligibility in the patient room is desirable when
considering the discussion between the doctor and the patient, whereas it is not
desirable when considering the privacy of the patients. When furnished, both rooms
meet the Finnish standard SFS 5907 recommendation for the reverberation time.
However, the room with the gypsum ceiling do not meet the recommendation for the
background noise level from the same standard, but the difference is less than 1 dB.
64
Furniture clearly improved the efficiency of the acoustical ceiling by scattering the
sound field in the room. The curtains around the patient’s beds did not affect to the
speech intelligibility. The privacy between the patients could be improved by using
mobile or foldaway screens or heavy curtains between the beds. Also, additional
absorbing wall panels could reduce unwanted reflections from one bed to another.
The differences of acoustic between the two rooms were clear but not remarkably
large. One reason to this is that the difference between absorbing abilities of the
used glass wool panel and the perforated gypsum panel was not remarkably large
either.
The open plan office had already an acoustical spray coating as a ceiling and
high screens between the workstations. In the renovation, absorptive wall panels
were installed to practically every wall from table height to the ceiling. The major
problem in the office was sound propagation from a work station to another. After
the treatment the STI-values between the workstations and especially between the
office rooms decreased. Furthermore, the overall sound pressure level was decreased,
thus the whole office is now more silent. The decrease of sound pressure level between
the office rooms was significant, in some cases even 8 dB. The reverberation time
decreased also slightly but it was not the problem before the treatment either as it
was already in an acceptable level. Although, the improvement in the reverberation
time of the low frequency region was larger. The rate of spatial decay of sound
pressure level per distance doubling was also increased slightly, but as the measured
office was not a traditional open plan office the DL2 values do not represent the
acoustical properties of the space well. The spreading of sound could be prevented
further by sealing the unused doors between the office rooms. At present condition
the doors leak noise greatly. Because the building is conserved and installing the
acoustical ceiling is therefore not an option, the free hanging acoustical units could
be used to further increase the absorption area in the office room, thus decrease the
sound pressure levels even more.
65
References
Barron, M., 1995. Interpretation of early decay times in concert auditoria. Acta
Acustica united with Acustica, 81(4):320–331.
Beranek, L., 2011. The sound strength parameter G and its importance in evaluating
and planning the acoustics of halls for music. Journal of Acoustical Society of
America, 129(5):3020–3026.
Bj¨orkholts, D., 1988. Koulutilojen ¨aa¨niymp¨arist¨oselvitys. Tech. rep., Turku Regional
Institute of Occupational Health.
Brunskog, J., Gade, A. C., Bellester, G. P., and Calbo, L. R., 2009. Increase in voice
level and speaker comfort in lecture rooms. Journal of the Acoustical Society of
America, 125(4):2072–2082. doi:10.1121/1.3081396.
Busch-Vishniac, I. J., West, J. E., Barnhill, C., Hunter, T., Orellana, D., and
Chivukula, R., 2005. Noise levels in Johns Hopkins hospital. Journal of the
Acoustical Society of America, 118(6):3629–3645. doi:10.1121/1.2118327.
Canning, D. and James, A., 2012. The Essex Study - Optimised classroom acoustics
for all. Tech. rep., The Association of Noise Consultants.
Chu, W. T. and Warnock, A. C. C., 2002. Measurements of sound propagation in
open offices. Tech. Rep. Internal Report IR-836, Institute of Research in Construction.
Ecophon Saint-Gobain, 2006. Modern School Acoustics. Tech. rep., SaintGobain Ecophon AB. URL http://www.ecophon.com/Documents/01.Ecophon%
20Master/Acoustics/Education/INT_Modern_School_Acoustics.pdf. Cited:
7.6.2012. Complement to the book ”Don’t limit your senses”, ISBN 91-974193-2X, 2002.
Haapakangas, A., Helenius, R., Keskinen, E., and Hongisto, V., 2008. Perceived
acoustic environment, work performance and well-being - survey results from
Finnish offices. In 9th International Congress on Noise as a Public Health Problem
(ICBEN) 2008, Foxwoods, CT.
Hagerman, I., Rasmanis, G., Blomkvist, V., Ulrich, R., Eriksen, C. A., and Theorell,
T., 2005. Influence of intensive coronary care acoustics on the quality of care and
physiological state of patients. International Journal of Cardiology, 98(2):267–270.
Hak, C. C. J. M., Wenmaekers, R. H. C., Hak, J. P. M., van Luxemburg, L. C. J.,
and Gade, A. C., 2010. Sound strength calibration methods. In 20th International
Congress on Acoustics, ICA 2010, pp. 1–6.
Halme, A. and Sepp¨anen, O., 2002. Ilmastoinnin a¨¨anitekniikka. Suomen LVI-liitto,
Helsinki. ISBN 951-98811-2-3.
66
Hirvonen, M., 2007a. Rakennusten akustinen suunnittelu. 1, Akustiikan perusteet.
RIL 243-1-2007. Suomen rakennusinsin¨oo¨rien liitto, Helsinki. ISBN 978-951-758477-7.
Hirvonen, M., 2007b. Rakennusten akustinen suunnittelu. 2, Oppilaitokset, auditoriot, liikuntatilat ja kirjastot. RIL 243-2-2007. Suomen rakennusinsin¨oo¨rien liitto,
Helsinki. ISBN 978-951-758-483-8.
Hirvonen, M., 2008. Rakennusten akustinen suunnittelu. 3, Toimistot. RIL 243-32008. Suomen rakennusinsin¨o¨orien liitto, Helsinki. ISBN 978-951-758-486-9.
Hongisto, V., 2011. Meluntorjunta. Tech. rep., Aalto-yliopisto.
Hongisto, V., Virjonen, P., and Ker¨anen, J., 2007. Determination of acoustic conditions in open offices and suggestions for acoustic classification. In 19th International Congress on Acoustics.
Houtgast, T. and Steeneken, H. J. M., 1985. A review of the MTF concept in room
acoustics and its use for estimating speech intelligibility in auditoria. Journal of
the Acoustical Society of America, 77(3):1069–1077.
IEC 60268-16:1988, 1988. Sound System Equipment - Part 16: Objective rating of
speech intelligibility by speech transmission index.
Indoor Air Association, 2008. Indoor air classification. Tech. Rep. 5, Finnish indoor
air association.
ISO 140-7:1998, 1998. Acoustics - Measurement of sound insulation in buildings and
of building elements - Part 7: Field measurements of impact sound insulation of
floors.
ISO 3382-1:2009, 2009. Acoustics - Measurement of room acoustic parameters - Part
1: Performance spaces.
ISO 3382-2:2008, 2008. Acoustics - Measurement of room acoustic parameters - Part
2: Reverberation time in ordinary rooms.
ISO 3382-3:2012, 2012. Acoustics - Measurement of room acoustic parameters - Part
3: Open plan offices.
ISO 717-1:1996, 1996. Acoustics - Rating of sound insulation in buildings and of
building elements - Part 1: Airborne sound insulation.
ISO 717-2:1996, 1996. Acoustics - Rating of sound insulation in buildings and of
building elements - Part 2: Impact sound insulation.
ITU-T P.51, 1996. ITU-T Recommendation P.51: Artificial Mouth.
Jordan, V. L., 1970. Acoustical criteria for auditoriums and their relation to model
techniques. Journal of the Acoustical Society of America, 47(2A):408–412.
67
Karjalainen, M., 2000. Hieman akustiikkaa. Tech. rep., Teknillinen korkeakoulu.
Karjalainen, M., 2008. Kommunikaatioakustiikka. Report / Helsinki University
of Technology, Department of Signal Processing and Acoustics, 7. Teknillinen
korkeakoulu, Espoo, 2. extended ed. ISBN 978-951-22-9749-8.
Ker¨anen, J., Hongisto, V., Oliva, D., and Hakala, J., 2012. Avotoimiston
huoneakustiikka - laboratoriotutkimus ja suunnitteluohje. Tech. Rep. 30, Suomen
sis¨ailmayhdistys ry.
Ker¨anen, J., Virjonen, P., and Hongisto, V., 2007. A new model for acoustic design
of open offices. In Internation Congress on Acoustics Madrid, 2-7 September 2007,
pp. 1–6.
Ker¨anen, J., Virjonen, P., and Hongisto, V., 2008. Characterization of acoustics in
open offices - four case studies. In Acoustics ’08 Paris, pp. 549–554.
Kristiansen, J., Lund, S. P., Nielsen, P. M., Persson, R., and Shibuya, H., 2011.
Determinants of noise annoyance in teachers from schools with different classroom
reverberation times. Journal of Environmental Psychology, 31(4):383 – 392. ISSN
0272-4944. doi:10.1016/j.jenvp.2011.08.005.
Lahti, T., 1995. Akustinen mittaustekniikka. Raportti / Teknillinen korkeakoulu, s¨ahk¨otekniikan osasto, akustiikan ja ¨aa¨nenk¨asittelytekniikan laboratorio, 38.
Teknillinen korkeakoulu, Espoo. ISBN 951-22-2901-3.
MacLeod, M., Dunn, J., Busch-Vishniac, I. J., West, J. E., and Reedy, A., 2007.
Quieting Weinberg 5C: A case study in hospital noise control. Journal of the
Acoustical Society of America, 121(6):3501–3508. doi:10.1121/1.2723655.
Mapp, P., 2005. Is STIPA a robust measure of speech intelligibility performance?
In Audio Engineering Society 118th Convention, Barcelona, Spain, pp. 1–9.
Nilsson, E., 2006. A reverberation time formula for rooms with ceiling treatment.
In Joint Baltic-Nordic Acoustics Meeting, Gothenburg, Sweden, pp. 1–6.
Nilsson, E., 2010. Room acoustic measures for classrooms. In Internoise 2010, noise
and sustainability.
Nilsson, E., ke Andersson, N.-A., and Chigot, P., 2006. Sound scattering in rooms
with ceiling treatment. In Euronoise, Tampere, Finland, pp. 1–6.
Peltonen, T., 2000. A Multichannel Measurement System for Room Acoustics Analysis. Master’s thesis, Helsinki University of Technology, Espoo, Finland.
Rossing, T. D., 2007. Springer Handbook of Acoustics. Springer, New York. ISBN
978-0-387-30446-5.
Rossing, T. D. and Fletcher, N. H., 1995. Principles of Vibration and Sound.
Springer, New York. ISBN 0-387-94336-6.
68
Rossing, T. D., Moore, F. R., and Wheeler, P. A., 2002. The Science of Sound.
Addison-Wesley, Reading (MA), 3. ed. ISBN 0-8053-8565-7.
Ryherd, E. E., Waye, K. P., and Ljungkvist, L., 2008. Characterizing noise and
perceived work environment in a neurological intensive care unit. Journal of the
Acoustical Society of America, 123(2):747–756. doi:10.1121/1.2822661.
Sala, E. and Viljanen, V., 1995. Improvement of acoustic conditions for speech
communication in classrooms. Applied Acoustics, 45(1):81 – 91. ISSN 0003-682X.
doi:10.1016/0003-682X(94)00035-T.
Salandin, A., Arnold, J., and Kornadt, O., 2011. Noise in an intensive care unit.
Journal of the Acoustical Society of America, 130(6):3754–3760. doi:10.1121/1.
3655884.
Schroeder, M. R., 1965. New method of measuring reverberation time. Journal of
Acoustical Society of America, 37(1965):409–412.
SFS 5907:2006, 2006. Acoustic classification of spaces in buildings.
Smirnowa, J. and Ossowski, A., 2005. A method for optimising absorptive configurations in classrooms. Acta Acustica united with Acustica, 91(1):103–109.
Steeneken, H., Verhave, J., McManus, S., and Jacob, K., 2001. Development of an
accurate, handheld, simple-to-use meter for the prediction of speech intelligibility.
Proceedings of Institute of Acoustics, 23(53-59).
Taina, P., 2006. Pientalon huoneakustiikan parantaminen. Master’s thesis, Helsinki
University of Technology, Espoo, Finland.
Uosukainen, S., 2010. Akustinen kentt¨ateoria. Tech. rep., Teknillinen korkeakoulu.
WHO, 1999. Guidelines for community noise. Tech. rep., World Health Organization.
Winer, E., 2004. Bass Traps - Not Just for Fisherman!
URL http://www.
positive-feedback.com/Issue13/toc13.htm. Cited 7.6.2012.
69
A
Classroom: Pictures of the measured spaces,
and the reverberation time calculations
Pictures of the measured classroom
(a) From the front door.
(b) From the back wall.
Figure A1: Measured empty classroom before the treatment with Gyptone BIG
Quattro 47 suspended ceiling.
70
(a) From the front door.
(b) From the back wall.
Figure A2: Measured furnished classroom before the treatment with Gyptone BIG
Quattro 47 suspended ceiling.
71
(a) After the treatment.
(b) Extra Bass solution.
Figure A3: (a) Measured empty classroom after the acoustical treatment with
Ecophon Master Rgid Dp and (b) bass absorbers above the ceiling.
72
The reverberation time calculations of the classroom
Figure A4: The reverberation time calculations of measured classroom before and
after the acoustical treatment. Absorption indices are from (Halme and Sepp¨anen
2002).
73
B
Healthcare space: Pictures of the measured
spaces, and the reverberation time calculations
Pictures of the measured healthcare spaces
(a) From the front door.
(b) From the window wall.
Figure B1: Measured patient room with glass wool Ecophon Focus A suspended
ceiling.
74
(a) From the front door.
(b) From the window wall.
Figure B2: Measured patient room with perforated gypsum Knauf Plaza G1 suspended ceiling.
75
The reverberation time calculations of the measured healthcare spaces
Figure B3: The reverberation time calculations of two measured patient rooms.
Absorption indices are from (Halme and Sepp¨anen 2002).
76
C
Open plan office: Pictures of the measured
spaces
(a) Absorptive wall panel installed on the corridor wall.
(b) From the other end of the corridor.
Figure C1: Measured open plan office. Pictures from both ends of the corridor.
77
(a) Four-person office room 338.
(b) Absorptive wall panel installed to two-person office room 339.
Figure C2: Measured open plan office. Pictures from office rooms.


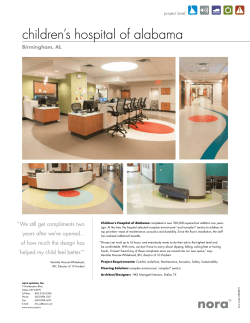


© Copyright 2026