
Labor Market Openness, H-1B Visa Policy, and the
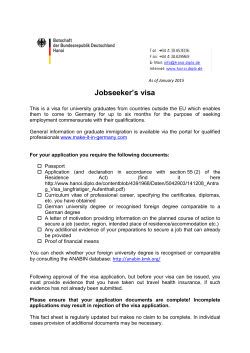
Labor Market Openness, H-1B Visa Policy, and the
Scale of International Student Enrollment in the US
Kevin Shih∗
April 18, 2015
Abstract
International students have long comprised an important part of US higher education. However, little is known regarding the factors that encourage students from
across the world to enroll in US colleges and universities each year. This paper examines the relationship between international enrollment and the openness of the US’
skilled labor market, currently regulated by the H-1B program. Gravity regressions
reveal that H-1B visa issuances to a country are positively and significantly related to
the number of international students from that country. Causal estimates of the impact
of labor market openness are achieved by exploiting a dramatic fall in the H-1B visa
cap in October 2003. Triple difference estimates show that the fall in the cap lowered
foreign enrollment by 10%.
JEL Codes: F22, I21, J11
Keywords: International enrollment, foreign students, determinants, globalization,
higher education, H-1B policy.
∗
University of California, Davis. Department of Economics. 1 Shields Avenue, Davis, CA 95616. Email: [email protected]. This research was conducted while the author was a Research Associate of the
Institute of International Education and a doctoral candidate at the UC Davis Economics Department. The
author thanks Christine Farrugia, Rajika Bhandari, Giovanni Peri, Chad Sparber, Lars Lefgren, and two
anonymous referees for insightful discussions and suggestions. The author acknowledges support from the
NBER Pre-Doctoral Fellowship in High Skill Immigration. This research does not reflect the views of the
IIE. The author is accountable for all errors contained herein.
1
1
Introduction
Students from around the world have long pursued higher education in the
US. Sustained growth over the last half century (figure 1) has transformed foreign
students from emissaries of cultural and educational exchange to major
constituents of US universities. In 2012, approximately 3%, 12%, and 30% of all
bachelor’s, master’s, and Ph.D. degrees, respectively, were awarded to noncitizens.
Within STEM 1 fields that figure is even higher, with foreign students earning
roughly 40% of all graduate diplomas. Despite their large presence in US higher
education, little is known about the factors that encourage thousands of foreign
citizens to study in American colleges and universities each year.
This paper aims to elucidate how the openness of the US’ skilled labor market
affects the number of international students. The entry of college educated (skilled)
foreign workers is currently regulated by H-1B visa policy. Foreign individuals who
have employment agreements with US firms may still be denied access under H-1B
regulations. As such, H-1B policy is the key tool that regulates the openness of the
US’ skilled labor market. This study evaluates whether H-1B policies that alter
labor market openness impact foreign enrollment at US colleges and universities.
Distinctly, this paper focuses on the quantity of international students, and as
such, both complements and extends recent work by Kato & Sparber (2013) on the
effect of H-1B policy on the quality of foreign college applicants.
1
STEM stands for Science, Technology, Engineering and Mathematics.
2
This research question bears importance for US higher education, whose colleges and
universities lead the world in hosting international students.2 Anticipating and shaping
future foreign enrollment streams is not possible without understanding the relevant
factors. The ability to adjust student composition is of tremendous value as foreign
students may impart externalities that affect native educational attainment (e.g. Hoxby
1998, Borjas 2004, Hunt 2012, Jackson 2014) or university knowledge creation (e.g.
Chellaraj et al. 2008, Stuen et al. 2012). Understanding how H-1B policies intersect with
international student entry can be used to regulate the extent of these externalities.
Focusing on labor market openness through the H-1B program is particularly
relevant for policymakers. Curiously, while the US tightly controls employment of
foreign skilled workers by placing caps on H-1B visas, there are no quotas on foreign
matriculation in US colleges and universities. Despite these opposing stances towards
foreign students and high skill workers, policies targeted towards one group may affect
the other. However, H-1B reforms are often made without considering the broader
effects on foreign students. This paper informs high skill immigration policy by
elucidating an unintended consequence of the H-1B visa program on US higher
education.
Understanding how access to domestic labor markets affect the number of foreign
students also informs changes in future high skill labor supply, innovation and economic
productivity. As a sizeable portion of foreign students seek jobs in the US after
graduation, policy makers using H-1B caps to reach targets for high skill labor supply
2
See the OECD report http://www.oecd-ilibrary.org/education/how-is-international-student-mobility-shaping-up_5k43k8r4k821-en.
3
may inadvertently overshoot or undershoot if they fail to account for the impacts on
international enrollment.3 Such unanticipated changes in the supply of skilled labor may
affect the wages and productivity of US natives (e.g. Borjas 2009, Peri et al. 2014).
Additionally, because foreign students and high skill workers are key contributors to
STEM innovation (Black & Stephan 2007, Kerr & Lincoln 2010, Chellaraj et al. 2008;
Stuen et al. 2012), failure to regulate skilled foreign labor supply would have
consequences for technological progress, and hence long run economic productivity
growth.
Surprisingly, as the world leader in hosting international students, the US has been
the focus of only a small number of studies on the determinants of international
enrollment.4 Previous attempts have taken a broad-sweeping approach, examining the
relationship between international enrollment and a variety of potential factors within a
gravity regression framework. The results from these studies have found many factors to
be important, including bilateral trade (McMahon 1992); skill prices in home countries
(Rosenzweig 2006); tuition fees and US government expenditures on higher education
(Liu & Wang 2009); and home country GDP, demographic changes to young
populations, and exchange rates (Bird & Turner 2014).5
This work extends existing research on the determinants of international student
mobility in several key manners. First, I introduce measures of H-1B issuances by
3
Ruiz (2013) reports that 35% of all H-1B visas awarded in 2010 were to individuals transferring from an F-1 student visa.
Furthermore, among those F-1 visa holders transferring to an H-1B visa, nearly 75% were individuals with graduate degrees.
4 As foreign student entry to non-US destinations has grown, many recent studies have focused on understanding international
student mobility to European Union nations (Brezis & Soueri 2013; González et al. 2011; Van Bouwel & Veugelers 2013) and to the
United Kingdom (Naidoo 2007; Jena & Reilly 2013).
5 In related work, Grogger & Hanson (2013) find that increases in the strength of the US economy and weaker home country
economic conditions both increase the likelihood Ph.D. recipients stay in the US.
4
country into the gravity regression framework. Controlling for other potential
determinants helps mitigate omitted variable bias and allows variation in H-1B
issuances to better reflect labor market openness. Additionally, utilizing the gravity
framework affords comparisons to earlier studies that exclude H-1B issuance.
While gravity regressions and comparisons across the literature are useful, causal
relationships are the important and relevant margin on which policies should be
structured. Thus, the second contribution of this paper is to attain causal estimates by
analyzing a natural experiment that decreased the openness of the US’ skilled labor
market. I focus on a policy-induced reduction in the H-1B visa cap from 195,000 to
65,000 in October 2003. This strategy builds on the difference-in-differences approach
used by Kato & Sparber (2013) to evaluate how the fall in the cap affected the quality
of foreign college applicants. A central contribution of this paper, therefore, is to focus
on quantity—a complete understanding of the role of H-1B policy, and hence labor
market openness, is not possible without examining both selection and scale.
Because several countries were exempt from H-1B visa caps, Kato & Sparber (2013)
compare SAT scores sent to universities by applicants from non-exempt (treated)
countries to those from exempt (control) countries. While comparisons between treated
and control countries serve as a useful starting point, this difference-in-differences
approach requires that the two types of countries would have followed parallel trends in
absence of H-1B reform. To overcome this demanding assumption I utilize a triple
difference framework that leverages the fact that graduate students were also largely
exempt from H-1B limits, and can be used as a second counterfactual group to remove
5
differential trends across treated and control countries. Importantly, the triple difference
approach requires a much weaker assumption: no other coincident factors differentially
affected the enrollment behavior of undergraduates from treated countries.
The main finding of this paper is that changes in H-1B visa policy that alter labor
market openness strongly affect international student enrollment. Gravity regressions
reveal a large positive correlation between international enrollment and H-1B visas. The
results are always statistically significant at the 5% level and remain robust after
controlling for a variety of other factors, including exchange rates, trade, and home
country GDP. In fact, factors that were found to have statistically significant
relationships with foreign enrollment in prior studies lose significance when H-1B
issuances are accounted for. The strong role of H-1B visas is even evident in the most
rigorous specifications, which also control for country fixed effects, year effects, and
country-specific linear time trends.
The triple difference analysis confirms the insights of the gravity regressions.
Preferred average treatment effect estimates reveal that decreased labor market
openness, due to the fall in the H-1B cap, lowered international enrollment by 10%.
Inspection of pre-trends verifies that the triple difference strategy effectively mitigates
differential trends between treated and control countries. The triple difference results
are usually significant at the 5% level, with p-values ranging between 0.039 and 0.07,
even after including various controls and country trends.
The impact of labor market openness on international enrollment may occur through
several mechanisms. Decreased openness may be perceived as a signal of a less friendly
6
climate, thereby discouraging foreign citizens to study abroad. Alternatively,
contractions in H-1B policy may weaken networks of information as fewer H-1B workers
arrive and inform college age relatives and friends at home about opportunities in the
US. Finally, decreases in labor market openness may lower the anticipated return to
studying in the US, as international students reduce their expectations of finding
employment and earning US wages after graduating.
Analysis of possible mechanisms finds support for the latter explanation—students
respond to labor market openness due to changes in anticipated net returns to studying
in the US. Stratified triple difference regressions confirm that the fall in the H-1B cap
had stronger effects on students from countries with large expected returns from
attending college in the US. Countries with the highest expected returns experienced a
16% decline in enrollment, while countries with lowest returns only saw enrollment
decline by a statistically insignificant 5%.
The next section examines the close links between international students and the H1B program to provide descriptive support for the notion that H-1B policies may impact
foreign enrollment. Section 3 describes the data and presents the empirical analysis
using gravity regressions. Triple difference analysis on the reduction in the H-1B cap are
presented in section 4. Section 5 concludes.
2
International Students and the H-1B Visa Program
US high skill immigration policy maintains an unusually dichotomous set of
regulations. Since the exemption of foreign students from national origins quotas in
7
1924, legislators have maintained an open door for international students to enter
US colleges and universities. 6 In contrast, high skill immigrant labor has typically
been tightly controlled by the H-1B visa program, which restricts entry through a
yearly cap set by congress. Since October 2003 the cap has been set at 65,000 H-1B
visas per year. While the political stances towards these two programs have been
rather different, the programs themselves have become closely intertwined.
The nexus between foreign students and the H-1B program arises rather
organically. The foreign students of today are often the high skill immigrants of
tomorrow, and as such, require an H-1B visa after graduation. Additionally, the
link between foreign students and the H-1B program also manifests in legislation.
Currently, an extra 20,000 H-1B visas each year are reserved for foreign students
who graduate from US universities with advanced degrees (i.e. master’s degree or
higher). Additionally, since 2000 US higher education and non-profit institutions
wishing to hire foreign skilled workers were exempt from H-1B limits, creating an
open pathway for foreign master’s and Ph.D. students to find academic and
research-based employment.
Because these programs are closely connected, it is not surprising that they
tend to attract similar types of individuals from abroad. Large portions of H-1B
workers and foreign students are engaged in STEM fields. Roughly 30% of all
international students earning bachelor’s degrees from 2003-2012 majored in a
6
While there has not been a cap on student visas since 1924, there have been various policies that have restricted entry. For
example, post 9/11 policies increased screening of student visa applicants, leading to longer wait times for visas. See Walfish (2002),
Alberts (2007), and Urias & Yeakey (2009) for further background.
8
STEM discipline (figure 2, left panel). That percentage is even larger at higher
academic levels. Over 40% of all foreign masters’ degrees recipients, and between
60-70% of doctoral recipients graduated with a STEM degree. In comparison, the
percent of H-1B recipients in STEM occupations has climbed from 48% to 75%
over the 2003-2012 period (figure 2, right panel).
Additionally, foreign students and H-1B recipients are also similar in terms of
where they come from. Figure 3 plots the distribution of foreign students (left
panel) and H-1B recipients (right panel) across the 13 countries that appear among
the 20 largest in both international enrollment and H-1B visa issuance in 2012. All
other countries are combined in the “Other” category. Asian countries comprise the
large majority of both international students and H-1B immigrants. The H-1B
program is unique, however, in that one country (India) far dominates all others,
while international students are more evenly distributed across Asian nations.
China is the largest country group in terms of international enrollment, followed by
India as a close second.
Despite starkly different policies towards international students and high skill
foreign labor, the types of students and workers that ultimately arrive in the US
appear rather similar. H-1B workers and international students tend to gravitate
towards STEM fields and are predominantly selected from Asia. These descriptive
statistics, therefore, provide support to the notion that H-1B policies that alter
labor market openness may have consequences for international students. With
9
these facts in mind, the next section turns to gravity regression analysis to examine
the role between H-1B visa issuance and foreign enrollment.
3
Data and Empirical Analysis
Does labor market openness, as regulated by the H-1B visa program, attract
international students to the US? One way to approach this question would be to
measure how closely international enrollment from a country varies with that country’s
usage of the H-1B program. Prior research has adopted a similar approach, utilizing
gravity regressions, to examine the association between international enrollment and
various economic factors, such as GDP, exchange rates, and bilateral trade, (e.g.
McMahon 1992, Rosenzweig 2006, Liu & Wang 2009, Jena & Reilly 2013, Bird &
Turner 2014).7 Using this framework I introduce a measure of the H-1B program, which
controls labor market openness, as another possible determinant. I then include
previously considered determinants in regressions to see if the relationship between H1B visas and foreign enrollment remains.
The analysis uses the following general gravity regression model,
log(
In specification 1,
)=
+
) + log(
log( 1
)+
+
+
(1)
represents the total number of international students from country
enrolled in US universities in year . The number of H-1B visas issued in a given year
to each country is denoted by
1 . Because many foreign students end up transferring
7
The gravity method is also popularly used in related literature that attempts to identify determinants of international migration
(e.g. Clark et al. 2007, Mayda 2010, Ortega & Peri 2013, 2014).
10
to an H-1B visa in each year, I use H-1B issuances lagged one year ( 1
) to help
break this mechanical correlation. The key coefficient, , measures the strength of the
relationship between foreign enrollments and H-1B visa issuances.
Importantly, H-1B visa issuance is an imperfect measure of labor market openness,
since, for example, changes in H-1B usage could be entirely driven by US labor demand
or foreign labor supply and therefore not representative of policy openness. Therefore,
the model includes a vector of control variables,
. Importantly, to account for
changes in labor supply or demand conditions in the sending country that push students
abroad I include measures of home country push factors, such as the college age
population, employment, and GDP per capita. To account for changes in US economic
conditions that attract students from abroad, I include a proxy for foreign students’
expected earnings from studying in the US: the average wages of college educated
immigrants in the United States by country of origin. Additionally, I include imports,
exports, and exchange rates to measure the strength of ties between foreign countries
and the US, which may affect the extent of educational exchange. These controls appear
in various prior studies, and thus allow the results from this analysis to be compared to
previous findings.
Finally, specification 1 also includes country-fixed effects ( ) to absorb timeinvariant country-specific factors that may influence both international enrollment and
H-1B issuances, such as distance, culture, and language. The inclusion of year dummies
( ) helps account for global trends, such as rising worldwide GDP which might
simultaneously increase the attractiveness of alternative study abroad destinations. The
11
identifying variation, therefore, comes from changes in H-1B visa issuance within
countries and over time. As such, this methodology will be particularly vulnerable to
other omitted factors that vary within countries over time. For example, multilateral
factors, such as changes in the relationship between China and Canada, another popular
destination for foreign students, may bias results if such changes are correlated with
China-US relations (Bertoli & Moraga 2013).8
3.1 Data
The principal source of data on international student enrollment in the US comes
from the Institute of International Education (IIE).9 I compile undergraduate and
graduate fall term enrollment counts by country of origin for the academic years 19981999 through 2010-2011 (e.g. Fall 1998 for the 1998-1999 academic year) from Open
Doors reports (Open Doors 2012). I collect the count of H-1B visas issued by country
over the same period from the US Department of State (Department of State 2012).
Data for control variables come from a variety of sources. Real GDP per capita by
country is calculated by dividing real GDP by population, from the Penn World Tables
(Feenstra et al. 2013). Specifically, I use expenditures-side real GDP, which better
captures real living standards and is more suitable for analysis across countries and over
time.10 While increases in real GDP may reflect rising wages/demand conditions in the
8
Note that some multilateral factors, which Bertoli & Moraga (2013) label “multilateral resistance to migration”, will be accounted
for when using time dummies. Only bilateral or “dyad” factors will be unaccounted for in the gravity approach.
9 The IIE was founded in 1919 and has published yearly statistics of international students in US higher education in volumes called
“Open Doors” since 1954. For more information see http://www.iie.org/Research-and-Publications/Open-Doors.
10 Expenditure-side real GDP is calculated at chained Purchasing Power Parities (PPPs), to compare relative living standards across
countries and over time. Using PPPs adjustments are important to capture the real costs of living which differ across countries. See
Feenstra et al. (2013) for detailed description of this variable.
12
home country, and hence increasing opportunity costs of studying in the US, they might
also represent rising income which could enable more students to afford studying in the
US.
Exchange rates, denominated in home currency per USD, also come from the Penn
World Tables. Holding other prices constant, fluctuations in exchange rates should raise
or lower the cost of attending college in the US.11 For example, an appreciation in the
Euro/USD exchange rate raises the cost of attending college in the US for European
students. Thus, exchange rates should be negatively correlated with foreign student
enrollment.
As the focus of this analysis is on the quantity of foreign students, it is important to
control for demographic shifts in sending countries that might affect the number of
internationally mobile workers and students (Liu & Wang 2009; Bird & Turner 2014).
All else equal, a country that experiences a particularly large birth cohort will
mechanically have a larger number of individuals from that cohort applying and
attending college. It is likely that some of this excess demand for higher education spills
over to the US. To account for demographics I gather data on the population of tertiary
education age (i.e. college age) individuals by sending country from UNESCOs Institute
for Statistics.12
Trade linkages between countries may foster other types of interaction, including
educational or labor exchange (McMahon 1992). I compile bilateral import and export
11
These costs may include tuition, living costs, transportation costs, and application fees.
Tertiary age differs depending on the country, but generally cover individuals aged 18-30 who attend educational levels from
undergraduate to graduate education in the US. See http://www.uis.unesco.org/Education/Pages/international-standardclassification-of-education.aspx for more information.
12
13
values by Harmonized System (HS) code, US state, and partner country from US census
data.13 These data are aggregated across states and HS codes to obtain total values of
imports and exports between the US and each sending country.
Finally, to proxy for US demand conditions I construct a measure of the expected
US wage for students from each sending country by calculating the average annual wage
of immigrants aged 25-40 with a bachelor’s degree or higher by country of origin from
the 2000 US Census and the 2001-2010 American Community Surveys.14 Average wages
are expressed in constant 2010 dollars and are only available for only 92 countries.
The resulting dataset comprises a panel of 140 countries from 1998-2010.15 All
variables are expressed in natural logarithms (logs) to mitigate the effect of scale bias. A
very small number of country-year observations contain zeroes, in either foreign
enrollment or H-1B visa issuance. Thus I use a standard transformation, adding 1 to
these variables, to allow logs to be taken.16 Because variables are specified in logs, the
key coefficient ( ) identifies the elasticity of international enrollment to lagged H-1B
visa issuances. All specifications include country fixed effects and year effects. Standard
errors are clustered at the country level to mitigate serial correlation in residuals.
13
These data were kindly made publicly available by Peter Schott See Schott (2008) for more details.
Immigrants are defined as individuals not born in the US and who are not born abroad to US citizen parents. The sample is
limited to immigrants who worked a positive number of weeks in the previous year, reported earning positive wage/salary income,
and have a bachelor’s degree or higher. Unfortunately, no surveys are available in 1998 or 1999 that provide enough observations to
accurately estimate average wages of immigrants by country of origin.
15 I drop one outlier country—Iraq—from the analysis, as it was one of the countries that was most largely affected by post 9/11
security measures, and thus saw huge declines in international students and H-1B visas.
16 Thus, the dependent variable is log(1 +
), and the H-1B measure is log(1 + 1
). Results are very similar when dropping
countries with zeroes from the panel, and are available upon request.
14
14
3.2 Empirical Analysis
Table 1 presents regression results of specification 1 on 140 countries from 1998-2010.
The specification used in column 1 regresses total international enrollment on 1-year
lags of H-1B visa issuance, controlling for country fixed effects and year effects. Column
2 adds home country push factors—GDP per capita, college age population, and
employment—as controls. Column 3 further includes exchange rates, imports, and
exports to account for economic ties with the US. Column 4 adds the measure of
expected US wages to control for US pull factors.17
A strong and significant association between H-1B visa issuance and international
enrollment is apparent in columns 1-4. Estimates range between 0.16 and 0.20, and are
significant at the 1% level in all specifications. Taken literally, the estimate in column 4
implies that a 1% rise in H-1B visa issuance to a country leads to a 0.2% increase in
international enrollment in the following year.
Aggregating over all foreign students in higher education could mask different
responses to H-1B issuances. For example, undergraduate students might be myopic in
deciding where to go to college, and place a small weight on labor market openness. In
contrast, graduate students may be more concerned with the labor market openness of
the destination country. Columns 5 and 6 of table 1 separately examine the relationship
for foreign undergraduate and graduate students. The results show positive, similarly-
17
Notice the drop in sample size when adding expected US college wages. This is due to the fact that wages are only available for 92
countries and only from 2000-2010.
15
sized, and statistically significant relationships for both undergraduate and graduate
students, suggesting evidence against differential responses.
Further, notice that among all control variables only college age population appears
to have a consistently positive and significant association across the specifications.
While the important relationship between demographics and international enrollment is
not a new finding, it is interesting to see that it still remains when including H-1B visa
issuance. The coefficients on college age population in columns 2-6 are always
statistically significant, at least at the 10% level, and range between 0.50 and 0.89—on
par with prior studies by Rosenzweig (2006) and Bird & Turner (2014).
Surprisingly, the other control variables that account for home country push factors,
US pull factors, or bilateral linkages seem to have little association. This contrasts
markedly with results from prior work using nearly identical regression frameworks. Bird
& Turner (2014) find a significant positive association between foreign undergraduate
enrollment and both GDP per capita and exchange rates (denominated in home
currency per USD), with coefficients ranging between 0.6 to 0.7 and 0.3 to 1.2,
respectively. Rosenzweig (2006) finds positive and significant coefficients on GDP per
capita (estimates between 0.6-0.7), while Jena & Reilly (2013) find significant negative
relationships between exchange rates and international students in the United Kingdom
(estimates range from -0.7 to -1.6).18 This analysis has shown that H-1B visa issuance
18
In highly related work, Grogger & Hanson (2013) find that home country GDP decreases the proportion of international PhD
students who stay in the US after graduating, while US GDP increases that proportion.
16
has a very strong relationship with foreign enrollment, and reduces the significant effects
on other potential factors when included in gravity regressions.
3.3 Timing of H-1B Effect
Do international students only respond to 1-year lags of H-1B issuance? The
analysis thus far has used 1-year lags of H-1B issuance to mitigate a mechanical
correlation that arises because each year a portion of students that are enrolled will
graduate and receive H-1B visas to work in the US. If students are highly forwardlooking, H-1B admissions levels measured before students are college-eligible may
be the relevant signal. Alternatively, because college takes time to complete,
students enrolled today may respond more to future admissions levels (Ryoo and
Rosen 2004). However, using future H-1B admissions levels may lead to upward
biased estimates because of the additional mechanical correlation described earlier.
Table 2 analyzes the timing of the relationship by varying H-1B issuances from
3 year lags to 3 year leads. The coefficient on the H-1B variable is displayed for
total international enrollment (row 1), undergraduates (row 2), and graduate
students (row 3). All specifications are identical to column 4 of table 1—they
include all controls, country fixed effects and year dummies. The estimates in
column 3 of table 2 uses 1-year lags of H-1B visas and thus is identical to the row
1 estimates in columns 4-6 of table 1.
Notice first that all results, except for row 1 column 1, are positive and always
statistically significant at the 5% level, and at the 1% level in the majority of
17
cases. 19 Additionally, the size of the point estimates increase when moving from 3
year lags to 3 year leads. The estimates in column 1 suggests that international
students respond to H-1B issuance even 3 years prior. The estimate grows larger as
the specifications use successively shorter lags. Coefficients continue to grow when
using contemporaneous H-1B issuance and even leads of the H-1B variable. The
fact that point estimates continue to grow when using leads is consistent with the
problem of upward bias due to mechanical correlation from foreign students
transferring to H-1B status after graduating.
3.4 Robustness
Gravity regressions of specification 1 are particularly vulnerable to threats from
omitted variables that vary within countries and over time. To partially assess the
extent of this bias, I implement a robustness check that includes country-specific linear
trends, which absorb factors that evolve linearly within countries. Identification is
driven by deviations in H-1B issuance from country trends over time.20
Columns 1-3 of table 3 displays the results when including country-specific trends.
The specifications also include all control variables, year dummies, and country fixed
effects. Column 1 uses total enrollment as the dependent variable, while columns 2 and
3 repeat this check for undergraduates and graduate students, respectively. Estimated
19
The estimate using 3-year lags on total enrollment is not statistically significant, while the estimates for graduate and
undergraduate enrollment are statistically significant. This is likely due to measurement error when using total foreign enrollment
since survey respondents first report total enrollment and then report enrollment by academic level, which includes graduate
students, undergraduates, non-degree students, etc. Respondents use a residual “unknown” group that allows the sum across
academic levels to equal the reported total enrollment. Thus, total enrollment may be measured with greater error than
undergraduate and graduate enrollments.
20 Note that this specification is more demanding than those used in prior studies, which at most control for year dummies and
country fixed effects. Additionally, results are robust to checks that drop the largest sending nations (China and India) from the
analysis. These are available from the author upon request.
18
coefficients on H-1B issuance are around 0.10 when controlling for country-specific
trends, slightly lower than the point estimates without country trends in table 1, which
range from 0.16-0.20. The decrease in the point estimate suggests that country-trends do
account for some endogenous variation coming through linearly-evolving omitted factors.
Importantly, the positive result remains statistically significant at the 1% level.
Although the positive and statistically significant relationship between international
enrollment and H-1B visas issuances is compelling, the empirical designs presented thus
far are not without flaws. Many omitted factors, including multilateral factors (Bertoli
& Moraga 2013), may bias the results. Crucially, the findings should be interpreted as
strong associations rather than causal estimates. To better identify the causal impacts of
labor market openness, I focus on a natural experiment that occurred in October 2003—
the H-1B visa cap fell from 195,000 to 65,000, drastically reducing access to the US
labor market. The next section analyzes this reduction in H-1B visas and estimates the
impact on foreign enrollment.
4
The H-1B Policy Experiment
The H-1B program began in 1990 with a congressionally mandated cap of
65,000 visas per year. Since then the program has undergone various reforms,
which have both restricted and relaxed entry. One such reform led to a fall in the
cap in October 2003, providing a very good natural experiment to evaluate the
impact of reduced labor market openness on foreign enrollment.
19
During the late 1990’s legislation increased the cap from its original level of
65,000. The passage of the American Competitiveness and Workforce Improvement
Act (ACWIA) in October 1998 raised the cap from 65,000 to 115,000 for fiscal
years (FY) 1999 and 2000, and to 107,000 for FY 2001. These increases were
temporary, however, as the act stated the cap would return to the original level of
65,000 for FY2002. The passage of the American Competitiveness in the 21st
Century Act (AC21) in October 2000, however, extended this rising trend of
openness, superseding ACWIA and further expanding the H-1B visa cap to 195,000
for FY 2001-2003. Again the increased cap was temporary—as written in AC21, the
H-1B cap would return to 65,000 beginning in FY 2004 without further acts by
Congress.
By October 2003 (the start of FY 2004) Congress failed to introduce new
legislation that would extend the raised caps from AC21, as they did in October
2000 before the raised caps under ACWIA expired. The H-1B cap fell from 195,000
to 65,000, marking a dramatic decrease in labor market access for foreign students
enrolling in the following academic year (i.e. September 2004 - June 2005). It is
unlikely (and later I show it not to be the case) that students reacted in
anticipation of the expiration of the cap. The rising trend in openness and the
previous extension and expansion of the H-1B caps set under ACWIA created
uncertainty about whether the cap would actually fall or be extended again.
Interestingly, however, the fall in the cap in October 2003 did not necessarily
signal lower labor market access to all students. By October 2003, four countries—
20
Canada, Chile, Mexico, and Singapore—had signed trade agreements which
included alternative visas for their skilled citizens to work in the US. In May 2005,
the passage of a preferential trade agreement also created an alternative work visa
for highly educated Australian nationals.21 The availability of alternatives to the
H-1B visa under these trade agreements proved crucial after the cap fell in 2004.
As shown in figure 4, as the H-1B cap fell, these countries began substituting into
the other visas. Notice the timing of substitution for Australia, which does not
occur until the trade agreement was signed 2005, suggesting Australian students in
2004 were likely affected by the decreased H-1B caps. Overall, while prospective
foreign students from most nations experienced a dramatic restriction in access to
the US labor market (treated countries), students from countries with alternative
visas (control countries) did not.
Kato & Sparber (2013) utilizes a difference-in-differences design to compare
changes in SAT scores from applicants of treated countries against control
countries. Importantly, this difference-in-differences estimator hinges on the
assumptions of parallel trends—foreign enrollment from treated and control
countries would have evolved identically in absence of treatment. Replicating this
strategy to examine effects on international student quantity is worrisome since
differential trends in enrollment behavior across treated and control countries may
21
These various trade agreements created alternative visas which were very similar to the H-1B visa. TN visas were created in 1994
under the North American Free Trade agreement for citizens of Canada and Mexico. The H-1B1 visa program was enacted in
September 2003 for citizens of Chile, and Singapore. Lastly, in May 2005 a bill was enacted establishing E-3 visas for Australian
citizens. For further details regarding these policy changes see Kato & Sparber (2013).
21
exist. Additionally, having only 5 control countries raises the concern of whether
the small control group yields sufficient power to detect meaningful effects.
Interestingly, however, two other features of H-1B reforms provide a way
around the restrictive assumption of parallel trends. First, in addition to raising
the H-1B cap, AC21 also exempted foreign highly educated individuals hired by
non-profit organizations and universities from counting against the cap. Second,
the H-1B Reform Act of 2004 mandated that beginning in FY 2005 an additional
20,000 H-1B visas per year, not counted toward the cap of 65,000, was to be
reserved for individuals that earned graduate degrees from US colleges and
universities. Together this meant that the October 2003 fall in the cap reduced
labor market access for foreign undergraduates much more than for foreign
graduate students. Thus, comparing the enrollment behavior of foreign
undergraduates relative to graduate students adds another dimension of plausibly
exogenous variation to identify the causal impact of H-1B policy on foreign
enrollment.
I utilize a differences-in-differences-in-differences (
or triple difference)
regression framework to estimate the causal impact of the H-1B visa policy on
international student enrollment. IIE data provides foreign student enrollment
counts by academic level and country of origin. Under this design Canada, Mexico,
Australia, Chile, and Singapore—countries with alternatives to the H-1B—are
considered control countries, whereas all others are considered treated countries.
22
Undergraduates are considered treated students, while graduates are considered
control students.
I focus on the sample of 92 countries for which all control variables used in the
gravity regression analyses of section 3.2 are available. I center the analysis on
enrollments over the 7 year window from fall 2001 - fall 2007, which remained
relatively free from other H-1B related policy reforms that might otherwise
confound treatment effects.22 Pre- and post-treatment periods cover fall 2001 - fall
2003 and fall 2005 - fall 2007, respectively. I remove fall 2004 from the analysis as
the extra 20,000 visas for graduate students was not enacted until December 2004.
This demarcation will introduce a slight bias towards finding no effect as Australia,
denominated as a control country throughout the sample, did not have an
alternative to the H-1B until December 2005—students from Australia enrolling in
fall 2004 were actually treated.23 Robustness checks correct for this issue by
dropping both fall 2004 and fall 2005 from the analysis.
Importantly, this methodology overcomes the concern of parallel trends because
it requires a much weaker assumption: no other coincident factors differentially
affected undergraduates from treated countries. Graduate students, who are less
restricted by the fall in the H-1B cap, proxy for how undergraduate enrollment
would have trended in the absence of treatment. Thus, differential trends should be
22
For example, including fall 2000 might confound estimates because AC21, which raised the H-1B visa cap, was passed between fall
2000 and fall 2001. Similarly, including fall 2008 would be worrisome since an interim final rule was passed in April 2008 that
extended the period of Optional Practical Training to 17 months for F-1 students pursuing STEM degrees.
23 The bias towards zero arises since we would be comparing enrollments from treated countries to those from a control country that
is actually treated in two years of the post period (fall 2004 and fall 2005). To the extent treatment effects are identical across
countries, this will induce a bias towards 0.
23
differenced out when comparing the evolution of undergraduate and graduate
enrollment, across treated and control countries. Empirically, the triple difference
estimator also removes differential trends across academic levels. Furthermore, this
strategy allows for visual inspection of whether differential trends are in fact
removed—there should not be any apparent pre-trends between treated and control
countries, when plotting differences in enrollment between foreign undergraduates
and graduate students.
The removal of differential trends across treatment and control countries can be
more clearly seen in figure 5, which plots differences in log enrollment between
undergraduates and graduates, separately for treated and control countries. The
horizontal axis indicates time, in years, relative to the October 2003 reform. Fall
2003 is coded as 0 years relative to the October 2003 reform, fall 2004 is 1 year
after the reform, etc. As can be seen, after differencing across academic levels there
is no evident pre-trend in enrollments across the two types of countries.
Furthermore, notice that the drop in undergraduate enrollment only occurs after
treatment. This shows that students did not respond in anticipation of the cap
expiring. It is likely that the rising trend of openness and the previous passage of
AC21 which extended ACWIA created uncertainty over whether the cap would
actually fall. 24 Given that the triple difference methodology appears to effectively
remove problematic differential trends, the next section presents the findings.
24
Note that graduate enrollments appear to fall slightly in treated countries relative to control countries after the drop in the cap.
This may perhaps be due to an overall downward trend in international entry to the US after post-9/11 security measures came into
effect. The triple difference estimator is still valid so long as the extent 9/11 policies did not differentially affect undergraduates in
treated countries.
24
4.1 Comparison of means
The top panel of table 4 shows a simple comparison of average log undergraduate
enrollment for treatment and control countries, before and after the October 2003 fall in
the cap. The panel is divided into four cells by time (pre-treatment vs. post-treatment)
and country (treated vs. control). Standard errors, shown below the means in
parenthesis, are clustered at the country level.
Average undergraduate enrollment fell by 7% for control countries, while falling
18.4% for treated countries. Thus, enrollment declined in treatment countries relative to
control countries by 11.5%. This is equivalent to the difference-in-difference estimate
only comparing changes between treated and control countries for undergraduates
(
).25 The validity of this difference-in-difference estimate requires that
undergraduate enrollment in treatment and control countries would have trended
similarly if the fall in the H-1B cap never occurred.
As stated earlier, by October 2003 several reforms had created alternative pathways
for graduate students to gain access to the US labor market. Thus, the behavior of
graduate students between treated and control countries should serve as a
counterfactual for what would have happened to undergraduate enrollments in the
absence of treatment. The bottom panel of table 4 shows similar mean comparisons of
log graduate enrollment. The simple differences in means show that graduate enrollment
declined by a statistically insignificant 3.5% for control countries, while declining by 5%
in treated countries. Thus, the difference-in-difference estimate comparing treated to
25
, stands for Treated Students.
, stands for Control Students.
25
control countries for only graduate students (
) suggests that the drop in the H-1B
visa cap decreased enrollment by 1.5%. However, the
estimate is statistically
indistinguishable from zero.
The triple difference (
) estimates are provided in the final row of table 4. The
estimate shows that the fall in the H-1B cap led to a 10% decline in international
enrollment in the US. This estimate is statistically significant at the 5% level, with a pvalue of 0.039. Importantly, the three-tiered differencing (pre vs. post, treated country
vs. control country, and treated students vs. control students) removes trends withincountry and within-academic level. The validity of the
estimate requires that there
were no other shocks that coincided with the fall in the H-1B cap and also differentially
affected undergraduates in treated countries.
4.2 Robustness
Table 5 displays results from robustness checks that estimate the triple-difference in
a regression framework using the following specification:
log(
) = +
+
+
(
+
×
+
) +
( ×
( ×
)+
×
( ×
) + log(
(2)
)
) +
The dependent variable in specification 2 represents log enrollment, which varies by
academic level ( ), country ( ) and year ( ). I control for academic level, country, and
year effects ( ,
, and
, respectively) and all two-way interactions of
equal to 1 for all years after the drop in the H-1B cap),
26
(a dummy
(a dummy equal to 1 for
treated countries), and
(a dummy equal to 1 for treated students—i.e.
undergraduates). The coefficient on the triple interaction,
To explore the robustness of
, I include various controls (
, gives the
estimate.
) representing other
potential determinants of foreign enrollment, which come from the analysis under
section 3.2.
The first row of table 5 reports coefficient estimates of
from specification 2. Each
column subsequently adds more controls. Column 1 replicates the triple difference
estimate in the last row of table 4. Column 2 controls for population, employment, and
real GDP per capita in sending countries. Because the control countries obtained
alternatives to the H-1B visa through preferential trade agreements, it is crucial to
control for trade flows to isolate the effect of a change in H-1B cap, above and beyond
any changes in trade policies with the US. Column 3 performs this check by adding
imports and exports. Additionally, column 3 also includes bilateral exchange rates.
Column 4 further adds the expected US college wage. Column 5 performs a highly
demanding specification which includes all controls in column 4 and adds countryspecific linear time trends. Note that the inclusion of these controls hardly affects the
estimate, which remains statistically significant at the 5% level, with p-values
ranging between 0.039 and 0.049.
As a last check, column 6 also drops fall 2005 from the analysis. Recall that
Australia, though labeled a control country in regressions, was actually treated in fall
2004 and fall 2005. Australia only obtained an alternative to H-1B visas in December
2005, after students had already enrolled for the fall 2005 term. Therefore in fall 2004
27
and fall 2005, students from Australia perceived a large drop in access to the US labor
market, which was only alleviated for students enrolling in fall 2006. As stated earlier,
miscategorizing Australia as a control country in fall 2005 should bias the
estimate
towards zero. This is confirmed in column 6, which removes fall 2005 from the analysis
entirely. The point estimate is slightly more negative than in all other specifications
which retain fall 2005. However, the extent of this bias is small as the coefficient only
changes by 0.03 log points.
Overall the triple difference estimates show that the fall in the H-1B cap reduced
international enrollment by 10%. Furthermore, this finding is very robust and stable to
the inclusion of various controls. This result confirms the positive association uncovered
in the gravity regressions in section 3.2 and indicates that labor market openness is a
strong and important determinant of international enrollment.
4.3 Mechanisms
Why does H-1B policy, and hence labor market openness, affect international
enrollment? There are several plausible mechanisms through which this
relationship may arise. For example, international enrollment may increase with
expanded labor market openness if high skill immigrant workers transmit crucial
information about educational opportunities to home countries. Such backward
linkages could foster educational exchange as young relatives and friends of H-1B
workers learn more about opportunities at American universities. Alternatively, the
cultural climate of destination countries may be an important factor for foreign
students. Increases in H-1B policy may signal a broader openness and warming to
28
foreign students, which would encourage individuals from abroad to apply and
enroll in US universities.
An altogether different explanation is that foreign students weigh the net return
to studying in the US against studying at home (or another destination). Increases
in labor market openness may raise the anticipated return to studying in the
states, because it also raises the probability of finding a job and earning a US wage
after graduating. As the expected return to studying in the US rises relative to
staying at home, more students enroll in American colleges and universities.
To test whether this latter mechanism prevails, I create measures of expected
returns to studying in the US and studying at home. The expected earnings
variable used as a control in earlier gravity regressions—i.e. average wages of
college educated immigrants from each country of origin—proxies for the return to
studying in the US. To proxy for the return to staying at home, I use average
income per worker (GDP per capita). Skilled wages in each of the countries are not
readily available, so instead home country GDP serves as a rough proxy.
For each country I use these two measures to construct the relative return—log
expected US wages minus log home country GDP. Treatment countries are then
divided into terciles based on the distribution of this relative return. The triple
difference regressions are separately estimated for each tercile of the distribution of
relative returns using the same specification as in column 4 of table 5.
The results of this exercise is shown in table 6. Column 1 shows results for the
first tercile (countries with very small relative returns), column 2 for the second
29
tercile (countries with moderate returns), and column 3 for the third tercile
(countries with large returns). The negative impact of the fall in the H-1B cap is
largest in the third tercile—those countries with the most to gain from studying in
the US. Reducing labor market access by decreasing the number of available visas
lowers the expected return from studying in the US. In contrast, students in the 1st
and 2nd tercile of relative returns have smaller effects which are statistically
insignificant.
Interestingly, the results from this exercise also reveal that the impact of H-1B
policy on foreign students appears heterogeneous across countries depending on the
expected return to studying in the states relative to remaining at home. This is a
crucial finding for both educators and policy makers. Shocks that affect labor
market openness will likely have disproportionate impacts on students who have
more to gain by studying in the US.
5
Conclusion
This paper provides an empirical analysis of the effect of labor market openness on
the quantity of international students in the US. In the US, labor market access for
college educated foreign workers is largely controlled by the H-1B visa program. Gravity
regressions on country-level panel data reveal that H-1B visa issuances have a strong
positive association with international enrollment, even after controlling for other
possible factors including exchange rates, trade, home country population, and expected
US college wages.
30
While such correlations are enlightening, I estimate causal effects by focusing on a
large reduction in the H-1B visa cap (from 195,000 to 65,000 per year) that occurred in
October 2003. Importantly, this reform created a natural experiment that restricted
labor market access to some countries, but not others. Additionally, access was
restricted only for some students (undergraduates), but not others (graduate students). I
utilize a triple difference framework to evaluate the fall in the H-1B cap, comparing
differences across treated and control countries, for graduate and undergraduate
enrollment.
Triple difference estimates reveal that the fall in the H-1B cap reduced international
enrollment by 10%. Importantly, these reductions appear to be driven by the fact that
lower labor market openness reduces the expected return to studying in the US.
Students from countries with larger expected returns appear to respond more strongly
than students from countries with little or nothing to gain by studying in the US.
Understanding the determinants of international enrollment in the US is an
important agenda. It is worth reiterating that the focus of this paper has been on the
quantity of foreign students in the US and the economic forces that lead to changes in
scale. Jointly understanding adjustments that take place on both the quality and
quantity margins are important to elucidate how various international economic factors
influence US higher education. Additionally, future work that identifies how such factors
affect the mix of foreign students across different fields of study will also be useful for
education administrators and policymakers alike.
31
References
[1] Alberts, H. C. (2007). “Beyond the headlines: changing patterns in international
student enrollment in the United States”, GeoJournal, 68(2-3), 141-153.
[2] Bertoli, S., & Moraga, J. F. H. (2013). “Multilateral resistance to migration”,
Journal of Development Economics, 102, 79-100.
[3] Bird, K. & Turner, S. (2014). “College in the States: Foreign Student Demand and
Higher Education Supply in the US” Working paper. Curry School of Education,
University of Virginia. http://curry.virginia.edu/resource-library/working-paperforeign-student-demand
[4] Black, G., & Stephan, P. (2007). “The importance of foreign Ph.D. students to US
science”, Science and the University, 113-133.
[5] Borjas, G. J. (2004). “Do foreign students crowd out native students from graduate
programs?” (No. w10349). National Bureau of Economic Research.
[6] Borjas, G. J. (2009). “Immigration in High-Skill Labor Markets: The Impact of
Foreign Students on the Earnings of Doctorates”, In Science and Engineering
Careers in the United States: An Analysis of Markets and Employment (pp. 131161). University of Chicago Press.
[7] Brezis, E. S., & Soueri, A. (2013). “Mobility of students and quality of higher
education: An empirical analysis of the ‘Unified Brain Drain’ model”, (No. 2013-11).
Working Papers, Bar-Ilan University, Department of Economics.
[8] Chellaraj, G., Maskus, K. E., & Mattoo, A. (2008). “The contribution of
international graduate students to US innovation”, Review of International
Economics, 16(3), 444-462.
[9] Clark, X., Hatton, T. J., & Williamson, J. G. (2007). “Explaining US immigration,
1971-1998”, The Review of Economics and Statistics, 89(2), 359-373.
[10] Department of State (2012). Nonimmigrant Visa Statistics FY1997-2012,
Nonimmigrant visa issuances by visa class and by nationality. Retrieved from:
http://travel.state.gov/content/visas/english/law-and-policy/statistics/nonimmigrant-visas.html
[11] Feenstra, R. C., Inklaar, R., & Timmer, M. P. (2013). “The Next Generation of the
Penn World Table”, (No. w19255). National Bureau of Economic Research.
[12] González, C. R., Mesanza, R. B., & Mariel, P. (2011). “The determinants of
international student mobility flows: an empirical study on the Erasmus
programme”, Higher Education, 62(4), 413-430.
32
[13] Grogger, J., & Hanson, G. H. (2013). “Attracting talent: Location choices of foreignborn PhDs in the US”, (No. w18780). National Bureau of Economic Research.
[14] Hoxby, C. M. (1998). “Do immigrants crowd disadvantaged American natives out of
higher education?”, Help or Hindrance, 282-321.
[15] Hunt, J. (2012). “The impact of immigration on the educational attainment of
natives”, (No. w18047). National Bureau of Economic Research.
[16] Jackson, O. (2014). “Does immigration crowd natives into or out of higher
education?”, Unpublished working paper.
[17] Jena, F., & Reilly, B. (2013). “The determinants of United Kingdom student visa
demand from developing countries”, IZA Journal of Labor & Development, 2(1), 122.
[18] Kato, T., & Sparber, C. (2013). “Quotas and Quality: The Effect of H-1B Visa
Restrictions on the Pool of Prospective Undergraduate Students from Abroad”, The
Review of Economics and Statistics, 95(1), 109-126.
[19] Kerr, W.R., & Lincoln, W.F. (2010). “The Supply Side of Innovation: H-1B Visa
Reforms and US Ethnic Invention,” Journal of Labor Economics, 28(3), 473-508.
[20] Liu, D., & Wang, J. (2009). “The determinants of international student mobility:
An empirical study on US Data”, Unpublished manuscript.
[21] Mayda, A. M. (2010). “International migration: A panel data analysis of the
determinants of bilateral flows”, Journal of Population Economics, 23(4), 1249-1274.
[22] McMahon, M. E. (1992). “Higher education in a world market”, Higher Education,
24(4), 465-482.
[23] Naidoo, V. (2007). “Research on the flow of international students to UK
universities: determinants and implications”, Journal of Research in International
Education, 6(3), 287-307.
[24] Open Doors (2012). “Open Doors: Report on International Educational Exchange”
Institute of International Education, New York, NY. Multiple Years. Data available
online: http://www.iie.org/Research-and-Publications/Open-Doors/Data.
[25] Ortega, F. and Peri, G. (2013). “The role of income and immigration policies on
international migrations”, Migration Studies, 1(1), 47-74.
[26] Ortega, F. and Peri, G. (2014). “Openness and income: The roles of trade and
migration”, Journal of International Economics, 92(2), 231-251.
[27] Peri, G., Shih, K. Y., & Sparber, C. (2014). “Foreign STEM workers and native
wages and employment in US cities”, (No. w20093). National Bureau of Economic
Research.
33
[28] Rosenzweig, M. R. (2006). “Global Wage Differences and International Student
Flows”, In Brookings Trade Forum (Vol. 2006, No. 1, pp. 57-86). Brookings
Institution Press.
[29] Ruiz, N. G. (2013). “Immigration Facts on Foreign Students”, Brookings Institution.
[30] Ryoo, J., & Rosen, S. (2004). “The engineering labor market”, Journal of Political
Economy, 112(S1), S110-S140.
[31] Schott, P. K. (2008). “The relative sophistication of Chinese exports”, Economic
Policy, 23(53), 5-49.
[32] Stuen, E. T., Mobarak, A. M., & Maskus, K. E. (2012). “Skilled immigration and
innovation: evidence from enrolment fluctuations in US doctoral programmes”, The
Economic Journal, 122(565), 1143-1176.
[33] USCIS (2012). “Characteristics of Specialty Occupation Workers (H-1B): FY 2012”,
Department of Homeland Security and United States Citizenship and Immigration
Services, Annual Report to Congress.
[34] Urias, D., & Yeakey, C. C. (2009). “Analysis of the US Student Visa System
Misperceptions, Barriers, and Consequences”, Journal of Studies in International
Education, 13(1), 72-109.
[35] Van Bouwel, L., & Veugelers, R. (2013). “The determinants of student mobility in
Europe: the quality dimension”, European Journal of Higher Education, 3(2), 172190.
[36] Walfish, D. (2002). “Student Visas and the Illogic of the Intent Requirement”, Geo.
Immigr. LJ, 17, 473.
34
35
1954
1975
12,118
1982
Graduate
1986
1990
1994
1998
2002
2006
2010
311,204
1954
19,101
1975
1982
1986
Undergraduate
1990
1994
1998
2002
2006
2010
339,993
Note: This figure represents graduate and undergraduate enrollment of foreign students in the US. The left panel shows graduates and the right panel shows
undergraduates. Data comes from the Institute of International Education, publicly available at: http://www.iie.org/research-and-publications/open-doors/data.
0
50,000
100,000
150,000
200,000
250,000
300,000
350,000
400,000
Figure 1: Trends in International Postsecondary Enrollment in the US, 1954-2012
36
2010
2011
2012
% STEM (Masters)
% STEM (Ph.D.)
2003
2004
2005
2007
2008
% STEM (H-1B)
2006
H-1B Recipients
2009
2010
2011
2012
Note: The figure on the left displays the percentage of STEM bachelors, masters, and doctoral degrees awarded to international students by US colleges and
university. The figure on the right represents the percentage of all H-1B visa recipients for initial employment in STEM occupations. Data on H-1B recipients by
occupation comes from Department of Homeland Security reports (USCIS 2012). Data for the second series comes from the Open Doors reports of the Institute
of International Education (Open Doors 2012).
% STEM (Bachelors)
-
2009
2008
10
10
2007
20
20
2006
30
30
2005
40
40
2004
50
50
2003
60
60
80
70
International Students
70
80
Figure 2: Percentage of International Students and H-1B recipients in STEM
37
France
Turkey
UK Nepal
Taiwan
Japan
South
Korea
China
Brazil
Mexico
Canada
Germany
France UK
Turkey
Nepal Japan
Taiwan
South Korea
China
Other
India
H-1B Recipients for Initial Employment
Note: Figures represents the distribution of international students (left figure) and H-1B visa recipients (right figure) across countries of origin. Data on
international students by country come from the Open Doors reports of the Institute of International Education (Open Doors 2012). H-1B visa issuances by
country of origin come from the Department of Homeland Security Report: “Characteristics of Specialty Occupation Workers (H-1B): FY 2012” (USCIS 2012).
Figures reflect H-1B visa issuances for initial employment.
Canada
Brazil
Mexico
Germany
Other
India
International Students
Figure 3: Distribution of International Students and H-1B recipients by Country in 2012
Figure 4: H-1B Usage by Control Countries
Chile (H1B & H1B1)
0
0
100
200
200
400
300
600
400
800
500
1000
Singapore (H1B & H1B1)
2000
2002
2004
2006
2008
2002
2004
2006
2008
2006
2008
8000
Mexico (H1B & TN)
0
0
2000
50
4000
100
6000
150
Canada (H1B & TN)
2000
2000
2002
2004
2006
2008
2000
2002
2004
3000
Total (H-1B + Alternative)
2000
4000
Australia (H1B & E3)
H-1B Visa
0
1000
Alternative Visa
2000
2002
2004
2006
2008
Note: The above set of figures displays H-1B visa usage, measured by visas issued to that country group, from 2000-2008.
Also displayed is visa usage of alternative visa classes for high skilled immigrants. These include the H-1B1 visa for
Singaporeans and Chileans, the TN visa for Canadians and Mexicans, and the E3 visa for Australians. Data comes from
the Department of State’s Non-immigrant Visa Statistics (Department of State 2012).
38
.7
-2
-1
0
1
2
Years from Drop in H-1B Cap
Treated Countries
3
4
-1
0
1
2
Years from Drop in H-1B Cap
3
4
Note: Figures plot differences in log international enrollment between undergraduate and graduate students. The left figure plots the mean for treated countries–i.e.
nations without alternatives to H-1B visa. The right figure shows the mean for control countries with alternatives to the H-1B visa. Control countries are Australia,
Canada, Chile, Mexico, and Singapore. The horizontal axis indicates years relative to the drop in the H-1B cap in October 2003.
-2
Control Countries
Figure 5: Enrollment from Treatment vs. Control Countries
.65
.55
.5
.6
.3
.25
.2
.15
.1
39
40
0.87***
(0.20)
-0.22
(0.19)
0.89***
(0.20)
-0.21
(0.19)
College Age
Population
Employment
1,012
92
0.06
(0.06)
-0.03
(0.04)
0.06
(0.04)
-0.04
(0.09)
0.19
(0.40)
0.74*
(0.39)
0.08
(0.14)
0.26***
(0.08)
1,012
92
0.02
(0.04)
0.05
(0.05)
-0.00
(0.04)
0.03
(0.08)
0.42*
(0.23)
0.50**
(0.21)
0.03
(0.10)
0.25***
(0.06)
Note: *, **, *** denote significance at the 10%, 5%, and 1% levels, respectively. Table represents results from regressions
of international student enrollment on U.S. labor market openness, as proxied by H-1B visa issuance. All variables are
expressed in natural logarithms, unless explicitly stated otherwise. Standard errors are displayed in parenthesis and are
clustered at the country-level to account for serial correlation in residuals within countries.
1,012
92
1,820
140
N
Countries
0.02
(0.05)
0.07***
(0.03)
Exports
0.07
(0.04)
0.03
(0.04)
-0.02
(0.02)
Imports
Avg. U.S. Wage,
College Immigrant
-0.03
(0.07)
-0.07
(0.05)
0.40
(0.32)
0.51**
(0.25)
0.03
(0.12)
0.20***
(0.07)
Exchange Rate
1,820
140
0.15
(0.12)
0.17
(0.11)
GDP per capita
1,820
140
0.16***
(0.04)
0.16***
(0.04)
H-1B
0.19***
(0.04)
Table 1: Gravity Regressions of International Enrollment on H-1B Visa Issuance
(1)
(2)
(3)
(4)
(5)
(6)
Dep. Var:
Total
Total
Total
Total
Undergraduate
Graduate
International
Enrollment
41
1,012
92
1,012
92
0.25***
(0.06)
0.26***
(0.08)
0.20***
(0.07)
t-1
1,012
92
0.24***
(0.08)
0.28***
(0.09)
0.23***
(0.08)
t
1,012
92
0.26***
(0.09)
0.31***
(0.11)
0.27***
(0.10)
t+1
1,012
92
0.34***
(0.07)
0.32***
(0.10)
0.31***
(0.09)
t+2
920
92
0.33***
(0.07)
0.32***
(0.10)
0.30***
(0.09)
t+3
(7)
Note: *, **, *** denote significance at the 10%, 5%, and 1% levels, respectively. Table represents results from regressions of
international student enrollment on leads and lags of U.S. labor market openness, as proxied by H-1B visa issuance. "t" indicates
international enrollment is regressed on contemporaneous H-1B visa issuance. "t-1" indicates that H-1B issuance in the year prior
is used instead. All variables are expressed in natural logarithms, unless explicitly stated otherwise. All models control for GDP
per capita, employment, and the college age population in the sending country; exports, imports, and exhange rates with the
U.S.; the average wages of college immigrants in the U.S. from the sending country; country fixed effects and year effects.
Standard errors are displayed in parenthesis and are clustered at the country-level to account for serial correlation in residuals
within countries.
1,012
92
N
Countries
0.21***
(0.06)
0.23***
(0.08)
0.17**
(0.08)
Undergraduate
0.17***
(0.06)
0.16**
(0.07)
0.11
(0.07)
Total
Graduate
t-2
t-3
Lead/lag of
independent variable:
H-1B visa issuance
Table 2: Gravity Regressions with Leads and Lags of H-1B Visa Issuance
(1)
(2)
(3)
(4)
(5)
(6)
Table 3: Robustness of H-1B Visas w/ country-specific trends
(1)
(2)
(3)
Dep. Var:
Total
Undergraduate
Graduate
International
Enrollment
0.10***
(0.02)
0.12***
(0.04)
0.09***
(0.03)
GDP per capita
-0.01
(0.02)
-0.01
(0.03)
-0.04
(0.03)
College Age
Population
-0.16
(0.12)
-0.12
(0.16)
-0.13
(0.12)
Employment
0.01
(0.07)
0.10
(0.09)
-0.13*
(0.08)
Exchange Rate
0.62*
(0.32)
0.96***
(0.28)
0.53
(0.41)
Imports
-0.31
(0.30)
-0.29
(0.34)
-0.50
(0.35)
Exports
0.01
(0.02)
0.01
(0.03)
0.00
(0.03)
Avg. U.S. Wage,
College Immigrant
0.03
(0.03)
0.06*
(0.04)
-0.04
(0.04)
N
Countries
1012
92
1012
92
1012
92
H-1B
Note: *, **, *** denote significance at the 10%, 5%, and 1% levels, respectively. Table
represents results from regressions of international student enrollment on U.S. labor
market openness, as proxied by H-1B visa issuance. All variables are expressed in
natural logarithms, unless explicitly stated otherwise. Standard errors are displayed in
parenthesis and are clustered at the country-level to account for serial correlation in
residuals within countries.
42
43
7.771
(0.483)
6.383
(0.164)
Treated Countries
[N=348]
Control Countries
[N=20]
7.983
(0.571)
Control Countries
[N=20]
-0.035
(0.035)
-0.015
(0.04)
-0.100
(0.046)
7.737
(0.513)
DD CS
DDD
-0.050
(0.025)
-0.115
(0.051)
DD TS
6.334
(0.165)
-0.069
(0.047)
7.914
(0.612)
Post - Pre
-0.184
(0.029)
Note: Table displays cross-tabulated mean log enrollments by country (treatment vs. control countries) and time
(pre-treatment vs. post-treatment). These means are separately calculated for undergraduate and graduate levels.
Standard errors are reported in parenthesis and are clustered at the country level.
Graduates
Undergraduates
Table 4: Triple Difference Estimate of H-1B Policy
Pre (2000-2003) Post (2005-2008)
Treated Countries
6.868
6.684
[N=348]
(0.137)
(0.143)
Table 5: Robustness Checks of Triple Difference Estimate
(1)
(2)
(3)
(4)
(5)
(6)
-0.100**
(0.048)
-0.100**
(0.048)
-0.100**
(0.048)
-0.100**
(0.048)
-0.100**
(0.050)
-0.103*
(0.056)
P X TC
-0.015
(0.042)
-0.005
(0.047)
-0.010
(0.041)
-0.011
(0.042)
0.064
(0.041)
-0.004
(0.051)
P X TS
-0.035
(0.036)
-0.035
(0.036)
-0.035
(0.036)
-0.035
(0.036)
-0.035
(0.038)
-0.046
(0.044)
TC X TS
0.274
(0.196)
0.274
(0.197)
0.274
(0.197)
0.274
(0.197)
0.274
(0.207)
0.274
(0.199)
College Age Population
0.430
(0.271)
0.394
(0.283)
0.395
(0.283)
0.909**
(0.409)
0.406
(0.292)
Employment
0.027
(0.199)
-0.022
(0.199)
-0.020
(0.197)
-0.684**
(0.327)
0.091
(0.249)
GDP per capita
0.033
(0.132)
0.030
(0.132)
0.027
(0.132)
-0.141
(0.117)
0.055
(0.137)
Exchange Rates
0.062
(0.072)
0.065
(0.071)
0.069
(0.066)
0.061
(0.073)
Trade Share of GDP
0.387
(0.531)
0.364
(0.548)
-0.234
(0.631)
0.376
(0.641)
0.037
(0.046)
-0.012
(0.038)
0.057
(0.052)
x
x
x
92
92
DDD
[p-value ]
[0.039]
[0.039]
[0.039]
Avg. U.S. Wage,
College Immigrant
[0.040]
Country-specific trends
Omit Fall 2005
Countries
92
92
92
92
[0.049]
[0.070]
Note: *, **, *** denote significance at the 10%, 5%, and 1% levels, respectively. Table displays triple difference
regression estimates of the impact of H-1B policy on foreign student enrollment. All variables are specified in
natural logarithms, unless explicitly stated otherwise. Standard errors are reported in parenthesis and are clustered
at the country level.
44
Table 6: Heterogeneous Impacts of H-1B Policy
(1)
(2)
(3)
1st Tercile
2nd Tercile
3rd Tercile
DDD
[p-value ]
-0.036
(0.059)
[0.545]
-0.102
(0.069)
[0.152]
-0.162**
(0.070)
[0.027]
N
Countries
408
34
408
34
408
34
Note: *, **, *** denote significance at the 10%, 5%, and 1% levels, respectively. Table
displays triple difference estimates, stratifying countries by tercile of the distribution of net
returns from studying in the U.S. Net returns for each country are measured as the
difference in log average U.S. wages paid to college educated immigrants from that coutnry
and the log GDP per capita of the country. Standard errors are reported in parenthesis and
are clustered at the country level.
45


© Copyright 2026