
2015 KPEDD Situations & Prospects
2015 Kenai Peninsula Situations & Prospects Leadership to Enhance, Foster and Promote Economic Development April 2015 Research, analysis, and the 2015 Situations & Prospects Report by Sheinberg Associates, a Community & Strategic Planning & Research firm, www.SheinbergAssociates.com GIS analysis and corresponding map production by Alaska Map Company www.akmapco.com Leadership to enhance, foster, and promote economic development April 2015 Dear Readers, The Kenai Peninsula Economic Development District, Inc. (KPEDD) is very pleased to issue this 2015 Situations and Prospects report. We’ve heard from many of you that you’ve missed this report, last published in 2010 by the borough. Many businesses, non-profits, grant-writers, and residents use it for a variety of economic and personal purposes. We think you will like the fresh look of this new publication too. The data you need is still here, but we’re also focusing on some bigger picture trends, and we are also in the process of “loading” several of these indicators onto the KPEDD website where we intend to update them regularly for your use. It should be ready by late April; check for “Economic Indicators” at www.kpedd.org KPEDD’s mission is to provide leadership in enhancing, fostering, and promoting responsible and sustainable economic development. In order to achieve this goal KPEDD has adopted the acronym of SAVE - Sustainable, Accountable, Visible, and Efficient. We hope you find the 2015 Situations and Prospects report will SAVE you time and help with your business decisions. It is available to download at our website above. Come by our office at mile 14.5 on the Kenai Spur Highway, give us a call at 283-3335, or email Rick anytime at [email protected] to see how we can assist you in meeting your business needs. Brendyn Shiflea President, Board of Directors KPEDD Board of Directors Brendyn Shiflea, President Cheryle James, Vice President Mark Dixson, Treasurer Jason Feeken, Secretary Dale Butts Tim Dillon Mark Dixson Rick A. Roeske Executive Director Mike Dye Rick Koch Sue McClure Dale Bagley Katie Koester Stan Mishin Joe Rybak Acronym Guide AADT ACS ADEED ADF&G ADOLWD ADOR ADOT&PF AHFC AMHS AVTEC BEA CAH CDP CDQ CFEC CI CMS CPH CVRF DCCED DCRA EIS FAA FERC IFQ KPB KPC KPEDD KPTMC LNG NAICS NOAA NRCS OCS PFD Pre-FEED PK-12 QCEW SNAP SPH TAG UAF USCG USDA Average Annual Daily Traffic American Community Survey Alaska Department of Education and Early Development Alaska Department of Fish and Game Alaska Department of Labor and Workforce Development Alaska Department of Revenue Alaska Department of Transportation and Public Facilities Alaska Housing Finance Corporation Alaska Marine Highway System Alaska Vocational Technical Center Bureau of Economic Analysis Critical Access Hospital Census Designated Place Community Development Quota Commercial Fisheries Entry Commission Cook Inlet Centers for Medicare and Medicaid Services Central Peninsula General Hospital Coastal Villages Region Fund Department of Commerce and Community Economic Development Division of Community and Regional Affairs Environmental Impact Statement Federal Aviation Administration Federal Energy Regulatory Commission Individual Fishing Quota Kenai Peninsula Borough Kenai Peninsula College Kenai Peninsula Economic Development District Kenai Peninsula Tourism and Marketing Council Liquid Natural Gas North American Industry Classification System National Oceanic and Atmospheric Administration Natural Resources Conservation Service Outer Continental Shelf Permanent Fund Dividend Pre-Front End Engineering and Design Preschool through 12th Grade Quarterly Census of Employment and Wages Supplemental Nutrition Assistance Program South Peninsula Hospital Tax Authority Group University of Alaska Fairbanks United States Coast Guard United States Department of Agriculture Table of Contents 1 Kenai Peninsula at a Glance ............................................................................................................... 1 2 Kenai Peninsula: Nine Strategic Assets and Advantages ............................................................. 3 3 Population .............................................................................................................................................. 5 4 Regional and Personal Prosperity ...................................................................................................... 9 5 Business Prosperity............................................................................................................................. 15 The Whole Work Economy ......................................................................................................................... 15 Business Activity (Gross Sales) .................................................................................................................. 18 Wages & Employment Trends ................................................................................................................... 22 6 Property Sales, Development, and Taxes ....................................................................................... 23 7 KPB Economy: Industry Spotlights ................................................................................................. 31 Oil & Gas ....................................................................................................................................................... 31 Health Care and Social Assistance............................................................................................................. 36 The Maritime Sector ..................................................................................................................................... 41 Commercial Fishing and Seafood Processing .......................................................................................... 45 Tourism and Visitors ................................................................................................................................... 53 Transportation and Warehousing.............................................................................................................. 64 Construction.................................................................................................................................................. 66 8 Housing ................................................................................................................................................. 67 9 Cost of Living....................................................................................................................................... 70 10 Education and Civic Engagement .................................................................................................. 73 11 Agriculture ......................................................................................................................................... 78 12 City Profiles........................................................................................................................................ 79 City of Homer (Figures 92-94) ..................................................................................................................... 79 City of Kenai (Figures 95-97) ....................................................................................................................... 82 City of Seldovia (Figures 98-99) .................................................................................................................. 85 City of Seward (Figures 100-102) ................................................................................................................ 87 City of Soldotna (Figures 103-105) .............................................................................................................. 90 13 County Business Patterns –By Zip Code ...................................................................................... 93 14 Report Contributors and Primary Data Sources ....................................................................... 109 1 Kenai Peninsula at a Glance Demographics Population Median Age Number < age 5 Number > age 64 Number of PFDs The Whole Economy Total Personal Income (BEA) Total Work Force (‘10/’11 and ‘12/’13) Total Work Earnings (‘12/’13) Number Self-Employed/Proprietors (‘10/’12) Per-Capita Income (BEA) Statewide Per Capita Income Median Household Income Statewide Median Household Income Employment and Wages Total Employment Total Government Employment Total Private Sector Employment Total Wages Total Private Sector Wages Average Wage Annual Unemployment Rate % Families Below Poverty % Families Below Poverty with female head of house, no husband Business Activity (Gross Taxable KPB Sales) Sales (Restaurant, Bars, Retail) Construction Production (O&G, mining, ag, fish, seafood) Services Wholesale Utilities Tourism (A&E, Guides, Lodging) Prof (Health Care, Prof) Manufacturing Property (Rentals) Transportation & Warehousing Public Admin (Govt) Grand Total 2010 55,400 40.6 3,434 6,276 53,145 2010 $2.31B 25,564 $1.09B 6,126 $41,569 $45,565 $54,221 $67,016 2010 19,438 4,773 14,665 $819.4M $585.2M $42,155 10.0% (’10) 4.8% 2014 57,212 41.1 3,679 8,131 53,217 (‘13) 2013 $2.77B 26,821 $1.23B 6,117 $48,485 $50,150 $62,826 $70,477 2013 20,704 4,820 15,884 $949.7M $702.6M $46,062 7.5% (‘13) 5.6% Change +1.8% +0.80 +7.1% +29.6% +72 Change +0.46 +1,257 (5%) +0.14 -9 +$6,916 (+17%) +$4,585 (+10%) +$8,605 (+16%) +$3,461 (+5%) Change +1,266 +47 +1,219 +$130.3M +$117.4M +$3,907 -2.5% +1.1% 13.5% 16.1% +2.6% 2012 $Millions $1,074.8 $911.7 $479.6 $305.5 $284.0 $166.7 $162.1 $152.1 $151.2 $101.0 $127.1 $29.4 $3,945.2 2013 $Millions $1,077.0 $566.3 $555.8 $335.7 $319.5 $176.8 $167.3 $158.0 $139.0 $104.6 $96.3 $21.1 $3,717.5 KPEDD - 2015 Situations & Prospects page 1 Change +$2.2 -$345.3 +$76.2 +$30.2 +$35.5 +$10.1 +$5.2 +$6.0 -$12.2 +$3.6 -$30.8 -$8.3 -$227.6 Schools PK-12 School District Enrollment Dropout Rate Free Lunch Eligibility (% of all students) ACT and SAT Test Scores Full & part time KPC and AVTEC students Housing Number of new dwelling units (5 cities) Number of dwelling units (5 yr avg/ACS) Number dwelling units occupied Median House Value / Median Rent Statewide Median House Value / Statewide Rent Homeowners: % paying >30% income in mortgage Renters: % paying >30% income in rent Maritime Indicators State Fish Tax shared with KPB/cities Total Pounds Landed in KPB (pounds) Ex-Vessel Value Landed in KPB Passenger Transportation Total Passenger Arrivals Airline Passenger Arrivals (9 airports) Railroad Passengers (total) AMHS Passengers Disembarking Cruise Passengers AADT @ Placer River Br. Seward Hy Agriculture Number of farms Acreage under cultivation Total Number of High Tunnels TOP 5 SECTORS: JOBS (% of all) Ag, forestry, fishing, hunting 6% Accommodation & food services 10% Retail trade 11% 2009/2010 2014 OR 2015 CHANGE 9,368 9,150 (‘14/’15) -2.3% 4.5% 2.8% (‘13/’14) 1.7% better 37% 39% 2% more KBP scores > state averages, but scores declining 3,825 4,166 (’14) +8.9% 2010 2013 Change 64 81 (3Q ‘14) +319 (3 yrs) 30,100 30,593 +493 21,070 21,418 +348 $200,900/ $854 $206,800 / $935 +$5,900 / +$81 $235,300/ $245,300/ +$10,000 / $1,056 $1,113 +$57 36.9% 28.8 % -8.1% 45.9% 2010 $622,270 116.5M $150.4M 2010 336,848 133,671 58,021 15,178 (‘10) 153,082 4,011 (‘10) 2007 124 29,140 acres 33 (2010) 41.2% ‘12/’13 $933,230 (’14) 130.2 $135.4M (’13) 2014 347,330 144,181 80,320 (’14) 7,582 (‘13) 148,778 (’14) 3,753 (‘12) 2012 162 38,289 acres 252 (2014) -4.7% Change +$310,960 +13.7M -$15M Change +10,482 (+3.1%) +10,501 +22,299 -7,596 -3.0% -258 Change +31% +31% +664% TOP 5 SECTORS: EARNINGS (% of all) Construction 8% Government 18% Health care & social assistance 14% Ag, forestry, fishing, hunting 8% Health care & social assistance 11% Sources: 2013 ADOLWD QCEW Employees &Wages, 2012 US Census Nonemployers Statistics (self-employed) KPEDD - 2015 Situations & Prospects page 2 Government 20% Mining, quarrying, oil & gas extraction 13% 2 Kenai Peninsula: Nine Strategic Assets and Advantages Economic development professionals today recommend creating development strategies based on an area’s unique assets, networks, and competitive advantages and then leveraging them to compete regionally and beyond. This approach is in contrast to a focus on areas of deficiency, which are used as a basis to appeal for state or federal funding. Preferring the asset-based approach, a review of the Kenai region’s unique assets and competitive advantages, along with some challenges, provide context and focus for this publication’s economic information, and should stimulate future-thinking. The following lists are not exhaustive, and are qualitative rather than quantitative. They are based on the observations and ideas of the KPEDD Board and the report contributors listed at the front of this report. CENTRAL LOCATION The Kenai Peninsula is centrally located in Alaska, with proximity to road, marine, and air infrastructure and shipping. It is proximate to markets within Alaska, the Arctic, Asia and Pacific Rim countries, and beyond. There are opportunities to grow demand and export goods and services to these markets. MILD, DRIER CLIMATE The Peninsula’s climate is relatively mild compared to other parts of the state. This makes doing business logistically easier than in more extreme areas. THE MAGIC IS IN THE MIX Area residents have a cultural refusal to be pigeonholed. Hardcore Slope workers also have B&B's; charter boat operators do welding jobs in the off season; teachers raise sled dogs, medical professionals dabble in trapping. It’s the people and their collective talents, skills, and desire to live here that make the magic. COST OF LIVING IS RELATIVELY LOW The cost of living on the Peninsula is low for Alaska. Typically household goods cost just a bit more than Anchorage. Land is plentiful and homes and apartments are among the most affordable in the state. Less expensive natural gas is available for heating. Taxes are relatively low and stable. While the cost of electricity is on the high side compared to Anchorage and Mat-Su; there may be renewable energy opportunities that could positively affect electricity cost. DIVERSIFIED ECONOMY The Kenai Peninsula region has a more diversified economy than many places in the State. Strong tourism, commercial and personal use fishing/processing/ wholesaling, and oil and gas activity and infrastructure bring people and money from outside into the area. Maritime commerce centers on transportation, the fishing and seafood industry, ship-building and repair, marine surveyors, scientists, water transporters and other marine trades. Construction and trade are aided by these strong sectors. The diversity of health care services available is also notable for the population. High quality workforce training in the region supports the oil and gas, maritime, and other trades. The industry-friendly political, government and business climate is an asset. The entrepreneurial spirt is alive in the Borough and a driving force for job creation, but there could be more of a cooperative effort to create an entrepreneurial culture. KPEDD - 2015 Situations & Prospects page 3 This diversification is a strong asset; however, a challenge is that the key goods-producing industries: fishing, tourism, oil and gas, are subject to forces beyond the control of the area (such as world markets, commodity prices, ocean warming, the US recession’s effect on travel). INCREDIBLE RECREATIONAL OPPORTUNITIES The region’s scenic beauty, clean air and water, healthy fisheries, relatively fertile soils and wild landscapes coupled with good access have resulted in plentiful recreational opportunities. These are enjoyed by residents and tourists alike, and many businesses exist to help visitors experience these assets. GOOD SCHOOLS AND WORKFORCE TRAINING Kenai Peninsula School District students score higher on standardized tests than the statewide averages, and higher than Anchorage School District students. The dropout rate is down to 2.8% from a ten year high of 4.5% and the 2014 senior class graduation rate was 81.4%, the highest in ten years AVTEC and KPC both provide undergraduate education and industry trades training including in the oil and gas and maritime trades. WELL DEVELOPED PUBLIC INFRASTRUCTURE The Kenai Peninsula is served by road, air, marine, and rail infrastructure. There are deep water icefree ports at Seward and Homer. The region’s paved roads and public works are supported by welltrained staff; emergency services are available to assist the public. There is an established and growing natural gas distribution grid (including storage facilities). Internet speeds have also been increasing recently. A challenge is that the single state highway between Anchorage and the region is congested in the summer. DIVERSE PLACES AND CHOICES Even though the Kenai Peninsula is a single geographic/political entity, the unique assets and competitive advantages are quite varied. Opportunities in Kenai/Soldotna are different than in Homer and Seward, and in-between. Here one can live the rural Alaskan dream but still be close to amenities and an organized, paved, plugged-in place. It’s a mix of modern and wild. We need to plan as we develop to preserve this diversity for future generations. KPEDD - 2015 Situations & Prospects page 4 3 Population Kenai Peninsula’s population is projected to continue to grow. Kenai Peninsula Communities Boundaries of Cities and Census Designated Places (CDPs ) KPEDD - 2015 Situations & Prospects page 5 YEAR POP 1950 1960 1970 1980 1990 2000 2010 2014 4,831 9,053 16,586 25,282 40,802 49,691 55,400 57,212 Fig 1 Source: ADOLWD Population 2010 2014 Percent Change (Cumulative) 2010 - 2014 55,400 57,212 3.3% 1,930 1,956 20 176 1,364 289 74 1,156 685 1,932 877 76 593 5,003 192 472 7,850 549 7,112 80 219 254 4,493 318 883 3 177 78 2,022 980 255 165 2,693 4,163 5,617 18 171 505 2,059 1,985 17 183 1,394 295 71 1,174 644 2,024 877 65 566 5,099 196 460 8,441 574 7,167 68 234 275 4,652 270 847 3 168 73 2,187 1,120 233 170 2,768 4,311 5,869 9 174 490 6.7% 1.5% -15.0% 4.0% 2.2% 2.1% -4.1% 1.6% -6.0% 4.8% 0.0% -14.5% -4.6% 1.9% 2.1% -2.5% 7.5% 4.6% 0.8% -15.0% 6.8% 8.3% 3.5% -15.1% -4.1% 0.0% -5.1% -6.4% 8.2% 14.3% -8.6% 3.0% 2.8% 3.6% 4.5% -50.0% 1.8% -3.0% Fig. 2 POPULATION Kenai Peninsula Borough Anchor Point CDP Bear Creek CDP Beluga CDP Clam Gulch CDP Cohoe CDP Cooper Landing CDP Crown Point CDP Diamond Ridge CDP Fox River CDP Fritz Creek CDP Funny River CDP Halibut Cove CDP Happy Valley CDP Homer city Hope CDP Kachemak city Kalifornsky CDP Kasilof CDP Kenai city Lowell Point CDP Moose Pass CDP Nanwalek CDP Nikiski CDP Nikolaevsk CDP Ninilchik CDP Point Possession CDP Port Graham CDP Primrose CDP Ridgeway CDP Salamatof CDP Seldovia city Seldovia Village CDP Seward city Soldotna city Sterling CDP Sunrise CDP Tyonek CDP Balance Source: ADOLWD, Population Estimates KPEDD - 2015 Situations & Prospects page 6 Between 2000 and 2010, the region gained 5,700 people and grew at an average annual rate of 1.1%. In the last four years, another 1,800 people brings the total estimated Kenai Peninsula population to an all-time high of 57,212 (ADOLWD). The region’s average annual growth rate exceeded the states’ from 1950 through 2010. In the last few years the region’s growth rate has slowed though and the state projects (based on historical birth, death, and in/ outmigration rates) that over the next 30 years the region will grow, but at a slightly slower rate than the state. Economic opportunity and time will determine if this is true or not. The state currently projects over 65,000 residents by 2042 for the Kenai Peninsula. KPB Population Outlook Current & Projected Population - Kenai Peninsula Borough Fig. 3 population TODAY - 57,212 60,000 50,000 40,000 30,000 20,000 10,000 0 male projected - 65,647 female source: ADOLWD, Pop. Projections During each of the last three years (2014-2012), slightly more people moved away from the Kenai Peninsula than moved here. This reversed the trend from the three preceding years (2011-2009). Approximately two-thirds of all people moving to or from the peninsula go to or from places outside of Alaska. The next top spots for those both leaving and coming are Anchorage, Mat-Su, and Fairbanks. Fig. 4 Number of People Moving to/from Kenai Peninsula, 2008-2014 4,000 3,000 3,125 3,313 2,000 3,626 2,840 3,331 2,704 2,730 2,554 2,963 2,754 2010-2011 2009-2010 2,947 2,543 1,000 0 2013-2014 2012-2013 2011-2012 Moved TO Kenai Peninsula Moved FROM Kenai Peninsula Source: ADOLWD, PFD-Migration Data KPEDD - 2015 Situations & Prospects page 7 2008-2009 In addition to continued growth and more students on the way, the big news for the Peninsula is the aging population. As the number of seniors grows, the traditional population “pyramid” is becoming a population “rectangle” in Kenai, around Alaska, and in the US. Currently, 8,100 people (14%) of the Kenai Borough population are 65 or older. By 2014 - Kenai Peninsula Population Fig. 5 2027 it is projected that 14,800 people (23%) will be over 65. And, the number WOMEN MEN 85 or older will increase four-fold over 90+ 30 years, from about 670 in 2014 to 3,270 80-84 in 2042. 70-74 60-64 There continues to be about 4% more men than women on the peninsula, but projections expect that over the next 30 years this will get closer to even due to the large number of “boomers” aging and the fact that women tend to live longer than men. 50-54 40-44 30-34 20-24 10-14 0-4 3,000 2,000 1,000 0 1,000 2,000 2042 - Kenai Pennsula Population WOMEN 90+ 3,000 Fig. 6 MEN 80-84 Older residents generally have different interests, and different housing, health care, and service needs than younger age groups. It is not too soon to begin planning for this change. 70-74 60-64 A gap analysis should be conducted to identify missing services, opportunities, and facilities. Keeping seniors on the peninsula keeps families together, allow seniors to continue to contribute their skills and talents, and keeps retirement and investment earnings local. 50-54 40-44 30-34 20-24 10-14 0-4 3,000 2,000 1,000 0 1,000 2,000 3,000 Percent Change During Time Period (average annual) Source: ADOLWD, Pop. Projections 7.0% 6.0% Fig 7. Rate of Population Growth - Past and Projected Kenai Peninsula Borough Alaska TODAY 5.0% 4.0% 3.0% 2.0% projected 1.0% 0.0% Source: ADOLWD KPEDD - 2015 Situations & Prospects page 8 Kenai Peninsula Borough school enrollments have declined for a decade, but are forecast to level off, and then increase. Despite the growing population, the number of students enrolled in the Kenai Peninsula Borough School District has dropped over the last decade by 485 students or 5%. School enrollment is down to 9,150 during the 2014-2015 school year. However, the state forecasts the decline to level off by 2020, and the number of students to increase over the next 30 years to over 13,000 students. The Big Unknown - Gas Pipeline to Nikiski If a gas pipeline is built from the North Slope through Alaska to Nikiski where a large plant and marine terminal for liquefaction and export would be built, it will mean short-medium term construction jobs and longer term operation jobs. At this time a decision on the AK LNG pipeline is expected in 2018-2019. If the project moves forward, five-seven years of construction would be followed by some 40 years of LNG export beginning in 2026. Further information is available in the Oil and Gas Section of this report. This could mean 2,000-5,000 more residents in the region. They would bring a demand for housing, goods and services, utilities, public works and public safety needs, schools, emergency room and health care service increases, and more. This would be in addition to population growth due to “regular” births and in-migration, which the state currently projects at over 65,000 residents in 30years. The Kenai Peninsula Borough (KPB) and its communities would be wise to begin considering these possible impacts and needs now. The KPB recently hired an oil and gas specialist to help track the likelihood of action on this and other regional gas and oil activities. 4 Regional and Personal Prosperity In inflation–adjusted (real) dollars, total Kenai Peninsula personal income grew by 38% between 2003 and 2013 (3% average annual). This exceeded real personal income growth of Anchorage (17%) and Alaska (25%) during this time period. Total Personal Income, Kenai Peninsula In 2013, personal income on the Kenai Peninsula totaled $2.77 billion. This includes personal income for Kenai area residents only; it does not include earned income by non-resident workers working in the region. Total personal income includes three broad categories of income: Resident earnings Dividends, interest, and rent Personal current transfer receipts (also known as transfer payments) “Resident earnings” is the income earned by Kenai Peninsula residents from employment (or from a business). “Dividends, interest, and rent” describes investment income, such as dividend income from stock ownership (including dividends paid to retirement plans), interest earned on savings accounts and bonds, and rental income from property ownership. “Personal current transfer receipts” are payments from government to individuals, including Medicare and Medicaid payments, Social Security payments, food stamps, and similar payments. This category also includes Permanent Fund dividend payments. KPEDD - 2015 Situations & Prospects page 9 Kenai Peninsula Resident Personal Income Nominal and Inflation-Adjusted (Real), 2003-2013 Personal Income ($Billions) Fig. 8 $3.0 Nominal Real $2.5 $2.0 $1.5 $1.0 $0.5 $0.0 2003 2004 2005 2006 2007 2008 2009 2010 2011 2012 2013 Nominal $1.54 $1.61 $1.68 $1.80 $1.99 $2.20 $2.20 $2.31 $2.50 $2.68 $2.77 Real $2.05 $2.07 $2.16 $2.33 $2.47 $2.44 $2.51 $2.64 $2.76 $2.77 $2.01 Sources: Bureau of Economic Analysis CA1-3, Sheinberg Associates Resident earnings accounted for 64% of Kenai region resident total personal income in 2013; dividends, interest and rent for 20%; and transfer receipts for 16%. Between 2003 and 2013, area personal income increased by $1.2 billion dollars. This includes growth of $748 million in earnings; $295 million in dividends, interest and rent; and $189 million in transfer receipts. During this 11-year time period, the category of dividends, interest and rent, grew faster (117%) than other types of personal income. Per Capita and Household Income Per capita personal income on the Kenai Peninsula in 2013 was $48,485. This is a measure of total personal income divided by Kenai Peninsula’s total population. Per capita income in the Kenai Peninsula was 3% below the statewide level ($50,150) and 8% above the US per capita income ($44,765) average. Fig. 9 Kenai Peninsula Resident Personal Income, by Source, 2013 Dividends, interest, & rent $547,061,000 20% 64% 16% Personal current transfer receipts $455,429,000 KPEDD - 2015 Situations & Prospects page 10 Resident earnings $1,768,306,000 Source: Bureau of Economic Analysis, CA 30 According to the Census Bureau's 3-year (2011-2013) American Community Survey, Kenai Peninsula Borough’s median household income is $62,826. Fig. 10 Number of KPB Households by Income < $10,000 $10,000 to $14,999 933 1,192 $15,000 to $24,999 2,001 $25,000 to $34,999 1,773 35,000 to $49,999 The 2013 ACS Survey lists the Alaska’s median household income at $72,237 and the US at $52,250. 2,474 $50,000 to $74,999 4,262 $75,000 to $99,999 3,149 $100,000 to $149,999 3,597 $150,000 to $199,999 >$200,000 or more Fig. 11 Place Alaska Aleutians East Borough Aleutians West Census Area Anchorage Municipality Bethel Census Area Bristol Bay Borough Denali Borough Dillingham Census Area Fairbanks North Star Borough Haines Borough Hoonah-Angoon Census Area Juneau City and Borough Kenai Peninsula Borough Ketchikan Gateway Borough Kodiak Island Borough Lake and Peninsula Borough Income $50,150 $33,430 $36,673 $54,766 $36,195 $60,210 $66,674 $46,563 $45,313 $85,326 $44,619 $57,033 $48,485 $56,591 $48,804 $47,492 1,235 802 2013 Per Capita Income Place Matanuska-Susitna Borough Nome Census Area North Slope Borough Northwest Arctic Borough Petersburg Census Area Prince of Wales-Hyder Census Area Sitka City and Borough Skagway Municipality Southeast Fairbanks Census Area Valdez-Cordova Census Area Wade Hampton Census Area Wrangell City and Borough Yakutat City and Borough Yukon-Koyukuk Census Area United States source: ACS, 2011-2013 Income $46,149 $41,310 $50,719 $40,241 $51,541 $36,354 $52,608 $70,065 $47,270 $51,646 $25,066 $40,890 $49,269 $45,494 $44,765 Source: Bureau of Economic Analysis, CA 1-3 Regional Economic Profiles Some on the Peninsula are struggling financially and having a hard time making ends meet; several indicators are of concern. Fewer students qualify today for free or reduced fee lunches in Kenai Peninsula Schools than did in 2012, and Borough schools have fewer that qualify than the state as a whole or other Southcentral Alaska School Districts. Still, almost one out of every ten Peninsula students comes from a family whose income is only 130% to 185% of federal poverty limits. For the 2014/2015 school year, this would be for example, a family of four making less than $55,167 (reduced lunch) or less than $38,766 (free lunch). For a single parent with one child, annual income limits to qualify are $36,371 (reduced) or $25,558 (free). KPEDD - 2015 Situations & Prospects page 11 Number (and %) of Students Eligible for Free and Reduced Lunches District 2014 2012 2010 Kenai Peninsula 2,923 (39%) 3,277 (45%) 3,112 (37%) Anchorage 22,898 (46%) 19,711 (40%) 17,834 (37%) Mat Su 5,868 (39%) 5,616 (38%) 5,252 (36%) Alaska Statewide 56,383 (47%) 52,729 (44%) 47,914 (41%) Fig. 12 Source: Alaska DEED Perhaps more worrisome, approximately 5.5% of Kenai Peninsula families have income that is below the federal poverty limits ($29,820 for a family of four). And, if the Kenai region family is headed by a female with no male present, then 16% are living in poverty. In both cases, the percent below poverty in the region has increased compared to 2010 (all data from 2011-2013 American Community Survey). In the last 12 months, 9% of Kenai Borough households received food stamps/SNAP benefits. And over 40% of renters are paying more than 30% of their income on rent. An overview of demographic and socioeconomic data for the Kenai Peninsula Borough follows, excerpted from the 2011-2013 American Community Survey by the US Census. (City profiles are in the last section of this report.) Kenai Peninsula Borough Mayor Mike Navarre greets people at the area-wide senior Thanksgiving dinner at the Kenai Senior Center. (2011, Peninsula Clarion file photo) KPEDD - 2015 Situations & Prospects page 12 Fig. 13 Kenai Peninsula Borough Socioeconomic Data Unless otherwise noted, all data from 2011-2013 American Community Survey 5-Year Estimates POPULATION 2014 Population 1 # PFDs 2013 2 Kenia Peninsula School District Enrollment (Oct 1 2014) 3 HOUSING Total housing units Occupied housing units Vacant housing units Median value of owner-occupied units Median monthly rent (for renters) Households spending more than 30% of income on housing For homeowners with a mortgage For homeowners without a mortgage For renters EMPLOYMENT STATUS Population 16 years and over In civilian labor force Employed Unemployed In Armed Forces Not in labor force CLASS OF WORKER Civilian employed population 16 years and over Private wage and salary workers Government workers Self-employed in own not-incorporated biz. workers Unpaid family workers INCOME AND BENEFITS (in 2013 inflation-adjusted dollars) Total households Median household income Mean household income Households with… Earnings Social Security Retirement income Supplemental Security Income Cash public assistance income Food Stamp/SNAP benefits in the past 12 months Total Families Median family income Mean family income Per capita income 4 Estimate KPEDD - 2015 Situations & Prospects page 13 % 57,212 53,217 9,150 - 30,593 21,418 9,175 $206,800 $935 2,600 796 2,229 71.2% 28.8% 26.8% 12.5% 41.2% 45,352 28,524 25,455 25,783 144 16,684 62.9% 56.9% 6.0% 0.3% 36.8% 25,783 18,606 4,670 2,420 87 72.2% 18.1% 9.4% 0.3% 21,418 $62,826 $77,255 17,214 6,027 4,151 850 1,331 1,978 14,320 $74,753 $89,440 $48,485 80.4% 28.1% 19.4% 4.0% 6.2% 9.2% - HEALTH INSURANCE COVERAGE Civilian noninstitutionalized population With health insurance coverage Without health insurance coverage BELOW FEDERAL POVERTY LEVEL All families Families with female householder, no husband present All people EDUCATIONAL ATTAINMENT Population 25 years and over Less than 9th grade 9th to 12th grade, no diploma High school graduate (includes equivalency) Some college, no degree Associate's degree Bachelor's degree Graduate or professional degree 55,596 43,469 12,127 78.2% 21.8% - 5.6% 16.1% 9.1% 38,715 817 1,920 12,897 11,102 2,850 5,841 3,288 2.1% 5.0% 33.3% 28.7% 7.4% 15.1% 8.5% Unless otherwise noted, all data from 2011-2013 American Community Survey 5-Year Estimates 1 ADOLWD, Population Estimates 2 PFDs reported by zip code, ADOR 3 # Students enrolled in School District, ADEED 4 Bureau of Economic Analysis CA 30 Profile Kenai Peninsula Borough Taxes Property Tax Mill Rate Revenue O&G $49,372,199 $9,294,743 In 2014, from 5.90 $46,286,259 $6,618,858 to 11.30 $37,752,405 $7,946,360 Fig. 14 Year 2014 2009 2004 Sales Tax Rate Revenue 3% $30,277,598 3% $28,585,036 2% $14,910,977 Source: DCCED Alaska Taxable Data Base Kachemak Bay Dawn KPEDD - 2015 Situations & Prospects page 14 Total $58,666,942 $52,905,117 $45,698,765 5 Business Prosperity The Whole Work Economy Wage and employment data from the Alaska Department of Labor and Workforce Development (ADOLWD) Quarterly Census on Employment and Wages (QCEW) is the most common dataset used in Alaska to understand economic activity. However, this important dataset does not include earnings or a count of those who are self-employed (like many commercial fishermen) or those who own their own small businesses (sole proprietors). Data on these individuals is available through the US Census Nonemployers Statstics database, which is based on US tax returns. Matching NAICS codes from these two data sources and aggregating them provides a more complete picture of the whole economy than either data set does alone. This shows that work related earnings on the Kenai Peninsula total $1.2 billion, with 23% from the 6,117 self-employed individuals or small business owners, and 77% from wage and salary workers who are employed by 2,025 firms on the peninsula. Of all work-related earnings, one-third of the total is from goods-producing work, primarily commercial fishing, seafood, and oil and gas. Almost half the total is from service-providing work, primarily businesses serving visitors, professional services, retail trade, and health care and social assistance. About 20% is from government service, primarily local government, which includes school district staff, all city and borough employees, tribal government employees, and many hospital and clinic workers on the Peninsula. Earnings from SELF-EMPLOYMENT, BUSINESS PROPRIETORS, $277 million goods producing 50% service providing 50% Earnings from EMPLOYMENT WAGES, $954 million goods producing 22% government service 20% service providing 35% Sources: 2012 USCensus Nonemployer Statisitics; 2013 ADOLWD Quarterly Census of Employment and Wages (QCEW) KPEDD - 2015 Situations & Prospects page 15 Fig. 15 Total - ALL WORK-RELATED EARNINGS, $1.2 billion government service goods 20% producing 33% service providing 46% Whole Work Economy - Earnings & Jobs - Kenai Peninsula WORK EARNINGS (in $millions) WORKFORCE NAICS Employ. Proprietor No. No. Codes & Description Wages Income TOTAL Employees Proprietors TOTAL Agriculture, forestry, 11 $3.81 $98.65 $102.46 85 1,577 1,662 fishing, hunting Mining, quarrying, oil 21 $150.46 $3.89 $154.35 1,492 44 1,536 & gas extraction 23 Construction $65.03 $28.27 $93.30 1,022 597 1,619 31-33 Manufacturing $55.32 $6.66 $61.98 956 170 1,126 22 Utilities $27.74 conf $27.74 265 conf 265 '42' Wholesale trade $11.48 $5.02 $16.50 198 67 265 44-45 Retail trade $69.26 $17.07 $86.33 2,516 454 2,970 Arts, entertainment, '71' $3.99 $7.56 $11.55 254 358 612 and recreation Accommodation and '72' $42.34 $14.67 $57.02 2,227 360 2,587 food services Transportation & 48-49 $46.45 $13.37 $59.83 969 226 1,195 warehousing 52 Finance & insurance $12.31 $1.05 $13.35 261 49 310 Real estate, rental & 53 $17.67 $30.04 $47.71 304 423 727 leasing Professional & 51, 54,56 business services, $54.86 $24.59 $79.46 1,090 856 1,946 incld information 61 Educational services $2.77 $2.17 $4.94 103 144 247 Health care & social 62 $122.46 $8.96 $131.42 3,251 249 3,500 assistance Other services (except 81 $19.60 $15.15 $34.75 862 540 1,402 public admin) 99 Unclassified $0.96 $0.00 $0.96 29 0 29 20 Government $247.16 $0.00 $247.16 4,820 0 4,820 Fig. 16 Total for all sectors $953.67 $ 277.15 $1,230.83 20,704 Sources: 2012 US Census Nonemployer Statistics; 2013 ADOLWD Quarterly Census of Employment and Wages KPEDD - 2015 Situations & Prospects page 16 6,117 26,821 Jobs Over the last few years, the most jobs on the Kenai Peninsula have come from the same five sectors (Figure 17). Together, over half (58%) of all jobs in 2013 come from government, health care, retail work, lodging and food services, and fishing (primary part of agriculture/forestry/fishing/hunting series.). This includes work from employment (12,899 jobs) and from the self-employed (2,640 proprietors). TOP 5 SECTORS, by Number of Jobs (Employees + Self-employed) 2011 Jobs Most Jobs Rank (% of Total) Rank Government 1 4,773 (19%) 1 Health care & social assistance 2 3,310 (13%) 2 Retail trade 3 (2,985 12%) 3 Accommodation and food services 4 2,383 (9%) 4 Agriculture, forestry, fishing, hunting 5 1,684 (7%) 5 Fig. 17 2013 Jobs (% of Total) 4,820 (18%) 3,500 (13%) 2,970 (11%) 2,587 (10%) 1,662 (6%) Sources: US Census Nonemployer Statistics 2012, 2010; ADOLWD QCEW 2011, 2013 Earnings Like jobs, the top five sectors providing earnings to Kenai Peninsula residents has not changed over the last few years, through the relative ranking has varied (Figure 18). Together, over half (60%) of all work related earnings in 2013 come from government, oil and gas, health care-related, fishing, and construction. This includes the income of $588,914,000 from employment (wages) and $139,769,000 from those who are self-employed. TOP 5 SECTORS, by Total Work Earnings (Wages + Earnings of self-employed) 2011 Earnings in $millions Most Earnings Rank (% of Total) Rank Government 1 $234.2M (21%) 1 Mining, quarrying, oil & gas extraction 4 $105.7M (10%) 2 Health care & social assistance 2 $117.1M (11%) 3 Agriculture, forestry, fishing, hunting 3 $106.4M (10%) 4 Construction 5 $84.9M (8%) 5 Fig. 18 2013 Earnings in $millions (% of Total) $247.2M (20%) $154.4M (13%) $131.4M (11%) $102.5M (8%) $93.3M (8%) Sources: US Census Nonemployer Statistics 2012, 2010; ADOLWD QCEW 2011, 2013 Job Growth has been in Lower-Wage Service-Providing Jobs Looking just at ADOLWD employment and wage data, job growth since 2003 has primarily been in the private sector. Figure 19 shows the increase of 2,684 jobs since 2003. The trendline shows average monthly wages in 2013. It shows that high growth service-providing jobs have lower average wages than other types of work. Higher paying federal jobs declined by 69 over the last 11 years. The overall economic impact of this was offset by the gain of 87 high-paying, goods-producing jobs. KPEDD - 2015 Situations & Prospects page 17 3,000 Kenai Peninsula - Change in Employment 2003-2013 and 2013 Average Monthly Wages 2,684 $7,000 2,500 $6,000 2,000 $5,000 1,500 $4,000 1,000 $3,000 500 0 157 74 87 $2,000 $1,000 -69 -500 $ average monthly wage 2013 change in number of jobs Fig. 19 $0 Federal Govt State Govt Local Govt Private -Goods Private-Service Producing Providing Source: ADOLWD QCEW Ever-popular Kenai Peninsula Activity Business Activity (Gross Sales) Gross sales are a good proxy for business activity. Business sales in the Kenai Peninsula Borough increased from 2010 to 2012, then fell 6% between 2012 and 2013 (Figure 20). This decline was primarily due to a large drop in construction sales (38%), along with a decline in warehousing and transportation. Keep in mind though, that the construction sales decline in 2013 followed a surge the year prior related to oilfield services activity. Oil and gas sales (part of mining/quarrying) rose $76 million (16%) between 2012 and 2013, and in just the first three quarters of 2014 have already increased another $328 million. Figure 21 looks back to 2003 gross sales and corrects for inflation (using the Anchorage Consumer Price Index) by changing 2003 gross sales into their equivalent 2013 dollars. This shows that most sectors have experienced sales growth that beats inflation, but tourism-related business sales and manufacturing sales have lost ground compared to inflation. KPEDD - 2015 Situations & Prospects page 18 Business Activity - Gross Sales, Kenai Peninsula Borough (in $dollars) Business Type 1st 3 Qtrs 2014 2013 2012 2011 2010 Admin, Waste Mgt 52,304,750 81,561,362 73,484,901 81,557,526 87,245,737 Ag, Forestry, Fishing, Hunting 2,392,646 3,259,614 3,229,852 3,424,002 3,015,460 Arts & Entert. 5,625,991 15,377,847 16,595,623 14,538,692 13,213,615 Construction Contracting 341,822,808 566,348,085 911,658,568 565,883,608 306,010,371 Educational Svs 1,815,370 2,945,892 2,725,887 2,448,338 2,103,667 Finan. & Insurance 5,501,636 10,033,276 6,000,909 7,828,604 11,219,271 Guiding Land 2,489,551 2,701,107 1,767,489 1,716,669 1,617,518 Guiding Water 56,746,285 60,368,575 57,773,657 56,552,908 52,032,123 Health Care, Social Asst 17,137,475 20,369,553 22,172,947 23,366,404 21,817,289 Hotel/Motel/B&B 81,901,746 88,861,805 85,963,109 78,682,347 71,241,197 Information 39,705,661 55,491,122 56,433,632 57,638,499 57,423,336 Mgmt of Companies 2,975,513 * * * * Manufacturing 92,920,442 139,007,456 151,240,269 178,084,776 131,436,024 Mining/quarrying 880,792,267 552,522,750 476,350,194 358,414,721 251,660,299 Prof, Scientific & Technical Svs 53,660,426 137,673,975 129,896,082 128,622,351 120,344,285 Public Admin 17,279,469 21,096,106 29,376,966 18,365,994 17,430,474 Remediation Svs 366,773 536,572 533,377 99,263 13,143 Rental Comm Prop 5,299,291 6,766,394 14,547,574 11,866,897 9,785,373 Rental Non-Resid Prop 24,108,325 23,115,672 20,674,302 18,204,760 16,830,767 Rental Self-storage & Mini3,663,038 4,610,668 4,007,371 3,339,314 2,857,689 warehses Rental Pers Prop 4,117,664 4,911,307 4,406,314 4,467,389 4,195,923 Rental Resid Prop 49,669,253 65,203,539 57,370,174 53,836,057 52,155,324 Restaurant/Bar 76,812,416 92,841,409 89,305,206 84,496,703 78,299,766 Retail Trade 778,272,023 984,180,277 985,526,079 938,881,631 842,761,679 Services 142,667,387 173,813,125 155,555,976 111,828,223 80,854,932 Telecommunic. 8,228,246 11,365,241 10,809,481 10,679,923 11,331,623 Timbering 5,940 * * * * Trailer Court 8,860 16,291 13,866 14,681 9,485 Transportation, Warehousing 88,516,554 96,307,920 127,117,477 145,925,448 151,872,478 Utilities 112,266,878 176,751,210 166,669,401 149,208,806 129,513,782 Wholesale Trade 256,937,708 319,501,740 283,976,391 493,632,271 408,102,853 TOTAL 3,206,012,394 3,717,539,890 3,945,183,074 3,603,606,805 2,936,395,483 % change from year before -6% 9% 23% 6% Fig. 20 Source: Kenai Peninsula Borough Finance Dept *confidential KPEDD - 2015 Situations & Prospects page 19 Change in Kenai Peninsula Borough Gross Sales 2003-2013, Nominal and Real (inflation-adjusted) Real Change in (inflation-adjusted) gross sales, change in gross sales, 2003-2013 2003-2013 Line of Business ($ millions) ($ millions) Sales (Restaurant, Bars, Retail) $464 $275 Construction $322 $247 Production (O&G, mining, ag, fishing, $376 $320 hunting, seafood) Services $218 $182 Wholesale $114 $51 Utilities $97 $73 Tourism (A&E, Guides, Lodging) $6 -$43 Prof (Health Care, Professional) $104 $88 Manufacturing -$3 -$46 Property (Rentals) $25 $1 Transportation & Warehousing $65 $56 Public Admin (Govt) $7 $3 Grand Total $1,796 $1,206 Fig. 21 Real Percent Change 2003-2013 34% 78% 136% 118% 19% 70% -20% 125% -25% 1% 137% 19% 48% Source: Kenai Peninsula Borough Finance Dept; analysis Sheinberg Associates Between 2009 and 2013, every city except Seldovia had an increase in overall gross business sales (Figure 22). During this period, Seldovia sales decreased $471,000 or 11%. The City Profiles at the end of this report show city’s gross business sales in detail. Gross Sales by City 2003-2013 (in $millions) Fig. 22 4000 $ Millions 3000 2000 1000 0 2003 2004 Homer 2005 2006 Kenai 2007 Seldovia 2008 2009 2010 Seward KPEDD - 2015 Situations & Prospects page 20 2011 Soldotna 2012 2013 Other The top 20 taxpayers in the Borough (Figure 23) continue to be oil and gas producers, companies that supply goods and services to the oil and gas industry, telecommunications companies (ACS), utilities (Enstar), and major retailers (Walmart, Fred Meyer). Fig. 23 Top 20 Taxpayers in Kenai Peninsula Borough 2014 Taxable 2014 Assessed 2013 2012 Taxpayer Rank Value Rank Rank Hilcorp Energy Company 1 $461,096,690 1 Conoco Phillips 2 $240,642,477 2 2 Tesoro Alaska 3 $178,222,079 3 4 Cook Inlet Natural Gas Storage 4 $116,889,716 5 Alaska LLC ACS 5 $77,886,637 6 5 Xto Energy Inc 6 $61,522,320 7 6 Alaska Pipeline 7 $58,676,344 8 10 Kenai Offshore Ventures, LLC 8 $38,246,000 9 Cook Inlet Energy, LLC 9 $36,446,610 10 19 Enstar Natural Gas 10 $36,147,765 20 14 Wal-Mart Real Estate Business Trust 11 $26,434,900 11 8 BP Exploration 12 $25,852,110 13 9 Saxon Drilling 13 $24,349,490 Kenai Kachemak Pipeline 14 $23,946,630 12 7 Weatherford Us LP 15 $21,095,660 Armstrong Cook Inlet LLC 16 $20,627,850 15 Buccaneer Alaska, LLC 17 $18,841,850 Agrium Us Inc 18 $18,754,212 17 13 Cook Inlet Pipeline Co 19 $18,810,330 14 17 Fred Meyer 20 $18,185,068 19 12 Marathon Oil 4 3 GCI 16 11 Orion Offshore, Inc 18 Unocal 1 Phillips Gas Supply Co 15 Kenai Pipeline Company 16 Kenai Plaza Inc 18 Tulin Charles E & Helen L 10 Pacific Energy Resources Ltd Rowan Drilling Co Inc ARSC Energy Services Inc Homer Spit Properties Forest Oil Carrs Gottstein Home Depot 2008 2007 Rank Rank 3 1 3 2 6 7 11 6 8 11 14 15 5 5 8 9 9 12 10 4 15 7 12 10 4 20 2 13 17 1 13 17 18 16 18 19 20 Source: KPB Finance Dept. (values are based on KPB Certified Values for Tax Year at time of certification) KPEDD - 2015 Situations & Prospects page 21 14 16 19 Wages & Employment Trends The Whole Economy discussion at the beginning of this section combined employment and wage data with that of self-employed proprietors. This section looks only at employment and wage data provided by ADOLWD on a quarterly and annual basis, as this is the most often reported and detailed employment information available. Average monthly wages on the Kenai Peninsula are highest for employees in utilities, mining (oil and gas), and the federal government (Figure 24). Wages are lowest for those working in arts, entertainment and recreation businesses; accommodations and food services; other services; and retail trade. Fig. 24 Average Monthly Wages by Industry, 2013 Other Svs Accommodation, Food Svs Arts, Entertainment, Rec. Health Care, Social Asst Educational Svs Admin & Waste Svs $1,895 $1,584 $1,309 $3,139 $2,242 $3,159 Prof, Scientific, Tech. $4,772 Real Estate, Rental & Leasing $4,843 Finance & Insurance $3,930 Information $3,762 Utilities $8,724 Transportation, Warehousing Retail Trade $3,995 $2,294 Wholesale Trade $4,830 Manufacturing $4,823 Construction $5,302 Mining (incd O&G) Ag, Forestry, Fishing, Hunting Local Govt State Govt $8,404 $3,735 $4,001 $4,445 Federal Govt $6,113 Source: ADOLWD, QCEW Average monthly wages alone only tells part of the story. Average wages are shown on Figure 25, but in addition average monthly wages by business type are seen as a line across the chart. This shows there are far fewer jobs in high wage utility, oil and gas, and federal sector work compared to other work on the Peninsula. The sectors with the most employees are health care and social assistance; local government (which includes school, most of the peninsula's hospitals and clinics, and city, tribal and borough employees); retail trade; and accommodations and food services. KPEDD - 2015 Situations & Prospects page 22 Fig. 25 Number of Jobs (average) 3,500 $10,000 $9,000 $8,000 $7,000 $6,000 $5,000 $4,000 $3,000 $2,000 $1,000 $0 3,000 2,500 2,000 1,500 1,000 500 0 Employment Average Monthly Wage Monthly Wage (average) Average Monthly Employment and Wages, 2013, Kenai Peninsula Borough Source: ADOLWD, QCEW 6 Property Sales, Development, and Taxes Between 2010 and 2014: Almost 2,800 parcels of land sales totaling 7,370. Commercial growth centered in Kalifornsky, Soldotna, Nikiski, Kenai, and Salamatof. Residential development hotspots are Sterling, Kalifornsky, Homer and Soldotna. Land Sales Looking at where land has sold and for what purposes over the last four years is an indicator of economic activity in the Kenai region. Kenai Peninsula Borough data on Qualified Land Sales were analyzed to understand trends. Between 2010 and 2014, just under 2,800 parcels of land on the Kenai Peninsula totaling 7,370 acres were sold. Almost 1,040 were sales of land, 1,600 were sales of parcels with an existing structure (all but two were residential), and 160 sales had some type of smaller improvement (such as a driveway). Half of all sales occurred in six areas: Sterling (13%), Anchor Point (12%), Kalifornsky (10%), Nikiski (6%), Cohoe (5%), and Funny River (5%). The Qualified Land Sales maps show exactly where land sales occurred, based on the location and density of sales by square footage. KPEDD - 2015 Situations & Prospects page 23 Buildings Constructed Another piece of the real estate puzzle is understanding the number, type, size and location of newly constructed buildings. Between 2010 and 2014, a total of 2,973 new buildings and additions were constructed, adding 3.6 million square feet (sf) of built space on the Kenai Peninsula. This includes 2.1 million sf of residential development (new, additions, mobile homes, etc.) in 1,330 dwelling units and 1.5 million sf of commercial or industrial development (new, additions, fuel-tanks, etc.) in approximately 1,645 buildings. The six clusters that account for two-thirds of all building activity are around Kalifornsky (15%), Sterling (12%), Nikiski (11%), Soldotna (10%), Homer (9%) and Kenai (9%). Commercial growth is centered in Kalifornsky, Soldotna, Nikiski, Kenai and Salamatof (see Commercial Growth Maps). Building Development 2010-2015 (1st qtr), by total square feet Fig. 26 building square footage Kalifornsky CDP Sterling CDP Nikiski CDP Soldotna city Homer city Kenai city Salamatof CDP Anchor Point CDP Fritz Creek CDP Ridgeway CDP Diamond Ridge CDP Bear Creek CDP Fox River CDP Funny River CDP Cohoe CDP Ninilchik CDP Seward city Kachemak city Seldovia city Happy Valley CDP Hope CDP Seldovia Village CDP Kasilof CDP Nikolaevsk CDP Clam Gulch CDP Moose Pass CDP Cooper Landing CDP Lowell Point CDP Primrose CDP Halibut Cove CDP Beluga CDP Point Possession CDP Sunrise CDP 100,000 200,000 292,207 328,297 221,595 131,809 219,401 166,063 40,991 138,620 86,856 75,269 108,027 33,816 86,690 45,985 300,000 400,000 500,000 238,569 99,573 164,549 220,573 107,442 159,263 Residential (all types) Commercial or Industrial Sources: Kenai Peninsula Borough Tax Roll and Qualified Land Sales List KPEDD - 2015 Situations & Prospects page 24 Location of Land Sales, 2010-2015 (1st quarter) KPEDD - 2015 Situations & Prospects page 25 KPEDD - 2015 Situations & Prospects page 26 KPEDD - 2015 Situations & Prospects page 27 KPEDD - 2015 Situations & Prospects page 28 Property Tax Roll and Taxes While no one enjoys paying taxes, the strength of the region’s tax base is linked to its ability to withstand change yet still provide reliable revenue to support desired services and operations. The tax roll (the value of all assessed property in the borough) is thus part of the mix that contributes to a robust regional economy. Property tax rates have remained fairly steady in the Kenai Borough. Property tax rates vary by locality or Tax Authority Group (TAG). Property tax levy (mill) rates are set annually by the borough assembly, municipalities, and service areas boards. Example property tax mill rates are listed in Figure 27, and vary from a low of 5.9 (TAG 67) to a high of 11.30 (Homer). A mill is simply a thousandth of a dollar (1/1000 of $1 and represents one dollar of tax for each 1,000 dollars of taxable assessed value. Example Mill Rates within Kenai Peninsula Borough Place 2011 2012 2013 2014 Homer - TAG 20 11.30 11.30 11.30 11.30 Kachemak -TAG 80 7.80 7.80 7.80 7.80 Kenai - TAG 30 8.37 8.37 8.37 8.86 Seldovia - TAG 10 9.10 9.85 9.85 9.85 Seward - TAG 40 8.12 8.12 8.12 8.37 Soldotna - TAG 70 7.80 7.80 7.67 7.66 Fig. 27 Source: KPB Finance Dept The value of property typically slowly rises on pace with inflation. All things being equal, changes to the tax roll year over year are primarily due to changes in market conditions and to new growth. New growth includes subdivisions and new improvements. The value of Kenai Peninsula tax roll decreased 1% between 2013 and 2014 (Figure 28), or 4% if oil and gas property is excluded. The primary reason for the decline is that the borough code was changed to increase the exemption on all residential property from $20,000 to $50,000, which is the new maximum state law allows municipalities to offer. Even with the value of the tax roll decreasing between 2013 and 2014, property tax revenue increased everywhere except Soldotna. While overall property tax revenue collected between 2012 and 2013 followed the increased value of the tax roll that year, tax collection decreased in Kachemak, Seldovia and Soldotna. In Soldotna, property tax rates are currently at an historic low rate. KPEDD - 2015 Situations & Prospects page 29 Assessed Taxable Value (Tax Roll) by Place (in $millions) Percent Change 20132012Place 2003 2012 2013 2014 2014 2013 KPB Total $4,075 $6,452 $6,693 $6,638 -1% 4% Homer $313 $627 $618 $574 -7% 5% Kachemak $29 $63 $66 $56 -15% 8% Kenai $337 $694 $755 $711 -6% 9% Seldovia $16 $35 $35 $32 -8% 18% Seward $156 $223 $228 $213 -7% 13% Soldotna $269 $455 $455 $440 -3% 10% Outside cities $2,956 $4,355 $4,536 $4,613 2% 4% Fig. 28 Source: Alaska Taxable, Tables 6 and 6A, years 2014, 2013, 2012, 2003 Fig. 29 Place KPB Total Homer Kachemak Kenai Seldovia Seward Soldotna Property Tax Revenue, by Place (in $millions) Percent Change 201320122003 2012 2013 2014 2014 2013 $41.69 $54.07 $56.91 $58.67 3% 5% $1.54 $3.00 $3.06 $3.40 11% 2% $0.03 $0.07 $0.06 $0.07 2% -4% $1.41 $2.56 $2.89 $3.40 18% 13% $0.15 $0.18 $0.10 $0.21 109% -43% $0.71 $1.00 $1.01 $1.28 26% 1% $0.49 $0.60 $0.35 $0.27 -23% -42% Source: Alaska Taxable, Table 3, years 2014, 2013, 2012, 2003 KPEDD - 2015 Situations & Prospects page 30 7 KPB Economy: Industry Spotlights Oil & Gas Cook Inlet hosts several offshore oil and gas reservoirs within the Kenai Peninsula Borough (KPB), as do adjacent uplands. Since the first exploratory well found oil in 1900 and later Standard Oil and Union Oil’s exploration began in 1954, activity associated with oil and gas exploration, extraction, storage, processing/ manufacturing and delivery has generated significant economic activity in the region. Oil & Gas Industry Outlook Today, the oil and gas sector accounts directly for approximately 8% of employment and 15% of gross business sales activity on the Peninsula. Adding indirect and induced activity further increases the impact of this industry sector. The Kenai Peninsula has oil and gas infrastructure and know-how too, with an experienced onshore and offshore oilfield workforce dating back to the 1980s. Kenai Peninsula College offers three degrees tailored to the oil and gas industry and currently has 370 students enrolled in these programs. There is also an established and growing natural gas distribution grid (including storage facilities). For this report, oil and gas is defined to include oil and gas extraction (NAICS 211), oil and gas well drilling (213111), work on oil and gas field wells (213112), petroleum and coal products manufacturing (324), and chemical manufacturing (325). Business Activity Looking at the last 15 years on the Kenai Peninsula, the value of gross oil and gas sales bounced up and down between $213 million and $380 million until 2011. In 2011-2012, gross sales increased 2 to 3 times in value, which coincided with a 40% jump in the price of crude oil between 2010 and 2011 and significantly increased activity in Cook Inlet. Fig. 30 Oil & Gas Employment in Kenai Peninsula, and, Percent Oil & Gas is of all Employment, 2002-2013 2,000 10% 10% 8% 1,669 1,600 1,435 1,390 1,340 1,334 1,297 1,389 1,314 1,270 1,249 1,304 8% 6% 8% 7% 7% 7% 7% 1,400 8% 7% 7% 6% 1,800 1,200 1,000 7% 800 4% 600 400 2% 200 0% Oil & Gas Wage Employment 1,740 Oil & Gas Employment % of KPB Total Employment KPEDD - 2015 Situations & Prospects page 31 2013 2012 2011 2010 2009 2008 2007 2006 2005 2004 2003 0 2002 % of total KPB Wage Employment 12% Source: ADOLWD QCEW Data, A. Rodrigues Gross oil and gas sales over the last 15 years have accounted for between 8 to 24% of all KPB sales, and there is a strong relationship between oil and gas and overall business sales. Workforce and Wages There are approximately 60 businesses in this sector on the Peninsula. The KPB lists 61 oil and gas businesses registered for sales tax purposes (2015). The Alaska business license holder list shows 24 businesses in this sector whose physical address is in the KPB (2015). The ADOLWD employment database (QCEW) lists 37 businesses (including mining) with 1,492 employees in the KPB (2013), and the list of proprietors’ (self-employed) in the KPB for oil and gas shows 44 small businesses (2012). Oil and gas related employment as tracked by the State has declined on the Kenai Peninsula since 2002, but with a significant jump of 365 employees between 2012 and 2013. In 2013, oil and gas related employment in the borough averaged 1,669 jobs and $176 million in annual wages. Wages in the Cook Inlet oil and gas industry are the highest of any industry in the Borough, averaging $105,600 in 2013 ($8,800/month), more than twice the borough average of $46,000 ($3,840/month). Sector Trends, Issues, and Outlook The state lists over 70 occupations that support the oil and gas industry. Alaska‘s occupational forecasts prepared before the 2014/2015 oil price decline called for robust growth in the oil and gas industry in Alaska. A 2012-2022 industry projection called for almost 20% growth in mining (including oil and gas), well above the projected state average. However, oil and gas (and metal) prices fell significantly in 2014 and early 2015; as a consequence the state is facing a $3 billion+ revenue shortfall, and population growth is slowing. ADOLWD analysis of fall 2014 employment data though shows mining, including oil and gas employment, up 650 jobs compared to the same time in 2013. Oil & Gas Gross Sales in Kenai Peninsula, and, Percent of all Gross Sales, 2000-2013 30% $1,200,000,000 24% 25% 20% 13% 13% 15% 10% 18% 17% 15% 15% 15% 16% $800,000,000 $600,000,000 10% 9% $1,000,000,000 8% 8% 9% $400,000,000 5% $200,000,000 0% $0 Gross Sales Series1 % Oil & Gas of Total KPB Gross Sales KPEDD - 2015 Situations & Prospects page 32 Oil & Gas Gross Sales % Oil & Gas is of Total KBP Gross Sales Fig. 31 source: KPB Sales Tax Data Oil & Gas Prices. During the 2015 KPEDD Industry Outlook Forum regional oil and gas resource owners, developers, and regulators downplayed the current depressed oil and gas prices because: There is current demand and the potential for an intermediate and long-term shortage of natural gas in the region and the Railbelt area, which encourages investment in new gas production for the higher-value Alaska market despite lower natural gas prices in Lower 48 markets. Oil and gas development is an investment with decades-long return and amortization, so short-term price trends are less important — though certainly a factor in the availability of cash flow for corporate investment decisions. The Alaska LNG project, which could start production at its proposed Nikiski liquefaction plant and export terminal by 2025, would be a significant investment in the Kenai Peninsula, operating for decades. Though the project is still in its early stages of design and permitting, and a final investment decision is about four years away, there is significant activity in the region as part of the environmental review and design work. Reserves & Production. The Kenai Peninsula oil and gas industry has been declining since its oil production heyday in the 1970s and its gas production peak in 2001. Cook Inlet gas production fell by almost half from 2001 to 20111. The Agrium fertilizer production plant in Nikiski closed in 2007 due to concerns over lack of gas as feedstock for the plant; the ConocoPhillips liquefaction plant at Nikiski also stopped production, though it later reopened for limited cargoes of LNG; and uncertainty grew over remaining oil and gas in the area’s legacy fields. Since 2010 though, oil and gas related economic activity has escalated. Oil production in Cook Inlet has been up five years in a row – increasing by 50% since 2010, and capital spending in Cook Inlet has been up four years in a row.2 There were, on average, almost twice as many development wells drilled per year in 2012, 2013 and 2014 than in 2010 or 2011. “The number of Cook Inlet development wells drilled continues to reflect investment that is leading to increased oil and gas production,” according to the State of Alaska Department of Natural Resources, Division of Oil and Gas 2014 annual report. Cook Inlet is now producing about 15,000 barrels of oil per day3, up from about 10,000 barrels per day in 2010. This renewed growth is due to many factors, including: Changes and repositioning of reservoir owners and developers, with reinvigorated commitment to Cook Inlet opportunities, such as the purchase by Hilcorp Energy of Marathon and Chevron’s Cook Inlet assets. New gas exploration and production by companies like Hilcorp Energy, Armstrong Oil and Gas, Buccaneer Energy and Wilcox’s Cook Inlet Energy. 1 State Department of Natural Resources, Division of Oil and Gas L. Persily report, 2015 Kenai Industry Outlook Forum 3 Bradner, Tim, reporting for Alaska Dispatch, April 23, 2014 article on Northern Economic study. 2 KPEDD - 2015 Situations & Prospects page 33 Blue Crest Energy’s acquisition of 100% of the Cosmopolitan field leases and the company’s renewed exploration and development work. Blue Crest has reported it will conduct additional exploratory drilling this summer, both onshore and offshore, for both oil and gas. In addition, Blue Crest announced in February it will partner with WesPac Midstream LLC, which proposes to build a small gas liquefaction plant at Port McKenzie to serve the Alaska market. Blue Crest would supply gas to WesPac under the deal. Work on consolidation of four regional gas pipelines into a single system4 for efficiency. Furie Operating Alaska’s has reported it plans to resume its exploratory drilling work at the Kitchen Lights unit this year. State tax credits for oil and gas exploration work. drill pipe from well at the Cook Inlet 2010 legislation that set up tax credits and enabling statutory Natural Gas Storage Alaska. Photo: changes that encouraged ENSTAR to proceed with M. Scott Moon, Peninsula Clarion. development of a gas storage facility in a depleted Kenai Peninsula gas reservoir. The gas storage facility allows Southcentral utilities to purchase gas year-round to have available to meet peak winter needs. Nabors Alaska Drilling workers pull Gas Pipeline. Today, the most significant issue for the region is whether or not a gas pipeline will be built to deliver North Slope natural gas along the Railbelt to a liquefaction plant and marine terminal, to be built at Nikiski for LNG export shipments. Two potential projects are at play. The project with more momentum is the Alaska LNG project, being developed by ExxonMobil, BP, ConocoPhillips, TransCanada and with the state as a 25% equity partner. The other is the Alaska Gasline Development Corporation project, a smaller-volume state-owned state-supported pipeline that was created by the Legislature several years ago as a backup plan to get gas to Alaskans if the large-volume producer-led project fails to move forward. There is current discussion about the possibility of upsizing this smaller-volume line to allow for LNG export shipments, in addition to meeting local gas demand. The governor said he hopes the producer-led venture moves ahead, but wants the state to be better prepared if not. He had provided few details of his initiative as of early March 2015. The Alaska LNG project cost is estimated at $45-$65 billion (2012 dollars), and includes a gas treatment plant on the North Slope to remove carbon dioxide and other impurities; an 800-mile, 42 inch-diameter pipeline that would move 3-3.5 billion cubic feet of natural gas per day; and the LNG plant and marine terminal at Nikiski. The plant would have the capacity to make up to 20 million metric tons a year of LNG, about 2.5 billion cubic feet a day of gas. Enstar Natural gas company, Tesoro Alaska Co LLC, Homer Electric Association, Hilcorp Alaska LLC (subsidiary of Kenai Beluga Pipeline LLC 4 KPEDD - 2015 Situations & Prospects page 34 The project is in a pre front-end engineering and design (pre-FEED) phase, expected to be completed in early 2016. The project sponsors in February 2015 submitted to the Federal Energy Regulatory Commission (FERC) their first round of draft engineering and environmental reports — called “resource reports.” FERC in March 2015 issued its Notice of Intent under the National Environmental Policy Act to start the public scoping process for the project, which will include public meetings statewide during the year to take public comment on which issues and concerns FERC should address in its environmental impact statement on the project. At the time of printing, meeting dates have not yet been announced. FERC will use the data in the resource reports in preparation of the EIS. The project sponsors have reported they plan to submit their complete application to FERC in the third quarter 2016 and hope for FERC action on a final EIS in 2018. The project sponsors and the state could to be in a position to make a final investment decision on Alaska LNG by early 2019. Construction could take five years from the investment decision, with first gas moving through the line in 2024-2025 — if all goes according to schedule. Among the uncertainties that could affect an investment decision in the Alaska LNG project are: Status of competing LNG proposals including Pacific NorthWest LNG in British Columbia (led by Malaysia’s oil and gas company Petronas), a Shell-led proposed LNG project in British Columbia; several more LNG hopefuls in the Canadian province; the multiple LNG export plants proposed for the U.S. Gulf Coast; six LNG plants under development in Australia; and LNG projects proposed in Russia, Tanzania and Mozambique — all targeting the same global market as Alaska. The success of North Slope gas producers in their gas marketing efforts for the Alaska LNG project. The project sponsors’ abilities to manage costs in a very competitive marketplace. The North Slope producers and the state agreeing to fiscal terms that balance public revenues from a state resource with the need for fiscal stability required for such a longterm, capital-intensive private investment. Determining the best pipeline route and meeting environmental challenges to get the pipeline across Cook Inlet, with its beluga whale and salmon habitat concerns, ice and tides, and existing pipelines and oil and gas production platforms. U.S. Department of Energy authority to export Alaska natural gas worldwide, specifically to countries that lack free-trade agreements with the United States (such as China, India, Japan and Taiwan). The Alaska LNG application, filed in 2014, was pending at the Energy Department as of March 2015. ConocoPhillips Kenai LNG Facility KPEDD - 2015 Situations & Prospects page 35 Health Care and Social Assistance Health Care & Social Assistance is an increasingly important economic engine in the Kenai region. Wages & Employment In 2013, the Health Care & Social Assistance sector accounted for 3,250 jobs and over $125 million in payroll on the Kenai Peninsula. This is approximately 16% of the region’s total workforce and 13% of the region’s total wages. The majority is in health care, with 2,400 jobs and a $101 million payroll. Employment growth in Health Care & Social Assistance averaged 8% per year between 2003 and 2013, while wages grew at an average annual rate of 13% per year.5 Health Care & Social Services Employment & Earnings Kenai Peninsula Region, 2002-2013 Fig. 32 3,500 3,000 2,500 2,631 2,709 2,934 3,030 3,095 3,251 2,000 $80 1,945 1,917 1,500 1,000 $120 1,269 1,482 1,545 1,562 $40 500 0 Real Earnings ($ Millions) Monthly Avergae Employment Health Care & Social Assistance Industry Outlook $0 2002 2003 2004 2005 2006 2007 2008 2009 2010 2011 2012 2013 employment Fig. 33 Sources: ADOLWD,QCEW and Central Peninsula Hospital earnings Health Care & Social Assistance Employment Kenai Peninsula Region, 2013 Social Assistance, 838 Out Patient Health Care, 1,208 26% 37% 37% Hospitals, Nursing & Residential Care 1,205 5 Sources: ADOLWD QCEW, Central Peninsula Hospital KPEDD - 2015 Situations & Prospects page 36 Source: ADOLWD, QCEW Business Activity Most sales of medical services are tax exempt on the Kenai Peninsula; however, businesses and nonprofits must report their gross sales prior to taking their legal exemptions. Health Care & Social Assistance businesses on the Kenai generated $20.4 million in sales in 2013. This is a 3.5% total increase over 2008 gross sales of $19.7 million (or a 0.7% average annual increase). It is noteworthy that gross sales peaked in 2011 and have decreased $3 million since then even though Kenai Borough population increased by 190 people during this period (2011 to 2013). While declining sales aren’t desired from a straight economic perspective, given the pressure to control health care spending and try new approaches (see sector trends and outlook) this may be a trend in the ‘right’ direction for the sector. Fig. 34 Business Activity - Gross Sales for Health Care & Social Assistance Businesses on Kenai Peninsula, 2008-2013 Outside of Cities $20,000,000 Seldovia $15,000,000 Seward $10,000,000 Kenai Homer $5,000,000 Soldotna $0 2008 2009 2010 2011 2012 2013 KPEDD - 2015 Situations & Prospects page 37 source: KPB Finance Dept. Kenaitze Dena’ina Wellness Center. Cannery workers wrote their names and dates of work on the rafters of the warehouse at the Kenai Wards Cove cannery. Some date back to the 1920s Photo by Pat Dixon, from redoubtreporter.files/wordpress.com. Types of Jobs. State business license records list 275 health care and social assistance businesses physically located on the Kenai Peninsula. ADOLWD occupational data shows at least 25 jobs on the Kenai Peninsula in each of the following occupations: Licensed Practical and Licensed Vocational Nursing Assistants Nurses Dental Assistants Personal Care Aides Dental Hygienists Pharmacists, Pharmacy Technicians Family and General Practitioners Physical Therapist Aides Health Educators Physical Therapists Healthcare Support Workers, All Other Physicians and Surgeons, All Other Home Health Aides Radiologic Technologists Massage Therapists Recreational Therapists Mental Health Counselors Registered Nurses Medical Assistants Rehabilitation Counselors Medical Records and Health Information Speech-Language Pathologists Technicians Mental Health and Substance Abuse Social Substance Abuse and Behavioral Disorder Workers Counselors Medical and Clinical Laboratory Veterinary Assistants and Laboratory Animal Technologists Caretakers Nurse Practitioners Veterinary Technologists and Technicians Health Insurance According to the 2011-2013 American Community Survey, 12,127 residents or about 22% of the borough’s residents do not have health insurance coverage. Of those that do, just over one-quarter receive public coverage (Medicaid, Medicare) and the remainder have coverage from private insurance sources. These numbers represent the situation just before Affordable Care Act insurance opportunities opened (late 2014). KPEDD - 2015 Situations & Prospects page 38 Kenai Peninsula Borough HEALTH INSURANCE COVERAGE (2011-2013) Civilian population With health insurance coverage No health insurance coverage Fig. 35 Estimate 55,596 43,469 12,127 % of Total 78% 22% Source: US Census ACS 2011-2013 3-Year Survey Major Health Care Providers One employer, the Central Peninsula Hospital (CPH), accounts for over one-quarter of this sector’s employment and half its wages. CPH is located in Soldotna and is a community-owned hospital with a KPB lease, operating agreements, and its own Board of Directors. There are a number of facilities and services under the CPH umbrella including the 49-bed Hospital, the 60-bed Heritage House with long-term skilled nursing care, six family and specialty physician services clinics, and a new specialty medical office building that is under construction and scheduled to open in January 2016. The hospital provides emergency medical services regardless of ability to pay and also promotes wellness services for all. CPH has 798 total employees and in FY 13 had a $69.5 million payroll, and an estimated 245 volunteers 6. South Peninsula Hospital (SPH) in Homer is a Critical Access Hospital (CAH) named a Top 100 CAH out of 1300, in 2011) offering an emergency room, 18-bed acute care, and several other health and wellness services. They also run a 28-bed long term and extended care facility. The facility is a non-profit organization governed by a Board of Directors. In FY 2013, SPH had 412 total employees with a $30.1 million payroll, and an estimated 40 volunteers 8. The new Dena’ina Wellness Center, a 52,000 sf facility incorporating traditional Kenzitze design elements, just opened in 2014 in Kenai. It offers medical, dental, behavioral health, chemical dependency, wellness, physical therapy, pharmacy support and traditional healing services all beneath one roof for Alaska Native/American Indian beneficiaries on the Peninsula. Between health care and other services 3700 customers were served in 2014. Sector Trends, Issues, and Outlook Industry Growth. The health care industry in Alaska has been one of the fastest growing economic sectors for 20 years. Direct spending in Alaska in 2009 on personal health care was $6.4 billion, and the average annual growth in health care spending in Alaska between 1991-2009 was 8.4% each year (CMS, National Health Statistics). Including health insurance, government health expenditures, and related activities, the health sector represented 14% of Alaska’s GDP in 2012 (McDowell Group/Sheinberg Associates, 2014 Juneau Economic Plan). Over the last decade medical care has shifted from predominantly acute care to chronic disease management. There is increased emphasis on integrating prevention and behavioral health into full-patient care. These trends will continue into the future. Increasing Seniors. The senior population on the Kenai Peninsula is increasing. Currently, 8,100 people (14%) on the Kenai Peninsula are 65 or older; by 2027 it is projected that 14,800 people (23%) will be over 65. The number over age 85 is expected to increase four-fold over 30 years, from about 670 in 2014 to 3,270 in 2042. This is already creating a challenge; for example recently CPH’s acute 6 IRS Form 990 and verbal reports KPEDD - 2015 Situations & Prospects page 39 care census was almost one-third filled with patients age 85 or older that would be better served by home health and hospice services if they were more available. As the senior population grows, demand will increase for services to assist people to age in place, for traditional assisted living and long-term care, for home health, hospice, palliative care, respite care, and related services. Medicaid Expansion, Health Care Reform. A “perfect storm” in 2015 is shining a spotlight on Alaska’s health care system and spending. This situation is due to the convergence of the $3 billion plus state operating budget deficit (due to declining oil prices), the fact that health and social services expenditures combined with education comprise the majority of state agency spending, and the opportunity to move forward with Medicaid expansion. There is pressure from both the Alaska Legislature and executive branch to reform the health care system and reduce the growth of health care spending. Kenai is in an interesting position in this regard. CPH is a community owned hospital in good financial shape that employs a large number of health care providers in the region. Some suggest that the Kenai region is well-positioned to initiate a pilot project to form a Coordinated Care Organization and move toward “global payments” for health services. This type of system incentivizes focus on more efficient service to a patient’s holistic health needs. The Kenai Borough is exploring the idea of joining the SPH and CPH Hospitals and running them under one Board. Top Borough and health care administrators are pro-actively thinking about the shape of long-term sustainable health care on the Peninsula. Needs of Gas Pipeline Workforce. Another important future concern is the impact to Health Care & Social Assistance needs if the gas pipeline is built and terminates in Nikiski with an LNG plant. Expanding hospital and health care services cannot be done overnight. One official familiar with medical facility costs suggested that an increase of 5,000 people on the Kenai could create a demand for 10-25 more hospital beds or related space at a rough cost of $100 million. This type of expansion typically needs a 15-year planning window, yet if the gasline goes there will not be 15 years to plan and meet service demands. KPEDD - 2015 Situations & Prospects page 40 The Maritime Sector The Kenai Peninsula is home to at least 3,068 workers in a maritime-related job, who earned $172 million in 2013, with an average income of $56,000. When aggregated, ocean-related work is the single biggest “sector” on the peninsula. The state of Alaska and several municipalities are looking closely at the Maritime Maritime Economy for several reasons: Industry Alaska has more coastline than all the other United States combined, Outlook is dependent on marine transshipment given our location, has world class commercial fishing operations, retreating sea ice is increasing the accessibility of the Artic and creating new economic opportunity, that the State’s proximity to Asia it an asset for marine transshipment, and the state’s fiscal dependence on oil revenue has increased the need to diversify the economy. Maritime jobs are all work related to the ocean. This includes fishermen, cannery workers, barge line operators, aquarium researchers and employees, ferry workers, boat builders and repair operations, educators geared toward maritime professions, sport fish guides and whale watch charters, marine biologists and surveyors, fishing crew, fishing gear retailers, fish wholesalers and much more. The Kenai Peninsula region is clearly on the “Maritime Map” and has a significant ocean-based economy: NOAA ranks the commercial fish ports of Seward, Kenai, and Homer as 15th, 26th and 46th (respectively) in the US in 2013 in pounds of fish landed. Cumulatively these three ports landed 130.2 million pounds of commercial fish that generated $135.4 million in ex-vessel value in 2013. Seward’s Alaska Vocational Technical Center (AVTEC) is home to the Alaska Maritime Training Center, whose goal is to promote safe marine operations by effectively preparing captains and crew members for employment in the Alaskan maritime industry. Courses are delivered through the use of a world class ship simulator, state of the art computer based navigational laboratory, and modern classrooms equipped with the latest instructional delivery technologies. The University of Alaska Fairbanks/National Science Foundation research vessel SIKULIAQ is now homeported in Seward. The Cook Inlet/Kenai River salmon run supports the most popular sport and personal use fishery in the state. KPEDD - 2015 Situations & Prospects page 41 In May 2014, the City of Seward and Vigor Industrial inked the transfer of the Seward Ship Drydock and Chandlery’s assets and contracts to Vigor. This drydock business began in 1973 and now joins Vigor’s family of nine shipyards in Oregon, Washington and Alaska. Seward is one of only four communities with drydocks in the state. Homer is focusing on its growing marine trade services. According to Homer’s Mayor White, the City issued a $4.2 million revenue bond that leveraged $30 million in improvements at the harbor area by federal and state agencies and private businesses. A number of marine trades businesses are investing here. The Seward SeaLife Center is Alaska’s only public aquarium and ocean wildlife rescue center. The Alaska Clean Harbors non-profit program, working with harbors around the state, is based in Homer. Cook Inlet is home to approximately 1,584 marine vessels over 28 ft. Commercial fishing vessels make up the majority of vessels and account for a higher gross tonnage than any other category. Recreational vessels make up the second largest category, both in terms of vessel count and gross tonnage. The average Cook Inlet vessel is 41 ft. long, 35 gross tons, and 29 years old7. AVTEC Maritime Class Even with this myriad of ocean-related enterprises, the regional maritime industry has not been measured. This is due to the way economic data is typically quantified. The NAICS codes that comprise maritime work and economic activity are part of many different industry sectors, so they are “hidden” as part of other work. As a result, maritime contributions to the economy are typically overlooked. Alaska SeaLife Center in Seward 7 Alaska Maritime Industrial Support Sector, McDowell Group, 2014 KPEDD - 2015 Situations & Prospects page 42 The 2015 Situations and Prospects report quantifies the Kenai Peninsula region’s maritime economy for the first time. Fig. 36 Kenai Peninsula Region Maritime Employment and Earnings, 2013 No. of Firms Total Wages Average Annual Employment Average Annual Wages 1,498 $96,239,000 1,498 (gross income) 44 $21,200,583 545 $38,900 68 $19,701,920 386 $51,040 Marinas, Boat Dealers, Boat Building 2 11 $4,430,137 106 $41,794 Mixed Marine Manufacturing, Education, Boat Repair & Maintenance 2 9 $2,787,253 66 $42.223 Mixed Marine Leisure & Hospitality 2 55 $4,416,677 158 $27,954 Mixed Marine Professional, Scientific, & Technical Services 2 31 $19,925,368 281 $70,909 4 $3,669,741 28* $131,062* * Total Kenai Region Maritime 1,746 $172,370,679 3,068 $56,183 State government maritime (ADF&G, AMHS) UNK UNK UNK Federal government maritime employees (NOAA, USCG) UNK UNK UNK $64,245 Fishing (self-employed)1 2012 Fishing and Seafood Processing 2 (with employees/ payroll, including aquaculture, fishing, seafood processing, wholesalers, seafood markets) Water Transportation 2 (water guides, tours, support) (e.g. marine surveyors, engineering, fisheries research) Local Government Employees 3 Sources: 1 2012 US Census Nonemployer Statistics 2 ADOLWD QCEW data/research by M. Abrahamson and C. Bell 3 Local Government data excerpted from FY 15 and FY 13 actual operating budgets from Seward, Homer, Seldovia, and Kenai River Center; * employment is estimated from web listings of employees by department ** includes full, salary, benefits, insurance, etc. Data compiled by Sheinberg Associates KPEDD - 2015 Situations & Prospects page 43 Sector Trends, Issues ,and Outlook This is a very diverse sector and the outlook is positive. There are several opportunity areas, including but not limited to: Artic Support. Due to climate change and advancing technologies, more vessels are operating in Arctic waters. The increase in arctic maritime activity associated with research, fishing, a shipping/regulatory presence, and oil and gas exploration on Alaska’s outer continental shelf (OCS) all have the potential to impact maritime service demands. Seward experienced this in 2014 as its taxable sales increased 12% when an artic drilling rig was homeported there. A focus at the Seward Marine Industrial Center now is on expanding infrastructure to support arctic development. Homeport Vessels in Alaska. The Alaska Community Development Quota (CDQ) Group Coastal Villages Region Fund (CVRF) is in the process of moving its fishing fleet from Seattle to Seward. There are five CVRF vessels there now and harbor improvements are being completed now to build a basin enclosure to protect the moored vessels and docks. Boat Building and Repair. There are growing opportunities in boat building and repair. Homer and Seward already have a number of small and large boat repair and build businesses, and are wellpositioned to expand through “cluster development.” This strategy focuses on the symbiotic nature of multiple industries benefiting each other and boosting overall economic growth. As one sector grows, other sectors are strengthened and a feedback loop is created. By 2025, the Alaska fleet will include roughly 3,100, 45+ year old vessels, between 28 ft. and 59 ft. In addition, several thousand skiffs and smaller craft will near the end of their lifecycles. Alaska firms are best suited to designing and building or assembling small vessels close to the waters where they will be used. Coal Transshipment. The Seward Coal Loading Facility is at the southern terminus of the Alaska Railroad. It is the only facility in Alaska available to accommodate export of Usibelli coal. This infrastructure is a strategic asset, though ongoing maintenance and care to coal dust and other environmental issues are required. It is operated by Aurora Energy Services for the Alaska Railroad. Export volumes respond to market conditions and recently the price and exports for Usibelli’s calorie value coal has decreased on the world market. This has resulted in decreased exports to Japan, Korea and China. Also, Alaska’s coal competes with Australian and Indonesian coal. Fig. 38 2009 801,254 Coal - Metric Tonnes Delivered to Seward 2010 2011 2012 2013 2014 953,329 1,083,757 871,935 574,755 465,079 Source: Alaska Railroad Corporation Vessels. The Alaska Maritime Industrial Support Sector study(McDowell Group, 2014) found that slightly over half of Cook Inlet’s vessels were built in the 1970s and 1980s, which is similar to the entire Alaska fleet. However, Cook Inlet has a larger number of vessels built after 1990. In terms of length, while the region is home to 129 vessels 50 ft. or greater, 86% of Cook Inlet vessels are shorter than 50 ft. While Anchorage and Mat-Su contain much of the region’s population, Homer is by far the largest regional port in terms of vessel counts. Homer is home to 440 commercial fishing boats, 84 recreational boats, and 54 passenger vessels (plus 19 other miscellaneous vessels). Seward is home to 167 recreational boats, 62 commercial fishing boats, and 61 passenger vessels. KPEDD - 2015 Situations & Prospects page 44 Cook Inlet Fleet Profile by Vessel Type (reproduced from Alaska Maritime Industrial Support Sector, McDowell Group, 2014, page 21) Commercial Oil & Pass. & Fishing Recreation Gas Cruise Tugs Barges Other Vessel Vessel Count 866 466 35 153 21 12 31 Vessel % 55% 29% 2% 10% 1% 1% 2% Tonnage Gross Tonnage (GT) 21,905 8,579 3,457 6,341 2,079 7,382 5,050 GT % 40% 17% 7% 13% 4% 15% 10% Average Average Age 31 25 16 26 26 32 27 Average Length 39 37 59 46 75 139 64 Average GT 25 18 99 41 99 615 163 Fig. 37 Total 1,584 54,793 29 41 35 Source: McDowell Group Alaska Fleet Vessel Database Commercial Fishing and Seafood Processing While commercial fishing and seafood processing are a part of the Peninsula’s Maritime Sector, the economic strength and importance of these jobs, businesses, and activities merits its own report section. The Kenai Peninsula Borough (KPB) has a long history of commercial fishing and seafood processing. Today 1,430 KPB residents hold commercial fishing permits. Most of the permits are for salmon. Almost 40% of all area permit holders live in Homer, followed by Kenai, Soldotna, and Kasilof. Commercial Fishing & Seafood Processing Outlook. Nice 4-5 year up trend, but some unknowns Sockeye salmon are the commercial money fish in Cook Inlet, accounting for 93% of the salmon ex-vessel value in 2014. The borough’s commercial fishing harvest value peaked in 1984 at $158.1 million. Since 2002, the value of the harvest is steadily growing (except for a jump in 2008 followed by a decline in 2009). Commercial fishing earnings for Kenai region residents have exceeded $125 million for each year between 2010-2013, with full 2014 numbers not out yet. High levels of commercial fishing coincide with high levels of fish processing. There are approximately 20 seafood-processing operations located in Kenai, Homer, Kasilof, Soldotna, Seward, and Ninilchik. These range from smaller value-added operations to large statewide processors. The largest plant is Icicle Seafoods in Seward, a national company currently being sold. State 2013 ADOLWD processor data shows 2,204 seafood processing jobs on the Peninsula in 2013 of which 939 were filled by Alaskans8. Seafood processing wages in the KPB totaled $8.5 million in 2013. 8 http://labor.alaska.gov/research/seafood/statewide/AKSFPBorca.pdf KPEDD - 2015 Situations & Prospects page 45 Processors share approximately 3% of the value of the fish they processed with the state, which then shares half of this with the municipality where the processors are located. Commercial drift gillnetting boat leaves the mouth of the Kasilof River at about 1 am July 2014 during an overnight fishing period. Photo by Rashah McChesney, Peninsula Clarion In 2014, the Kenai Peninsula Borough received $933,000 in shared fishery taxes. This translates roughly to $62 million in ex-vessel worth of fish processed in local plants. The more value per fish that processors can add, the higher their earnings will be. Kenai Peninsula Resident’s Commercial Fishing Activity and Earnings KPB has 1.4% of Alaska’s population, yet gross earnings to KPB residents from commercial fishing accounted for 7.1% of the state’s total commercial fish earnings in 2013. This is typical; over the last 20 years borough residents have earned between 5.4% and 8.4% of all commercial fishing earnings in the state (Figure 39). In 2013, 1,097 KPB residents fished 1,504 commercial permits statewide and landed 185.5 million pounds of fish worth $136.5 million (Figure 40). The majority of the harvest, at just under threequarters (71%) of residents total commercial fishing earnings, was in the salmon fishery. That same year, KPB residents fished 12.6% of all Alaskan salmon permits. Those Kenai region residents harvested 131.1 million pounds of salmon statewide with estimated gross earnings of $97.6 million. That is a 46% increase in earnings compared to resident’s 2012 estimated gross of $66.7 million from salmon fisheries. KPB Resident - Total Commercial Fisheries Earnings as Percent of Alaska's Total Commercial Fisheries Earnings 10% 8% 6% 4% 2% 2013 2012 2011 2010 2009 2008 2007 2006 2005 2004 2003 2002 2001 2000 1999 1998 1997 1996 1995 1994 1993 1992 1991 0% 1990 Source: CFEC Fishery Statistics Fig. 39 In 2012, KPB residents owned 1,067 commercial fishing vessels, 98 tender/packer vessels, and four freezer/canner vessels. The number of commercial fishing vessels owned by KBP residents declined for many years until a 2008 low of 938 vessels; since then the number has been rising. KPEDD - 2015 Situations & Prospects page 46 Fig. 40 Year 1990 1991 1992 1993 1994 1995 1996 1997 1998 1999 2000 2001 2002 2003 2004 2005 2006 2007 2008 2009 2010 2011 2012 2013 KPB Resident Permit and Fishing Activity By Year All Fisheries, All Areas, All Permits KPB Resident Permit Activity No. No. Permit Permits Holders Issued 2,116 2,007 1,898 1,737 1,698 1,590 1,556 1,562 1,543 1,530 1,549 1,538 1,473 1,466 1,441 1,399 1,407 1,407 1,396 1,408 1,428 1,434 1,434 1,429 4,261 4,166 4,033 3,615 3,476 3,069 2,920 2,991 2,872 2,692 2,657 2,542 2,307 2,251 2,227 2,163 2,136 2,121 2,122 2,176 2,206 2,296 2,296 2,216 KPB Resident Fishing Activity No. Est. Gross No. Permits Total Pounds Earnings Fishing Fished Landed in $ 1,644 1,554 1,504 1,381 1,335 1,286 1,266 1,264 1,188 1,189 1,181 1,105 1,030 1,058 1,035 1,043 1,025 999 1,025 1,024 1,024 1,079 1,079 1,097 2,531 2,614 2,616 2,265 2,268 1,970 1,946 1,945 1,757 1,680 1,688 1,573 1,393 1,427 1,401 1,414 1,364 1,344 1,353 1,399 1,405 1,507 1,507 1,504 100,460,969 102,171,040 148,101,691 105,093,973 105,081,537 110,305,028 95,855,308 102,663,420 97,729,436 108,115,355 101,421,496 97,867,559 104,430,925 102,080,093 112,143,976 138,982,655 112,739,074 146,579,950 129,394,179 122,005,714 171,744,645 148,452,292 148,452,292 185,479,739 95,915,261 67,522,748 129,360,059 71,356,009 79,168,409 74,591,534 73,274,247 68,871,308 50,210,350 79,347,712 62,374,454 47,599,968 52,677,656 64,606,377 71,238,837 77,352,281 76,759,760 99,431,356 107,634,696 85,028,773 125,126,250 124,888,822 124,888,822 136,515,228 Statewide Est. Gross KPB Earnings Resident in $ % of Total 1,721,666,600 1,648,696,166 1,822,322,655 1,237,935,397 1,433,455,315 1,370,930,869 1,125,424,836 1,000,483,977 795,952,527 1,169,030,511 955,726,572 793,474,058 796,148,357 938,194,005 990,019,285 1,122,052,241 1,168,678,059 1,298,832,267 1,488,137,938 1,149,586,999 1,487,015,419 1,869,719,562 1,881,387,782 1,909,477,746 5.6% 4.1% 7.1% 5.8% 5.5% 5.4% 6.5% 6.9% 6.3% 6.8% 6.5% 6.0% 6.6% 6.9% 7.2% 6.9% 6.6% 7.7% 7.2% 7.4% 8.4% 6.7% 6.6% 7.1% Source: CFEC fishery statistics Icicle Seafoods Seward plant, file photo by Heidi Zemach, Seward City News KPEDD - 2015 Situations & Prospects page 47 Cook Inlet Salmon Fisheries The average value of a Cook Inlet purse seine permit jumped $15,000 between 2013 and 2014 and is at its highest value since 1996, at $86,000. The value of Cook Inlet drift salmon gill net permits dropped a bit this year but are still near $74,400, a 20-year high. Cook Inlet sockeye salmon accounted for 74% of all pounds of salmon commercially harvested in Cook Inlet (CI) in 2014. That year, the average Cook Inlet sockeye harvested weighed 6.06 pounds, down from 6.25 pounds during the 2013 season and a little below the rolling 5-year average weight. Prices vary from year to year but have generally been building since 2002 for Cook Inlet commercial sockeye. The average price per pound in 2014 for sockeye was $2.25 per pound, the same as 2013. This high price per pound has increased the economic value of the fishery, and is at least partly due to the high quality handling by fishermen and success of the fresh frozen market. The number of harvested sockeye decreased from 2.74 million fish during 2013 to 2.56 million fish during 2014. Likewise, pounds of harvested sockeye decreased from 26.7 million pounds during 2013 to 21.1 million pounds during 2014. The total ex-vessel values for Cook Inlet sockeye decreased from $38.5 million in 2013 to $35.0 million during 2014. There are no factors on the horizon raising any concerns about run size according to ADF&G biologists. The Cook Inlet region has seen a period of low, below average King Salmon runs since 2009. That trend is anticipated to continue during the 2015 season. To reach desired escapement, ADF&G has for the last several years closed or limited commercial set net fishing along the east side of Upper Cook Inlet and highly regulated the sport catch of King Salmon. As a result, the value spread of the harvest between setnet and drift net gear groups is changing (Figure 41). In 2012, a year with major set net limits, the percent of salmon harvest by set net dropped from 36% of the total Cook Inlet salmon catch the year before to 8% of the catch in 2012. The percent caught by set netters was back up to 25% in 2013 however (a full dataset from 2014 is not available). The overall harvest of red salmon isn’t necessarily being affected but the gear group and individuals catching it are shifting. Pounds Harvested in 1000s 40,000 $60,000 35,000 $50,000 30,000 $40,000 25,000 20,000 $30,000 15,000 $20,000 10,000 $10,000 5,000 0 $0 Pounds of CI Sockeye Harvested Ex-Vessel Value CI Sockeye Pounds of all CI Salmon Harvested by SetNet KPEDD - 2015 Situations & Prospects page 48 Ex-Vessel Value in $1000s dollars Cook Inlet Sockeye Harvest Fig.41 Sources: ADFG Fishery Statistics, CFEC SO4H harvests 0 800 600 400 200 0 Cook Inlet PINK Salmon 10,000 5,000 0 2,500 2,000 1,500 1,000 0 3,000 Cook Inlet CHUM Salmon 2,000 1,000 0 1997 1998 1999 2000 2001 2002 2003 2004 2005 2006 2007 2008 2009 2010 2011 2012 2013 2014 1997 1998 1999 2000 2001 2002 2003 2004 2005 2006 2007 2008 2009 2010 2011 2012 2013 2014 10,000 1997 1998 1999 2000 2001 2002 2003 2004 2005 2006 2007 2008 2009 2010 2011 2012 2013 2014 1997 1998 1999 2000 2001 2002 2003 2004 2005 2006 2007 2008 2009 2010 2011 2012 2013 2014 30,000 1997 1998 1999 2000 2001 2002 2003 2004 2005 2006 2007 2008 2009 2010 2011 2012 2013 2014 1997 1998 1999 2000 2001 2002 2003 2004 2005 2006 2007 2008 2009 2010 2011 2012 2013 2014 40,000 1997 1998 1999 2000 2001 2002 2003 2004 2005 2006 2007 2008 2009 2010 2011 2012 2013 2014 1997 1998 1999 2000 2001 2002 2003 2004 2005 2006 2007 2008 2009 2010 2011 2012 2013 2014 Pounds Harvested (in 1000s) Cook Inlet SOCKEYE Salmon Cook Inlet CHINOOK Salmon $3,000 Cook Inlet COHO Salmon $1,500 $2,000 1997 1998 1999 2000 2001 2002 2003 2004 2005 2006 2007 2008 2009 2010 2011 2012 2013 2014 1997 1998 1999 2000 2001 2002 2003 2004 2005 2006 2007 2008 2009 2010 2011 2012 2013 2014 Source: ADF&G, Alaska Commercial Salmon Harvests and Ex-vessel Values Figures 42-51 with 5-year moving average trendlines Ex-Vessel Value (in $1000s) $60,000 Cook Inlet SOCKEYE Salmon 20,000 $40,000 $20,000 $0 $1,000 $800 $600 $400 $200 $0 Cook Inlet CHINOOK Salmon Cook Inlet PINK Salmon 15,000 $2,000 $1,000 $0 Cook Inlet COHO Salmon $1,000 $500 500 $0 Cook Inlet CHUM Salmon $1,500 $1,000 $500 $0 KPEDD - 2015 Situations & Prospects page 49 The City of Kenai occupies a unique position in that four distinctly different fisheries take place within the City’s boundaries: commercial, sport, personal-use, and educational fisheries. Given this, the City works diligently with other agencies to support sustainable fisheries harvests. Kenai River DipNetting. The rapid growth of the Kenai River personal use dipnet fishery has added a 250,000-400,0000 sockeye fish harvest in a short time period to the management mix; beginning in 2013, harvest of King Salmon was prohibited. The City of Kenai bears management expenses that nearly equal revenue for this fishery. For example, in 2014 the City instituted a tide dependent no wake zone for a 6,000 foot segment of the south river bank to reduce erosion; eliminated an access and improved another, and is constructing a new access at the Kenai River mouth; maintained solid waste and pit toilets, and provided police foot and boat patrols. Revenue was generated from municipal boat launch and parking fees. Cook Inlet Halibut and Sablefish Fisheries Halibut fishers are another player in the KPB commercial fishing industry, though the pounds landed at KPB ports has been declining significantly since 2002, as it has been all over the state coincident with quota reductions. In 2014, 673 vessels landed 4.5 million pounds of halibut at three ports in the KPB: Homer, Seward, and Kenai, with over half the effort at Homer. Excluding confidential data, Homer and Seward show as the 1st and 3rd top landing ports in Alaska for individual fishing quota (IFQ) halibut landings by pounds. Due to confidential data, the total gross earnings for KPB commerical halibut fisheres cannot be reported, but it was at least $16.7 million in 2013. Sablefish fishers, a third major commercial fishery player, harvested 5.48 million pounds brought to KPB ports on 407 reported landings in 2014. This is 26% of the state’s total commercial sablefish harvest. Seward had 294 landings with 4.8 million pounds and is the State’s top landing port for sablefish (excluding confidential data). KPB sablefish commercial fishermen gross earnings are estimated at $6.5 million in 2013. Commercial Catch of Pacific Halibut Landed in KPB (pounds) Fig.52 Millions of Pounds 25 with Five Year Moving Average Trendline 20 15 10 5 0 source: NOAA IFQ Reports KPEDD - 2015 Situations & Prospects page 50 Commercial Catch of Pacific Sablefish Landed in KPB (pounds) Fig.53 Millions of Pounds 12 with Five Year Moving Average Trendline 10 8 6 4 2 source: 0 NOAA IFQ Reports Sector Trends, Issues, and Outlook Add Value. Homer, Kenai, and Seward are top US ports for commercial fish landings and total exvessel value. Fish are plentiful in the region and the industry and workforce are positioned to continue to benefit. Cook Inlet region seafood processing operations have a competitive advantage over other parts of the state in being on the road system. Freshly frozen fish can be packed in refrigerated vans and trucked to US and Canadian markets immediately after it is caught. Additional economic opportunities are available by increasing local value-added seafood processing in areas such as new food products, nutraceuticals, cosmetics and skin care, fish skin leather, supplements, performance fabrics from crab and shrimp shells, bio-oils and fuels, and other products that increase the percent utilization of whole fish. King Salmon Decline. Despite these strengths, the fisheries in the KPB are also undergoing serious challenges and constraints. Reasons for the statewide decline in King Salmon runs were the subject of a scientific summit a few years ago. There are many unknowns, but a leading idea on the cause is the temperature current and food supply changes linked to the Pacific Decadal Oscillation, which is currently favoring BC, WA and OR king runs9. A commitment to monitor indicator streams around the state arose as an outcome of the summit. This activity may now be at risk due to state budget woes. Halibut BioMass & Allocations. Pacific Halibut quotas are down all over Alaska due to declining stocks. Reduced overall quota is then allocated among harvester types. For 2015 though, slightly increased biomass data has led to a small uptick in Area 3A (Cook Inlet region) quota. Biomass trends and smaller halibut sizes led to limitations on sport charters in the inlet which are now two halibut per client per day, one of which must be 30 inches or less. Fish size, biomass, allocation between commercial and sports harvesters, and limits related to bycatch are fishery management concerns. “Every Fish has a Name On It”. Being near Alaska’s population centers and having road accessible fisheries raises attention to Cook Inlet fisheries. At Alaska Board of Fisheries meetings, management concerns erupt among commercial gear groups, between Anchorage/Mat-Su versus and Cook Inlet 9 Personal communication, P. Shield. Also see Northwest Fisheries Science Center, and http://www.adn.com/article/biologists-lookocean-clues-alaska-king-salmon-collapse KPEDD - 2015 Situations & Prospects page 51 fishing groups, and between area sport and commercial fishing associations. Unknowns among management and allocation decisions create anxiety and uncertainty among users. ADF&G Budget Cuts. Proposed state budget cuts for FY 2016 to ADF&G could impact fish research and data collection as well as the timeliness of fish decision-making. Ocean-Warming. The long-term effect of ocean warming and acidification on future commercial fisheries migration and growth patterns is an unknown and of concern to the industry. Fish Prices. Finally, market prices for fish are subject to many different variables and market forces. Price significantly alters profitability and economic impact to the region. Fish business reporter Laine Welsh in March 2015 reported high halibut and sablefish prices for 2015 to date with blocks of Southeast Alaska halibut fetching record-setting prices. In February 2015, the Homer Tribune reported that, “early indicators point to lower salmon prices this year in a plentiful market. A strong U.S. dollar against the Yen, Euro and other currencies also makes it more expensive for foreign customers to buy Alaska salmon. At the same time, record numbers of cheaper, farmed salmon continue to flood into the U.S. from Norway and Chile. 10” Departing from the mouth of the Kenai River, a fleet of driftnet commercial fishing boats head out at dawn towards the lower Cook Inlet. December 2013. Photo Michael Downey http://michaeldowney.com State of Alaska file photo, setnetters near shore 10 http://www.adn.com/article/20150302/laine-welch-pickled-willy-pulls-three-peat-annual-symphony-seafood http://homertribune.com/category/columnists/fish-factor/ KPEDD - 2015 Situations & Prospects page 52 Tourism and Visitors Kenai Peninsula recreational opportunities are enjoyed by residents and visitors alike. The peninsula’s road accessible rivers, lakes, bays, mountains, glaciers, fish and wildlife will continue – as long as transportation costs are not prohibitive – to ensure the area is an important travel destination for people from Anchorage, the rest of the state, the US, and the world. The area’s diverse attractions include fishing, wildlife viewing, hunting, RVing, boating, hiking, biking, skiing, marathons, camping/ backpacking, ATVing, snow machining, kayaking, canoeing, rowing, sailing, and snowshoeing. The region also benefits from developed parks and Recreation Centers with tracks, rinks, swimming pools and more. Tourism and Visitors Industry - Mixed Outlook: Signs of Weaknesses but Good Opportunities The Kenai Peninsula’s tourism industry is recovering from the 2008-2009 US recession’s reduction in visitor travel and related spending. Employment numbers are back to pre-recession (2008) levels, but average monthly wages in this sector have declined compared to 2008. The once thriving world class King Salmon fishery has been closed for the past few years with great impact to related tourism, likely causing last year’s decline in water guide-related business activity. Growth opportunities include continued diversification away from King Salmon fishing toward other salmon and fish, tours to less traveled natural assets such as the Harding Icefield and to bearviewing spots on the west side of the Cook Inlet, and more activities and infrastructure for international or cruise visitors who don’t want to rent a car. Some suggest that more corporate travel and trade industry offerings are needed west of Cooper Landing. The Impact of the 2008-2009 National Recession on Tourism Alaska fared the national recession and real estate bubble crash better than most almost any other state; housing prices were generally not impacted and employment stayed high throughout. However, one Alaskan industry felt the impact – tourism. With the national economy in decline and discretionary spending reduced, coupled with rising fuel costs, visitation to Alaska slowed, including on the Kenai Peninsula. State tourism studies show visitor traffic to Alaska dropped over 7% between summer 2008 and summer 2009. The decrease occurred primarily in air passenger visits, which dropped an estimated 15%. Ferry visitors fell 16% and highway visits were down 8%. Cruise ship passenger volumes between 2008 and 2009 were flat. However, cruise passengers traveled less within the state, more often choosing cruise only packages (rather than cruise+land tour packages such as those that go through Seward). The Kenai Peninsula felt these impacts. Local business sales that serve visitors and the number of visitors declined sharply between 2008 and 2009, and then began to rise. The good news is that depending on the business type, by 2010 or 2011 most had gross sales back to their 2008 levels (Figure 54). KPEDD - 2015 Situations & Prospects page 53 Gross Sales - Visitor Related Businesses, Kenai Peninsula 2008-2013 Fig. 54 $300,000,000 $250,000,000 Restaurant/Bar $200,000,000 Hotel/Motel/Bed & Breakfast $150,000,000 Guiding Water $100,000,000 Arts and Entertainment $50,000,000 Guiding Land $0 Source: KPB Finance Dept. Fig. 55 2013 Gross Sales - Visitor Related Businesses, by City (in $1000’s) Business Type Total, for Place Restaurant/Bar Hotel/Motel/ Bed & Breakfast Guiding Water Arts and Entertainment Guiding Land Soldotna $35,300 $25,678 $4,971 $605 $4,046 * Homer $44,686 $17,229 $14,419 $11,353 $1,238 $446 Kenai $25,087 $14,362 $9,759 $361 $604 * Seward $51,681 $13,192 $13,892 $23,936 $58 $604 Seldovia $1,085 $638 $163 $253 $31 $0 Outside of Cities $102,311 $21,743 $45,657 $23,860 $9,400 $1,651 Source: Kenai Peninsula Borough Finance Dept. Businesses, Employment, and Wages On the Kenai, the visitor industry is experiencing modest growth since recovering from the 20082009 downturn. Since 2008 gross sales have increased at an average annual rate of 2.5%. Total gross sales in 2013 were $260 million in 2013. Over this same period employment numbers remained steady but average monthly wages have declined slightly (from $6,180/month in 2008 to $5,901/month in 2013). Wages have thus not kept pace with inflation over the last six years. As a result, buying power for employees in this industry has declined. For this report, visitor oriented businesses include those with Lines of Business (per KPB sales taxes) or those in the state’s database in Arts, Entertainment, and Recreation (NAICS 71); Accommodations and Food Services (NAICS 72); and Scenic and Sightseeing Services, which includes Water and Land Guides (NAICS 487000, traditionally aggregated with Transportation for QCEW employment). Looking at all the data sources, there are approximately 1,000 large and small business owners and 2,650 employed workers in tourism businesses in the KPB. Among these visitor-oriented businesses and workers: 1,440 businesses registered for KPB sales tax purposes (2015) 1,030 holding Alaska business licenses physically located on the peninsula (2015) KPEDD - 2015 Situations & Prospects page 54 345 businesses in this sector with 2,648 employees and $52.3 million in wages in the KPB (2013) 614 small self-employed small business owner in this sector (2012) Since restaurants and bars serve residents along with visitors, the economic impact just due to visitors is difficult to isolate for these businesses. In 2013, the visitor industry accounted for 2,648 salaried employees and over a $52 million payroll on the Kenai Peninsula (Figures 56). This is approximately 15% of the region’s total employees and 5% of the region’s total wages. Accommodation and Food Services drive the sector, generating approximately 80% of the employment and wages. The visitor industry is highly seasonal and the average monthly employment of 2,648 includes a summer high of over 3,700 employees. Figure 58 includes the 700+ sole-proprietor businesses with their $22 million income to salaried workers to show the close to $75 million in all work earnings that this sector creates. Monthly Average Employment 3000 $60 2500 $50 2000 $40 1500 $30 1000 $20 500 $10 0 $0 2002 2003 2004 2005 2006 2007 2008 2009 2010 2011 2012 2013 Source: ADOLWD, QCEW Employment Earnings Fig. 57 Visitor Industry Employment, 2013 Scenic and Sightseeing 6% Accommodation 31% Performing Arts, Museums, Zoos, Parks, etc. 1% Food Services and Drinking Places 54% Amusements, Gambling, Recreation 8% Source: ADOLWD QCEW KPEDD - 2015 Situations & Prospects page 55 Real Earnings ($Millions) Visitor Industry Employment & Wages Fig. 56 2013 Tourism and Visitor – Workforce/Earnings on Kenai Peninsula SELF-EMPLOYED SALARIED EMPLOYEES PROPRIETORS TOTAL TOTAL average workforce earnings Business Type employment total wages No. income (% of all) (% of all) Arts, Entertainment, & 612 $11,552,089 254 $3,991,089 358 $7,561,000 Recreation (16%) (15%) Accommodation & 2,587 $57,017,104 2,227 $42,344,104 360 $14,673,000 Food Services (79%) (76%) 167 $6,027,345 Scenic and Sightseeing 167 $6,027,345 (5%) (8%) TOTALS 2,648 $52,362,538 718 $22,234,000 3,366 $74,596,538 Fig. 58 Sources: ADOLWD, QCEW 2013, US Census Nonemployer Statistics, 2012 Visitors by the Numbers Cruise Ships. On the Kenai Peninsula, cruise ships visit Seward and Homer. Each year Seward receives about 50 large ships whereas Homer sees primarily smaller ships only a few times per year. Passenger numbers are calculated using the lowest berth capacity (lowest possible number of passengers) and a 5% multiplier. The number of cruise ships and passengers stopping in the region has been declining since the 2001 peak of 110 ships and 330,000 passengers. The 2008-2009 recession effect hit in 2010 when cruise passengers numbers dropped 9% in one year, but declines have continued until last year’s increase. However, 2014 cruise visitor volume of almost 149,000 is less than half of 2001 cruise visitor numbers. Fig. 59 Year 2009 2010 2011 2012 2013 2014 SEWARD Ship Calls Passengers 70 166,059 57 139,285 54 135,574 52 145,454 51 130,578 54 142,245 Cruise Ship Travel HOMER Total % Ship Calls Passengers Passengers Change 2 1,934 167,993 9 13,797 153,082 -9% 14 15,939 151,513 -1% 7 9,599 155,053 2% 1 401 130,979 -16% 5 6,533 148,778 14% Source: Cruise Line Agencies of Alaska Alaska Railroad. The Alaska Railroad Corporation operates two trains between Seward and Anchorage. The Grandview Cruise Train is only available to cruise ship passengers beginning or ending their cruise in Seward, as an alternative to the cruise line's standard motorcoach service to and from the Anchorage airport. The Coastal Classic is open to the public, and makes one daily round trip from Anchorage to Seward, with an intermediate stop in Girdwood. The Coastal Classic serves a mix of Alaska residents, independent travelers making day trips to Seward or to Kenai Fjords National Park, and additional cruise passengers making a connection to/from Anchorage. KPEDD - 2015 Situations & Prospects page 56 Both trains are seasonal, running only between the months of May and September. Between 2009 and 2014 the total number of individuals taking the train to and from Seward increased 18%, from 67,000 to 80,320 passengers. Fig.60 Alaska Railroad Passengers in Seward 90,000 80,000 70,000 60,000 50,000 40,000 30,000 20,000 10,000 - Grandview Train to/from Seward Coastal Classic Departures from Seward Coastal Classic Arrivals in Seward 2009 2010 2011 2012 2013 2014 Source: Alaska Railroad AMHS Ferries. The Alaska Marine Highway System (AMHS) serves Homer and Seldovia on the Kenai Peninsula. In 2006, Homer’s ferry visits and passengers increased as AMHS ferry service to and from Seward was discontinued. Passenger and vehicle traffic remained steady between 2008 and 2012, years when other tourism travel was down due to the US recession – this could indicate that the majority of users are local, or travelling out of necessity and not as elective pleasure travel. In 2013, both ports experienced an approximate 50% decline in passenger and vehicle traffic when the Ferry Tustamena was pulled for extended repair. In 2014, port departures rose back to 2012 levels and ridership is on its way back to those levels. Figures 61,62 Alaska Marine Highway Port Departures 300 200 100 0 2001 2002 2003 2004 2005 2006 2007 2008 2009 2010 2011 2012 2013 2014 Homer Seldovia Seward Source: AMHS Annual Traffic Reports 400 Alaska Marine Highway Disembarking Passengers Source: AMHS Annual Traffic 15,000 10,000 5,000 0 2001 2002 2003 2004 2005 2006 2007 2008 2009 2010 2011 2012 2013 2014 Homer Seldovia KPEDD - 2015 Situations & Prospects page 57 Seward Visitor Centers and Destinations. While it is difficult to track the exact number of visitors to the Kenai Peninsula, several key destinations do track their annual visitors, and these destinations can serve to some extent as a proxy for Borough-wide visitor levels. Seward’s Alaska SeaLife Center, Alaska’s only public aquarium and ocean wildlife rescue center experienced a 23% drop in attendees from 2008 to 2009. In subsequent years visitor levels have been increasing, but in 2014 the center still drew 13% fewer visitors than it had in 2008. Kenai Fjords National Park experienced a 20% drop in annual visitors in 2009. Visitor levels recovered and grew in following years, peaking in 2011 at nearly 350,000 visitors. The number of people visiting the park since has been very close to 2008 numbers. Although not every visitor to the peninsula makes a stop at a community visitor’s center, Chamber of Commerce-run Community Centers in Kenai, Soldotna, Seward and Homer all keep track of the number of visitors they receive from year to year, and this too can help paint a more complete picture of visitor numbers to the Kenai Peninsula. Of these four visitors centers, all have experienced a decline in traffic. Particularly low 2014 numbers at the Homer and Seward Visitor’s Centers are likely due to extensive renovations of their buildings in 2014. Year 2008 2009 2010 2011 2012 2013 2014 Fig. 63 Annual Visitors to KPB Destinations Alaska Kenai Fjords Chamber of Commerce Visitor’s Centers SeaLife National Center Park Kenai Homer Soldotna Seward 162,985 272,190 N/A 11,215 49,913 19,326 126,092 218,358 N/A N/A 44,663 N/A 128,462 297,596 N/A N/A 34,817 N/A 133,087 346,852 N/A N/A 39,469 16,268 138,940 281,279 41,866 N/A 38,820 14,238 143,892 283,592 38,707 14,000* 43,320 14,467 142,349 270,666 35,354 8,600* 40,071 13,061 Sources: Alaska SeaLife Center, National Park Service, Kenai Chamber of Commerce, Homer Chamber of Commerce, Soldotna Chamber of Commerce, Seward Chamber of Commerce Sport Fishing, Charters and Fish Guides Most visitors to the area have heard that Les Anderson of Soldotna brought in the 97 ¼ pound world-record setting King Salmon from the Kenai River in May 1985. This legend is both the area’s advantage and challenge. It is an advantage in that the Kenai’s industry of sport fishing guides, charters, and related businesses has become known to sport fishermen and women in the US and internationally. It is a challenge in that recent declines in Kenai River King Salmon numbers and increasing regulations and unreliable openings to protect escapement has been occurring for several years. Word is slowly getting out to the sport fishing world. Given that King Salmon numbers are not increasing, guides KPEDD - 2015 Situations & Prospects page 58 are talking with clients to help set realistic expectations and avoid disappointments. All of this makes it difficult for guiding businesses that rely on reservations and extended planning. Another recent challenge to the sport fishing and charter industry are decreased catch limits for halibut (two per day per client in 2015, one fish under 30”). Given all this, impacts on the number traveling to fish in the Kenai region are occurring. Anecdotal and some Kenai Peninsula Tourism Council research suggests that there are fewer high-end individuals traveling from afar, fewer business “wine & dine” cliental, fewer coming to stock their freezers for the year, and so on – numbers are down. The number of water guides has declined from a high in 2006. Between 2013 and 2014, there was a 3% decline in taxable sales from Water Guides in the 2nd & 3rd quarters (Figure 42). Fortunately, with some planning and flexibility, rod and reel guides can change the species they target or move to another river and still provide successful experiences for guests. But, continued diversification in tourism marketing is needed, away from fish and towards a focus on the region’s many other assets, such as its mountains, glaciers, and wildlife that high-end visitors seek. Taxable Sales for 2nd & 3rd Quarter 2014, and, Percent Change Compared to 2013 Type of Business Taxable Sales % change from 2013 Guided Land $1,518,116 +4% Guided Water $43,388,481 -3% Car Rental $1,808,786 -23% Tour Operators $1,276,925 Flat Accommodations $61,385,578 +1.9% Restaurants $47,179,060 +1.6% Fig. 42 Source: Kenai Peninsula Tourism Council Kenai River Guides - Resident v. Nonresident Fig. Fig.6365 500 450 400 Non resident Resident 350 Source: USDA NRCS Kenai Field Office 300 250 200 150 100 50 0 KPEDD - 2015 Situations & Prospects page 59 Kenai River Fisherman (Non-Unique ) Fig. 66 120,000 Source: ADFG Alaska Sport Fishing Survey Non-guided 100,000 Guided 80,000 60,000 40,000 20,000 0 2004 2005 2006 2007 2008 2009 2010 2011 2012 2013 Travel by the Numbers A portion of those arriving by all modes of transportation are visitors to the Kenai Peninsula who have come to enjoy the many recreational and tourist attractions. However, there is no way to tell whether those arriving by air and road are visitors, residents, or business/commercial-travelers, so transportation numbers include all. Air Access. Air travel into and out of the Kenai Municipal Airport declined between 2008 and 2009 at the beginning of the recession; however, enplanements have been increasing steadily since then. By 2011, passenger enplanements had returned to pre-recession levels, and by 2012 the airport experienced a 10 year high in passenger travel. According to McDowell Group Travel Industry studies, this is consistent with a statewide trend of increased independent travelers from 2009 to 2011, which offset a decline in the number of cruise ship passengers during that period. At the same time as enplanements are rising, the number of takeoffs and landings has been decreasing for nearly twenty years. Over time, carriers at the Kenai Municipal Airport are serving more people with fewer flights. (Figures 70 and 72). Number of Enplaenments 120000 100000 50000 80000 40000 60000 30000 40000 20000 2004 Fig. 70 60000 Kenai Municipal Airport Number of Take-offs and Landings The Kenai Municipal Airport is the largest of nine airports in the region. Similar to the Kenai airport, most experienced a decline in use after 2008, but have been slowly regaining passengers. Pounds of freight shipped by air are variable and volume appears to be linked to local work and projects 2005 2006 2007 Enplanments Enplanements 2008 2009 2010 2011 2012 2013 Take-offs and Landings KPEDD - 2015 Situations & Prospects page 60 2014 Sources: FAA and Kenai Road Access. Annual average daily traffic counts (AADT) are documented annually by the Alaska Department of Transportation and Public Facilities (ADOT&PF) in several locations on the Kenai Peninsula. Eight sites (see map) have been monitored by the Situations and Prospects reports for several years. Each is indicative of traffic to and from a certain area on the peninsula. Since 2000, traffic in the southern peninsula (spots G and H on the map), at the Placer River Bridge across Seward Highway (spot D) -which is a good proxy for travel to and from the Peninsula and Anchorage area, and to Seward (spot E) has generally been flat. At the Soldotna-Sterling Highway at the junction with Kenai Spur Highway (spot B) traffic has increased steadily for 20 years. This site is within the City of Soldotna and reflects new development and activity in this area- particularly in the last 5-6 years (see property, development and taxes section of report). Traffic at the NikiskiKenai Spur Highway declined from 2006 to 2011 then jumped, possibly reflecting the close of Agrium and reduced oil and gas work, with renewed activity in that sector beginning around 2010. Annual Average Daily Traffic Counts Fig. 71 20,000 18,000 B Soldotna Sterling Hwy @ Kenai Spur 16,000 A Kenai - Kenai Spur Hwy C Soldotna Sterling Hwy @ Robinson Lp 14,000 12,000 H Homer - Sterling Hwy 10,000 8,000 D Placer River Bridge-Seward Hwy 6,000 F Nikiski - Kenai Spur Hwy G Anchor RiverSterling Hwy 4,000 2,000 E Moose PassSeward Hwy 0 Source: ADOT&PF AADT KPEDD - 2015 Situations & Prospects page 61 Locations of Annual Average Daily Traffic Counts KPEDD - 2015 Situations & Prospects page 62 Fig. 72 Arriving Passengers, Freight, Mail, & Containers Beluga Air Passengers Air Freight Air Mail Homer Air Passengers Air Freight Air Mail Kenai Air Passengers Air Freight Air Mail Nanwalek Air Passengers Air Freight Air Mail Port Graham Air Passengers Air Freight Air Mail Seldovia Air Passengers Air Freight Air Mail Seward Air Passengers Air Freight Air Mail Barge Freight (20 ft. cont) Soldotna Air Passengers Air Freight Air Mail Tyonek Air Passengers Air Freight Air Mail TOTALS PASSENGERS Cook Inlet Region Airports 2008 2009 2010 2011 3,085 1,159,631 11,201 2,765 1,591,876 8,356 2,524 739,776 10,095 42,687 704,343 55,032 37,373 695,093 46,033 87,692 2,391,713 25,339 % change 2008-2013 2012 2013 3,375 1,071,888 9,519 3,266 971,396 9,979 2,289 500,157 5,266 -26% -57% -53% 36,825 805,269 35,917 36,070 696,623 32,074 38,086 694,905 20,214 36,179 1,322,397 18,376 -15% 88% -67% 76,368 1,444,965 25,483 79,544 1,342,783 12,781 90,775 1,401,360 13,480 92,863 1,415,967 9,184 94,478 1,418,710 8,395 8% -41% -67% 3,524 252,621 151,475 3,530 318,709 79,265 3,326 389,387 30,610 2,558 343,144 24,711 2,662 300,521 16,549 2,391 239,067 15,941 -32% -5% -89% 2,918 360,297 50,529 2,778 399,073 45,466 2,770 430,667 39,415 2,252 335,167 42,819 2,045 344,881 34,989 1,897 301,742 22,386 -35% -16% -56% 7,290 286,802 107,031 5,883 261,866 88,760 5,511 297,298 87,963 4,330 198,550 85,117 4,215 136,651 72,892 3,592 113,764 48,609 -51% -60% -55% 28 - 5 500 - 9 - 14 3,545 5 4,204 3 - -89% 55 1,850 - 163 9,169 - 43 - 19 7,432 - -65% 302% 2,992 448,074 25,840 150,271 3,264 492,259 23,088 132,129 3,534 755,987 14,936 146,719 3,333 1,032,340 16,250 144,181 11% 130% -37% 150,271 3,162 430,331 17,838 133,671 3,192 579,875 21,227 142,566 Notes: Freight: On-Flight Market Freight(pounds) Mail: On-Flight Market Mail(pounds) Passengers: On-Flight Market Passengers Source: US Department of Transportation, Bureau of Transportation Statistics, T-100 Market Data Source: Barge Freight=Twenty Foot Equivalent Container Units. Foreign empties not included. Domestic Source: U.S. Army Corps of Engineers, Waterborne Commerce Statistics Center KPEDD - 2015 Situations & Prospects page 63 Transportation and Warehousing One of the area’s competitive advantages already mentioned a few times in this report is the easy access by road to southcentral Alaska, the rest of the US and Canada. In addition to road access, the area is also accessible by water – at major ports in Seward and Homer as well as many smaller ports and harbors, by air at nine airfields, and by railroad to Anchorage. For this report, Transportation and Warehousing businesses include those registered under this Line of Business for KPB sales tax purposes, as well as those with NAICS code 48 - Transportation and Warehousing, registered in state databases. This includes Air Transportation, Water Transportation, Truck Transportation, Transit and Ground Passenger, Pipelines, Support Activities, Postal Service, Couriers and Messengers, and Warehousing and Storage. The state ADOLWD QCEW database also includes those engaged in Scenic and Sightseeing work (NAICS 487000), but for this report employment and wages from those activities are included with Tourism and Visitors. Figure 67 shows who works in this sector on the Kenai Peninsula. Looking at the varying data sources, there are between 150-300 large and small business owners and approximately 800 employed workers in transportation and warehousing businesses. Data sources for this sector show: 144 businesses registered for KPB sales tax purposes (2015) 244 holding Alaska business licenses physically located on the Peninsula (2015) 101 businesses in this sector with 802 employees and $40.4 million in wages in the KPB (2013, ADOLWD QCEW database) 226 small self-employed small business owner in this sector (2012, Nonemployer Statistics) In 2009, gross transportation and warehousing sales dropped 60% from $223 million to $86 million. Since many in the transportation and warehousing sector help transport visitors and freight, this sector was hit by the 2008-2009 national recession which impacted visitation nationwide and in the state. This impact was particularly noticeable against the backdrop of 2008, which was a peak year due in part to high sales by three businesses in the City of Kenai. Business activity was back up in 2010, but has been on a downward trend again in this sector since that time. Wages and employment by contrast have both been steadily increasing. In 2013, 802 employees in this industry (average monthly) earned $40.4 million in wages, and, an additional 226 self-employed proprietors earned $13 million (2012). Further analysis is needed to better understand issues affecting this sector. KPEDD - 2015 Situations & Prospects page 64 Fig 67 Transportation & Warehousing Employment, 2013 Warehousing, Storage, Transit & Ground Pass, Pipeline Air Transportation 18% 25% Couriers and Messengers 4% Postal Service 1% Water Transportation 14% Support Activities 21% Truck Transportation 17% Fig 68 Source: ADOLWD QCEW Gross Sales-Transportation and Warehousing, Kenai Peninsula, 2003-2013 $250,000,000 $200,000,000 $150,000,000 $100,000,000 $50,000,000 $0 2003 Fig 69 Average Employment 900 Source: ADOLWD 2004 2005 2006 2007 2008 2009 2010 2011 2012 2013 Transportation and Warehousing, Employment & Wages, Kenai Peninsula, 2003-2013 $45 800 $40 700 $35 600 $30 500 $25 400 $20 300 $15 200 $10 100 $5 0 $0 2003 2004 2005 2006 2007 2008 2009 2010 KPEDD - 2015 Situations & Prospects page 65 2011 2012 2013 Annual Wages (in $millions) Source: KPB Finance Dept. Construction The construction sector is ranked 5th highest in terms of total earnings to Peninsula residents in 2013. Earnings followed a positive trend with a strong uptick in 2012 and 2013; an indication of more income per worker. Earnings come from 265 businesses with 1,022 employees whose wages totaled $65 million, and, $28 million from the earnings of 597 small business proprietors in this sector (NAICS code 23). The 2015 Alaska business license records list 466 with a business license in this sector on the peninsula and the borough’s sales tax records list 699 construction businesses physically located in the region. Employment numbers are not as strong as wages, as the 10-year trend has been an employment dip to 2009, followed by three flat years, then a modest gain in 2013. Gross sales made by the construction industry have been quite variable. A low in 2010 was due primarily to the completion of work on a major retail outlet in Kenai during 2009. A larger business in Homer also had a sales dip between 2008 and 2010 that added to this decline. Construction sales shot up in 2011-2012 due to a surge in oilfield service company related construction activity. Sales dropped by 38% in 2013, which along with a decline in warehousing and transportation, led to a 6% overall drop in borough-wide in gross sales in 2013. Construction Industry Employment & Earnings Kenai Peninsula, 2002-2013 Monthly Average Employment 1400 $70 1200 $60 1000 $50 800 $40 600 $30 400 $20 200 $10 0 Earnings ($Millions) Fig. 73 $0 2002 2003 2004 2005 2006 2007 2008 2009 2010 2011 2012 2013 Employment Earnings Source: ADOLWD, QCEW Gross Sales - Construction Industry, Kenai Peninsula, 2003-2013 Fig. 74 $Millions 1,000 800 600 400 200 0 Source: KPB Finance Dept 2003 2004 2005 2006 2007 2008 2009 KPEDD - 2015 Situations & Prospects page 66 2010 2011 2012 2013 8 Housing Land sales and development in the region is primarily being driven by residential development. The Kenai region has very competitive housing prices compared to the rest of the state (see cost of living section of report). Still, 29% of homeowners (with a mortgage) and 41% of renters are paying more than 30% of their income on housing. Construction of dwelling units in five Kenai Peninsula cities that the Alaska Housing Finance Corporation (AHFC) tracks jumped from a six-year low of 59 in 2012 to close to 100 in 2014 through the 3rd quarter. Homer consistently leads the way in construction of new homes. The primary sources of housing data are the US Census 3 and 5-year American Community Survey, AHFC, and ADOLWD. Care must be exercised when comparing data from different sources. The US Census gives accurate ten-year trends, and shows that in the Kenai Peninsula Borough the number of dwelling units grew by 5,707 (23%) between 2000 and 2010. During the same period, the population grew by 11%. Housing Information - Kenai Peninsula Borough Number of Housing Units 1990 2000 2010 2013 Total Housing Units 19,364 24,871 30,578 30,593 Occupied housing units 14,250 18,438 22,161 21,418 Vacant housing units 5,114 6,433 8,417 9,175 of vacant, how many seasonal or recreational use 4,560 6,083 Fig. 75 (18% of all housing) Cost of Housing and Rent Median value of owner-occupied units Median monthly rent (for renters) Households spending more than 30% of income on housing For homeowners with mortgage For homeowners without mortgage For renters 2013 Number $206,800 $935 (20% of all housing) 2013 Percent - 2,600 796 2,229 29% 13% 41% Sources: 1990, 2000, 2010-US Census, For 2013: 2011-2013 American Community Survey The AHFC and ADOLWD track building permits, residential development and loans for five cities on the Kenai Peninsula: Kenai, Soldotna, Homer, Seldovia, and Seward. In these cities, home construction peaked in 2006, with 153 new dwelling units built, and declined to a low of 59 in 2012 (Figure 76). The drop during this period likely parallels Cook Inlet oil and gas activity as well as the national 08-09 recession which impacted tourism visitation throughout the state. In 2013, home construction picked up, again probably coincident with oil and gas activity as well as the recovering tourism industry. KPEDD - 2015 Situations & Prospects page 67 source: K Wiebold, ADOLWD -ADOLWD/AHFC data Fig. 76 Five Kenai Area Cities - Number of Dwelling Units Constructed, 2003-2014(3Q) 140 120 100 80 60 40 20 0 2003 2004 2005 2006 2007 2008 2009 2010 2011 2012 2013 2014 Soldotna 8 25 23 28 28 24 20 29 10 14 16 24 Seward 42 17 12 10 2 6 2 2 0 3 4 3 Seldovia 2 0 3 0 0 0 0 0 2 1 0 0 Kenai 24 19 25 45 30 24 11 20 29 22 33 28 Homer 45 54 76 70 60 37 38 27 31 19 41 42 AHFC/ADOLWD uses data on new construction and from a lenders survey to track the average and total price of loans and housing. The data on Figure 77 is for all homes, both older and new. The average price of single family homes has been steadily rising over the last 11 years. Like many other parts of Alaska, the Kenai region was not affected by the national real estate bust that saw prices plunge after a 2006 peak in the Lower 48. The average price of multi-family housing is widely varying. This likely has to do with the age and condition the units being sold. Average Home Prices, Kenai Peninsula Borough 2003-2014 (3Qtrs) source: K. Weibold, ADOLWD/AHFC $600,000 $500,000 $400,000 $300,000 $200,000 $100,000 $0 2003 Fig. 77 2004 2005 2006 Single Family 2007 2008 2009 2010 Multi-Family KPEDD - 2015 Situations & Prospects page 68 2011 2012 Condo 2013 3Qtrs 2014 2014 Alaska Housing Assessment Data The AHFC published a 2014 Alaska Housing Assessment. It is based on information from the 20072011 ACS data, 2010 US Census data, the 2009 Residential Energy Consumption statistics program, and more. This report consolidates data and provides a systematic comparison across the state. However, this information is now a bit dated. According to the Alaska Housing Assessment, 4% of the housing on the Kenai Peninsula is considered overcrowded or severely overcrowded, which is under the Alaska average of about 6%. The least overcrowded community in the borough is Ninilchik, where an estimated zero households are overcrowded; the highest overcrowding rate is found in Nanwalek, at 43%. A dwelling is considered to be overcrowded if there is more than one person per room and severely overcrowded if there are more than 1.5 persons per room. A common evaluation of affordability is amount of income spent on housing. Households that spend more than 30% percent of their income on housing are considered cost-burdened. According to the 2014 AHFC Housing Assessment, 31% of housing units in Alaska are cost-burdened, and on the Kenai Peninsula, the 2011-2013 ACS survey found that 41% of renters are paying more than 30% for their income as are 29% of homeowners with a mortgage (Figure 13). Energy use in Alaskan homes is significantly higher than in the rest of the United States. Energy usage is a combination of heating fuel and electricity costs, and is significantly affected by the energy efficiency of the home’s construction and whether or not weatherization measures have been put into place (if an older home). Percent of Total Residential Space Heating Energy by Fuel Type, Kenai Peninsula Borough Fig. 78 Propane, 3% Electricity, 3% Wood 11% Source for chart and table: 2014 Alaska Housing Assessment -Kenai Peninsula Borough, from a "mix" of 2009-2012 sources Fuel Oil 27% Natural Gas 56% Residential Space Heating Energy, Kenai Peninsula Borough Fuel Type Estimated Total Annual Use Natural Gas 21,554,824 ccf Fuel Oil 7,947,985 gallons Wood 22,620 cords Propane 1,185,380 gallons Electricity 30,611,605 kWh Fig. 79 Source: AHFC 2014 Alaska Housing Assessment, Kenai Peninsula Borough KPEDD - 2015 Situations & Prospects page 69 Based on the 2009-2012 data used in the 2014 Alaska Housing Assessment, the average annual energy cost for homes in the Kenai Peninsula Borough is $4,510, 60% higher than the cost in Anchorage ($2,786) and twice as high than the national average ($2,129), but low compared to many more rural places in the state. According to this AHFC study, there is wide variability on the Peninsula, with the lowest average annual energy costs found in Tyonek, where residents pay $2,600 each year, and the highest average annual energy costs in Seldovia where residents pay $7,300 annually.11 9 Cost of Living One of the most personal and complex measures of economic vitality in a region is the average cost of living for a household. Various sources of data are available to help determine the typical cost to live in the Kenai Peninsula Borough (KPB). Based on the similarities in cost of living between Anchorage and the KPB revealed by the McDowell Group’s 2009 Cost Differential Study, the Anchorage CPI can serve as a rough proxy for the Kenai region12. The McDowell Group study found that borough-wide, prices for housing, food, transportation, clothing and medical services in the KPB were 1% higher than in Anchorage. This 1% differential between the KPB and Anchorage matched results from a previous Geographic Differential Survey conducted in 1985, suggesting that the KPB cost of living has tracked Anchorage over time. The KPB connection to the road system and proximity to Anchorage likely creates this close relationship. While the McDowell Group report did not provide a local level cost of living breakdown for most communities in the KPB, it did include a community-specific analysis for Homer. Homer’s distance from Anchorage did not influence the overall cost of living - it had the same cost of living as the Peninsula as a whole, just 1% higher than Anchorage. Household Costs There are other cost of living surveys that compare community level prices for certain goods and utilities on an annual or quarterly basis. The University of Alaska Fairbanks conducts quarterly surveys of the cost of food and other utilities for Alaskan cities, including Homer, Kenai, Seward, and Anchorage. The price of gasoline and heating oil is collected quarterly in Seldovia as part of the Alaska Department of Commerce and Economic Development’s Fuel Price Survey. As evidenced by these data (Figures 80, 81) prices do range throughout the Peninsula. 11 2014 Alaska State Housing Assessment, Kenai Peninsula Borough, page VI, http://www.ahfc.us/efficiency/research-informationcenter/housing-assessment 12 Alaska Geographic Differential Study, McDowell Group, 2009 KPEDD - 2015 Situations & Prospects page 70 Fig. 80 Household Expenses Anchorage Mat-Su Homer Kenai (city) Seward Seldovia Week of food for a family of four 1 $180.04 $179.66 $217.31 $199.93 - Electricity ($/ kWh) 2 0.15463 0.15621 0.24163 0.23825 0.22334 Heating Oil ($/gal) 3 $3.98 $4.54 $4.66 $4.77 $4.80 $5.12 Gasolin e ($/gal) 4 $3.85 $3.85 $4.28 $4.41 $4.34 $5.13 Lumber 2x4x8' 5 $2.69 $2.97 - Propane ($/gal) 1 $3.73 $4.12 $4.15 $3.38 - Dates/sources: 1 3rd Qtr 2014 UAF Food Cost Survey 2 same source as 1, but 1st Qtr 2014 data. 3,4 same source as 1, but 2nd Qtr 2014 data, Quarterly Utility Observations. Except Seldovia, which is- DCRA Fuel Price Survey 5 ADOLWD 2014 Construction Cost Survey Of ten boroughs AHFC surveyed in the 4th quarter of 2014, the only place with lower average rent than KPB was Wrangell. Similarly, in a survey of the average selling prices for single-family homes (based on loan volumes), of eight Alaskan boroughs, KPB was 3rd lowest and the average price of $246, 743 was $55,600 below the statewide average. Fig. 81 Housing Costs Anchorage Kenai Peninsula Borough Mat Su Statewide Anchorage Mat-Su Homer (city) Kenai (city) Seward (city) Seldovia City Average rent, all units $1,135 $831 $1,022 - Vacancy rate Avg. sales price-single family home 1 4th Quarter 2014 3.20% $356,092 6.70% $246,743 5.30% - Sources: 1 AHFC Alaska Housing Market Indicators, Q4 2014, 2013) $256,162 $302,378 2 Median Home Price 2 Average rent per renter 2 2009-2013 ACS $282,800 $176,700 $262,400 $184,800 $176,300 $225,000 $1,142 $904 $892 $885 $724 $448 ACS 5 year housing characteristics (2009- KPEDD - 2015 Situations & Prospects page 71 Cost of Residential Building Materials Statewide, the cost of a “market basket” of residential building supplies increased 4% in both 2013 and 2014. Between 2013 and 2014 rates varied quite a bit; from a 17% increase in Kodiak to a 1% drop in Anchorage and Ketchikan. In the City of Kenai, the cost of building supplies increased 1% between 2013 and 2014 (ADOLWD, 2014 Annual Construction Cost Survey). In 2014, transportation on costs increased in all areas. The City of Kenai led though, with an increased cost of shipping the building materials of 18% whereas Juneau only saw a 4% increase. Sample (market basket) Residential Construction Costs, 2014, City of Kenai 2012 2013 2014 Average cost of Building Market Basket Kenai $24,586 $27,360 $27,443 Anchorage $21,524 $23,854 $23,848 Wasilla $25,151 $23,862 $25,097 Average cost of Shipping from Seattle Kenai $11,137 $11,137 Anchorage $8,245 $8,245 Wasilla $9,673 $9,673 Alaska Suppliers Comparison Index, 2014, without concrete, rebar, doors or windows (Anchorage is Baseline) Anchorage 100 $100 100 Fairbanks 104 $108 112 Juneau 101 $110 117 Kenai 114 $115 115 Ketchikan 115 $117 117 Kodiak 120 $114 134 Sitka 113 $115 104 Wasilla 117 $100 105 Barrow 249 $214 226 Bethel 191 $161 166 Nome 195 $176 188 Fig. 82 Source: ADOLWD 2014 Construction Cost Survey More than 600 Kenai Peninsula Borough School District students participated in a construction and welding class during the 2011-2012 school year through the Alaska Construction Academies offered at KPBSD high schools. Of those 600, at least 150 students completed the first module of the National Center for Construction Education and Research. Photo & story from KPBSD website. KPEDD - 2015 Situations & Prospects page 72 10 Education and Civic Engagement Kenai Peninsula Borough (KPB) School District The number of students enrolled in the Kenai Peninsula Borough School District has been decreasing steadily for the last ten years. Preschool (PK) to 12th grade enrollment declined 437 students between 2005 and 2010. The district lost an additional 218 students between the 2010 and 2015 school years (Figure 83). However, the state projects the number of school aged children on the Peninsula will begin increasing around 2020. State projections, based on historical in/ out migration and birth /death rates, call for 13,000 youth aged 5 to 19 in the Kenai Peninsula in 2042. For comparison, there are 9,150 PK to 12th grade students enrolled in Kenai Peninsula schools in 2015. Fig. 83 KPB School District Enrollment by School and Community (Pre K-12 School Community Kenai Peninsula Borough School District Chapman School Tustumena Elementary Cooper Landing School Kachemak Selo School Razdolna School Voznesenka School McNeil Canyon Elementary Fireweed Academy Homer Flex School Homer High School Homer Middle School Paul Banks Elementary West Homer Elementary Hope School River City Academy Skyview Middle/High School Aurora Borealis Chter School Kaleidoscope Sch. Arts & Sciences Kenai Alternative High School Kenai Central High School Anchor Point Anchor Point Total Cohoe Cohoe Total Cooper Landing Cooper Landing Total Fox River Fox River Fox River Fox River Total Fritz Creek Fritz Creek Total Homer Homer Homer Homer Homer Homer Homer Total Hope Hope Total Kalifornsky Kalifornsky Kalifornsky Total Kenai Kenai Kenai Kenai KPEDD - 2015 Situations & Prospects page 73 2005 2010 2015 9805 131 131 167 167 12 12 91 37 133 261 123 123 34 43 500 248 236 253 1314 14 14 546 546 178 88 49 530 9368 104 104 153 153 7 7 91 38 107 236 137 137 74 37 422 215 233 237 1218 15 15 56 403 459 182 248 82 539 9150 113 113 181 181 19 19 57 83 117 257 120 120 103 31 407 199 212 228 1180 22 22 88 395 483 188 253 77 511 change 10-15 -218 9 9 28 12 21 -17 -38 7 24 School Community Kenai Middle School Kenai Peninsula Youth Facility Marathon School Mt. View Elementary Sears Elementary Moose Pass School Nanwalek School Nikiski Middle/High School Nikiski North Star Elementary Nikolaevsk School Ninilchik School Port Graham School Susan B English School Seward Elementary Seward High School Seward Middle School Spring Creek School Connections Kalifornsky Beach Elementary Redoubt Elementary Soldotna Elementary School Soldotna High School Soldotna Middle School Soldotna Montessori Charter School Soldotna Prep School Sterling Elementary Tebughna School Kenai Kenai Kenai Kenai Kenai Kenai Total Moose Pass Moose Pass Total Nanwalek Nanwalek Total Nikiski Nikiski Nikiski Total Nikolaevsk Nikolaevsk Total Ninilchik Ninilchik Total Port Graham Port Graham Total Seldovia Seldovia Total Seward Seward Seward Seward Seward Total Soldotna Soldotna Soldotna Soldotna Soldotna Soldotna Soldotna Soldotna Soldotna Total Sterling Sterling Total Tyonek Tyonek Total 2005 2010 2015 369 2 323 255 1794 37 37 63 63 433 393 826 73 73 201 201 30 30 66 66 317 261 210 44 832 716 446 414 299 541 556 100 3072 201 201 42 42 361 4 438 1854 18 18 69 69 372 415 787 74 74 170 170 15 15 47 47 284 183 92 20 579 1006 438 379 277 568 430 159 3257 139 139 30 30 383 10 453 1875 14 14 78 78 413 370 783 64 64 164 164 27 27 41 41 300 186 125 611 734 390 424 320 605 155 208 2836 251 251 31 31 Source: Alaska Department of Education and Early Development, Student Enrollments KPEDD - 2015 Situations & Prospects page 74 change 10-15 21 -4 9 -4 -10 -6 12 -6 32 -421 112 1 Many student performance indicators are improving. The dropout rate in the 2013/2014 school year was down to 2.8%, from a ten year high of 4.5% in 2009/2010. Among the 2014 high school senior cohort, the graduation rate was 81.4%, the district’s highest in ten years (Figure 84). Graduation rate refers to the number of students who earned a high school diploma within four years of starting high school. Graduation and Attendance Rates 85% 83% 81% 79% 77% 75% 73% 71% 69% 67% 65% 20.0% 18.0% 16.0% 14.0% 12.0% 10.0% 8.0% 6.0% 4.0% 2.0% 0.0% Sources: ADEED: State AY District Reports; Alaska State Report Card to the Public Graduation Rate* Drop Out Rate Kenai Peninsula Borough School District a comparison of graduation and drop-out rates Fig.84 Dropout Rate In 2014, 193 seniors were eligible for the academically rigorous Alaska Performance Scholarship, compared to 167 the year before. On SATs and ACTs Kenai Peninsula School district students consistently beat statewide averages, but Kenai School District scores have been dropping for several years in a row (Figure 85). Fig. 85 Year 2008 2009 2010 2011 2012 2013 2014 SAT and ACT Test Scores Average ACT Scores Mean SAT Scores KPB Statewide KPB Statewide Schools Schools Schools Schools 24.0 21.2 1572 1533 23.7 21.0 1570 1528 23.1 21.1 1544 1509 23.1 21.2 1562 1513 22.3 21.2 1516 1504 22.5 21.1 1493 1495 21.7 21.0 1496 1485 Source: Kenai Peninsula Borough School District Student Assessment Results On standards based testing (SBA), more Kenai Peninsula School District 5th and 9th grade students score Advanced or Proficient than students in Anchorage or the statewide average, and scored higher than Mat-Su students in most cases. KPEDD - 2015 Situations & Prospects page 75 Fig. 86 Reading Writing Math Adv/ Below Adv/ Below Adv/ Below Prof Prof Prof Prof Prof Prof percent 89.65 10.35 86.43 13.57 81.10 18.90 85.49 14.51 82.78 17.22 74.94 25.06 87.29 12.71 82.19 17.81 76.22 23.78 81.10 18.90 76.80 23.20 70.50 29.50 percent 88.62 11.38 82.46 17.54 69.57 30.43 82.54 17.46 75.09 24.91 62.13 37.87 89.55 10.45 81.32 18.68 72.61 27.39 81.10 18.90 72.90 27.10 61.50 38.50 SPRING 2014 - Standards Based Assessment (SBA) GRADE 5 Kenai Peninsula School District Anchorage School District Mat Su School District Statewide Average GRADE 9 Kenai Peninsula School District Anchorage School District Mat Su School District Statewide Average Source: Alaska Department of Education and Early Development - Assessment, Accountability and Student Information Postsecondary Schools Two postsecondary schools offer degree programs and vocational training on the Kenai Peninsula. The Alaska Vocational Technical Center (AVTEC), located in Kenai, offers short term programs of less than six weeks, and long-term training programs of 6 weeks or more. Training programs include the Alaska Culinary Academy, the Alaska Maritime Training Center, and courses in information technology, nursing, applied technology and power plant operations. While enrollment has remained steady at around 350 students per year in longer term programs, AVTEC has experienced significant growth over the last three years in the number of students enrolled in short term programs. In the fall semester of 2014, 2,886 students enrolled in courses at Kenai Peninsula College (KPC), a branch of the University of Alaska Anchorage. KPC’s main Kenai River Campus in Soldotna has over 2,000 students each semester, and is augmented by satellite campuses in Seward, Homer and Anchorage. The school operates three flagship programs that provide workforce development to the oil and gas industry. In the spring of 2015, the Process Technology enrolled 225 students; the Industrial Process Implementation program had 50 students; and Occupational Safety and Health enrolled 90. KPC’s introduction of live video streaming for all classes has extended the reach of the program to students working on the North Slope and offshore. AVTEC and Kenai Peninsula College, Number of Enrolled Students (FT & PT) Fig. 87 5000 4000 3000 2000 2,230 2,438 3,001 2,905 2,744 2886 1,858 1,944 966 1009 1118 1387 1309 976 1121 1280 2007 2008 2009 2010 2011 2012 2013 2014 1000 0 Sources: AVTEC, KPC AVTEC Students KPC Students, all campuses KPEDD - 2015 Situations & Prospects page 76 Educational Attainment and Civic Engagement Among adults aged 25 and older in the Kenai Peninsula Borough, 93% have a high school diploma or greater compared to 92% statewide. The number of college graduates in the Kenai Peninsula at 24% is slightly lower than the state’s average of 28%. Educational Attainment, Adults Age 25+ 35% 30% 25% 20% 15% 10% 5% 0% Less than 9th grade Fig. 88 9th-12th grade, no diploma High school Some college, grad (or GED) no degree Kenai Peninsula Borough Associates degree Bachelor's degree Alaska Grad. or professional degree Source: ACS 2009-2013 In addition to educational attainment, measures such as voter participation and library circulation rates, can convey information about a population’s literacy and engagement. The voter participation rate for the Kenai Peninsula area tracks consistently with statewide participation in national general elections, leading by one to two percentage points. Turnout is routinely higher in presidential election cycles. Kenai Peninsula Borough general elections draw a lower, fluctuating turnout, from a ten-year low of 13% to a high of 29%. Library circulation rates per capita have also fluctuated over a ten-year period. The most recent data available, from fiscal year 2012, shows that library circulation on the Peninsula is particularly high in smaller communities, and well above statewide rates. Fig. 89 Kenai Peninsula Public Library Annual Circulation of Library Materials, Per Capita Anchor Point Public Library Cooper Landing Community Library Homer Public Library Hope/Sunrise Community Library Kasilof Public Library Kenai Community Library Moose Pass Public Library Ninilchik Community Library Seldovia Public Library Seward Community Library Soldotna Total, all Alaska Libraries FY02 5.6 7.9 20.4 5.9 15.7 12.8 7.4 25.3 5.4 21.1 20.7 5.8 FY08 7.9 8.2 18.3 0.0 9.7 16.2 36.2 19.8 19.6 25.6 25.3 6.3 Libraries in italics report data by calendar year, rather than by fiscal year. Source: Alaska State Library, Alaska Public Library Statistics KPEDD - 2015 Situations & Prospects page 77 FY12 8.3 10.9 20.7 10.7 8.8 17.2 30.3 12.6 23.2 21.6 19.4 7.1 11 Agriculture As reported by the five year US Agricultural Census, the number of farms in the Kenai Peninsula has been increasing for the last ten years, though the total acreage under cultivation has fallen. A farm is defined as any place where $1000 of agricultural products is produced and sold. From 2002 to 2012, the number of farms in the Kenai Peninsula Borough (KPB) grew by 65%, from 98 to 162 farm operations. This far exceeded statewide growth in the number of farms during that same period. Many of the farms started over the last 10 years are small operations, leading to a change in the average Kenai Peninsula farm size from 370 acres in 2002 to under 200 acres in 2012. Mean Farm Size, Alaska and Kenai Peninsula (acres) KPB 2000 AK acres 1500 1000 500 0 1997 Fig. 91 Year 1997 2002 2007 2012 2002 Farms on Kenai Peninsula Number of Acreage in Farms Farms 89 56,474 98 36,269 124 29,140 162 38,289 2007 2012 source: USDA Agricultural Census Fig. 90 The regional growth in the agriculture industry is also reflected in the number of high tunnels constructed on the Kenai Peninsula. The USDA Seasonal High Tunnel Initiative for Crops, which provides grant funding for high tunnel construction to extend farmers’ growing season, has paid for the construction of 252 high tunnels on the Kenai Peninsula between 2010 and 2014. Source: USDA Agricultural Census Kenai Farmers Market, Picture from Local Food Facebook Page These increases in cultivation do not translate to immediate economic growth. According to data gathered annually by the Bureau of Economic Analysis, 2013 was the first year since 2005 that farm proprietors in the Borough had net positive income. This is likely due to the high number of new farm operations in the region. Farms have high startup costs, and often require a multi-year period to see return on investment and reach full production levels. KPEDD - 2015 Situations & Prospects page 78 12 City Profiles City of Homer (Figures 92-94) Source: 2009-2013 American Community Survey 5-Year Estimates, unless noted otherwise POPULATION 2014 Population 1 # PFDs 2013 2 (in zip code 99603) School Enrollment, all schools in City of Homer (Oct 1, 2014) 3 HOUSING Total housing units Occupied housing units Vacant housing units Median value of owner-occupied units Median monthly rent (for renters) Households spending more than 30% of income on housing For homeowners with a mortgage For homeowners without a mortgage For renters EMPLOYMENT STATUS Population 16 years and over In civilian labor force Unemployed Working Private wage and salary workers Government workers Self-employed in own not-incorporated biz. workers Unpaid family workers In Armed Forces Not in labor force INCOME AND BENEFITS (in 2013 inflation-adjusted dollars) Total households Median household income Mean household income Households with… Earnings Social Security Retirement income Supplemental Security Income Cash public assistance income Food Stamp/SNAP benefits in the past 12 months Total Families Median family income Mean family income Per capita income KPEDD - 2015 Situations & Prospects page 79 5,099 9,720 1,180 2013 Percent 2,747 2,207 80.3% 540 19.7% $262,400 $892 ME ME ME 4,082 2,528 175 2,353 1,557 407 381 8 37 1,517 2,207 $53,750 $72,703 1,763 621 399 92 189 215 1,246 $74,583 $91,596 $32,046 61.9% 4.3% 57.6% 66.2% 17.3% 16.2% 0.3% 0.9% 37.2% 79.9% 28.1% 18.1% 4.2% 8.6% 9.7% - HEALTH INSURANCE COVERAGE Civilian noninstitutionalized population With health insurance coverage Without health insurance coverage BELOW FEDERAL POVERTY LEVEL All families Families with female householder, no husband present All people EDUCATIONAL ATTAINMENT Population 25 years and over Less than 9th grade 9th to 12th grade, no diploma High school graduate (includes equivalency) Some college, no degree Associate's degree Bachelor's degree Graduate or professional degree 5,085 3,865 1,220 76.0% 24.0% - 6.6% 10.2% 3,555 - 0.6% 3.8% 21.9% 32.2% 9.1% 20.6% 11.8% ME - Margin of error exceeds 6%, not reported 1 ADOLWD 2 Reported by zip code, ADOR 3 # Students enrolled in schools within city boundary, ADEED Sales Tax Year 2014 2009 2004 Rate 4.5% 4.5% 3.5% Revenue $7,399,059 $7,600,739 $4,353,146 CITY OF HOMER TAXES Property Tax O&G Mill Rate Revenue Revenue 11.3 $3,220,859 $181,087 11.3 $2,980,980 $0 13.35 $1,742,434 $0 Source: DCCED Alaska Taxable Data Base KPEDD - 2015 Situations & Prospects page 80 Total $3,401,946 $2,980,980 $1,742,434 GROSS BUSINESS SALES IN CITY OF HOMER (in 1000s) Business Type 2013 2012 2011 2010 2009 2008 Admin, Waste Mgmt $17,430 $17,534 $21,554 $29,332 $15,950 $15,874 Ag, Forestry, Fishing, Hunting $209 $161 $221 $124 $109 $121 Arts & Entertainment $1,238 $1,206 $1,167 $1,182 $1,151 $1,424 Construction Contracting $39,968 $34,242 $27,237 $20,125 $37,856 $39,628 Educational Svs $274 $302 $288 $272 $274 $313 Finance & Insurance $99 $107 $113 $167 $74 $65 Guiding Land $446 $124 $142 $123 $79 $60 Guiding Water $11,353 $10,686 $10,676 $9,982 $9,252 $11,858 Health Care, Social Asst $5,376 $5,509 $4,785 $4,276 $3,220 $2,738 Hotel/Motel/B&B $14,419 $13,875 $13,481 $12,430 $11,652 $14,254 Information $6,735 $6,917 $7,390 $7,432 $7,733 $8,567 Mgmt of Companies $0 * $0 $0 $0 $0 Manufacturing $7,660 $9,237 $7,798 $7,231 $6,693 $7,722 Mining/Quarrying * * $0 * * * Prof, Scientific & Technical Svs $10,097 $8,084 $6,341 $6,630 $7,438 $7,174 Public Admin $5,265 $5,078 $4,639 $4,458 $4,677 $4,250 Remediation Svs $516 $420 * $0 * $0 Rental Commercial Prop $935 $942 $1,054 $982 $713 $445 Rental Non-Residential Prop $1,181 $900 $828 $1,034 $683 $949 Rental Self-storage & $2,659 $2,451 $2,159 $2,009 $1,856 $1,799 Miniwarehouses Rental Personal Prop $875 $907 $976 $891 $883 $737 Rental Residential Prop $11,619 $11,321 $10,467 $9,853 $9,880 $13,167 Restaurant/Bar $17,229 $16,012 $16,120 $14,999 $13,750 $13,867 Retail Trade $162,593 $167,112 $163,337 $141,845 $133,461 $148,018 Services $24,813 $20,595 $16,726 $15,721 $12,078 $12,010 Telecommunications $1,677 $1,707 $2,136 $2,320 $2,106 $834 Timbering * * * * * * Trailer Court * * * * * * Transportation, Warehousing $15,988 $28,624 $24,657 $21,419 $17,591 $20,513 Utilities $49,358 $48,569 $41,979 $26,477 $51,087 $45,867 Wholesale Trade $25,956 $18,366 $18,995 $17,107 $12,904 $11,287 GRAND TOTAL $436,004 $431,017 $405,367 $358,435 $364,189 $383,561 Annual % change 1.2% 6.3% 13.1% -1.6% -5.1% Source: Kenai Peninsula Borough Finance Dept *confidential KPEDD - 2015 Situations & Prospects page 81 City of Kenai (Figures 95-97) Source: 2009-2013 American Community Survey 5-Year Estimates, unless noted otherwise POPULATION 2014 Population 1 # PFDs 2013 2 (in zip code 99611) School Enrollment, all schools in City of Kenai (Oct 1, 2014) 3 HOUSING Total housing units Occupied housing units Vacant housing units Median value of owner-occupied units Median monthly rent (for renters) Households spending more than 30% of income on housing For homeowners with a mortgage For homeowners without a mortgage For renters EMPLOYMENT STATUS Population 16 years and over In civilian labor force Unemployed Working Private wage and salary workers Government workers Self-employed in own not-incorporated biz. workers Unpaid family workers In Armed Forces Not in labor force INCOME AND BENEFITS (in 2013 inflation-adjusted dollars) Total households Median household income Mean household income Households with… Earnings Social Security Retirement income Supplemental Security Income Cash public assistance income Food Stamp/SNAP benefits in the past 12 months Total Families Median family income Mean family income Per capita income HEALTH INSURANCE COVERAGE Civilian noninstitutionalized population With health insurance coverage Without health insurance coverage KPEDD - 2015 Situations & Prospects page 82 7,167 12,706 1,875 2013 Percent 3,108 2,820 90.7% 288 9.3% $184,800 $885 328 52 390 30.5% 9.4% 35.9% 5,608 3,915 437 3,478 2,664 561 253 0 0 1,693 69.8% 7.8% 62.0% 76.6% 16.1% 7.3% 0.0% 0.0% 30.2% 2,820 $63,019 $78,137 - 2,390 634 511 184 165 271 1,870 $76,815 $89,140 $31,710 84.8% 22.5% 18.1% 6.5% 5.9% 9.6% - 7,230 5,417 1,813 74.9% 25.1% BELOW FEDERAL POVERTY LEVEL All families Families with female householder, no husband present All people EDUCATIONAL ATTAINMENT Population 25 years and over Less than 9th grade 9th to 12th grade, no diploma High school graduate (includes equivalency) Some college, no degree Associate's degree Bachelor's degree Graduate or professional degree ME - 3.7% 9.4% 4,662 - 1.8% 5.1% 35.6% 27.4% 7.9% 12.8% 9.4% ME - Margin of error exceeds 6%, not reported 1 ADOLWD 2 PFDs reported by zip code, ADOR 3 # Students enrolled in schools within city boundary, ADEED Year 2014 2009 2004 Sales Tax Rate Revenue 3% $6,623,650 3% $5,372,499 3% $3,680,000 CITY OF KENAI TAXES Property Tax Mill Rate Revenue O&G 8.86 $3,204,551 $191,845 9.0 $2,550,238 $90,104 12.10 $1,950,156 $26,130 Total $3,396,396 $2,640,342 $1,976,286 Source: DCCED Alaska Taxable Data Base Kenai Mayor Pat Porter welcomes audience at 2015 KPEDD Industry Outlook Forum KPEDD - 2015 Situations & Prospects page 83 GROSS BUSINESS SALES IN CITY OF KENAI (in 1000s) Business Type 2013 2012 2011 2010 2009 2008 Admin, Waste Mgmt $3,615 $3,090 $3,024 $2,781 $3,193 $2,860 Ag, Forestry, Fishing, Hunting $463 $359 $319 $309 $347 $408 Arts & Entertainment $604 $738 $750 $1,220 $999 $855 Construction Contracting $61,791 $51,662 $31,488 $31,366 $54,256 $55,126 Educational Svs $643 $362 $310 $251 $218 $637 Finance & Insurance $572 $584 $659 $604 $461 $453 Guiding Land * * * * * * Guiding Water $361 $719 $513 $692 $543 $1,011 Health Care, Social Asst $326 $375 $624 $1,139 $1,268 $1,866 Hotel/Motel/B&B $9,759 $9,659 $7,798 $7,178 $6,862 $7,888 Information $10,656 $10,750 $10,894 $11,027 $10,963 $12,171 Mgmt of Companies $0 * $0 $0 $0 $0 Manufacturing $25,157 $22,286 $39,115 $18,833 $21,576 $38,343 Mining/Quarrying $4,519 $5,001 $9,770 $9,973 $14,712 $60,106 Prof, Scientific & Technical Svs $12,552 $14,704 $11,419 $11,872 $12,037 $12,329 Public Admin $5,158 $4,749 $4,408 $3,939 $3,881 $4,101 Remediation Svs * * * * * * Rental Commercial Prop $618 $611 $833 $634 $465 $450 Rental Non-Residential Prop $4,260 $4,884 $3,961 $3,480 $3,610 $4,114 Rental Self-storage & * * * * * * Miniwarehouses Rental Personal Prop $455 $845 $871 $1,017 $1,153 $982 Rental Residential Prop $12,170 $12,220 $11,368 $11,302 $12,238 $12,787 Restaurant/Bar $14,362 $14,287 $14,234 $13,654 $12,955 $13,140 Retail Trade $269,715 $276,010 $267,720 $212,351 $169,876 $166,509 Services $7,901 $8,119 $7,334 $6,340 $5,197 $5,532 Telecommunications $1,685 $1,780 $1,807 $1,936 $2,078 $963 Transportation, Warehousing $12,720 $17,042 $15,127 $19,103 $15,922 $151,469 Utilities $46,216 $34,499 $18,489 $16,299 $19,014 $15,431 Wholesale Trade $78,681 $76,385 $53,846 $23,925 $21,916 $40,373 GRAND TOTAL $584,960 $571,720 $516,682 $411,223 $395,741 $609,904 Annual % change 2.3% 10.7% 25.6% 3.9% -35.1% Source: Kenai Peninsula Borough Finance Dept *confidential KPEDD - 2015 Situations & Prospects page 84 City of Seldovia (Figures 98-99) A demographic profile is not presented for the City of Seldovia because the population is small enough that the 2009-2013 American Community Survey margin of error is high and renders the data unreliable. GROSS BUSINESS SALES IN CITY OF SELDOVIA (in 1000s) Business Type 2013 2012 2011 2010 2009 2008 Admin, Waste Mgmt $0 * * * * * Ag, Forestry, Fishing, Hunting $0 $0 * $0 * * Arts & Entertainment $31 $58 $49 $34 $19 $727 Construction Contracting $990 $870 $1,314 $3,497 $989,702 $989,702 Educational Svs $0 * * * * * Finance & Insurance $0 $0 * * $20 $33 Guiding Land $0 $0 $0 * $206 $226 Guiding Water $253 $273 $237 $197 $3 $0 Health Care, Social Asst $0 $0 $54 * $249 $819 Hotel/Motel/B&B $163 $193 $180 $194 $358 $338 Information $398 $427 $389 $356 $1 $33 Manufacturing * * * * $0 * Prof, Scientific & Technical Svs $343 $325 $146 $172 $69 $94 Public Admin * * * * * * Rental Commercial Prop * * * * * * Rental Non-Residential Prop $0 $0 * * * * Rental Self-storage & $0 $0 $0 $0 * * Miniwarehouses Rental Personal Prop * * * * * * Rental Residential Prop $54 $52 $69 $93 $43 $98 Restaurant/Bar $638 $735 $836 $795 $655 $828 Retail Trade $798 $645 $778 $905 $852 $1,156 Services $31 $37 $166 $129 $91 $140 Telecommunications * * * * * * Transportation, Warehousing * * * * * * Utilities * * * * * * Wholesale Trade * * * * * * GRAND TOTAL $3,699 $3,614 $4,217 $6,373 $4,170 $5,499 Annual % change 2.3% -14.3% -33.8% 52.8% -24.2% Source: Kenai Peninsula Borough Finance Dept Year 2014 2009 2004 *confidential CITY OF SELDOVIA TAXES Sales Tax Property Tax Rate Revenue Mill Rate Revenue O&G 2.5%/4.5% $128,487 9.85 $213,696 $0 2.5%/4.5% $76,970 9.10 $126,554 $0 2.5%/6.5% $107,299 13.85 $146,451 $0 Source: DCCED Alaska Taxable Data Base KPEDD - 2015 Situations & Prospects page 85 Total $213,696 $126,554 $146,451 Top: Seldovia Bay, photo from Alaska Primary Care Assn website Bottom:: photo from Seldovia Bay ferry website KPEDD - 2015 Situations & Prospects page 86 City of Seward (Figures 100-102) Source: 2009-2013 American Community Survey 5-Year Estimates, unless noted otherwise POPULATION 2014 Population 1 # PFDs 2013 2 (in zip code 99664) School Enrollment, all schools in City of Seward (Oct 1, 2014 )3 HOUSING Total housing units Occupied housing units Vacant housing units Median value of owner-occupied units Median monthly rent (for renters) Households spending more than 30% of income on housing For homeowners with a mortgage For homeowners without a mortgage For renters EMPLOYMENT STATUS Population 16 years and over In civilian labor force Unemployed Working Private wage and salary workers Government workers Self-employed in own not-incorporated biz. workers Unpaid family workers In Armed Forces Not in labor force INCOME AND BENEFITS (in 2013 inflation-adjusted dollars) Total households Median household income Mean household income Households with… Earnings Social Security Retirement income Supplemental Security Income Cash public assistance income Food Stamp/SNAP benefits in the past 12 months Total Families Median family income Mean family income Per capita income HEALTH INSURANCE COVERAGE Civilian noninstitutionalized population With health insurance coverage Without health insurance coverage KPEDD - 2015 Situations & Prospects page 87 2,768 3,923 611 2013 Percent 1,210 ME ME $176,300 $724 ME ME ME - 2,386 ME 91 ME ME ME 87 9 7 ME 7.7% 0.8% - 975 $46,971 $72,889 ME ME ME ME 28 ME ME 530 $75,114 $99,462 $28,902 2.9% - 2,325 ME ME - BELOW FEDERAL POVERTY LEVEL All families Families with female householder, no husband present All people EDUCATIONAL ATTAINMENT Population 25 years and over Less than 9th grade 9th to 12th grade, no diploma High school graduate (includes equivalency) Some college, no degree Associate's degree Bachelor's degree Graduate or professional degree ME - 2.8% 4.2% 2,160 ME ME ME ME 3.1% 5.5% 3.0% - ME - Margin of error exceeds 6%, not reported 1 ADOLWD 2 PFDs reported by zip code, ADOR 3 # Students enrolled in schools within city boundary, ADEED Year 2014 2009 2004 CITY OF SEWARD TAXES Sales Tax Property Tax Rate Revenue Mill Rate Revenue O&G 4% $4,584,701 8.37 $1,276,897 $0 4% $4,138,995 8.12 $953,957 $0 4% $2,674,839 10.22 $670,297 $0 Source: DCCED Alaska Taxable Data Base Start of the annual Mt. Marathon Race in Seward KPEDD - 2015 Situations & Prospects page 88 Total $1,276,897 $953,957 $670,297 GROSS BUSINESS SALES IN CITY OF SEWARD (in 1000s) Business Type 2013 2012 2011 2010 2009 2008 Admin, Waste Mgmt $2,514 $2,077 $1,772 $1,575 $1,306 $1,201 Ag, Forestry, Fishing, Hunting $27 $10 * $0 $0 * Arts & Entertainment $58 $252 $616 $534 $93 $66 Construction Contracting $26,040 $29,769 $23,956 $22,290 $33,687 $31,073 Educational Svs $39 $56 $57 $40 $17 $48 Finance & Insurance $47 $144 $446 $118 $86 $90 Guiding Land $604 $151 $149 $195 $80 $40 Guiding Water $23,936 $20,968 $21,080 $19,769 $17,258 $22,928 Health Care, Social Asst $1,310 $1,165 $1,225 $1,495 $1,694 $1,812 Hotel/Motel/B&B $13,892 $12,604 $11,601 $10,207 $9,401 $12,124 Information $3,705 $3,644 $3,845 $3,915 $3,967 $4,084 Manufacturing $16,941 $20,175 $16,136 $13,979 $14,522 $17,637 Mining/Quarrying $0 $0 $0 $0 $72 $105 Prof, Scientific & Technical Svs $8,624 $10,257 $11,314 $9,942 $7,062 $4,224 Public Admin $7,399 $7,366 $7,076 $6,793 $6,987 $6,743 Remediation Svs $0 $0 $0 $0 $0 $1 Rental Commercial Prop $1,845 $1,973 $1,516 $1,739 $1,705 $1,946 Rental Non-Residential Prop $426 $348 $262 $298 $352 $509 Rental Self-storage & * * * * * * Miniwarehouses Rental Personal Prop $133 $160 $149 $140 $125 $100 Rental Residential Prop $7,865 $5,257 $5,397 $4,369 $5,506 $5,183 Restaurant/Bar $13,192 $12,005 $11,132 $10,052 $9,197 $10,243 Retail Trade $54,276 $52,178 $51,417 $49,972 $46,894 $50,722 Services $14,361 $17,973 $10,434 $1,886 $2,420 $2,474 Telecommunications $396 $480 $493 $610 $405 $413 Transportation, Warehousing $9,722 $7,127 $4,631 $4,277 $4,592 $6,479 Utilities * * * * * * Wholesale Trade $31,627 $31,537 $26,292 $22,343 $18,426 $30,050 GRAND TOTAL $238,980 $237,677 $210,994 $186,539 $185,854 $210,296 Annual % change 0.5% 12.6% 13.1% 0.4% -11.6% Source: Kenai Peninsula Borough Finance Dept *confidential KPEDD - 2015 Situations & Prospects page 89 City of Soldotna (Figures 103-105) Source: 2009-2013 American Community Survey 5-Year Estimates, unless noted otherwise POPULATION 2014 Population 1 # PFDs 2013 2 (in zip code 99669) School Enrollment, all schools in City of Soldotna (Oct 1, 2014) 3 HOUSING Total housing units Occupied housing units Vacant housing units Median value of owner-occupied units Median monthly rent (for renters) Households spending more than 30% of income on housing For homeowners with a mortgage For homeowners without a mortgage For renters EMPLOYMENT STATUS Population 16 years and over In civilian labor force Unemployed Working Private wage and salary workers Government workers Self-employed in own not-incorporated biz. workers Unpaid family workers In Armed Forces Not in labor force INCOME AND BENEFITS (in 2013 inflation-adjusted dollars) Total households Median household income Mean household income Households with… Earnings Social Security Retirement income Supplemental Security Income Cash public assistance income Food Stamp/SNAP benefits in the past 12 months Total Families Median family income Mean family income Per capita income HEALTH INSURANCE COVERAGE Civilian noninstitutionalized population With health insurance coverage Without health insurance coverage KPEDD - 2015 Situations & Prospects page 90 4,311 14,426 2,836 2013 Percent 1,844 1,669 90.5% 175 9.5% $213,800 $990 ME ME ME 3,323 2,007 256 1,751 1,474 236 41 0 0 1,316 1,669 $54,931 $77,447 60.4% 7.7% 52.7% 84.2% 13.5% 2.3% 0.0% 0.0% 39.6% - 1,337 497 314 111 131 199 1,193 $57,656 $88,484 $31,295 80.1% 29.8% 18.8% 6.7% 7.8% 11.9% - 4,211 3,226 985 76.6% 23.4% BELOW FEDERAL POVERTY LEVEL All families Families with female householder, no husband present All people EDUCATIONAL ATTAINMENT Population 25 years and over Less than 9th grade 9th to 12th grade, no diploma High school graduate (includes equivalency) Some college, no degree Associate's degree Bachelor's degree Graduate or professional degree ME 2,615 - ME - Margin of error exceeds 6%, not reported 1 ADOLWD 2 PFDs reported by zip code, ADOR 3 # Students enrolled in schools within city boundary, ADEED Year 2014 2009 2004 CITY OF SOLDOTNA TAXES Sales Tax Property Tax Rate Revenue Mill Rate Revenue O&G 3% $7,725,471 7.66 $268,057 $0 3% $7,717,581 9.10 $803,576 $0 3% $5,694,134 11.60 $523,714 $0 Source: DCCED Alaska Taxable Data Base KPEDD - 2015 Situations & Prospects page 91 Total $268,057 $803,576 $523,714 3.5% 5.0% 2.8% 4.7% 30.8% 29.6% 8.0% 13.8% 10.3% GROSS BUSINESS SALES IN CITY OF SOLDOTNA (in 1000s) Business Type 2013 2012 2011 2010 2009 2008 Admin, Waste Mgmt $3,656 $3,144 $2,824 $2,437 $3,224 $6,678 Ag, Forestry, Fishing, $88 $84 $107 $45 $30 $144 Hunting Arts & Entertainment $4,046 $1,633 $1,570 $1,392 $1,433 $1,515 Construction Contracting $73,914 $39,160 $25,989 $21,223 $24,769 $35,627 Educational Svs $716 $712 $721 $588 $601 $629 Finance & Insurance $442 $385 $376 $835 $701 $940 Guiding Land * * * * * * Guiding Water $605 $777 $908 $678 $988 $1,694 Health Care, Social Asst $9,101 $10,657 $12,002 $11,460 $9,050 $9,388 Hotel/Motel/B&B $4,971 $4,811 $4,794 $4,264 $4,617 $5,404 Information $10,090 $10,472 $10,526 $10,753 $11,316 $11,828 Mgmt of Companies $0 * $0 $0 * * Manufacturing $7,551 $15,010 $9,329 $10,592 $11,048 $10,118 Mining/Quarrying $3,125 $56 $79 $61 $79 $127 Prof, Scientific & Technical $10,883 $10,531 $10,621 $9,612 $9,542 $10,263 Svs Public Admin $1,612 $1,634 $1,394 $1,358 $1,320 $1,189 Rental Commercial Prop $2,219 $2,000 $1,815 $1,781 $1,637 $1,445 Rental Non-Residential Prop $6,712 $4,354 $4,678 $4,862 $4,793 $5,748 Rental Self-storage & * $0 $0 $0 * * Miniwarehouses Rental Personal Prop $856 $849 $759 $727 $603 $374 Rental Residential Prop $11,112 $9,827 $9,331 $9,276 $8,704 $9,491 Restaurant/Bar $25,678 $25,489 $23,378 $22,414 $22,575 $23,987 Retail Trade $261,132 $255,400 $243,332 $246,262 $251,821 $286,385 Services $9,760 $9,095 $8,998 $9,094 $8,943 $8,275 Telecommunications $3,071 $2,705 $2,436 $2,811 $2,113 $536 Timbering $0 $0 $0 $0 * * Transportation, $3,451 $13,741 $13,801 $10,815 $8,272 $10,779 Warehousing Utilities $14,103 $14,142 $22,768 $27,099 $14,543 $12,420 Wholesale Trade $31,766 $18,960 $18,202 $18,189 $18,119 $13,244 GRAND TOTAL $500,663 $455,627 $430,740 $428,628 $420,839 $468,228 Annual % change 9.9% 5.8% 0.5% 1.9% -10.1% Source: Kenai Peninsula Borough Finance Dept *confidential KPEDD - 2015 Situations & Prospects page 92 13 County Business Patterns –By Zip Code Number of businesses per sector is reported for each zip code. For the Kenai Peninsula Borough as a whole, in addition to number of businesses per sector, number of employees by sector and annual payroll by sector is reported. Information is shown for 2012 and 2008, the most recently available data and five years previous. All data is gathered from County Business Patterns Census data, http://www.census.gov/econ/cbp/ Zip Code 99556 99568 99572 99603 99605 99610 99611 99631 99635 99639 99663 99664 99669 99672 99682 Includes these communities… Kenai Peninsula Borough (all zip codes aggregated) Anchor Point, Nikolaevsk, Happy Valley Clam Gulch Cooper Landing Homer, Diamond Ridge, Fritz Creek, Kachemak, Halibut Cove, Port Graham, Nanwalek Hope, Sunrise Kasilof/Cohoe Kenai, Salamatof, Point Possession Moose Pass, Crown Point Nikiski Ninilchik Seldovia, Seldovia Village Seward, Lowell Point, Bear Creek, Primrose Soldotna, Kalifornsky, Funny River, Ridgeway Sterling Tyonek, Beluga KPEDD - 2015 Situations & Prospects page 93 Anchor Point, Nikolaevsk, Happy Valley – Zip Code 99556 Source: American Community Survey, 2009-2013 ZIP 99556 Total Number of Businesses Total Number of Employees Annual Payroll 2008 2012 57 55 230 146 $5,965,000 $10,098,000 Number of Businesses by Industry - ZIP 99556 Anchor Point, Nikolaevsk, Happy Valley 7 Other Services (except Public Administration) 5 4 Accommodation and Food Services 5 Arts, Entertainment, and Recreation 1 4 Health Care and Social Assistance 3 Educational Services 1 3 3 Admin, Support, Waste Mgt, Remediation Services 2 Professional, Scientific, and Technical Services 3 2012 1 Real Estate and Rental and Leasing 2 4 Information 2 2008 6 Transportation and Warehousing 4 3 Retail Trade 5 1 Manufacturing 2 13 Construction 14 Utilities 2 Mining, Quarrying, and Oil and Gas Extraction 2 2 3 3 Agriculture, Forestry, Fishing and Hunting 2 0 5 10 Total Number of Establishments KPEDD - 2015 Situations & Prospects page 94 15 Clam Gulch Area – Zip Code 99568 Source: American Community Survey, 2009-2013 ZIP 99568 Total Number of Businesses Total Number of Employees Annual Payroll 2008 4 6 $207,000 2012 4 6 $275,000 Number of Businesses by Industry -ZIP 99568 Clam Gulch Accommodation and food services 2 1 Professional, Scientific, and Technical Services 1 2012 1 Transportation and Warehousing 2008 2 Construction 1 0 1 2 Total Number of Establishments KPEDD - 2015 Situations & Prospects page 95 3 Cooper Landing Area – Zip Code 99572 Source: American Community Survey, 2009-2013 ZIP 99572 Total Number of Businesses Total Number of Employees Annual Payroll 2008 2012 31 37 45 45 $2,878,000 $4,272,000 Number of Businesses by Industry - ZIP 99572 Cooper Landing 9 Accommodation and Food Services 11 8 Arts, Entertainment, and Recreation 6 3 3 Health Care and Social Assistance Transportation and warehousing 2 1 Educational Services Administrative and Support and Waste Management and Remediation Services 1 2012 1 Professional, Scientific, and Technical Services 2008 1 Real Estate and Rental and Leasing 1 Finance and Insurance 4 4 Retail Trade 1 Manufacturing 5 Construction 3 Utilities 1 1 Agriculture, Forestry, Fishing and Hunting 1 1 0 5 10 Total Number of Establishments KPEDD - 2015 Situations & Prospects page 96 15 Homer, Diamond Ridge, Fritz Creek, Kachemak, Halibut Cove, Port Graham, Nanwalek Area – Zip Code 99603 Source: U.S. Census Bureau Zip Code Business Patterns, 2008 and 2012 ZIP 99603 Total Number of Businesses Total Number of Employees Annual Payroll 2008 2012 485 506 2,543 2,968 $91,289,000 $108,827,000 Number of Businesses by Industry - ZIP 99603 Homer, Diamond Ridge, Fritz Creek, Katchemak, Halibut Cove, Port Graham, Nanwalek Industries not Classified 1 37 37 Other Services (except Public Administration) 57 60 Accommodation and Food Services 17 19 Arts, Entertainment, and Recreation Health Care and Social Assistance 44 48 5 6 Educational Services Admin, Support, Waste Mgt, Remediation Services 15 20 2012 24 25 Professional, Scientific, and Technical Services 17 16 14 12 12 9 Real Estate and Rental and Leasing Finance and Insurance Information 2008 42 45 Transportation and Warehousing 61 61 Retail Trade Wholesale Trade 12 16 17 17 Manufacturing 62 Construction 75 2 3 Utilities Agriculture, Forestry, Fishing and Hunting 55 28 0 20 40 60 Total Number of Businesses KPEDD - 2015 Situations & Prospects page 97 80 Hope, Sunrise Area – Zip Code 99605 Source: U.S. Census Bureau Zip Code Business Patterns, 2008 and 2012 ZIP 99605 Total Number of Businesses Total Number of Employees Annual Payroll 2008 10 11 $564,000 2012 10 0-19 $742,000 Number of Businesses by Industry - ZIP 99605 Hope, Sunrise Other Services (except Public Administration) 2 Accommodation and Food Services 2 Arts, Entertainment, and Recreation 2 2 3 1 1 Admin, Support, Waste Mgt, Remediation Services Professional, scientific, and technical services Transportation and warehousing Retail Trade 1 2012 1 1 1 2008 2 Manufacturing Construction 1 0 1 2 Total Number Businesses KPEDD - 2015 Situations & Prospects page 98 3 4 Kasilof, Cohoe Area – Zip Code 99610 Source: U.S. Census Bureau Zip Code Business Patterns, 2008 and 2012 ZIP 99610 Total Number of Businesses Total Number of Employees Annual Payroll 2008 2012 43 40 20-99 20-99 $3,316,000 $3,800,000 Number of Businesses by Industry - ZIP 99610 Kasilof Cohoe Industries not classified 1 6 6 Other Services (except Public Administration) 3 3 Accommodation and Food Services 2 2 Health Care and Social Assistance 4 Admin, Support, Waste Mgt, Remediation Services 3 Professional, scientific, and technical services 1 Real estate and rental and leasing 2012 1 2008 1 Information 3 Transportation and Warehousing 1 3 3 Retail Trade 3 Manufacturing 4 11 Construction 15 4 Agriculture, Forestry, Fishing and Hunting 3 0 5 10 Total Number of Businesses KPEDD - 2015 Situations & Prospects page 99 15 20 Kenai, Salamatof, Point Possession Area – Zip Code 99611 Source: U.S. Census Bureau Zip Code Business Patterns, 2008 and 2012 ZIP 99611 Total Number of Businesses Total Number of Employees Annual Payroll 2008 2012 407 411 3,158 3,769 $143,088,000 $210,420,000 Number of Businesses by Industry - ZIP 99611 Kenai, Salamatof, Point Posession Industries not Classified 1 54 Other Services (except Public Administration) 45 41 43 Accommodation and Food Services 10 9 Arts, Entertainment, and Recreation 41 43 Health Care and Social Assistance 5 6 Educational Services 21 22 Admin, Support, Waste Mgt, Remediation Services 2 1 Management of Companies and Enterprises 38 39 Professional, Scientific, and Technical Services 12 Real Estate and Rental and Leasing 16 18 Finance and Insurance 2012 2008 11 5 4 Information 17 19 Transportation and Warehousing 34 Retail Trade 40 21 21 Wholesale Trade 16 Manufacturing 11 60 61 Construction 1 2 Utilities 9 Mining, Quarrying, and Oil and Gas Extraction 7 6 6 Agriculture, Forestry, Fishing and Hunting 0 10 20 30 40 Total Number of Businesses KPEDD - 2015 Situations & Prospects page 100 50 60 70 Moose Pass, Crown Point Area – Zip Code 99631 Source: U.S. Census Bureau Zip Code Business Patterns, 2008 and 2012 ZIP 99631 Total Number of Businesses Total Number of Employees Annual Payroll 2008 2012 9 8 27 30 $3,012,000 $3,152,000 Number of Businesses by Industry - ZIP 99631 Moose Pass, Crown Point 2 Accommodation and Food Services 2 1 Educational Services 1 1 Professional, Scientific, and Technical Services 1 2012 Transportation and warehousing 2 2008 2 Retail Trade 1 1 Construction 2 1 Agriculture, Forestry, Fishing and Hunting 0 1 2 Total Number of Businesses KPEDD - 2015 Situations & Prospects page 101 3 Nikiski Area – Zip Code 99635 Source: U.S. Census Bureau Zip Code Business Patterns, 2008 and 2012 ZIP 99635 Total Number of Businesses Total Number of Employees Annual Payroll 2008 2012 50 45 487 268 $38,457,000 $18,537,000 Number of Businesses by Industry - ZIP 99635 Nikiski 5 Other Services (except Public Administration) 5 5 Accommodation and Food Services 5 1 Health Care and Social Assistance 2 3 Admin, Support, Waste Mgt, Remediation Services 2 Professional, scientific, and technical services 2012 1 2008 4 Real Estate and Rental and Leasing 3 7 Transportation and Warehousing 5 5 Retail Trade 5 3 Wholesale Trade 3 1 Manufacturing 4 10 Construction 12 1 Mining, Quarrying, and Oil and Gas Extraction 3 0 2 4 6 8 10 Total Number of Businesses KPEDD - 2015 Situations & Prospects page 102 12 14 Ninilchik Area – Zip Code 99639 Source: U.S. Census Bureau Zip Code Business Patterns, 2008 and 2012 ZIP 99639 Total Number of Businesses Total Number of Employees Annual Payroll 2008 2012 33 35 79 128 $3,383,000 $5,288,000 Number of Businesses by Industry - ZIP 99639 Ninilchik 13 Accommodation and Food Services 10 2 Arts, Entertainment, and Recreation 1 3 Health Care and Social Assistance 3 2 Admin, Support, Waste Mgt, and Remediation Services 1 Professional, Scientific, and Technical Services 2 2012 1 Information 1 3 Transportation and Warehousing 2008 3 4 Retail Trade 5 2 Manufacturing 1 2 Construction 5 2 Agriculture, Forestry, Fishing and Hunting 2 0 1 2 3 4 5 6 7 8 9 10 11 12 13 14 Total Number of Businesses KPEDD - 2015 Situations & Prospects page 103 Seldovia, Seldovia Village Area – Zip Code 99663 Source: U.S. Census Bureau Zip Code Business Patterns, 2008 and 2012 ZIP 99663 Total Number of Businesses Total Number of Employees Annual Payroll 2008 2012 18 15 20-99 47 $1,640,000 $1,664,000 Number of Businesses by Industry - ZIP 99663 Seldovia, Seldovia Village 3 Accommodation and food services 4 Admin, Support, Waste Mgt, Remediation Services 1 Professional, Scientific, and Technical Services 1 2 1 3 Transportation and Warehousing 2 2012 2 Retail trade 2 2008 1 Wholesale trade 1 2 Construction 4 1 Utilities 1 1 Forestry, fishing, hunting, and Agriculture Support 1 0 1 2 3 Total Number of Businesses KPEDD - 2015 Situations & Prospects page 104 4 5 Seward, Lowell Point, Bear Creek, Primrose Area – Zip Code 99664 Source: U.S. Census Bureau Zip Code Business Patterns, 2008 and 2012 ZIP 99664 Total Number of Businesses Total Number of Employees Annual Payroll 2008 2012 188 195 1,222 1,284 $52,305,000 $57,136,000 Number of Businesses by Industry Seward, Lowell Point, Bear Creek, Primrose 1 1 Industries not classified 13 Other Services (except Public Administration) 17 48 Accommodation and Food Services 39 7 Arts, Entertainment, and Recreation 9 18 16 Health Care and Social Assistance 2 Educational Services 1 Admin, Support, Waste Mgt, Remediation Services 8 6 2012 1 2 Management of Companies and Enterprises 9 11 Professional, Scientific, and Technical Services 2008 3 3 4 3 Real Estate and Rental and Leasing Finance and Insurance 2 Information 1 26 26 Transportation and Warehousing 21 21 Retail Trade 3 Wholesale Trade 6 6 7 Manufacturing 12 13 Construction 1 1 Mining, Quarrying, and Oil and Gas Extraction 10 Agriculture, Forestry, Fishing and Hunting 5 0 10 20 30 40 Total Number of Businesses KPEDD - 2015 Situations & Prospects page 105 50 60 Soldotna, Kalifornsky, Funny River, Ridgeway Area – Zip Code 99669 Source: U.S. Census Bureau Zip Code Business Patterns, 2008 and 2012 ZIP 99669 Total Number of Businesses Total Number of Employees Annual Payroll 2008 2012 550 606 4886 5211 $170,013,000 $198,756,000 Number of Businesses by Industry - ZIP 99669 Soldotna, Kalifornsky, Funny River, Ridgeway 58 Other Services (except Public Administration) 53 70 Accommodation and Food Services 63 19 Arts, Entertainment, and Recreation 16 107 Health Care and Social Assistance 84 7 Educational Services 9 Admin, Support, Waste Mgt, Remediation Services 20 19 Management of companies and enterprises 1 2012 31 Professional, Scientific, and Technical Services 32 25 Real Estate and Rental and Leasing 2008 25 23 Finance and Insurance 24 5 Information 6 29 Transportation and Warehousing 23 113 Retail Trade 101 9 Wholesale Trade 13 9 Manufacturing 12 72 Construction 66 Utilities 1 Mining, Quarrying, and Oil and Gas Extraction 2 1 1 6 Agriculture, Forestry, Fishing and Hunting 1 0 20 40 60 80 Total Number of Businesses KPEDD - 2015 Situations & Prospects page 106 100 120 Sterling Area – Zip Code 99672 Source: U.S. Census Bureau Zip Code Business Patterns, 2008 and 2012 ZIP 99672 Total Number of Businesses Total Number of Employees Annual Payroll 2008 2012 70 67 100-249 201 $8,736,000 $8,033,000 Number of Businesses by Industry - ZIP 99672 Sterling Other Services (except Public Administration) 4 6 4 Accommodation and Food Services 7 Arts, Entertainment, and Recreation 2 3 4 Health Care and Social Assistance 3 2 Educational Services 1 Admin, Support, Waste Mgt, Remediation Services 3 2 Professional, Scientific, and Technical Services 9 2012 5 2 Real Estate and Rental and Leasing 2008 3 3 Transportation and Warehousing 2 5 Retail Trade 8 Wholesale trade 2 4 4 Manufacturing 22 Construction 21 Mining, Quarrying, and Oil and Gas Extraction 1 2 Agriculture, Forestry, Fishing and Hunting 2 1 0 5 10 15 Total Number of Businesses KPEDD - 2015 Situations & Prospects page 107 20 25 Tyonek, Beluga Area – Zip Code 99682 Source: U.S. Census Bureau Zip Code Business Patterns, 2008 and 2012 ZIP 99682 Total Number of Businesses Total Number of Employees Annual Payroll 2008 2012 2 4 0-19 0-19 Withheld Withheld Number of Businesses by Industry - ZIP 99682 Tyonek, Beluga Other Services (except Public Administration) 1 Accommodation and Food Services 1 1 2012 1 Retail Trade 2008 1 1 Agriculture, Forestry, Fishing and Hunting 0 1 Total Number of Businesses KPEDD - 2015 Situations & Prospects page 108 2 14 Report Contributors and Primary Data Sources Report Contributors Alyssa Rodriegues, ADOLWD Research & Analysis Beau Burgess, business owner, Homer City Council Brendyn Shiflea, First National Bank of Alaska, KPEDD Board Bret Luick, University of Alaska Fairbanks Bruce Richards, Central Peninsula Hospital Caitlin Coreson, KPEDD Cassie Strodtman, Alaska SeaLife Center Cheryle James, Wildmans, KPEDD Board Chris Tilly, Kenai Peninsula Borough Finance Office Conor Bell, ADOLWD Research & Analysis Craig Rang, All American Oil Field Dale Bagley, Redoubt Realty, KPEDD Board Dorothy Osenga, Seward Chamber of Commerce Eric Engebretsen, Bay Weld Boats Erica Shinn, Kenai Municipal Airport Gary Greenberg, Alaska Map Company Gary Katsion, Lodge Owner Jason Feeken, KPEDD Board John Pollack, Kenai Peninsula College Johna Beech, Kenai Chamber of Commerce and Visitor Center Jorge Davila, Homer Chamber and Visitor Center Karinne Wiebold, ADOLWD Research & Analysis Katie Koester, City of Homer, KPEDD Board Katie Ring, Kenai Peninsula Borough Keith Baxter, Kenai Peninsula Tourism Marketing Council Kim Kain, AVTEC Lalanya Downs, Cruise Line Agencies of Alaska Larry Persily, Kenai Peninsula Borough Leeann Bayer, Alaska Marine Highway System, ADOT&PF Mali Abrahamson, ADOLWD Research & Analysis Mark Dixon, Soldotna City Manager Meg Mueler, USDA-NCRS Kenai Field Office Michael Haines, entrepreneur Neil Wagner, consultant, investor Pamela Russell, State DNR, Parks and Outdoor Recreation Patrick Shields, ADF&G Commercial Fisheries Renata Benett, Totem Ocean Trailer Express Rick Davis, Central Peninsula Hospital Rob Lewis, Kenai Peninsula Borough Rick Roeske, KPEDD Ron Long, City of Seward Scott Winther, Alaska Railroad Corporation Shannon Hamrick, Kenai Peninsula Tourism Management Council Stan Mishin, KPEDD Board Tanya Lautaret, Homer Electric Association Tom Anderson, Kenai Peninsula Borough Assessor KPEDD - 2015 Situations & Prospects page 109 Primary Data Sources Alaska Department of Fish and Game Alaska Commercial Salmon Harvests and Exvessel Values http://www.adfg.alaska.gov/index.cfm?adfg=CommercialByFisherySalmon.exvesselquery Alaska Sport Fishing Survey https://www.adfg.alaska.gov/sf/sportfishingsurvey/ Alaska Department of Commerce and Community Economic Development Alaska Taxable Data Base http://commerce.state.ak.us/dnn/dcra/OfficeoftheStateAssessor/AlaskaTaxableDatabase.aspx Division of Community and Regional Affairs (DCRA) Alaska Fuel Price Survey http://commerce.state.ak.us/dnn/dcra/researchanalysis/fuelpricesurvey.aspx Alaska Department of Labor and Workforce Development Population Estimates http://laborstats.alaska.gov/pop/popest.htm Population Projections http://laborstats.alaska.gov/pop/popproj.htm Quarterly Census of Employment and Wages (QCEW) http://laborstats.alaska.gov/qcew/qcew.htm Alaska Occupational Database (ODB) http://live.laborstats.alaska.gov/odb/index.cfm PFD Migration Indicator Data http://laborstats.alaska.gov/pop/migration.htm Seafood Processing Workers and Wages http://labor.alaska.gov/research/seafood/seafoodscentral.htm Construction Cost Survey http://laborstats.alaska.gov/housing/constcost.pdf Alaska Department of Revenue Tax Division, Shared Taxes and Fees Annual Report http://www.tax.alaska.gov/programs/sourcebook/index.aspx Tax Division Annual Report http://www.tax.alaska.gov/programs/sourcebook/index.aspx Permanent Fund Dividend Division Annual Reports https://pfd.alaska.gov/DivisionInfo/AnnualReports Alaska Department of Transportation and Public Facilities Average Daily Traffic Count Maps http://www.dot.state.ak.us/stwdplng/mapping/adt.shtml Alaska Marine Highway System (AMHS) Annual Reports http://www.dot.state.ak.us/amhs/reports.shtml Alaska State Library Alaska Public Library Statistics http://library.alaska.gov/dev/plstats/plstats.html Alaska Division of Elections Voter Registration Statistics http://www.elections.alaska.gov/vi_vrs-er.php Election Results http://www.elections.alaska.gov/vi_vrs-er.php Alaska Department of Education and Early Development School Enrollment Totals for All Alaska School Districts http://education.alaska.gov/stats/ Dropout Rates by District http://education.alaska.gov/stats/ State AYP District Reports http://education.alaska.gov/reportcard/ Alaska State Report Card to the Public http://education.alaska.gov/reportcardtothepublic/ Free and Reduced Lunch Eligibility Reports https://www.eed.state.ak.us/tls/cnp/NSLP.html Alaska Housing Finance Corporation Alaska Housing Assessment http://www.ahfc.us/efficiency/research-information-center/housingassessment/ Bureau of Economic Analysis Personal income, per capita income, and population (CA1-3) http://www.bea.gov/iTable/index_regional.cfm Regional economic profiles (CA 30) http://www.bea.gov/iTable/index_regional.cfm Farm income and expenses (CA45) http://www.bea.gov/iTable/index_regional.cfm KPEDD - 2015 Situations & Prospects page 110 Commercial Fisheries Entry Commission Commercial Vessel Database http://www.cfec.state.ak.us/fishery_statistics/vessels.htm Fishery Statistics – Participation and Earnings http://www.cfec.state.ak.us/fishery_statistics/earnings.htm Fishery Statistics – Permits and Permit Holders http://www.cfec.state.ak.us/fishery_statistics/permits.htm Permit Value Reports http://www.cfec.state.ak.us/mnu_Permit_Values.htm Centers for Medicare and Medicaid Services National Health Expenditure Data http://www.cms.gov/Research-Statistics-Data-and-Systems/ResearchStatistics-Data-and-Systems.html Federal Aviation Administration Airport Operations and Rankings Reports http://aspm.faa.gov/opsnet/sys/Main.asp?force=atads Foundation Center Internal Revenue Service (IRS) Form 990s http://foundationcenter.org/findfunders/990finder/ Kenai Peninsula Borough Tax Roll, Sales Tax Department Gross and Taxable Sales Reports Mill Rates http://www.borough.kenai.ak.us/assessing-dept/hot-topics/mill-rates School District Assessment Results http://www.kpbsd.k12.ak.us/departments.aspx?id=46 National Oceanic and Atmospheric Administration Individual Fishing Quota Program (IFQ) Harvest and Landing Reports http://alaskafisheries.noaa.gov/ram/ifqreports.htm Individual Fishing Quota Program (IFQ) Cost Recovery and Ex-vessel Reports http://alaskafisheries.noaa.gov/ram/ifqreports.htm Individual Fishing Quota Program (IFQ) Crewmember Statistics http://alaskafisheries.noaa.gov/ram/ifqreports.htm National Parks Service Visitor Use Statistics https://irma.nps.gov/Stats/ University of Alaska Fairbanks Alaska Food Cost Survey http://www.uaf.edu/ces/hhfd/fcs/ U.S. Census Bureau Nonemployer Statistics https://www.census.gov/econ/nonemployer/index.html 2009-2013 American Community Survey (ACS) 5-Year Estimates http://factfinder.census.gov 2011-2013 American Community Survey (ACS) 3-Year Estimates http://factfinder.census.gov Zip Code Business Patterns http://www.census.gov/econ/cbp/ United States Department of Agriculture Census of Agriculture http://www.agcensus.usda.gov United States Department of Transportation Bureau of Transportation Statistics, Air Carrier Statistics (Form 41 Traffic), T100 Domestic Market Data http://www.transtats.bts.gov/tables.asp?db_id=111&DB_Name= Back Cover: Mt. Redoubt Volcano erupting across Cook Inlet, 2009. Photo, Gary Greenberg KPEDD - 2015 Situations & Prospects page 111 2015 Kenai Peninsula Situations & Prospects
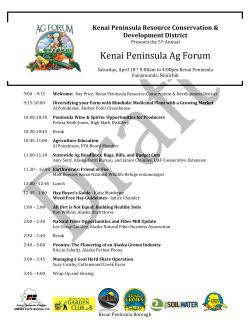


© Copyright 2026