
D - KrishiKosh
ARKIV FOR KEMJ, MINERALOGI OCH GEOLOGI.
BAND 22 A.
N:o 10.
Eldctrophoresis by the Moving Boundary Method.
A Theoretical and Experimental Stu(]y.
By
HARRY SVENSSON,
With 33 Figul'e's in the text.
Uornmnniratell Novcruucr 28th] 94G 1y THE SnmBlmG and ARNE
TlSl~LIl1H.
ContentA.
PagC"
2
Preface , . . . . . . , , . , . • . . • , . , , . , • . . . .
2
J 11 trod uetion , , . . . . . . . . . . . . . , , . • . • , . . ,
l
('hnptIT I. '1'hl' Bo1l11,zm'!I .1 nOllwlies and Other 80ll1'I'CS vt' EtT01'
4
A. JIistorit'ul • . . , , . . . , . , . , . • . •
7
B, A 'rheor,v of Eleetrophoretic Migmtion . . , ,
29
C. Othf'r ROllrl'eS of Error . , . , , . , , . . ,
33
Oha1Jtc1' []. The.A nalytical JiJ[I'ctropllm'cHz8 A1J]JUrIltu8 •
33
A, Hi~torical . . • • , , • . , . , • . . . .
34
B. Impl'overnclltR in the TisC'lills Apparatus • ,
40
C. DirE'ctions for Use of the l'resellt ApparatllR
47
(.'liaptcr r n. AldllOll of ()/;8el'llrd IOn . . • • , , • •
47
A. Historical , . . . . . • . . . . . . , . .
..
•
H. The Crosspd SliI, Mpthod, Arl allgeruents and Elementllry Theory 49
n. TllCl Light JnLpllHity . . . . . . . , . . , . . . . . . . . 58
n. Thll Thickness of the Curve Hllli the Hesolving Power 01 the
01
Method • • . , • • . . . , . , • .
74
E. t-101HCf'H ot Error • . . • . . . , . , . . . . . .
90
F. D('scription of the Optirul COllljlonents . . . . • .
102
U, 'l'he Ac1jllstment of the Optical SYRt('m . . • • • ,
] 05
H. Experimental- Octerminulfon of AppUrlttlls Constants
"~~.lfp"
rv
hJledrop7torrtical lIIrasH1'c11Ients
• -. AnomaliPB . , •
lion or Mohilities
II .A nuly~es • . ,
I' JiJZrcll'ophol·Csis.
..•..•.
100
. . . • • . . . .
and Isoelectrle PoiniR .
. .
• •
10(\
115
124
. ,.
HI
141
the Preparutlve ApparutuB
tion of tIl(' ApparatuB
150
. ,
References
, ....
;r kerni. min.ralQg~ o. (Ie
144
147
154
1
25231$
1l1li11111.II1IIII1II mn l1li1111
~
ARKIV FOR
~El\II,
TtfINERALOGI O. GEOLOO(
fln
22 A.
N:O
10.
Pl'eface.
The present work was carried out at the Institute of
Physical Chemistry at the University of Uppsala during the
period 1939-1946. It was interrupted for about two ye[l,r8 by
works on another subject. N eedle8s to say, it has also suffered
much from the war·time conditions. Great difficulties have
been encountered in supplying optical corn pOllents aIld other
instrument parts, and, during long periods, the overseas literatme did not reach Sweden.
To my teacher, Professor ARNE TISBLIUS, I wish to express
my sincere gmtitude. He introduced me into this field of
research and g'lLVe me the first scientific impulses. In the course
of illy work he has shown a never-failing and stimulating' interest in the form of many discussions and helpful criticism.
My best thanks are also due to the Chief of the Institute,
Professor TIll>: SVEDBERG, for the great privileg'e of working
at his Institute and for his splendid scientific e:x:ample. I also
wish to thank him for the kind interest he has devoted to
my work
I am very grateful to my colleagues at this und other
institutes for many interesting conversa,tions and for helpful
sug·gestions. I am also much indebted to Mr. 1. ERIKSSON for
his advice and help in C0ll11ection with apparatus constructions,
t,o Mr. E. HELLMAN and his. staff for .valuable help ill working
up the experimentul data, to Mr. L. FINN for making drawings
and photographs, to Mr. B. ALnH~vlsT for skilful technical
assistance, lLnd to other members of the technical staff of the
Institnte for facilities of all kinds.
A generollS help in supplying American literature was
given by the American Legation in Stockholm, for which
kindness I wish to express my sincere gratitude.
Dr. D. F. CHEESMAN, Stockholm, has kindly revised the
Eng'lish text of this work. The costs connected with the reo
vision were pal·tly defrayed by the British Council.
The work was made possible by gTants from the Rockefeller and the Wallenberg' Foundations.
Uppsala, November 1945.
Harry Svensson.
Illtl'o(luctiou.
For the investigation of the electrochemical properties of
proteins and other colloids, the electrokinetic methods play an
important part. Two essentially different procedures are available: electroosmosis and electrophoresis. In both methods,
HARJ~Y
SVENSSON, ELEC'l'ROI'HORESIS.
3
the relative motion between the colloid and a solution of definite pH and salt concentration is studied and measured. In
electroosmosis, the substance, which must be insoluble, is
resting' and the li!lUid moving; in electrophoresis the opposHe
conditiolls prevail, or an attempt is [Lt least made to realize them.
In electrophoresis, we have three different methods to
choose between. One can observe the movement of ~mall particles under the microscope or ultr:.Lmicroscope (tlie 1I7iel'oscopicaZ
mRthod), when the particles may consist of the suhstance to
be investigated, if this is insoluble, or they ma}' be othe)'
pllrticles cOlLtecl with :.L layer of a soluble colloid. One can
also observe the motion of lL boundar\' between a solution of
the colloid and the solvent (the 1!loviJl.;j hOllllilm'?I method). Finally, the motion of the colloid may be studied by alJalytical
means in quite the same way as HIT'l'()R~' measured tl'ansference llumbers for simple ions (the tran~ference method).
If the colloid is insoluble, the electl'oosmotic and the micToscopic methods a,re the only possible ones. Soluble substances may be investigated by all three electl'opboretical
methods, bnt not by electroosmosis. The transference method
is more tedious than the otbers, but if the substance is available only in extremely low concentrations together with much
impurities, and if it bas a characteristic l'Nwtiol1 (such [1S
toxicity 01' enzymic activity), it is the only possible procedure.
The microscopical method has the great advantage of requiring
a minimum of material and aJso of time. On the otber band,
the moving bound~ll'Y technique is the only method capable
of analyzing mixtures, which gives it n, very wide applicability.
As this work will deal only with the moving bOUlldal'Y
method, there is no reason to enter into further details of the
other methods. The reader is referred to the mOIlographs of
PItA USNI'I'Z and REI'l'S'rO'I"l'ER (1931) and AURAllISON, M.OYER,
and GORIN (1942).
The object. of this work is to make some contributions to
the theory of electrophoresis and to describe some improvements in the electrophoresis teehnique of THmJ.1us, especially
a modified optical system for observ::Ltion of the boundaries
!Lncl a refined apparatus for preparative use. The principles
of these methocls have been publishecl earlier.
4
ARliIV FOR KlnII, 1lIINERALOGI O. GIWLOGl.
BD
22 A.
N:O
10.
CHAPTER 1.
The Boundary Anomalies and Other Sources of Error.
A. Historical.
The first experiments with the moving' boundary method
were described by LODGE (1886) and were applied to ordinary
inorganic ions. WHETII.HI (1897) and MASSON (1899) introduced the method of observing> the boundary between two salts
with a common ion. If the salts, their concentrations, and
the direction of the current are properly chosen, snch It
boundary becomes stable a,nd very sharp and is thus very
suitable for mobilit.y determinations. The method has since
been extensively used and bronght to a high degTee of precision by MAcINNES and collaborators (see MAOINNES and
LONGSWORTH'S review of 1932).
For colloids, the moving boundary technique began with
t·he experiments of PIO'I'ON and LINDER (1897) and WHrl'NEY
and BLAKE (1904). These authors used only traces of electrolytes in their investigations, but since they only observed one
boundary they did not ·discover the phenomena later called
boundary anomalies.
HARDY (1005) studied both boundaries in a U-tube and
noticed that they travelled at different rates. He also found
that the difference could be diminished and made to cancel
by the addition of sufficient amounts of salts to both solutions. This very illporbant discovery was not given much
attention in the following period, and a variety of experiments
were reported where only traces of salts were present. The
necessity of having the same conductivity on both sides of
the boundary, pointed out by HARDY, was nevertheless uncler·
stood by most workers.
Duor.A.ux (1909), in a discussion on the moving bonndary
method, emphasized that this condition was not enough. If
the field strength was to be constant even when Cl11'rellt waH
passing', it was necessary that the colloid solution and the
supernatant contained the same electrolytes in the same
concentrations. This fact was also pointed out by POWIS (1916).
By a comparison with the transference method, which was
considered less objectionable, DUCLA ux came to the conclusion
that if the conductivity did llot cbange below the boundary,
the moving- boundary method would give correct results.
Even DUOLAUX'S work was neglected to a great extent,
and the boulldary anomalies continued to cause trouble. The
HARHY SVENSSON,
ELECTROPHORESIS.
6
difficulty increased as the anomalies looked more marked with
the development of special observation methods. It is therefore not surprising that the method was seriously criticized.
SVEDBEIW and ANDE~SSON (1919) pointed out that the conducti vity and the field streng-th could not be expected to keep
constant unless the two solutions were identical, in which
case there was no boundary to be observed; thus the moving'
boundary method was in itself a contradiction. The same
thought was expressed by KRUYT (H)25): in the moving boundary method, the observatiol1s were carried out exactly at the
most unfavourable point in the tube, for at the boundary,
a,nd only there, the ionic concentrations changed when current
was sent through. ENGEL and PA.ULI (19~7) and others also
criticized the method.
The question of the most suitable snpernatant was also
discussed by KRUY1' in the paper cited above. He could not
decide, however, whether it should have the same conductivity
or the same ionic concentrations as the colloid solution.
MUKHlmJEE (1923) obtained much better results if the field
strength was measured directl}' across the boundary. In 1928,
KnUYT and VAN DER WILLIGEN began to use the ultrafiltrate
as supernntallt. The difference in conductivity waS corrected
for by assuming' the rising boundary to move under the influence of a field strength cOl'l'espondillg to the conductivity
of the snpernatu,nt, the fallhlg boundary under a potential
gradient corresponding to that of the sol.
In his thesis, TISELIUS (1930) gave a thorough theoretical
and experimental treatment of the boundary ullOmalies, which
11ame was now introduced. He showed that the conditions to
be fulfilled were a constant conductivity and constant mobilities throughout the tube during' the experiment. It was true
that these requirements could never be completely realized,
but, by adding snfficient amounts of the same electrolytes to
both solutions, and by keeping the colloid concentration low,
it was possible to minimize the anomalies so much that they
became practically unimportant. This was plainly shown by
hi.s very accmate measurements on different proteins: they
were reproducible, and the same velocity was obtained in both
limbs of the U-tllbe. TrSELlus' investigation restored the
repute of the moving boundary method.
The theoretical treatment of the motion of ions under
the influence of an electric current was sta.l'ted bv K OHLRA.USCH (1897) and WEBER (1897). As these investigations
were ca1'l'ied out before colloids were subjected to electrophoresis, the results arrived at were applied only to the
WUETHAM-MAI'lflON method. The theory of such two-salt bound-
6
ARKIV FOR
KEJlII,
lIIINERALOGl O.
GEOLOGI.
BD
22 A. N:O 10.
aries has subsequently been Riven in more elementary forms
by MAcINNlcS and LONGBWOR'l'fl (19~2), by HAR'rLJcY and
Mon,LIET (1933), and by HAcrrE11 (1\135).
Althoug-h the starting' conditions in experiments with colloids are not the same as those in the WHETHAlIl-MASSON
method, it is not difficnlt to extend KOHLI~ADSOR'S theory to
colloid systems if the nnmber of ion species is liwited to three.
This was done almost simultaneously by HENRY a,nd Bm'l"l'AIN
(1933) and HACKER (1933). They showed that the advancing
colloid column acquired an adjusted composition and un adjusted conductivity and that this explained why erroneous
mobilities were obtained by using the orig'inal conductivity of
the sol. TISELIUS (1930) had a,lready pointed out that a cluLUge
in conductivity across the boundary would give rise to sh:1rpening of one boundary and blurring' of the other, and now
HENRY and BRIT1'AIN showed that such a conductivity change
would generally develolJ even if it were a bscnt initially kr
the »restorillg' effect» of MACINNES and LONOSWOR'l'H (l H32)).
HI,NHY and BRI'l'TAIN concluded that, alt.hough it was more
diffuse, the descending boundary might be expected to give
reliable results. This was verified by experiments. HAcIom
did not trust in the diffuse falling boundary and occupied
himself with the rising' boundary only. He came to the conclusion that the sol moved up unchanged only if 11 certain
electrolyte concentration, different from that in the sol, were
chosell in the supernatant.
This was the situation when THlEI.IUS (H137, b) discovel'ccl
the false resting' bonndary, since then called the
bounda,ry,
on the rising side. It was first considered to be n, real g-lobulin component (the discovery was made in an investig'ation
on serum), but soon TISELIUS and KABA'r (HI39) found that
it was a salt gradient superimposed by a protein gradient and
caused by a protein concentration too hig'h in relation to the
salt concentration. Shortly after, LONGSWOR'I'H and MAOINNEs
(19'*0) confirmed this view experimenta.lly and showed tbat
the same mobilit.y was obtained on both sides if the altered
conductivity on the rising side were used for calculating the
field strength prevailing there. Oorrections for the conductivity changes during electrophoresis have recently been applied
by LAGERCl~AN'l'Z (1944), who measured the conductivity directly in the U-tube.
LONGSWORTH and 1VIAcINNEs, in the paper cited above,
also reported the presence of a corresponding' fa.lse boundary
on the descending side; this was named by analogy the I!
boundary. It was much smaller than the d boundary owing
to the absence of a superimposed protein gradient.
a
HARRY SVENSSON, ELEC'l'gOl'HORESIS.
7
The existence of the false resting boundaries was log·ieally
evident after the works of HENRY and BRl'l'TAIN and HAOKER.
While these authors were clearly aware of them, they could
not detect them visually. .A new method of observation was
required for that discov~l'Y.
B. A
1'heor~'
of Eleetl'ophol'etic 1\ligrlltioll.
1. Notation.
b = a function defined by equation (32).
c = ionic concentrations in electrochemical equivalents per
ml., with the signs of the charges.
f= unknown functions.
i = current density in ltmp.!cm.~, positive if the current flows
in the direction of the x-axis.
i as a subscript denotes the different ion species.
_; (a subscript) = the number of the boundary in question,
counted in the direction of the x-axis, 01' the number
of the liquid layer between two boundaries. This subscript is always placed lLfter 1:.
'I1t = »molecular:> weight of an ion surroulldiIlg a boundary.
'}/, = the total number of ion species present in the tube; refractive index.
/" = the quotient between the specific charges of the leading
and a surrounding' ion, see equation (31)_
t = time.
n = ionic mobilities in cm. 2 volt- 1 sec. -l, with the signs of
the charges.
;:[! = the
coordinate of the electrophoresis tube, which is assumed to have a constant cross-sectional area.
,?
_ionic valencies, with the signs of the charges.
B (U) = a function defined by equation (24).
() = concentration of a leading ion in the unit defined above.
F = Faraday's constant = 9G 500 coul./equivalent.
I = ionic strength.
]J{ = »moleculal'» weight of a leading ion.
P = absolute errors.
Q= relative errOl·S.
T = transference numbers.
U' and U" = mobilities of a moving boundary, defined by
equation (8); mobilities of leading ions.
t} = mobility of a leading ion, defined by equation (22).
V = velocity of a boundary in cm./sec., positive if the boundary moves in the direction of the x-axis.
8
ARKIV
l;'i:\R KElIlI,
l\IINERAT~OGI
O. GIWLOOI. TID
22 A. N:O to
Z = valence of a leading ion.
z = conductivity in Ohlll~l 0111.- 1
!t = number of ion species absent on one siele of the original
boundary.
J' = number' of ion species absent on the other side of the
boundary.
A = the Dounan equilibrium constant .
.11 leadin(l iOIl is defined as an ion of the same mobility as
the moving boundary, i. e. as an ion whose mobility can
be determined ill the actual experiment.
Sometimes the increments of the variables at the boundarieR
are of interest. These are denoted by .d c, LI 'H, etc. and termed
positive if the variable increases algebraically in the direction
of the x-axis.
2. Postulates. The electrical field strength is not the only
force acting upon the iOllS in an electrophoresis tube. Moreover, we have the osmotic forces causing diffusion and a nmnbel' of forces tending to move the liquid as a whole. In so
far as the different influences are simply additive, they can
be treated separately and the effects added afterwards. This
cannot be sa.id for the diffusion, it should be t~lkell into account in a theory of electrical mig-ration. The siwuHaneoUR
consideration of diffusion and electrical mig'ration, however,
leads to very complicated equations. Efforts in this direction
have been made by PLANCK (1890), WEBER (see RmlllANN and
WEBER 1910), and, for simpler systems, by MACINNES and
LONGSWOR'rH (1932) and LONGSWORTH (1943). As the object.
of the author's treatment will be the general case of n ion
species, the only possible course is to neglect. the diffusion.
The theory to be given is valid for infinitely sharp boundaries; thus it can be expected that the results agl'f>e the
better with the experimental evidence the sharper the boundaTies are. It is well known from theoTetical and experimental investigations that. a bounda.ry with an originally contiuuous concentration distribution will, with one of the possible CUl'rent directions, grow sharper until an equilibrium
with the diffusion is attained. If the diffusion is neglected,
the theory tells that the boundary grows into a mathematical
discontinuity. With the other current direction, the boundary
is more or less blurred. Sharp boundaries are of course much
more useful for electrophoretical stUdies, and a treatment of
such boundaries alone must therefore be of value. Furthermore, as all intermediate stages between sharp and blurred
boundaries exist, results which hold exactly for mathematical
HARRY SVENSSON, ELEC'l'ROPHORESIS.
9
discontinuities will be approximately valid for Romewhat
diffuse boundaries and retain their qualitative significance for
more blurred boundaries.
In thiA connection it is interesting' to note WEBER'S finding
that the completely blurred boundary is not the only possible
solution of the purely mathematical problem aTising' with that
current direction that causes blurring. Besides, the differential
equations are satisfied by a number of discontinuous solutions.
Even if we know that these solutions have no physical siguificance, their existence shows that the assumption of nothing'
but sharp boundaries involves no mathematical contI·adiction.
3. Introduction. If diffusion and other secondary influences are neg'lected, the Illation of the ions is regulated by
KOHLRAUSCH'S differential equation:
(1)
i~r::!_=
iJ t
_ i
.!L (Ci 1I i ).
i)
x
y.
In the case of n ion species, we ha,ve n such equations. One
of them call be eliminated by the law of electroneutrality:
~Ci= 0,
(2)
and for the conductivity the expression:
(3)
%=
F·
~cini
has to be introduced. In an exact treatment, account should
also be taken of the fact that all ionic mobilities I1re functions of all ionic concentrations:
(4)
This ca,n be done only in the case of a simple electrolyte with
two ion species. The problem is then open to 11 simple mathematical treatment, and KOHLRAUSCH has shown that the property of the transport DumbeI' l' of one iOll as a function of
the electrolyte concentration:
(5)
1'+
=
1 -1'- =J(o)
is decisive for what happens when current is sent thl'ough
a tube where two different concentrations of the same electrolyte meet in a certain point or interval. If the transport
number is It constant, no ehange at all takes place, but if it
10
ARKIV
FOR
KErlII,
MINERALOGI O. GFJOLOGI. nn 22 A. N:O 10.
is a, linear function, the boundary moves with a constant
velocity. If the function is more complictLted, the boundary
will chang'e its shape also: with one current direction it is
sharpened, with the other direction it grows broader with
time. Depending' upon the character of the function (5), the
boundary will rebin its originaJ symmetrical shape, or it may
g'l'OW skew. It is apparently possible to draw very interesting
conclusions concerning' the transport numbers and the iOllic
mobilities from :1 single experiment of this Idnd, if the diffusion can also be taken into account. The first investigation
along these lines was presented by SMITH (1931). LONGSWOR'I'H
(19-103) recently succeeded in bringing this method to the same
exactitude as the two-salt boundary method. This is indeed
a very nice result, which would certainly have been impossible
to attain without the accurate and convenient opticall'egistration III ethous of to-day.
The case of three ion species is the simplest possible in an
ordinary electrophoresis experiment. It is also open to an
exact mathematical treatment, but only if the mobilities Can
be regarded as constants. A system of two partial differential
equations results which was solved by KOHLIMUSCH (1897)
and, more completely, by WEBER (1897, see also RIE}IANN
and WEBER 1910). Later, LAlJE (1915) extended the theory
to polyvalent electrolytes and to incomplete dissociatiou. He
also discussed the problem of varying mobilities. We will
subsequently return to these investigations, in connection with
the theory to be presented.
With more ion species than three, the mathematical difficulties grow enormously, and no attempt has yet been made
to solve the differential equations for such systems. From the
Blectl'ophol'etical point of view, however, it is unlleCe;';Sal'Y to
know the exact solution of the mathematical problem. The
shapes of the boundaries are only of secondary importance,
and qualitative information suffices on tbis point. The difl'usion will in any case alter the picture given by the mathematical analysis. Discontinuities in the mathematical sense
are frequently the solutions of the differential equations, and
they can of course never be realized in experiments, only
a,pproximated to.
On the other band, it is essential to know the conditions
for obtaining' correct mobilities, the conductivity cbanges
appearing during electrophoresis, the influence of different
buffer salts, and the conditions for correct quantitative anal.vses
Df electrophoretic patterns. Such questions can be answered
without tho use of higher mathematics and for an arbitrar.v
number of iOl1 specieI') if sharp boundaries are assumed. This
HA]~RY
1l
SVENS&ON, In,EC1'ROPHORESIS.
was shown by the author in an earlier
publication (19.13). The thporJ to be pre·
sented now is a continuation and 11 gene·
rnJizutioll of this work.
Dl1l'ing the preparation of this thesis,
an article b.y V. P. DOLE appeared in The
J onnULl of the American Ohemical Society
(19-1:)). This paper cleals with the same
sub.iect, und DOLle has drawll lUuch the
l'lltlllC conclm;ions as those which are to be
pl'esenteli here. Since the present inve&tigation was carried out simultaneously twd in·
depE'udelltly, however, the author has decided to publir,h it; the notation and methods
of deduction are somewhat different, as are
the viewpoints from which thp problem is
regarded and attacked.
+
------- A
c,
ut
Jet
_ _ _ 13
4. The ]~llll(lmneutal Equation for It
l\Ioviug' nOUllllnry. Following WEH1m'S deunction for three ion species, we write the
aIllonnts of an tll'bitl'llry ion that pass the
sections .A aml 0 (Fig" 1) 011 both sieleR of
a bonndm'Y B; LItey are g'iveu per unit time
and nnit cro['s section:
((1)
Fig. 1.
The diffcl'ClllCe between them is the increase of that ion pel'
Ree. and cm. 2 of the tube. Calculated from the motion of the
boundary, the Rame increase is ± (C,l - c,~) V. We thUR arrive
at the equation:
(7)
By the following equl.1tiol1s, we will define two mobilities
l.1ud [T" belong'ing to the moving boundary:
(13)
v=
I[_i = _U_"_, .
)(1
Equ!1tion (7) can then be written in the symmetrical form:
(fl)
C l('1l 1 1 '
U' )
~
C 2(U,2' --
U")
~-.
1:1
ARKIV l'OR
lCE~rI,
MINERALOGI O. GEOLOGI.
ED
22 A.
N:O
10.
Further, two unsymmetrical forms can be derived:
(10)
(11)
These equations, which are g'eneralized forms of equation (7)
in the author's previous communication (1943), must be satisfied
by every ion present on both or one side of a moving' boundary.
The brackets to the rig'ht in the equations (10) and ([1)
are independent of the ion species if all ionic mobilities are
assumed to change proportionally across the boundary, 1:. c. if
the relation:
(12)
1121
tlnt
-=-=--::::::::. ..
Un
'Il,,)
is valid. It is well known that this is not the case, but it is
a fairl.Y good approximation for small concentration challg'es
and for monovalent ions. It is necessary to make this assumption in order to carry the theory further, and it should bringus a step nearer the truth than the assumption of constant
mobilities. It should be remembered, however, that the results
that are to be deri ved are not exact and that the errors may
be appreciable for polyvalent ions. The conditions prevailing
in the electrophoresis of colloids are generally such, or can
so be chosen, as to make the errors introduced in this way
negligible. Special care must be taken in extending the assumption (12) to colloid ions but many of the equations to
be derived are valid even if (12) does not hold for such ions.
5. True Boundaries. The moving boundary method is.
generally used for the purpose of measuring ionic mobilities.
Thus, it must be claimed that U' = Un or U" = Ui2 for the
ion uncler investigation. Since the equation (9) is symmetrical,
it is sufficient to treat one of these cases, and we choose to
put U" = U 12 , givin~ the ion uuder investigation the number 1. It follows that the left·hand side in (9) must cancel
for i = 1.
a. At first we consider the solution
(13)
u' =
U ll .
With the aid of (8) and of U"
= U 12,
it is found that (1S}
HARl{Y SVENSSON,
J~LEC'l'ROPHORESIS.
13
can be written:
(14)
"!=~.
"2
'11 12
This is also evident from equation (11), since e11 is assumed
to be ~ O. With reference to (12), however, the l'ight-hand
side in (11) vanishes for all ion species. It follows that
Cil = Ci~ for all ions with mobilities different from that of the
boundary. Now (13) is assumed to hold, and hence ion No.1
lllay change its concentration at the boundary. As one ion
alone cannot have a concentration increment, it follows that
there is no boundary at all 01' that there arc two iOl1S with
the same mobility whose conceutration increments ne'ntral£.?e each
other.
The solution U' - Hil = U" - ICi2 = 0 represents a special
case of electrophoresis, treated theoretically by KOHLRA useH
for the system KOl + NH.1Cl. Experimentally, it has been
used by NrmNs'l' (1897) in his well-known demonstration experiment to show the mig'l"ation of the permanganate ion. He
used potassium nitrate as electrolyte buffer, since the mobility
of the nitrate ion nearly coincided with the ion under investigation. As has been shown here, the process is not
disturbed by the presence of more than three ions. These
ions have constant concentrations across the boundary. The
conductivity change at the boundary is only that given by
(14), and the boundary anomalies can be said to be absent.
Nevertheless, the case is of chie£y theoretical interest witbout
an.v practical consequences, owing' to the difficulty of finding
suitable buffer iOllS of the same mobility as that of tbe colloicl
under investigation.
b. The second possibility of obtaining a correct mobility
is of paramount importance and is given by the condition
(15)
If V' = Ihl is postulated instead of U" = 'lt 1:], the condition
becomE'S C12 = O. Consequently, the -lon wndcl' i1l1 1estigation tl11Ist
lie absent on one side of the bou1IIZa1'Y, a'II(Z the condnctivity to
be used jor cmnlJUtation of the mobilit;l/ is that IJ}'pva'ili'llll on the
other s£de, ,in the Zayel' contain£ng the ion £11 question. The fil'stmentioned condition can be said to have been consistently
fulfilled in all electrophoresis investigations. N or does the
second condition imply anything essentiallJ new. As recently
as in the nineteen-twenties, however, otber conductivities were
proposed for the calculation of the potential gradient under
the in:fl.uence of which the boundary moves.
14
ARIi:JV FOR REM!, MINERALOGI O. GEOLOGI. ED
22 A.
N:O
10.
Ii. }'111se EOllIl(laries. Boundaries capable of giving corred
ionic mobilities will Sll bsequently be called (t'ue boundaries. The
conditions of obtaining such boundaries have been deduced.
We shall now assume that these conditions are not fulfilled
[Lnd determine whether any moving' boundaries C[Ln exist under
such circllmstances.
Our assumptions are thus that all ion species [t.re present
on both sides of the boundrLr.Y and that (14) does not hold.
H follows that 'Hil - U' and !li~ - U" are both =? O. The
eqnations (10) and (11) can then be divided by these factors,
and the subsequent summation over all iOllS gives:
(1 I))
(17)
In consequence of the bw of electroneutrality, these sums
are = 0, and hence we have:
(18)
"'V
..w
_.!}_i_2 Ui2
ltd -
[1'
=)1,
.......
Cil lIil
11/2 -
u"
= 0
.
It is not possible to give exact solutions of these equations
for U' and U" respectively in the general case of n ion species, since the left-haml side can be written as a polynomial
of the degree of n - 1; they C:111 only be solved graphically.
It is easily realized, however, that the equations possess real
roots; it must thus be concluded tha,t, under the given conditions, »£a1se» moving boundaries may exist, giving »wrong»
mobilities.
7. 'flie Number of 'I'rue lind I~als(l BOlllHlaries. Let us
now assume that we start an experiment with a sing'le sbarp
boundary between two solutions containing tho same ion species with different, arbitrary concentrations. It is now possible to state what bappens when current is passed (if only
sharp boundaries are formed).
The number of boundaries developed by the current is
identical with the number of real roots of equation (18). If
U" is put = 0, this equation is reduced to 2) Cjj = 0, the law of
electroneutrality. Thus, U" = 0 satisfies the equation, and we
ha ve found one root by this trial. A. t U" = + 00, th e function approximates to ofrom the negative side, and at U"=-oo,
it behaves correspondingly from the positive side. In the
HARRY SVENSSON, ELECTR01'IIORESJ8.
15
points U" = Ui2, n in number, the function changes sig'n by
passing' through infinity. In all otber points, it is continuous.
It follows that all the n - 1 roots of the equation are real,
that they are situated in the intervals b8tween the ionic mobilities, one in each interval, that one root is 0, and that
there is no root above the hig'hest and none below the lowest
(greatest lleg'ative) ionic mobility.
or zfl/VEj
hr Iifl!lll/d
·r 1/11([QIl21J
dr 1/11[21]
!
Co,
Fig. 2.
The function (18) is given graphically in Fig. 2 for the
case of one anion and three cations. In 2 a, the concentrations
of the three cations are alike; in 2 band c, the concentration
of the intermediate cation is reduced to 1/~ and 1/5 of its
original value, u,llcl in 2 d that cation is absent. It is realized
that, for small concentrations of a certain ion, false mobilities
are obtained that approximate to the true mobility of that iOll.
The physicl1l significance of these considerations is that, if
l111 ions are present in both 01'iginl11 solutions, n - 1 false
boundaries are developed when the circuit is closed. One of
them remains stationarv; the others move with mobilities
situated between the true ionic mobilities.
Finally, we will consider the general case when ~~ ion species are absent on Ol1e side of the original bounc1ary, 11 species
are absent on the other side, and n - ~l - v species are pre·
sent in both solutions. From the. foregoing, we know that
Hi
ARRIV
~'OI:
KRlllI, JlUNER.!LOGI O. GEOLOGI.
BD
22 A.
N:O
10.
II It - '/' - 1 false boundaries are developed, and from p. 13
it is evident that every ion species absent in the upper solution will give rise to a true boundary mobility U", and that
all species absent in the bottom solution will give true mobilities U'. Thus, if the number of species present in both
sol utions is reduced to two, only one false boundary is to be
expected; this has the mobility 0 and is identical with the 0
or e boundary.
HACKER (i935) treated qualitatively cases of up to four ion
species. His conclusions regarding' the number of boundaries
and the mobilities which m!1y be determined from their velocities agree completely with the theory presented here. He
did not consider cases with mixed electrolytes in the buffer,
however, anel could hence show the existence of only one false
bounclal'Y, the I) boundary. Moving boundary experiments with
more than three ion species have been reported earlier (MACINN ES,
COWPERTHWAITE, and SHEDLOVBKY 1929; LONGSWORTH l!:J30).
8. True Boundaries Common to Two Ions. Under the conditions given above, It + l' true bOllndary mobilities are de·
veloped, and the same number of true ionic mobilities can be
deduced from the experiment if the corJ'esponding concluctivities ca.n be determined. This number can apparently be
greater than the number of moving boundaries. The latter is
II 2, and the sum It + l' can rise to n. In such cases, twosalt boundaries are formed, from which one ionic mobility
may be deduced by using' the conductivity above, and another
ionic mobility by using i·hat below the boundary. These mobilities are identical with U' and U". .As an example, let us
consider the simple case of KCI below NaCl. There are three
ion species; hence one resting and one moving' boundary will
be developed. Na+ ancl K+, both absent in Ol1e of the solutiolls, will move with true mobilities. Two moving boundaries
cannot be formed, however, and the ions must consequently
migrate with a common boundary.
Numerous experiments of this kind are reported in the
literature, but they have, with few exceptions, been used for
the computation of one mobility only. The reason is that one
of the solutions (the indicator solution) adjusts its composition
and develops a new conductivity when the current is started.
This conductivity must be measured during or after the experiment, which is associated with considerable technical difficulties. It would be possible, however, using the procedure
of direct conductivity measurements in the cell as described
by LAGERCRANTZ (1944). LONGSWORTH (1944) has tried another procedure. By an optical analysis of the electrophOl'esis
HARRY SVENSSON, ELECTROPHORESIS.
17
pattern hp was able to compute the transference numbers of
both the leading' and the indicator iom;.
Most experiments of this kind have also been performed
in the presence of only three iOll species, but a boundary
common to two ions can exist in more complicated systems
also. An interesting restriction is found by putting U" = 1(1:1
and U' = ~121 ill equation (9):
(HI)
c,!
_)(1
c,~
X.
11,2 ~ 'Ill:].
U,! -
/1 21
The concentration ratio canllot be neg·ative. Hence the mobility
of lLIl ion present on both sides of the boundary may not be
intermediate between the mobilities of the two ions forming
the boundary. Thus, lithium and potassinm cannoL form a
common boundary with souium on both sides.
'rhis finding makes it possible to judge the nature of the
boulluaries formed in fairly complicated sYRtems. Consider,
for instance, the system LiF + NaE' against KOt + RBI'. Six
ion species are present. Thus, four movillg boundaries are
developed, aml one resting'. All ions are absent in Ol1e of the
t1olutiolls, so they will all lllove with true mobilities. Two
moviug' boumlaries mnst therefore necessarily be COInlllOn to
two ion species; the other two are ol'uinary bouudaries. The
statiolULry stlLte developed after the formation of all boundaries is shown ill Fig'. 3. Two pictures lLre possible, dependillg'
upon the direction of the current. It is not pORsible to realize
this particular example expel'imentally. Bllll'ring' takes place
at certain boundaries, and at others unfavourable density increments cause convections.!
9. The -False Uoun<lal'i('.., ill the Literature. In the {hl'eeion s.YRtem AO often ~tnc1ierl, the existence or the resting
boun(hLl'Y has been known ('vel' since the introduction of the
method. In the electrophoresis of colloids, however, it was
first diRcovel'ed ill 1937 by TI81GLlU~.
It is interesting tllat the exi~tence of the false rf'Rting
boundary can be theoretically (leuuced ill thiR way and that
there is a close connection betweell the a boundary anu the
l'e:-;ting boundary between the original and adjusted indicator
soilltions in tho classical two-salt electrophoresis experiments.
It is still more s1l1'prising, however, that the a bOlllldal'Y appeal's as a member of a whole series of boundaries with
1 Rel'cntly
LON<1'>WOllTJI (H)4G)
kind with 6 ion Sll('cics.
lIllR
r:trried 0111
Arkiv /{ir I.·emi, mineralagi a. aea/oai. 13d 22 A. N:o 10.
(Jxprriment~
of 1,his
2
1):1
ARKIV
~'(h1
KEJ)II, MINERALom o. GlWLOGI.
22 A.
N:O
10.
-
+
U· Na'
F
Lit Nat
F
LC
Li' Na'
Kt
-
F- Br
F
Li' Na'
Kt
cC Br-
F
Li' No'
K+
el- Br
F
Net
K+
(I. -
cC
BD
Br
-
,
Kt
Kt
cC ni
C( Br-
+
b.
-
u.
Fig. 3.
» wrong» mobilities. Yet such boundlLl'ies wers already describecl in 18!)7 by KOHLRAUSCH and WEJmn. for three ions.
They found that 'It discontinuity would move with an intermediate velocity if oJI three ions were present on both sides
of the boundary. For n = 3, equ(Ltion (18) is easily solved; if
constant mobilities are assumed, us KORLRA.USOH and W IGBEl~
did, the second root is:
(20)
u" =
.
_ ~!1~~ /Ill + £2_!~1~1 +_I'Hl U I ~0..
Cll'lll + C2l 'U~
Cllllln
+
The corresponding velocity is identical with that given by
KOHLRAUSOH and WEBER.
In electrophoresis experiments with colloids, false 1iWVI:'JIf/
boundaries have never been reported and have not been believed
to exist. On the contrary, it has been a g'enemlly accepted
view that no changes oeem outside the region swept over by
the colloid boundaries. This view is correct in the case of
only two buffer ions, but otherwise not.
'].'he reasons why the false moving boundaries have never
been observed are the following. The theory has as yet only
HA.RRY SVENSSON, ELECTROPHOltESIS.
19
shown that they may exist and that they generally are developed if no special starting conditions prevail. Nothing can so
far be said about the concentration increments at these boundaries, except that they del:lend upon the ionic concentrations in
the two original solutions. Now the latter are quite special ill
the electrophoresis of colloids. The concentration increments at
the ol'ig'inal boundary, including those of the colloids, are very
small (cf the concentration unit in this theory) and are given by
the Donnau equations if dialysis has preceded the experiment.
The boundaries developed by the C11l'rent then also become
weak with respect to electrochemical concentrations. The refractive index and density increments at the colloid bounduries,
however, are appreciable, owing' to the very high equivalent
weig'hts of these ions, but this is not the case with boundaries
formed exclusively of buffer ions. The false moving' boundaries uro possibly so weak that they fall below the resolving
power of the metbol1 of observation. - Boundaries with weak
density g'l'adients are also easily destroyed by the unavoidable
heat cOllvections. Finally, it is possible that the density increments of the fa,lse boundaries arc often such that the upper
solution is heavier than the lower; the boundaries are then
destroyed by convection ill statu 'IIllscclIdi.
10. The COlllluctivity Change at a '1'rl1e l\[oving Boundary.
In the following' discussion, the conditions prevailing' in the
electrophoresis of colloids are assumed to be valid. The possibility of boundaries common to two ions is excluded, and the
two original boundaries in the two limbs of the tube will be
considered. We now llleet with the difficulty that the subI>cript ] denotes the buffer in one limb, but the sol in the
other, and /,il'e versa with the subscript 2 (equations (10) an
(11 )). In one limb, we have to use [Til with equation (11); in
the other [T' is to be applied with equation (10). These inconveniences can be overcome by introduci11g new definitions:
the subscript 1 will be used to denote the layer above and 2
the layer below a moving' boundary, in both limbs. Similarly,
(J' is computed with the aid of the conductivity above, and
(T" with thtLt below the boundary. As, however, we no longer
htwP, need for U', the bounih1TY mobility is simply called U.
The eqmLtioIls given earlier retrLin their vaJidity with these
new definitions, which is shown by the fact that (10) alld (11)
are interconvel'tible if the subscripts 1 and 2, and U' and
(J", are exchanged.
Considering now a true moving boundary, we shall call
the ion which determines its velocity the leading ion. In order
to differentiate it from the other ions, its concentration is
20
ARKlV FOR KEnn, MINERALOGI O. GEOLOGI. llD
22 A.
N:O
IO.
denoted by 0 anrl its mobilit.y by U. As long' as only one
true boundary is considered, the symbols will be used without
subscripts.
If (11) is applied to this system, the division by (lli~ - U)
call be carried out for all Ions except the leading' ion. The
summation of all concentration increments a,t the boundary
gives:
(21)
If the leading' ion satisfied equation (12), its mobility above
the boundary would be:
(22)
(J =
Utf,1.
'lt~
It is immaterial whether or not (12) holds £~r the leading ion,
since it is absent above the boundary, but U is introduced in
order to simplify the equation. This' C[111 now be written:
(23)
'I'his conductivit.y ratio is the most important manifestlLtioll
of the boundary anomalies and is therefore of cOllsiderable
interest. It is the direct eause of the differences in veloeities
between the two limbs and of the sharpening' and Llurring'
effects. Equation (23) gives this ratio as a fUllction of the
concentration U of the leading' ion, the function:
(24)
and the mobility ratio across the boundary, It is quito natura'!
that this ratio appears as a facto!', This fact will therefore
not be commented upon, but the influence of
and T1 (U)
will be discussed ill detail. 'I'his pl'ovides all answer to the
question how the boullclo,l'Y anoIDo,lies 111o,y be depressed most
effecti vel y.
a
a, The conductivity ratio depends largely upon the COllcentl'u,tion of the leading iOll, It must be recalled that 0 is
the equivalence concentmtion and has to be replaced by
Z allLI if a is given in weight units, Assuming' [L certain
weight concentration, e, g, the least concentration that can be
con velliently observed optically, the boundary anomalies i11creo,se with the specific charge F Z/JJI of the ion. This is Ol1e
HAln~Y
SVENSSON, ELECTIWPHORESIS.
21
B(O)
---------------------
u;D
I
I
--------------------rI
I
Fig. J.
(!/ the J'casOl18 wh!l colloids (I/,C thr most 8uitable 'Ion8 fa/' elcctl'op/WI'I'Si8 without prolloullced lJoltllcla/'y allomalie8. Simple inorganic
ions and even most Cl"ystH,lloid organic ions possess such hig'h
specific charg'es thnJ. the houndary n,l1omn,lies become very
prominent. This is also the case in the WHB'l'HAlI-MASSON
method, but here the word anomalies is not adequate. In this
method, they are vel'.V useful in keepiug' one boundary abnormally sharp. The high accuracy attn,ined by MAcINNJJ:s and
collaborn,tol's wonlrl not lU1ve been possible if the »anomalies»
were depressed and the ~ounclaries allowed to diffuse normally.
b. The function B (UJ will now be stuclied. Its mag'nitude
call be vn,l'ied greatly uy suitable choices of buffer salts and
their concentrations.
Its is immediately clear that the ionic concentrations should
be hig'h, a well-kn~wn fact already pointed ant by HAIWY.
The great influence of the ionic mobilities in the buffer has
not been l>ecognized hitherto.
In Fig. 4, it is possible to study the contribution to the
f~lllction B (UJ made by one pair of buffer ions. A negative
U is assu!U8d, and the contribution of the cation is given by
the curve to the right, that of the anion by that to the left
of the axis '/(il = O.
It is easily realized that the ion of the same charg'e as
tlle leading ion should preferably have a mobility '1/'11 as ne~~r
U as possible. rrhe connterion should be slow if 1_1£11 I > I'lJl,
g'iving ris~ to a large value of the fuuction B (U) with the
sign of U; in the opposite case it ought to be as fast as
possible, a larg'e value of the function of the opposite sign
resulting.
:2::!
AR1{JV FijR KENI, NINERALOCII O. GEOLOGI. ED
~~2 A. N:O 10.
In experiments with colloids, as these are in general slower
thun all Imffer ions, the cations IJecessarily ~ounteract the
aniolls, Rnd B({T) acquires the same sign as U and C. The
C01ldlldil:/t/1 is thell cOlistantly lower below the boU!ulary than
alJ(J1:e it. This is in concordance wit,b long-standing experience.
If no buffer ions slower than tbe leading' ion are lLva,ilable,
both ca.tiolls a.lld anions in the buffer ~hould be chosen with
low mobilities, but it is especially important that the ions of
the same charge as the leltding' ion shonlcl be slow. To demonstra,te this, we can consider a buffer salt with the ionic
mobilities + 1.5 [J and - 4 [J, and another with the mobilities
- 1.1i
and + 4
The first salt gives n contributi0n
= - 6.(; (:, the second only - 2.2 c to the function B (U).
,\Vith the latter salt the anomalies are three times a8 gl'e:Lt
as with the first salt in the same concentration.
The limiting' case when a buffer ion has the sallie mobili~y
as the leading ion gives an infinitely lal'g'e function B (U),
[Lnd the conductivity ratio is reduced to the mobility ratio,
which should be neal' unity under these circulllstances. This
special case has been treated earlier, p. 13. It represents a
theoretical possibility for the complete elimination of the
boundary anomalies.
The favourable influence of slowly moving buffer ions has
been discovered experimentally by LONGSWOR'l'H, SHEDLOVSKY,
and MACINNES (1939), who introduced lithium diethylbarbiturate a,ne} lithium chloride as' buffer substances in electrophoretical investigations. The need of a low conductivity and
the nice separation between the peaks in serum patterns contributed to this choice, but it was actually observed that the
anomalies were less pronounced with snch buffers.
It should be pointed out that the ions regulating the pH
nee~ not necessarily make large contributions to the function
B (U). The latter can equally well be raised to the desired
value by other ions without buffering action.
a
a.
11. TIle Sharpening and Blurrillg Effects. It has been a
frequent experience that the boundaries migrate more sharply
with one current direction than with the other . .A closer investigation shows that the blurring is less rapid than due to
diffusion alone in the former case, more rapid in the latter
(provided that a quite homogeneous substance is concerned).
It is also well known that the reason of the sharpening and
the blurring is the conductivity increment. If the latter is
positive in the direction of the movement, we get a sharp
boundary, for an ion lag'ging' behind for some l'eason comes
into a medium of low conductivity and high potential gradient
HARRY SVENSSON, ELECTROPHORESIS.
23
aud overtakes the boundary again, while an ion which has
diffused in front of the boundary is retarded by the low field
streng·th prevailing there. If the conductivity increment is
negative in the direction of the migration, the opposite phenolllenon takes place.
The difference in sharpness between the two boundaries
depends almost exclusively upon the conductivity increments
prevailing across the boundaries. In the WUETHA:r.r-JllI.A.SSON
method of electrophoresis, the effects are very pronounced.
In experiments with colloids, the difference is g·enerally smaller.
The sharpening is, of course, fa,vourable, as it increases the
accurt1cy of the readings. The blurring is correspondingly
unfavourable.
The sharp boundaries would, if no diffusion took place,
grow into mathematical discontinuities after some time; if the
experiment were started with such a cliscolltin uity, this would
persist. As the theory presented is based on the assumption
of shlLrp boundaries, it follows that the j·eslllts will hold qua'lltitat£veZy "If the conductivity illcrement given 7111 the theory is
posithe in thc direction of the migration. In the opposite case,
the eq11l1tioI1R given for ionic concentrations caI1not be expected to retain their qut1ntitative significance. Even the
number of boundaries may bf' reduced if the biuning causes
consecutive boundaries to overlap.
12. 'fhe Concentration CllIlllges at the Bounllaries. Disregarding the exceptional case of two ions with the same mobility, it has been established that every "·012 clzanges ds 1:011centratioll at every bOlll/dary. Since n - 1 boundaries are formed, there are n different liqllid layers an d n 2 different ionic
concentrations. The two end phases are identical with t.he
original solutions which will he assumed to have known compositions. If the experiment is started with two boundaries,
the above numbers ha\Te to be doubled.
A new subscript .i will now be introduced to denote the
number of the liquid layer (j running from 1 to 11) and the
number of the boundary (,j running from 1 to n - I). Equation (9) may now be written in the form:
(25)
Ci,j'Xj-H (1I1j -
[7;) =
{;i,Hl"X.j (lI(,j+l -
U.i').
By letting i run from 1 to n and multiplying all equatio11i'\
by each other, we have:
6-1
(26)
Cil")(/I
II (ttlj 1
6-1
Uj) =
Cl n "X. 1
II (Ut,,1+1 -
Uj').
:!-l
ARKIY FOR ImllU, lIIINBRALO(ll O. G1WI,OGI. ED
DOL]O~
22 A.
N:O
10.
was a.ble to show (H)-l5) th~Lt these elluatiolls are sa.tisfieu.
by the roots of the equations (18) with the subscl'ipb, 1 anel
}I instead of 1 and 2.
'This facilitates the calclllatioll gTeatly,
since (18) is solvable graphically.
It should be noted that ouly false boundary mobilities {j'
and U" appeal' as roots of the equations (18). '1'he true mobilities, however, are known from the stn,rtiug conditions: ions
absent in the supernatant give rise to true mobilities U", and
ions absent in the bottom solution to true mobilities U'.
Oonsequently, all boundary mobilities may be calculated I1Umerically from the known com positions of bottom solution
a,nd supernatant. The problem of calcuhLting- all concentrations anywhere in the tube is now solveu. We have only to
ca.lculate the conductivities with the aiel of the eql1atiom; (8),
anel, finally, the concentrations from boundal'y to bOUlllhry
by using equation (25).
1:1. 'rhe Refl'actiyc lu!lex IIl(,l'emellts at the UUIIIl!luI'ies.
These increments are of special importance since the metbod
of observation is nowad~t.Ys basrd 011 refractive indiees (see
OhlLpter III). After the introduction of self-reg'isterillg' optical
systems for recording' electrophOl'f~Ris prd·,tel'ufJ, the qnantitativ("
anal.vsis of colloidal mixtures hn,R become n. part.icldal'Jy iIIJportant function of the movillg' houndary methud. TIl(' pl'illciple of such analyses is to measure the refmctive index illcrement at every boundary and to regard these increments a,s
representative of the leading iOIlS of the respective hOlllldal'ieR.
The errors arising' from the incorrectness of this assumptioll
will now be considereel.
The elimination of the conductivit.v ratio betwecn the
equations (11) anel (~3) g'ives the concentration increment of
an a.rbitrary lOll at an arbitrary true moving boullela.ry:
(27)
.J L'i i = -_
,
?j ±l~ . __0L!{,.i.j~_U· .
B.1· (U,·)
•
'It I..
J -
.I
The contribution of this ion to the refractive index increment is:
(28)
intl'oducil1g a quantity, the specific refractive index inerement
of a sing'Ie ion, that cannot be detel'~:nined experimentally.
The contribution of the leading' ion to the refracti re index
change is, llsing the same notation:
HARRY SVENSSON, ELEC'l'ROPHORERIS.
iJn
(29)
0'+1-'
.1
dO
The relative error in putting' the latter expression equal to
the total refractive index change is therefore, for one ion:
(30)
f)
1
_
It' -
-
(0, 0)
Cij 'UiJ
-
U; () Ci
nj( U,i) . UiJ
,;
L'OIlRt.
The last factor in this equation is determinable experimentally.
'1'he total relative errol', if it i~ small, is obtained by summation over i.
When only semi-quantitative information of the errors in
cIuestion is requil'eJ, the same weight concentrations of different ions can be assumed to give rise to the same refractive
index increment, In sllch a case, the last factor ill (30) can
be written as the ratio of the specific charges of the leac1illg'
and Slll'l'OUll<lil1g' ions:
(31 )
(0D (~~C)
Z
Il eOIlHt.
Zi
= JJj : 1111
= J',.
The_second fa.ct.or in (30) is one of the mom.bers forming'
After introducing tlw contribution made by one ion
into this fUllction:
.u (U).
eCllmtion (30) can be written in the simple form:
(33)
Qi =
-
7)·
'j"
,:
7,1,
......,
}f
and the totuJ rcltttive error becomes:
(3J)
'1'le sUlllmation has to be extended to all surrounding ions.
In experiments with colloids, only the fastest or slowest
boundary is migrating in a medium consisting exclusively of
buffer ions. The other boundal'ies are sU1'l'ounded by colloid
as well as by ordinary iOllS, and both kinds contribnte to give
a l'efractivp. index increment different from that desired, the
increment due to the leading' ion alone.
26
ARKIV Fcil{ KEllIl,
lInNEI~ALOGI
o. GTIlOLOGI.
1JD
22 A.
N:O
10.
As regards the buffer ions, Ii,: is appreciable, but the fact
that I"j is small maIms the errors due to these ions of minor
importance. EoI' colloid ions, on the other hand, 'l"i is large,
and even bi may be fairly g-r8fLt if the mobilities of the leading and the surroundillg' colloius are nearly ec[ual. A surrounding' colloid can thus g'ive rise to an apprecilLble errol' in
the refractive index increment at a moving' boundary. The
only way to eliminlLte these errors is to choose a Lig'h value
for the fUllction B (0), i. e. to depress the boundary allOIll<Llies
as dispussed earlim', but it is now evident that the method
of enlarging- B
is not arbitrary. SloVl' ions with hig'h
specific charges are most suitable.
If the leading ions are ordinary ions with high speci tic
charges, theT6 1S no possibility of making the refractive index
increments representative of one ion alone. HT e thus fJ1l(:OU'lIiel'
a further r(J{lSou tl'll!1 colloids orc especiall!J 'll'cll adaptcd to
electrophoresis iUFcsi£gatioJl8.
A consideration of the signt; in equation (27) g'ives information of the sense in which a given surrounding' iou
changes the refractive index increment of the leading' ion.
The following' l'ule can be formulated: the 1Y'}1'actit'(J im/e:r: ·illcrement given by the Zeadill{! 1:01/ is en/w'gcd b;11 slower sm')'ulmdillg 1:OJU; of the same charge; it is d£nl1:nisiLe(1 by faster
iOlls
the same cha1'gc and by lOllS of the opposite char(!e.
Consider, for instance, a mixture of two colloids. On the
rising side, the slower component mig-rates with the faster
one as a surrounding ion, It thus appears too small, by virtue of the above rule. On the falling side, the faster component moves in a medium containing the slower oue. It follows
from the same rule that the l'apid component appears too
large. Thus, the more rapid cOlllponent appears too large in
both limbs in the U-tube. This circumstance mal{es the errors
III the analyses very treacherous and difficult to reveal.
em
qr
14. The Density Increments at tlle Eoundaries. The density
increments are of importance, since a boundary is not stable
in a vertical elect.rophoresis tube unless the increment is positive when reckoned from above. If it is negative, convections follow which destroy the boundary and give rise to quite
uncontrollable conditions. The heavier liquid which is developed
above the lighter falls in the tube until it arrives at a bou11(lary through which it cannot break. Thus, several boundaries
may be destroyed by one negative densit}, increment. Furthermore, the layer in which the convections take "place acquires a composition different from that characteristic of the
steady state which the current tends to develop. This pre-
HARRY SVENSSON, ELEC'I'ROPHORESIS.
27
sumably influences the velocities of neighbouring boundaTies.
On the whole, it can be stated that experiments where con~
vections fi,re observed are of doubtful value even for boundaries not directly concerned in the convections.
It is not difficult to formulate the condition for a positive
density increment, but the expression is not very illuminating,
and no simple rule can be deduced from it. Ions that nnite
heaviness and rapidity must be placed below slow and hg-ht
10ns. Colloids are extremely heavy, but slow; we know by
experience that they must also be placed at. the bottom. When
ions of medium rapidity and medium weight. are to be investigated, the conditions must be chosen with great care in
onler to avoicl convections.
Difficulties in the experimental verification of KOHLRA US en's
theory have been shown to be due to convections orig'inati ng'
in g'r[Lvitationally unstable boundaries (MACINNES and LONGSWOWl'H 1932; HAR'l'LEY and MOILLIET 1933).
15. The d' Gradient. On the assumption that a colloid ion
can be treated as an ordinary iOll, and that the ionic mobili·
ties can be regarded as constauts, it is possible to derive a
general expression for the conductivity chauge at the a
boundar,)'. The calculation will be carried out for the case
where the bottom solution and the supel'natl'Lnt are in COlliplete Donnan equilibrium with each other.
BOLAM (1932) has given the equations of the Donnan
equilibrium, but a general expression valid fOT a,rbitrary valencies and for cations as well as for anions is lacking. Such
an equation can be formulated if the notation on p. 7 is
used. The equation is:
(35)
C'2)_!
.d Cil)_l_
~,~ Zi = ( 1 + - "i =
( Cil
Ci 1
A,
where the subscripts 1 and 2 refer to the outer and inner
liquids respectively, and A is ~L cOllstallt that remlLil1s to be
determined. If the colloid concentration is small in compm·j son
to the salt concentration, the ratio LI eillen wHl be small too,
and we can write:
(36)
The condition of electroneutrality inside the bag g'ives:
'(37)
c + ~ Ci2 =
O.
~8
Al~liIV Fi:iR KEnII, MINERALOGI O. GEOLOGI. BD 22 A. N:O 10.
Hence we obtain the value of A:
(38)
C
/1=1--,
2I
.h
where I is the ionic strength of the dialysate. The g'enerul
equation of the Donnan equilibrium thus becomes:
(39)
Ci2 =
ril (
Zi
~
1-
0) .
I
Owing' to the Donnan effect, there appears a difference
m cOllcluctivity on both sides of the membrane. This difference
is derived by· multiplying' (39) by Ili, snmming' over all ions,
and addillg' the contribution of the colloid ion; we have:
(JO)
The chfLrge of the colloid may evidently be calculated from
this equation if the two conductivities and the mobilities arc
knowIl. In order to attain reasonable a.ccul'acy, however, it if!
necessary that the cOl1l1uctivities al'f~ not too g'l'eat [Lncl that
the two terms in the bracket have the Sfl,me Sig'H. This will
be the case if the buffer iOlls tend to mise the conductivity
inside the membrane, as does the colloid itself. Consequently,
the difference in conductivity is great if the buffer iOlls of
the SfLme sign as the colloid move more slowly than the
coulltcrions. It increases still more if the latter have a hig-her
valence than the former.
As KOHLRAUSC:H stated, his bchol'rliche Funldian (regulating'
function):
(41)
" c,:
B=.:::..J-~'
Hi
is independent of time ~Lllcl changes oIlly with the position ill
the electrophoresis tube. Owing to the DOllnan efluilibl'iull1,
we have from the beginning of the experiment two solutions
with somewhat different fUllctions B. This difference rellluiI1S.
aftel' the current is started and is tho direct cause or tho
appearance of the a boundary.
The function B of the bottom solution is easily deriveu
by dividing equation (39) by tli and s.ummation over all ions,.
llOt forgetting the contribution given by the colloid. We have~
HA[tl~Y
(42)
B
=
2
SVENSSON,
+c
B
l
ELECTIWPHOl~ESIS.
29
[I __!_ ~ Zi Cil].
U
~
I
71i
At the cl' boundary, all ions change their conceutrations proportionally, and the factor is given hy the conductivity ratio
'X'/x 2 ('X' = the conductivity of the adjusted solution above the
o bonndn,ry). Thus, if we multiply B2 by the ratio X'/X 21 we
find the reg'ulatillg function of the supern[Ltant:
(43)
1))1 (X 2 -
X
')
=
X
'
C [__1_
- _!_
~ ~~]
.
[J
')
I 4...J
.
..,
H,
Finally, if U is eliminated from equation (40), we obtain the
relation:
2 I - U ~ '<~i Ci
'lli
(44)
This eqUlLtion contains three cOlllluctivities which can all
be me:tsnrec1, the concentrations and the mobilities of the
buffer ions and the mobility of the colloid. It should thus
be possible to test the validity of the assumptions and the
tht~ory outlined earlier. Experiments to this end will be described in Ohapter IV,
'fhe (J boum1u,ry disappears if the regulating' functions of
the two solutions are [Llike, £. c. if the mobility of the colloid
satisfies the equ[Ltion:
(45)
This value is [1, kind of harmonic mean of all ionic mobilities.
Siuce the latter have to be taken with Sig'llB, the ha1'1110nic
lllean represents a ver,Y hig'u mobility, Under ordinary condi·
tions, the conductivity, and hence the density, is alwlLYs greater
helow the (\' b01111cbry tha.ll lLbove it; thus the cl' boundary is
al ways gravitationaJly stable if dia,lysis has lH'eceded the experiment.
C. OtlJer Sources of Error .
. The bonndlLl'Y anomalies lLl'e no doubt the most serious
source of error in the moving boundary method, but there are
30
ARKIV FOR REMI, MINERAI,OQr O. QEOLOGI. IlD
22 A.
N:O
10.
also others. These will only be mentioned very briefly, however, since they have been carefully considered by earlier investig·ators. The present author has no contributions to make
III this connection.
1. The !niluellee of the Eleetl'ollc Reactions. This influence
is twofold. Firstly, if the electrodes are not reversible, acid
and alkali are f~rmecl around them, and the hydrogen and
hydroxyl ions thus formed will migrate into the U-tube and
alter the conditions prevailing at the boundaries. The same
will be the case if reversible electrodes are used surrounded
by a salt solution different from the buffer. HARDY (1905)
and BUR-l'ON (1906) avoided the immediate contact between
the platinum electrodes and the colloid solutions by introducing'
a, 1~1yer of supernatant liquid. Later, the electrodes were removed still further from the boundaries and placed in special
electrode vessels (MICHAELIR 1909, SVEDBERG and J RTTE ] 923).
TISELIIlS (1937, a) pointed out that the necessary volume of
buffer between electrodes and U-tube was related to the quantity of electricity to be sent throug·h. The time dnrillg which
an experiment could proceed without distlll'bances from the
electrodes was thus restricted by the dimensions of the ap]JfLratus.
As n, peculiarity without great practical significance, it may
be mentioned that there is one possibility for the c01llplete
elimination of this type of disturbance. If we use reversible
silver - silver chloride electrodes surrounded by a concentrated
solution of sodium chloride, amI if the buffer is made up of
the same salt, allY disturbances from the si11t a1'01.111d the
electrodes can never reach the U-tube. We have in the
electrode tubes a boundary between two concentrations of the
same saH, anc1 such a boundary moves very slowly under the
i1lfluence of a direct current.
The second source of 81'1'01' localized to the electrodes is
the volume change that accompunies the electrode reaetiolls.
LIn-VIS (1910) was the first to draw attelltion to this change
amI also m<l,de corrections for it. The matter hn.s subsequently
been discussed by severn.l authors. The g'l'eatest difficulty ill
applying' correctiolls for this errol' lies in the relatively great
ullcertainty of the available density data. The corrections are
so small that they reqnire consideration 0l11y in very accurate
determinations of small velocities. LONGSWOR'l'H (Hl42) states
that the correction amounts to about 1 % for high mobilities
under ordinary conditions, and that it shifts the, isoelectric
point by some hundredths of a pH unit. It should be observed, however, that it rises with the current and that the
HARRY SVENSSON, ELECTROPHORESIS.
31
shift in isoelectric 'point is g-reater if the slope of the mobility
curve is small.
2. The Influence of the Free Hquid Sllrface. When a
protein column is moving upwards in one limb and downwards in the other, the rising column exerts a hydrostatic
pressure which tends to drive the column back again. If there
are free lilluid surfaces in bot.h electrode vessels, this effect
g-ives rise to an excessively low velocity. The necessity of
having 1t small free liquicl sm'face was pointed out by TUlRLIUS
(19i30). The error is completely eliminated if one electrode
vessel is closed (LONGSWOR'l'H and MAChNES 1939).
3. 'rhe EICl'tl'oosmosis. Not only the colloid under investigation, but also the glass walls become charged by the
contu,ct with the solvent, As a result of this, the solvent will
tend to move as a whole in an electric field. This phenomenon
is of the greatest importance in the Illicroscopical method of
electrophoresis (see ABltA.llISON 1934:), where the observed
velocity varies greatly from the glass wall to the centre of
the tube. In the moving' boundary technique, it is of minor
importance (TUlELIUS 1930; ABKAllfsoN, MOYER, and GomN
1\)42). 'fhere are sOllJe recent observations, however, showing
t.hat electroosmosis may l)lay a role in special cases. Electroosmotic Htreumillgfl tot !L moving' boundary were first observed by
MCWAIU.ANE (19-10) and, shortly after, by SHTmLOVSKY and
SlI[ADEI, (19-l-()). Both observ::Ltions were made in studies of
v:1ccinia virus. SHlGDLOVSKY alld SnUDlcL showed tha,t the
reason was' too low to density gradient at this particular
boundlLry. If the concentration of the virus wus augmented,
or if a soluble protein of l.bout the sume mobility was added,
the electrooslllotic stl'efLming's c1isappeared,
N Ol~'l'llR01) (H142) and RO'I'HEN (H)42) sbte that the electToosmosis lllig'Lt cause boundary spreading even if no streamings
were visiiJle. They investig'ated purified diphtheria antitoxin
in phoslliutte amI diethylbarbiturate buffers and found a considerable spreading. SjJccial measmements of the electroosmosis
in snch buffers revea1eu t.hat it too was larg'e. By uc1c1ition of
M/20 cfdcium chloride, the electroosmosis could be completely
suppressed, as could the bounuary spreading'. This Dneling' is
very pU~7.ling', sillce the question arises whether boundary'
spreading is always clue to electroosmosis.
4. lIeat Convection. Too high a power in the ltpparatus
gives rise to deformation of the boundaries and even to new
boundaries. The influence of uifferent factors ou the highest
;;2
AlmlV
Fi:il~ KElIIl, lIUNlCRALOGI O. GEOLOGI. En
22 A.
N:O
10.
permissible potentiltl gradient was studied b.-V TISELIll S (] 930,
1937, a). His experiments 011 this subject led to two important
improvements: the use of Jiattcned U-tube8 and the method
of working' at the temperature of maximum density of wa,ter.
A rectallg'ular tube makes possible a better heat exchange
between the solution and the water bath, and at the temperatl1l'e of maximum density the risks of convection are n,t a
minimum because the derivative d(.l/d t (t = temperature) = 0.
TISELIllS found that potential gradients 10 times higher than
before could be used after applying these improvements.
Boundaries caused by cOllvection are generally easily
distinguishable from real boundaries. Thus, they change shnpe
from time to time, disappear and reappear, and the electrophoretic patterlls in the two limbs are no longer mirror images.
Nevertheless, experiments have been reported, even quite
recently, where heat convections hl1ve undoubtedly caused
disturbances.
TIfmr.rus reported that a power of 0.1i-1.0 w. cm.-:I could
be used in the llew apparatus. With the refined opticalmethods used nowadays, however, by which convections may be
discovered at an earlier stag'e, this figure has proven to be
somewhat too high; if a weak g'Tadient is to be observed for
several hours, it is not advisable to apply a total power in the
apparatus higher than G-8 w. (ef ALVAREZ-ToSTADO 1940).
At room temperature, 01' in the presence of much salts or
other substances capable 01 shifting the tempemture 01 maximum density, it may be necessary to reduce this power
considerably (MOORE 1941).
5. Other Convections. It was mentioned on "p. 26 that
the current sometimes tends to develop moving' boundaries
which are unstable gravitationally. This is always to be fea,red
in expel'iments with S:1ltS. The starting conditions in such
experiments must be chosen with the utmost care. 'Where
colloids are concerned, the risk is much less, and con vectiol1S
in such experiments can almost invariably be attributed to
incomplete dialysis. It lIlay be recommended as a precautionary mea.sure, especially if the colloid concentration is low,
always to dialyze from a higher salt concentration to a lower.
Incomplete dialysis in the opposite direction gives often rise
to convections at the slowest boundary.
A boundary that is allowed to move down, by electrical
migration or by» compensation» (p. 36) into the bottom cell
becomes gravitationally unstable on passing' the bottom. Hence
the very important rule: a lJolwclary must neuer lie rdlowed to
enter the bottom cell.
Needless to say, convections may also arise from leakage.
HaRRY
SVENSSON,
El,ECTROPHOl~ESIS.
83
OH.A.PTER II.
The Analytical Electrophoresis Apparatus.
A. Historical.
The first electrophoresis apparatus consisted simply of a
vertica,l tube of g'lass with l)latinum electrodes in the upper
and lower ends (PIOTON ::md LINDER 18~J7). WHITNEY and
BLA KE (19D4) modified it by placing' semipermeable membranes
between the sol and the electrodes. NERNS'l' (1897) used
a U-tube for the demonstration and rOllg'h measurement of
the movement of the pel'ma,nganate ion, but this device was
not used for studying colloids before 1 ~J05 and 1906 by HARDY
and BUR.'l'ON respectively. In the bottom of the tube there
wa,~ !L ca,pillary tube in connection with a. funnel for forcing
in the colloid solution. 'fhe electrodes, still platinum, were
placed in the upper open ends of the limbs. '1'bese were
graduated to silllplify the readings.
Reversible electrodes werE' introduced by MICHaELIS (1909).
He also used two stop-cocks, one in each limb, in order to
provide sharper bounda,ries anel to make the apparatus lLpplica,ble [LIRO to the transference method. SVJ1:DBERG (LIld J E'l''l'E
(H)~3) and SCOTT and SVEDBERG (1924) effectively increased
the distance between electrodes and boundaries. They used
special electrode vessels with reversible electrodes and furtherIllore introduced two safety tubes betweell them and the
U-tube. Among the expel'iruelltal arrangements used later, the
apparatus of KRlTY'l' and VaN DER WILLIG EN (1928) and that
of TISELIUS (1930) are especially noteworthy. THEoRELL (1934)
made a, U-tube consisting of several compartments which made
possible the removal and analysis of fractions after the
electrophoresis.
The next step in this evolution was taken by TISEI,IU8
(H)37, a). This apparatus is too well Imowll to require a deta,ilec1 description, but as it provides the basis of large paTts
of this work, its merits will be briefly summlLrized:
1. The apparatus works at the density maximum of water,
which makes it possible to use much higher potential
gradients than before.
2. '1'he introduction of a sensitive optical method, that of
Toeplel', implies a greater resolving 'Power and increased
convenience of working'.
Arldv Jor I,'emi. mincmlofli o. geoloiJi. Bd 22 A. N:o 10.
3
3-1
ARKIV FOI~
KEl\U,
lIIINERALOOI O. GEOLOGI.
ED
22 A. N:O 10.
3. l'he flat rectangular cells contribute to increasing the resolving power and permit comparatively small volumes to
be uRed.
-1. The division of the U-tube into foul' compartments make
possible the use of the apparatus for preparative purposes
and its application to the transference method in cases
where the substance under investigation caullot be observed.
D. The method of » com pensatiolP, an artificial movement of
the liquid as a whole through the U-tube, significantly
illcrea,ses the possibilities and the convenience of electrophoretical separations.
For details, the reader is referred to TISELIUS' orig'inal paper
and to reviews publishe(l later (TISELIUS 193t1, a, b, 1939,
1939/-10, 1940; LONGSWORTH and MAoINN}!;S 1939; STERN 1939;
LONGSWOR~'H 19-12).
In spite of the advantages of TISELIUS' instrument. it soon
became evident that it was possible to apply further improvements. The most significant of these was a modified optical
arrangement, which will be clealt with in a special chapter.
Some other details will be reported here.
R. Improvements in the 'l'iselius Allilaratus.
1. Cells and Electrode Tubes. The rectangular form of
the U-tube, snch as constructed by TISELIUS, has so lllany
advantages that there has been no reason to change the sbape
and dimensions. In collaboration with Professor TISELIUS, the
author has undertaken some other modifications in the cells
and electrode tubes. _After the development of the different
methods for [Lutomatic recording of electrophoresis patterns,
the quantitative electrophol'etical analysis became increasingly
important. This necessitated the introduction of a cell of the
double height in order to eliminate the central g'lass plates,
which in the original construction separated the two snudl
cells from each other and, when patternA were taken, masked
considerable portions thereof. With a long cell, there are
86 mm. of free length for the pattern, which is sufficient for
most purposes. One limb of the long cell and the bottom cell
are filled with the colloid, the rest of the apparatus with
buffer. _At the start, the poles are placed so as to cause the
colloids to lllove up in the other limb of the oell. If there
1 The appamtus, with remlllt modifications to be descrilletl here, iR now
being manufactured by LKB·Produkter Fabriks AB, Box 782, Stockholm.
HARRY SVENSSON,
F'ig.
ELECTROPHORESIS.
35
o.
are components of opposite charges, compensation must precede the current. Owing' to the greater hydrostatic pressure
of the limb with colloid, it is not possible to level the appaTatus before malring the boundaries when a long cell is used.
This difficulty has been overcome by the simultaneous introduction of closed electrode vessels .
.As an alternative to the Ol'ig'inal Bat-bottomed cell, a Vshaped cell has been introduced. Its employment increases
the safety Q,gainst con vectiolls due to the accidental passage
of a density gradient through the bottom of the U·tube.
The top cell and the electrode tubes have undergone more
important modifications. The original construction had the
disad vantage of insufficient insulation at the connections
between the top cell and the electrode tubes. .At these l)oints,
pa.rt of the current leaked out to the thermostat. This made
the measurement of the current through the U-tube difficult
and also implied a permanent risk of g'etting erroneous mobilities due to a slow passage of buffer through the leakage.
In order to eliminate these difficulties, a Dew top cell with
fom standard ground :i oiuts was constructed. '1'he two larger
ones fit into the cOl'l'esponding joints of the electrode tubes,
the two smaller make possible the penetration of the U-tube
with a syringe without removal of the top cell. The whole
set of cells now in use is shown in Fig, 5.
In this connection, new electrode tubes also had to be
made. They are shown in Fig. 6. They are both closed with
36
AHIOV FOR
KEllII, JIlINERALOGI O. GBOLOGI.
TID
22 A. N:O 10.
large standard joints. The silver electrode is fitted to a glass tube throug'h
the COllO of the g'l'ound j oint. It is
seen that the connection tubes are
narrOwer than in TISFlLIUS' original
construction. This was necessary in
order to keep the dimensions of the
complete apparatus unchallged.
The only rubber tubes in the modified apparatus are situated at the
electrode tubes and are never removed.
When they have recently been put
tog-ether, there may possibly be a small
leakage through these connections, but
in a short time the rubber adheres
very firmly to the glass tubes u,lld
gives a pet'fect insulation. The same
is thc ca,se with the standard ground
joints, if carefully gTeased. In fact,
with a voltage of 600 volts between
the electrodes, it was impossible to
detect any leakag'e whatsoever with an
ordinary milliammeter.
The electrodes have also been reconstructed according to LONGSWOR'l'n
and MAcINNES (1930) in order to inFig. u.
crea,se the effective silver surfa,ce. These
have also described the use of a closed electrode vessel.
2. The Compensation Device. 'fhe object of this is to move
the liquid as a whole at a constant, very low rate in order
to assign to any boumh,ry any desired apparent velocity.
TISELIUS' original construction (19137, a) was a clockwork motor
ill connection with an ebonite plunger in one of the electrode
vessels. The direction of the movement could be chosen by
the appropriate winding of the suspension thl'eau around the
rotating' axis, the velocity by choosing a plunger with the
propel' diameter. It was not possible, however, to change the
compensation rate or direction during an experiment without
closing the apparatus and reopening after levelling'.
After the introduction of one closed electrode tube, thif!
arrangement was no longer practicable. LONGSWORTH and
MAOINNES (1939) introduced a s.vringe in connection with the
closed tube, the piston being (!riven by a synchronous motor.
In this laboratory I another and simpler method was tried.
The closed electrode tube was connected with a funllel by a
HARRY SVENSSON, ELECTROPHORESIS.
l~ig.
37
7.
long' capillary tube with a very high streaming- resistance. By
phcillg the funnel fLt different levels, any desirecl com peusation velocity in the desired direction could be obtained. The
open electrode tube communicated with a tube outside the
thOl'lllOStrLt in order to facilitate a direct comparison of the
levels of the fLpplLratus and the compensator and the measurement of the liquid pressure. The pressure was lcept consta.nt
by applying Mal'iotte's principle.
This fLrrang'ement was abandonel1 after some time, chiefly
since the compensation rate depended npOl1 the viscosity and
Jensity of the buffer. '1'he new type used for the present
implies [1 returll to TrsELlus' constructioll, yet with some
modifications. It is shown in Fig'. 7. To the hour axis of all
electrical synchronons clock, a pulley A with a series of different diameters is attached. A thread connecting the two ebonite
plungers D and E passes the wheels B and a and goes once
round one of the cylindrical surfaces of A. The tubes F and
0, slightly larger than the plungers, are connected to the
38 AI~KIV ~'OR
KE]\[l, nIINERALOGI O. GEOLOGl.
BD
22 A.
N:O
10.
two electrode tubes by way of the stopcocks H and I. If the
compensator mllst coutinue after the capacity of the plungers
is exilauflted, the stopcocks H and I are closed and K opened,
and the plungers are returned to their original position. After
levelling, the stopcocks H and I are opened again and K
closed. An eventuul overflow of buffer when the compensator
is being' fillec1 is received in a beaker L by way of the outlet
tube M. This a,rrangement has the following' aclv!lntag'e:-;:
1) It g'ives a velocity that can be easily calculn,teu from the
dimensions of ths plungers, the pulley, and the cross-sectional
area of the U-tube.
2) The diameters of A form a geometrical series with the
quotient 1.:35, and any desired velocity is attainable to within
12.5 %. The fine adjustment is made by chang·jug' the voltage
over the apparatus.
3) The direction of the movement can be changed without
rewinding the thread, simply by stopping the clock and starting
it backwards.
4) The liquid level in the apparatus is unchange<1.
5) The arrangement necessitates only a small free liquid
surface (about 0.5 cm. 2 ).
G) The volume of the plungers, 35 cm. 8 , is large enough
for maintaining a compensation velocity of SO· 10- 0 cm.!sec.
(cross-sectional a,rea of the U-tube = 0.70 cm.~) for III hours.
7) The arrang'ement makes possible the use of a completely
symilletrica,l electrophoresis apparatus with two closed electrode tubes.
The new compensator has been used only for a short time,
but the experiences gained with it have been only fn,vourable.
3. Electrical Installation. To 0 btaiu (lirect current of any
desired voltage, TISELHTS used an electron tube amplifier fed
with alternating current from a potentiometer 01' variable
transformer. This system is still in use. The coupling device
is shown in Fig. 8. The transformer Trl provides the filament
current, Tr2 the variable anode voltage. RT] and RT2 are two
rectifying tubes. The resulting direct current is tn.ken from
the poles of the condenser C, while the superimposed alternating voltage remains over the choke Ch. The negative pole of
the condenser is connected to earth.
In the figure, two ammeters A are drawn, but ill reality
only one instrument is used, in com billatioll with a special
commutator. This is able to move the instrument from one
position to the other, simultaneously short-circuiting' the first
position, all in one manoeuvre. Routine measurements of the
HA TIRY SVENSSON, ]:LECTROPHORESIS.
3!)
v
'.-'
/),///,-
EUI·th
Fig. 8.
current are made on both sides of the apparatus in order to
provide constant checks on the current leakage from apparatus
to thermostat, which is u,lso earthed. The difference between
the two currents is identical with this leakage, aud it should
not be allowed to rise above 0.1 rnA at 200-300 V over the
apparatus. It is very difficult to avoid lealmge completely,
even after the introduction of the new top cell, which is
absolutely tight. Insufficient Cl1l'e in greasing the cells and
mounting the U-tube, as well as cracks in the cells, are immediately discovered by this leakage iudicato1'.
After the leakag'e has been checked, the earth connection
of the amplifier should preferably be removed. The amplifier
is then connected to earth only by way of the thermostat
(through the leakage or leakages), and hence it automatically
acquires an absolute potential which g'ives a minimum of
leakage. Thus, the earthing of the amplifier is neccRsary in
order to check and measure the leakage, but, if a leakage is
present, the eltl'th connection should be broken.
In the spring of 1944, all three electrophoresis instruments
at the Institute were collected in one rOOlll, which made possible further rationalization. All instruments aTe controlled from
a common instrument table. where all switches, potentiometers,
relays, etc., are mounted. There is also a main switch fo1' all
machines in the room that produce noise. This is situated in
the neighbourhood of the conductivity apparatus in order to
vrovide silence during the search for t.he sound minimum.
-1-0
AltKIV
l<'i:iR
KEllU, MINERALOGI O. GEOLOGI.
ED
22 A.
N:O
10.
4.
The Conductivity Appllratus was built accordiug' to
(19BO), with certain simplifications. Its precision
is definitely greater than 1 : 1000, but docs not reach 1 : 10000.
It is completely adequate for the conductivity measurement,s
in <luestioll in this work. Three different conductivity cells are
used, with the constants 12.30, 44.20, lLUd 258.0, for poorly,
medium, and well conducting solutions. All conductivity measurements were carried out in the electrophoresis water-bath
at the temperatures in the actual experiments.
SHEDLOVHKY
C. Directions for lTse of the Pt'csent Apllnl'atuN.
1. ~IountiJlg' the Apparatus. All ground smfaces of the
cells [Lre well greased with a suitable mixture of vaseline and
paru,ffi n oil. The best composition of this g'l'ease CILllnot he
given, since the quality of the two substances mentioned seems
to vn,ry from time to time. It must be determined by experience. The following l'ule can be given: the grease should
have a viscosity as high as possible without maJ;::ing' the
movement of the cells (l1t the freezing' point) by the [Lir pumps
impossible. A lower viscosity is associated with a short,er time
of complete electric insulation, after which time the cells have
to be regreased, while a hig'her viscosity is, with the preseut
construction, naturally impracticable. The pneumatic arrangement, introduced by 'l'IsELIUS for the movement of the cells,
may seem stl'lLnge but is vel'Y suitable. The limited foree
provided by the pumps can never crack the cells.
A rubber plate with a central, rectangular hole is placed
on the bottom of the U-tube stand, and the bottom cell is
placed on the top. It is pressed against the right-hfLud metal
wall. The diaphrag'lll (Fig. 23, p. ~)4) iR placed in position,
and by stretching' a thread from its outer slits, perpendicularly
lLg'ainst the diaphragm, it is checked thILt the two holes in the
bottom cell fit against these slits. If this is not the case, the
rig'ht-hanc1 metal wall is shiftecl sideways in the tlesirecl direction. After the correct position of the cell has been fOlll1t1,
it is made immovable by fixing the stoppel' 8 j in the proper
position (Fig. 9 a).
The intermediate and the top cells are now placed one
above the other, each cell being moved a little under pressure
until the air between the two g'l'ease layers is completely
pressed out. The steering springs 8Pl are put in place (in the
case of a long intermediate cell, they are placed between this
and the top cell), as are the two top springs 8P2' The latter
should exert a slight pressure on the top cell; they are pre-
H Jl.ERY SV~:NSBON, IcT,ECTROl'JWIGESTS
41
rig D ,0
v('utetl from gliding off by two l'ubb('l' blllJ(lEl Fillf111y, the
stoppel' S~ is put ill its pJace, and the left llllnd metal wall
i., fixed in such a position that tbe top ceJl is mn.dt' imlllovable
By l'l1bbel' tnbings, long' enough to give sufficient flexibility, the male standard joints fitting to the top cell are C011-
.±~
ARlCIV J"OU KElIrI, lIIINE]~ALOGI
o.
GEOLOGI. BD
22 A.
N:O
10.
necteil. to the electrode tubes. The latter are fixed ill their
holders. The U -tn be stand and the electrode tnbe holders are
placed hallg·ing" in the metal frame made for this purpose.
The lateral fLlld height positions of the electrOlle tubes are
adjusted so that the two prLrts of the standard joints fit into
each other.
2. :mllillg tlle Al1llal'l1tns • .A. dry U-tube can be filled llirectly with the solution to be investig·atell. Otherwise, the cells
hrLve to be washed once 0]' twice with the buffer to be used.
After the washing, the U-tube stand is inverted in order that
the wash-buffer may run away as completely as possible.
If ouly the necessary amount of the solution to be investigated is aVl1ilable, the requirecl dl1ta (pH, concluctivity)
must be determilled before filling the apparatus. Otherwise,
these measurements can be made 011 the rest of the solution
afterwa,rels.
In each CrLse, the entire solution is poured into the U-tube,
and in some way or other the adhering wash-buffer is effectively mixed with. A good method is to suck up the solution
into a syringe from one limb and let it run down again in
the other, this operation being· repeated.
In the case of short intermediate cells, the lower of these
is now moved to the left-hanel metal wall, while the other
cells are kept in their positions. Both limbs of the upper. cell
lue emptied by means of a 8yring·e; it is advantageous here
to tilt the apparatus a little. The cell is then washed twice
aud fiually filled with buffer.
In the case of a long cell, this and the top cell are shifted
to the left-hand metal wall (after l'emoving the stopper 8 2 ).
One limb is em ptied, the other fined with the colloid solution.
The empty limb is washed twice and finull.v filled with buffer.
The top cell is shifted back to the right-hand waH, and the
stopper is again put in place. Finally, the l'emaining colloid
solution in the top cell is removed, and the cell is washed
twice.
The U-tube stand and the electrode tubes are now bung"
in the metal frame, and all strLndard ground joints are well
g-reased. The vertical tubes fitting to the top cell are fixed
on and rotated a little to secure complete iusn lation. The
electrode vessels are attached to the top cell, the joints being·
rotated in the same way. The connecting rubber tubes S10111d
exert a slight pressure in the direction aga,inst the top cell;
a force in the other direction is dangerous as it involves a
risk that the connection may break during' the experiment.
The complete apparatus is shown in Fig, !) b.
HAI~RY
RVDNSbON, EI,DCTROPHORESIS
.~
'"
"'~,.'" ".""".-.,,,,,,,,,,
.......".""' ... -,-~,-.......-_;,_.."-_....._..,,. ~
.
"
'
Fig () h
The apparatus is now placed in the thprrnostat in the proper position. The electl'mle tubes are filled with buffer, but
110t completely; a small volume mnst be left for the electrodes
and for the chloride solutions. '1'he electrodes are il1flerted,
the white electrode always being used as the positive pole,
and the larg'f' gTound joints are rotated and pressed together.
'rhe connections between the apparatus and the compensator
are nolV eHtabliflhed In the older construction, the compensator
limbs were connected with the two vertical tubes of the top
cell, but in the new type c1ehvpred by L](B-Produ7tte}" Fa7mlcs~tB, Stockholm, these tubes are sealed, and the connection
is made instead to special tubes ill the COnef, of the ground
joints of the electroc1e tubes.
..1,4
Af{Ii:lV
~'OH
KEllU, MINEIULOGI O. GEOLOGI.
HD
22 A.
N:O
10.
Buffer solution is sucked up into the chloride containers
to a level sOlllewhat above the stop·cocks. The containers are
tilled with chloride solution (preferably cooled), and the latter
is allowed to run down. The remaining ail' in the electrode
tubes is then :1utomatically removed, and the rubber tubes
leading' to the compensator, as well as the latter itself, l1re
tillea with buffer. The tube connecting the two compensator
limb:> is left open so that the buffer level migrates at equal
speeds in the two limbs. The final level is adjusted to the
desired height, not too neal' the outlet tube. The compensator
cylinders are put in a position suitable for the intended direction of compensation. The stopcocks below the chloride conta,iners are closed before the solution has run completely down.
The apparatus is now ready, but before the current is started,
it must be t1llowecl to stand for at least half an hour to at.tain
constant temperature.
3. Sturting the Experiment. The conuection between the
two compensator limbs is closed. The IT-tube is opened by
pressing the intermediate cell to the right-hand wall, not too
quickly. If a long cell is in use, it should be pushed to the
right by both air pumps in order to prevent cracking' of the
cell due to an asymmetrical force.
It is often desirable to start with l1 few minutes' compensa·
tion in order to make the original boundaries visible and to
check that they are single and quite sharp. This is doue
simply by starting the synchronous clock in the propel' direction.
A. reading should preferably be taken after the clock has.
been stopped aga,in. The current is then started, the voltage
being chosen so that the total power in the appamtus does
not exceed ('j w. After a few minutes, the connections between
apparatus and compensator should be broken by clamps or
stopcocks in order to prevent disturbing influences from the
compensator. The liqui.d level in the narrow space between
the ebonite plungers and the compensator limbs is ill-defined
owing' to the capillary forces, and an accidental touch on thl~
compensator may give rise to a small shift of the liquid in
the appara,tus. The current is read several times during' the
experiment, and the leakage is checked. If there is a current
leakage, it is probable that. a transport of liquid also takes
place at this point. Such a liquid transfer. which g'ives l·ise
to erroneous velocities, may be clue to different hydrostatic
pressures on the two sides of the leakag'e (different liquid
levels in l1pparatus and water bath), or it may be caused by
electroosmosis. Both effects are counteracted by working with
IIAltltY SVENSSON, EI,EC'l'ROPHOREBIB.
45
a. completely closed apparatus. It is necessary, however, not
to close it before complete temperature equilibrium is attained,
i. c. 10 minutes after the current has been started. Altel'nuti vely, the sodium chloride solution can be allowed to run down
completely and the stopcocks left open. The connections with
thc compensator can then be closed before temperature equilibrium is H,tt:Lined, since the buffer can contract and expand
in the chloride tubes. The complete symmetry of the apparatus warrants that no liquid shift through the U-tube results
from such volume cluL11ges.
4. Readings. In an apparatus of this kind with so Ulany
joints, leakage is !Llways IL source of error much to be feared
and never to be neglected. All avtl,ila.ble methods of discovering a.nd controlling' the leakage and its consequences should
therefore be applied. A further such possibility is available
when readings of the migration of the boundaries are made.
In t.he abspnce of leakage, the movements of t.he boundaries
should be I1niform, and plots of their positions against the
time should result in stmight lines. Unfortunately, however,
one cannot conclude t.he a.bsenee of lea.lmge from a uniform
movement, a.lthol1gh from !L non-uniform migrution it must be
con eluded that the aplmratus is not completely tig'ht and that
the mobilities obtained are uncert.ain.
Foul' to six rea(ling's on each component a,re sufficient
provided that thoy are extended OVel' a considerable time (slow
illigration) or over 11 considerable distance (rapid migration).
The reading'OJ are plotted against the time (with some training,
it is found most convenient to plot directly), straig'ht lines
are elm Wll fitting' the points, and the mobilities are calcula.ted
from the graph by measuring the slopes with un ordinary
protractor, It must be condemned to base the mobility deterlUination on only two or three readings or 011 frequent reading's during fL short time interval. III the absellce of system(Ltical errors, the accuracy in the mobility determination rises
with the distance which the component is allowecl to travel
and with the number of reading'S.
For ordinary purposes, it is quite sufficient to make the
reading'S directly on the screen in the camel'a. In cases where
the higbest possible precision is IJeCeSSal'Y, several exposures
must be taken and the position of the l)eaks determined photometrically (LONGSWORTH H143) ,
5. Finishiul!: Ule Iilxperiment. The current is broken, and
the U-tube is closed by shifting the intermediate cell{s) to the
left. The compensator limbs are emptied, and the rubbel' tubes
-loG
ARKIV FOR KEIIII, UINEltALOGI O. GEOLOGI.
TID
22 A.
N:O
10.
between them and the apparatus are disconnected. The appa.ratus is lifted out of the bath. The four gTound joints of
the top cell are cautiously disengaged by rotatory movements.
The Su,llle is llone with the joiuts of the electrode tubes. The
electrodes are removed and washed with tap-water. They are
kept under water. The tubes are emptied and also washed,
prefcr::Lbly with distilled water the last time.
The top cell is emptied with a syringe. In the case of short
intermediate cells, the conteuts of the upper cell are made
accessible by shifting it to the right-hand wall. The same
cell find the top cell are afterwards shifted to the left, and
the lower cell can be emptied. Finally, if all cells are again
pressed to the right-hand wa]l, the contents of the bottom
cell can also be sucked up.
In the case of a long intermediate cell, the top eell must
be shifted to the left in order to make the contents of the
t IVa lim bs accessible to the syringe.
lf the contents of the U-tube are to be discarded, the
latter need not be closed at the conclusion of the experiment.
The U-tube is then emptied simply by turning it upside down.
It is finally washed with tap-water [Llld filleu with distilled
water.
6. Cleaning the cells. The g'pease between the cells has a
tendency, in the course of time, to move up into the cells,
where it adheres to the walls and diminishes the lig'ht intensity. Simultaneonsly, the grease between the cells gradually
makes room for the solution inside the tube, giving rise to
leakage between tho lim bs anel between the apparatus and
the thermostat. A leakage of the first kind is impossible to
detect; those of the second kind have l1lreac1y been discussed
in detail. When a leakag'e is discovered it is time to clean
and regre:1se the cells. At this Institute, regreasing' is now
ca,rried out before every run, cleaning once a week.
The cleaning' is now performed with synthetic detergents
(1 per cent duponol solution) after the bulk of tho gTease Ims
been removed with a cotton wad. Special care must be taken
in cle::Lning the insides of the front and back walls effectively.
For this purpose, a cotton wad fixed on a nickel rod has
proved to be suitable. Bichromic-sulphuric acid should not
be used. The grease is very resistant to this agent, while the
cell cement is perhaps not.
7. 'flte Determination of the Cross-Sectional Area of the
Cells. The ground surfaces of the cell are g'l'eased, and the
cell is placed on a plane glass plate. The volumes of the two
limbs are measured by one of the following procedures.
IIAHRY SVENSSON, ELEOTltQPIIOllESIS.
47
According to the first procedure, the two limbs of the dry
cell are fillell with 1 N-Hel to a slight overflow. The latter
is removed by letting another glass plate glide over the top
of the cell from one side to the other, the superfluous liquid
being' sucked up with a filter paper. The contents of the two
limbs :11"e then transferred to separate flasks tog'ether with
several washings. The acid in the flasks is titrated with
0.1 N-NaOH.
In the other procedure, the greased cell together with the
two glass plates is weiglled empty, with one limb filled with
water, and with both limbs filled. The weight differences are
recalculated to volumes.
The total height of the cell is measured to within 0.1 rom.
The division of the volnmes by the heig'ht gives the crosssectional areas. A correction to the temperatlll'e of the waterbath cannot be consiuered as necessary.
It is generally found that different' cells, and even different
limbs in the same cell, have somewhat different dimensions.
A numbering of the limbs is thus necessary. It is essential
to note the cell numbers in each experiment as well as to
build np the U -tube in a standardized manner so that the
cross-sectional area is known in every part of it.
CHAPTER Ill.
Method of' Observation.
A. Historical.
In LODGE'S early experiments, different indicators were
adued to tho migTation tubes in order to make possible the
observation of moving bOllndaries. MASSON (1899) also used
culoured indicator solutions, but his indicators had the double
purpose of showing- the boundary position and of keeping' the
boundary sharp. In the early experiments with colloids,
coloured 01' opalescent sols were investigated (PIC'l'ON and
LINDER 1897; WHITNEY and BLAKE 1904; HARDY 1905), and
the movement of the boundary was observed visually. In
other words, the early workers made use of lig'ht absorption
in the visible range.
This was the only method available until SVEDDERG and
J E'l''l'E (1923} made use of the fluo1'escence of colourless proteins. The U-tube was irradiated from the side by ultraviolet
lig·ht. KRUYT (1925) and DUlifANSKI and KNIGA (1926) used
48
Al~KIV Fon REIIII, nIINERAJ~OGl O. GEOLOGI. BD
22 A.
N:O
10.
the Tyndall effect instead, the former author placing the light
source above, the ll1ttel' at the side of the U·tube.
III comparison with these methods, the ultraviolet lig'ht
absorption method introduced by Sn:DBERG and TISE],IUfJ
(HI:2(:i) [Lnd further developed and extensively used by TISEJ,IUfJ
(1930), imvlied a great advance. TI8ELIUS' measurements of
mobilities and isoelectl'ic points showed an exactitude hitherto
unknowll, which was hl'g'ely due to the superiority of the
new method of observation.
Methods based upon the devia.tion of light were used in
electrophoretical measurements as early as 1902 by .AmwG and
GAml. Their very simple al'rang'e1l1ent, which is applicable
only to very sharp boundaries, has, with certain improvements
(MAcINNES, COWPERTHWAITF., and HUANG 1927), been in nse
until quite recently in moving boundm'y studies by the WHETHAlI[·MASSON method. LAlIlllI'S welDmown scale method was
published in 1928, bnt was not applied to electrophoresis
until much later (KEKW1CK 1939, 1940; TISELIUS and HOI~S
FAI,I, 1939; HOl~BFALL 1939).
The introduction of the TOEl'I,ER, Schlieren method (see
SOHARUIN 1934) by TIsm~IUs (1937, a) was of still more fal'reaching importance than the ultraviolet light absorption
method at that time. It immediately substantiated its usefullless in the discovery of the three globulin components in
horse serum (TlSELIUS 1937, b).
The methods so far mentioned, except the scale method,
only permit the localization of boundaries with an increasillg'
exactitude and convenience, but they are still inapplicable to
concentration measurements [1D c1 to a detailed analysis of
refractive index gradients. The scale method is cap'able of
such an analysis, but it is too laborious in electrophol'esis;
the two limbs of an onlinary apparatus represent a total
length of about 17 cm.
tn 1938, PHlLPO'l' published a self-registering optical arrangement for the ultracentrifuge. It was based on the
TOEPLER method allc1 on TnovER'l"S cylindrical lens method
(1914). This invention seems to have found its most important
application in electrophoresis, for in this field of research it
initiated the development of several self·l'egistering' optical
systems after related principles.
The first step was made by LONGSWORTH (1939, a) who
obtained electl'ophoretic pattel'lls by the simultaneous movement of the horizontal edge and the plate in the ordinary
TOEPLER arrangement. Shortly afterwards (1939), the present
author pl'eSellted a modification of PHILPO'l"S method, with
the use of slits instead of edges. Moreover, the original
HARRY
48
SVENSSON, ELEC'l'IWPHOREBIS.
method of PHILPOT is also used in electrophoresis (RENWICK
1940), as are modifications of LONGSWOR'fH'S procedul'e (FELL,
STERN, [Lnd COGHILL 1940; S'fERN and DuBoIS 1841).
It h[LS been an interesting study to elucidate the theoretical
elements of PHILPO'l"S method as modified by the present
author. A first attempt in this direction was made in 1£.140,
but the influence of the diffraction of light was at that time
disregarded. In the following pages, the theory will be treated
in a simpler and more thorough manner than before.
n.
1'he Croflse(l·Slit Metl10(1, Arrangements mul }JlcllIentarr
'l'lwory.
1. Optical Arra.ngements. The crossed-slit method can be
applied in !1 va.riety of modifications, some of which are
shown schematically in Fig. 10. Considering also that concave
mirrors can be introduced instead of lenses, that vialle mirrors
can be combined with lenses, and that the light source can
be arl'fLllged in different manners, it is easily ]'ealizec1 that the
1_Jossibilities are llumerOllS.
In Fig. 10, A is the light source, B 11 collimating or projection lens, C a horizontal slit, D an objective (the first
5'ch/icrcll lens), E the electrophoresis cell, F another objective
(the second Schlieren lens), G an inclined slit, H [L third
objective (the C[Lmera objective), I a cylindrical lens with a
vertical axis, and K the photographic pbte.
G<!)-" I eo ~.-.-.-.-:[-- D-~'-'-'- _.' I
ABC
- ----.-_
_.-.-:. !i • '~---'---'-l-'----1
____ .. --- ---' 0
Ef
<.
G
--'--- -.
H
G'--J):--~I
·:-·-----]-·-n·---·-·-·-·-·-·-[--·-·-·--~ ! -.
._r
I
.
__ ._.
. ___ "
.-
-------------.-.---.-.
ABC
DE
0'- $ I "'_-:--
I
A
~
G -j)e
-'---1 -a-----
----._
_-_._.
--. __ . .__
C
0
E
:
'-=l---_A-'j
-.
-.
G
:t-
I
'~; ._
G
H
[
ABC
- - - ' _ _ " -.~.
:-=~
---'-w-_
______ . :_ __ ---_:E f
'---'-i
K
n --_.. -. __
::~'.'. -"':'--:tt'._.ij'-
-/J
i· -~~-rU-----==¢=)
-:-~r-.
:
-----
o
K
I
H
3"
.- -.-.--
I
_K
'-$~-_________
-=:-r_
"!i l-·=~_.
-~
.
a
Fig. 10.
Arkiu 161' kemi, mincl'<l/ogi o. aeulogi. Ed 22 A. N:o 10.
H 1
K'
60
ARliIV Fi)R liElIII, lIfINmar.OGI o. GIWJ,OGI. BD
22 A.
N:O
10.
The principles of the method are as follows, irrespective
of the modification employed.:
:1.
inlltge of the h01'izoutal slit is thrown UPOIl the diagonal s1i t;
h. an image of the cell is thrown upon the phot.og'l':1phic
plak;
c. an imag'e of the inclined slit is thrown on the same plate.
fLU
The possibilit.y of focusing' the lens system HI on the cell
and on the diag'onal slit simultaneously is due to its astigmatism. The principle is that a point in the cell is brought
to focus as a sharp horizontn,l line, while a point at the
diagonal slit gives rise to a sharp vertical line on the plate.
2. Notation.
a = thickness of the cell in the direction of the optical axis.
7) =
perpendicularly to))
»
»
(' = concentration.
d = lineal' vertical slit image devilttion.
c = base of natural logarithms.
= focal distance (with subscript referring to the lens
question).
!J = thickness of the radiating body in the lamp.
h = length
»»
))
»
»
f
dll
.
111
_. = speCIfic refractive index increment of tbe substance
de
in question.
l = active distances.
1)= AC = active distance between the lamp and the horizont[Ll slit.
l~= eif = active dist[Lnce between the horizontal slit and
the cell.
111 = EG = active distance between the cell and the dia,g'()nal slit.
14 = GK = active distance between the diagonal slit and the
plate, the cJ lindrical lens being treated as a plane plate.
1[,= OG = active distance between the two slits, reference
~ing taken to the lens action of the gradient.
10= OK = active distftnce between the horizontal slit [lnd the
plate, reference being taken to the lens action of the
gradient.
11 = refractive index.
J1 = optical distance (see text).
k=
(_J=
HAI~RY
l'
SVENSSON, ELEC1'IWPHO RES] S.
61
= width of the horizontal slit; a fraction between 0 und
- 1 that defines the position of the cell in relation to
the focus of the camera. The latter is situated at .z: = 0,
the cell walls at .8' =]'u and (7' + 1) a.
8 = length of the horizontal slit; a fraction between 0 and
+ 1 that defines the point of a large cell from which
the active distance l~ has to be counted. For s = 0 it is
counted from th(-\ front wuJI, for is = 1 from the back
wall.
t = timc.
u = area of the CUl've (illuminated area,).
v = aperture angle of a light beam; prism angle .
.r = vertical cell coordinate.
11 = horizontal coordinate at the diagonal slit.
Z' = horizontal cell coordinate (along the optical axis). ,Z·' = 0
is in the focus of the camera,
= one of the Fresnel integTals; the constant of SNELL'S law.
= diffusion constant.
G = mag'nification factors,
Gj =
»
of the lamp.
G~=
»
» » horizontal slit.
G n=
»
»
cell.
)\
»),
diag'onal slit.
GJ =
0,,="
. ' ) ) ) when brought to focus
by the gradient.
I = light intensity.
,J =
flux.
L = height of the cell.
P = absolute errors.
(J = relative
»
R = radius of CUl'vlLtUl'e.
S = one of the Fresnel integ-mls.
U = area enclosed between the curve and the reference line
on the plate.
X = vertical coordinate on the plate.
Y = horizontal coordinate on the plate.
d X = vertical thickness of the curve,
d}' = horizontal
»
a = alJg-le between the light path and the horizontal line
within the cell.
0= the same angle outside the cell; inside the cell, 0 is defined by equation (84).
11 = wid th of the inclin ed slit.
A = wave-length.
g is defined by equation (67).
e
n
52
Al~JnV Pi)R Imnn, MINERAT,OGI o. GEOI,OGI. BD 22 A. N:O 10.
cp = augle of inclination of the curve on the plate; this equals
zero where the curve runs vertically.
d = thickness of the curve.
(j = ang'le of incliml,tioll of the diagonal slit; this e()lHl,ls zero
in the verticaJ position.
Optical distances are denoted by a single line__ ~bove the notation for the g'eollletrical distance, o. [I. P(,\ = the optical
distance between P [Lllel Q.
Actz:re distances are _clenoted by a double line in the same
position, e. (l. 1:' Q.
3. Active Distances. This is an optic:1l conception that has
been found to be exceedingly vll,luable in this theory. The
anthor has not been [1ble to find it elsewhere in the optical
literature, but the ideas have much in common with those of
ABBl~ when he elucidated the active diaphragm in a.n optical
system (el WINKELMANN 1\:)06, p, 212),
The active distance between two points (pbnes) P and Q,
between which :1 system of lenses and plates is situated, will
be defined as:
(1)
where pi is the imag'e of P when brought to focus by the
lens system, and Q' the imag'e of Q, Gp and GQ are the 1'especti ve magnification factors. The identity between the two
expressions, which is necessary if the definition is not to lose
its significance, is easily shown by the following consideration. 1£ the magnification factor is defined as positive for an
upright, negative for an inverted imag'e, the lens formula
g'ives the equations (we assume now a single lens between P
and Q):
(2)
a=f(l-+),
lTQ
The active distance becomes, calculated according to both definitions:
(3)
i. e., identically the same. If one of the mag'llification factors
is 00 (P or Q is situated in the focal pla,ne of the lens), the
active distance equals the focal distance f If Gp GQ = 1 (the
II ARR Y SVENSSON, HLECTIWPHORESIS.
53
planes P and Q are conesponding imag'e l)la11es), the active
dishmce is O. Finally, if f = 00 (the lens is a plane plate),
both magnifica.tion fa.ctors are = 1, and the active distance
appears in the f01'm 00' O. It is easily found, however, that
the active distance is in this case identical with the optical
distance.
The relation (3) was shown to be true only for the simple
case of a single thin lens between P and Q, but it is not difficult to show tlmt it holds quite generally. It is also possible
to divide the lens system into two parts. Let p' be the image
of P in one part of it, Q' the imag'e of Q in the other part.
The expression
P'Q'
G1, UQ
is still eq nal to the active distance
rQ.
5. The Physical Significance of' the Active Disialll~e. In
Fig. 11, we have two pln.lles P and Q on either side of the
lens L, twd p' is the image plane of P given by the lens.
In the upper fig-nrc t.he illlag'e is real; in the lower it is
imag·inar,Y. Two lig'ht pencils making the a,ngle v with each
other orig'inate from the plane P, are broken by the lens, ancl
intersect the plane Q in the points Ql and Q2' We will calculate the distance (~1 q~.
This distallce is the product of P'Q and the tLng'le Ql p' Q~.
The latter is = !'/ G p; thus we have:
---;:-
(.!l Q~ =
p' Q
/' . ~--;-- =
(Jp
Fig. 11.
/,.
==
PQ.
5-1
ARKI\,
Fbl~
KElIIl, nIlNlmALOGI o. GEOLOGI.
lin 22 A.
N:O
10.
This result illustrates the usefulness of the active distance.
The angle V llHt,)', for instance, be the ~wgle of detlection ill
the cell; the corresponding linear deiiection ill an arbitrary
plane is obtained by multiplying the angle by the a.ctive
distance to tbat plane. Altel'nl),tively, '/) may be a space angle
defined by the aperture of the lens; the light intensity at (~
and the dimcnsions of the illuminated are~L are easily eorn puted
by removing the lens and substituting the real distunee for
the n,etive one. The treatment. of the diffraction of light in
optical systems containing lenses is also greatly simplified, us
will be shown bter. The active clist~tnce may be regarded as
a generalization of the opticaJ distanee.
5. The ('hoice of Variables. It is desirable to elucidate
the influence of the different apparatus constants on the
sensitivity and the resolving power of the method. The knowledg'e thus g'ained may be of some value in the choice of the
optical arrang'ement. To avoid an immense amount of 1V0rk,
ho wever, it is necessary to introduce the most suitable variables,
applicl1ble to all possible variations of the method and giving
simple expressions in the mathematical treatment. Optical and
focal (listances are not suitl1ble, but the magnification factors
are convenient variables, and the salUe :is the case with the
active dist.ances defined above. It is not surprising', then, that
simple relationships hold between the magnificlttioll factors
and the active distances.
A crossed slit arrangement is completely characterized by
the four distances 71 , l2' 711 and 74 and the factor G.1 , since
the other magnification factors are connected with the distn,nces
in a manner easily found by inspection of Fig" 12. Assume
that C emit,s a light beam with the aperture v. This is brought
to focus at G by the lens system DF, and the image aperture
is 71/ G 2 • The extension of the bright field at the cell E can
thus be calculated from both sides, which gives the relation:
(5)
c
D
E F
Fig. 12.
G
HAgRY SVENSSON, ELIW'l'ROPHORESlS.
50
Similarly, if we regard a light beam originating' from the cell
and bronght to focus on the plate, we obtain the relation:
(G)
Finally, if the projection lens is focmled on the cell, we also have:
(7)
This need not be the case, however, since the lens B can also
be focused on the slit 0, when lj = 0 a.nd (7) does not hold.
tL 'l'lte l,igltt Deviation in the Cell. Since the method is
Imsed upon the same principles as the TOEPLER and LAMlII
methods, it is superfluous to repeat the theory for the deviation of light in the celL The reader is referred to the works
of these authors and to the more thorough trea,tmellt given
in section E of this chapter. The angle of deviation after the
passage through the cell is:
(8)
O2 - 01 = a 1/' (.'l:).
7. Thn Hnllar Slit Imag'll Deviation. If no deflection takes
place in the cell, the light pencil arrives at the normal slit
illlu,ge at G, the diagonal slit. If, however, }1' (.r) rf 0 :1t a
certain point, this pencil is deviated down wards according' to
(8) and arrives at G at the vertical distance
d = 73 a n' (x)
(9)
from the normal slit image.
8. 'l'he Formation of the Electroillioretic Patterll.
If the
cJ linc1ric!11 lens is removed, a normal image of the cell is
thrown upon the plate by the camera objective. The cylindrical lens destroys this imag'c only in one dimension, with the
result that every point in the cell is brought to focus as un
horizontal line on the plate, The vertical cOOTdil1ates X Ulld
x of the plate and the cell are connected by the magnification
factor Gil:
(10)
In the same way, points of the diagonal slit are bronght
to focus as vertical lines on the plate, The horizontal coorc1i-
i'ili
ARKIV FOR KEl\U, lIIJNEIULOGI O. GEOLOGI. BD
22 A.
N:O
10.
nates l~ and 1/ of the plate and the diagonal slit are connectcd
by the factor' 0 1 :
( 11)
It follows that a light. pencil ]JUflsing' tho point ;(:1 ill the cell
and the point YI in the diagonal slit must arrive at a. single
point on the plate defined by the reJa.tions (10) and (11).
In this elementary theory, we rpgard the slits and slit
imllges as infinitely narrow and disreg'ard the diffraction
1
1
dl
I
I
I
Fig. ]3.
phenomena. The intersections between the slit imug'es at G
and the inclined slit n.re then ll1l1tbematical points. 'rhe 1101"maJ slit imag'e will be assumed to intersect the inclined slit at
1/ = O.
. If the a.ug·le of the illclille<l slit is 0 (Fig. 13), the coordinate of the point of intersection of a deflected slit image
becomes:
(12)
!It = 7:1
a ii' (01:) tan 8,
and the correspondiug' coordinate at the plate:
(13)
If the indices are omitted, the eljuution of the Clll've
plate is obtained:
(1+)
011
the
IIA RR Y SVENSSON, ELIDCTIWPHORI£SIS.
57
By uiiferentiution, we find the slope of the curve:
ta.n rp
(1 i»)
(-l~
{f 1/"
--~---:---
1:1
d )r
= --=
(.1:) tan 8
(i~
dX
!). 'J'he ltefractivc Index Increment. Equation (14) can also
be writ.tell
III
the form:
(10)
IntegTn,ting between Xl a,au X 2 , we obtain the increase
refractive index between the points :C1 and :'2 in the cell:
or
.Y,
( 17)
110 "
=
11
I
~
-.---!-----U {l.j In a tan (j
a
j' r d X
-L
•
X,
If, further, we assume a linear relationship hetween refractive
index and concentration (If
(1 f3)
we
LAlIl]r
_211 =
1\)37):
1,;. dc,
JULYI::':
(HJ)
where U is the definite integml in (17), represellting the area
enelosed by the curve, the abscissa, and the two lines X = Xl
aud X = X~.
10. '('he ]Jens Action of the Gradient. The refractive index
g'l'adieut in the cell acts as a cylindrical lens with an hori7.ontal ILxis and has the focal distance:
(2U)
whieh is, of eourse, [L function of ;{:. The refractive power of
this lellS is by no means negligible. Light l)encils that pass
through gmJients in tho cell ure thus not brought to focus
in the plane G of the inclineJ slit, but in pla-nes that can be
situated far in front of or behind it. When mention is made
of a "devin,ted slit image', therefore, this is an inaccurate,
but convenient expression.
58
AgE:IV Fi:)n Kmlrl, nIINElUl,OGI o. GEOT,OCH.
ED
22 A.
10.
N:O
A method of obsel'Vu,tioll based on the len8 action of the
bOL1ndaries was work-ccl out by ThIhcHEBoEuF and MONNlElt
(19-12) for electrophoreticiLl stuelies.
C. 'l'he Light Iutensity.
1. First AI'I'Hng·mnr.llt. In this method of illumination, n
Imup with an horizontal radiant body is useel, which is bronght
to focus on the horizontal slit (Fig·. 14). In the calculation,
the lamp is assumed to distribute its light symmetrically in
all directions, losses due to refiectioll are lleglected, and the
diffl'::wtion of light is not taken into account.
In this case, the active distance between lamp and cell is
1~/G1' and the lig·ht intensity at the cell, if the slit were absent, is fountl to be:
(21)
The result will be the same if a slit with the dimensio11s
}' = G1 9 and s = G 1 h is inserted, and the eli III ensions of the
light source [11'e arbitrarily greater than g and h. We may
thus write:
{2~)
,,
E
.~ -.-.-.-.-.---.-~-.~
- -.- --- r--'I
I
c::=::=J
.-
.... _
Fig. 14.
-.-
-._ ---.-
---- ..... -------- ... --
IIA RRY SVENSSON,
,, ''
,,, :,'
t
1
ELEC'l'JW1'1l0l~ES1S.
"-'-
-_-------_.----,
, ,
,,
E,
,
~, ?
'
, :
:
'
-------
.~-
-----------
-(....::------------------
--.--=;=:~
'The flux of lig'ht passing' the cell is obtained by multiplyil1g'
by its height L an<1 brea<1th b:
·(:33)
If the inclined slit is removed, this flux of light enters the
·camera with.out losses a11d distribut.es itself over the area
L Gil 8 G2 G.J. on the plate. The intensity there becomes:
,(24)
II'. =
ruLl.
a-a
4--{3
7[:
2
G-'
28.1
Eliminating G2 by means of equation (5), we finally have:
'(25)
2. Se(~on(l Arrangement. This illumination method was
:suggested by PHILPOT (1\:)38) for the ultracentrifuge and bas
-certain advantages. The lamp should now have a greater
vertical extension, the projection lens is focused on the cell,
:an<1 the hotizontal slit stands as near the projection lens as
possible (Fig.. 15). With. tue notation introduced earlier, we
have:
GO
AUlnV
~,(jg
KF.lIII,
JlIINEl~ALOfH
O. GEOLOLiL
lJD
22 A.
N:O
10 .
.II h fA
Ie =~l~"
'"±rcj
(2G)
The lig'ht :flux through the slit is:
(:!7)
At the cell, the illumiufLteu. area is G; fJ h, and hence the lig'ht
intellsity:
(28)
With the aid of (7), we have:
(29)
IE
}'s
=
h
:;--1"
'-r 7i 2
As this expression is identical with (22), and as thcre is no
difference beyond the cell, the intensity 011 the plate is the
SfLme as in the first fLrmngement.
3. ThiNi Arrangement. According to this method, which
necessitates fLU fLchroIllfLtic opticfLl system, :111 incandescent
lam p with a. single, horizontal, stretched filament is used as
a. light source, and the condenser lens and the slit are omitted.
The light intensity at the cell is:
(30)
As {! aml h tue in this case identical with 'I' and s, this expression is again identical with (22), and the finall'eslllt is
the same.
Independently of the illumination arrangement, therefore,
the light intensity of the curve mlLy be written:
(31)
Ire
=
}'7)h
-----,--,-.
4n12In(~II(TJ
It is proportional to the light density of the lamp, to the
width of the horizontal slit, and to the breadth of the cell.
In the third arrangement, it is proportional to the totfLl intensity of the lamp. It is inversely proportional to the distances l~ and 7:1, anel to the magnification factors Un anel G.].
HARRY SVENSSON, ELEC1'ROPHORESIS.
61
It is remarkable, however, that the intensity is independent
of the quantities lj and (]j characterizing the illumination
arrang'ement and of the lig'ht-trallsmitting cltpacity of the projection lens. Oonsequently, the choice of illumination system
does not influence the light intensity more than does the light
density of the lamp, nor does the choice of the lens B or its
mag'nification in the first two arrangements.
D. 'l'he 'l'hickllCi'lS of the Curve an(l the Resolving P01l'er
of" the Method.
Hitherto, the diffraction of light has been disrcg'arc1ed, a,nc1
the slits have been treated as mathematical lines. This involves impermissible simplifications and we will now consider
the effects of these, in order to find the limitations of the
method. As effects of the two fa·ctors are mutually independent, they will be treated separa,tely. The effects will finally be
summarized.
1. The EIfect of the ]i'jnite Wi(lth of the Horizontal Slit.
As the width of the dia,g'onal Blit is treated in the next section, it will still be reg'ardec1 as infinitely small, and no diffraction will be assumed to take place. The effect of the finite
horizontal slit width is then simply that the section between
slit image and inclined slit becomes a line instead of a point.
The horizontal projection of this line is:
1'lR
(32)
tan ()
-/;-'
irrespcctive of the lens action of the gTadient. Hence we ob
tain on the plate G, curve of the horizontal thickness:
(33)
d }' = _G 1 1_J!L!_a_~ .
l2
With the aid of (15), the vel'ticnl thickness:
J X=
(34,)
C--Ji!.iT121~
a II (;1;')
and the thickness perpendicular to the curve itself:
(35)
.d =
G.[ l' lB tan
e cos rp-
------[2- - -
l12
ARKIV POR KEnIl, MINEllALOGI O. GEOLOGI.
ED
22 A.
N:O
10.
are ea:-lil y derived. If the aSimm ptions were correct, the thickness \vo~1Il1 be at its maximum for rp = 0 (in the base·line
and at the top) and at its minimUIll in the steepest parts of
tlle cnrve (the illliexion points).
2. l'he Diffraction of' Lig'ht and the Width of' the Diagonal
Slit. If a slit G is illuminated by another slit 0, pa,mllel
to the first, diffmction phenolllew1 can be observed on a screen
K behind the first slit (the simple two-slit arrangel1l811t). With
a propel' slit width 8 at G, tllere is obtained a central bright
fringe flanked symmetrically by a number of diffraction fringes
of decreasing' in tensity.
The mathematical theory of light diffraction in thiB twoslit arrangement was developed by Fl1ESNEL (1819) and LOl\I:lIIET, (1886) and leads to the following expression for the light
intensity:
(3H)
where 0 and S are
FRESNEL'S
integrals:
·v~
(37)
() =
Jcos t 1} d v
119
and
S=
f sin 11,2 d v.
",
",
The limits of integration are:
where d X is the distance 011 the screen from the centre of
the diffraction picture. Equation (36) gives the light intensity
at this distance.
Let us now assume that C is infinitely narl'Ow. Our problem is to find the width 8 of the other slit that makes the
centr[11 line at K as sharp and bright as possible. In the
curves (Fig. 1G) the light intensity is plotted as a fUllction
of LI X fOl' different values of 8. The extensions of the geometric!Ll projections:
(39)
OK
='8
OG
of the illuminating slit are also indicated in the diagrams by
vertical lines.
HARRY SVENSSON, ELEU'l'ROPHOlmSIS.
l13
A -==:±t:==--
B
Fig. 16.
For a very small c, the central fringe is very broad and
of low intensity. When c increases, the central fringe becomes
narrower and brighter. For very large slit widths, however,
the nearest diffraction fringes lie so near the central one and
are so bright that the eye accepts several fringes as one line,
which becomes approximately as broad as the geometrical projection. The centml line, as observed by the eye, is thus
never smaller than this projection. Its optimum sharpness
allfl brightness are apparently obtained for a slit width that
gives a central fringe of the same thickness as the geometrical
projection (Fig. Hi, diagram E).
The elementary theory of diffraction gives for the extension
of the central fringe the expression:
-
(40)
2 A.. GK .
dX=--____
c
The optimum slit width is obtained by putting it equal to the
breadth of the g'eometrical projection (39), which gives:
L1-l-
Al~KIV FiiR REMI, lIUN1<;RALOGI O. GIWLOGI.
fln
22 A.
N:O
10.
{-u)
In the crosHed slit method, we have not the simple twoslit u,1'l'fLugement, but [L slit C, illuminating' another slit G,
and [j, plate K behind. Elluation (41) is not immediately applicahle, however, owing' to the presence of lellses between the
three elements 0, G, and K. Another difficulty is that the
two slits are not p!11'allel to each other. We have to answer
two lluestio~s: _lLL What _~_0t.ance8 correspond to the optical
dista,nces CG, OK, lLUd OK in a more complicated two-slit
nrrangement with lensesr b) How is an inclineJ. slit to be
treated? .
The a,uthor snggests tha,t these questiolls must be answered
as follows: a) The opticfLl distances cCI, GK, and CK in the
simple two~lit ~~'Eangement have to be replaced by the active
distances ell, Uk, and OK in the actual system containing'
lenses. b) For an inclined slit, {3 must be replaced by {3/sin 8,
the vertical width of the slit.
Our expression for the optimum slit width is now:
{3
(42)
=
. 1f2i-:
sm
(J /
U.'l.+:
UK .
.
OK
Now, however, another difficulty lLl'ises. Since the Schlieren
(lenses) throws au image of 0 upon 0, the active distance
CG should be = O. This would imply the absence of diffraction phenomena in the crossed slit method, which is known
not to be the case.
The explanation of this apparent contradiction lies in the
refractive power of the gradient in the cell. The gTa,dient acts
as a cylindrical lens, and this lens removes the image of 0
from t~ plane ~ G. For th.e cnlculation of the active distances cIT and OK, which will now be named If> and lr, 1'especti vely, we may therefore exa,mine Fig. 17, whore E is
drawn as a plate of varying thickness. G' is the ima.ge of G
~ens
--
·-~·-·-·8e¢:-.:. _____
. . _. __ ._.-=-.. ~.-c
".
-::::..
-
-
-- -
D
- -~-
_-
E
Fig.
-
..
-
.
- .. -
: -.
:
G
17.
HARHY SVENSSON, ELEC'l'ROPHORESIS.
65
given by the lens E; the other symbols have the same significance as in Fig. 10, p. 49.
When deducing' the active distance 10 = cd, let D give an
imag'e of 0 and E an image of G. The optical distance between these images is GG', and division by the corresponding
magnification factors gives the active distance:
(43)
lfi
GG'
=
()
I' •
2 LTD
The lens formula, applied to the gradient lens, gives:
(44)
whence:
(45-46)
and
We thus find the desired distance lo:
15 = l~ l", a 1 '}I" (x)
(47)
I·
The active distance 10 = UK is derived similarly. Let D
and E together g'ive an image of C, aud H an image of K.
The optical distance between these images is G' E, and the
magnificati0n factors are G2 G5 and 1/ Gn respectively. We
then have:
G_
. G'_
Jj]
7 ----"-8
(48)
0=
() I'
•
2 Ll' 5
Since G' ill = In - GG', we obtain, with the aid of the relations (5), (6), and (45):
(4:9)
The insertion of 15 and 70 into (42) finally gives the optimum
slit width:
(50)
B
= In sin
(j
11 2 A. a 1 n" (x) I.
The smallest possible thickness of the curve is then el1sily
derived by using equation (40) and putting GK = GE: = 74 ,
We find the vertical thickness:
Arki" fOr kerni. rnineralogi o. aeologi. Ed 22 A. N:o 10.
5
G6
ARKIV 1,'bR KEnrr, lIfINERALOU[ O. GIWLOGI.
BD
22 A.
N:O
10.
(61)
the horizontal thickness:
(62)
and tllC thickness perpendicular to the curve itself:
(53)
_ r-·,---,-- ----. .•j -
d -
~ U 3 U 4 )'In
tan
(j
sm
OJ
q;.
Thus, if the slit width satisfied equation (50) in every point
and if the horizontal slit were infinitely small, the curve thickness would be at a maximum where rp = 45°.
rrhe ahove derivation is fairly complicated. Peculiarly
enong'h, the following simple consideration, which only requires
an elementary knowledge of diffraction phenomena., gives the
same result. Owing to the vertical slit width, elsin (j, light
pencils from a certain range d:'c of the eell pass the slit at
a certain coordinate y. This range is given by the equation:
(5J)
(55)
d x = - -___c
.
l3 a Inil (.x) I sin
.
(j
After multiplying by G 3 , we obtain d X, which corresponds
to the geometrical projection in the simple two-slit arrangement. If this is put equal to the breadth of the central fringe:
(56)
2 A74 sin ()
equation (50) is arrived at.
The author is aware that both ,deductions are open to
criticism, but the fact that they give the same result suggests
that this is correct. The first derluction is, of course, inconvenient if the second can be accepted, but it seems to the
author less exceptionable, having the additional advantage of
suggesting the origin of the diffraction fringes and the cause
of their existence.
3. The Simultaneous Consideration of the Two Slit Widths.
In order to perform this generalization, it is possible to extend
the first theory to a finite width of the diagonal slit and to
HARRY SVENSSON,
ELECTROPIIORESIS.
G7
extend the theory of diffl'action to an illuminating' slit with
l1 finite extension.
A slit can be imagined as an in£nite number of infinitely
narrow slits. The above theory is valid fOT each of these
slit.s, and we only have to integrate over all participating'
slits. This is easily done if the assnmption is made, in
agreement with the facts, that the projection of the whole
slit 0 on the screen is small in comparison with the breadth
of the central fringe. All infinite number of centml fringes
superimpose, and the resulting fringe will be as much broader
as corresponds to the projection of the illuminating' slit on
the screen through an infinitely l1arrow diffracting' slit. The
addi tional breadth is:
(57)
}' . GK
. erG
J' 74
= l~ 13 a j n" (xl j'
This expression, which is identical with (34), must be added
to (51) to give the real vertical thickness of the cnne:
d Y and d are then calculated as before. More simply, however, d Y can be derived directly by giving the inclined slit
the width according to (50), and the slit image the width O 2 ,,
(Fig. 18). The horizontal thickness of the curve then becomes
(the pl'o)ection OT the tetl'agon A.BOD, enlarged G 4 times):
(59)
d 1'= GJ. tan () (lBJ(2).a Inl/(xlj
+ G2 ,·)·
This is the sum of (52) and (33).
It is thus found that the two effects are additive when
expressed in curve thiclmesses. The l'esuitiIlg thiclmess of t.he
curve perpendicular to itself is:
Flg. 18.
G8
ARKIV POR KmTI, lI11NERALOGI o. G1WLOGI. En
22 A.
N:O
10.
4. The Resolving; Power of the lUethod. The crossed slit
method is used for two different purposes, 'riB. the discovery
and 10calizl1tioll of refractive index gradients and the measurement of the total refractive index chang'es at rmch gradients. Just as for other optical instruments, we can define
the conception resolving power, but the definition must be
made in accOl'dance with the actual pUTpose of the method.
a. The Least Perceptible n' (:c). If the purpose is only
to discover refractive index g'l'adients, we define the resolving
power as the least II' (:c) that can be discovered with certainty.
'rhis limiting' n' (x) eauses a horizontal uefiection on the plate
just sufficient to separa.te the curve from the base-line. We
have the thicknesses 01 the em've and the base-line in equation
(59) and the distance between them in equation (14). The
resolving power is thuB g'iven by the equation:
This gives the resolving' power:
(52)
n' (x)
=
V~f(~J + 2__.
2a
. ls a
It is realized that a resolving' power of this kind cannot be
defined, since. it ,also depends upon n" (x). It can only be
defined for the top of the CUl've where we have:
(63)
,
'r
n",(x) .= -,-'
2 a
A. great resolving power is thus associated with a narrow
horizontal slit, a large cell thickness, and a large active
distance 12 , With typicnl figures, l' = 0.01 cm., 12 = 80 cm., and
1
5
{t = 2.6 cm., we find a resolving power of 5.10- cm.The
mirror system recently introduced in this laboratory ha.s
12 = 200 cm. and a = 5 cm., . which correspond to a resolving
power of 1· 1O-~ cm.- 1
HA.NSEN (1940) agrees with the present author in the
conclusion that n, resolving power in terms of n' (x) cannot be
HARRY SVENSSON, ELECTROPHORESIS.
69
defined. He states that it must be expressed in d'l1, and
concludes that the focal distance of the Schlieren lens (corresponding to our distance lH) is without importance. 1£ this
opinion were correct, it would be as easy to detect a refractive
index gradient covering a distance of 5 cm. as one of the same
,d n compressed to a reg'ioll 0.05 cm. broad. All experience,
however, strengthens the view that the shal"per boundary is
much easier to discover, in accordance with equation (62).
b. The Least Measurable d 11. 1£ the method is used to
measure refractive index gradients, its resolving' power will be
defined as the smallest ,d n whose order of mag'llitude can be
estimated. It is plausible to identify the latt81' quantity with
that value of dn which gives rise to a curve whose own
area (due to its thickness) equals the area enclosed by it.
The area covered by the curve itself is obtained by integrating the area element d Ii = ,d Y d X = Gn d Y d x:
+00
(64)
u
= (in G.l la 1/ ~T~ tan () IV-I nil (x) I dx +
-00
+t d ,"
+
O2 G n G 4
l'
tan ()
I dx.
-~d,"
In the first term the integration can be extended over the
entire x-axis, but in the second it is necessary to choose two
limits that enclose practically the whole gradient, but not
more, in order to obtain a finite integral.
The first integration cannot be carried out without knowledge of the function n" (x). It is [Lssl1lUed, then, that the
concelltratioll function is that represented by a normal diffusion
curve:
:1,2
:1,2
'(
(65-66) n ;c)
=
,dn
---::--== .
2VreDt
-"Dt
c·
;
'1l
"()
X'
- ;c . ,d 1l
- '4-m
= --------./ -- -- . C
4Dtl reDt
If this is introduced, and if the su bstitutiOli
(fi7)
is carried out, we obtain:
.
70
ARKIV FOR KElIII,
In
+'"
(68)
lIIINEI~ALOGI
O. GEOLOGI.
~
n" (:t01 d:r
= l/~ I",d;/' 2·
BD
I~:}-l
'"
c-;
22 A.
N:O
10.
d~ =
0
-00
4
'1/2;;;'i d 1' (3)4"'
=2/
01'
0
r-'
Il
numerically:
+00
(69)
I 'lGT'l~r) j
d;);
= 2.1R8 V j;~.
-00
Hence the value of the integral is indepenc1ent of the shape
factor of the diffusion curve, which suggests that the result
is also valid for other than normal diffusion curves. If the
constant 2.188 f2 is shortened to 3, we thus have:
Division by the enclosed area g'ives:
(71)
If this ratio is put = I, an equation is obtained which, after
solving for d 11, gives the required resolving power. The solu-
tion is:
(72)
(
Vr.d- -n = -31/~J:- 1 +
2
a
1/
1
4'1'.dX) .
+ ----
Yl4
With typical figures for the constants, A= 5 000 A., a = 2.5 cm.,
r = 0.01 em., d x = 1 cm., l2 = 80 cm., we obtain a resolving'
power of .d 11 = 27 . 10-°, which corresponds to a protein concentration of about 0.15 pel' cent.
The only apparatus constants that influence the resolving
power are a and Z2' The influence of the latter is minor,
however, l2 = = giving the same order of magnitude (.d 12 =
18 ·10-"). If the term containing 7' and 72 , representing the
influence of the width of the horizontal slit, is omitted, we
find the simpler expression:
(73)
.d11
9).
= __ 0'
(t
HARRY SVRNSSON, ELECTROPHORESIS.
71
according to which the resolving' power varies inversely as the
celi thickness. Hence the only way to raise it is to construct
celis with a hU'ger thickness. With the mirror system recently
introduced in this laboro,tory, the active thickness has been
doubled without increasing the volume by allowing the Ught
to pass the cell twice. This gives a limiting resolving' power
of g. 10- G• Larg'e cells have to be used with caution, howevcr,
in view of the systemfLtical enol'S arising from the curvature
of light within the cell. These errors will be treated in the
next section.
HANSEN (1940) gives for the unmodified Schlierell method
a resolving power H times as great as that derived here. The
cause of this di screpancy lies chiefly in different definitions
of resolving power. HANSEN'S resolving' power is the least
perceptible .d n, while we have defined it as the least /III that
can still be measured with some precision. It is not impossible,
howevel', that there is some difference in l'esolving power
between the original TOEPLER method and its modifications.
It is remarkable that HANSEN found the same l'esolving' power,
A/a, for the interferometric method.
It is interesting' to study the relation between the sensitivity and the resolving power. The sensitivity may be defined
as the height of the curve for '}/' (x) = 1 and e = 45°; it is
(}11sa= G2G1l~a. Among these factors, only a and (to a
certain deg'l'ee) 72 are active in increasing the Tesoiving power.
'1'he magnification factors increase the thickness of the curve
as well as its height and its enclosed area.
Optical imperfections in the lenses and glass walls will,
of course, influence the resolving power unfavol1l'ably. The
same is the case with a marked light absorption, which
necessitates the use of a fairly wide horizontal slit.
The theoretically derived resolving power corresponds fairly
well with experience, yet the author has the impression that
still lower concentrations can be investigated. The I'eason
why the theory does not do full justice to the method is that
the thickness of the curve was identified with the distarICe
between the two first intensity minima in the diffraction
picture. Now, the exposure time and the method of developing
the plates are generally chosen so that the diffraction fringes
totally disappear, which results in nn appreciable recluction
of the thickness of the curve. 1£ a hard developer can be
used, the edges of the curve become more distinct, and it
is possible to trace the middle of the line with fairly high
precision even if the area of the curve is about as great as
the eucloserl area.
72
ARKIV leCiJt KEll1I, ll1INERALOGI O. GEOI,OGI.
BD
22 A.
N:O
10.
LAMJl1 (1937) has described a slit method to be used as an
ltlternative for the scaJe method, and has also observed in
this connection that the diffraction limits the resolving' power.
In oruer to incre:1se the latter, he pl:1ced ~L thin thread ill
the middle of the slit. This method has not been tested in
connection with the crossed slit technique. It might conceivably be of value, since the two methods are closely related.
This possibility will be discussed ag'ain at a later stage.
5. The Ideal SilItI1e of the Inclined Slit. Equation (50)
shows that the slit width depends upon the second derivative
Il" (x) in the cell. Now, a certain point of the slit is generally
passed by light pencils originating from different places in
the cell, which may also have different values of 11," (;:r). Thus,
it is generu,lly not possible to satisfy the condition (50) for
all points in question. For a re ular diffusion curve, however,
7
the two points with the same }7. (:r) have also the same value
for n" (;/:), except in sign, and in this case it is possible to
give the slit a form that in every point satisfies (50).
The desirability of a spool-shaped slit was found experimentally as soon as the method came into use (SVENSSON
1939). It was fonnd that the steeper pa,rts of the curve
required a slit width that made the other parts, especially
the base-line, very broad. As this tlecrea,sed the resolving
power considerably, a wedge-formed slit was constructed, the
light giving the base·line passing' through its end. FELL, S'fERN,
and COGHILL (19.:10) have moditiec1 LONGSWOWI'U'S technique in
that a slit is moved instead of the Schlic1'en edge, with the
result that a curve is obtained just as with the method described here. The base-lines of sllch pattel'lls are also broad in
comparison with the steeper parts of the curves. The modification introduced by STI!lRN and DuBOIS (1941), with a. slit
gTadually increasing in width during the movement, is completely equiva.lent to the technique with the wedge-formed slit
described in the paper cited above (SVENSSON 1939). A slit
narrowing off a,t both ends, useful in the crossed slit method,
has been constructed by BURNS and HENKE (1941).
As we now have an opportunity of calculating the ideal
shfLpe of the slit, it may be of some interest to investigate
the possibilities of maldng such slits. These depend on the
manner in which different parameters influence the shape.
To derive the relation between the slit width and the slit
coordinate y, it is necessary to eliminate :r between the equations (50) and (12) by the I1ssumption that a normal diffusion
curve according' to (65) is present. If (12) is solved explicitly
for x, we have:
H.A RRY
(74)
;1'
=
SVENSSON,
73
ELEC'l'}WPHORESIS.
Vr=-4;~ln _Z~IJ~~~;'t~~ 0'
which on introduction into (50) gives:
r-
(75)
_8__
sin
(j
=
1 :3 _).~ L
( - - .,
l"Dt V
-V
e -
_11 __
tlLn
--~-
I
------_- 2 !I
v;;Tit
n In ad 1l
tan
e
Let us now assume that the inclined slit forms the diagonal
of the rectangle illuminated by the normal and deflected slit
images. This should always be the case, for it is the only
manner of using the total image field of the camera without
losing an.v part of the curve. As the length of the slit images
is G 2 8, we have:
(76)
If Dt is solved from this equation and inserted in (75), the
vertical slit width is obtained as a function of :1// G2 s:
This equation completely describes the ideal shape of the slit
for an ideal diffusion curve. It is seen that it depends upon
two parameters, .d 11, which is constant in a given experiment,
and tan e, which varies with time during the experiment.
It would then appear necessary to constl'llct a two·dimensional
multitude of slits to satisfy the requirements of all gradients.
The number of ang'les need not be more than 8-10, however,
and the number of d n values about the same. It shoulc1
therefore be possible to satisfy all requirements with about
80 slits. This and i other technical problems ill connection
Fig. 1().
74 .Al~KIV lclil~
KEMI, lIIINERALOGl O. GEOLOGI.
with the inclined slit are further
section. The ideal shape of the
different values of d nand e =
narrows off very abruptly at the
the top of the diffusion curve).
nD
22 A.
N:O
10.
discusseu in the experimental
slit is shown in Fig. 19 for
0
45 • It is seen that the slit
lower end (corresponding' to
K SOUl'ces of E 1'1'0 l'.
1.
J<:]I'1'01'S
Due to the Hmited Ynlidity of the Equation
cZ = fa a n' (;:r).
a. Introduction. This equation, presented in the elementary
theory and constituting the basis of the whole method, is the
result of a series of approximations. An examination of the
SOUl'ces of error involved in the method must therefore start
with a consideration of the validity of this eqnation. The
theory of the deflection of light in the cell must be treated
in more detail.
The subject has interested many illvestig'ators, physicists,
astronomers, and ophthalmologists. An extensive review of the
relevant litel'ature was given by LAlIflIf (1 (37) and is therefore
omitted here.
A light pencil passing' throug'h tbe cell is deflected along'
its whole path and describes a curve within the cell. Let J:
be the height coordinate and e the coordinate along' the optical
axis; then the differential equation of the light path is:
(.l:.c
dz =
(78)
Here
(79)
(1
is the constant of
12
V~---
1.
(yJ -
SNELL'S
law:
cos a = 0,
from which equation (78) can easily be derived by eliminating'
the slope of the curve, tan a.
It is thus evident that the total deflection does not represent 11' (xl in a single point U', but in a certain interval
X 2 - Xl' The same is naturally true of other refractometric
methods; the aspect has been carefully considered by THovERT
(1914), LUfM (1937), and others. In the scale method, however, the resulting errors manifest themselves in diffuse scale
imagoes, a circumstance that does not al'ise in the present
method. On tbe contrary, conditions favouring the errors often
g'ive very sh::tl'p diagrams on the photographic plate. It is
HARRY SVENSSON, ELECTROPHORESIS.
75
therefore all the more necessary to study the errors involved
and, if possible, to evaluate their order of magnitude under
different conditions.
A simple consideration indicates that the errors due to
the CUl'vature of lig-ht within the cell may be appreciable.
Suppose that horizontal light enters the cell and that the
ang'le of deflection within the cell is a. We then have from
SNELL'S law:
(80)
whence
II =
(JI
+ LI n)
cos
= (11
(I
+ LI 1/)(1
-
i a~),
(81)
With CI = 0.03, a quite reasonable value, we have LI n=60 . 10-".
This means that a pencil, subject to the detlection mentioned,
has passl~d a refractive index interval of 60· 10- 5 in the cell.
In the ClLse of small g-radients, this interVlLl represents a great
part of the total refractive index change at the boundary,
and thus the deflection cannot be regarded as representative
of a single point.
From equn,tion (81) another interesting- fact is also clear.
For a given refractive index change, the ang'le of deflection
can never be greater than
(82)
a=
1
/ 1"2L1.'!l
-~,
!
n
since a pencil with this deflection has travelled through the
entire refractive index g-radient.
b. A More Exact Expression for tan rf. We shall start
from the equation:
(83)
where 01 and O2 denote the angles enclosed between the light
pencil and the horizon.tal line at the two walls of the cell.
If the angIe of inclination at an arbitrary point within the
cell is denoted by (/, we define the angle 0 by the equation:
(84)
whence:
sin
a=
!I
sin a,
(85)
Developing this expression into powers, we have:
76
o.
AnRlV l"i:iI: KEBlI, lIIlNER.A.LOGI
tan (j
(8G)
=
12
a
GEOr,OGI.
En
22 A.
N:O
10.
n 'J
(j -- a' .
;) lin -
+ --
Ijlo!' values of IX as large as 0.12, the second term of this
equation represents only one per cent of the first. As a is
a.l ways much smaller, the second term is without importance,
and we call write:
tan 0 = n ((.
(87)
We shall now regard Lan (j as a function of z and develop
it into powers of z. It is necessary to take the fifth power
of ,<} into account; tan (j has therefore to be differentiated
five times. As an aid in this work, the derivatives of a and
;}; with respect to z are given:
da
(88)
n
,
d:1:
--- =
dz
dz
t au a
'
where n' denotes the derivative with respect to :r. These relations are easily derived from the equations (78) and (79),
During the differentiation, n is regarded as a constant,
and, to facilitate the work still more, tan a is developed into
powers as soon as it appears. In fact, it is sufficient to replace tan a by a, for in every derivative terms of a tota.l power
(the added powers of a and the derivatives of 12) higber than
3 may be omitted. The development gives:
(89) ta.n
.l>
u
= tan
_~
Uo
,Z2"
+ z no + -:; 110
..
+ ,e,4 a
~4
0
CIO
zn (n~ 11~
+ -6
--
no
11/
+ no
(3 n~ }I~' + ?1~2) + 120ZO (3 n~2
no
110
n;;'
II~
.,)
aii
+
+ :il_?~~~).
no I
The n:s with dashes denote derivatives with respect to :c, a Ild
the subscript 0 indicates the position z = O.
Let us assume that the plane z = 0 is in the focus of tbe
camera; it is then quite correct that the derivatives '}1:" '11:;,
and n~' enter into our equations. The angle ao, however, is
not wanted, unless the plane z = 0 coincides with the back
wall of the cell, where a is known. Now, it is not .suitable
to focus the camem on the back wall, for the errors depend
upon the position of the cell, and the optimum is represented
by another position, as will be shown later. The angle ao,
therefore, must be eliminated u,nd ai' the angle at tLe back
wall, introduced instead.
77
HARRY SVENSSON, ELEOTROPHORESIS.
The relation between these two angles is obt:1ined from
equation (89) with the aid of (87). Here it is sufficient with
the third power:
(!:l0)
where .8'1 is the coordinate of the back wall. If [to is solved
explicitly, we find:
(91)
This expression has to be introduced into equation (89). At
the same time, however, we put z = 2'1 = t ' [ l and z =.2'2 =
= (1' + 1) a, and take the difference. These two values of z
are the two coordinates of the walls, a is the cell thickness
and l' a fraction between - 1 and 0 c1escribillg the vosition
of the cell in relation to the focus of the camera. We then
obtain an equation:
.
tan Oil - tan 01 = ana
(92)
+
~2
I' (/')
2
~J
asG
n~ ( [t _
1-
1
+
2
110
11~ + 110", (2
+ - j; (r ) [n~
--
[11 -
no
Il
s n no__
' ~20") +
+ ~!!_
aY!!J'_ .
1'_"_!!'"•_ no." a
110
.1
1
ra
2 a-n~
1
no
110
+ 1"2 an~2)] +
2
11~
"" + ~1_IJ_"2) +
+ E_df (r) (a _ r a no') (3 ~~
24
_a
fi
4
1
_ I' ( _)
+ 120 Jfi
1
1/0
no
no
(3 n~~ n~' + n~no11~2)
•
1lu
2'
which appears very complicated but will nevertheless provide
all information required about the errors uncleI' investigation.
The functions j(t-) are:
(93)
c. The Oase of Horizontal Light. If
can be reduced to:
(9.J:)
[II
=
0; the eqn[J.tiol1
78
ARKIV PC)R KErn, lIIINERALOGI O. GEOl,OOl,
ED
22 A.
N:O
10.
and the question arises how to choose r in order to attain
the best results. The second term vanishes for '1'2 = 'Iu, the
third is at a minimum for the same value, aud the last term
vanishes for 1,2 = '/5. As far as only shape errors are considered, the most suitable value should be 1,2 = l/~, i. e. the
camem should be foclCsed 011 a plane at the distance a/J/ 3 = (l,GS a
from the back 'IOall. In electrophoresis, however, the shape of
the curve is not of primary importance but it is necessary
that the top of the curve is not shifted along the X-axis and
t.hat the ellclosecl area is correct.
a. The ShUt of the Top of the Ow've. Let us assume that
the gradient CUl've is a normal diffusion curve:
(95)
We then have the relations:
(96)
/I
Xn,
,
n = - 2Dt
and
n
fI'
x2
-
2D t ,
=~~t~-n
if the top of the curve is situated at x = O. Thus the two
fifth-degree terms in (94), containing only even powers of x,
are symmet.rical about the axis x = 0 and are incapable of
shifting the top of the curve. The second term, however, does
this, and the shift is calculated as:
(97)
dx=
(3• 1,2
-
1) a 2 lim
'
6n
,
where 'n;", is the maximum of n'. This error is comparatively
small. With r = - 1 (the front wall in the focns of the camera),
a = 2 5 cm. and a -n~1 = 0.04, the top is shifted a distance of
0.25 mID. from its correct value. If the middle of the cell is
in focus, the shift is only 0.03 mill. (in the other direction).
The shift gives rise to a certain skewness of the curve.
(3. 'The Enclosed Ar'ea. The concentration measmements
are of great im pOl'tance in electrophoresis; the error in the
area is therefore of special interest. It is obtained by integTation of the last two terms in (94) from - 00 to + 00 (the
integra'! of the third-degree term is = 0, since it is a, centrisymmetrical function of xl. The integration, which is carried
out in the same wa,y as on p. 69, gives:
HARRY SVENSSON, EL1LCTROPHORESIS.
p =-
(!:l~)
79
(1 - ?,~)2 (d n)8 aU
-~------.
~"(j
D'
",F'iJ) (D t)""11""
n;
Ouriously enough, this error is = 0 for l' = - 1, which corresponds to focusing' On the front wall of the cell.
I'· The Shape Errol's. The diag'onal slit metIlod has never
been applied to di:ffnsion measurements, since there has been
no reason to abandon the scale method, which has been used
and found satisfactory in this and other laboratories for manJ
years. It should be possible to use the present method, however, if care is taken to prevent the shape errors from givingerroneous results.l As it is impossible to jUdge from the Curve
itself whether 01' not it is cOl'rect, it is necessary to derive
analytical expressions for the conditions under which the Clll've
is a true image of the gl'a,dient.
The only cell position that can be permitted in diffusion
meu,Sl1l'ements is that represelltecl by r = - 1/V3. This g'ives
the shape error:
([5 '}/'
'Jl!l2
+ ----,
(99)
270 n~
which can be transformed to:
a 6 (2 x 2 -
""
(100)
p=
3 D t) n'H
540n~(Dt)~
.
It has its maximum negative value at the top of the curve:
aU (d 11)3
P = - 1440 n 2 7]:"/' (D ttl"
(101 )
is zero in the points
in the points
X =
±
iC
=
± viJJlJ t,
;rr-/ 6" Dt,
1
passes a positive maximum
.
and finally falls off asymptotI-
cally to zero. The relative error at the top is:
(102)
a 4 (d n)2
If it be required that it [lot exceed one per cent, we find the
condition:
I Americllll workers have recently begun to IlSe LONGRWORTH'S scanning procedure for diffusion meusurements, apparently with success (LONGSwourII 1041; ROTHlo:N HJ40).
.')()
AHKIV FOU. liEnfI, 1IIINEI1A.T,OGI O. GEOLOGI.
nn 22A.
N:O
10.
0.040
0.035
0.030
0.02~
0.020
i:lTl
o
-~
80
(,0
120 1~O 130 220 260 300330360 400· 10
Fig. 20.
(103)
Dt>
V:- i
-.,a2 dn=
'.2 n; .))."
0.Hi8a 2 dn.
With a = :J.5 cm. and dn = 0.00185 (a 1 per cent protein solution), D t must be greater than 0.0183, which corresponds to
a diffusion time of one hour if D = 5· 10- 7 • 'l'he condition
is not very restrictive, It can also be put in- the form:
_--
(104)
I
an",
<
11- -; ;
0.8 f
_
~
1 d n - O. iT
V d-
n.
Thus, the greatest angle of deflection permitted is a square
root function of the refractive index increment (the concentration). The curve relating a n~t and d n is shown in Fig. 20,
From this it can be read that a 11:11 must not exceed 0,03 for
d n = 0,00185.
THOVERT (1914), using a simpler and not quite correct
method of calculating this error, obtained the constant 1,0
instead of the value 0,7l in equation (104),
d. The Case of Non-Horizontal Light, The illumination
of the cell with horizontal light reql1ires two Schlic),(,l) objectives, In order to spare one of them, arrang'ements have often
HARRY SVENSSON, ELECTROl'HORESIB.
81
been used with only one such lens and cOIlvergent light
through the cell. Under such circumstances, additional errors
appear, viz. the terms containing a l in equation (92). With
n (11 = 0'1, these terms can be written (j;" (1') is shortened tOj,IZ):
(105)
Here 0'1 is also a function of ;1':
(106)
where :Cn is the coordinate of the optical axis and 1 = l2 for
diverg'ent and = {3 for convergent light through the cell. If
n" and 11'" are also eliminated by (90) we have:
(107)
p
f
(1' _.
,t' )
= __(12~___;:;."
__ ':'J.l..
+ a'.
'}1' , •
3
j':1 '//'" ((;2 - .)... D_t)_(-r
-x )2
':"":' __ .:.Q_
+
~Jn2(DWl2
JnDtl
a 4 (3f! - 81'./;J (.-r2 - '2 D t) '11'2 Cr - :/'0)
+ -~--'-96 n2(n tjil-Z ,- ---.' +
+ a J (f,,1 -
b..,
r- J.{')
2
'" " (::c -
II -;1:-
)
,1;" •
96n2(DWl
(I.
1'he Sluft q/ the Top of the Oun:e. In the above expression, only the terms containing odd powers of x influence
the position of the top. Furthermore, the three last terms aTe
insignificant in comparison with the first. If this is combined
with the second term in equation (94), we obtain for the calcula tion of the shift:
(108)
The calculation is carried out by differentiation of the sum
of a n' and these two terms. The x-fuIlctions are developed
into powers, only the first degree being taken into account.
The Rhift of the. top becomes:
Addu fijI' kcmi, mincmlufli o. !le%Y'i. Ed 22 A. N:o 10.
6
ARlCIV
FOn
KEJlU, lIrINBRALO(lI O. OEOLOG!. ED
22 A.
N:O
10.
(109)
and C11n be ma.de to cancel only if ;ro = 0 (the top of the
curve is situfLted on the optical axis, where the light pencil
is horizontal). With the most unfavourable figures, ;r'u = 4.li cm.,
I = 100 cm. a.nd (lU' = 0.04, the error becomes for /' = - 0.[> :
O.OR mill.; for r = - 111"3: 0.06 mm.; for 'I' = 0: 0.65 mm.;
for I' = - 1: 0.67 mm. Hence the shift is appreciable when
one of the ",a,lls is in the focns of the camera, but negligible
when the central parts of the cell are in this position,
fl. '1'he Em:losed Area. The fLrea is only influenced by terms
in equation (107) with lLU even power of ;1], so we have to
sum these terms and integrate, As an aid in this work, the
following definite integrals are g·iven:
-!-e<>
j';1;2 JI' !l x = 2 D t d
II .
+""
Ir4
II'
d ;i; = 12 (D if d
II.
-cL)
-00
(110)
-00
After integration, reduction, and division by a d
at the relative error:
II,
we arrive
(111)
a 3 :co (2T -1) (1' + 1)2 dn
961i2-;''il~-1-(Dtr/"-'
-
The second term is negligibly smull. The first vallishes for
)' = -~, the third for l' = - 1. 1'11e first tel'ill is independent
of the position of the curve in relation to the optical axis
and of its shape factor. Since it is also independent of .d II,
the first term plays no part whatever in relative concentration
meaSl1l'ements. In absolute meaSUl'emellts, it is easy to apply
a correction; it amounts to about 1 per cent under standard
conditions.
It is concluded that, if only relative concentration measurements are concerned, the position of the front wall in the
HARR Y SVENSSON, ELECTROPHORIJ:SIS.
83
focus of the camenL is to be preferred even if cOllvergent or
eli vel'gent light is employed.
y. The ShalJe Errors. We will restrict this investigation
to the top of the curve n,nd to the cell positiou represented
by r = -.~. This is the most suitable position in the case of
convergent light, which is evident from equation (109). Equation (H2) is then reduced to:
tan
(112)
o.~ -
a=
tan
1
+
an I
as ['III
'11'11
+
"-""
---•
24
n
u ( 3 i!__~1l___
'" III
-!"___
1DOJ':'"0
-I-
'1/
III (
a 1 -I- all')~]
~
2n
+
I
"")
~.
" + ,'II"
,
'11-
From equn,tiol1 (10H), we know that this expression acquires
its maximum value for :r = - a2 n'/24 II if ;t' = 0 is the true
position of the top of the curve. Hence we insert this value
in (112) in order to obtain the height of the curve; we then put:
1/ (x)
JI"
= 1/'
(:r)
II III (:t')
(0)
+ ;t}l" (0) = 11;,,;
u" (0) -I- x n'" (0) = .'C n~:;
'" ;
= II III (0) -I- ,l'; II 1111 (0) = 11m
=
where the subscript rn means maximum. We then obtain:
(113)
The errol' is a quadratic function of the angle a l • It is at a
minimum where a1=-an;n/2n. Since C(~= +an;,,/2n, this
minimum errol' corresponds to that position of the top for
which the most deviated pencil describes a· path symrnekical
about the axis .:: = 0 (the middle of the cell). This has been
verified experimentally by LONGSWORTH 1; he has studied this
error on a two-salt boundary travelling through the whole
cell. Such a gradient has a constant shape factor D t because
there is an equilibrium between the diffusion and the sharpening effect (p. 22); it is thus ver.r suitable for studies of
convergence and curvature errors.
1
L. G.
LONGRWURTH,
personal communication.
84
ARKIV FOR KElIfI, lIlINERALOGI O. GEOLOGI. DD
22 A.
N:O
10.
The minimum relative error is:
(114)
I
If'
a ,1 'ilm"ll",
Q = fl7GO II~
7t
a 'Jim ),j
('
= ~880 )/2 (,1 n)~
It is very small. With all;n = 0.04 and d n = ] 0- 3 (corresponding
to a very sharp boundary: 2 V 2 D t = 0.05 CIll.), we have a
relative error of only O.l(j per cent.
The maximum relative error is obta,ined by giving CCI the
most unfavourable value, Z:. c. CCL = - L/2l, where l is again
= l2 or la. This corresponds to a gradient situated neal' the top or
bottom cell. With reasonable fig'ures, L = 8 cm" l = 160 cm.,
Lin = 10- 3, and an;n = 0.04, we have a relative error of about
2,7 per cent.
The errors are surprisingly sma,ll. It is interesting' to note
that the errol' (114) is 64 timcs smaller than the corresponding'
error for parallel, horizontal light (equation (102)).
e. The Influence of the Cell Thickness. We have found
that the errors can be expressed in terms of the maximum
deviation Om = a 11;". Thus, the greater the cell thickness (t,
the Hmaller IDtlst II;" and the greater the shape fa,ctor D t be
in order to make the e1'rors sufficiently snmll. An upper limit
for the cell thickness has not yet appeared, which is very
remarkable. Such a limit must exist, however, for the cell
canllot possibly be permitted to extend into the neighbourhood
of the inclined slit.
Tile reason why this limit has not yet appeared is that
the eqnation (83) is valid only for comparatively small cells.
In the case of cells whose dimensions a,re not small in
comparison with ltl' it is evident that the latter distance
requires a more exact definition than hitherto, as the question
arises frOID which point in the cell the distance has to be
counted.
To answer this question, we start from the exact expression:
(115)
d
=
LI x
+ l tan
O2 ,
where ,1 x is the linear vertical deflection within t.he cell and
l the active distance between the front cell wall and the
inclined slit. The llug-le 01 is put = 0, since this is the 0111y
possible value with large cells.
Let us assume that Is is to be counted from a plane at
the distance s a from the front cell wall; s is then a fmction
between 0 and 1. We then have l3 = l + sa and (115) can he
written:
85
ELEO'rROPHOI~ESIS,
HAHRY SVENSSON,
(116)
The deflection LI:r; within the cell is deduced in the same way
as were tan 0' and a, The result is:
In the case of parl111el lig'ht, we have fnrther;
(118)
tan
S
u2
= an
+
I
1 - 3 r2
'.
bn
3
a n
I
/I
It
+
+ 3 u '" + ---120'1,~~-a5n
25 r 4 - 101,2 + 1
'"
+ -15- - -J -2()10}'2
, , - - - { l n"n
n 2,
n"
,
j,4 -
/II
The a,clditional error due to the extension of the cell aTe
represented by the first two terlllS in (J 16). 1£ the expressions
(117) and (118) are inserted therein, the second degree terms
cancel if s is chosen = 1/2 n, The distance l~, therefore, bas
to be counted from a point a/2 n from the front wall of
the cell.
The remaining terms are;
(1 H))
d n ' 'II
"
'" 'Il '"
c; - 5")
j'
a 0 '1/"
= - a-'---- ("
-------,+
3
P
240 n
241/2
We divide by lalln' to obhtin the relative enol' and
talleously put }'2 = 1/3 :
1/
Q
(120)
() = _ a"
(,
12
241l~
.!!. _
l3
a
4
I
16
n
720 n
'If
S
,a
+
l;j
:1
a'
'/2
"~
a
240 1I,u 19
The relative errors derived earlier for a small cell are:
(J :H)
ot,-
·1
I
,II
01
1/0)
f!:_.!!...3!_
an"
DOn~ +270n~'
SillHll·
tI(i
ARKIV r,'i:il~
Kmn,
llllNERALOGI o. GEOLOaI, ED
22 A.
N:O
10.
Since a/In is in every case smaller than 1, the last two terllls
in (l~O) caunot apPl'eciably raise the magnitude of the errors
in (1 ~ 1). 'fhe first term, however, represents the essential
additional error due to the thickne~8 of the cell, and we
require that this errol' does not excee(l 1 per cent:
a 2 11 " a
')4 -21
(J 22)
-
II
<
0.0].
'D
Since Ji" is at a maxnnum in the inflexion points of the
diffusion curve:
If
(123)
'Jim
= ----,--dll
-_ - ,
--~--
2Dtl/ 27tc
we insert this value. If the smallest permissible value of D t
according to (103) is also introduced, we alTivc at the comlition:
(124)
a
f <
0.08
II
J
r--~--
1() ('
=
O.lill.
u
Since the order of magnitude of lH is 100 em., the cell
can thm be permitted a thiclmesf> of 5() cm. There is apparently no danger that ordinary cells are too thick. It is, iudeed,
surprising' that they can be enlarged so much. ThiH possibilit,Y
involves an tLppreciable rise in the resolving power; the use
of cells of great thickness would make possible measurements
of extremely low concentrations. Large cells, however, are
attended by great technical difficulties, especially in such
complicated instruments as an electrophoresis apparatus. They
have the a,dditional <lisadvantage of strong' light n,bsol'ption.
In cliifuRion measuremeuts, for which it should be pmisible to
construct cells of appreciable thickness, we have the disadvautage that an appreciable time JlJllst pass before the slmpe
errors disappear. This time increases as the S(1ua1'e of the
cell thic1mess.
f. The Possible Role of Total Reflection. In this treatment, the classical geometrical optics was uSfHnned t,o be applicable, anel SNETJJ/S IflV1' was Illade the basis of the calcuintiolll'i,
Now, GANB (1915) has showll, by II theory founcle(1 directly
on MAXWEI,L'S equations, that SNELl,'S law is only approximately valid in the case of medill with continuollsly varying'
optical density. Let us assume that the pencil Cllters the cell
with a small positive angle of incidence ({l Rncl that the 1'0-
H A RltY SVEN SSON, ELECTROPHORESIS.
87
fraction is gTeat enong'h to make a~ negative, According to
the classical g'eometrical optics, the pencil will then run h o1'iwntally at a certaiu level ;r in the cell, According' to GANB,
however, total reflection occurs a,t this critical plane, and the
real pn,th in the neighbourhood thereof differs from that given
hy SNF.!,]/S law.
A closer inspect,ion of GANS' equations shows that the differellce between the two paths is very small. With {{ = ;J,G cm"
the greatest derivative JI' (.:r) which is possible to observe by
the present method is n' (x) = 0,025, and the corresponding
angle of reflection at the critical phne is arc tan 250, thus
very near 90°; itt a distance of 0,03 mm, from the critical
plane the slopes of the two paths differ by only 2 per cent,
It is further evident from GANS' paper that the true path
reunites with the SNEr,L curve, -i, c. if there is a sufficient
distance between the point of reflection and the cell walls, the
angle of refraction is not in±1uenced by the limited validity
of SNELL'S law,
Luu[ (1928) also discussed GANS' equations and came to
the conclusion that the deviation from SNELL'S law is too small
to be of significance.
2. Errors dUll to OI)ticuI Imperfections in TjllIlSeS and Glass
Plates, If the optical system iH properly adjusted, and if all
components are optically perfect, a straight vertical line, which
we will call the base- or n:feJ'I'J/ce !-iue, is obtained on the plate
ill the absence of refractive index gradients ill the cell. The
line becomes diffuse when the diagonal slit approaches the
horizontal position, but remains straight and vertical. Badly
correctecl or unsuitable Schlil'l'cn objectives tLl1d insufficiently
plane g'lass plates goi ve rise to different figures on the plate,
depending upon the conditions. Wit,h a narrow cell, which
actR as a vertical slit, a curved base-line is obta,ined. When
the cell is shifted horizontally and perpendicularly to the
optica.l axis, the curve changes its form, It follows that, in
the case of a wide cell, the curve may turn into quite a large
illumilll1ted area with irreg'ular shape and irregular intensity,
a, The Schlieren Objectives. Let us assume that a pencil,
eros sing the cell at the distance x from the axis, passes the
SeltZ/e)'en lens at a point where there is an error J J in the
focal distance, This causes an error in the quantity d which
is calculated to be:
(125)
~ , <:'f_.f. (1'
d "r7 = ".',t'
+
(r' )
~
,
88
AH.KIV
Fi:iI~ KElIII, IlrINERALOGI O. GEOT,OGl.
ED
22 A.
N:O
10.
It is required that this errol' shall he smaller than the breadth
of the slit image. As this is equal to (}~ 1', we derive the COlldition:
J f
-< -- G.,?,
_---.
(12n)
f
;r(l + G-J
With reasonable figures for the constants, }' = n.O} em., a~ = ]
and x = !) cm., it is found that the relative errol' in the focal
distance must not exceed 0.1 per cent.
It should be pointed out that not only badly corrected
lenses give rise to curved base-lines, but also perfect lenses, if
they are used in a manner for which they were not COllsb-ucted. .A lens corrected for parallellig-ht cannot be employed
with a magnification factor of ], and a portrait objective
should not be used for parallel light. If such arrangements
are tried, the base· line acquires a regular S-shape, while lenses
badly ground or made of inhomog·eneous g'lass give rise to
more irregular base-lines.
From the above, it is evident that the first two fl,l'mngements
(Fig. 10, p. 49) require astronomical objectives, in the fourth
a portrait objective should be suitable, while in t.he third and
fifth arrangements, where the slit magnification is about 1,
symmetrical objectives should be preferred.
b. The Glass Plates. The light has to pass as many as
6 glass plates, viz. the two cell walls I1nd four thermostat
windows. If they are not sufficiently corrected, they will introduce errors similar to those resulting from bad 8dLlicJ'cJ/
objectives_
a. l'he Lens Action. The focal power of a glass surface
wit.h the curvature radius R is ('11 - 1)/R, Vi' here 'JI is the quotient of the two adjacent refr[Lctive indices. Now, we hl1ve 6
surfaces between g'lass and air and G between glass and "mter.
The total focal power of the fOl'mer is B/R, and it is required
that this be less than 0.1 pel' cent of the focal power of the
8chl/cron lenses. If the latter is put = l/o(), we obtain the
condition:
(127)
R> 1.8 km. I
'rhe demand on the surfaces between glass and water is somewhat more modest:
(128)
R> 450 Ill.
These claims represent a rather high optical quality and an
appreciable cost. They are, 11OWeVel', derived under the assump-
HA Rlt Y SVENSSON, EL1~C'l'ROPHORESIS.
89
tion that all radii [Ll'e of the same sigll, which is naturally
very improbable. This high degree of precision should there·
fore not be necessary, but the radius of curvature sbould not
be smaller than 500 metres for any surface.
It is still an unsolved technical problem to make cells of
such high opticn'! verfection. The cells used up to the present
in this country have much gTeater errors, which involve much
trouble and !1uditiollal work.
fl· The Prism ."iction. As will be described in the nex.t
section, the base· line is reproduced together with the gradient
curve by permitting a fraction of the light to })ass beside the
cell. An undesirable prismatic error in the cell walls causes
an erroneous position of the gradient curve in relation to the
base-line. We ag'ain require that the deviation of the slit
image due to the prismatic effect shall not exceed the breadth
of the image itself. Hence we have the condition:
(129)
The order of magnitude of the highest permissible prism aug'le
is 0.0002 01' 40".
'rhe refracting edge of this prism has to be assumed to
be horizontal, but it mav also be vertical 01' inclined. In I'mch
cases, which have also been met with, the slit images originating from the cell are shifted sideways in relation to that
coming from beside the cell. This decreases the image field
in the camera, but does not g-ive rise to systematical errors.
Prismatic errors in the thermostat windows are not so
dang-erolls, since they give the same deviation to the curve
and to the base-line. In fact, very large prism angles are permissible if monochromutic light is used. For white light, however, a limit is set by the demand fot' negligible chromatic
dispersion.
c. The Camera Objective. Portrait objectives are generally
employed with fairly good results. The ideal objective for
the magnification 1, however, is a symmetrical objective consisting of two astronomical lenses. The suitability of the
camera objective should be tested by checking- tha,t the magnificution factor is constant througbout the cell.
d. The Cylindrical Lens. It has been, and still is, extremely difficult to obtain a suitable cylindl'ical lens. Only a
few firms in the world have facilities for grinding corrected
no
AnKIV FciR KE.IlIl, IIrINElULOGI O. GEOLOGI.
BD
22 A.
N:O
10.
cylindrical lenses, and it has beeu illlpo~~ible during' tho war
to corne into contact with these firms. The author was therefore obliged to find the most suitable simple c.ylindricnJ lens.
Thl' smallest errors are obtn,illed with the Illagnification 1
mlCl with ::t sYIIlmetrical, biconvex lOllS. The errors decrease
Rtill more if a lells system cOllsisting of two plano-con vex
lenses is employed. Such lenses are llOW under cOllst,l'uetion;
to minimize the chromatic errors, they are beillg' made from
a val'iet.y of glass with especially low chrollHLtic dispersion. I
F. Description of' the Optieul Co III Ilonentl".
1. Al'l'ang'clllcnts with Jjcnses.
a. The Light Source. The choice of lig'ht source depends
l:.tl'gely upon the chromatism of the optical system_ If sOllle
of the lenses are not chromatically corrected, monochromatic
light is necessary. Sodium or mercury va,pour lamps are then
very suitable. The former produces only one spectmlline, the
D line, and needs no light-filter, The lamp tested in this
laboratory was not very powerful, and the impossibility of
obtn,ining colours other than yellow is n, distinct c1isadvanbge_
The sodim11 vapour lamp has therefore not been extellsively
used.
The mercUl,), vapour lamp, type »Philoru, HP SOO», manufactured by Philips, has, on the other hand, been much employed_ It is to be recommended, especil1lly when monochromatic ligbt is required_ In combillation with different lig'htfilters, wbich are mu,llufactured especially for this lamp by
diifel'ent optic[Ll firms, the lamp is able to transmit yellow,
g'l'een, violet and even redmonochl'omatic light. The intensity
is g'ooel, especiuJly that of the yellow line. 'l'be bm p must be
surrounded by a housing which prevents stmylight passing'
into the room.
Since the Philora lamp hn,s u, vertical discharge tube, the
second illuminr:ttion arrang'ement must be employed (p. 59)_
With [I, sufficiently IrLrge lamp magllificfLtion OJ, one limb can
be totall.y illuminated, but owing to the small horizontal extension of the mdiant tube, OIlly one u,t a time. For illnmilH1tion of the other limb, the lamp has to be shifted perpendicllhrly
to the optical axis, or is simply turned l1 little n,bont the
optical pin of housing'. Since there is a considerable distunce
1
For helpful adviee in this [Iud other optical queAtiom" the lIuthor
iH
Illllch indebted to Mr. E. VOGL, Sl'e~wTc(t AcTmmllZ(ltor-AR. Jnnqner, Stock-
holm.
H~ RI~ Y BVENSSON, ELEC'l'ROPHORESIS.
91
<;~\:::.">1
.
,
'-{'.
_,;."
Fig. 21.
between the photogruphic plate and the lamp, the necessity
-of shifting the latter is very incon vellient. This is the greatest
disaclvantag'e of the second illumination system.
Incandescent lamps should only be usecl in combina,tiol1
with achromatic 8t:7i1ieren lenses or with light filters transmitting' narrow wave-length l'!111ges. Two types are possible:
tung'sten blLnd l!Lmps in combination with the first ilhul1ination n,rnl1lgement (p, 68), and slit lamps with a sillgle, l011g',
stretchecl filament, used alone (third illumination al'l'angement).
The author has tried to use slit lamps. In order to avoid
II curvature of the filament, the lamps were bUl'Ilt in an uprig'ht
position, but two small pieces of vlane mirror were arl'al1g'ed
so as to give a horizontal virtual image of the filament (Fig.
21). Such lamps were not suitable. The light intel1sit,y obtained
with them could not be compal'ecl with that given by the mercury lamps, ancl they were shortlived and expel1sive.
9~
ARKIV FOR KEJlU, JlIINERALOGI O. GEOLOGI.
ED
22 A.
N:O
10.
h. The Projection Lens. This lens should be spherically
aud chromatically corrected and have a focal length of 5 to
10 em. The author has found commercial projection objectives
quite satisfactory. 'rhey are relatively cheap.
I n the second illumination arrangement, it is often difficult
to find a suitable projection lens. The lam p·magnification must
be htrg'e enough to illulllinate the whole cell, and the lens
small enoug'h to be lliaced as close to the lamp [ttl is necessary
for such a magnification. The calculation made in this labora,tory for an actual case showed that only a small range of
focal length could be permitted.
In the first illumination arrang'ement, the necessary aperture
angle to the right of C is v = L/l 2 • By considering the diameter
0, the focal leng,th in and the magnification factor (-i1' of the
projection lens, it is possible to derive its required lighttransmitting capacity:
(130)
°
In
,L(1
+ al)
l~
With L = 10 cm., G 1 = 2 and 12 = 80 cm" we have 0/fn =
= 1 : 2.7. This is a considerable capacity, and [1 light source
of great horizontal extension is therefore desirable in order
to keep the magnification G 1 sufficiently small.
c. The Horizontal Slit. The slit used in this laboratory
is shown in Fig'. 22. The slit length is 5 em" and the lower
edge is movable to give different slit widths r.
d. The Schlieren Lenses and the Thermostat Windows.
The demands made on these components have alreILdy been
discussed. In our instruments, the thermostats are equipped
with four rectangular windows, the double windows being'
necessary in order to avoid clouding on the glass in contact
with the cold water. The windows have an appl'eciable lllagnitude and their precision-grinding' could therefore reasonably
be omitted. In the new type of thermostat, which is now
manufactured by LKB-Pl'oduktcr Fabl'iks-AB, Stockholm, two
circular windows, 10 cm. ill free diameter and g'l'onucl accOl'cling to the requirements on pp. 88 and 89, are mouuted
towards the W:1ter. The outer glasswindolVs are omitted and
replaced by two astronomical objectives of the same free diameter, acting as Schhcrcn objectives (el LONGSWORTH 1939, b).
This arrangement has many advantages. It reduces to a minimum the glass areas which require precision-grinding; the cost.
of this grinding is not high. The Sehlie1'clI lenses need no·
HAHny SVENSSON, ELJilO'l'IWPHORESrS.
93
.J'.
4'
("".
..•...
~,<."-:-::
.
Fig. 22.
optical benches and riders, but have nevertheless their }Jropel'
a,lld well· defined positions in screw-mountings. The omission
of two glass-plates reduces the losses in light intensity due to
retiections. Finally, the arrangement with one Schtz:eren objective on each side of the cell is no doubt the best of all, as
already pointed onto
e. The Registration of the Base-Line. The light passing
through the cell gives rise to the gradient curve, which relates
the quantities n' (il::) and x. If a fraction of the light is allowed
to pass at the side of the celi, and if the optical conditions
are perfect, a vertical straight line is obtained in addition to
the curve. This is the base- or reference line, which is of
great value when the plates are to be integTated for concentration analyses.
!J4
ARIUV I"OR KEJlII, MINERALOGI O. GEOLOGI.
ED
22 A.
N:O
10.
Fig. 23.
In the case of insufficiently corrected Schliel'f'1l lenses and
glass windows, the base· line becomes 11 curve instead of It Rtl'l.I.ig·ht
line, fLnd the gradient curve is correspondingly affected. Th!'
integration between tho curve :wd the baso-line, how('v€'l', gives
an automatic COl'rection for these e1'1'01'8, provided that the
lig'ht g-iving the base-liue is passed as near the cell as possible.
On the other hand, all iw;ufficient cOl'rection of the cell
walls is not compensated by using a, hase-line from outside
the cell.
Fig. 2;3 shows a diaphragm which is fitted all the U-tube
stand behind the cells. 'rhe lllai n plate has fotll' vertical slits
3 mm. wide, the outer l)ai1' fitting to the U·tube limbs and
the inner pair to tho space between the limbs, as close as
possible to the cells. The distances between the outpI' ond
inner slits are thus equal to the thiclmesB of the cell walls,
HAR,RY SVENSSON, lGLEC'1'R01'HORESIS.
95
3 mm. Another plate has two vertical slit.s. These are 9 mm.
broad and at such a distance fl'om each other tJmt, when one
of them coincides with the right hand slits of the first plate,
the other does not coincide with the left hand slits, and 'Vice
versa. The second plate glides over the first plate and can be
moved just the necessary distance by turning an excentric
disc. In this manner, the desired limb of the U-tube can be
opened or closed for the light by a simple rotating movement.
'1'he base-line, originating from the two iuner slits of the first
plate, Cl1n be obtu,ined with the required intensity, or completely omitted, by regulating' the width of this slit. Finally, for
an intermediate position of the second plate, light passes
through the two outer slits, but not through the inner ones.
The result is that the gradient curves of the two limbs appear
superimposed on the photog'l'aphic plate, but without base-lines.
Such a position is sometimes convenient when making readings,
f. The Diagonal Slit. The type of slit hitherto used is
shown in Fig. 24. It can be rotated to g'ive slit angles ()
between - 90° and + 90°, IV hich can be read on a circular
scale. The slit width Cltn be regulated by the micrometer
screw A, and the whole slit can be shifted sideways b.y means
of the slide arrangement B. Wi,th the edge O. it is possible
to make a wedge-shaped slit, the wedge angle being read on
the scale D. The parallel edge E must then be moved COillpletely behind O.
The normal and deflected slit images form a rectangular
field in the plane of the inclined slit. When an exposure is
to be made, the slit should be adjusted to form the diagonal
of this rectangle. This ad.iustment is a fairly complicated pro·
cedure consisting of the following' phases: 1) the determination of the most suitable slit angle; 2) the adjustment of the
weclge angle; 3) the a,djustment of the height position of the
slit; 4) the adjustment of its lateral position. If the bright
rectangUlar Held is visible, the adjustment is easily made, but
this is often not the case. The adjustment would be simplified by allowing the centre of rotation and tbe apex of the
wedge to coincide with OIle C01'11er of the normal slit image,
which always has the same position. The adjllstments 3) and
4) would then be omitted. Such a slit would, however, be more
complicated to build and would certainl,Y appear very clumsy.
The problem of constructing a slit which was easier to
handle became especially urgent after the deduction of the
form of the spool-shaped slit (p. 73, eq. (77»). Such slits can
be drawn on an enlarged scale, reduced pbotogmphically to the
desired magnitude and, if necessary, etched in aluminium :foil
gG
ARKIV FOR rCltiJlII, lIIINEUALOGl O. GEOLOOI,
llD
22 A.
N:O
10.
Fig. 24 a.
by some gTallhical -procedure. Experiments along: these lines
have been stltrted, but it is impossible for the momollt to flay
whether such fixed slits will adequately re plnce the aJj ustlLblc
slit now in 11SP. It se8IUS impossible to use the negatives of
the photographically reduced <1rawing's.
If the expel'imputs were successful, lllallY advantages woulu
be galueJ:
1) It would be possible to m,e the spool-shn,pe requirell
from the theory of diffraction.
2) All adjustments would be eliminated; tll(' observer neeu
only choose tllp most suitable slit and place it in its holder.
3) The readings of the slit and weclg'e angles woulJ be
unnecessary. The sliti-l are suitably drawll with a serieR of
convenient values of tan 0, which are printed on the slits.
4) It would be possible to increase the reHolving power by
lIA l~R Y SVENSSON, ELEC'l'ROPHORESHl,
(hawing' Hliis with a thin central thread. aecol'ding to
97
LAlIll\[
(19:37)
r)) The manufacture of fixed slits on a large Reale is
casier and more economical than that of adjustable slits
according to BURNt! and HI',NIUG (H)41), Tho neeessary number
of slitH can be drawn in one or two days, and the subsequent
photog'l'uphie and chemograpLie procec1ures [ll'e adavtablo to
production on a large scalp,
g. The Plate-Holder and the Reading Device. .A new
type of reacling arrangement is shown in Fig', 2:>, The curve
falls upon a piece of g-lass, opaque over the gTeater part of
its stu'face but refieciil1g ovcr a narrow vertical band to the
right, A thin, horizontal metal thread is movable vertically
und made to coincide with the top of the CUl'V8, the eye behlg
held in such a position that the thread and its reflected image
Arlciv for ',oni, nmlelaloyi
0, geoZml1
Ud 22 A, No 10,
7
\18
ARKTV FOR KElIlI,
llnNm~ALOGI
O. GEOT,OGI. nD
22 A.
N:O
10.
""'...
Fig.
~;).
coincide. 'fhe position of the top is then reud on a fixed
millimetre scale to the left (or to the right). This rea(lil1g
device is very convenient 1111c1 [LCClll'ute. vVhell UHYlllUlctricld
peaks lLl'e to be read, it is incorl'ccL to measure thc position
of the top; the reading' should infltead be made all a line
biscctillg the enclosed area (LONGSWOl~TH 194:Z). The l'eat1ilJ go
device described above is very suitable fo), such h011l1l1nrim"
as well as for symmetrical bouwlaries.
2.
~Iil'ror
Arran gem en ts.
Ever since the first developmont or the cl'osflecl-slit teclllJi(lll(',
it has been very difficult in this country to obtain IpIlseR of
sufficiently good correction. This was especially tho case with
the Schlieren objectives and the cylindrical lells. These difficulties were due to the appreciable length of the U-tube und
99
HAltRY SVENRSON, ELECTROPHORESIS.
to the fonner practice of using' only one Sehlier(!l1 lens and
convergent light through the cell. The latter circumstluwe
appreciably increased the necessal'_Y diameter of the objective.
In the year 1943, AS1'RUP and HEI,M built au optical system
with a concave elliptical mirror instead of the Schlicren lens
and reported much better results than before. Even in this
system, however, the diameter of the mirror had to be much
larger than the height of the cell, and the precision-grinding
of an elliptical surface was rather expensive. In the same
year, the firm Helhge il~· Co, ]i'rcibu1"(J im Breis_quu, Germany,
sent a spherical concave mirror to this Institute and sugg·ested
that it be used to replace the Schliercil objective. .A. mirror
-.,-.
c
Fig. 2G.
arrangement for the observation of the sedimentation in the
ultracentrifuge was described by FRAN CE [11lC1 LANG (H141) (cf
STJiJRN (1943)) .
.A. spherical mirror has only one precision-ground sllrflLce
and is thus much cheaper than a chromatically and spherically
corrected lens, which it may replace if properly used. In
Fig. 26, the points 0 and 0' lie in corresponding Gaussian
image planes, and we consider the path of a pencil that is
reflected by the mirror at a distance from the centre defined
by the :mg'le 1fJ. 0' is not the Gaussian imag·e of 0, but the
point of intersection of the pencil in question and the G~1USS
ian imag·e plane. The distance between 0' and the Gaussian
image of 0 is therefore the focal errol' due to too large angles
(J [md 1/). For this errol', the author has derived, from equations aVlLilable in optical textbooks, the following expression:
(131)
r + {3 =
1 + (; 1jJ 1jJ ( ~-,
1-(~
{3)
(1- +--_,a 11' 1-(:~~
21q) .
The angles have to be regarded as positive if the lines rise
towards the right, and vice verS(t. The magnification factor is
100
ARKIV POR ITEMI, MINERAl,OGI 0. GlDOLOGI. ED
22 A.
N:O
10.
positive for an upright, negativo for an inverted imag'o. 'rhe
formula holds for small ang'les. The error is at a minimum
for a IIUtg'nification factor of about - 1, i. e. when the object
and its inlltge lie in the same plane through the centre of the
sphere. In this case, we Lase the simple equation:
(132)
'l'he slit and its image may easily be placed as little as
4: cm. ap rLl't , hence (J = 0.01 for a minor with ~OO em, radius
of curVl1tUl'e. As 'l'ISEJ,IUS' U ·tube iH 8,1i cm. hig'h, 1/J becomes
O.O:!] ii, and the ang'ular errol' r + (1 = O.OOO.OOL3. By multiplying'
this by 200 cm., we find the linel1l' error in the focusing of
the slit: .J d = O,OOll.KG cm. There is evidently 110 risk of obtaining an excessive spherical aberration with U = - 1; the
errol' clel'ived above is smaller thnll might be expecteJ from [l,
lens with perfect spherica.l correction.
rrhe complete achroIDlLtisUl of a mirror is l1 further l\dv!1ntage
of great importance. Achromatic objectives lLl'e calculated to
give the same focal length for t.wo distinct Fraunhofer lin8s,
e. {I. the 0 and F lines. In the wu,ve-length region betweell
them there are chromlLtic errors, while in the extreme red and
violet reg'ions the chromatism is often so g'l'cat that the use
of lig'h t·filters is necessary.
The repllLcement of the cylinclricallens hy a conCI1VH mirror
would be still more flLvourable owing to the considerable
spherical and chrollllLtic aberrations of the lenses hitherto
used. The spherical aberl'l1tiOll of such a cylindrical mirror
would perha.ps be 10 times gTeater tlH1l1 the figure mentioned
above on account of the smaller radius of curvature and
the necessity of using a larger [Lngle (J. It would nevertheless
be unimportant.
The question theu arises if even the last lens, the camera
obj ecti ve, may not be replacell by ~L mirror. This must, in
fact, be done if a cylindrical minOT iR introduced, for this is
the only way of having' the ph1te ill lL convenient position for
the observer.
The most suitfLble a1'l'angement with concave spherical
mirrors would thns be that shown schematically in Fig'. 27,
~i
._. _._. -._._. _-.-.
c
Tsp GH
_·-·-·-·G-~~~~~~=·:-;·:~·:=::·:_=·:~·(~:~·j~-·1
I
Fig. 27,
K
If ARRY
I'> VENSflON,
IJLnCTROT'HORBSIt:!
101
In order to make the spherical aberrations as
1'>1110,11 as possible,
ull three mirrors are used with a magnification of about unity
'rhe cell is placed close to the mirror D, and the diag'onal
'llit clo~p to the mirror H. Tho plate holder K must be p1acel1
a suitable di'ltance behind the latter, bence the cylindrical
mirror I is allowed to give a sompwhat enlan;ed ima~e (a 1 =
1 2;) 0 is the hori~ontal slit 1t is placed below the optical
i,
•
,
t~
I
,I
FIg. 28
axis of the mirror D a,t 'luch a di~tal1ce that there is sufficient
:-Jpa,Cfl for !1 lineal' deflection d of 4 to 5 cm.
U nfol'tunately, thp precision -ground CJ lin dl'ical mirror 1'equirel1 in this !1l'rangelllcnt could not be supplied under the
prevailing conditions. The llse of a mirror clo<,e behind the
cell was nevertheless tried, but in combination WIth an ordinar'y camera oblective anl1 c:y1in(11'ic01 Ions. The minor wa<,
cut to a rectangular sbape and built into a metal housing'
with fl, plane glas'3 plo,te in front (Fig 28). The experiences
made with this armng'emellt have been partl}, but not exclusively, fa,vourable The faot that the light passes the cell
twice, coupled with the cOllsiderable magnitude of the distance
72 (~ 200 em), increases the l'f'solving power Substances can
Le investigated at much lower C'oncclltrn tions, which is of
value with regarcl to the bounrll1l'.Y Hnomalie:;. The advantage
of complete achromatism haH alreatly been poillted out
10~
AHKIV FOn I\ElIIl, lIIINERALOGI O. GEOLOCH. BD
22 A.
N:O
10.
Since the light necessfLrily lmsses the cell at two different
points on its way to and from the mirror, this alTlLllgemellt
llifLy a[Jpear dang·el'ous. The tlleol'ctical deductions on pp.
7J-Sli have shown, however, tha.t even the light dcviatioll
Tf~sultillg from one passage of the cell represents It' (:x:) over a
certain interval and not for a sillgle point. '1'he errors proved,
however, to be very small under standard conditions. The
distance between the mirror i.1nd the back celt wall has been
made as small as possible (the optical Jistn.llce = 3.3 cm.). A
simple calculation shows that light tlmt is not deflected passes
the cell in two intervals O.fi5 mm. apart. As the light source
is sitl1ateu below the optical axis, this distance diminishes
when the lig'ht-deviation increases, i. e., the errol' in qnestion
is at a minimulll at; the tOlJ of a curve. The author has
established on only one occasion, when a very small but extremely sharp gradient WlLS under observation (a,n alltigenantibod.y complex with practically no diffusion), that this e1'ror
is able to cause a single boundllry to appeal' double in the
ca,mel'a. Under standard experimental conditions the error is
insignificant and camlOt be detected as a deformation of
the curve.
There are other circulllstances, however, th[tt Ill[tke the
mirror arrangement less favourable. One consists ill the reflections given by the therlllostat windows. These give rise to
straight, oblique lines cutting thE' base-line and the gradient
curve. They can be removed by giving the windows a small
angle of inclinn,tion sideways, so that the l'effected lig'ht does
not enter the camera. This is simpler than to extinguish the
re:8.ectiom; by interference (BLODGE'l'T HJ39).
Another disnd vantage is the low light intensity that makes
the arrangement unsuitable for opalescent and darkcolol1red
substances. This drawback, however, is partly compensated
by the higher resolving power, which permits a greater dilution. The use of infm·red light for opalescen t solutiolls
(Tl~EFFERS and MOORl'; H141) has not yet been tried.
On the whole, it ean be stated that the mirror arrUllgelllent is favourable in many respects, but inferior to arrangements with achromatic lenses and hOl'i7.0ntal light throng'h
the cell.
G. rrhc Adjustment of the Optical I-Iystem.
The theory presented carlier has shown that only the cell
thickness a, the distance lo und the slit width r influence the
resolving pOW81', and 72 ~ncl }' only to a small extent. The
HAIWY
ElVb~NSSON,
ELECTROPHORESIS.
103
risk of choosing' lenses, or of making the adjustment with
given lenses, in a way that does not o'ive the hio'hest possible
. power, is thus small. The "
'"
resolvmg
choice
of lenses and of
magnification factors must be dictated by other considerations.
We huvt'~ already pointed out that the best arrang'ement in
Pig. 10 is thfLt which gives parallel, horizontal light through
the cell. When the adjustment is beillg' mude, the following
requirements should also be kept in mind:
1) '1'he cell magnification all should suit the available
plates. The imag'e of the cell must not, of C0111'se, be larger
than the lJlate, hut it should not, on the other hand, be much
smaller, leaving a large part of the plate unemployed.
2) The slit magnification factors O2 and GJ should also
be chosen so that the resulting breadth of the image field at
K (_b'ig. 10) checks with the breadth of the plate.
3) The light intensity should be kept reasonably higb.
Equ[Lt.ion (31) shows that an unnecessary enlargement of 12 , In.
G3 fLucl (/1 must be avoided.
The firm LKB-Produkfer Pauriks AB, Stockholm, noW
delivers the optical components required f01' the arrangement
mentioned above. The datfL for the lenses anel slits are slIch
that the three above-mentioned req'uiTements ltl'e reasol1Ubly
satisfied. Thfl heig'ht of the picture in the camera becomes
about 9 cm., its breadth (the height of the curve) about 5 cm .
.A. cletailed description of the optical adjustment is given below.
It is assumed that the arrangement with parallel light has
been adopted, but the description should be of value even for
arrangements with convergent light through the cell.
1) '1'he Sch11:eTen objective D is put in its proper position. If
it is not mounted directly on the thermostat, as in the LKB
instrument, its heig'ht must also be correct frOID the beg'inning'
(the centre of the lens at the same height as that of the
U-tube).
2) The illumination system is chosen in accordance with
the lamp available (see pp. 58 and 90). The horizontal slit
(or the slit lamp in the third arrangement) is placed appl'oximately in the focal plane of the lens D. The other parts of
the illumination system are placed according to Figs. 14 and
15. The whole vertical extent of the Schlie1'en lells must be
illuminated.
3) If the light beam to the right of D converges or diverges vertically, the position of the slit is adjusted until the
beam passes with a constant vertical extension throug'h the
whole Toom. The slit is then situated exactly in the focal
plane of D. The lamp and the projection lens are readjusted.
104
ARKIV F(iR KInII, llIINT.;H,ALOGI o. UIWI,oriI. llD
22 A.
N:O
10.
4) The borizontal slit is put lLt the pl'oper height, making'
the light be:1111 to the rig'ht from D CX:1utly horizontal. If
necessary, tbe heights of the lamp and the projection lens are
adj ustecl.
0) The second Sc1tlic}'clZ lens _B' is put in its p}a,ce, at the
sante height as the cell and the lens D.
Ij) '1'he thermostat is tilled with water of the kind and
temperature to be used in the experiments. The cell stand is
put in its propel' place ill the neighbourhood of the lens F.
7) The plane on which the camera is to be focused (the
middle of the cell ill the case of convergent lig'ht; the pllLne
represented by 1'~ = LIB in the case of parallel light; see tbe
theory, pp. 7-1-80) is made visible by a thread or the like.
8) The diagonal slit is placed in the image plane of the
horizontal slit, and the camera objective close behind. In the
LKB appll,ratus, the btter consist.s of two astronomical objectives; the slit is then suitabl.v placed betwt'en these lenses,
and the whole system is shifted along' the optical axis ulltil
a sharp image is formed on the slit.
9) The diagonn,l slit is removed, n,nd the back-piece of the
cn,mera, is placed exactly in the imag·e plane of the thread in
the cell stanel. This l1djustment canllot be made with sufficient.
accuracy if the camera objective is screened off by the slit,
which n,cts I1S It eliaphragm incrpl1sing the focn'! depth.
10) The camera, bench is clLutiously shifted sillewarcls until
the light bel.m coming from the 8chlie}'{']/ lenses TlltSfles cenb'ally through the camera objec,tive and the back-piece. If
necessary, readjustments of the diagollal slit and the backpiece are made.
11) The thread in the cell stand is removed, and a cell
is inserted in its placc. '1'he camera objective is put as low
as possible without cutting off liny part of the light beam.
The heig'bt of the back-piece is adjusted so that the whole
image of the cell is visible.
12) The diag'onal slit, with 8 = 0, is ILgain put in position.
The cylindrical lens (LKB-Prodllfct('1' delivers a double lens) is
shifted along' the optical axis until a sharp image of the slit
is formed on the plate. 'fhis is possible with two different
positions, one giving an enlarged, the other a reduced image
of the slit. The most suit.able position is chosen. It nllLy also
happen that no sh~rl) image CI111 be formed. In Auch a case,
the distance 74 = Gl( haA to be enlal'ged in some way, and
the adjustment mnst be partially repeated. - If £I, circular
cylindrical lens is to be used (LKB-Pl'odn!.:fI]1·'''' lenses are
rectangular) its axis must be I1djnsted to }1 vertical position
at the same time as the n,djustll1ellt 12). The lens is rotated
HA.gl~Y
SVF.NBSON, I~l,lW'l'ROPHORESIS.
106
ill its hold~l' until the sharp imag'e on the plate becomes
exactly vmt.Ica,L
The a,c1jllst.ment is now complete, but it is advisable to
make the following checks:
13) 'l'he difLg'otml slit is l'emovec1, and it i8 confirmed that
the bright field on the plate is symmetrically situ\:Lted. It this
is not the case, the C[Lmera. bench has to be shifted to the side.
14) The inclined slit, with e = 85°, is iusel'ted, and the
di:1phragm ill Fig. 23, p. 94, is placed on the cell stand. An
inclina tion of the line on the screen indicates that the two
slits have not (Iuite correct relative posit.ions. The horiz'ontal
slit is shifted a little a,long the axis until the liue on the
plate becomes exactly vertical. A curved line indicate,; that
there are optical imperfections somewhere in the system (see
p. 87).
16) This check is only necessary if the second illnmination
arrangement is employed. The diaphragm mentioned in 14)
is used here also. It nuty happen that the slit image at the
diagOlllLl slit deteriorates when this dia,phrlLg'lll is inserted,
becoming too shOl't, with low intensity at the enos. In such
a case, the projection lens is not exactly focused on the
dia,phragm, which can be corrected by slightly adjusting' the
position of the lttrnp. If it is not possible to obtain an iIflfLg'e
of the lamp on t.he diaphragm, the projection lens is ullsuitable (cf. p. 92).
n.
]~xllcrilllelltal
Oetel'millation of Apparatus Constants.
1. The Active Distance lB' In optical arrang'ements where
this distance is equal to the optical distance between cell and
dia.gonal slit (Fig. 10, p. 49), it should preferably be measured
directly. In cases where lenses are sihmted between the cell
and tl~e slit, 7n must be determined experimentally.
The best method is to place a simple thin lens with all
exactly known, fairly long focal distance fF. ill the focus of
the camera. This lens gives rise to an oblique line on the
phLte; this line is photographed together with the reference
line, The ang'le <p between the two lines is me[Lsul'ec1, where[Lfter the distance 1n is calculated from the formula:
(1133)
(, =
,I
IE g!l_.tan~.
G.! tan
e
The experiment must, of course, be carried ont in the waterbath at the t,emperatnre generally employed, It follows tlmt
106
AgKIV
FOl~ KEIIII, IIIINERALOQI O. flEOLOGI. BD 22 A. N:O 10.
tE is the focal distance in the sallle medium. If it is preferred
'to measme the focal llistance in air, the refractive index of
the water must be determined to permit recalculation of .II,
for that medium.
2. ']'he lIIag'nification :Fuctol's (;;1 and ({J. These factors
nuty be measured simultaneously. A diaphragm with a slit of
exactly known vertic!1l extension L is placed in the water-bath
in the plane that is in the focus of the camera. The diagonal
slit is placed vertically, and its width, about 5 mm., is accurately mea,Sllred. An exposure is made. The result is a
rectang'ul::tr black field on the l)iate. If the optical system is
perfectly adjusted, its edges are very sharp. '1'he dimensions
X fLud r of the rectangle arc measured in l1 comparator. The
magnification factorR are given by the equations:
(134)
_X.
Gs L
~--,
CHAPTER IV.
Electl'ophoretical Measurements.
A. 'rIle Boundary Anomalies.
1. }<'alse l\[oving' nOundal·ies. The theory presented in
Chapter I predicted that moving boundaries with mobilities
between the ionic mobilities would develop if more than two
ion species were present in both original solutions. Such
boundaries were called false, since they aid not belong to :1
certain ion and could not be used for the calculation of fLny
ionic mobility. In electrophoresis experiments with colloids,
the buffer is often made up of two or more different salts,
and such buffers must g'ive rise to false moving' boundaries in
addition to the 0 boundary, which is always present. '1'h0
reasons why these boundaries are so seldom observed were
discussed in' Chapter 1.
MoogE [Lnd LYNN (194:1) reported the presence of a small,
fast component, not yet identified, in electrophoresis experiments with human plasma. It moved with a mobility of
- 18· 10-", WfLS greater on the descending' side, and was also
greater if the plasma concentration was raised. '1'hey tried to
isolate the component but could not find any high-molecular
Bubsta.nce in the cell that might have contained it.
MOORE and LYNN used a mixture of lithium diethy lbarbiturate
and lithium chloride as buffer. This contains two negative
HaRRY SVENSSON, ELEC'l'ROPHOl~ESlS.
107
ions, anll a false moving' bouncbl'y with a mobility between
those of chloride and cliethylbl1l'biturate ions is to be expected.
ThiR boundary must be thought to apIJear greater in the limb
w here protein Cttn superim pose, just as is the case with the
false resting boundaries. It should also illcl'ease in size with
increa,sing protein and with tlecreasillo' buffer concentrations.
All these predictions check with JYlooRE's anel LYNN'S observlLtions, fwd it is thus very probable that they Lave observed
a. false moving uotlndary; this is the first observation of this
kind known to the author. In order to prove this hypothesis,
we have carried out some experiments in mixecl buffers and
with different colloids. If conditions favouring boundary anolUnlies Wel'e chosell, small rapid bOlllldaries were regularly
observed, not ollly with serum n.nd pln.sma, but also with
single pure colloids: serum albumin, egg' albumin, twd g'tUTI
a1'[1,bic. Diethy Ibarbitl1l'ate ions were also substituted for bar·
biturate iOllS, and the results were similar. This seelllS to exclude the possibility suggested by MOORE and LYNN that the
new boundary represents a complex between the diethylbarbitmate iOll n,nd some plasma constituent. This hypothesis is
al130 incompatible with the fact that the rapid boundary disappears if' the chloride ions are substituted for diethylbl1rbitmate
iOllS.
'rIle measurements on the fn.lse moving· boundar.v in the
system g'um arabic + lithium chloride + lithium ba.rbiturate
are given in Table l. In Fig. 29, we have the same data.
plotted against the chloride lWeI bUl'bit.urate ion concentrations,
the sum of which was kept constant. It is realized that the
mobility of this boundary varies continuously with the pro-portion between the two anions. If the chloride is nea,rly
absent, the mobility approaches that of 01-; if the barbiturate
Table 1.1
LiCI
0.020
0.017
0.014
n.012
0.010
0.008
Li Barb.
0.000
O.lIoa
O.OOil
O.OIlR
a.non
0.010
0.012
0.01,1
0.017
O.OOli
O.lI~U
D.noli
U ·10"
i
I
I
-lB.:!
-H).u
-21.2
-24..4
-20.8
-20.s
- 301.7
I ..
--'-~-
1 Dno to a mistake in COllllJUting an :1ppuratus cOJ1stant, tbe figures U
at!) [i % too high; the same is the case with the points in Fig. 29.
ill this tahle
10S
ARKIV FOR, RElIl}, lIlINERAI,OGI 0, GEOLOGI.
DD:.l~ A. N:O HI.
U' IO~
CIll 2
\olr 1se(:.1
1,0.
30.
20
10.
°0.,000
0.,005
O,UIO
U,01~
o 02rJ
a,Q20
0.015
0.,(/1(/
0.,005
0,000
H-LiCI
H-[.iDOl'b,
Fig. 20.
cOllcentra,tioll is nearly zero, this ionic mobility is approached
by the boundary. If olle of the anions is totally absent, however, the false boundary disappeal's. '1'he cnrve in Fig. ~9 is
the theoretically expectrc1 curve calculated from equation 20, p, 18,
by putting ULI = 19.4, UCI = - .:!2.~, and Unnrb, = - 14.0' 10-:'
cm.~ volt- 1 sec-I,
Some experiments were [1lso carried out with the constant
proportion 1: 1 between the two anions and varying- amounts
of free barbitmic acid. They showed that the mobility of the
false moving' boundary was independent of the acid concentration. These experiments solve a problem not discussed in the
theoretical chapter. The electriclLl transport by an anion of
a weakly dissociated !wiu can be expressed as the product of
the concentration of the free ions and their mohilities; this
has been done in Cbapter 1. It can aIso be expressecl as the
Pl'ouuct of the tot:11 acid concentration (dissociated -j- llIlc1issociated acid) twc1 an appl1rent mobility, which is equal to the
mobility of the free iOIl multiplied by the degree of tlissociation. If the latter Dlode of expression were justified in t.his
theory, it would be possible to reduce the boundary anomalies
to negligihle values b.v choosing buffers with an excess of free
aciu just sufficient to make the a'l)paTent mobility of the lwion
equal to that of the colloid.
The experiments mentiolleu above with varying' amounts
HA.RRY SVENSSON, EI,EC'l'ROPHORESIS.
109
of free acid show that the apparent mobility of weakly dissociated acic1 anions bas no significance; it is only that of the
free ions that exerts any infiuence. 'rhe same has been found
in experiments where the degree of boundal'Y anomalies was
measured for different concentrations of free acid. No indications of reuuced or inverted l1uomalies were observed.
2. 'fhe Influence 01' Huffer Ion ~[obilities. The theory ill
Ohn,pter I predicted also that buffer ions with low mobilities
would be favoUl'able with respect to the boundary anomalies.
In order to show this experimentally, a series of experiments
were made with different buffer anions anc1 with serum albumin as the colloid. It is advantageous in sucb. an investigation to ha,ve a free choice between all available anions independently of their buffering' regions; a base buffering in the
neutral region was therefore chosen as cation. Triethanolamine
is suitable in this l'espect,. If pure, it has a pR value of 7.7
(ITA 1,1, and SPRINKLE 1932). The technical pl'eparatiol1 :waila ble to the authol' was probably a mixture of di- twd triethanoln,mine, to judge from its high apparent pIC value (the pH of
an equimolecular mixture of the free base and a suIt thereof)
and from its wide buffering region. Triethanolamine is, by
virtue of its low mobility, its favoUl'able pK (it is well known
that there are not mall)' pK values in the neutral region) and
its low price well adavted to many electrophoretical investig'ations. It has already been used for such purposes by ROE and
EWAR'l' (1942).
It was intended to make these experiments in connection
with direct conductivity mel1snrements in the preparative apparatus to be described in the next chapter since the conductivity ratio across a moving' boundary is the most adequate
measure of the boundary anomalies. Owing to the war-time
conditiolls, however, this apparatus could not be completed
in time. The experiments therefore hacl to be carried out in
the ordinary apparatus, and the ratio between the velocities
of the rising anel falling bonnda,ries was chosen as fL measure
of the anomalies. rrhe results are given in Table 2. The
anions are placed in the order of increasing' mobilities, which
is evident from the conductivities of the buffers, also g'iven
in the table. The colloid and salt concentrations, the latter
expressed in normalities, were kept constant throughout the
series. An experiment with ammonia instead of triethanolamine was also included ill order to show the effect of the
cation mobility.
It is evident from this table that slow ions actually have
the favourable effect predicted by the theory and that the
110
AmnV l!'OR KBlIII, J\nNEl~ALOGI O. GEOLOGI.
BD
22 A.
N:O
10.
Table 2.
Cation
C1
" ty
OliC lletlV!
Anion
0
I Velocity
l?atio' 1 io,
d'i
0'
io
I.
I
TrietlJ"lllohminc
I
[
');
»
"
"
I,
I DiethyllJlLrbitnrate I
) N~1~;:;11~~~eDe,~,sul- I
IBlltyrate
Propionate
})
I i<'ormate
I ('itmte
"
I Chloride
1,_A_I_n_Ill~()~n_i_ll_ll_l_ _ _ _ I ChloriM
I
I
0.(011381)
0,00042(;
0.000'15·1
O.OOOJ"O
0.00052·1
0.000[,30
I
I
i
1.10
1.11
1.13
1.12
1.10
14
11
15
fl
II
12
15
15
().OOO(j~j
1.2~
)0
18
O.UOO~~l
1.3[,
28
1.1U
(]
(j
7
7 ,
i)
I
difference hetween different salts at the same concentration is
appreciable. With the slowest ions tested, the boundary a110medics were not llHLl'ked; both boundaries migrated fLt about
the S[Lme mte and were about equa,lly sharp; the difference
between the a ltnd li boundl1ries was small. With an ammoniuIU chloride buffer, which contains the fastest iOlls available,
the anomalies were very ll1l11'ked: one boundary abnormally
sharp, the other completely blurred; a great difference in
mig-ration velocities; a <) boundary very much greater tlmn the
8 boundary.
3. The (!ualltitative Verification of the Theol'~'. As far as
strong· elcctrolytes are concerned, numerous experiments have
already been carried ont to test the simple KOIUl~AUSCH-W]>1DElt
theory treating three ion species. After elimination of all
sources of error, these experiments have revealed a complete
agreement with the theory. Similar controls with morc iOll
species have recently been made by LONGSWOWl'H (194-G), also
with positive results.
In systems containing' colloids, such tests are much more
. difficult. HAcnm (1955) tried to show indirectly that colloids
also obey the KOHLRAUSCH-WEIJER theory, but he did not find
complete agreement. A direct experimental control necessitates
the knowledge of the specific charge of the colloid; otherwise
the electrochemical concentration a call1lot be inserted into
our equations. The determination of colloidal charge is the
chief difficulty in this respect. Such measurements aTe associated with considerable difficulties; it is, furtherlllore, a matter
of debate which kind of charge is active in this respect.
Titration data surely cannot be used since iOllS other than
hydrogen iOllS have been shown to l'eact with colloids (ADAm
and ADAIR 1934; DAVIS and COHN 1939; S'l'EINHARD'.r 1042),
HAR11Y SVJ'1NSRON, ELEC'1'R01'HOlmSIS.
111
The stoichiometl'ical charge is determinable an ulytically for
substances such as cellulose"sulphuric acid esters, pectills, and
polymetaphosl'boric acid, but it cannot be expected to be
ltctive to its full extent in electrophoretic migration. TISELIUB
(Hli)()) defined an ltpparent charg'e which mio'ht be thouITht to
be applicable since it was derived from mobility data. Finally,
we have the charge derived from the Donnan equilibl'ium and
measured by membrane potentials (ADAm and ADAIR 1934).
'rhe above"mentioned interaction between colloids and small
ions is a severe complication. Irrespective of whether it is
due to [1 specific affinity or a pure electrostatic attraction, part
of the crystalloid ions ill the medium are bound to the colloid
so firmly that they move along' with it in an electrical field.
We thus have to determine the concentrations of the .Fee
ions 011 either siele of a moving boundary. The only methods
availfLble for snch measurements are potentiometric in cbaracter;
they arc l1pplicable only to a few ions, however, and the accumcy is limited by the fftct tlmt they give primarily the
log'aritlull of the activity. Ordinary analytical methods g'i ve the
SUIll of free and bound ions; such figures cannot be expected
to check with the theory. On the other hand, if the theory
is accepted, measurements of this kinu will be able to g'ive
nLlulLble iuformation concerning' the extent to which different
ions are LOUtHl to colloids. The same is the case with the
Donnan equilibriulll.
W 0 wOlllll suggest that the charg'e active in the DOllnan
equilibrium i8 identical with that to be used in the theory of
electrophoretic migration. In Ohapter I, a theory was briefly
outlilled lLceording' to which it would be possible to make
elmrge cleterminations from the Donnan equilibrium by measuring' the coud uct;i vit.y on eitber side of the membrane. Since
this llletholl Heetned to be simpler than potential measurements,
it was dt~cidec1 to test jt, in an actual case. 'rbe theory mentioned is ahw independent of the interaction between colloid
and salt iOllS, since tho free ions acti ve in the Donnan equilibrium must be assumed to behave as free ions in the moving
bOnlldltl'y system also. Verification of the tbeory, then, involves
only the me[1snremel1t of three conductivities, those on both
sides of tJw llIembmne a,iter [1 complete DOllnan equilibrium
hl1,S boen reached, and the adjusted conductivity between the
(Y and the rising boundaries when the dialyzed solutions are
subjected to electrophoresis.
Gum arabic was chosen as a suitable colloid. A pure, saltirHe pl'eplLration thereof was dissolved in an acetate buffer to
five different concentrations. The solutions wel'e poured into
cellophane bag'S and clialJzecl with rotation against the buffer
11~
ARIGV 1iOR J(ElIII, lUINERALOGI O. OEOLOGI. BD
22 A.
N:O
10.
Tavle 3.
! Huffer I
In! () I DIE
A
I
for five days, The ba,g's were tied together with enclosed ail'
under pressure in ol'del' to accelerate the attainment of osulOtie
equilibrium,
After dialysis, the bag's were emptied and the contents
poured into flasks, The condnctivities of the contents and the
60 '-cK-.-,0",U',"TTTTl"TTTrrrT"TT"·''''l~''l---n.,t'
"qulv 1m •
~!
+4++1-++++
- I
"
58
1_--=
56
~O
i-- -- - . - -
._._~ _-~r"
.:~+
48
Dry \vdgh!
I- -
2U
_ - '" ,-.l--
,nr~ l,'hi!1h'
5
10
I~
20
my/nt'
(<If,'Jf'j.10" - _ .. -
tWO ohlli' cn[ ~ .. .: .•.
B,B U'I~5
000
.h!!C..
voU >ec
SA
"00 -- -
8,0
300
7.6
200
7.2
6,8
0
!\'
5
10
15
20
Dtt) \v'ei9ht
25
mg/m'
F'ig.30,
10
Ill!)/m'
113
HARII,Y SVENSSON, ELIW'fROPHORESIS.
Table 4.
I
No, \
Dry
w~ight
9
(j
\
.....
1 i(,,-X )
2 ~2-~ • .
"
3 Mobility of gum
4 E'f. (44), left balld side
0 Eq. (44), right·bulld Bide.
f, Gum conc.
7 K COllC. Uree K + I .
·
8 Acetate cone ..
·
9 K+ + Ao- cone,
·
10 Gnm CODC.
·
11 E(juiv. weight
·
12 K COllC. (t.otal K)
13 K Coone. UJOlllld K!
14 COOR COllC.
1[1 K COliC. (bOll!!tl K)
16 COllC. uf pure gum
17 F:(juiv. weight
1H.5
45
30 \ 6a.1)
130
215
LI5
1 S[j
1.,1
1.55
i2
H.Bl
1.5.1
JG
, Hon
\
4.81;
1.1i4
2281
45.50
-:!.O~
-j,4a
46,48 46.1"
4:)..10 42.7B
,l.34
·1.3:1
·1.66 7.67
2235 223U
·17.7;; 40.00
0.79
2.2B
3.7~
1.51
O,OB
4.a~
O.Oy
7.17
O,lfi
1.01
4571
7,52
mg. ml.- 1
21
18
\
\
-S GO -8.511 -·S.42
·1- o.
I
\
\
15
12
\
\
0(i.5 \109.f' 10-()
il8D ·\70 10- 6
- 8.13 -7 .OU -6,U8 10-"
1.0
1 81 1.V5 10"
1.05 2.11) lOS
1.7
-Ull -;'.41 -(i.un 10- 0
46.88 47.11; 47.t'4 10- 6
42.22 41.7ii 41.2;, 10- 6
4.32
4.31 4.30
10.68 13.6\1 H1.70
2392 253012615
52.01i 5J.ID GO.s·! 10-r.
8l.,i
H02
5.38
9.84
0.21
10A7
10flG 1053 104\l 106·[
I
\
obm-1clll.-li
ohm-1cm.- 1i
Cill.' voltsec.
"hm em.
Ollll] em.
~'il1iv.llll.-1
"'lniv. ml.- 1
eql1iv. ml.- I
mg. DlI.-1
I
I
1
mg. 1lI1.g. eql1iv.- l
eql1iv. ml.- 1
8.70 lo-tl equiv. 111].-1 I
7.00
12A4 15,00 10-G Cljlliv. ml.- 1 1
0.27 0.34
m/!:. ml.- 1
mg. ml.- I
1a.42 lG.1I1l
I!. ~quiv.-l
10'ja 1084,
I
I
dialysate were measul'ed at the freezing· point. The concentrations of gum arabic and potf1ssium were determined a1ll11ytically
by evaporating' a known volume to dryness, weighing', treating
with concentrated sulphlll'ic acid, fuming', anrlrepeated weighing.
The solutions were then subjected to elecb·ophoresis, 011e
by one, in the preparative apparatus (Ohapter V). The same
lot of buffer, the dialysate, was used in all experiments. The
g'um was anowed. to migrate some 15 CUI., the mobility was
read, and afterwards the liquid layer between the 0 and the
rising boundaries was sucked out. Its conductivity was mea·
sured, also at the freezing-point. The primary experimental
data are given in 'rable 3.
The experimental errol'S are too great to permit a reliable
test of the theol'Y by using the individual results. Hence it
was attem pted to level the e1'1'Ol'S by drawing' curves for each
quantity (mobility, conductivities, potassium concentr£l,tion) and
using points on the curves instead of the experimental data.
These curves, with the dry weight of one ml. solution as the
independent val'iable, are given ill Fig. 30.
The buffer was intended to be O.OG Min potassiulll acetate,
but the analysis showed that it was only 0.04445 M. The acetic
acid concentration was 0.005 M; the contribution of the hydrogen ions to the conductivity was neglected (pH about 5.5).
From available tables, the mobilities of potassium and acetate
iOllS under the prevailing conditions were found to be 38.9/F
A"kiv for kemi, min.ralaui a. gealoui. Bd 22 A. N:a 10.
8
11-1
ARKIV FOg KElI1T, nlINEgALOGI O. GEOLOGI.
ED
22 A.
N:O
10.
and -IS.IfF respectivel}'. Hence we lmve: T=..J.4.4j)· LO-li;
~ ['jll, = 0.3'lS; ~ ,ti L'i Iii
=
~l[).!I· J()-lll; ~ Zi C,/Ui
=-
O.l:!(j8.
III TlLble .J" lines 1 and :l, we find the conductivit.'y differences for COllcen tra,tions corresponding to G, \), ]:l, 16, 18, a,nd
21 mg'. dry weig·bt. The next line gives the lllobilit.y of the
g'Uill, measured on the descending' side. In lines 4 !1nd f), the
val ues of the left- and. right-hand sides of equation (44-),
Ohapter I, are g·iven. These figures would be expected to approach each other at low concentrations. Oil the coutrary,
however, they con verge at the higher concentrations. Althoug'h
equrLtion (..t4) is satisfactorily vel·ified at certain concentrations,
the agreement with theoretical expectations is not quite satisfactory.
The experiments just described also give valuable information reg'ardillg the cha.rge of gum arabic under the prevailing
conditions. In the Gth line, Table 4, we have the electrochemical concentration C, calculated from equation (40). The 7th
[Lnd 8th lines give the potassium [Lnd [Lcetate ion concentmtions according to equation (39). Line 9 shows the added
weight concentrations of these diffusible ions in mg. per lIll.
By snbtracting these figures from those in the top line, we
obtain the weig'ht concentration of the colloid (line 10). Division of the last-mentioned figures by those ill line G gives the
active (apparent) equivalent weight of the gum. It is of the
order of :WOO, a value aV]Jroximatel.l' twice us great as those
given by SAVE1@OTIN (19.J,5) and. others.
This discrepancy is due to complex (ioll pair) form!1tion
between the gum and the potassiulll ions, which if! evident
from the succeeding' lines in Table 4. The analytical data for
the potassium concentrations within the bags are g'ivC'u ill
line 12. It is seen that these do not check with the figures
in line 7; since the latter n,re the concentrations of free potassiu 111 ions, it is cOllcluded thn,t the differences between the
7th and l~t,h lines are the concellt,rations of bound potn,ssium
ions (line 13). It is fL striking fact tha.t these tig'Ul'e8 are of
the same order of magnitude as the active colloid cOllcentrations in line 6. It mrist be cOllcl uded that about half of the
carboxyl groups in the gum molecule are neutrali~1,8c1 by l)()uJ/(Z
potassiuUl ions, which iOllS thus participate in all 1l10Vf'nlf'11ts
of the colloidal particle. We lleed not imagine that these iom;
are fixed to the carboxyl groups, but the electrostatic forces
are apparently strong 8110Ug'h to prevent the bound coulltel'iollS
from leaving the surface of the micelle. The physico·ch('mical
consequence is the same as if we were concerncfl with an
incompletely dissociated salt of the colloid.
The analytical potassium determinations make it possible
ITARRY SYENSSON,
EL:EC'l':nOPHOI~ESIS.
115
to calculate u, new equivalent weight. If we add the 6th and
13th lines, we fincl the tobl concentl'a,tion of carboxyl g'l'onps
(line 1--1). ]if oreover, by recalculating line 13 to weight concentrations (line 15) and subtracthlg' these fig'ures from those
in the 10th line, the weight concentl'u,tiOll of the free g'um is
obt!1inecl (line 16). Finally, division of the latter fig'ures by
those in line H gives the equivalent weight of the gum with
consideration of all its carboxyl groups (line 17). Direct titration of the preparation used in this investiglLtion gave an
equivalent weight of 1270. The figures in the last line of
Table -l are definitely lower, although the apeement may be
considered as s[Ltisfactol'Y.
The method outlined for measuring' colloidal charges must
he further developed and refined; the concentrations should
he substituted for the activities. Now[!,days, when accurate
mobility determinations can be carried out on a routine ,basis,
the method shoull1 be capable of g'ivil1g' reasonable accuracy.
Cha,l'ge determinations bused llpon the conductivity chang-e
across a moving boundary (Chapter I, equation (23)) seem to
the author still more promising'. This method is also independent of the adsorption of slllall iOIlS to the colloid, moreover
it has the advantag'e that the activities do not enter into the
equation. If a snit-able apparatus is availahle, it is also a
rapid method; it is not necessary to awn,it a complete Donnan
equilibrium.
The fact that hig'hly charged colloids bind counteriolls to
a great extent has been observed earlier by HHIlIlARS'l'EN
(1924) for thymonucleic acid. He found an apparent dissociation of 0.:2-0.::]1] for the sodium salt.
B. 'l'llC Determiuution of
~lollilitie8
und Isoe,lectl'ic Points.
1. }I'aetors Illllllcncillg the Itlobility.
This topic was discussed in detail by .A BRAlIJ SON, MOYER,
a,ncl GOltIN (194:2), an cl au exten sive review of the literature
was given. There is consequently not much to be [Ludell here,
but a short survey may perhaps be of value.
a. The Acidity (pH) is the chief factor for l1mphoteric
colloids; it should be measured to within 0.01 pH unit.
b. The Ionic Strength. This concept for expressing salt
concentrations has come into general use in electl'ophoretical
investigations. The DEDYE-HuCKEL theory demands that
IiG
AltKnr FliR KEIIII, MINERALOar o.
GEOl~OGI. ED
22 A.
N:O
IV.
differeD t salts of the same ionic streng-th have the sallle
retlLl'dil1g' effect on the motion of iOllS. The variation of the
mobilit,ies of colloids with iouic strength is ver}' marked (see
DAVIS and COHN 193D f1D(l TISELIUS and SVENSSON 1940).
The effect of the snlt concentration is, in fact, of the same
order of umg'llitude as that of pH, especially at low salt COTIcentrations. The DlGllYE-HtiC1mL theory seems to be applicable
to proteins (TrsI<:r,rus and SVENSSON IH40).
c. The Nature of the Buffer Ious. Different ions have
different affinities for the colloids and form complexes of
different stabilities. There are two extreme types of such
reactions: ion pair formation, which association is due to strong'
electrostatic attraction between the colloid and counterions,
'and 81}(JcUic ajt't'llities, where more specific forces lllllSt be
assumed to be lLctive (ABRAMSON, MOYER, and GORIN). Between
these two gTOUpS we must probably place the assodatz'oll
betweell dipola1' ious, discussed by AmwENlus (1941). Although
very great differences in affinity have been found, it is probably
not possible to make sharp distinctions between the different
types of ion association.
d. The Temperature influellces the mobility inven;ely as
the viscosity of the solvent. Instead of a temperature effect,
we may thus talk of a pure viscosity effect. - The actual
temperature within the U-tube is somewhat higher than in
the water·bath and varies from the centre to the walls (MooNEY 1941).
If the colloid is assuUled to have the same
tempero,ture coefficient as the buffer iOlls, however, the mobility
obtainecZ refers to the ternperaiw-e at which the cOlldudivity £s
measured (TISELIUS 1937). Small temperature fluctuations
during the experiment al'e thus without significance. The only
necessary temperature reading is that during the conductivity
determination.
e. The Viscosity. In connection with the 11ltracentrifnga1
technique, it has been discussed whether the sedimentation
constant should be corrected for the viscosity of the sedimellting
solution 01' for that of the medium. The common practice in
thi.9 laboratory is to use the viscosity of the meuiuUl (SVliJDBERG a.nd PEJHmSEN 1940), but LA.UFl~Jm (1944) found that
better results were obtained if the viscosity of the sedimelltillg'
solution was used. The problem was discussed recently by
PEDIDRSEN (1945), but must still be reg'arded as unsolved. The
same problem aud the SlLme difficulties are encountered in
electrophoresis. Here, too, the influence of viscosity requires
IlARHY
SVENSSON, ELRC'l'ROPHORl,;SIS.
117
further theoretical and experimental investigation. The author
would suggest tha.t the viscosity influence is fourfold: Ci) the
iufluence of the viscosity of the pure solvent. As faT as water
a.lone is concerned, this influence is identical with that of
temperature; (/) the influen ce of the viscosity increment of
non-ionogenic dissolved substances; y) the influence of the
viscosity increments of surrounding ions; 0) the influence of
the viscosity increment of the leading ion itself.
The correction for the first two effects is easy; it should
be permissible to correct a mobility determined at O.G o C to
the freezing point by multiplying by the ratio of the viscosities
of water at these two temperatures. Accordingly, the mobility
determined in an acetate buffer with much acetic acid can be
corrected to zero acid concentration by considering the viscosity increment of acetic acid.
On the other hand, it is not possible at present to correct
for the last two viscosity effects. Simple corrections for the
buffer salt viscosity increments are certainl'y not justified,
since ions of opposite charge are enriched in the diffuse double
layer around the colloid. These ions must therefore be expected to exert a. gTeater viscosity influence than the iOllS of
the S1Lme charge. 'The influence of the viscosity increment of
the colloid itself is also obscure. Thus, S'l'ENHAGEN and
TEoRELr, (1939) reported thn,t the mobility of thYIllOl1ucleic
acid was independent of the nucleic acid concentration, but
HALL (1941) fonnd some dependence upon the concentration
for a nucleoprotein. The fact that there remains a small
difference between the mobilities from the rising" and falling"
sides after conection for the different conductivities (L.AGER01~AN'l'Z 194,4), indicates that the concentration of the leading
ion, by its viscosity increment, influences the mobility to some
extent, although not so much that the two qUfLl1tities are
in versely proporti on a1.
Viscosi.ty cOl'l"ections have generally not been carried out
by way of routine. From the above considerations, indeed, it
is evident that sllch corrections are of doubtful value until
sufficient knowledge about the viscosity influences is gained.
This view was ftlso expressed by S~'ENHAGEN n,ncl TJJ:oRELJJ
(1039).
f. The Field Strength. The mobility is genel'n.lly considerecl
to be independent of the potential gradient, but S'l'ENHAG EN
and TEOI~ELL (1939) reported that the mobility or tl1ymonucleic
acid rose with the field strength. The same effect has been
found by HOFF1I1.A N (1938) for microscopic particles in extTemely strollg electric fields. This dependence is rather obscure
118
",HKIV Fon KIL:m, lIIINEl1ALOGI
o.
GEOLOGI. liD
~2
A.
N:O
10.
and rcquires further illvestig·ll,tion. It UHLY possibly be explained
as 11 result of an orientation of dipolar ions.
From the above six points, it is evident that the reporting'
of mobility data and iRoelectric points without a detailed description of the experimental conditions is of limited value.
2. BOllll(lltl'Y SprelllliJlg (Elech'ochemical Inhomogeneity).
In recent ycars, the polydispersity of high-molecular compounds has been the object of theoretical and expcl'imentuJ
investigations. The corresponding phenomenon in the electrochemical respect may be called electrochemical inhomogeneity and manifests itsel'f as a spreading of the moving
boundaries. This 'effect must obviously not be confused with
the blurring caused by conductivity disturbances (Chapter I).
The boundary spreading must be investigated under experimental conditions that exclude boundary anomalies as completely as possible.
The boundary spreading \viLS first observed by TISELIUS
and HORSFALL (1939; see also HORSFALL 1939). In 194~,
SHARP, HEBB, TAYI,OR, and BEA1W presented a theory of the
phenomenon and defined a constant H, the heterogeneity
constant, which gave a quantitutive measure of the inhomogeneity of a protein. The heterogeneity constant has the
dimension of a mobility and is given by the equation:
L/a
H=P;.dt'
where a is the standard deviation of the gl'::Ldient curve, ]I)
the field Atrength and t the time. Two curves giving the
mobility and the factor H as functions of pH may be said
to represent a fairly complete electropboretical characterization
of a protein.
The possible relationship between boundary spreading and
electroosmosis, as suggested by N OHTHROP (1942), has already
been mentioned (p. 31).
S. The COllllitiOllS for Obtaining Correct :lIIobilities.
These conditions were derived in Chapter I and are as
follows. The £on unde-r £nvest/gatio')l must be al)sent on one s1'de
of the moving boundary; the observation of a boundary between
two diffel'elJt concentrations of the same ion is thus erroneOUR
in principle. There is only one exception from this rule: if
there is a buffer iOll of the same mobility as that of the ion
HARRY SVENSSON, EI,EU'rROPHORESIS.
119
under illveRtigation, the boundary will move with the correct
mobility even if it is formed between two diiferellt concentra·
tions of that ion. When colloids are concerned, too much
stress should not be laid upon the requirement that they be
abseut in the buffer. Practically conect mobilities can be
obtained from boundaries forllle~l between two different COllcentmtions, if this arrangement is preferable for some reaSOll,
when the ratio between colloid and salt concentrations is small.
The other condition for obt.aining correct mobilities is:
jar r:on1pzttin(! the .field strength, lhe collducth'it:1J in the liquid
laycr '/text to the mOr)in{1 boundary which can tai'lls the ion under
investigation has to be 'Used. For colloids, this means that the
conductivit.y just !IrION' the moving boundary lllust be known.
This condition is often very difficult to satisfy in the case of
rising boundaries.
4. Uobility Determinations with Depressed Boundary Anomalies.
This is the method introduced by TrSELlus (1930) and
implies the use of high salt and low protein concentrations.
In the light of the new results derived in Ohapter I, the
conditions to be fulflllecl can be formulated as follows. The
active equiva,leut concentration C of the iou under investigation must be llegligible compared with the function B (U) of
the buffer. The concentration of the leading ion should thus
be chosen in the neighbourhood of the resolving power of the
method of observation. It has already been pointed out that
this limiting concentration is much lower for colloid ions
with their low actiye specific charges than for ordinary ions,
and that colloids are consequently the most suitable ions for
the method in question. Practically speaking', the method
with depressed conductivity disturbances is limited to colloids.
If the conditions mentioned are fulfilled, the conductivity
will be essentially COllstallt throug-hout the tube, nor will it
change with time. It Ct"1il thus be conveniently measured before the experiment is started. The same velocity is obtain ed
in both limbs, and the false boundaries are so small that
they are without importance.
The amount of salts necessary for depression of the boundary
anomalies depends upon the nature of the buffer ions. In
order to obtain a high value for B (U), it is desirable to have
b\lffer ion mobilities in the neighbourhood of that of the
colloid. If proteins are concerned, which are as a rule relatively slow, this means that the buffer should be made up of
as slow ions as possible. The slow8l' the ions, the lower salt
concentrations can be tolerated. .Among the inorganic iOllS,
120
ARKIV lPOR KElIlI, lllINERALOGI o. GEOLoar. TID
22 A.
N:O
10.
Li+ and P- are slowest and thus of considerable importance
in electrophoresis of proteins and other slow colloids. U 11fortunately, LiF is only slightly soluble and cannot be used.
The most suitable inorganic sa,lts should thus be N aF and
LiOl. The necessary amount of buffering salts (phosphates,
acetates, etc.) must naturally be added to maintain a constant pH.
In organic chemistry, we have several easily available iOllS
with low mobilities: acetate, benzoate, diethylbal'biturate,
cacodylate, naphthalenesulphonate among the negative and
triethanolamine among the positive ions. The more complicated
arc the monovalent iOlls chosen, the lower are the mobilities,
but the risk of chemical reactions with the protein simultaneously increases. Thus, SOORNE and HARInS (1939) found
that phthalate buffers shifted the isoelectric point of silk
fibres from 3.u to 2.7, and picrate ions combined with the
particles to such a great extent that the isoelectric point
totally disappeared. It is also well known that many acidimetric indicators combine firmly with proteins, as well as
detergents. Such affinities probably diminish the applicability
of slow organic ions.
O. lIIobility Determinations in Hle Presence of noumlary
Anomalies.
The conductivity disturbances aTe unfavourable from most
points of view, b~t they have one very advantageous effect:
the sharpening' of the boundaries in one limb of the U-tube.
Sharp boundaries can be localized with a hig-her accurllcy,
and mobility measurements on such boundaries should then be
more reliable than measurements on normal or blurred boundaries.
This principle is made use of in the WRETHAIlI-MASSON method,
where a very high accuracy has been reached. A similar
exactitude would also be attainable for colloids if m'eaSl_ll'ementa could be made on sharp boundaries produced. by choosing'
experimental conditions favouring the boundary anomalies.
There is One great difficulty, however. WHRTHAJlf-MASSON
experiments are always alTallg'ed so that one of the original
conductivities can be used for computing the field strength,
but this is seldom possible where colloids are concerned.
From the results in Chapter I on the number of true and
false boundaries, the following rules can be formulated. The
condueti1)ity of the OI'£yinal supernatant is to be used f(W the
fastest upwanl-migrating ion present in the snpe7'natant aloJlf',
unless two still faster i011s ate l/resent in both solutions. In the
latter case, the fastest rising boundary is a false boundary,
HARRY SVENSSON, ELECTROPHORESIS.
121
anu the conductivity of the supernatant canuot be used to
calculate any true ionic mobility.
The conductivity of the O1'igi17al bottom solution ·is to be usecl
for the fastest d01vnwani-migl'ati'llg i01l )Jl'eselit £n the bottom
solution alolle, unless two still jastel' ions are present in voth
80luti07ls. This rule is of outstanding importance for colloids
and will be further illustrated by two examples. Example 1:
Supernatant: sodium diethylbarbiturate + diethylbarbituric acid;
bottom solution: the same buffer -t- serum. The fastest descending boundary is that of serum albumin, and the conductivity of the original sol may be used to find the correct
mobility of albumin. E:t:ample 2: Supernatant: a phosphate
buffer; bottom solution: the same buffer + serum. Here we
have two neg'ative ions faster than serum albumin. The fastest
descending boundal'y is thus a false boundary, and the conductivity of the original sol does not give the correct mobility
of serum albumin.
The cOllductivity qf the ol'iyi'llal supenlatant can 'ilel'{!/' be
applied to a descending boundary, and that of the ol'igi'nal
bottom solution is always £uapplieable to all ascending boundary.
The truth of this rule is immediately understood if it is recalled
that the false resting boundal'y ~onstalltly exists, indicating
that an adjustment of ionic concentrations and conductivity
has taken place. Early investigators did not understand this,
hence the great difficulties with the moving boundary method
in the beg'inning of this century.
a. Descending Sharp Boundaries. Colloids, witb their
very high (active) equivalent weig'hts, must constantly be
placed in the bottom; hence only the descending boundary is
useful for mobility determinations, in view of the above rules.
Now, descending colloid b0l1l1daries are genemlly blurred and
inapplicable to precision meaSUl'ements for that reason. If we
could so arrange matters that the falling colloid boundary
was sharpened, however, it would be possible to make precision
measurements on colloids just as this is possible in the
WHETHAlIr-MASSoN method with ordinary salts. The 0111y
way to attain this is to choose buffer ions which move more
slow ly than t,he colloid.
In the presence of much salt, it is hardly possible to finel
buffer ions slower than colloids. When the salt concentration
is reduced, however, the mobility of the colloid rises much
more than do those of ordinary iOllS (r/ TrsELlus and SVENSSON 1940). The method in questiol1, then, should be valuable
in studies of highly charged colloids ill nearly electrolyte-free
solutions. No such investigations have so far been published.
122
AHKIV FOR, KEIIII, 1I1INERALOGI O. GEOLOGI.
l~ig.
31.
TID
22 A. N:O 10.
b. Ascending Sharp Boundaries. If we
wish to make use of snch boundaries for mobility measurements, it is necessa,!,}, to measure
the conductivity just below the bounda,l'Y during
01' after the expel'iul€nt, since this conductivity
is !lot identical with any of tbe original conductivities. Snch measurements are attended by
considerable technical difficulties, bnt the problem hu,s been flolved by LAGERCRAN'l'Z (19-14).
He constructed special electrophoresis cells of
the TIRELIlJS type with sealed-in platinum electrodes. After the experiment, the boundaries
were »compensated», and the conductivity was
read as a, function of time. By simultaneous observations ill the camera, LAGicn.cRANTZ was able
to measure the concluctivity through the whole
electrophol'etic p!1ttern. Ad.lusted conductivities
have previousl.y been measl1l'ed by HACKER (1935)
and by LONGSWOJ~TH and MAOINNES (1940). It
is also possible to make such measurements in
the present author's preparative apparatus (Chapter V). Some preliminary experiments have been
performed by pressing ont the contents of the
U-tube limbs through the top capilla,ry side-tubes
into special conductivity cells. Here the boundaries
pass the electrodes and the very narrow tube
between them at a steady state. The conductivity
is read and plotted as a function of time. One
such conductivity cell is shown in Fig. 31.
6. lIIobiIity Studies on Serum Proteins.
In the next section of this chapter, a number of serum
analyses will be described. Since these experiments were carl'ied out with depressed boundary anomalies, it was possible
to llleaSl1l'C the mobilities in the same runs. It was then found
that they varied in a characteristic manner with the composition of the buffer at constant pH and ionic strength. These
differences are perhaps worthy of mention, since they appear
to throw some light upon the interaction between proteins
und simple ions.
Many serum analyses were made in mixtures containing
phosphate of pH 7.7 and ionic strength O.O:l and a neutral
salt in the concentra,tioll 0.18. Three different salts, LiCl,
Nael, and NaF, wel'e employed, and the mobilities were found
HARR.Y SVENSSON,
123
ELECTROPHOl~F.8IS.
Taule iJ.
!vIabilities of Serum Proteins at pH 7.7 and Ionic Strellgth
O.:w. Phosphate Ionic Strength 0.02, Neutral Salt D.Hl.
1
I
Neutral Bnlt
I
IUCl
NaCl
1NaP
I
Al1111111in
GluIJ. cz
Glou. ~
Gl01). y
5.80
·1.87
4.7H; 4.:)(;
.1.:)7
3.07
2048
2.11)
1.:12
3.46
3.H
O.!I~
O.fiO
__I
to decrease in the ordel' mentioned. The mobilities are listed
in Table 6, the figures being' average values from many experiments. Since the mobilities were fonnd to be essentially
alike in sera from different species, the table includes mobilities
from all species investig·ated. In the fluoride bufIer, the albumin peak was constantly split into two, the slowe1' part being'
the chief component. It is not known whether these two albumins are identical with LUETSOHElt's albumins (1\)39), separated
at pH 4, but the fluoride ions evidently have a specific affinity
for part of the albumin molecules.
It is hardly possible to explain the different mobilities in
these buffers otherwise than by supposing' that the proteins
have a g'rea,ter affinity for C1- than for F- a.ud a greater
affinity for Na+ than for Li+. Since all serum components
were affected in the same direction, this seems to be a general
property of proteins.
Similar experiments, but with still more striking differences,
have been observed in experiments with haemocyanin. Since
these experiments were carried out for another purpose (p.
130), pH and ionic strength were not kept quite constant.
Hence the mobilities al'e not presented here. They val·jed,
however, much more than could be attributed to pH and ionic
streng·th, and it was observed that the mobility was low in
buffers containing large cations (triethanolamine) and high in
those with large anions (diethylbarbiturate, naphthalenesulphonate).
Both these sets of experiments, carried out on negatively
charged colloids. seem to support the view that the afjillity of
Ji1'oteins for d~trusible ions increases with the siz~ of the latter,
Since the same phenomenon was observed for cations as well
as for anions and for di:ifel'ent proteins, it can possibly be
concluded that the above rule is of quite general validity.
Observations by DAVIS and COHN (1939) regarding the influ·ence of phosphate and citrate ions 011 protein mobilities pro'vide evidence in the same direction, BALLOU, BOYER, and
] 24 AnKIV
FOR
KElIII, lIIINERALOGI O. GEOLOGI. BD 22 A. N:O 10.
LUCK (194,5) investigated the effect of the lower fatty acid
anions lWcl found that their adsorption on protein molecules
increased with increasing chain length. This is concordant
with the recent finding that detergents form very stable complexes with proteins (LUNDGRF.N, ELAlII, and O'OONNEL 1943).
C. Electrophoretical Auslyses.
1. Sources of
}~l'l'or.
The general eXPloession for the refractive iudex cbange at
a moving boundary was given in Ohapter 1. As is evident
from equl1tion (28), l111 ions present contribute to this change.
rEhe hitherto generally accepted view, regarded as self-evident,
that the refractive index increment at a moving' boundary is
due to the leading colloid alone, must be amended.
The question then arises whether it is possible to choose
experimental conditions such that the influence of the surrounding ions become negligible or whether a method of correction for primary analytical data must be worked out. If
none of these possibilities exists, we must admit that the
electrophoretic method of analysis is of limited value and
unsuitable for precision analyses. Its usefulness when the
highest accuracy is not demanded need not be discussed.
a. Superimposed Colloid Gradients. It was pointed out
In the first chapter that the greatest errors of this kind are
g'iven by the colloids themselves. In an electrophoretic pattern
of serum, the albumin changes its concentration, not only at
its own boundary, but also at all other rising boundaries and
at the 0 boundary. COl'respondingly, the ')' globulin changes
its concentration at all descending' bounclaries. Concerning the
sign of the errors, the following rule was formulated: jastc1'
ions (even colloids:) of tlw sarnc charge as the leacHI/O ~'o'll (lml
ia12s of the opposite chm'(le dimim:sh the 1'Pjractive index change
at the bou/ldarJ/:' "'lol£'er ions ql' the same charoe increase it. The
consequence of this is that the faster components appeal' too
large at the expence of the slower ones in both limbs of the'
U-tnbe.
The superimposed colloid gmdiel1ts are proportional to theconductivity changes across the boundaries; they can thus be
diminished to negligible values by depressing the boundary
anomalies. High salt concentrations, preferably of salts with
low ionic mobilities, and low colloid concentrations have to
be used.
HA.RRY SVENSSON, ELECTROPHORESIS.
125
It was shown by the author (1943) that the 8nors in question coutu be quite appreciable under unfavourable conditions.
The sa,me swine serum in dilution 1; 2 gave 59 pel' cent albumin in the positive limb at an ionic strength of 0.10, but only
43 per cent on addition of 0.37 M-NaCl. With so much salt
the boundary anomalies are neg'lig-ible, and the last analysis
must be regarded as correct, Similar experiments have been
carried out recently by PJmLlI[A.NN and KA.UFMAN (1945) with
human serum in dietbylbarbitnrate buffers. They found a
similar drift in the apparent serum composition with the salt
concentration, or inversely, with the serum concentration. They
stated that the true composition was obtained if the analyses
were extrapolated to zero for the ratio between serum and
salt concentrations. The errors were much smaller in the
diethylbarbiturate than in the phosphate-chloride buffel's. This
is consistent with the prediction of the theory that slow buffer
ions of the charge of the colloid are especially favourable with
respect to the boundary anomalies. COOI'ER (1945) bas also
studied the errors in question, using synthetic mixtures and
swine serum. He obtained correct analyses in all in stances,
however, und concluded that electl'ophoretical analyses 'Were
quite reliable.
b. Superimposed Salt Gradients, These gradients A,re
g'overl1ed by the same laws as the superimposed colloid gradients. Diffusible ions generally move faster in an electric
field than do colloids, at least under standard conditions in
the presence of much salt. Their contributions to the refractive index chang'es at the boundaries are then constantly
negative, i. e. they tend to diminish the refractive index gradients; this holds for cations as well as for anions. According
to equation (28), the effect increases when the difference in
mobility between the diffusible ion and the colloid decreases.
In buffers containing a slow and heavy anion, therefore, fast
boundaries with a negative migration will be more affected
than slow boundaries of the same kind, and the latter more
than boundaries with a positive migration. The analysis
will, in the absence of other errors, give figures too low for
the most negative and too hig'h for the most positive components. It should be observed that these errors counteract
those due to superimposed colloid gradients.
On the other hand, in bnffers containing a slow and heavy
cation, fast boundaries with 'a positive migration are most
affected, The analysis will give figures too low for the most
positive and too hig'h for the most negative components.
A.lthough cations as well as anions make negative contl'i-
]26
ARKIV FOR KElIlI,
MINEl~ALOGI
O. GIWLOGI. TID
22 A.
N:O
10.
butions to the refractive index increments at all moving boundaries, a considera,tioll of all boundaries in a moving boundary
"vstem lel1ds to the conclusiol1 that cations and anions give
l'iHe to errors of opposite signs in electrophol'etical analyses.
The total errOl' should thus be at a minimum if cations and
anions are of about the same size, especially if the colloidal
mobilities al'e situated symmetrically about the arithmetical
mean of the buffer-ion mobilities (all mobilities being taken
with signs).
Superimposed salt gradients, as well as superimposed colloid
gradients, may be depressed by choosing low colloid and high
salt concentrations. Noue of the errors, howevel', can be completely eliminated. This fact is evident from the law of electroneutrality: ions other than the leading one must change their
concentrations at the boundary in order to neutralize the
charge of the colloid. The remaining enol'S, still present if
the boundary anomalies are effectively depressed, are closely
connected with the question how to measure the specific refractive index increments of charged colloids. This question
is discussed below.
o. The Specific Refractive Index Increment of a Charged
Colloid. This constant is g'enerally determined by measurillg
the refractive iudices of solutions of the colloid and the solute,
The dry isoelectric colloid is either dissolved in a salt solution
or the colloidal solution is dialyzed against the buffer; the
difference in refractive index so obtained is not due to the
colloid alone. When a dry isoelectric protein is dissolved,
shifts in ionic concentrations will take place and, after dialysis, the Donnan equilibrium will give rise to different salt
concentrations on both sides of the membrane. It follows that
the specific refractive index increment of a charged colloid
will depend upon the com position of the buffer and 011 pH.
The only well·defined specific increment of a colloid is that
which refers t.o the uncharged, isoelectric colloid.
This is a difficulty encountered in all refractometric stuc1ies
of colloids. It is not so serious when only small buffer ions
are present. In electrophoresis investigations, however, hea vy
organic ions, especially dietbylharbiturate iOllS, have come into
use, and it is then qnestionable whether the dependence of
the specific increment on the buffer plays any r{)le or not.
The problem may be specified as follows. We can meaSUl"e
the specific increment after dialysis and define it according to
the Donnan equilibrium, At a moving boundary, we have
another kind of equilibrium between the iOllic concE'ntl'atiolls
on either side of the boundary. This equilibrium can equally
HARRY SVI,NSSON,
ELEO~'ROPHORESIS.
127
well be used for the same purpose, for defining and measuring'
the specific increment. In principle, there is no reason to
prefer the Donnan equilibrium, except its convenience. The
question is now: how good is the agreement between the constants measured in these ways if the same buffer is used, and
if different buffel's are employed?
This question is difficult to answer for the present, but it
should be possible to attack the problem by two methods: by
precision measurements of refractive index on solutions in
Donnan equilibrium, using different buffers, and by electrophoretical analyses of synthetic mixtures, also with different
buffers. The author has only tried the latter procedure, which
will be described on p. 129.
d. The Interference of the 0 and 8 Boundaries. According
to the theor.y in Chapter I, where constant transference
numbers were assumed, these boundaries do Dot move, but,
owing to a small variation of the transference num bel'S with
concentration, are generally observed to move slowly in one
direction or the other. If uncharged components are present
in a system, they will generaHy be superimposed on by the 0
and 8 gradients, and a similar interference will take place if
the false boundaries migrate in the same direction and about
as fast as some 1100rly charged real component. This gives
rise to systematical errors (the poorly charged component appears too large) whose magnitude depends UpOll the sizes of
the false boundaries. In the presence of boundary anomalies
(conductivity disturbances), the (~ gradient is much greater
than the 8 gradient; the error is thus greater in the rising
than in the descending limb, and is often easily detected by
this discrE'pancy. Rence the generally accepted habit of using
only descending' bounuaries for concentration IDf'!lSUl'8mf'nts.
It is better, then, to choose buffers giving the false boundaries a migration contrary to those of the components to be
measured. The separation between the y and 0 peaks in serum
analyses was investigatpd by LONGSWOR'l'H (1942). He obsel'ved
that pure phosphate buffers and diethylbarbiturate buffers had
the desired property of giving' 0 boundaries with a positive
migration. LONGSWOR'l'H states that this direction of migration
is generally associated with hig'h cationic transference numbers
for the buffer. We have made the same observation.
With boundary anOlllulies deTll'l'Ssed as much as possible,
the 0 and 8 boundaries remain, but are of approximately the
same size. In such cases they are not discovered through a
discrepancy between the analyses in the two lim be; special
care must thus be taken to prevent their interference in the
128
ARKIV FOR TrEMl, UINERALOGI O. GEOLOGl. BD
22 A.
N:O
10.
analyses. If simple, light ions are applied, the false boundaries
axe so small in size that they can generally not be detected;
they al'e consequently una,ble to cause any errors of significance. In the presence of heavy ions in appreciable quantities,
however, both false boundaries are fairly great, and it is not
possible to depress their size by raising the salt concentration.
[n investigations with such buffers, therefore, it is an imperative necessity that the false »resting» boundaries separate completely from the slowest real component.. An electrophoretic
analysis carried out in diethylbarbiturate or triethanolamine
buffers without any visible 0' !1nd B boundaries cannot be correct; their invisibility quite certainly depends upon the fact
that they are hidden in the slowest real component.
It should be noticed that the error due to the interference
of the 0 boundary counterllcts those due to superimposed colloid gradients. Hence it is not surprising that serum analyses
carried out before it was known ·that the 0' bouudary could be
concealed in the r g'lobulin peak, and before the superimposed
gTadients were discovered, might happen to show albumin contents that can be accepted as correct today. In such analyses,
two errors of different sign have neutralized each other.
e. Ion Pair Formation and Specific Affinities. If buffer
ions are present which are partly bound by and moving along
with the colloids, these ions will contribute positively to the
refractive index increments at the boundaries. The order of
magnitude of this error was shown to be 2 per cent for g'um
arabic and potassium ions (p. 114). In the presence of heavy
ions with appreciable affiuities for proteins, the error may
definitely be much greater. There are certain indications that
the affinity rises with the size of the ions (p. 123).
2. Conditions Suitable for Electrophoretical Analyses.
It is now possible to summarize the conditions which, in
our opinion, should be fulfilled if reliable results are to be
obtained. The most suitable buffers may also be named.
The conductivity changes during electrolysis must be very
small. This is achieved b.y using high salt and low colloid
concentrations. The mobilities of the buffer ions should be
low. The condition is fulfilled if the 0' and 8 gradients are of
about the same size, including the case where they are absent.
In the presence of cl' and 8 boundaries, it is necessary to
choose a buffer giving these boundaries a diTection of migration opposite to that of the components to be measured. Ac.cording to LONGSWORTH, large cationic transference numbers
HARRY SVENSSON,
ELECTROrHOI~ESIS.
129
in the buffer will generally cause the false boundaries to move
with the current, and vice versa.
Buffer salts with high specific refractive ind~x increments
(high molecular weights) should be avoided or used with
caution (the necessity of taking this precaution cannot be
regarded as satisfactorily proven; of the subsequent experimental section).
Ions known to possess specific affinities for proteins should
also be avoided.
In virtue of the above considerations, the author has found
buffers composed of simple inorganic salts to be least objectionable. Mixtures of phosphates and NaOl, NaF, and LiOl
have been most extensively used. With a total ionic strength
of 0.20-0.'25 and a protein concentration of 1.0-1.5 per cent,
the f~tlse boundaries are too small to be detected, and the
boundary anomalies are depressed to llegligible values.
Under such conditions, there is no reason to favour one
limb above the other. The babit of measuring concentrations
only on descending boundaries originated from the fact tbat
the {3 boundary is much smaller t,han the 15 boundary when
the conductivity disturbances are not depressed. The generalization that all disturbances are smaller on that side is no
doubt erroneous. The omission of dn,ta from the ascendil] g
side involves an unjustifiable waste of experimental material.
Electrophoretical analyses carried out under the conditions
mentioned also permit the determination of mobilities in the
same runs. The components move at the same rate ill both
limbs, which is also an indication of eliminated boundarv
anomalies. Here, too, the habit of taking mobilities only fro~
the descending side is pointless, especially as the conductivity
of the original sol is strictly applicable only to the fastest
descending boundary. In serum analyses, the author derives
all mobilities from both limbs by taking the aveTage velocity
and by employing the mean conductivity of the (thoroughly
dialyzed) sol and the supernatant.
3. A General Test of the Reliability of Electrophoretil'al
Analyses.
For the performance of such a test, it is necessary to have
two electrophoretically homogeneous colloids with mobilities
sufficiently different to permit a complete separation between
the peaks. The slower component should also move sufficiently
fast to separate completely from the <) gradient. It is very
difficult to find two substances that satisfy these requirements
Arldv iur kerni. mineralo(Ji o. aealagi. Bd 22 A. N:o 10.
9
130
Alt:KIV FOR KEllU, JlIINERALOGI O. GEOI,OGI. TID
22 A.
N:O
10.
l'able 6'.
(Ac- = Acetate, V- = Diethylbarbiturate, B- = Barbiturate,
Pr- =Propionate, Ph- I- I = Phosphate, '£1'+ = Triethanolamine.)
---"~--"------
-----,------
Buffer
lOllS,
-_------
---.---------~"
Jonie Strength' 10"
I
---_.
EleetrophoretiCltl
A llal,Yses
~i~l~f::r~;~lp-IA('-lpb- -IPh-F~ 1~~I-v--_CI-A-u-;~'-ll:t~I-I~
100
85
3·1
134
134
100
3·!
150
150
1100[
100 100
1
5
2
2
I
150
150
150
[
I
2
150
150
00 I
I
60
64
2
!~:~;, [\ ~~:~5
49.1
50.35
51.85
50.8
·19.5
100
49.7
150
150
42.2
38.15
50.0
4\l.fl5
48.15
49.7
50.5
GO.8
57.8
G].B;'
I
I
in all buffers to be tested. The author has chosen gum arabic
and Helix pomatia haemocyanin.
Stock solutions of these two substances were prepared and
dia.ly?:ed aga,inst a phosphate buffer, pH 7.7, ionic strength
0.20, for three days. The concentrations were then mellslll'cd
refractometrically, the difference in refractive index between
the solutions and their c1ialysates being taken as a mefLsure
of concentration. The two colloid solutiolls were then mixed
in proportions calculated to give a mixture of equal parts of
the components (in refractometric measure). The general
procec1Ul'e 0-£ measuring the areas of electrophOl'etic patterns
is least objectionable if the neig'hbouring' components have
about the same concentration. Suitable quantities of the mixture were dialyzed a,gainst new buffers and subjected to
electrophoretical analysis by the ordinary method. Salt concentrations sufficiently high for reaching the limiting' avparent
composition were used throughout.
The results of these measurements are given in Table G.
Some experiments have been excluded owing to disturbances
of diverse kinds. In two experiments, benzoate and napbthionate were used as buffer salts, but these anions caused denaturation and flocculation of the haemocyanin.
Most buffers investigated gave results in g'ood agreement
with that expected, 50.0 per cent of each component. The
only exceptions were the two experiments with dicthy IbarbitUl'ate buffers, which gave definitely low values for gum
arabic.
HA.l~RY
SVENSSON, ELEOTROPHORESIS.
131
This result is to be expected for theoretical reasons. The
two components were mixed in equal parts as judg'ed from
refractometric measurements in phosphate buffers. The specific
increment measured after dialysis must prove to be smaller if
heav,V diffusible ions of the cha,l'ge of the colloid l11'e used,
since these ions are enriched in the dialysate; the difference
increases with the charge of the colloid. It increases still more
if the Donnan equilibrium is substituted for that prevailing'
across a moving' boundary, for the heavy diethylbal'bitnl'ate
ion is also slow, and slow ions chang'e their concentrations
compal'atively much at colloid moving bonndal'ieR. This error
will consequently tend to make the faster gum arabic bounJary
too small when heavy anions and light cations are employed,
especially if the specific increments are mea.sured in buffers
containing small ions.
It is true that the error due to superimposed colloid
gradients counteracts this error, but the experimental conditions were such as to exclude the intel'ference of such g'l'adients (much salts, no conductivity disturbances). There is
another circumstance, bowevel', that tends to enlarge the enol'
discussed above; this is the interaction between the colloids
and the diffusible iOllS. The affinity of haemocyanin for the
dietbylbal'biturate ions must be expectecl to be much gTeater
than that of gum arabic, for haemocyanin is an amphoteric
electrolyte with many positive charges at t,lle, lJrevailillg pH,
while gum arabic is a polyacid with probably nO affinity for
anions. This difference in complex-formation affinity tends to
enlarge the baemocyanin boundary.
With a heavy cation and a light anion (e. g. triethanolamine hydrochloride), the conditions should be reversed. The
specific increment measured in such buffers appears gTeater
than in phosphate buffers, since the heavy cations are elll'iched
within the bag, the more the g'l'eater the charge of the colloid
is. Thus, if an electrophoresis experiment is made in such a
buffer, and if specific increments determined in phosphate
buffers are used for computing the concentrations, the faster
bonndar,V will prove too great. The error increases still more
if the Donnan equilibrium is substituted for that prevaiUng'
across a moving' boundary. Finally, the affinity of gum arabic
for triethanolamine is g-reater than that of haemocyanin, The
gum binds a.bout two 11er cent of its own weight of potassium
ions (p. 114); thus the complex gum ar[1bic-tl'iethanolamine
should COlltain as much as 7.7 per cent triethanolamine. All
these influences tend to make the faster boundary too great
at the expense of the slower, if heavy cations a,nd light o,nions
are used,
132
ARKIV Fi:il~ KElIlI, JlIINFJRALOGI O. GEOLOGI. ED
22 A.
N:O
10.
Table 7'.
(Ph = phosphate, Tl' = triethanolamine, V = diethylbarbiLurate.)
- --
-
I - Bnffer 8!\lt~, Ionie Strength I Ele()troP-h~l~ticUl-Al1ltlyses
I
I
1;1~~r;!\CITNII~l~llV jTr~l TrCII--Alb~ iGlOb.ujGlob·pimOh.y
I
18..!
81.6
I Antidiph· 0.10 0.10
~
~
C
I
Sel'Ulll
therit,ic
0.10
0.10
0.10
HOl'fle
Be 1'1I Ul
1:8
~---~--
Autipneu
lllD('orcic
R'luhit
Sernm
1:8
0.15
0.15
I
-_---I-~-----0.10
0.10
0.10
I
I
0.15
,
10.25
18.7
80.70
30.4
38.05
·12.05
0.15
I
80.u
81.8
~---
0.10
I
20.0
18.2
4\).65
81.B
-~- rj.7~-:;-~:~·D.no
7.0
2.U5
D.ft
I
8.2
48.8
41.85
47.4
This prediction is not confirmed by the three experiments
with triethanolamine included in Table 0. The acetate experiment gave only slightly too much gum arabic; the experiment with acetate and barbiturate should not be expected
to give a large error since there is also a heavy anion. Two
experiments with triethanolamine hydrochloride and hydrofluoride were excluded owing' to their unreliability. They gave
gum arabic concentrations well over 50 per cent, and thus
seemed to verify the predictions, but the analyses in the two
limbs differed too much, and there were also other disturbances. The haemocyanin and the <1 boundaries did not separate
(the haemocyanin mobilities were extremely low, and the 0
boundaries migrated negatively), and the haemocyanin peak
was too sharp to permit an accurate integration.
Some experiments with unknown mixtures have also been
carried out in different buffers (Table 7). These analyses show
only small differences and they cannot be stated to show any
systematical variations with the composition of the buffer.
It should be noticed, however, that <1 did not separate from
r globulin in the two triethanolamine hydrochloride experiments: the figurAs for albumin in the latter should be higher
than is shown by the table. There is 110 indication of a too
low albumin content in the diethylbarbiturate buffers, but
possibly of too high albumin values in triethanolamine hydrochloride buffers. Triethanolamine in combination with a.
light anion is not suitable for serum analyses, since 0 does
not separate fr01l1 ?' globulin and all mobilities are very low.
The qnestion of the applicability of the diethylbal'biturate
HARRY SVENSSON, ELECTROPHORESIS.
133
buffers is of great importance since most American investigators nowadays llse them ill routine work. They are extremely favourable with respect to resolving -power for the
different plasma proteins and the
g'l'adient (LONGSWORTH
1942). It is not possible, from this meagre experimental material, to judge whether heavy cations and anions must be
abandoned in electrophoretical analyses. Further investigations on specific increments in different buffers, as well ·as
electrophoretical analyses of synthetic mixtures, must be carried
out with the highest possible caTe and accuracy. The author
would state, however, that it is not self-evident that heavy
buffer salts may be employed, and we are inclined to believe
that they are not generally applicable, in spite of the results
in 'rable 7. Let us suppose that monovalent buffer salts with
molecular weights of about 1.000 we:re available. It is impossible to deny tbat such salts would give refractive index iucrements at the boundaries of the Same order of mag'nitude
as would the colloids under investigation. They consequently
could not be used in electrophoretical analyses. Complicated
organic ions occupy a position int.el'mediate between such
hypothetical salts and ordinary light salts.
a
4. ElectropllOretical Analyses of Some Normal SHU.
An extensive literature dealing with changes in the electrophoretic patterns of sera and plasmas under pathological conditions has developed since the construction of the TISELIUS
instrument and the self-registering optical sy stems. In comparison with this large experimental material, the analyses of
normal human and animal sera are surprisingly few. The
author therefore Iound it valuable to contribute to the study
of serum and serum changes by including here as many analyses of normal animal sera as time permitted. Human sera
have not been dealt with in this paper since OLBAGEN (1945)
and LAGERCRANTZ (1945) have recently published investigations
including in all 36 analyses on normal human sera under
conditions excluding sources or error as much as possible. 1
This investigation comprises horse, cow, pig, rabbit, sheep,
and guinea pig sera, ten of each. They were dialyzed undiluted
with stirring for 24 hours or more against a 2 litre lot of
the buffer to be used. After dialysis, they were diluted 5-6
times with buffer, cleared by centrifugation, and subjected to
electrophoresis. Exposures were taken after 6 hours, lour to
six exposures in each experiment. The plates were magnified
I OJ. MOORE Ilnd
708 (1944).
LYNN
(1941) Itnd V. P. DOLE, Jonrn. CHm. Invest. 23,
13J
ARlUV FOR KlDIl, lIUNImALOGI o. Q1WLOGI. BD
22 A.
N:O
10.
d
b
I
~~
g
e
h
Fig. 32.
a. CUll' Herum. b. Gninea·Pig ReruUl. c. IIarse Rerum. d. Pig Refum.
c. Uabbit Serum. f. Sheep Herum. g. Autiliiphtheritic Horse Horum.
h. Antipneumococcic Rahbit Rerum.
5 times, and the areas were measured with a planimeter.
After dividing' by tan 0, the average areas were calculated in
each limb, and the relative composition calculated. The average
from both limbs was finall,V computed.
Mixed buffers containing phosphates and neutral sa.lts were
used ill these experiments. No systematical val'iatiolls in the
apparent composition with different neutral salts could be
detected, except that the albumin peak appen,red double in
the presence of much fluoride.
The results are collected ill Tables 8-13. A com parison
of these data with oldel' analyses of the same species (of
SVENSSON 1941) shows that the l]eW analyses have given a
definitely lower albumin content. The salUe is the case with
OLHA.GEN'S and LA.GE1WR,A.NTZ' analyses of human sera and
plasmas. This is no doubt due to superimposed colloid gradients in the older investigations, where the conductivity
disturbances were not as a rule sufficiently depressed. On the
other hand, the present analyses of cow and rabbit sera agree
satisfactorilv with those of SAN CLEMENTE and RUDDLRBON
(1943), SK!:RP, TAYLOR, BEARD, and BEARD (1942) and VAN
135
HARI{Y SVENSSON, ELECTROI'llOHESIS.
DEJ~ Scmmn, BORNEL, WYC:rrOFJo', and OLARK (1 \)42). This was
to be expected, for these authors have used low serum and
comparatively high salt concentrations. All lnvestjg'atiolls so
far carried ant all considerl1ble numbers of nOl'mal individuals
of the same species agree in showing' that there are great
individuul variations in the composition of the serum.
Typical electrophoretic patterns of some different sera are
given in Fig. 32.
Table 8.
Analyses of Normal Oow Sera.
Buffer, Ionic Strength
Serum
Dilution
1:5
1:4
l:fi
1:6
1:5
1:5
1:5
1:5
1:5
1:5
1
0.10
0. 15 1
3+.R
O.o~
0.02
0.03
0.02
Electropboretieal AnaJyses
0.18
0.18
0.18
0.18
0.10
0.10
0.10
0.10
0.10
0.10
0.10
0.10
0.10
0.10
--
Average:
I
+7.1
17.8
0.3
:16.8
3!l.9
11.1
I
6.55
().~
8.0
52.5
8.0
40.7
37.60
.U.SO
17.8
12.2
13.0
39.5
35.85
1-1.4
I
13.0
I
41.0
(l.2
17.115
I
I ;18.2
37.05
I 46.0
10.75
38.25
30.5
().,
112.3
7.15
43.0
8.15
33.4
7.6
34.95
7.85
42.4
8.2
I
37.8
Table 9.
Analyses of Normal Guinea-Pig Sera.
Serum
Dilution
Buffer Salts, Ionic Strengtb
Nfl PhosPbatel
l:fi
1:4
1:4
1:4
1: ·1
1:6
1:0
1:6
1: (j
l:fi
0.02
0.02
0.10
0.02
0.10
0.02
N~~ll NltFTUCl
0.18
O.H
0.10
0.18
0.10
0.18
O.o~
0.18
0.10
0.10
0.10
0.10
0.10
0.10
Avernge:
Electrophoreticnl A nnlyses
I
Alb. Glob.
68.5
64.4
53.2
69.0
62.05
46.8
60.5
57.7
52.8
52.6
10.6
14.1
c(
IGlob. pi
I
17.0
16.0
12.45
12.8
7.3
5.3
10.0
9.6
23.6
16.2
11J.2
1+.8
13.95
11.55
7.25
17.7+16.05
11.8+ 15.2
7.0+ 16.25
21.6
21.1
22.5
1::3.1
17.8
16.7
155.8 1 14.5
I
I
5.35
8.8
H.6
8.2
Glob. )'
I
21.5
~-
136
ARKIV FOR KEru:r,
~rrNE[~ALOGI O. GEOLOGI. DD
22 A.
N:O
10.
TavIe 1 n.
Analyses of N orrnaJ .fIorse Sera.
S erum
I
I
I
I
Dilution Na Phosphate NaCl Nab'
1 :4
1:6
1:6
1:6
1:5
1:6
1 :6
LG
1:6
1:6
Electrophoretical Analyses
Rnffer Snits, Ionic Strength
I LiCl
0.18
I
Alb. Glob.
IX
I Gloh. fl IGlub. r
37.25 3.0+7.8
29.35 5.7+ 8.~
33.3
13.8
21.8
2fl.25
19.75
36.7
O.lR
20.8
32.1
0.02
0.18
36.5 6.2+9.2 7.8+12.7
28.1
0.02
'10.2
6.7
18.0
35.1
0.18
0.10 28.6
17.55
27.95
25.0
0.10
0.10 35.s
13.4
18.2
33.1
0.10
0.10
0.10 27.56 12.7
26.6
33.15
0.10
0.10 28.0
15.75
35.0
20.Y5
0.10
0.10
24,4
17.25 20.0+ 13.4 24.45
·--~~---'---_'_-A-v-er~2.1-1-13.8 --+1~2-4-.2--·-;-1-29~.·-90.03
0.02
0.02
0.18
---'------'
Table 11.
Analyses of Normal Pig Sera.
Serum
Buffer Salts, Tonic Strellgth
I I ILiOI
Dilution Nit Phosphate NaCl NaF
1:4
];,t
1:0
1:6
1:5
1:5
1:0
1:2
1:6
1:6
0.02
0.02
0.18
0.18
0.02
0.02
0.1)2
0.18
0.111
0.10
0.076
0.18
0.10
0.10
Alb.
44.8
43.9
35.85
35.5
38.85
40.6
0.10
0.10
ElectrophoreticI11 Analyses
0.10
0.16
0.10
0.10
IGlob. IGlob. fll Glob·.-;
IX
14.4
10.5
14.15
18.40
26.65
27.15
20.05
22.15
21.95
25.5
17.0
1().15
16.0
3l.(16
20.9
13.56
16.5
14.65
1!l.76
21).5
47 0.;
14.9
] 5.7
15.0
12.0
4~.0
14.10
17.4
23.7
24.05
25.45
-12.1
40.4
-------'--._~" ._---'----.--'--~7-.----;---
Averl1l,!;c:
21.4
1 42.4 1 16-.0--1~1(1.8-125.;~
~~~---~~~-~-----~-~
137
HARRY SVENSSON, ELECTROPHORESIS.
Table 12.
Analyses of Normal Rabbit Sera.
-.
Serum
Dilution
Buffer Salts, Ionic Strength
--
. '
Electrophoretieal Analyses
I
All).
Nn PhosPlJatel NaOl/ Nali' LiCl
0.02
0.02
0.02
0.10
0.10
0.10
0.10
0.10
0.10
0.10
-.
1:6
1:6
1:6
1:5
1:6
1:6
1:6
1:6
1:5
1:6
--
-~.
0.18
IGlob. IGlob. ill Glob. r
IX
62.05
60.5
60.B
10.2
12.6
11.7
56.25
62.1
4.05
60,0
4.B
64.15
4.75
59.6
3.9
5(',.4
7.4
5.6
BO.G
0.18
0.18
0.15
0.10
0.10
0.10
0.10
0.10
0.10
Avel'a~e:
1 59.G
1
7.05
20.9
10.0
19.4
23.75
22.1
23.1
18.85
23.7
24.0
22.1
6.85
10.9
8.6
20.0
11.75
12.6
12.75
12.8
12.211.7
t
12.0
t
21.35
Table 13.
Analyses of Normal Sheep Sera.
Serum
Dilution
1:4
1:6
1:6
1:5
1:0
1:6
1:6
1:4
1:6
1 :4
Buffer S!tlts, Ionic Strength
Na
Pho~~hatel NaOlI NaF ILiCl
0.02
0.02
0.020.10
0.02
0.02
0.10
0.02
0.02
0.10
0.18
0.18
O.lB
0.075
0.18
0.18
0.10
0.18
0.18
0.10
Electrophoretlcal Analyses
Alb.
I
Glob.
IX
IGlob. ill Glob. y
4.75
63.4
7.85
46.85
6.80
48.2
7.0
flO.1
5.8
15.75
58.9
59.Q 4.85+ 10.3
54.1 5.7 + 13.65
64.0
8.75
6~.8
6.2
54.0
13.2
Aveml!I': 157.8 1
10.~
24.1
37.0
9.85
7.85
10.8
36.95
4.7
20.65
20.s
21.25
23.s
5.55
5.8
I
4.15
23.1
11.85
8.4
18.65
7.2
23.8
I
25.[)
t
138
ARKIV l"OR KEnrr, lInNER-ALOGl o. GEOLOGI. En
I).
22 A.
N:O
10.
Fraetionation of Pig' Serum.
The connection between the electrochemical fractions ::Lnd
those obtained by Pl'ecillitlttion with neutral salts, alcohol, and
dialysis against water has been iuvestigatecl by OOHN rd al.
(19-10), SVENSSON (1\:l-IJ), a,nd others. It was found tlHLt the
electrophoretical serum fractions are salted out in the reverse
order of their mobilities in the alkaline reg'ion, but with COllsiderable overlapping', The globulins insoluble in distilled water
were shown to consist of all three electroch emical fractions;
each of the latter can be split into a soluble and an insoluble
part. During" the war, continued work on human plasma alongthese lines has given results of far-reaching' pract.ical COllsequences (OOHN et al. 194-1,), anel it is hoped that the details
of the methods of fractiolllttion, so far held secret, will soon
be pnblisheel.
PEDERSEN (1945) has recentl.v published a thorough investigation of the ultracentrifugal behaviour of serum and
serum fractions. He found the following general correla.tion between the ultracentrifugal and the electrophol'etical components:
albumin has a sedimentation constant of 4.5 S., llurt of the a
g'lobulin corresponds to the heavy 20·component, f1 globulin is
identical with It la.bile X-component with varying sedimentation
constant, and 'Y globulin corresponds to the well·known 7-component. The labile X-component deserves special attention.
PEDERsmN founel that its sedimentation constant varied with
the density of the solntion and showed that it was a lipoprotein with a molecular weight of about two millions. He
aclvanced the hypothesis that it was a complex of albumin, r
globulin and lipids.
The fmctionation experiment to be described here was
undertaken in o1'eler to determine whether the electrochemical
properties of TlBI!:LlUS' fractions were constant during a fractionation procedure, or whether a disintegration of the (J complex took place. In such an investigation, it is necessary to
account for all protein in the original serUm sample. No
centrifuge tube mnst be allowed to crack, 110 washing can be
discarnec1, and every mI. of protein used in the analyses must
be taken into ::Lecount in the finalllummation. Nitrogen estimations must be carried out at each step to check that no nitrogen has escaped and that all anoJyses are cOrl·eet.
Owing' to its relatively high (3 globulin content, pig serum
was chosen for the fractionation. Its nitrogen content was
determined, and all electrophoretical analysis was carried onto
In order to make possible con venient protein analyses, an
equimolecular mixture of mono- anel dipotassium phosphates
HARRY SVENSSON,
ELJDC~'ROPHOREl'HS.
139
was used as saIting·out ~l,gent according to BUTLER and MoN'I'(1932). 200 ml. seru111 was fractionated, and the sn,lt
concentrations used to separate the fractions were chosen according to BU~'LEII, BLAT'l', anel SOD'l'HOA'l'F. (1H36). The phosphnte concentrations in the dissolved precipitates were determined by meltsuring the conductivity; an evaluation curve
rela.ting the salt concentration and t.be conc1ucti vity was con.stmctec1 before the fractionation was started. This method
has been used eal'lier by the authol' for ammonium sulphate
and found both convenieut and accnrate. The conductivity
was measured on a 1 : 100 dilution of the dissolved preci pitates.
. The precipitates were not washed, bnt dissolved and 1'8precipitated until the nitrogen content of the supernatallts
became essentially constant. The supernatants were not discarded, but united with the rest of the serum (in some instances, where the nitrogen content was extremely small, the
:supernatant was discarded, but the amouut of nitrogen was
noted and taken into account in the final summation). It could
thus not be avoided that the volume gradually grew very large;
at the end of the procedure, it was more than 2 litres.
The first precipitates were centrifuged down in cellon tubes;
glass tubes were never employed. The more soluble precipitates
could not be centrifuged, the salt solutions being too heavy;
they were filtered by suction through hardened filter papers.
Sometimes it was necessary to let such filtrations proceed over
night, but they always succeeded, the filter papers never be·came blocked. SpeciaL care was taken in washing the filter
papers and the funnels :free from nitl'ogen.
The most soluble fraction, remaining in solution after the
vhosphate concentration had been raised to 2.58 M, was not
reprecipitated. Only a small fractiol1 of it was totally freed
from protein (as tested with snlphosalicylic acid) by raising
the salt concentration to about 3.4 M; 3.0 M, as suggested by
BUTLER, BLA.TT, and SOUTHGA.'l'E, was not sufficient. This pre.cipitate was used for electrophoretical analysis.
All dissolved precipitates were dialyzed against the same
buffer, phosphate, pH 7.7 and ionic strength 0.10 + 0.10 M-LiOl;
,this buffer was also used :for the original serUlll. The fractions
were subjected to electrophoresis in It concentration not exceeding' one per cent. The m obi lities of the components were
read, and a comparison with the mobilities in whole serum
gave information regarding the identity of the components in
·each fraction. The fractions were analyzed optically as earlier
described.
The results of the analyses are given in Table 14. In tbe
first column, we find the salt concentrations at which the pre'GOMElty
140
ARRIV Fein, J{EJltI, NINgRALOOI O. GEOLOGI. BD
22 A.
N:O
10.
Table 14.
1
I Fraction
I
I
0.00-1.25
1.25-1.50
].50-2.00
2.00-2.40
2
I 3 I 4 1 5 1_6I 7 I 8 1 9 I 10 Ii
I Alb·lmoh.aIGlOh·.sIGlub.Yj Alh. IGlol).alGlob. (llmOl). yi
170
490
25.7 \74.3
\ 107
1084
84.6
I
%
6.0
12.8
20.8
15.4
52.35
31.7
48.1
2_40-2_.~8
3.0
23.5
75.2
8.95
2.M-llAO
33.8
71.2
11.15
Compo~ition
»
of
10.45
11.9
12.B
5.4
1\.75
~erllnl from anulyses of fractions II
,,»
»
original analysis
991
37
127
1111
1090
47.65
7.9
95
144
1768
2370
24
246
210
396
372
42_8
I
17_7
I
10.3
42.1
1
14. 05
1
13. 75 1 29.5
I
29_3
cipitates were obtained. The second column gives the amounts
of the fractions in per cent of whole serum, as detel'mined
by nitrogen analyses. Corrections have been appUed for the
nitrogen used up in the analyses. The third to sixth columns
contain the results of the electrophoretica,l analyses of the
fractions, also in pel' cent of the tota.} fractions. In the seventh
to tenth columns, the last-mentioned figures have been multiplied by those in the second column to give the absolute
amounts of the electrochemical components in ten-thousandths
of the whole serum. On summing vertically, we obtain the
relative amounts of TI8ELIUS' components as determined from
the fractions. For comparison, the electrophoretical analysis
of the original serum is given in the line below.
The agreement between the analyses from the six fractions
and the original serum is surprisingly good. The small differences found for a and {1 globulins cannot be considered as
significant; it is sometimes difficult to resolve these two com-ponents electrophoretically, and their mobilities in the fractions
did not check with those in the original serum as well as
could be desired.
The conclusion to be drawn from the above result is that
the mobility of a serum protein is a very stable pro-perty. It
should be recalled that the fractionation procedure described
here was rather violent. Many of the fractions were repre·
cipitated four to five times; the work, illC11.lding the lengthy
filtrations, was carried out at room temperature (in summer,.
sometimes about 30° C.), except that tbe solutions were stored
in the cold room overnight. The solutions were occasionally
wal'med to 40° O. in order to give better fl.occulation. The whole·
fractionation lasted about 6 weeks. Nevertheless, the good
HARRY SVENSSON, JI~LECTROPHOI{ESIS.
141
agreement between the analysis of the original serum and those
of the fractions shows that any demonstrable changes in the
electrochemical properties of the proteins hlLve not taken place,
except the smaH alterations in the mobilities or the a and (J
g'lobulins mentioned n,bove. This is simuttaneously the strength
and the weakness or the electrophoretical method of analysis:
many investigations ca.n be carried out and results expressed
in terms of components of fairly well-defined and constant
properties, but chflllg'es that are known to occur in such procedures as that described are not reflected in the electrophoretic patterns, and thus escape discover.V.
PEDERSEN'S hypothesis cOllceming the complex nature of
f3 globulin has not been streng·thened by the results of this
investigation, but this obviously does not prove its falsity.
Such a COmlJlex is perhaps not split by the action of neutral
salts; it is very plausible that stronger agents are needed. It
would be or value to make similar investigations using delipidation, sillce such a treatment woulel be expected to split the fJ
complex. Delipidated sera were investigated electrophoretically
by BLIX (1941); he found that the f3 globulin was still present
and that it retained its arfinit,y for lipids.
The fractionation experim ent reported here is claimed to
give further evidence of the reliability of electrophoretical
analyses, uespite the many sources of er1"Or encountered in it.
OHAPTER V.
Preparative Electrophoresis.
A. Historical.
In principle, every transference apparatus is able partially
to separate differently migrating substances from each other.
The numerous transference instruments that have been described, however, have only in exceptional cases been applied
for purification purposes.
In connection with some experiments on the electrophoresis
of protein mixtures, it was pointed out by TISELIUS (1930)
that the electrophoretical and ultracentrifugal methods of
separation have definite adva.ntages over the classical precipitation methods. The latter involved rather drastic cbanges in
the state of the solution, which changes could be feared to
bring' about partial denaturation. It is now well established
that lengthy chemical purification processes result in a partial
break-down of large lllolem.ues and in the formation of in-
142
AnKIV FOR KEUI, llUNERALOGI O. GEOLOGI. llD
22 A.
N:O
10.
homogeneous, ill-defille(l subsbnces (se8' for instance GRRENS'rEIN
19.J,.l aud PEDERSEN HH5).
An extensive use of the gentle ultracentrifllgal and electrophoretical methods for large scale purification is restnLined by
the great technical difficulties involved in the comtructioll of
suitable instmments with sufficient capacity. Pl'ep!1r~Ltive ultracentrifuges are 1l0W tLvailable and lHLve made it possible to
obtain several giant molecules in a practically pure state. The
purification of vh-uses is one of the most important applications
of this method. The electrophoretical method of preparation
has not yet found such a wide application in large scale work.
The greatest difficulty with this method is the heat genel'ated
by the current, this heat preventing' the simultaneous application of wide U-tubes [Lnd high potential gradients.
The first description of an electrophol'etical preparation by
the moving boundary method was given by BENNHOLD (1933)
who used a Michaelis apparatus. After the migration had
proceeded for a suitable time, he dipped a capillary pipette
with a warmed bulb into the U-tube. While cooling', the
pipette sucked up the protein fraction present at its end.
In 1934, 'rEtEORELT, constructed a U-tube divided by sliding'
ebonite plates into a great number of comp::ntments. This
apparatus was mainly used for analytical purposes (for transference measurements) but it was indeed well adu,pted to micropreparations. For purification on a lal'gel' scaJe, THEOHELIJ
constrllcted another apparatus in the next year (THEORRLL
1935, b). His successful purification of the yellow enzyme
(THEORELL 1935, a) gave a good illustmtioll of the usefulness
of the new instruments and of the new method of fractionation.
TISTI:LIUS' apparatus of the year 1937 is at the same time
~L moving boundary, a transference, and a preparative illstrument. Its great applicability for purification purposes was
greatly enhanced by the convenient and sensitive method of
observa.tion and by the technical arrangement afterwal'ds called
»)the compensator». The separation of phycocyanin and phycoerythrin, as described in TrsELIus' paper, is a very nice demonstration of the possibilities of the electrophOl'etical method
of fractiOllation.
TISELJUS' orig'illal construction only permitted the divi~ion
of each limb into two fractions; when necessary! tbese fructions were subdivided when the apparatus was taken into
parts. Suita.ble devices and procedures fOl' an arbitrary 8U bdivision of the limbs into several fractions bave been cles~ribe(l
by LONGSWORTH (1942) and by SAN OLEMENTE (1943).
TISELI"US' analytical instrument soon proved to be too small
£01' large-scale preparatiolls. A special preparative apparatus
HARl~Y
SVENSSON, ELEO'rnOPHORESIS.
1-13
with g'l'eatly increased dimensions was then built (TumLlus
1938). Examples of the use of this apparatus hiLVe been given
by BLIX, TISELIUS, and SVENSSON (1941).
In 19-1:Z, the present authol' described a new type of apparatus for pl'epamtive 11se. The system with sliding' cells waH
abandoned, the fractionation was instead carried out b}' suction
at eig'ht capillary tubes attached to the U-tube limbs. The
cross-sectional area was the same as in 'rISELI us' analytical
model in order to make possible the use of high potential
gradients. An arrangement was introduced VI' hereby the current could be reversed in the electrode tubes without reversing
it in the U-t.ube: in this way it was possible to use quite
small electrodes n,nd buffer volumes. The small volume or the
U-tube was compensated b.V the possibility of carrying' on the
experiment with further amounts of fresh material after the
fractionation of the first lot had been completed.
An arrangement for chang'ing the pol:ll'ities of the electrodes
was alrea,dy used 26 years ago in a simple transfeJ'ence apparatus (STEIGMAN 1920), the current being reversed once a
minute, The dimensions of the present apparatus are such that
the current may pass ill the same direction for] 2-hoUl' periods.
The ideas constituting the basis of this new construction
have been found valuable during the last few years. There
were, however, certain draw-backs in the original construction
which reducecl the convenience of its use. Most of these in·
conveniences have now been eliminated in a manner that will.
be described in the next section.
A simple, but ingenions electrophoresis apparatus for preparative pmposes was built in the year 19..J,1 by MACHlBBOEUF_
His method of sampling is essentinlly the same as that adopted
by the present author.
A theoretical treatment of the influence of different factors, above all the shape of the U-tube, on the efficiency of
a preparative appa,l'atus was given by the author in 1944. The
heat-distribution within the U-tube, and the convection currents
arising therefrom were also treated by MOONEY (1941). The
practical consequences of the theory may be summarized as
follows:
1. The separation speed, in grams of pnrifipd matm'ial
isolated per unit time, v!1ries inversely with tLe square root of the
conclup.tivity. Since high Balt concentrations also climinish the
mobilities, there are two reaS0119 for keeping the conductivity low,
2. The flat, l'ectang'lliar cells introduced by TrsELIUs nre
more efficient than cylindrical tubes; the latter require more
material to give the same separation speed. The smaller internal
dimensions of a fiat cell only slightly influence the efficiency
144
ARKIV I"OR ITEMI,
lInNERAJ~OGI o. GEOLOGI. ED 22 A. N:O
10.
of the apparatus; the larger dimensions increase it proportionally .
. 3. There is an optimum thermostat temperature that depends upon the dimel1Siol1s of the app~Lratus, the temperature
of maximnm density, amI other factors. As long- as the influence of the cOIIlmonly used buffer salts upon the temperature
of the density maximum is not completely known, however,
it is not possible to adjust the thermostat temperature to the
optimum valne.
n. Dcscription of the Prcparative Allparatlls.
The whole apparatus is shown in the perspective drawing
in Fig. 33. The U-tube A is made in one piece by cementing
plane plates tog-ether. The best material is glass; perspex
was also tried, but great difficulties were experienced in making
such a tube free from electrical leaks, and the material also
Fig. 33.
HAHl"y SVENSSON, EI,ECTROPHORESIS.
1-l5
had an inferior optical quality. The limbs are 20 cm. high
and of the cross·section 3 X 25 (3 X 50) mm., although the
dimensions can naturally be chosen at will. Five short capillary t.ubes are cemented to the U-tube, one at the bottom,
two on the upper parts of the limbs, and two on the lower
pal'ts. The capillary at the bottom is used for forcing in
the colloid solution, the others for sampling and for sharpening of blurred boundaries. The five capillaries are connected, by small rubber tubes, to long, carefully bent capillary
tubes Bl to B G• These, in tUl'll, are connected to similar tubes
nailed to the front wall of the thermostat and ending' a few
Clll. above the table (these tubes are not shown in the figure).
They are normally closed b.y small glass rods. If they are
opened, the contents of the U·tube run out slowly (the dimensions of the capillaries are chosen to give a stre~1.ming velocity
of about one drop in two seconds) and at a steady rate (the
driving hydrostatic pressure is some 50 cm., so t.hat a small
change in the level of the free liquid surface in the apparatus
is of no significance). The fractions are recieved drop by drop
in small beakers placed below the ends of the capillaries. C
is the container for the colloid solution; its volume is that
required to fill the bottom part and one limb of the U·tube.
At the top or the U-tube, the limbs end in two closed
basins E separated from each other by a, vertical wall D. To
the ceiling's or the basins, two quite short vertical glass tubes
F, 20 mm. in bore, are attached. The rubber tubes G give
the necessary flexibility and provide connection with the two
standard ground joints H. Thus the electrical insulation against
the water-bath is attained in the same way as in the analytical
apparatus.
The U-tube hangs in the horizontal metal plate I attached
to the frame J, which carries the whole apparatus, by the
metal rods K.
The electrode tubes L are 50 mm. in bore and 45 cm.
high. .A long side-tube M, attached to the bottom of the main
tube and terminating in the standard ground joint N, carries
the chloride container 0 with a narrower tube P running
centrally in M. These side-tubes are used for forcing in the
chloride solution in the beginning of the experiment and for
emptying the apparatus at its end. The electrodes Q are constructed as in the analytical apparahls and are only slightly
larger. A silver rod runs in the insulating tube R, and the
space between R and the tube S is sealed with a rubber tube.
At the upper ends, the electrode tubes divide into three vertical tubes, the central narrow tube S, and two 20 mm. tubes
T. The electrodes thus cannot be removed from the tubes.
Arki" lor kemi, min~ralo(Ji
O.
geolo(J;. Ed 22 A. N.-o 10.
10
14G
ARIUV FOR KEnn, lUINEIMJ.OGI O. GEOT,OGI. BD
22 A.
N:O
10.
This is clearly a disadvantage; a construction with a large
standard ground joint at the top of the electrode tube and
the tubes T attached to its male comlJonent lllay p08siLly be
tried in future. The apparatus can work for a very long time,
however, before the silver is so etched that the current is
broken, which i>3 the only reason for removing the electrodes.
The four connecting tubes U and the large stop· cocks V
serve the purpose of providing liquid junctions betweeu the
electrode tubes and the U-tube li.mbs. In order to make possible a change in polarit.y of the electrodes without a corresponding change in the U-tube, each electrode tube can be
connected with each U-tube limb; by adjusting the stop-cocks
V, it is possible to choose the current direction in the U-tube
independently of that in the electrode tubes. As already pointeu
out, this arrangement makes it possible to run separations
practically as long as desired.
In the previous construction, the polarity chang'c was
achieved by means of an air commutator, but this ltrra11gement
coulel not be used without shutting off the U-tube limbs from
the rest of the apparatus, owing' to convective streamings.
The present liquid commutator with two stop-cocks constitutes,
of course, the simplest solution of the problem; the stop·cocks
Jllay be turned without any perceptible disturbances. This
device was not initially introduced because such large stopcocks could not be purchased; they have now been ground
especially for this purpose.
Two short tubes X are attached to the tops of the stopcocks; they are attached by rubber tubes to the two arms of
the compensator, which is built according' to the principles
mentioned in the description of the analytical apparatus.
The optical system is the same as in the analytical model.
The use Ot a concave mirror just behind the cell is especially
advantageous in this apparatus, since it is the only possible
means of obtaining an aberration-free achromatic optical system.
Ordinary lenses at 20 cm. diameter give a very appreciable
spherical aberration, and monochromatic light is necessary.
The costs of making corrected lenses of these dimensions are
so higb as to be disproportionate to the usefulness of the
apparatus.
The concave mirroT is of 200 cm. radius of curvature and
measures 5 X 20 cm. It is spherical; a large circular spherical
mirror can be subdivided into several rectangular mirrors, which
procedure is not possible with elliptical mirrors and with lenses.
It is used with a magnification of unity. The mirror housing
is visible in the figul'e (Y). .A. metal screen Z with four vel'-
HARRY SVENSSON, ELECTROPHORESIS.
147
tical slits prevents unwanted light from entering the camera
and corresponds to the diaphragm of the analytical apparatus
in Fig. 23. ~
C. The Mallilmlation of tIle Preparative Apparatus.
The apparatus is so constructed that it need only in exceptional cases be lifted from the water bath and taken to
pieces. Filling, sampling, and emptying operations are all cal'ried out in sitn. Cleaning cannot be carried out in the thermo·
stat, but experience has shown that cleaning, except simple
rinsing, is very seldom necessary. There is no g-rease in the
U ~tube region.
Let us suppose that the apparatus is empty and the elec·
trodes well rinsed since the fOl'egoing experiment. The buffer
to be used is then -poured in through a illUnel attached to
one of the tubes X (Fig. 33). The liquid will first run down
and fill the U~tnbe. After reaching the stop·cocks, it passes
into the electrode tubes. It should be observed that during
this procedure half of the buffer passes through the U-tube
on its way to one elecb'ode tube; thus the U-tube is automatically and effectively l'insed. Almost all air in the appamtus
is forced out through the other tube X during the filling, but
a small quantity is left in the stop"cock through which the
liquid flows in; this is l'emoved later. BuffeT is poured in
until it rises in the other tube X. The funnel is then l'emoved.
The chloride funnels are lifted sEg-htly in order to remove
the ail' in the tubes M. The liquid then rises by itself to the
ground joint, and the inner tubes P are again put in place.
The sto-p·cocks of the chloride funnels aTE' opened until the
inn er tubes P are also completely filled with buffer to a level
somewhat above the stop-cocks. The buffer is also allowed to
rise above the stop"cock of the colloid container C. The apparatus is now left to cool down for half an hour.
The two tubes X are connected by rubber tubes to the two
arms of the compensator. The chloride containers are filled
with a strong', cooled chloride solution, which is allowed to
run down.
The rest of the air in the a-pparatus is simultaneously
forced out through the tubes X, and the compensator is finally
£lled with buffer coming the same way. After the chloride
has run down, the stop-cocks are closed. The level in the
compensator is reg'ulated to the desired value.
Any buffer pl'esent in the container C is removed, and the
container is filled with colloid solution. The stop·cock is opened,
and the solution to be fractionated is fOl'ced in through the
148 Al~KIV
h'uR KEMI, JlrINERALOGI O. GEOLOGI. ED
22 A.
N:o
10.
capillary A j • The rate as well as the direction of migration
can be regulated by the compensator. If both connections
between ~"pparatl1s and compensator are left open, the boundaries will migrate symmetrically in the two limbs; if one of
them is closed, the corresponding boundary ceases to migrate,
and the colloid rises only in the other limb. The speed can
be regulated by adjusting the level in the compensator.
The filling can also be carried out with both connections
to the compensator closed, but it is then neceflsary to open
One 01' two of the outlet capillaries . .A very convenient method
is to open the lower left·hand and the upper right-hand capillary when opening the stop-cock at C. The colloid solution
will then migrate Ul_) to these capillaries; if a small quantity
is allowed to run out by these paths, the boundaries are most
effectively sharpened and it is impossible that they move too
far. The method of making boundaries by forcing in the
heavier solution from the bottom is of COUTse much inferior
to that employed by TI>ll!]LIU8 in bis analytical apparatus, but
if the former method is combined with a subsequent sharpening'
in the manner just described, it results in boundaries COlliparable with those obtained in the TISELIUS model. When
the sharpening is complete, as judged by observations ill the
camera, the capillaries are closed; the lower capillary must
obviously be closed long' before the upper one.
The stop-cocks are turned into their correct positions, if
this haf:l not already been done, and the current is closed in
the propel' direction. Reaclings are made if necessary; otherwise the apparatus can be left to itf:lelf until the fastest
boundary has reached the top capillary in the ascending' limb.
If the apparatus cannot be run in the same direction for so
long a time, a polarity change must be undertaken before; it
is most suitable to make this change when the boundaries
have proceeded half the distance_ The current is revel'sed on
the instrument board, and the stop-cocks V are simultaneously
turned through 180°.
After the first boundary has reached the top capillary,
the current is broken, and the first sampling- follows. The
container C is ag'ain filled with solution, and its stop-cock is
opened. If the upper left-hand capillary is now also opened,
the fastest component will run out that way drop by drop.
It is received in a small beaker. .A_ mixture of the first and
second components then follows when the second boundary
has arrived at the capillary. Th is is watched in the camera,
and the beaker is changed at the rig'ht moment. The fractionation is continued until all boundaries bave UllHed into
one very sharp boundary. The final fraction is always a mixI
HARR Y SVENSSON, ELECTROPHORESIS.
149
tUl'e of all components, like the original solution, since the
last boundary is in general the 0 boundary.
The stop-cock at C is now closed, and the connection between the left hand limb and the compensator is opened instead. In this way the upper left-hand capillary is rinsed with
buffer coming from above. The capillary is then closed, and
the upper right-hand capillary is opened. The right-hanc1limb
is then emptied in the same manner llS the left-hand limb
before. At first we obtain a fraction of the slowest component
in pure forll, then a mixture of the two slowest component,s,
and so on. 'rhe last fraction, obtained during the sharpening
of the lowest boundary, is a mixture of all components. Since
it has a concentration other than that of the original solution, it should not be mixed with the latter.
After the sampling, we have again two sharp boundaries, one at the lower left-hand, the other at the upper righthand capillary, i. e. the original conditions. After reversing
the current d.irection and turn ing the stop-cocks V throtlg'h
0
180 , the current is aga,in closed, and the second phase of the
experiment can begin.
The procedure may be modified in many ways. It is natura,lly possible to start at the upper left-band and the lower
right-hanel capillaries. The sampling can begin in the Tighthand as well as in tbe left-hand limb. The compensatoT
IJeed not be used, the necessary hydrostatic pressure being'
obtained by l)ouring in more chloride in the proper container
and opening the appropriate stop-cock. In the fractionation
of large volumes of colloid, however, this method is not advisable since much buffer is thus lost. By the procedure of
emptying the descending limb first, the boundary positions
are reversed in the second phase as compared with the first;
the current can then be reversed in both U-tllbe and elecb'ode
tubes when starting the second phase, and the comilll1ta,tol'
s'ystem need not be used. The latter is necessary, however, if
the poles must be changed before the fastest component has
travelled through the entire limb.
The procedure described is not practica,ble for the last
quantity of colloid solution to be fractionated, since the fresh
material is pressed in simultaneously with the sampling. If
no more material is available, however, the last fractionation
can be carried out with an arbitrary heavy solution instead;
this is forced in throng'b the bottom capillary.
In evel'y phase of a fractionation, a certain amount of the
original solution is recovered frOID the outlet capillaries in a
somewhat diluted form. These fractions may, if desired, be
mixed and fractionated once more in the same 'Way.
150
ARKIV FOR KENI, NINERALOCtI O. GEOI,OGI. BD
22 A.
N:O
10.
It is most convenient to select the voltage and other conditions so that samplings can be carried out in the morning
and in the evening. In routine work, the apparatus then requires management for one hour in the morning and one hour
in the evening, and the electrophoretical separation proceeds
during the day and overnight.
The necessity of using the compensator. for its original
purpose, in order to keep the slowest boundary resting at the
starting position, seldom prevails, since the slowest boundary
is in most cases the 0' boundary, which moves very slowly or
not at all. In exceptioual cases, where the colloid concentration
can be chosen very low in relation to the salt concentration,
the 0' boundary may be negligible. It is then permissible to
compensate it through the bottom of the U -tube. This must
never be done with It plainly visible boundary, since the result
will be convection iu the other limb. That the 0' boundary is
generally appreciable is evident from the circumstance that
the yield per unit time of purified substances increases with
the colloid concentration and decreases with the conductivity
of the buffer.
The apparatus is emptied by suction in the chloride and
colloid containers. Since the latter is connected with the Utube by a thin capillary, the latter procedure takes some time,
but the c8l1tr{1l part of the apparatus must be emptied in this
way. It should be observed that the electrodes are already
effectively rinsed free from chloride solution when the electrode tubes are emptied, the whole content of the latter passing
the electrodes on its way to the pump. If an additional washing is j udgecl necessary, it should be carried out before the
central part of the apparatus is emptied.
Summary.
In the first chapter, a geneml theor.y of electrical migration is given, The only assumption underlying this theory is
that of sharp boundaries; since the theory itself permits judgement of whether the boundaries are sharpened or blurred
during the migration, there is never any doubt concerning
its quantitative applicability.
With 11 ion species present. in the system, an originally
sbarp bonndary between two solutions of arbitrary compositions will split into n - 1 boundaries, one resting and n - 2
moving bonndaries. The resting boundary is identical with
the well-known 0' or Ii boundary. The boundaries are cha.racterized by the so called boundary mobilities U' and U", one
HARRY SVENSSON, ELECTROPHORESIS.
151
calculated from the conductivity on the anodic, the other from
that on the cathodic side of the boundary.
If all ion species are present in both original solutions, no
boundary will move with It true ionic mobility; such boundaries
are called false boundaries. The conditions of obtaining a
boundary with the mobility of a certain ion is the absence of
this ion in one of the original solutions. Exact information
regarding the conductivity to be used for calculating the field
strength is given.
The theory is claimed to be valid for ordinarv as well as
for colloid ions. and its later part deals mainly with the electro·
phoresis of colloids. An expression for the conductivity change
at a moving boundary is derived, and the influences of differ·
ent experimental conditions on the boundary anomalies are
discussed in detail. It is found that the specific charge of the
colloid and the mobilities of the buffer ions exert a great infiuence. With decreasing mobilities of the buffer ions, the
boundary anomalies gradually diminish, and, if a buffer ion
with the same mobility as the colloid can be found, the anomalies totally disappear.
The changes in ionic concentrations and refractive index
at moving boundaries are next considered. It is shown that
all ions present change their concentrations at every boundary
and that the refractive index increment at a moving colloid
boundary, contrary to the generally accepted view, is not due
to the colloid alone. The possibilities of choosing such experimental conditions that this ideal state of affairs is appt'oximated to, are investigated and discussed. The magnitude
of the a gradient is derived on the assumption that the two
-original solutions are in complete Donnan equilibrium with
each other.
Other sources of error, such as electrode reactions, electro-osmosis, and convections, are briefly discussed in a special
section.
Chapter II contains a description of the TISELIUS electrophoresis apparatus, including some improvements made during'
-the last few years. Directions for the use of the apparatus
are given.
Chapter III deals with the method of observation, theol'eticaIly and descriptively. An elementary theory of the crossedslit method is first given, the diffraction of light being' neglected. After a consideration of the light-intensity and the
factors exerting an influnce thereon, the diffraction is subjected
to a detailed study, The thickness of the curve is derived,
and the resolving power of the method calculated and dis-cussed. The chief factor influencing the resolving power is
152
ARKIV FOR RElIII, lIIINERALOGI O. GEOLOGI. ED
22 A.
N:O
10.
the cell thickness, but the active distance between the horizontal slit and the cell is also of some imllortance.
In the next section, the SOllrces of error in the method
are analyzed. The errors due to curved and inclined paths of
light through the cell l11'e first treat.ed. This necessitates a
thorough mathematical analysis of the light-path in an inhomogeneous medium. Errors ill the form of wrong shape
and wrong position of the peak, and wrong enclosed area· are
calculated in terms of properties of the gmdient and of the
appal'atns constants. It is shown that cells much larger than
was to be expected can be used in this method, chiefly because
it involves one more parameter than other similar methods:
the plane on which the camera objective is focused.
Errors due to optical imperfections in the lenses and glass
plates are next considered. The requirements to be satisfied
by the different components are listed.
In the next section, a description of the optical components
is given. A crossed-slit arrangement with concave spherical
mirrors instead of lenses is described here. This possesses a,
higher resolving power than the lens system and is completely
aclll'omatic, but it is inferior to lens arrangements in certain
other respects. The chapter ends with directions for adjusting'
the optical system and with methods for experimental determination of apparatus constants.
Chapter IV, headed »Electrophoretical Measurements», commences with a section describing 130me experiments which
verify the predictions of the theory in the first chapter. It
is necessary in this connection to measure the charge of thecolloid, which has been done by a new method based on combined electrophoresis and conductivity measurements on solutions in Donnan equilibrium. If the method is combinecl with
chemical anal,Yses, it is possible to determine the extent to
which diffusible ions are bound to colloids.
The second section goi ves a survey of the factors influen cingthe mobility and the isoelectric point of a colloid, the boundary
spreading, and the conditions for obtaining correct mobilities.
Two esselltiall,Y different methods of measuring' mobilities are'
treated, one with depressed boundary anomalies, where theboundaries diffuse and spread normally, and another with
pronot1nced boundal'Y anomalies, where the measurements can
be made on very sharp boundaries. The latter method, which
necessitates a complete knowledge of false moving boundaries.
and of the conductivity that must be employed, has not yet
been applied to colloids, and the possibilities of this are limited.
This section ends with some mobility stt1dies on serum proteins and haemocyanin, which apparently lead to the c011clu-
HARRY SVENSSON, ELEOTROPHORESIS.
153
sian that the affinity of proteins for diffusible ions increases
with the size of the latter.
In the section, :,Electrophoretical Analyses», a survey of
all sources of errol' is first g'iven, followed by a description of
the conditions which appear to warrant correct analyses. The
applicability of electrophoretical analyses have been tested on
a mixture of known composition and on two immune sera,
which were investigated in differE'nt buffers. Oorrect results
are obtained in most buffers, but doubts ere 1'ai8e(1 concerning
the applicability of heavy ions. It can, at all events, be stated
that the usefulness of such ions must be critically investig·ated
more than has been dOlle hitherto. 60 analyses or sera from
normal individuals of horse, cow, rabbit, pig, sheep, and guineapig are next presented; it is found that the individual variations are comparatively great; and tbat the albumin content
is lower than many older analyses have shown. The section
ends with a description of an investigation where pig serum
was subdivided by potassium phospbate into six fractions with
increasing solubility, and each fraction, as well as the original
serum, was analyzed electrophoretically. The analyses of the
fractions are found to check with that of the original S~l'um
within the experimental errors. This gives a further proof of
the l'eUability of electrophoretical analyses, if carried out carefully; it also shows that the mobility is a fairly stable property that does not greatly change during a rather violent
fractionation procedure.
In the final chapter, a review of fractionation and purification by the moving boundary method is given. A preparative apparatus is described, charactm'ized by a new sampHng
device: the fractions aTe sucked out through side capillaries
011 the U-tube walls. A further amount of fresh matedal to
be purified is simultaneously forced in from a bottom capillary, and the experiment is allowed to proceed. The apparatus
thus works continuously, al1d it is equally well adapted to
small and large volumes. A special commutator device makes
possible the nse of quite small electrodes and electrode tubes,
despite a practically unlimited fractionation capacity.
154
ARlUV FOR KEMI, MINERALOGI O. GEOLOGI. BD
22 A.
N:O
10.
Referen 008; R. Abegg and W. Gaus, Z. PhysilmJ. Chern. 40,737 (11l02).
- H. A. Abramson, Electrokinetic Phenomeua, New York 1034. - H. A.
Abramson, L. S. Moyer, and M. H. Gorin, Electrophoresis of Protoins and
tho Chemistry of Cell Surfaces, New York 11l42. - G. S. Adair amI M. E.
Adair, Biochem. JonI'll. 28, 190, 1230 (1034). - C. Alvarez-Tostado, .Tourn.
BioI. Chem. 135, 799 (1040). - S. Arrhenius, Nova Acta Reg. Soc. Sci. Upsa].
IV, 12, No I) (1940). - T. Astrup and C. H. Helm, Natnrwiss. 31, (1943).
- G. A. Ballou, P. D. Boyer, and J. M. Luck, Jonrn. BioI. Chem. 158, III
(1945). - H. Bennhold, Koll. Z. 62, 129 (1933). - G. DUx, A. Tiselius,
and H. Svensson, JOl.lrn. BioI. Chern. 137,485 (1941). - G. BUx, ,Tourn. Bio!.
Chern. 137, 4% (1941). - R. B. Blodgett, Phys. Rev. 55, 301 (1931l). - T. R.
Bolam, The Donm\n. Equilibria, London 1932. - J. W. Burns and L. K.
Henke, Rev. Scient. lnstr. 12, 401 (1041). - E. F. Burton, Phil. Mag. 11,
425 (10D6). - A. M. Butler and H. Montgomery, Journ. BioI. Chem. 99,
173 (1932). -A. M. Butler, H. Blatt, and H. Southgate, ,Tatun. Biol. Chom.
109,755 (1935). - E. J. Cohn, T. L. McMeekin, J. L. Onc1ey, J. M. Newell,
and W. L. Hughes, Jomn. Arner. Chern. Soc. 62, 3a8l1 (1940). - E. J. Cohn,
J. A. Luetscher Jr, J. L. Oneley, S. H. Armstrong Jr, and D. D. Davis,
Jonrn. Amer. Chern. Soc. 62, 33HlI (1940). - E. J. Cohn et al., Chemical, Clini·
eal, and Immtffiological Studies on the Prodncts of Hlmlan Plasma Fra.otiona·
tion. Journ. Clin. Invest. 23,417-505 (1944). - G. R. Cooper, JOUl'll. Bio!.
Chern. 158, 727 (1!l45). - B. D. Davis and E. J. Cohn, Journ. Amer. Chern. Soc.
61, 2002 (1039). - V. P. Dole, Journ. Arner. Chern. Soc. 67, 1110 (11)45). J. Duclaux, Jonrn. Chim. Phys. 7, 405 (1900). - A. Dumanski and A. G.
Knig,a, Roll. Z. 39,40 (102(\). - L. Engel anrl W. Pauli, Z. Physilml. Chem.
126, 247 (1027). - N. Fell, K. G. Stern, and R. D. Coghill, Journ. Immuno!.
39, 223 (1940). - W. G. France and E. R. Lang, Rev. Seient. InEtr. 12, 32
(lOU). - A. Fresnel, Oeuvres, Paris 1819. - R. Gans, Ann. Physik, 4.
Folge, 47, 709 (1915). ;_ J. P. Greenstein, Adv. Prot. Chern. 1, 201)
(1044). W. Hacker, Kol1. Z. 62, 37 (1033). - - - , Kol1. Beih. 41,
147 (19:35). - J. L. Hall, Jourri. Arne!'. Chern. Soc. fJ.J, 794 (1941). _.
N. F. Hall and M. P. Sprinkle, Journ. Arner. Chern. Soc. 54, 34(\\] (1032). E. Hammarsten, Biochem. Z. 144, 383 (1924). - G. Hansen, Z8iss Naohrich·
ten 3, 302 (1940). - W. B. Hardy, Joul'n. Physiol. 33, 251 (1905). - G. S.
Hartley and J. L. Moilliet, Proe. Roy. Soc. London A 140, 141 (1!J33). _K. Hoffman, Kol1. Z. 85, 328 (1938). - F. L. Horsfall, Ann. N. Y. Acad. Sci.
39, 20a (19a9). - R. A. Kekwick. Biochem . .Iourn. 33, 1I22 (19aO). - - - ,
Trans. Farad. Soc. 36, 47 (1940). - F. Kohlrausch, A.nn. Physik Chern.,
N. F .• 62, 209 (1897). - H. R. Kruyt, Koll. Z. 37, 358 (l021l). - H. R. Kruyt
and P. C. van del' Willigen, Koll. Z. 44, 22 (1928). - C. Lagercrantz, Ark.
Kern. Min. Geo!. 19 A, No 7 (1944). - - - , Upsala Lakareforenings INirhand·
lingar, Ny Foljd, 51, 117 (1\)45). - O. Lamm, Z. Physilm!. Chem. A 138, 31B
(1928). - - - , Nova Acta Reg. Soc. Sci. Upsa.J. IV, 10, No 6 (1037). - lVI.
von Laue, Z. Anorg. Chem. 93, 329 (WIll). - M. A. Lauffer, .Tonrn. Amer.
Chern. Soc. 66, 1105 (11)44). - G. N. LewiS, Journ. Amer. Chern. Soc. 32, SlIB
(1910). - O. Lodge, Rep. Brit. Ass. 1880, 381). - E. von Lommel, Abh. Bayr.
Abd. Wiss. 15, 531 (ISBG). - L. G. Longsworth, Journ. Amer. Chern. Soc.
52, 1904 (1930). - - - , JOUl'1l. Amer. Chern. 1300. 61, 529 (1930, n). - - - ,
Ann. N. Y. Acad. Sci. 39, 187 (1930, b). - L. G. Lon~swol'th, T. Shedlovsky,
and D. A. MacInnes, Journ. Exp. Med. '70, 390 (1939). - L. G. Longsworth
and D. A. MacInnes, Chern. Rev. 24, 271 (1939). - - - , Journ. Amer. Chern.
Soo. 6'2, 705 (1940). - L. G. Longsworth, Ann. N. Y. Acad. Sci. 41, 267 (1941)
- - - , Cham. Rev. 30, 323 (1942). - - - , JOUl'n. ArneI'. Chern. Soo. 60'
1755 (1943). - - - , Joum. Amer. Cllam. Soc. 66, 449 (1944). ~ - - , Journ:
IlARRY SVENSSON, ELECTROI'rrORESIS.
155
Amer. CIWlll. So('. (ji" 110U (IIl·iii). - J. A. Luetscher, .Journ. Amer. Chem.
Roc. G1. 2888 (lll:Hl). --- H. P. Lundgren, D. W. Elam, (tufl R. A. O'Connel,
.Joum. BioI. Chem. II!!, 183 (l\J.t3). -- A. S. McFarlane, Biochem ..Tourn.
:?ri. 120U (lllaii). - - - . TrnnH. Famc!. SoC'. 31i, 2,;7 (11140). - M. A. Macheboeuf, Compt. rend. Soc. BioI. 135. 1241 (1941). - M. A. Macheboeuf anft
A. M. Monnier, Compt. rend. ~!j,f"t(1. Sci. 214, 1002 (IU42). - D. A. MacInnes,
I. A. Cowperthwaite, !lud T. C. Huang, Journ. Amer. Chflln. Soc. 4.'). 1710
(11127). - D. A. MacInnes, I. A. Cowperthwaite, nnd T. Shedlovsky,
.Tourn. Amer. Chem. Soc. 51, 2671 (lll:l!]). - D. A. MacInnes and L. G. Longsworth, Chew. Hev. 11. 171 (19il:l). - O. Masson, Phil. Tmns. Roy. SOlO.
London A 1.92. 331 (1899). - L. Michaelis, Biochem. Z. 1G. 81 (1909). M. Mooney, in IlTemperatul'e, its ivreasurenllmt and Control in Science and
Industry,), New York HI-U, p. 428. - D. H. Moore and J. Lynn, ,Journ. BioI.
Chern. 141, S19 (lH41). - D. H. Moore, Journ. Amer. Chern. Soc. 64, 1090
(1942). - J. Mukherjee, Proc. Roy. Soc. LOIldon A 103, 102 (Hl2:{). - W.
Nernst, Z. Elektrochem. 3, aDs (1897). - J. H. Northrop, JOUl'll. Gen. Physiol. 25, 465 (l94:l). B. 0lhagen, Studies on Thermostabile Anticom·
plementary Human Scra. Stockholm 1!l45. K. O. Pedersen, Ultl'acentrifugal Stuflies on Serum and Sel'mn FmctionR, Uppsala 1945. G. E. Perlmann and D. Kaufman, .Tourn. Amer. Chern. Soc. 67, 638
(1945). J. S. L. Philpot, N!Lture 141, 2S:{ (1938). - H. Picton and
S, E. Linder, Journ. Chom. Soe. London 71, 1)68 (1897). - M. Planck, \Vied.
Ann. 39, 166 (1890). - F. Powis, Joum. Chem. Roc. London, 109, 734 (1916).
- P. H. Prausnitz aud J. Reitstotter, Eloktrophores8, Elektroosmose, Elektrodialys8 in li'lilssigkeiten, Drosden mId Leipzig 1!}31. - C. P. Roe £Iud R. H.
Ewart, Journ. Amer. Chem. Soc. G4, 2628 (1Il42). - B. Riemann and H.
Weber, Die partiellen Differontialgleichungon del' mathernatischen Physik,
5. Auflage, Br!LlUl8chweig 1910. - A. Rothen, .Tourn. Gen. Physiol . .?4,
203 (1940). - - - , Journ. (ien. Physiol. 25, 487 (HJ42). -C. L. San Clemente
nnd I. F. Huddleson, Mieh. State Techn_ Bull. 182, 3 (1943). - C. L. San
Clemente, Proe. Soc. Exp. BioI. Mod. 54, 82 (1\143). - H. Schardin, DaH
Toeplersche Schlierenverfahl'en, Berlin 1034. -'_ N. D. Scott and T. Svedberg,
Jouru. Amer. Chem. Soc. 46, 2700 (1924). - D. G. Sharp, A. R. Taylor,
D. Beard, and J. W. Beard, Journ. Immunol. 41, 115 (1942). - D. G. Sharp,
M. H. Hebb, A. R. Taylor, and J. W. Beard, JOUrll_ BiD!. Chern. 142, 217
(1042). - T. Shedlovsky, Joul'n. Amer. Cham. Soo. 52. 1793 (1930). - T.
Shedlovsky and J. E. Smadel, Jonrn. Exp. Med. 72, 511 (1940). - E. R.
Smith, Bur. Stand .•JoUI'n. Res. 6, 1117 (1931). - A. M. Sookne and M. HarM
ris, Textile Res. I), 374, 437 (11.130). - A. Steigman, Koll. Z. 27, 37 (1920).
- J. Steinhardt, Bur. Stand. Journ. Res. 28, 191 (1942). - E. Stenhagen
and T. Teorell, Trans. Farad. Soc. 35, 743 (1939). - K. G. Stern, AIm.
N. Y. Acad. Sci. 34, 147 (1!l30). - IL G. Stern and D. DuBois, Yale.Tourn.
BioI. Mee1. 13, 1309 (1941). - K. G. Stern, Rev. Scient. Instr. 14, 187 (lfl43).
- T. Svedberg and H. Andersson, Koll. Z. 24, 15u (1919). --- T. Svedberg
nnd E. R. Jette, JourJ1. Amer. Chem. Soc. 45, 954 (1923). -- T. Svedberg
and A. Tiselius, Jouru. Amer. Chem. Soc. 48, 2272 (1926). - T. Svedberg
and K, O. Pedersen, The Ultl'acentifuge, Oxford liMO. - H. Svensson,
Koll. Z. 87, lSI (1939). - - - , Koll. Z. 90, 141 (1940). - - - , Joul'n. BioI.
Chern. 139, 805 (1941). - ---, Ark. Kern. Min. Geol. 15 E, No H) (1942). - - , Ark. Kern. Min. Geo!. 1'1 A, No 14 (1943). - - - , in »The Svedberg 1884 30/8 1944», Uppsala 1944, .p. 213. - S. S!l.verborn, A Contl·ibuHan to the Knowledge of the Acid Polyuronides, Uppsala 1945. H.
TheoreIl, Biochern. Z. 275,1 (1934). - - - , Biochem_ Z. 218,263,291 (1935).
_ M. J. Thovert, Ann. Physique. Sel. 9, 2, 3tH! (1914). - A. Tiselius,
Nova Acta Reg. Soc. Sci. Upsal. IV, 7, No 4 (1930). - - - , Trans. Farad.
Soc. 33, 524 (1937, a). - - - , Biochem. Journ. 31, 1464 (HJ37, b).
- _ , Svensk Kem. Tidskl'. 50, 58 (1938, a). - - - , Koll. Z. 85, 120 (1938, b).
- A_ Tiselius and E. A. Kabat, .Journ. Exp. Meel. 69, 119 (193H). - A. Ti-
156
ARKIV FOR KEnn, ltrINlmALOGI O. GEOLOGI. UD
22 A.
N:O
10.
selius, J-ourn. Franklin Inst. 228, 797 (1939). - A. TiseUus nnd F. L. Horsfall, Ark. Kern. Min. Goal. 13 -1, No 18 (1039). - A. Tiselius, Harvey Lectures,
Ser. 35, 37 (1939/40). - - - , Rep. Proe. 3rd Iutern. Congr. Microbial. 1940,
54. - A. Tiselius and H. Svensson, Trans. Famd. SOL'. :3/J, 16 (1!J40). H. P. Treffers and D. H. Moore, Se:ienoe 93, 240 (11)41). -_J. Van der Scheer,
E. Bohne!, F. H. Clarke, and R. W. G. Wyckoff, .loul'll. ltnnnmol. 44, lun
(1942). - H. Weber, SitzungsbPl'. Akad. Wissensch. Berlin 1897, il36. W. C. D. Whetham, Phil. Trans. Roy. So~. London A 184, :~37 (VHl3). W. R. Whitney and J. C. Blake, ;Journ. ArneI'. Chem. ~o~. 26, 1331l (HlO4).
- A. Winkelmann, Hancllmch del' Physik 6, Leipzig 1\)on.
'l'ryckt den 9 tebruari 1946.
UpPslIlll 1946. Almqvist &; Wik&ells Boktl'ycke~i AB
ARKIV ]'OR KEM!, MINERALOGI OCR GEOLOGI.
BAND 22 A.
1'1:0 11.
On the Structure of Complex COlupounds of Bivalent Molybdenum. II.
X·ray Analysis of [MoaC1sl (Cl 4 • 2 H2 0) . 6 H2 0.
By
aYRILL BROSSET.
With 3 Figures in the text.
Communicated November 14th 194.6 by A.
WESTGREN and G. HAGG.
Some months ago I started an investigation on complex
compounds of bivalent molybdenum. As the first step in this
investigation, an X-ray analysis of the compound
(Mo GCI s](OH)4' 14 H~O,
was performed whereby the existence of the group [MoaCls]
was established [BRasSET, (1945)]. In this group the eight
chlorine atoms lie at the corners of a cube which is face
centered with molybdenum atoms. As it seemed to be of great
interest to establish whether other types of complex compounds
with bivalent molybdenum are also built up of these peculiar
[MooClsl groups, an X-ray analysis of the compound [MasCI,!·
·2 Hs01Cls . 2 HsO [this formula is given by LINDNER, HALLER,
and HELWIG (1923)] was undertaken.
The compound in question was originally prepared by
BLOMSTRAND (1859). He obtained it as a crystalline precipitate
from a solution of dichloride in moderately dilute hydrochloric
acid, and, as a result of his analysis, ascribed to it the formula MosCI",· 01 2 + 3 H 2 0. LINDNER, HALLER, and HELWIG
(1923) have studied a series of compounds which are fOl'med
by hydrolyses from the chloroacic1 R[Mo aCl 7 • H 2 0], 3 H 2 0 (the
formula proposed by the authors last mentioned). They found
that in the first step of the hydrolysis, i. e. when only a small
Arkiv fOr kemi, minera!o(!i o.
[J6ologi.
Ed 22.d. N;o 11.
1
2
ARKIV FOR KE1tn, llUNERALOGI O. GEOLOGI.
BD
22 A.
N:O
11.
n,mount of wn,ter is added to a strong' hydrochloric solution
of the chloroacid, a crystalline body is pl'ecipitn,ted which from
their analysis and dehydratatioll investigations was given the
formula [Mon0l,! . 2 H 2 0j012 . ~ H 20. Although this formula COlltains one more molecule of water than BL01tlS'l'I1AND'S formula
LINDNER, H,U,LER, and HJ'~LWICI, nevertheless, consider it to
be the same compound. The lower water content found by
BLO]lSTRAND is probably due to the characteristic ease with
which this compound looses water.
I prepared [Mo H01 4 • 2 H 30101 2 • 2 H 20 in the following way:
dichloride was dissolved in hydrochloric acid 1 : 1 (t ~ 80° 0)
and the saturated solution cooled to room temperature. By
this procedure chloroacid is precipitated in the form of very
thin needle-shaped crystals. The desired compound was then
obtained from a saturated solution of chloro!1cid in hydrochloric acid 1: 3 (in my paper cited above the strength was
erroneously stated as 1 : 1).
The compound [MoaOl'l . 2 H 2 0JOI2' 2 H 20 crystallizes in very
thin yellow coloured tetragonal plates. No good Laue photographs could be obtained. Nor were the powder photographs
satisfactory, as, with few exceIJtions, they showed only tbe
reflections from the faces 00 l. N evel'theless, they could be
used for the exact calculation of the lattice constants. Fortunately, rather good rotation and Weissenbel'g photographs
were obtained, making it possible to solve the problem. 1
The compound crystallizes in the tetragonal system. The
dimensions of the unit cell were found to be
a = 9.001,
c
=
28.041,
V= 2302
1n.
As the densit,y was found to be 2.29, the unit cell must contain 24.01, e. g. 24, formula units of MoCl 2 • 4/3 H 2 0.
The intensities of the reflections in the W eissen berg photographs show the following regularities:
and
1 All X.ray crystallographical notations used in this paper are in ae·
cordance with the International TallIes. For metho<1s of calculation see
BRQSSET (HI45).
BROSSET, COMPLEX COMPOUNDS OF BIVALENT MOLYBDENUM.
n.
3
."':\,
O/t
.-"'-'h.»'l!'-~\.->.~___'c'i
.'': 1
b
!1
Ii'.
b
a
Fig.!.
Fig. 2.
This indicates that the compound in question may crystallize
in the crystal class D.u, -4/m m m. Further, the following types
of reflections are missing:
hkO with h
hkl with
Okl with
+ k = 2n + 1
1= 2 n
1= 2 12
+1
+
1.
This is characteristic of the space group D 4 h B-P4/nec.
As the structure problem of [MooOls](OHL' 14 H 2 0 could
be solved by means of Patterson analysis it was natural to
use the same method in this case. Projections of the Patterson function on planes perpendicular to the c and a axes
were made (Fig. 1 a and 2 a). The projections were founded
on values of 1"1.;0 and hOI estimated visually from the Weissenberg -photographs no 1 and no 2 respectively (Tab. 1 and 2).
The IFI2 were obtained as usual by division of the corresponding' values of 1 by the factors dependent on the ang'le
(with the exception of the temperature factor). As a consequence of the investigation of [Mou01sJ (OR).! ·14 H 2 0 (l. c.l, it
is very probable that the stronger peaks reproduced in Fig.
1 a and 2 a are caused by Mo-Mo distances in the lattice in
question. The first problem was thus to find a distribution of
24 Mo in the unit cell that could explain the peaks in the
Patterson projections. It was easy to establish that the only
distribution of Mo consistent with tIle grouping of the peaks
in tIle Pattersou projections is the following:
4
ARRIV FOR REMI, MINERALOGI O. GEOLOGI.
ED
22 A.
N:O
ll.
Table 1.
Weissenberg photograph no. 1. Ou Ka radiation.
Tt k l
200
400
600
800
1000
1~lllC'1
I~.stiJJl·11
Int.
lOt.
HO
1
0.0
880
~!llc'l E~tilll'll
lDt. h k l I~l\lC'1
Int. E~tiru.
It k Z/ mt.
lilt.
110 101 1 100 1220
310
3 1 420
7
3 620
- II 510 7
Ii
710
'7
820
10
910
0.4
20
11 10 29
_- -_ - - _-
2
0.0
Ihfl8
:I
72
1
1
-----640
840
In •
5
3
----
II ~alt· IE~tim'll
-
\)
11
1
16
It Ie
550
750
950
I-
0.4
--
27
(l
--- -
660
860
6
\J
Int.
-
50
30
-
-
;3 30 34
liilO 11
'lilO 4
9;3 0
0.1
1 20
10
5
-
- - -- - - 'l 7 0 0.1
-
2
970 13
20
20
- - - - - - - - - - --- --- - -
2
13
16 Mo at 16 (g):
x~O.'JO; y~O.19; Z-0.10;
4 (c): z
~
0.34;
4 Mo at 4 (c): z
~
OAB.
4 Mo at
The vectors representing all possible Mo-Mo distances calculated with theAe parameter values are represented in Fig.
1 band 2 b. As is seen the ends of the vectors coincide with
the stronger peaks in the Patterson projections. The distribution of Mo atoms given above, however, implies the presence
of octahedral Moo groups with nearly the same dimensions
as in the structure of [MooOIs] (OH}4' 14 H 20. It was then
natural to assume that the lattice was, in this case also, built
up of [MoaOlsl groups, with the eight chlorine atoms lying at
the corners of a cube, face centered with the six molybdenum
atoms. For the remaining four chlorine atoms the following
two alternatives seemed to be possible:
1. Six chlorine atoms surrounding the [MouClsl group in octahechal configuration, four of them being shared between
two groups.
2. Four chlorine atoms lying at the corners of a square and
surrounding the [MoaOls) group.
From spacial considerations alternative 1 is impossible, while,
for the same reasons, alternative 2 seems probable.
This gives the following arrangement of the chlorine atoms:
BROSSET, COMPLEX COMPOUNDS OF BIV.A.I,ENT JlIOLYllDENUllL II.
5
Table 2.
Weissenberg photograph no. 2. Ou KeY. radiation.
hId
I
I E~tim.\\
mt.
Culc.
into
225
7
31
(>
20
-
-
-
150
10
30
15
24
41
84
0.1
20
20
40
100
-
19
20
-
0.8
O.n
-
3
3020
3022
3024
3026
3028
3030
3032
3034
5
100
100
4
3
89
30 4
30 (\
30 8
3010
3012
3014
S01(J
3018
10
8
IE)
127
10
16
0.1
0.1
0032
!l 0 2
-
0.3
26
0030
0034
100
25
35
0,0
15
17
6
4
3
0.0
0.6
2
])4h 8
I~nlc'l
mt. E~tiru'll
mt.
II
I
00 2
00 4
00 6
00 8
0010
0012
0014
0016
0018
0020
0022
0024
0026
0028
hkl
[>
-
5
-
-
II
10 2
10 4
10 6
10 8
1010
1012
1014
1016
1018
1020
1022
1024
1026
1028
1030
1032
1034
266
20
0.1
40 0
40 2
40 4
40 6
40 8
4010
4012
4014
40 J6
<1018
4020
4022
4024
4026
4028
4030
4032
4034
11
0.1
1
200
10
-
7
-
0.0
12
16
13
[>
-
0.1
0.1
0.0
0.0
--
20 0
20 2
20 4
20 6
20 8
2010
2012
1
2014
! 2016
2018
2020
2022
2024
2026
2028
2030
2032
2034
5
- I
3
0.0
13
2
IEstim.
ICnlc.
into
into
9
0.2
11
16
1
19
0.0
0.6
0.0
0.1
1
-
(>
10
10
-
O.n
2
1
0.0
-
-
0.0
I
0.0
0.1
5
I
-
10
-
10
20
17
3
19
0.1
0.7
1
0.0
3
0.8
-20
-
-
-5
(\
I
I)
5
5
12
2
0.0
0.6
0.2
0.1
3
hId
I
-
I
I
16 Cl at 16 (g): x ~ 0.23; y ~ 0.08; ;Z ~ 0.04;
1601 at 16 (g); x-0.23; y~0.08; ;Z~0.10;
16 01 at 16 (g): x ~ 0.23; y ~ 0.08; z ~ 0.90.
The intensities calculated from this arrangement of the molybdenum and chlorine atoms was found to approximate sufficiently closely to those observed ror the arrangement to be
6
ARKIV FOR JLElIII, MINEHALOGI 0, GEOLOGl.
ED
22 A.
N:O
11.
considered as correct in principal, and it was possible to continue with the placing of the remaining atoms, £, c. 32 H 2 0.
This could be done only from spacial considerations.
Remsmbel'ing the structure or [MouC1Hl (OR),,' 14 H 20, it
seemed reasonable to place two oxygen atoms at each [MooCl s]
group, thus forming together with the outer four chlorine
atoms, an octahedron surl'Ounding the [MooCls] group. 'l'he
remaining 24 oxyg'en atolls should then be placed in such a
way as to fill up the available space and give the whole
structure a convenient stability.
From these considerations the following arrangement of
the oxygen atolls was attained:
D4h
8
40
40
40
40
]60
at 4 (a);
at 4 (c): z ~ 0.27;
at 4 (c): z,.., 0.53;
at 4 (c): z ~ 0.17;
at 16 (g): x ~ 0.2{\; y"" 0.1l0; z,.., 0.29.
After t,he fin111 l1djustment of the parameters with the help
of the observed intensities, and, in the case of the oxygen
atoms, by considering the space available, the following atomic
arrangement was obtained:
Dil!
B
16 Mo at
4Mo at
4Mo at
16 Cl at
1601 at
1601 at
40 at
40 at
40 at
40 at
160 at
16 (g): X=0.40; y=0.185; z = O.IOO;
4 (c): z = 0.3:36;
4 (c): z = 0.4(\4;
16 (a) : x = 0.23; Jj = 0.08; Z = 0.031);
16 (g) : x = 0,23; !J = 0.08; Z = 0.1(;4;
16 (g): x = 0,23; Y = 0.08; z = O.QOO;
4(a) ;
4 (c): z = 0.268;
4 (c): z = 0.032;
4 (c): z = 0.108;
16 (g): x = 0.2M;; y = O.'JOO; 8 = 0,286.
As is seen from Tables 1, 2, and 3, the intensities calculated
with these parameter values agree satisfactorily with those
observed in the photographs.
The lattice of the molybdenum chloride in question is built
up of [MooCls] (C14 ' 2 H 20) groups (Fjg. 3 c) forming double
BROSSET, COJ\lPLEX CONPOUNDS OF BIY ALENT llIOLYBDENUM. II.
7
Table 3.
Weisscllberg photograph no. 3. Cu Ka l'aclia,tion.
hk I
I~~lc'l E~tiU1'11 It k I I ~alc'l E~tiUl'11 hk I IC:lllc'l E~tilll'!lli
mt. I k I I~alc'l
mt. E~tiIll.
lilt.
I
lilt.
lllt.
1111
01 2
265
'!
11 2
0.0
01 4
20
5
11 4
0.0
01 (3
0.1
01 8
7
0110
0.0
-
11 6
1
11 8
0,7
-
1110
0,0
3
0112
12
10
1112
0.2
0114
16
10
1114
\l
011(1
13
10 1111 HI
11
0120
lllt.
lllt.
I
11 0
0118
lllt.
I
12
0.1
10
1118
0.8
- , 1120
- i 1122
- 11124
- 1126
- 1128
- 1130
0.2
?
\1; i
I
0122
0.1
0124
0.0
0126
0.0
0128
3
0130
0.0
0132
13
0134
2
5
-
0.0
0.0
0.0
0.1
4
\ 1132
O.G
1118l
1
\I 21 1 14
2 0.2
\ 21
, 21 3
0.0
-4 I
0.1
5
3
121 6
1121 7 0
0.1
121 8
Ii 21 9 1
- 2110 0.5
2111
0.0
- 1 2112 0.7
, 2113
1
10
2114 0.,1
2115
0.1
11211(3 0.1
[)
'2117
2
2118
0.0
I 2119 0.0
- )2120 0.0
0,1
2121
- 112122 0.2
0.9
2123
2124
0.1
2125
0.0
- 2126 0.1
0,0
1 2127
- 2128 0,0
1
,21 21l \ 0,1
- 12 I 30 0,0
2 IllI
0.3
- 11 2132 0.0
1
- 1,2133
0.0
[2134
I
\
31 0
10
2
5
20
-
lSI
11
1
" 31 2
3
\ :-11 4
lis 1
'in
5
(i
7
:l
0.0
0.2
8
23
38
1
131 7 a
: 31 8 1
- 131 \) 10
22
- : 3111 6
- i 3112 0,0
- [ 3113 0.5
- 11311,1 0.0
- ,13115 O.S
- 1,\ :JIll} 0.4
jl:{ 117
0.1
- 113118 0,0
1311\)
0.1
- i l 3 120 4
- i 3121 :1
- 3122 2
0,9
3123
2
- I1 3124 3
a
1 3125
- I 3126 4
-- S 1 27 0.0
0.1
3128
0.0
3129
0.0
3 I 30
0,3
3131
0.0
3132
- 3133 0'0
- 313o! 3
r
'O
-
I,
-
20
10
-
-
15
30
30
5
-
10
15
5
-
-
--
-
-
-
I
3
3
5
5
5
--
-
!
:
1
----- " - - -I
layers, the latter being separated from each other by water
layers (Fig. 3 a). In the centers of these groups we have six:
molybdenum atoms lying at the corners of an octahedron (Fig"
3 b and c). The distances Mo-Mo are 2.{jg A and 2.62 A. In
the compound [Mo uC1 8] (OR)" - 14 H~O the corresponding distances are 2.G4 A and 2.62 A. Eight chlorine atollls lying at
the corners of a cube, nearly face cent.ered by the molybdenum
atoms, have the following distances from each other: 01-C1 =
= 3.01 A and 3.GIl A. Opposite the centers of four of the cube
8
ARKIV FOR KEll1I, lIHNERALOGI O. GEOLOGI.
ED
22 A.
N:O
11.
o Mo
00
Qel
Pig. 3.
faces lie chlorine atoms, and opposite two of them oxygen
atoms. The distance between a chlorine atom belonging to
this .outer shell and its neighbours in the inner shell is 3.58 A.
The outer chlcn:ine atoms seem to influence the positions of
their respective molybdenum neighbours, causing the greater
Mo-Mo distance 2.69 A as comP.ared with 2,621, The distance Mo-Ol in question is 2.48 1.
The structure arrived at makes it reasonable to attribute
the following formula to the compound:
[M0 6 0ls] (014 • 2 H 20) . 6 H 20.
The chemicll'! and shuctural analogy between this compound
and [MosCls] (OR);' 14 H 20 (BROSSET, l. c.) is obvious. Both are
compounds of the radical [M060lsjH (Fig. 3 b), for which I suggest the llame chloromolybdenum (2). The chloromolybdenu11l (2) .
group is able to act as the central group in complexes having the
coordination number six. It can join with many different ions
and water as ligands. Thus the compound [MooOls] (OR),! .
. 14H2 0, which for certain reasons (BRassET, l. G.) may also
be represented by the formula [MooOls] (OH)e' (2 RnO . 10 H 20),
is simply chloromolybdenum (2) hydroxide and the compound
[MosCIs] (01 4 , 2 HP) . 6 H 20 chloromolybdenum (2) chloride.
The crystal structure arrived at for the chloromolybdenu11l (2)
chloride explains several of its physical and chemical proper.
ties. The fact that cj a is about 3 and that the lattice is of
layer type are both consistent with the crystal shape. The
BROSSE'l', COllIPLEX COMPOUNDS Oll BIVALENT lIIOLYBDENU111. II.
9
configuration of the chlol'omolybdenulll (2) group implies a considerable stability. That is probably the reason why only 1/3 of
the chloride atoms ill chloromolybdellum (2) chloride can be precipitated with silver ions, Only the four chlorine ions functioning as ligands are precipitated, while the eight of the ch101'0molybdenum (2) group a,re too strongly bound and thus do not
take part in the precipitation reaction. It is, however, true that
this behaviour of the chlol'omolybdenum (2) group in solution
would be the same even if the group were halved through a
dissociation process, but it is hard to imagine a MosCIJ COllfiguration where all molybdenum and all chlorine atoms have
the same coordination respectively and thus a high deg'l'ee
of stability.
As has been indicated above the configuration of the groups
containing bivalent molybdenum present in solutions provides
a very interesting field of research which I intend to attack.
Farther, I will state that the cl·.fstallographical investigations
of compounds with bivalent molybdenum, tungsten, and tantalum will be continued. Calculations on the structme of
chloroacid are in pl'og'l'ess.
Summary.
A com pound hitherto denoted as
[Moa0l4 • 2 H 2 0] C1 2 • 2 H 20
has been investigated with X-ray crystallographical methods.
The following data were obtained:
Crystal class D4h-4bnm,m.
The most probable space group Du B_ P 4/'/1 C c.
The dimensions of the tetmgonal unit cell
a = 9.06
c = 28.04
1,
1.
Atomic positions:
D4h
B
16 Mo at 16 (g):
4 Mo at 4 (c):
4 Mo at 4 (c):
16 01 at 16 (g):
16 01 at 16 (g):
16 Cl at 16 (g):
x
= 0.40; y = 0.185; z =
z=
0.336;
Z =
0.464;
0.100;
x = 0.28; y = 0.08 ; Z= 0.036;
x = 0.28; y = 0.08; Z = 0.164;
x = 0.28; Y = 0.08; e = 0.1)00;
10
ARKIV FOR KEMI, ll[!NERALOGl 0. GEOT,OGI.
40
40
40
40
16 0
a.t
!1t
at
at
l1t
4 (a);
4- (c):
4 (c):
4 (c):
16 (g):
fe'
=
BD
22 A.
N:O
11.
0.268;
S = 0.532;
.~ =
;;c
=
O.IG8;
0.25(j;
y=
O.~)OO; .:;=0.285.
The unit cell contains foul' molecules of the compound. Its
formula is
The compound may be considered as a chloride of the hexanuclear mdieal [Mo(lOlslH. The name chiorolllolybdellum (2) has
been suggested for the latter.
I beg to express my gratitude to the LBT'l'ERSTEDT foundation which has supported this investigation by a grant.
For assistence in part of the experimental work I should
like to thank Miss G. BERGSTROJlI.
Stockholm Un-iversity, Institute of Geneml and Inorg'allic
Ohemistry, November 19J,5.
Ref ere n ~ e s: Blomstrand, W. (1859), ,J. fiif pl'ukt. Cll. 77, 88. Brosset, C. (1945), Arkiv f. kemi m. m. Bd 20 A. N:() 7, 1. - Lindner, K.,
Haller, E. rmd Helwig, H, (1923), 1':. anorg. aUg. ell. IfJO, 201).
Tryckt den 10 jnTIul1.ri 1946.
UPllsala. 1946. Alm'l.vist & Wlksells Boktryckori AB
ARKIV FOR KEMI, MINERALOGI OCH GEOLOGI.
BAND 22 A.
N:o 12.
----"""--"---------------------~
A Method for the Quantitative Determination of
Glucosamine and N·Acetylglucosumine
in the Presence of Other Sugal·s.
By
L. HAHN.
With 3 Figures in the text.
Communicated November 28th 1945 by
ARNE TlflELIUS
and KARL MYRBACK.
As glucosamine and N-acety 19i1lcosamine are essential components of many biologically important polysaccharides and
glycoproteins, convenient methods for their quantitative determination are needed. The method most employed for the
determination of glucosaminB is that of ELSON and MORGAN
(1), later modified by BOYER and FURTH (2), NILSSON (3), PALMER,
SMYTH and MEYER (4) and SORENSEN (5). With the aid of
acetylacetone in alkaline solution, the glucosamine, according
to this procedme, is converted into a IJYl'role derivative giving
a colour reaction with p-dimethylaminobenzaldehyde characteristic for pyrroles. The method has been found to give good
results when used for the determination of glucosamine in,
among other things, acid hydrolysates of simple proteins and
glycoproteins. It cannot, however, be used for the determination of mixtures of glucosamine and N-acetylglucosamine, since
the latter compound reacts with acetylacetone and alkali in a
different way.
The method for the determination of N-acetylglucosamine
described by ZUCKERlrANDL and MESSINER-KLEBERlI1ASS (6) and
modified by MORGAN and EI,SON (7) is based on a reaction
somewbat similar to that of the ELSON-MoRGAN glucosamine
method. N-acetylglucosamine, after treatment with dilute alkali
at 100°, gives a red-purple coloration with p-dimethylaminobenzaldehyde. ZUCKER1UNDL and MESSINEl?-KLEBERMASS asArkiv 16T kemi, mineralogi o. geologi.
Bel 22 A.
N;o 12.
1
2
ARKIV FOR REnlI, MINERALOGI O. GEOLOGI.
BD
22 A.
N:O
12.
snmed that a pyrrole derivative was formed by the treatment
of N-acetylglucosamille with alkali. MORG AN and ELSON (7)
and MORGAN (8) later gave, however, evidence of the formation
of an oxazole 01' oxazoline ring, and WHITE (9) finally established the formation of a glucoxazoline in this reaction.
MEYER and collaborators (lOr did not succeed in using the
MORGAN-ELSON method for the determination of free acetylglucosamine ill enzymic hydrolysates of hyaluronic acid. They
obtained values fOl' acetylglucosamine, which exceeded the total
dry weight of their preparations. The present author has had
similar experiences (11) llsing the method of ZUOKERRANDL and
MESSINER-KLEDEl~MASS. On comparing the kinetics of the cyclization of N-acetylglucosamine and of enzymic split products
of polysaccharide acids, great differences between the cyclization rates of these compounds were found. The split products
obtained by the action of testis mucopolysaccharase on hyaillronic. acid, for eX[Lmple, are converted into oxazoline compounds
at a much higher rate than N-acetylglucosamine. Prolonged
treatment with alkali leads to a considerable destruction of
the cyclic derivative. Rydrolysates of hyaluronic acid obtained
by the action of other enzymes, as well as enzymic split products
of chondroitin sulphuric acid, react, on the other hl1nd, much
IUore slowly with alkali (11, 12). The colour reaction with
p-dimethylaminobenzaldehyde is thus unsuitable for the determination of N-acetylgll1cosamine in such enzymic hydrolysates.
In the search for another method for the determination
of N-acetylglucosamine and glucosamine in such investigations,
my attention was drawn to the ease with which glucosamine
is oxidised to gll1cosaminic acid by mercuric oxide at neutral
reaction (13)1. In the following account a new method for the
determination of glucosamine and N-acetylglucosamine will be
described, which depends upon the oxidation of these sugars
by mel'curic chloride in neutral and slightly acid solutions and
colorimetric estimation of the excess of mercuric chloride with
the aid OT diphenylcal'bazide.
0
At 100 mercuric chloride is reduced at an appreciable
rate by glucosamine already at pH 5.8. At this pH mercuric
chloride is subject to scarcely any reduction by N-acetylglucosamine or by ordinary monosaccharides, On the other hand,
mel'curic chloride at pH 7.4 is reduced both by glucosamine
and N-acetylglucosamine, whereas at this pH, glucose, mannose,
galactose, ambinose, raffinose and glucuronic acid stilt show
no or only an inconsid.erable red.ucing power. .A. slow but
1 I am indebted to Prof. G.
new method.
BLIX
for suggesting the principle of the
L. HaHN, GI,UCOSAlII:INE .A.ND N-.A.CETYLGLUCOB.A.MINE.
3
~
~
.!;
EO
~24
g>
.~
20
"6
] 16
-5
t
:l; 12
.~
::s
8
.l,!
~
'E;"
¥
glucose
-::!
0
E:
Ii
5.5
6.0
6.5
pH-
7.0
7.5
Fig. 1. Reduction of mercuric chloride by glucosl1millc-HCl and !lcet,ylglucos·
amine I1t dif!ereut pH values.
considerable reduction of mercuric chloride is, however, brought
about by fructose at pH 7.4.
From Fig. 1 it appears that the reducing power of glucosamine is practically constant between pH 6.0 and 7.6, whereas
that of acetylglucosamine increases successively from 6.0 to
7.4. At the last mentioned pH the molar reducing powers of
glucosamille and N-acetylglucosamine are pl'actically the same.
Cousequently, glucosamine IDay be determined in the presence
of other Bugars by measuring the reducing power of the solution at pH 5.8-5.9. The determination of N.acetylglucosamine
can be carried out by measuring the reduction of mercuric
chloride at pH 7.4. If the solution contains glucosamine in
addition to acetylglucosamine, two analyses, one at pH 5.8-5.~1
and the other at pH 7.1, are necessary to give the concentrations of both substances.
I. Determination of N.acetylglucosRmine and glucosRmille
at pH 7.4.
Reagents:
Mercuric chloride, 5 per cent in water.
Buffel' solution of pH 7.4, obtained by dissolving' 0.19 mol
Na2HPO'1' O.OB mol KH 2PO! and 0.80 mol sodium acetate 1 in
1000 ml water.
Cresol red, 1 per cent in water.
1 The reduction values obt[1illed are somewhl1t inflnenced by the presence
of [1cetic acid. This errol' is eliminated by carrying out all determinations
in the llresenca of an excess of sodium acctnte.
4
ARKIV FOR KEJI1I, JI1INERALOGl O. GEOLOGI.
BD
22 A.
N:O
12.
Standard N -acety19lucosamine solution containing 0.5 mg/ml.
Acetic acid, 3 pel' cent in water.
1/25 M sodium bicarbonate solution (made shortly before
the analysis).
Diphenylcarbazide solution, obtained in the following way:
300 mg of the substance is dissolved in absolute alcohol by
gentle warming, cooled al1d made up to 100 m!. This solution
is kept cool and must be freshly made each day.
Procedure:
2.6 ml of the mercuric chloride solution is diluted with the
buffer to 50 rol. To 2 ml of this mixture is added 3 ml or less
of the solution to be investigated. The added quantity of the
sample should not contain more than 1.1 lIlg glucosamine-HCl
or acetylglucosamine. Each analytical series comprises in addition two standard tests (each containing 2 ml of the standard
acetylglucosamine solution) and two blanks. To each test two
drops of cresol red are added and the pH, if necessary, adjusted
to 7.4 with 0.1 M NaOH or 0.1 M acetic acid, using the standard
tests for comparison. All tests are then made up to 8 ml,
simultaneously immersed in a boiling water bath for 20 minutes,
cooled and acidified by adding 1 ml 3 per cent acetic acid.
The mercurous chloride precipitated is filtered off, the filter
(paper filter of 5 em diameter) is washed three times with 5 rul
water and the combined filtrates made up to 25 ml. 2 ml of
this solution is mixed with 3 ml sodium bicarbonate solution.
Thereafter 2 rul of the diphenylcarbazide reagent and 10 ml
913 per cent ethyl alcohol are added. The solution is well mixed
and after keeping for 90 min. at room temperature its light
absorption is measllred in a Zeiss step-photometer, using' filter
S 53.
II. Determination of glucosamine at I)H 5.9.
Reagents:
Mercuric chloride, 5 per cent in water.
Buffer solution of pH 5.9, obtained by dissolving 0.02 mol
Na 2 RPO,J, a,nd 0.18 mol KH 2 P0 2 in 1000 mi water.
Bromocresol purple, 1 per cent in water.
Standard glucosamine solution containing 0.6 rug g'lucosamine-HOI/ml.
Acetic acid, 3 per cellt in water.
1/25 M sodium bicarbonate solution.
Diphenylcal'ba.zide soh1tion, obtained as above.
Procedure:
2.6 ml of the mercuric chloride solution is diluted with the
buffer to 50 ml. To 2 ml of this mixture is added 3 rul or less
L. HAHN, GLUCOSAnlINE AND N-ACETYLGLUCOSAJI[lNE.
5
A
0.5
1.0
mg. aCflfylgllJcosaminfl
B
10
20
30
1r0
50
duralion of Mating
Fig. 2. Reduction of mercuric chloride by N':lcetyJglu~os!lmine :It pH 7.4.
of the solution to be investigated, containing not more than
1.2 mg glucosamine-HCl. The pH is adjusted to 5.[1 using the
standard for comparison and one drop of bromocresol purple
as indicator. The tests are made up to 8 ml, immersed in a
boiling water bath for 30 minutes, cooled and acidified with
0.5 ml 3 per cent acetic acid. The determination is for the
rest performed in the same way as described under I.
6
ARKIV I<'(iR KElIH, MINERALOG! O. GEOLOGI.
llD
22 A.
N:O
12.
The results of a number of determinations by methods I
and II are given in Tables I and Il and in Fig. 2 A. -Within
the concentration range investigated, there is a linear l'ela'
tion between the amounts of mercuric chlOl'ide reduced and
the amomlts of glucosamine and acetyIglucosamine oxidised.
The presence of small amounts of neutral salts, such as N aCI
and N a 2S0,1, did not influence the reduction. Larger amounts
of sodiL1m sulphate disturbed the estimation. As glucuronic
acid lllay be present in hydrolysates of mucopolysaccharides,
it is of special importance that this substance has no reducing
power under the conditions employed.
Table I.
Determination of glucosamine and N ·acety Iglucosamine at pH 7.4.
0.5
1.0
1.0
1.0
1.0
rug N.acetylglucosaruine
»
»
»
»
»
»
»
+ 10 rug
+ 10 »
+100 »
+ 2 »
+ 4 »
+ 4 »
»
1.0
"
»
1.0 »
»
1.0 »
1.0 »
0.5
gluco8atninG·HCl
)i>
1.0 "»
1.0
2.0
4.0
2.0
4.0
4.0
·1.0
4.0
2.0
0.5
Per cent mercuric
chloride reduced
• 43, 42
• 86, 85, 87, 85
· 86, 85, 84
.84, 86,
.86, 84
· 85, 83, 85
· 85, 87,
• 8 11, 86
.83, 86
.43, 42
· 85, 84, 84
.87, 8~
1, 0
1
1,
, 27, 25
1
0,
1, 0
2,
J
1
0,
0
0,
.83, 85
»
»
"
Naei
N::t 2 S0 4
acetic acid
glucuronic acid
glucose
m!lllnOSe
»
»
glucose,
+
4 mg gnlactosa
»
»
»
fructose
m£lllllOSC
» gl11uctose
» £Imbillose .
» rnffinose
» gll1CllrOllic acid
);
N.acetylgllwos:tUline
. . . . .. . ....
+ 0.:, JUg glllcosnmine·HCl
Table II.
Determination of glucosarnine at pH 5.1).
1.0 mg glncoslUuine·HCl
1.0
»
1.0
1.0
1.0
1.0
2.0
1.0
2.0
»
»
))
»
»
»
»
+ 10 mg Nael •
+100 » NaCl .
»
10 » Na 2 SO{ .
»
+100 » NI1,SO •.
»
+ 10 » N It-l\Cetate
N·acetylglllcosaminB
»
+ 1.0 rug gll1cosallline·HCl .
glucose.
),
),
.
.
.
Per cent of mer·
curie chloride re·
duced
• 81, 81, 80, 80
,80, 81
.80, 83, 81
.80, 78
.48, 46
.82, 82
9, 10
Il,
.85, 84
0
OJ
L. HAHN, GLUCOSA.:nnNE AND N-ACETYLGLUCOSAlIfINE.
7
2.5
0.5
20
'to
60
80
100
120 min.
lime of colour d~lItZlopmQnf
Fig. 3. Colour reaction of 5 rug mercuric chlotide with the diphenyJcar·
bazide reagent.
A strict simultl1neity in heating and cooling' the standards
and tests is necessary, sillce the reduction is not a stoichiometric
reaction and changes very mpidly with the time of heating
(Fig. 2 B). The photometric readings should be made between
90 and 120 min. after the addition of reagent (Fig. 3).
When the solution to be analysed contains both acety 19lucosamine and glucosamine, two determinations must be made,
one at pH 5.9 and the other at pH 7.4. The amount (in mg.)
of N-acetylglucosamine (.A.) and of glucosamine (G) are calculated
with the aid of the formulae:
G = R 2 _A.
k
where
Rl = reduction of test (in percentage of mercuric chloride
reduced) at pH 5.9
R2 = reduction of test at pH 7.4
kG = reduction value of 1 mg glucosamine-HCl at pH 5.9
IrA = reduction value of 1 mg N.acetylglucosamine at
pH 5.9
k = reduction value of 1 mg glucosamine·HCl or N-ac~
tylglucosamine at pH 7.4.
8
ARKIV FOR
KEMI,
MINER.A.LOGI O. GEOLOGI.
ED
22 A.
N:O
12.
Example.
2 ml of a solution containing 0.20 lUg acetylglucosamine
and 0.25 mg glucosamine-HCl per ml was analysed. At both
pH values three determinations were carried out:
Rl = 39.4, 41.9, 42.3, average 41.2
R2 = 74.0, 73.7, 77.8, average 75.2
k n = 80, kA = 4.6 and k = 85 (according to the results given
in Table I and II).
A = 0.40 mg and B = 0.41) mg.
The accuracy of the method is naturally not very great
when only single determinations are performed. The method
cannot be used in the presence of proteins or hydrolysis products
of proteins, as these react with the mercuric chloride.
'{'he method was tried for the determination of N-acetylglllcosamine and glucosamine in enzymic hydrolysates of hyaluronic acid and chondroitin sulphuric acid.
1) Hyaluronic acid from the vitreous body of cattle eyes,
prepared according to BLIX and SNELLM.A.N (14), was hydrolysed
with mucopolysaccharase from 01. pel'fringens at pH 4.0 for
120 hours. The enzyme preparation was purified as described
previously (11). The dialysed hydrolysate was concentrated
in vacuo until it contained 20 mg reducing substance pel' ml
(calculated as glucose according to HAGEDORN-JENSEN). 1 ml
of this solution was then adsorbed on a column of 1.2 g carboraffin C. The split products adsorbed were displaced from
the adsorbent by forcing a 1 per cent solution of ephedrin
through the column. The eluate was collected in 3 rol fractions.
It was possible in this way to separate two carbohydrate
compounds, one of which was free from ephedrin. This carbohydrate had earlier been found to show the same behaviour
as N-acetylglucosamine in the TISELIUS adsorption analysis
appumtus (11). Using the method of HAGEDORN and JENSEN,
1 mg of this substance was found to give the same reduction
value as 1 mg synthetic N-acetylglucosamine. With the mercuric chloride method O.lll) rug acetylglucosamine and 0.01 mg'
of glucosamine per g were found. - This result gives further
evidence of the identity of the split product in question with
N-acetylglucosamine. The mercuric chloride method may thus
also be used as a qualitative test.
2) Hyaluronic acid from umbilical cord tissue was digested
at pH 4.6 with highly purified testis mucopolysaccharase, which
was free from illuco-oligosaccharase activity. 1 m} of the dialysed
and concentrated reaction mixture showed with the HAGEDORNJENSEN method a reduction corresponding to 0.99 mg N-acetylglucosaruille. The mercuric chloride method at pH 7,4. indicated
L. HAHN, GLUCOSAlllINE AND N-ACE'l'YLGLUCOSAlllINE.
9
the presence of 0.28 mg glucosamine + acety 19lucofiamine per
ml (only 28 per cent of the H.-J. value).
3) Hyaluronic acid from vitreous humor was similarly digested
with mucopolysaccharase from leech, purified as earlier described
(11). '1'he H.·J. method gave 0.31 rug of reducing substance
per illl of the hydrolysate, calculated as N-acetylglucosamine.
With the mercuric chloride method no glucosamine [Lnll 0.09
mg acetylglucosamine pel' ml were found, this being 29 per cent
of the H.-J. value.
4) Chondroitin sulphuric acid from cartilage was dig'ested
at pH 4.fl with purified testis mucopolysaccharase for 8 uays
at 37 '1'he reaction mixture was dialysed and concentrated
and further treated in the following way. To 110 ml of the
solution were added 109 barium acetate and 250 ml absolute
alcohoL The precipitate obtained was dissolved in water, reprecipitated with alcohol and dissolved in 50 ml water. The
split products were fractionated by precipitating with 10 aIld
20 per cent alcohol. The fraction obtained by precipitation
with 10 per cent alcohol contlLined 16.7 per cent Ba and 19.4
per cent reducing substance expressed as acetylglucosamine,
according to the H.·J. method. The SOllIOGYI copper method
gave 5.1 per cent reducing substance as acetylglucosamine and
the ZUCKERKANDL-l\if:ESSINElt-KLEBERMASS method indicated 3.8
per cent of the same substance. With the mercuric chloride
method 5.0 per cent acetylghlcosamine (26 per cent of the
H.-J. value) and no glucosamine were found. The fraction
precipitated with 20 per cent alcohol contained 22 per cent
acetylglucosamine accol'rung to the H.-J. method and G.O pel'
cent of this substance according to the mercuric chloride method
(27 per cent of the H.-J. value).
'1'he reduction values obtained by the mercury method for
the split products of hyaluronic acid and chondroitin sulphuric
acid are thus (with the exception of the monosaccharide separated
from the -rerfringens hydrolysate) appreciably lower than those
obtained by the HAGEDORN·JENSEN method. Three possible
explanations of this discrepancy can be put forward. 1) A
large part of the free reducing gl'onps present in the split
products belong to the glucuronic acid. 2) Oligosaccbarides
with terminal a-amino aldehydic groups formed in the enzymic
degradation of mucopolysaccharides may have a much lower
capacity of reducing mercuric chloride than N·acetylglucosamine. 3) The reducing power of the split products measured
by the fel'l'icyanicle method is much higher than that of N-acetylg-lucosamine (or glucose, glucosamine, glucuronic acid). With regard to 1), it must be mentioned that earlier investigations of the breakdown of hyaluronic acid with testis mucoQ.
10
.A.RJ{lV FOR KElIlI, lIIlNER.A.LOGI O. GEOLOGI.
BD
22 A.
N:O
12.
polysaccharase indicated that only glucosaminidic links were
split by this enzyme (12). Tbe leech mucopolysaccharase seems
also to be a glucosa.minidase. If this is true, no free reducing
groups belonging to g'lucuronic acid should be present in such
hydrolysates. This explanation seems, therefore, to be less
probable than explanations 2) and 3). Further work will be
necessary to decide whether the mercury method can also be
relied upon for the determination of bound glucosamine and
acetylglllcosamine with free reducing groups.
Summary.
A new method for the quantitative determination of glucosamine and N-acetylglucosamine is described. The method
depenus upon the ability of these sugars to reduce mercuric
salts at slightly acid and neutral reaction respectively, while
other sug'ars (with the exception of fructose) reduce mercuric
salts onlJ at alkaline reaction.
The determination of glucosamine is carried out at pH 5.!).
In the absence of glucosamine, N-acetylglucosamine can be
estimated at pH 7.4. If both sugars are present two determinations must be carried out, at pH 5.0 and 7.4.
Glucose, glucuronic acid, g'alactose, mannose, arabinose and
raffinose do not disturb the determinations.
This work has been aided by a grant from »Konung Gustav
V:s 80 aI'S fond».
Institute of Medical Chemistry, University of Upsala.
Ref(Hencos: 1. L. A. Elson and W. T. J. Morgan, Biochem. J., 27,
1824 (1933). - 2. R. Boyer and O. Furth, Biochem. Z., 282, 242 (1935). 3. J. Nilsson, Biochem. Z., 285, 386 (1936). - 4. J. W. Palmer, E. M. Smyth,
and K. Meyer, J. BioI. Chem., 119, 401 (1037). - 6. M. Sorensen, C. r. Lab.
Cadsberf( Ser. chim. 22, 487 (H)38). - 6. F. Zuckerkandl and L. MessinerKlebermass, Biochem. Z., 23G, 10 (1931). - 7. W. T. J. Morgan and L. A.
Elson, Biochern. J., 28, 998 (1934). - 8. W. T. J. Morgan, Biochern. ,J., 30,
1)09 (193(;), Chem. & Iud., .57, 1191 (1038). - O. T. White, J. chern. SOD.,
1040, p. 428. - 10. K. Meyer, E. Chaffee, GI. L. Hobby, (Illel M. H. Dawson,
J. expo Med., 73, 301l (194-1). -U. L. Hahn, Ark. f. kom. miner. gool., Sor.A, 19,
No. 33 (1945). - 12. - - , Ark. f. kern. miner. goal., SOl'. A, 21, No.1 (1045).13. H. Pringsheim and G. Ruschmann, Bel'. d. deutsch. chem. Ges. 48,
080 (1915). - 14. G. Blix and O. Snellman, Ark. f. kem. miner. geol., Ser.
A, 19, No. 32 (1945).
TI'Yl',kt c1en 19 jUlllluri 11)46.
UllPsala 194G. Ahllqvist & WikseUs Bolct!,)"ckOl'i AB
ARKIV FOR KEMI, l\UNERALOGI OOH GEOLOGl.
BAND 22 A.
N:o 13.
NukleOlll'oteide in nOl'lllalen und cancerosen
Ze.Ileu. IV.
Schonend isolierte Desoxyribonuldeinsallren
aus Zellkel'nen.
VOll
L. AHLSTROM, H. v. EULER lmd L. HAHN.
lIIit 7 Fignrcn im Text.
]\Iitgeteilt
[till
28. Novelli her 1945.
Die t'xpel'imentellc Erfol'schullg' del' Nukleoproteide und
ihl'el' Rea.ktionen in den K erIlen normaler und eancer{iser
Zellen erfordel't in erstel' Lillie clie Herstellung reinel' und
clefinierter N uldeinsaul'e· Prii para te, Aus del' lleueren Entwicklung'
del' Nuideoproteiclchelllie geht niimlich hel'vor, dass Desoxyribonukleinsauren iill Verlauf del' Mitose in fl'eiem Zustancl
auftreten uncI sieh dann mit Protein en wieder zu N ukleopl'oteiden vereinigen, welehe den hauptsiiehliebell Bestandteil del'
Obromosomell bilden.
Es ist eines del' Ziele diesel' U ntersuehungsreihe, native
Nnkleinsii.uren mit gewissen Proteinen ill vitro zu kombilliel'en
und die elltstehenden Produkte mit nativen N ukleoproteiden
zu vergleichen.
Mit einer niedl'igmolekulal'en N ukleinsiinre sind eillzelne
diesbezi.1g·liche Versucbe bereits angestellt worden I, Inclessen
weJ'den Beobachtung-ell fLD N ulcleoproteiden biologisch um so
interessanter, je mehr sich die untersucbten Priipamte clem
nativen Zustaml niihel'n. Aus diesem Grund wurcle an g'estl'ebt ,
Nukleillsiiurell im natii.l'lichell Polymel'isationszllstund dul'ZUstellen und zu vel'weuden.
Zll Nukleinsiinre-Prlipal'aten von hobem Polymel'isationsgl'ac1
ist bel'eits E. HA]\[l\IARSTEN 2 gela.ngt. Wir baben seine Methoclik
1 EUJ.EIl und HAHN, F"'. Kem. Tidskr. 57, I6\) I) 94G\
~
E. HAl\!MARH'fEN, Bioehem. 7,8. 144, 386 (19241.
Arkiv /';" kemi, milleralogi o. (Je%(Ji. Ed 22 A. N:o 13.
1
2
A~KIV
paR KE:':l\Tl 1
]{IN1~1~ALOGI
O. GEOLOGI.
BD
22 A.
N:O
13.
auf die Herstellung' vou N ukleins~iurel1 fLUS Zellkel'nen angewandt. Dmch die Vel'Wendullg von Zellkernen als Ausg-ung's1llaterial gewillll.t ilmn eine erhohte Sichel'heit, dass die N ukleillsriureprodukte von Besta,ndteilen des Oytoplasmas frei sind.
Material.
Ais Ausgang'smaterial wurden Zellkerne aUB Kalbsthymus,
aus Schweinelebel' und l~inderleber vel'welldet. Die Zellkerne
waren in del' Regel nach del' von DOUNCE 1 angegebenen Methode
isoliert worden (Friel'811 des frischell Materials, wieder Auftauen
in ZitroJlens~iureli:isung bei pH 4 und fraktionierte Zeutrifugierung). In einig-en Vel'suchen wluden Kerne verwendet, die bei
pH 6 hergestellt worden waren. Es hat sich l1iimlich gezeigt,
dass es wesentlich vOl'teilhafter ist, die Keme wiibrelld del'
Reinigung'svel'fahren einer moglichst gering'en Aziditat auszusetzen.
Hinsichtlich del' Einzelheiten bei del' Behandlung del' Zellkerne sei auf vorbergehende Mitteilungen aus diesem Institut 2
verwiesell.
Alluiytische unll spelrtl'ophotometl'ische ~Ietho(lik.
Die hier vel'wend.eten Methodell zur Bestimmullg VOll P
uncI N sowie zur Bestimmullg del' DesoxYl'ibol1ukleinsaul'e
dul'cb die Diphenylamin-Reaktion nach DrscHE sind be1'eits
in del' II. Mitteilung diesel' Sel'ie fi beschl'iebeu.
Beziiglich del' Ausflihruug del' spektrophotometrischen MessUllgen zur NuldeinsiLurebestimmung (UV-Absorption durch die
Purill- bzw. Pyrimidinreste) sei nuter Hinweis auf £rii.he1'e
Angabell!J,4 folgeudes mitgeteilt.
Die ol'ientiel'euclen Versnche iiber die Absorption von Thymusuukleinsaul'e im Ultraviolett wurden mit einem Zeiss'schen
Spektrographen von 90 Ablenkung ausgefii.hrt nnter Vel'wendung'
einer Wassel'stofflampe als Beleuchtung'squelle und eines Rasters.
Die Auswertnng del' photog'l'aphischell Platten geschah mit
Mikrophotometer.
0
1
DOUNCE,
.r.
BioI. Uhem. 147, 685 (1943) -
Hiehe !1ueh MIRSKY
POLLISTER, Proc. Nut. Acad. Sci. 28, 344 (1942\
2 EULER, HAHN, HARSELQUlwr, .JAARMA null LUNDIN,
U.
Bv. Kern. Tidskr.
57, 217 (11l45).
s AHL8TRli~r,
EULER, FISOHleR, HAnN, Hi)GBEIW, Dieses Arehiv 20 A.
Nr 15 (1\145).
4
EULER
n. HOGBERG, Dieses Archiv, 22 A Nr Il (11)45/46).
3
L. AHLS'l'ROlU U. A., NDKLEOPROTEIDE IV.
Bei den laufenden Analysen wurden die Bestimmungen in
eillem Doppelmonochromator mit Ql1arz-Quecksilberlarnpe als
Lichtquelle ausgeflihrt und zwar an wtlssl'igen Losungen welche
mittels Phosphatpuffers bei pH 7 gebalten wurden. Dm die
N uldeillsaurekonzentration in eiweisshultigen Pl'iipar:1ten zu
bestimmen, war es zl1niichst llotwendig, das Eiweiss qnantitativ
abzuspalten; dies geschah durch Behandlung del' LOSUllg mit
Trichlol'essigsiiure in del' Wlirme 1 , wodurch das Protein unlos1ich wird und abzentl'ifugiel't werden k<1nn. N ach wieclel'holtem
Ausw[Lschen del' FtiUung und Einstellung del' Losungsazic1itiLt
mit Phosphatpuffel' wurcle die Absorption del' Nukleinsiiul'e
in den vereinigten Losungen bei den WellenHingen 240, 248,
254, 265, 275, 280, 28\:l und 297 miL gemessen. Die so erhaltene
Absorptionskul've entsprach del' photographisch aufgenommenen.
Durch Bestimmung des Phosphatgebaltes ill del' Eiweissflillung und in del' LOSUllg wurde festgestellt, dass eine Hydrolysendauer von 10 Minuten mit G%iger rrricbloressigsaure lIur
quantitativen Abspaltung del' Nukleinsauren ausl'eichenc1 war.
Die Lichtintensitat wurde mittels
einer N atriumphotozelle und Quarzdrahtelektrometer bestimmt. Die Absorptionskoeffizienten wurden nach
del' Formel
a
1
= --.-
c. d.
log 10 cm- 1
I
berechnet.
Dabei ist
c = Konc. in gil. - Bei reinen
Praparaten wird c bei etwa O,G .. 10- 2
10,0
gil gebalten.
cl = Scbichtdicke in em
10 = Intensitat des einfallenden
Lichtes; I = des austretellden Lichts
Das Verhtiltllis 10/1 wnrde mittels
rotierenden Sektors geruessen.
Die Figur 1 zeig·t die Absorptionskurve fill' eine hocbgereinigte
Thymusnuldeinsiture, bei welcher
P = 7,80 und N = 13,47 war. Del'
Verlauf del' Absorptionskul've sowie
240
die Hohe del' Kurve stimmen mit
den Angaben del' Literatur fiir l'eine - Desoxyribonukleinsaure iiberein.
1
\
\
\
\
\
\
\
\
\
\
I
\
\
~
260
280
Prap. 116 a 84,5 %
Standard: 84,0 %
Fig.!.
SCHRAMM U. DANNENllERO, Chern. Ber. 77, G3 (H)44).
.:1
ARKIV FOR KEllII, llllNERALOGI O. GEOLOGl.
llU
22 A.
N:O
13.
Isoliel'ullgSYcrfahl'cu 11lIS fj'hym II s·ZellJrel'llen.
III del' vOl'herg'ehenc1en n. Mitteilung' wmden die dort lintersuchten Nukleinsiiul'epriipal'ate bzw. Nukleate im Weselltlichell
nach den Methoclen von LEVENE, BREDERBCK, KLEIN U. BEOK
hel'gestellt, bei welclIen (las Material wlihrend liingerel' Zeit
del' Kochtemperatur und del' Eillwirkung von 5%iger KoehsaiziCi8ung oeler von Alkali ausgesetzt wird. Wie vOl'auszusehen
war und wie sich durch unsere eigeuen Versuehe bestutig't
hat, gewinnt man auf diese Weise N ukleinsaurepraparate von
verhiUtnismiissig niedrigem Polymerisationsgrad. In einem so
hm'gestellten Nukleinsanre-Pl'aparat ergab die Unterfmchung
in der SVEDBERG'sohen Ultrazentrifuge eine mittler-e Molekularg'l'osse von 14000 (.t 2000).
Bei del' Hel'stellung del' hier zu besehreibenden Nnldeinsiiuren wnrde die Anwendnng hoherer Temperaturen nun
gl'osserer Abweichungen VOll del' Neutralitat del' Losungen
vel'mieden,
Die Thymus-Zellkerne wUl'den nach del' Isolienmg mit destilliel'tem Wasser gewaschen, abzentrifugiert unO. in £euchtem
Zustanc1 wei tel' vel'al'beitet. Sie wUl'den durch Vel'1'eiben im
Morsel' mit destilliertem Wasser aufgesehlemmt, unO. zwar
wnrde bei rrhymuszellkernen die .:lO·behe Menge Wasser verwendet, bei clen loseren feuehten Lebel'zellkernen die 20-£aohe
Menge. Die Aufschlemmung' wnrde durch vOl'sichtigen Zusutz
VOll O,~ n NaOH nentralisiel't unc1 das pH elektrometrisch
kontl'olliert. Beim Alkalizllsatz werden die Versllchslosungel1,
besonc1ers diejenigen aus Thymuszellkel'nen stark viskos. Die
Proben wl1rclen
dann 16 Stllnclen lang- in einer Schi.ittelmaschine
0
bei etwa 14 geschiittelt.
Die Versnchslosnng, die nun nul' noeh Bchwach viscos war,
wurde dmch Zentrifngieren von unbedeutellden Mengen uugelaster Teilcheu befreit und das Zentrifugat dnrch Zusatz VOll
Kn,lzil1111chloridlOsung bis zu 0,01 ill gefiiUt. Die Ka.lzil1Illfallung
wnrde nach dern Abzentl'i£ugieren mit destilliel'tem Wasser
gewaschen und wiecler zeutrifugiert. Danaeh wurc1e die Fallung
in del' 20 fachen Menge 10%iger NatriumehloridlOsung gelOst,
mit Natrinmehlol'id bis zur Si~ttigung' versetzt und mit del'
zehnfachen Menge ges1ittigter Kochsalzlosung vel'diinnt. N ach
dl'eititgigelll Stehen im Kiihlsehrank wurde bei 0 clurch ein
doppeltes Falteufilter filtriert. (Da diese Filtration in den meisten
Versuchen sehr langwierig war, wurcle in den el'steu Versuchen
die RHirung durch Zentrifugieren bei 12 000 Touren/Min VOl'genommen. Es zeigte sich jecloch, class dieses Verfahren mit
0
5
L. AHLSTROM D. A., NUIO,EOPIWTEIDE IV.
NukleillsiLureverlusten verbuuden war, elu, die Nukleil1siime
z. T. sedimclltiel'te; deshalb wUl'de spiitel' filtl'iel't,).
Das Filtrat wurae aurch Eingiessen in das 11 h fache Volumen 96%igen Alkohols geflLllt, die FiWung- dnrch Abpressen
VOll Alkohol befreit, in Wassel' gelost 1l1lC1 elnreh Zusatz VOll
4, Vol. Alkohol mngeflillt. Diese Reinigung wUl'lle noch einmal wiederholt. Das erhaltene faserformige N atl'iumsaLz del'
N ukleinsaul'e wurde durel! mindestens fi.lufnlftliges Wasehen
mit reichlichen Mengen 70%igem Alkohol VOll1 KochslLlz be·
fl'eit und danaeh weiter mit 96 % und abs. Alkohol. Ather un d
absolntem Ather gewasehen. N uch clem Tl'oclmen il~l Exsiccatol'
libel' Blangel entbielt das Pl'apal'at noeh ungefiihl' 12 ~'~ Feuchtigkeit und wmde in dies em Zustalld analysiel't.
El'gebulsfle.
In del' folgenden Tabelle 1 sind die an den allgegebenell
Nuldeillsii.ul'epl'apal'aten el'haltenell unalytischen llnd physikalisch-chemise hen Vel'suchszahlen zusammengestellt.
Tab. 1.
Zusammensetzung del' Na-Nukleate.
Nr
pH bei
I, Zellkern·
Mllterilll
i isolierg.
IN
I
kl'
.'
1
Visko~it1it
i"'euch-!
N/P\ Dlschej
.n elO~allre I tigSpektr. keit
l' \ N
I
11)
\1) ber. fiir
rel. 100 ,(Pic
1
10,1,
108
110
I
I
I
ThyDluB
-
I,
7,n I13,3a\ 1,78
7,B7\18,05 1,77
7,2°112,89' 1,;9
1
80
I11'i -!
I-
I\
I
106
100
i 1,29 i, 2,05
"
106
U3
11,84 II 2,88
1,72
11 O~ 1_ _ _" __. _ _ ..l__ ~_-'-.:7,_50.'_1_3.:.,,8--,71_1.:.,,7_6~I_]_2_1_1,--_9_1---,-_ _.;-_ ,__~
__
l
107
111
113
»
Zellkeroe Th.
"
"
"
"
115 n
116
117
lOll
-
1
»
,.
"
"
»
"
4,0
4,0
4,0
6,0
6,0
6,0
4,0
7,64\12,88\ 1,70
7,2513,00 1,79
6,37\ -
-
6f
108
~8
17,71112,91
98
],07
1
97,5,
16,86 18,86 2,00
17,8°118,47 1,78 1
'7514'°°1
I -
I
I
i
I -
87 I 14,80
80,5 \ 9,79
72,5 11,86
82
85,5 I
\
1'80
7
v.
1
!l3,D \
Schweineleber
112
Zellkerne v.
4,0
'16,4a - , 85,
71l,51
I Hinilcrleber
I
~~I_ _ _ _ _ _ _~_ _ _~I~_~l__~_-"_. _____
»
II
I
I'
, _ _ I_ _
i
1,85
6,40
2,00
B,08
1,73
~
6,11
4,10
5,40
38,90
1,84
I
___ ,
_ _ _ _ __
ber. als Na.·Salz.
nllch 2 Std. Extraktion mit Alkohol-Aether.
I In diesem Versuch waren die Zellkernc mit Wasser uei pH 8,7 extrahiert
worden, wUhrend in den iibrigen Versuchen pH zwischen 6,8 und 7,4 variierte.
1
2
o
ARKIV FOR KEMI, llllNERALOGI O. GEOLOGI.
TID
22 A.
N:O
13.
Die Ansbeuten wurden teils auf das Frisehgewicht der
Zellkerne hereclmet, teils auf das Frisehgewieht der fur die
Zellkerne verwendeten Ausgangsmenge an rrhymus.
Tab. 2.
:
_-
_-
I '_~u bel'. nnf
I Fl'isebgew.
Zellkernc
i
Nr.
I
Material
I
I
,
!,
108 i
'Thymns
110 i
"
115
Zellkerne Th.
»
»
116
117
I
»
).
i
I
I
bel'. auf
Frisehgew.
Thymns
I
-
i
I
_-
~;,
I
0,R9
2,6ti
3,-.,
1,8
1,51i
1,40
1,28
I
0,7
Zu den Angaben del' Tabelle 1 und zur weiteren Clmrakterisiernng der Priiparate ist noeh folgendes zu bemerken.
Beim Fiillen <leI' wassrigen Nukleatlosung mit Alkohol
wurden bisweilen statt fadenformig'er ]'iillungen k6rnige Fiillung-en erhaltell. Es handelte sieh hier urn Iiline reversible
Veranderung', da bei sp1i.teren Reinigungsstudien wieder die
faclellfol'mige Fiillung zUl'iiekerhalten wmele.
Die erhaltenell Nnkleate losten sieh in <leI' Regel kbr in
Wasser, nul' Pr1i.pal'at 113 und 115 waren sehwerel' loslich und
gaben stark opalescente Losungen. (Eiweissgehalt).
pH del' wa.ssrigen Losungen aun1i.hernd 7.
UIll festzustellen, ob clie aus Thymus bzw. aus Thymllszellkel'neu erhaltenen Nukleate sieh in Bezug auf einen eventuellen Ribosegehalt unterschieden, wurclen Pl'aparat 110 (Thymus) unel 111 (Thymuszellkerne) auf ihr Vel'halten zu Orcin
untel'sucht. Priiparat 110 und 111 hatten ung'efuhl' clen gleichen
Phosphorgehalt. 300"( 110 gab eine Orcilll'eaktion entspreehencl
3,12 % und 300 y 111 entsprechend 2,87 % Ribose, d. h. mit
del' Orcinmethode wurele praktisch kein Untel'schied bei den
beiclen Substanzen gefunelen.
Die erhaltenen N uldeate waren nieht frei von Eiweiss. Sie
wurden in O,5%ig'er Losung auf ihl'e Biuretreaktion gepriift
uncl mit Losungen von Eieralbnmin und Casein verglichen.
Mjt Casein bzw. Albumin wUl'clen etwas verschiedene Werte
gefunden. Da aus einem Vergleich vel'schiedener Proteine wie
Casein, Albumin und Clupein hervorging, class mit del' Biuretreaktion fur versehieden8 Eiweisskol'pel' verschiedene Farbintensiteten 81'halten werden, sind die auf diese Weise bestimmten
Werte keine Absolutwerte, sondern konnen nul' zum Vergleich
del' Pra.parate untereinancler dienen.
L. AHLS'l'ROM U. A., NUKJ,EOl'ROTEIDE IV.
7
Ge£unden wurden, hel'echnet auf den Totalstickstoffgehalt:
Priipal'at 110
111
8,0 % Protein N
11!)
116
117
4
7,7 %
)}
11,5 %
1,6 %
»
»
0,5
N
N
N
N
)
(:!~
ccm einer wassrigen LOSUllg des Praparates 111 wul'den
1/2 20Tage
lang iill Cellophanschlauch gegen dest. Wasser dia-
lysiert.
Die Losung enthielt VOl' del' Dialyse
580 '( Nukleinsiiul'e
565 'r
nacll»»
»
Diese .Abweichung liegt innerhalb des Fehlel'bel'eiches del'
Methode, a. h. das Praparat war praktisch frei von Molekiilen
mit einem Molekulargewicht unter 10000.
Viscositiit.
Die Viscositiitmessungen wurdell im Auslaufviscosimeter
OS'l'W AJ,D bei 20°0 ausgefli.hrt. Gemessen Wllrden wassrige
LCisungell mit del' Konv.entration 0,05-0,26.
Die relativel1 Viscositiitswerte wurden durch Extl'apolieren
auf die gleiche Konzelltratioll lOU 'r P per ccm umgerechnet. Da
die Ber.iehung c 1 : log'1J, = c2 : log'''/]2 fill' grossere KOl1zentrationsuntel'schiede nicht gilt, sind die extrapolierten Werte fur die
Mher viscosen Priiparate (7.. B. 1l5), bei denell die Messungen
mit niedl'igeren Konzentrationell ausgefuhl't worden sind, unsieher.
Die Viscositlitsmessungen wunlen zu vel'schiedenen Zeiten
nach Herstellung del' Losnngen ausgefilhl't und dabei festgestellt, dass die Viscositiitswerte il111el'halb des untersuchten
VOll
Tab, 3.
~. -Ir H
K()n~elltratlOn
T •
in %
NI
107
108
110
]11
I
I
112
I
113
114
.115
I
I
0,046
0,048
0,262
0,180
0,140
O,O9~
0,082
0,080
I P
I •~ usI !I.U f 87.el't f"lU [~
H 2U i Liisung
6,6
40,R
7,0
40,G
40,6
83,5
6,9
6,1;
I 6/) i 41,0
I
I
I
I
7,5
7,8
6,8
reI.
i.
I
I
1
4l,1
41,0
41,1
I
I
I
I
I
75,0
52,1
113,5
530,2
71,1
117,0
319,5
245,6
i
~
reI. ber. flir
100 P/ccm
1,85
6,11
1,20
I 2,80
1,72
2,05
1
6,85
I
1,73
II
2,86
4,10
1,84
5,28
I 7,79
I 5,D9 I
I
25,5
37,7
.A_l~KIV ~,(jR REMI, lIIINERAI,OGI O. GEOJ,OGI.
8
BD
22 A.
N:O
13.
Zeitintervalls, 24 Stllllden, praktiseh konstunt waren. III del'
ohigen 'fabelle sind die nach fii.nf Stllllden gefulldenell Werte
allgegeben.
An Priiparat 107 wurde die Abhiingigkeit del' Viscositii,t
vom pH untersucht und ii.bel'eillstimmencl mit VILBRAND'l' und
TENNENTl mit steigender Alknlitat eine Abl1ahme del' Viscositiit
festgestellt :
bei pH 6,6 'fJ l'elativ 1,uG
bei pH 9,0 1)
»
1,77
Erwiirmen fiihrte ein Abnahme del' Viseositti,t mit sieh.
So wurde fiir Prliparat 110 gefunden:
VOl' dem Erhitzen del' Losung, pH 0,1) 'Il reI. 2,72 naeh 15 min.
Erhitzen del' Lasung auf 50°, pH 7,1 1) rei. 1,88.
1~leldrOI}horetische
Untersuchullg.
Die zu untersuchenden Troekenpraparate wurden ill Wassel'
zn O,:l5-0,50 % gelOst. Praparate, die als Li:isnng'en vorlagen,
wUl'den mit Wasser auf 0,25-0,5 % verdiinnt. Die Li:isungell wurden bei 10 000 Umdr./Min. w11hrencl 45 Min. zentrifugiert. Die
Zentrifug'ate waren sehr visci:is und zum Teil stark opaleszierelld.
Dadurch wurde die optisehe Beobachtullg del' WanJerullg iIll
eleldrischell Felcl becleutend erschwert. Die Losungen wurdell
dalln gegen Acetatpuffer verschiedellcr Aziditiit von del' Ionellstiirke 0,10 16 Stunden lang dialysiert und die dialysierte Li:isullg
irn Apparat von Tiselius del' Elektrophorese nnterworfen~.
Priipamt 104 (extrahiel't nach Dounce aus ThYlllus ullclmit
Alkohol gefallt), wurde bei pH 4,63 bzw. 5,23 uncl c = 0,25 %
untersucht. Bei heiden pH-Werten wanderte die Nukleillsiiure
einheitlieh, u. zw. mit u = -14,0 . 10- 0 bzw. u = -17,0·10-".
Bei pH 3,82 und c = 0,5 % konnte dagegen eine Aufteilung
in mehrere Komponenten beobaehtet werden.
Priipal'at 108 (au8 Thymus). Eine 0,50%ige Losung dieses
Praparates wurde hei pH 4,63 del' Elektrophorese unterworfen.
Keine Verunreinigllngen konllten nachgewiesen werden. Die
Allfnahmen in Fig. 2 A wurden nach 6 resp. 59 Min. gemaeht.
Die Stromstarke betrug i = 23,5 rnA und das PotentialgefaUe
F = 8,4 Volt/sec. Die Beweglichkeit errechnete sieh zu u =14,7- Gem. 2/Volt. sec.
Vrr,BRANDT nod TENNENT, Am. Chem. Soc. 65, 1806 (1943).
Wir clankeo Herro Professor Dr. H. TEEORELf" welcher nos in zuvorkommender Weise diesen Apparnt in seinelll Institnt zur Verfiignng gestellt bat.
1
2
L. AHLS'rROM U. A., NUKLEOPROTEIDE IV.
I I
9
I
Fig. 2 A.
PriijJ(I)'at 110 (aus Thymus). Eil1e U,50%ige Losung c1ieses Prii,-
parates zeigt hci pH 4,133 einheitliche Walluernng. Die Aufllahmeu in Fig. :2 B wurc1en nach 25 b7.w. 80 Min. gemaeht.
i ~~ 23,5 mA, F = 8,4 Volt/sec. und u = - 14,5 ·10-" . ..Anell
bei pH 3,82 wanderte das Priipamt einheitlich. Die Beweglichkeit del' N nkleillsiiure bei cliesem pH betl'ng 11 = - 13 ..], . 10- 6 •
Pl'iipltl'ut 111 (aus Thymus-Zellkel'uen). Eille O,.'io%ige Lasung c1icses Pl'iillarates wurde bei pH 0,:J2 und O,9f! untersucht. Bei heilien pH-Werten kOlluteu Spuren einer Vel'unreiniguug wahrgellommen werden. Bei pH 5,32 betrug rlie
Beweg'lichkeit dpr Hauptkomponente u = Hi,.' 10- 5 , wiihrencl
fUr die Vel'unreinigul1g u = 20,2' ] 0-;; gefundel1 wUl'de.
1
Fig. 2 R.
10
ARKIV FOR liEUI, llIINERAI,OHI 0. GEOJ,OOl.
r I
1
BD
22 A. N:oI3.
L
Fig. 2 C.
Priiparat 115 (aus Thymus-Zellkernen): O,25%ige Losungen
dieses Praparates waren sehr stark viscos und opaleszierend.
Die Elektrophorese wUl'de bei pH 4,\)4 ausgefi.ihrt. Ais Folge
del' hohen Viskositat traten im aufsteigenden Schenkel Anomalien in del' Wanderuug del' Gl'enzfliiche auf. 1m absteigenden
Schenkel wundel'te die Substanz einheitlich mit u = 15,0' 10-".
(1m aufsteigenden Schenkel betrug u = Hi,a . 10-°.)
Pl'iiparat 116' (aus 'rhymus-Zellkel'nen). Eine O,5%ige Lasung diesel' Nukleinsiiure wUl'de bei pH 4,(13 und 4,94 untersucht. Das Priiparat el'wies sich bei heiden pH Werten als
elektl'ophol'etisch einheitlich. Die Aufna.hmen iu Fig. 2 C
(pH 4,(13) wurden uach 20 bzw. 69 Min. gemacht. Die Stromstiil'ke betrug i = 8,'1 rnA, das Potentialgeflille F = 2,1; Volt/sec.
und die Ioncnstiil'ke des Puffers O,Jo. Die Beweglichkeit del'
Nukleinsiiu1'8 bei diesem pH erl'echnetc sich Z11 U = 13,8' 1O-r.
cm 2/Volt. sec. Bei pH 4,\l4 betl'ug u = 15,0·10-",
l' erhalten del' Desoxyribonuldeinsaul'(l lUIS rrllymusZellkel'ucn bei Sedimentation.
Eine Untersuchung des Priiparats 115 in del' Ultrazentrifnge
ergab, dass c1ieses Pl'iipal'at iiusserst polydispers ist. Die Untersuchung wurde von Doz. K. PEDERSEN am Institut fill' Physikalische Ohemie del' Uuivel'sitiit Uppsala liebenswiirdigerweise
ausgefiihl't. Ein Teil des Priipal'ats war ausserst grobdispers.
Diese Fraktion wnrcle in del' luftgetl'iebenen Ultrazentrifuge
vom iibrigeu Material abgetrennt. Beide Fl'aktionen wurc1en
dann nochmals in del' Ultrazentrifuge untel'sllcht und zeigteu
L. AHLB'l'R(iro:
u. A., NUKLEOPROTEIDE IV.
11
immer noch iiu8serst nnhomogene Sedimentation. AUf! dem
Gemisch von Komponelltell verschiedensten Dispel'sitatsgrades
lwnnte lmine grossel'e Fraktion einheitlicher Sedimentation
gewonllen werden.
. Del' Einfluss von geringen Anderungen der Wasserstoffionellkonzentration auf elie Loslichkeit des Nukleinsaurepriiparats
wurde in folgellderWeise ulltersucht: Eine 0,25%ig'e Losllng von
Praparat 115 in WltSSer wurde in del' Willkelzelltrifuge bei 10000
Umdr.iMin. 135 Min. lang zentrifugiert. Dabei trat eine deutHche Sedimentation del' gl'obsten Pal'tikeln ein, die sieh 1m
unteren Drittel des Zentrifugenrohres ansammelten. Diese
Fra,1dion wurde mit Wasser auf das 3 facbe Volumen vel'·
diiullt uncl in 3 Portiollen geteilt. In del' einen Portion wurde
del' N nkleinsaureg'ehalt nach DISCHE bestimmt. Die Wassel'stoffionenkonzentration del' beiden ancleren POl'tionell wurde
auf pH 7,1 bezw. 8,3 eillg·estellt. Nach 16 Stundell bei 6° C
wurclen die beiden Lasung-en in del' Winkelzentrifllge bei :2 500
Umclr./Min. und 5° 0 30 Stunden zentrifugiel't. Del' Illhalt del'
Zentrifugenrohrchen wUl'de dann durch vorsichtiges Absaugen
in 3 FrtLktionen geteilt und del' Nnkleinsiiul'eg'ehalt diesel'
Fraktionell nuch Dische bestimmt. Bei beiden pH-Warten erwies
sich ein nicht unbedeutender Anteil des Priipamts als gTobdispel's und sedimentierte mit betriichtlichel' Geschwindigkeit,
u. zw. mit bedeutend hohere1' Geschwindiglwit bei pH 8,3 alB
bei pH 7,1. Wiihrelld diesel' g'l'obdispel'se Anteil sieh in dem
unteren Drittel des Zentrifugelll'ohres ansamm elte, bestan den
die zwei ob81'en Fraktionen aus stark viskoser Liisuug', die
praktisch £rei von Opaleszens war. Die Koncelltration beider
Fraktionen war 10 % hoher im Falle del' hoheren Wasserstoffionenkoneentration als bei lleutraler Reaktion, Dies bedentet, dass eine Erhohung des pH's eille Steig'erung del'
Lasliehkeit del' Nukleinsiinre bezw. einen teilweisen trbergang
von Gel in Lasung mitsiehflihl·t. Andererseits 1st del' Unterschied im' Verhalten des untersuchten Prapal'ats bei pH 7,1
und 8,3 verhaltnismassig gering in Anbetl'acht des erheblichen
pH·Sprunges. Es ist daher nicht wahrseheinlich, dass die Verschiedenheit del' einzelnell Praparate in Bezug auf Viskositat,
Opaleszens und Loslichkeit auf geringe Abweichnngen im pH
wiihrend del' Praparation zuriickzufiihTen s1nd.
Praparat 116 verhielt sich beim Zentl'ifug'ieTen wesentlicll
vel'schieden von Praparat 115. Wedel' bei 2500 noch bei 10000
Umdr./Min. konnte eiue Seclimentation del' Teilchen beobachtet
werden. Losungen dieses Praparats waren a11ch bedeutend
weniger opaleszimt.
12
AltliI\T FOR KElIrI, MINRRALOUI O. GEOLOGI.
ED ~2
A.
N:O
13.
ZusRmmenf'ussung.
Die S. 5 geg-ebelle To,belle 1 gibt eine Ubersicht iiber die
an u verschiecleneu Nukleinslture-Prliparatell ans Kalbsthymm;
Bowie an :l Pl'apal'atell aus Schweine- bzw. Rindsleber erhaltenen
analytischen und physilmlisch-chemischell Daten. Wie einleitend el'w11hnt wurde, IH1udelt es sich hier durchweg um
solche Pl'iil'H,mte, welche mittels schonender Methodik, also
nach HAllUIARS'l'ENS Methode, unter Vel'meidnng' hoher Ternperatul'en unc1 stark saurer odeI' basischer Lasungen hergestellt
wurden. Dabei wurden fl'ische ZE'llkerne nols Ausgangsmaterinl
verwenclet, um von vOl'nhel'ein Vel'lmreinigungell der Pra,parlLtc
dUl'eh Bestandteile des Oytoplasmas auszuschliessen. Vel'gleichsweise wmclen 4 dil'ekt aus Thymus hergestellte Priipumte
ulltersucht.
Was die Ergebnisse del' P- und N-Bestimillungen betl'ifft,
so licgt del' fhl' die Desoxyribonuldeinsliure chal'akteristische
Quotient NIP, den wir im Mittel zu 1,74 finden, el'heblich hoher
als del', welehen wir fiir die nach LEVENE und BIW,DEltEUK
hel'gestelltell Nukleinsliuren gefunden haben (II. Mitt. S. 7),
und liegt l'echt nahe an clem Wert welchel' sich nus del' Fonnel
CSIlH4,02j,NluP.JN a.1 el'l'echnen HLsst. Die absoluten Werte fiiI' 80wohl P wie N sineI jec10ch bedeutend niedrig-cr als die theoretischen. Bei Berechn ung- des N uldeillsiiuregehaltes ans dem
P-Gehalt del' PriLparate (ulltel' Beriicksichtigllug del' Feuchtig-]reit) kommt, man tlaher zu einem Gehalt von nul' ca. 8f) %
N n klei tlsiinre. Die spektl'ophotometrisehell Besti ill 1ll ungen e1'g'abeu einen N ukleinsiiuregehalt von 95 %. Die N llkleillsiiureBestimillung'en naeh Drscr·m wenlen beka,nntlich von gleichzeitig'
anwesenden Begleitstoffen, besonclel's von Pl'oteillen sta,rk heeinfiusst, 80 dass sie nicht ohne weiteres ZU1' Benrteilung' del'
Reinheit des Pl'iipanttes hel'angezogen werden dhrfen.
Rei del' Betl'achtung del' ill den beiden letzten Spaltell
verzciehnetell Viscositiitswerte fiint auf, dass dieselbell bei den
aus Zellkel'nen hergestelltell Praparatell viel hi:iher g'efullden
wnl'den als bei den aus del' Thymusdl'Use dil'ekt g'ewonllenen.
Es uiirfte dies dal'al1f bel'uben, class aie ami Zellkernell e1'ha1tenen N uldeinsiil1l'e-Pl'aparate del' Einwil'kung del' depolymel'isiel'enden Enzyme weniger lang ausgesetzt waren, und dachl1'ch
die hohel'en Polymerisate nul' wliohl'end kiil'zel'el' Zeit ellzymatisch
angegl'iffen werden konnten; illsbesondre kommt hiel'bei allch
in Betracht, dass das enz_ymreiche o.vtoplaSllm bald von den
Zellkernbestandteileu entfernt wurde. Ubrigens mag' hier bctont
werden, dass die spec. ViscositiLt keil1eswegs ein A usdruck del'
Molekulargrosse del' Nukleinsliure ist; die Forlll del' Molelci.i.le,
L. AHLSTROllI U. A., NUKLEOPROTEIDIG IV.
also das Achsenverhaltnis, iibt einen erheblichen EiIlfiuss auf
die Viscositiit aus.
Die hohe Ziihigkeit del' Losungen hat die physikalischchemischen Bestillllllnngen sehr erschwert.
Bei Elektrophol'ese wallderte ein Teil del' untersuchten
Praparate (108, 110, 115, 116) eillheitlich, wiibrelld bei 2 del'
Priiparate (104, Ill) gering'8 Mengell von Verunreilligungen
wabrgenollllllen werden kOnl1tell. Da die elektrophoretischen
Untersuchungen als Folge del' hohen Viskositat und (zum Teil)
'del' Opaiescens del' Prapal'ate bei vel'hiUtnismassig' lliedrigen
Koncentrationen ausg-efiihl't werden mussten, kann nicht ausgeschlossen werden, dass auch die als einheitlich bezeichneten
Priirmrate klein ere Mengen von Substanzen enthielten, die von
del' N ukleinsau1'8 V8rsehiedene elektrophoretische Eigenschaften
aufweisen (Protein '?), cloch wegen ibre1' niedrigen Roneent1'ation
optiseh nicht wahrgenommen werden kOTInten. Weiterhin c1al'f
nicht verg-essen werden, dass bei del' Wandel'ung del' hocllmoleImlaren NnkleinsiLme im elektrischen Strom kleinel'e Mengen
von Verunreilligullgen mitgeseh leppt werclen ki5uuen, und sieh
dadurch del' Beobaehtung entziehen.
Die Serlimentatiol1s-Versl1che in del' Ultracentrifuge zeigten,
dass die untersuchten Prii.pal'ate polydispers waren uncl Molekiile von sehr hohen Molekulargewichten enthieltel1. Wenn
~ich n nch die hochstpolymerisierten Anteile del' N ukleinsaurePrapamte offenbar nicht mehr jm eehten Losullgszustand befa,mlen, so delltell die hohen Viscositlitswerte manchel' aus
Zellkel'lIen dargestelltell Pra,pal'ate illlmerhin auf die Gegen wart
gTosser (lcliistcr Moleldlle hin, die in den hier besehriebenen
Prli.pn,l'l1ten besonc1el's stark vertreten sind.
Sowohl clie Polyclispel'aitat clel' P1'a parate als Variationen in
i111'e1' elementaren Zusammensetzung- sind wahl ein Ausdl'uck
dafiir, dass die Nnkleopl'oteide in den Zellkel'nell wie auch die
aui') ilmell entstehenden Nnldeinsaurell sieh im lebeudel1 Zellkern in eiuem In,bilen und stark v81'ande1'liehen Gleiehgewicht
befindell. Man wird a,lso in Anbetracht des bei del' Mitose
heobachteten vollAtii,ndigen Vel'schwindens der Zellkerne unc1
des clal'ltuf wiedel' einsetzenden Wiederaufbaues del'selben nicht
erw!1l't.en dlil'feu, N llkleopl'oteic1e unc1 NuldeillSal1rell vom gleichen Grad del' Elinheitlichkeit isolieren zu koullen wie dies
bei alldel'ell, besonde1's niedriger lllolekularen Vel'billdungen
o-elino-t. Wohl abel' Irann v8rsueht werden Zusammenhiinge
;wis;hen clem Zustand eines Gewebes nach gewissen, die
Kel'llUm wandlung- beeiufiussen(len Behunc1lungen des Organs
bezw. eles lebenden Tieres und clem Zustanc1 und del' Molekulargrosse del' Nukleinsliure und del' Nukleoproteiele zu findelJ.
14
A.RKIV FOR
trEMl, MINERAl.OGI
0,
GEOLOGI.
DD
22 A.
N:O
13.
Dem Vorstand des Physikal.-Ohem. Institutes del' Universitat U Pllsala, Herrn Prof. Dr. THIn SVEDBEltG, sowie Herrn
Dozenten Dr. K.A.I O. PEDERSEN, sind wir fur die Ausfi.ihrung
von Versuehen zur Molekulargewichtsbestimmung von Desoxyribonukleinsanre-Praparaten zu besonderem Dank verpfiichtet.
Herrn fil. lie. BIRGER DR.A:~Oil, Frl. fil. mag. INGA I!'IsofIER,
Herrn ing. BERTIL HOGBERG, Frau MAIRE J AAUMA und Frl. ing.
MARIANNE LUNDIN wollen wir fur wertvolle praparative und
analytisehe liilfe auch hier bestens danken.
lnstitut fur organ.-chemisqhe }j'orschung del' Universitat
Stockholm.
'l'ryckt rl!1n 2 mnrs 1g46,
Ul'llRlIla 194H, Almqvist &
Wlksell~
Boktl'l'ckel'i AB


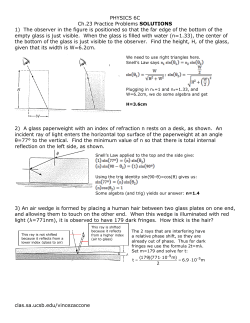


© Copyright 2026