
The Impact of Surface Properties on Downward Surface Shortwave
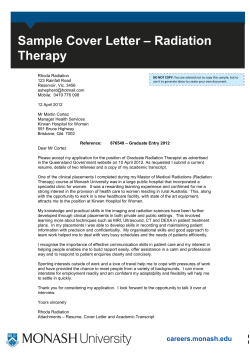
ADVANCES IN ATMOSPHERIC SCIENCES, VOL. 32, JUNE 2015, 759–771
The Impact of Surface Properties on Downward Surface Shortwave Radiation
over the Tibetan Plateau
¨ Daren∗1 , and HE Qing1
WANG Leidi1,2 , LU
1 Key
Laboratory of Middle Atmosphere and Global Environmental Observation, Institute of Atmospheric Physics,
Chinese Academy of Sciences, Beijing 100029
2 University
of Chinese Academy of Sciences, Beijing 100049
(Received 20 June 2014; revised 11 October 2014; accepted 22 October 2014)
ABSTRACT
The complexity of inhomogeneous surface–atmosphere radiation transfer is one of the foremost problems in the field of
atmospheric physics and atmospheric radiation. To date, the influence of surface properties on shortwave radiation has not
been well studied. The daily downward surface shortwave radiation of the latest FLASHFlux/CERES (Fast Longwave And
Shortwave Fluxes Time Interpolated and Spatially Averaged/Clouds and the Earth’s Radiant Energy System) satellite data
was evaluated against in situ data. The comparison indicated that the differences between the two data sets are unstable and
large over rugged terrain compared with relatively flat terrain, and the mean absolute error of the satellite products reaches
31.4 W m−2 (12.3%) over rugged terrain. Based on the SSF (single satellite footprint)/CERES product, the influence of
surface properties on the distribution of downward surface shortwave radiation (DSSR) was analyzed. The influence of
surface properties on DSSR over the Tibetan Plateau is about twice as large as that in two other regions located at the same
latitude (eastern China–western Pacific and subtropical North Pacific). A simulation was carried out with the help of the
I3RC (International Intercomparision of Three-Dimensional Radiation Code) Monte Carlo 3D radiative transfer community
model. The results showed that DSSR increases as surface albedo increases. Moreover, the impact of surface albedo on
DSSR is larger if the spatial distribution of clouds is more non-uniform. It is hoped that these results will contribute to the
development of 3D radiative transfer models and the improvement of satellite inversion algorithms.
Key words: shortwave radiation, surface properties, Tibetan Plateau, satellite remote sensing
Citation: Wang, L. D., D. R. L¨u, and Q. He, 2015: The impact of surface properties on downward surface shortwave radiation
over the Tibetan Plateau. Adv. Atmos. Sci., 32(6), 759–771, doi: 10.1007/s00376-014-4131-2.
1. Introduction
Solar radiation is a significant source of heat for the
earth–atmosphere system. The heterogeneity of surface solar
radiation could affect the radiative energy budget, weather
systems and climate change. The solar flux received by the
surface involves the attenuation of insolation by scattering
and absorption caused by atmospheric gases, aerosols, cloud
particles, and surface properties. Among others, surface
parameters generally include altitude, gradient, slope direction and surface albedo. Different surface properties result
in different dynamic and thermodynamic processes, which
influence the exchange of matter and energy between the
land surface and the atmosphere. The surface albedo characterizes the surface reflection of solar radiation. It determines energy exchange between the surface and atmosphere,
and it is a key factor influencing Earth’s climate system.
Even a small change in surface albedo could shift the energy
∗
¨ Daren
Corresponding author: LU
Email: [email protected]
balance of the earth–atmosphere system, and result in regional and global climate change (Wang et al., 2002; Stroeve
et al., 2005). Over the Tibetan Plateau, the mean surface
elevation is 4000 m above sea level. Its protruding nature
with high elevation and complex surface properties results
in equally complex weather and cloud systems over the region. There is a 3D radiative transfer problem in the inhomogeneous surface–atmosphere system. However, most radiative transfer models and satellite inversion algorithms are
highly simplified. Compared to atmospheric composition and
clouds, the effects of surface properties on downward surface
shortwave radiation (DSSR) have not been well studied until
now. Thus, it is worth exploring the effects of surface properties on DSSR.
As an important complement to ground observations,
satellite remote sensing provides data with preferable continuity and homogeneity in both time and space, and has become an effective way to study surface radiation budgets.
However, satellite products may be severely biased due to
input data inaccuracy, algorithm errors, and the influence
of surface properties and elevation differences (Yang et al.,
© Institute of Atmospheric Physics/Chinese Academy of Sciences, and Science Press and Springer-Verlag Berlin Heidelberg 2015
760
SURFACE PROPERTIES IMPACT ON DOWNWARD SURFACE SHORTWAVE RADIATION
2006). The complexity of spatial orientation and the optical
properties of the surface have so far been investigated in a
relatively limited number of radiative transfer schemes (e.g.,
Dubayah and Rich, 1995; Wang et al., 2005; Liou et al., 2007;
Helbig et al., 2009; Lee et al., 2013; St¨ockli, 2013). Their effects on the surface solar radiation budget have not been well
accounted for in the most widely applied radiative transfer
schemes in which the lower boundary is assumed to be unobstructed, horizontal, and homogeneous. Therefore, it is necessary to validate satellite data against in situ observations,
because such validations not only guarantee data quality but
also provide useful information to improve the retrieval algorithms. Meanwhile, climate simulations require accurate and
stable radiation budget data, and the products obtained from
space are useful for climate research (Ohring et al., 2005).
The Tibetan Plateau has great impacts on energy and water cycles at both regional and global scales, making it a
useful research area for testing the quality of data and the
estimation algorithms. Yang et al. (2006, 2008, 2010) assessed the satellite-estimated surface downwelling shortwave
irradiance of ISCCP-FD (International Satellite Cloud Climatology Project-Flux Data) and GEWEX-SRB (Global Energy and Water Cycle Experiment-Surface Radiation Budget) by using the in situ data of several surface sites over
the Tibetan Plateau. Comparisons indicated that the errors
of satellite products are spatially dependent over Tibet, and
discrepancies between different products are usually larger
in the presence of highly variable terrain. Gui et al. (2009,
2010) compared ISCCP-FD and CERES-FSW (Clouds and
the Earth’s Radiant Energy System-Monthly Gridded Radiative Fluxes and Clouds) hourly surface solar radiation with
ground measurements. The results showed that the accuracy
of satellite-estimated data cannot meet the requirements of
research communities, and satellite-estimated data over the
Tibetan Plateau must be substantially improved, especially
for the shortwave components.
Observations show that the downward shortwave radiation over Tibet is much higher than that over sea level along
the same latitude (Ma et al., 2005; Wang et al., 2013). In addition to the high elevation, there are several west–east elongated high mountains and many hills leading to the complex
terrain. The complex terrain can affect solar radiation in direct (Dubayah and Rich, 1995; Dubayah and Loechel, 1997;
Kang et al., 2002; Wang et al., 2005; Ryu et al., 2008; Helbig
et al., 2009) and indirect (Kuwagata et al., 2001; Kurosaki
and Kimura, 2002) ways. Besides clouds, the leading uncertainties in surface fluxes originate from the surface and nearsurface atmospheric properties (Zhang et al., 2006, 2007).
According to the results of a 3D Monte Carlo photon tracing program, the mean surface solar flux over a region with
complex topography can deviate from a smooth surface by as
much as 10–50 W m−2 for an albedo of 0.2, and the anomalies of solar flux in clear–sky conditions can be as much as
600 W m−2 (Liou et al., 2007). Given the altitudinal dependence of DSSR, caution is needed when applying current
satellite data to plateau regions. Ground measurements over
the Tibetan Plateau can be used as a benchmark for evaluating
VOLUME 32
satellite algorithms at high elevations (Yang et al., 2006).
Most evaluations of satellite products have been performed in low elevation areas with smooth surfaces, and high
accuracy has been shown. As for the quality of satellite products over the Tibetan Plateau, most previous studies have focused solely on relatively short periods of several months,
and have not evaluated the latest FLASHFlux (Fast Longwave And Shortwave Fluxes Time Interpolated and Spatially
Averaged)/CERES product. It is unknown to what extent
surface properties influence satellite-estimated DSSR. The
transfer of shortwave radiation under the co-existence of 3D
clouds and complex surface properties still requires exploration.
The remainder of the paper is arranged as follows. Section 2 introduces the datasets and processing used in the
study. In section 3, the DSSR from the latest FLASHFlux/
CERES data over a whole year is assessed against three
ground sites over the Tibetan Plateau, and the impact of surface properties on the satellite-estimated DSSR is analyzed.
Then, the shortwave radiation flux transferred through two
types of clouds is simulated using a state-of-the-art model.
Finally, the overall conclusions of the study and some further
discussion are presented in section 4.
2. Materials and methods
2.1. In situ data
In situ observations from three sites are adopted in this
study (Fig. 1):
(1) Yangbajain [(30.088◦N, 90.540◦E); 4350 m]: This
site is located on the southern side of Nyainqentanglha Mountain in the center of the Tibetan Plateau. It is annexed to the
Institute of High Energy Physics of the Chinese Academy of
Sciences.
(2) The Nam Co Monitoring and Research Station for
Multisphere Interactions [(30.774◦N, 90.988◦E); 4730 m].
This site is located on the southeast shore of Nam Co Lake,
220 km away from Lhasa. It was established by the Institute
of Tibetan Plateau Research, Chinese Academy of Sciences
in 2005.
(3) The Semi-Arid Climate and Environment Observatory of Lanzhou University [known as SACOL; (35.946◦N,
Fig. 1. Locations of the Yangbajain, Nam Co and SACOL sites.
JUNE 2015
761
WANG ET AL.
104.137◦E); 1965.8 m]. This site is near the city of Lanzhou,
on the southern bank of the Yellow River in northwestern
China. In particular, this site is very close to the geometric
center of China’s mainland.
The values of surface shortwave irradiance were measured by pyranometers at each site [Yangbajain: TBQ-2-BI, HUATRON, Beijing, China (1-min resolution); Nam Co:
Model-CM, Kipp & Zonen, The Netherlands (5-min resolution); SACOL: Model-CM, Kipp & Zonen, The Netherlands
(1-min resolution)]. The sensitivity of the TBQ-2-B-I pyranometer is 10.22 × 10⁻⁶ V W−1 m2 . The TBQ-2-B-I pyranometer is comparable to other pyranometers, and is widely
used in meteorological stations. All three solar pyranometers
were rigorously tested before installation. The time sequence
of the in situ data is from April 2009 to March 2010 at Yangbajain and Nam Co, and from January 2009 to August 2010
at SACOL. To acquire the best possible data for solar radiation, daily quality assurance checks are essential. The quality
control procedures are derived from WMO (World Meteorological Organization) and Geiger et al. (2002) with minor
modifications.
2.2. Satellite data
By improving the scene identification and increasing the
sensitivity of angular distribution models, CERES improves
the TOA flux accuracy for individual cloud types, thereby
providing a more reliable dataset for studying radiative processes and radiative forcing by cloud type (Loeb et al., 2003).
CERES has four level products. Our work used the SSF (Single Scanner Footprint) product from level 2 and FLASHFlux
Version 2G from level 3. The other products after level 2 are
based on the level 2 products. The SSF product contains one
hour of instantaneous CERES data for a single scanner instrument. The SSF combines instantaneous CERES data with
scene information from a higher resolution imager such as
VIRS (Visible/Infrared Scanner) on TRMM (Tropical Rainfall Measuring Mission) or MODIS (Moderate-Resolution
Imaging Spectroradiometer) on Terra and Aqua. Each SSF
granule contains one hour of data, which is approximately
two-thirds of an orbit from a single CERES instrument. The
width of the SSF swath is limited to the width of the imager
swath with which the CERES data were convolved. Each
SSF field of view (FOV) represents one scanner measurement. Measurements are taken every 0.01 seconds. According to different algorithms, the SSF can be divided into two
products: the “A” model product (Li et al., 1993) and “B”
model product (Gupta et al., 2001).
2.3. Methods
The gridded satellite data were bilinearly interpolated
onto the locations of the in situ data, so the satellite and in
situ data can be compared. It should be noted that deviation
exists in the ground observations themselves, and the validation techniques also produce errors because of the inhomogeneous distribution of meteorological variables. The statistical
methods used in this work follow previous studies (Huang,
2004; Houborg et al., 2007; Kim and Liang, 2010; Yang et
al., 2010). The statistics are reported in absolute (W m−2 )
and relative units (percentage of average measured global irradiance). The statistics in absolute units are given by
ME =
1 N
∑ (ek − mk ) ,
N k=1
(1)
MAE =
1 N
∑ |ek − mk | ,
N k=1
(2)
and the statistics in relative units are given by
1 N e k − mk
∑ mk ,
N k=1
(3)
1 N |ek − mk |
∑ mk ,
N k=1
(4)
¯ k − m)
¯
∑Nk=1 (ek − e)(m
q
,
1 N
¯ 2 N1 ∑Nk=1 (mk − m)
¯ 2
N ∑k=1 (ek − e)
(5)
ME =
MAE =
R= q
1
N
RMSD =
q
1
N
∑Nk=1 (ek − mk )2
1
N
∑Nk=1 mk
,
(6)
where e and m represent satellite predictions and ground measurements, respectively; e¯ and m¯ are the averages of satellite
predictions and ground measurements, respectively; N represents the number of samples; ME represents mean error;
MAE represents mean absolute error; R represents the correlation coefficient; and RMSD represents root-mean-square
deviation.
In this study we used the I3RC Monte Carlo 3D radiative
transfer community model (I3RC-community-monte-carlo).
This model has been tested and found to be superior and more
efficient in computing the downwelling flux than SHDOM
(Spherical Harmonic Discrete Ordinate Method) (Cahalan et
al., 2005; Pincus and Evans, 2009). The heart of the model
is a monochromatic integrator, and more details can be found
in Pincus and Evans (2009). Nevertheless, there are two major limitations of this model: First, the current code cannot
solve atmospheric molecular absorption problems. Second,
the current code can only deal with Lambertian surfaces. In
our study, the simulation used 109 photons to guarantee precision, based on the suggestion of Evans and Marshak (2005).
To ensure better accuracy for examining the interplay of
the surface, clouds and solar radiation, we performed simulations at a nonabsorbing wavelength of clouds in the visible spectrum (0.675 µm) and an absorbing wavelength in
the near-infrared spectrum (2.13 µm) under different surface albedos without considering the atmosphere. Unfortunately, the topographic effect was not implemented because
of the limitation of the current Monte Carlo code. The setting
of some basic parameters follows that of Pincus and Evans
(2009). For all calculations, the sun azimuth was set to 0◦
(in this study, 0◦ means that the sun’s rays are directed from
the direction of increasing x), and the sun zenith was set to
30◦ . In this study, a stratocumulus field (Moeng et al., 1996)
762
SURFACE PROPERTIES IMPACT ON DOWNWARD SURFACE SHORTWAVE RADIATION
and a cumulus field (Stevens and Lenschow, 2001) are used
as the input of the Monte Carlo model. Figure 2 shows the
two cloud fields. More information about these two clouds
can be found in Wang et al. (2014).
3. Results
3.1. Comparisons of satellite and in situ data
First, we plotted the daytime solar radiation against time.
Days with a very smooth curve were considered as clear-sky
days because clouds lead to clear fluctuation of solar radiation. Figures 3a, c and e show the scatter diagrams for all allsky days and Figs. 3b, d and f for clear-sky days. For all all-
VOLUME 32
sky days, there are large differences between the two products. Among the different sites, the satellite errors are smaller
at SACOL, which has a relatively flat surface compared to the
other two sites with their rugged terrain. The correlation coefficients between FLASHFlux and the observation are 0.899,
0.884 and 0.966 for Yangbajain, Nam Co and SACOL, respectively. The mean absolute errors of satellite-estimated
data are 26.69 W m−2 (10.96%), 31.38 W m−2 (12.26%) and
18.84 W m−2 (15.93%), respectively. The root-mean-square
errors for the three sites range from 12.92% to 16.86%.
Under clear-sky conditions (Figs. 3b, d, f), the DSSR results based on the FLASHFlux/CERES products and in situ
data show a much better relationship than that under all-sky
conditions. At Yangbajain and Nam Co, the FLASHFlux
Fig. 2. (a, b) Liquid water content (units: g m−3 ), (c, d) effective particle radius (units: µm), and (e, f)
optical depth (units: 1) at wavelength 0.67 µm of (a, c, e) stratocumulus and (b, d, f) cumulus. Note:
the photographs corresponding to the cloud optical depth at wavelength 0.67 µm were adopted from I3RC:
http://i3rc.gsfc.nasa.gov/cases new.html. [Reprint from Wang et al. (2014)]
JUNE 2015
763
WANG ET AL.
%)
%)
%)
%)
%)
%)
%)
%)
%)
%)
%)
%)
Fig. 3. Scatter diagrams of the DSSR of FLASHFlux/CERES products versus in situ observations
(units: W m−2 ): (a, b) Yangbajain; (c, d) Nam Co; (e, f) SACOL. R represents correlation; ME
represents mean error; MAE represents mean absolute error; and RMSD represents root-mean-square
deviation.
value tends to be lower than ground measurements on every
clear-sky day. The mean error is −16.57 W m−2 (−6.66%)
for Yangbajain, −17.09 W m−2 (−6.34%) for Nam Co, and
−4.39 W m−2 (−0.95%) for SACOL. At the same time, the
RMSD is very small, which suggests the difference between
the two datasets is very stable. The satellite products are more
consistent with surface measurements under cloudless conditions than under all-sky conditions. The differences indicate that the satellite errors partly result from the algorithms,
which ignore 3D cloud properties. The quality of the satellite inversion products is spatially dependent, and tends to be
better for the area with smooth terrain.
The mean error for all all-sky days is negative at Yangbajain and Nam Co, and positive at SACOL. The positive bias
at SACOL site may be mainly attributable to the underestimation of the aerosol amount in the retrieval process, especially for aerosol in the sub-thin-cloud layer (Hayasaka et al.,
2006). Very low aerosol optical values have been observed
over the Tibetan Plateau because of the sparse population and
minimal industrial activity (Cong et al., 2009). Therefore, at
Yangbajain and Nam Co, the DSSR is much less affected by
aerosols. The causes of the negative biases at Yangbajain and
Nam Co are not immediately obvious. The negative biases
may be due to the neglect of 3D radiative effects under the
conditions of the heterogeneous clouds and complex surface,
satellite overestimation of aerosol optical depth, or other reasons.
But how does the error between satellite and in situ
measurements differ among the twelve months of the calendar year? Figure 4 shows the MAE and RMSD as a
function of the calendar month. The MAE and RMSD
vary with month. At Yangbajain, the MAE varies from
7.58% up to 26.56% with the highest value in June, and
the RMSD varies from 9.49% up to 18.35% with the highest
value in May. At Nam Co, the MAE ranges from 8.69%
to 33.82% with the lowest value in January and the highest value in May, and the RMSD ranges from 10.07% to
22.99% with the lowest value in January and the highest
value in May. At SACOL, the error changes smoothly
throughout the year, except in a few months. There is a
764
SURFACE PROPERTIES IMPACT ON DOWNWARD SURFACE SHORTWAVE RADIATION
(a)
Yangbajain
Nam Co
SACOL
(b)
Yangbajain
Nam Co
SACOL
Fig. 4. The error of FLASHFlux/CERES DSSR for all all-sky
days in every month: (a) mean absolute error; (b) root-meansquare deviation.
peak of the MAE (26.05%) in September. The RMSD remains at about 11%, with a highest value of 24.18% in
September and second highest value of 18.39% in November.
The error varies at different sites with different surface
properties. The error at SACOL is relatively stable over the
whole year, which is probably related to the relatively stable
cloud activity. At Yangbajain and Nam Co, the error in May
and June is larger than that of other months. The peak error
in May and June is associated with the large cloud amount
¨ 2012). The large RMSD indiduring that time (Huo and LU,
cates that the spatial and temporal variability of clouds contributes to considerable uncertainty in May and June. The
differences between the FLASHFlux and surface measurements are different among different sites. These differences
are unstable and large over rugged terrain compared with relatively flat terrain, especially when cloud activity is highly
frequent. The above results indicate large uncertainty in the
coupling between 3D heterogeneous clouds and complex surface properties on radiative transfer processes. The complex
surface properties can induce complex weather types and sky
conditions, which eventually forms a complex physical role
to affect the radiation transfer process.
3.2. The spatial variation of satellite-derived instantaneous DSSR
This subsection described the work using the SSF/
CERES instantaneous orbit products. The coefficient of variability (CV), which is mainly used to compare the dispersion
of the different groups, is the ratio of the standard deviation
to the corresponding average of a set of data. In order to
evaluate the effect of surface properties on the distribution
of DSSR, three regions were chosen to obtain domain averages. These three regions were located at the same latitudes (26◦ –40◦N) but at different longitudes: eastern China–
western Pacific (ECWP, 105◦ –135◦E), subtropical North Pacific (NP, 150◦ –180◦E), and the Tibetan Plateau (TP, 75◦ –
105◦E). Based on digital elevation data at the resolution of
500 m from SRTM (Shuttle Radar Topography Mission),
VOLUME 32
NASA, Fig. 5 shows the elevation of the TP and ECWP region. The white region on the right represents the ocean. The
NP region is characterized by sea surface and is not shown
in Fig. 5. Clear-sky conditions were defined as occurring
when the clear area percentage coverage at the subpixel resolution was greater than 99.9%. During the period 1 April
2009 to 31 March 2010, the monorail tracks within an hour
that contained clear-sky sampling points (M) of more than
500 were chosen as our experimental database; the number
of such tracks was 145 in the TP region, 190 in the ECWP
region, and 54 in the NP region.
Figure 6 shows the variation of the spatial CV of DSSR in
the 1 h track, plotted by the ordinal number of eligible tracks
(N) from January to December on the horizontal axis and the
CV on the vertical axis. The number above the horizontal axis
represents the month corresponding to N, and some months
are not marked in the figure because of the inexistence of
eligible orbits or too few eligible tracks. These unmarked
months include June, July and August for the TP region (Fig.
6a), and January for the NP region (Fig. 6c). The months
between April and September are referred to as the summer
half year, and others are referred to as the winter half year.
If the monorail tracks within an hour that contained clear-sky
sampling points of more than 800 were chosen, the number
of such tracks was 56 in the TP region, 128 in the ECWP
region, and 15 in the NP region. The distributions of the spatial CV for the sampling points of more than 800 were the
same as those for the sampling points of more than 500, so
the figures for the sampling points of more than 800 are not
shown.
The CERES products do not fully account for the impact of the varied surface properties, especially the impact
of complex topography. The errors in computing the radiative transfer can influence the DSSR results. There are two
ways in which the surface influences the CV: one is the nature
of the radiative transfer related to the surface, and the other is
the limitation of the satellite inversion algorithm in resolving
the sophisticated surface properties. It is hard to completely
separate these two effects under current conditions. However, there are only slight differences between the “A” model
products and the “B” model products in their spatial CVs of
DSSR under clear-sky conditions (Fig. 6), which suggests
that the DSSR error induced by the limitations of the satellite
inversion algorithm has little impact on the CV. Therefore,
the nature of the radiative transfer is the dominant factor in
the occurrence of the different CV in the different regions.
The influence of surface characteristics on the DSSR displays
annual variation, and this annual variation presents the same
pattern as the shape of the opening up of the parabolic in the
three different areas. The annual variabilities of the CV in
the TP and ECWP regions may be mainly attributable to the
shading effect. The shading effect is relatively small when the
solar altitude angle is high, which would lead to the lower CV
in the summer half year. In the NP region, the wave changes
may lead to the annual variability of the CV. The waves are
closely related to the wind speeds. In winter, the NP region
takes the brunt of the prevailing westerlies, which results in
JUNE 2015
765
WANG ET AL.
Fig. 5. Elevation (at the resolution of 500 m from SRTM, NASA) of the TP and ECWP regions
(units: m). The white region on the right represents the ocean.
Fig. 6. Coefficient of spatial variation for SSF/CERES DSSR: (a) Tibetan Plateau (TP); (b)
eastern China–western Pacific (ECWP); (c) subtropical North Pacific Ocean (NP). The number
of clear pixels is larger than 500 in one hour on the satellite scanning track; “A” and “B” respectively represent the satellite data from the “A” model and “B” model. The horizontal axis
shows the ordinal number of eligible tracks N from January to December. The number above
the horizontal axis represents the month corresponding to N.
the high wind speeds. In summer, the wind speeds are relatively small in the NP region because of the influence of the
subtropical high pressure. The CV ranges from about 1% to
17% in the TP. The overall ranges of CV in the ECWP and
NP regions are very similar, and the CV varies from 1% up
to 13%. The ranges of CV are similar in the NP and ECWP
regions probably because the entire NP region and about half
of the ECWP region are covered by ocean. The land surface
of the ECWP region is much less variable than that of the
TP region, while the underlying surface of the NP region is
mainly affected by waves. The similar ranges of the CV in
the ECWP and NP regions may indicate that the influence
of huge waves on the CV can be as large as that of the land
surface.
In the three regions within the same latitudes, solar radiation in the TP is the most strongly affected by the underlying surface conditions. Table 1 illustrates the spatial
CV of DSSR in the three areas. In the situation of M being greater than 500, the average CV is 9.44% for the TP
region, 4.95% for the ECWP region, and 3.49% for the NP
region. In the situation of M being greater than 800, the average CV is 10.5% for the TP region, 5.11% for the ECWP
region, and 3.55% for the NP region, respectively. The sunlight or solar fluxes that reach the surface can be physically
grouped into the following five components: direct flux, diffuse flux, direct-reflected flux, diffuse-reflected flux, and coupled flux. The direct-reflected flux, which consists of photons
directly from the sun without encountering scattering, and are
Table 1. Statistics for the DSSR under clear-sky conditions.
M > 500
M > 800
TP
ECWP
NP
TP
ECWP
NP
Mean
(W m−2 )
Standard deviation
(W m−2 )
CV
686
733
848
670
724
842
60.4
33.0
27.6
66.5
33.8
28.0
9.44%
4.95%
3.49%
10.5%
5.11%
3.55%
Note: The mean CV of each region is the averaged CV of all eligible tracks.
The mean DSSR and standard deviation of each region are obtained in the
same way as the mean CV.
subsequently reflected by surrounding terrain, is the dominant component contributing to the different DSSR between
the flat surface and the surface with complex topography (Lee
et al., 2013). As can be seen from the above, the impact of
underlying surface conditions is the lowest in the NP region
and the greatest in the TP region, which is about twice as
large as that in the other two regions.
Figure 7 demonstrates the variation of DSSR in one hour
for several satellite scanning tracks when M is greater than
800. The days chosen in Figs. 6a–f are very close, and the
DSSR for a large region as a whole has no obvious change
in one or two days, so the variations are comparable. Figures
7a and e show the variation in the TP and NP regions on the
766
SURFACE PROPERTIES IMPACT ON DOWNWARD SURFACE SHORTWAVE RADIATION
VOLUME 32
Fig. 7. The variation of SSF/CERES DSSR in one hour on the satellite scanning track (units: W m−2 ): (a, b) Tibetan
Plateau (TP); (c, d) Eastern China–western Pacific (ECWP); (e, f) subtropical North Pacific Ocean (NP). Both the
height in the vertical direction and the coloring stands for the value of DSSR. The dark spots at the bottom of each
panel represent the locations under clear skies. Taking (a) as an example, the label “2010030908” means between 0800
and 0859 on 9 March 2010 UTC.
same day (9 March 2010 UTC), respectively. The clear-sky
sampling points in the monorail track within an hour are 1256
for Fig. 7a, and 814 for Fig. 7e. The CV of DSSR is 5.98%
for the TP region and 3.17% for the NP region. Although the
distribution of clear-sky sampling points can affect the CV,
the surface properties still contribute the most to the DSSR
and its CV. Figures 7b and f are for two tracks with similar
clear-sky sampling points (1036 and 1091, respectively) on
nearby days. The spatial CV of DSSR is 6.95% in the TP region and 4.10% in the NP region. Figures 7c and d show the
spatial variation of DSSR within one hour for two tracks in
the ECWP region. M is 2722 for Fig. 7c and 851 for Fig. 7d.
The CV is 2.55% and 4.95%, respectively. The above case
analyses show that the underlying surface properties affect
the distribution of DSSR the most in the TP region.
3.3. Simulation by the I3RC model
Shortwave flux transmittance (T ) is the ratio of the surface horizontal solar radiation to extraterrestrial radiation
(Liou, 2002). Under the concurrence of variable surface
albedo and 3D clouds, what is the effect of surface albedo
on the shortwave flux transmittance? As an example, Fig. 8
shows the distributions of the shortwave flux transmittance
of stratocumulus clouds. Figures 8a–d are for the wavelength
of 0.675 µm, and Figs. 8e–h are for the wavelength of 2.13
µm. For each simulation at a certain wavelength, the surface
albedo was 0.0 for Figs. 8a and e, 0.2 for Figs. 8b and f, 0.4
for Figs. 8c and g, and 0.6 for Figs. 8d and h. For the regions with white color, the transmittance is greater than 1.0,
which means that the enhancement of the radiation caused
by cloud cover is more evident than the reducing effect. We
know that such a phenomenon is mainly induced by scattered
radiation resulting from the underlying surface and inhomogeneous structure of clouds in principle. From the figures, we
conclude that the distributions of shortwave radiation transmittance in the three domains are similar, which is mainly
caused by the structure of clouds. The average T at 0.675 µm
is 0.686, 0.745, 0.815 and 0.900 for a surface albedo of 0.0,
0.2, 0.4 and 0.6, and at 2.13 µm it is 0.512, 0.548, 0.589 and
0.638, respectively. It is clear that the shortwave flux transmittance increases as the surface albedo increases.
Another example is for the impact of cumulus cloud on
the distribution of the shortwave flux transmittance (Fig. 9).
Figures 9a–d are at 0.675 µm, and Figs. 9e–h are at 2.13
µm. The average T at 0.675 µm is 0.900, 0.929, 0.959, and
0.992 for a surface albedo of 0.0, 0.2, 0.4 and 0.6, respec-
JUNE 2015
767
WANG ET AL.
3.5
3.5
(a)
(b)
1
2.5
Y(Km)
Y(Km)
2.5
1.5
1.5
0.9
0.5
0.5
0.5
1.5
2.5
X(Km)
3.5
0.5
3.5
0.8
(d)
2.5
Y(Km)
2.5
Y(Km)
3.5
3.5
(c)
1.5
0.5
0.7
1.5
0.5
0.5
1.5
2.5
X(Km)
3.5
0.5
3.5
1.5
2.5
X(Km)
3.5
0.6
3.5
(e)
(f)
2.5
Y(Km)
2.5
Y(Km)
1.5
2.5
X(Km)
1.5
0.5
0.5
1.5
0.5
0.4
0.5
1.5
2.5
X(Km)
3.5
0.5
3.5
3.5
3.5
(g)
(h)
0.3
2.5
Y(Km)
2.5
Y(Km)
1.5
2.5
X(Km)
1.5
0.5
1.5
0.2
0.5
0.5
1.5
2.5
X(Km)
3.5
0.5
1.5
2.5
X(Km)
3.5
Fig. 8. Simulated shortwave flux transmittance of stratocumulus cloud at wavelengths (a–d) 0.675
µm and (e–h) 2.13 µm. The surface albedos are 0.0 in (a, e), 0.2 in (b, f), 0.4 in (c, g) and 0.6 in (d,
h).
tively, and at 2.13 µm it is 0.860, 0.880, 0.901 and 0.923,
respectively. For cumulus cloud, the effects of surface albedo
on downward shortwave radiation flux are weaker than for
stratocumulus cloud. This is because the stratocumulus cloud
field has a much more complex structure than that of cumulus
cloud. Surface properties have a stronger effect on solar radiation under the sky of more complex 3D clouds. The largest
effect occurs in regions with cloud gaps. This is mainly attributed to the increase of the diffuse radiation, while the di-
rect solar radiation component is almost unaffected. If the
spatial changes of cloud properties (e.g. cloud optical thickness, liquid water content, effective particle radius, cloud
coverage and geometry) are more complex, the role of surface albedo on DSSR is stronger. At the same time, we can
see that DSSR will increase as surface albedo increases. As
the surface albedo increases, more photons will be reflected
to the sky instead of reaching the ground, and participate in
the processes of multiple scattering. A proportion of those re-
768
SURFACE PROPERTIES IMPACT ON DOWNWARD SURFACE SHORTWAVE RADIATION
(a)
4
2
0
(b)
6
Y(Km)
Y(Km)
6
2
4
X(Km)
0
6
(c)
6
1
4
0.9
2
0
VOLUME 32
0
2
4
X(Km)
6
0.8
(d)
6
4
Y(Km)
Y(Km)
0.7
2
0
4
0.6
2
0
2
4
X(Km)
0
6
(e)
6
0
2
4
X(Km)
6
0.5
(f)
6
Y(Km)
Y(Km)
0.4
4
2
0
2
0
2
4
X(Km)
0
6
(g)
6
4
0.3
0
2
4
X(Km)
2
6
0.2
(h)
6
Y(Km)
Y(Km)
4
0.1
4
2
0
0
0
2
4
X(Km)
6
0
0
2
4
X(Km)
6
Fig. 9. Simulated shortwave flux transmittance of cumulus cloud at wavelengths (a–d) 0.675
µm and (e–h) 2.13 µm. The surface albedos are 0.0 in (a, e), 0.2 in (b, f), 0.4 in (c, g) and 0.6
in (d, h).
flected photons will transfer to the ground through a complex
physical process.
Previous studies on surface albedo have paid much more
attention to its effect on the upward surface shortwave radiation than its effect on the DSSR (e.g., Li et al., 1993; Gupta et
al., 2001; Ma and Pinker, 2012; Qin et al., 2012). Our study
shows that surface albedo has an important role in the value
of DSSR itself. Given the importance of the upward surface
shortwave radiation based on surface albedo and DSSR, it
is necessary to consider the effect of surface albedo on the
surface radiation budget. Surface albedo is a dynamic parameter. It can change not only with the variation of surface
JUNE 2015
WANG ET AL.
769
conditions, such as the physical and chemical properties of
soil, but also with the sun’s angle. Surface albedo itself is
complex and uncertain. At present, the problem of the error
due to surface albedo in the satellite inversion and radiative
transfer algorithm is a challenge in the field of atmospheric
science. Further study is still needed.
(3) The I3RC numerical simulations showed that surface
albedo affects DSSR dramatically. DSSR increases as surface albedo increases, and the impact of surface albedo on
DSSR is larger if the spatial distribution of clouds is more
non-uniform. Surface albedo is just one of the parameters of
surface properties. It is necessary to consider the effect of
surface albedo on the surface radiation budget.
4. Conclusion and discussion
4.2. Discussion
4.1. Conclusion
As a basic problem in the earth–atmosphere system, detailed studies of the radiative transfer process contribute to
further research on climate change and the physics of remote
sensing. In the TP region, its protruding nature with high
elevation and complex surface properties results in equally
complex weather and cloud systems. As a result, present radiative transfer models and satellite inversion algorithms cannot meet the necessary requirements. Satellite remote sensing
has become more and more widely used in the geosciences.
However, satellite data should be evaluated against in situ observations before being used. The TP is characterized by high
elevation and complex surface properties, and thus acts as a
useful benchmark for evaluating satellite data. In situ observations at Yangbajain, Nam Co, and SACOL were adopted in
this study to evaluate FLASHFlux satellite data. The effects
of surface properties on the DSSR were analyzed by comparing the TP, ECWP and NP regions. The I3RC model was
used to study the effects of surface albedo on the DSSR. The
main results can be summarized as follows:
(1) Under clear-sky conditions, the satellite products and
in situ data are consistent with a correlation of 0.992 at Yangbajain, 0.991 at Nam Co site, and 0.998 at SACOL. The mean
absolute error of satellite-estimated products is about 6.7% at
Yangbajain, 6.3% at Nam Co, and 3.4% at SACOL. Under
all-sky conditions, the error increases significantly because
the present algorithms ignore 3D cloud properties. The quality of the satellite inversion products is spatially dependent,
and it tends to be better for smoother terrain. The error increases and becomes more variable with the increasing complexity of surface properties.
(2) The CV was used to evaluate the effect of surface
properties on the distribution of DSSR. The work was performed by choosing three regions located at the same latitudes (26◦ –40◦N), including the TP region (75◦ –105◦E),
the ECWP region (105◦–135◦E), and the NP region (150◦–
180◦E). The CV has an annual cycle, which is higher in the
winter half year and lower in the summer half year. The maximum CV reaches about 17% in the TP region, and about
13% in the other two regions. When the clear-sky sampling
points of the monorail track within an hour are greater than
500, the average CV is 9.44% for the TP region, 4.95% for
the ECWP region, and 3.49% for the NP region. When the
clear-sky sampling points are greater than 800, the averaged
CV is 10.5%, 5.11% and 3.55%, respectively. The impact of
underlying surface features in the TP region is about twice as
large as in the ECWP or NP regions.
Current satellite products face great challenges over the
TP because of the complex surface and sky conditions. Surface properties dramatically affect the distribution of DSSR
over the TP, which in turn will modulate the energy cycle and
further lead to a series of climatic and meteorological consequences. The present study qualitatively and quantitatively
indicated that the effect of surface features is an absolute restriction for the precision of current radiative transfer models and satellite inversion algorithms. In areas with a complex surface, the variability of that underlying surface and
its radiative properties combine to generate complicated spatial and temporal patterns of surface radiation budgets. Under clear-sky conditions, shortwave surface effects can lead to
surface temperature differences of up to 2.5 K, and longwave
effects to differences of up to 1 K (Manners et al., 2012). The
TP has very different characteristics of DSSR compared to
other regions. More attention should be paid to the effect of
the underlying surface on the surface radiation balance.
In terms of the effect of surface properties, most previous studies have simply performed their work under clearsky conditions (e.g. Liou et al., 2007; Manners et al., 2012;
Lee et al., 2013). However, the Earth’s average cloud fraction
is about two thirds (Maddux et al., 2010), and the complexity of surface properties can induce equally complex weather
types and sky conditions. Complex surfaces and 3D clouds
coexist most of the time. In our simulation, only the surface albedo effect was investigated under the sky with 3D
clouds because of the limitation of the current I3RC Monte
Carlo code. Our simulation showed that the impact of surface
albedo on DSSR is larger if the spatial distribution of clouds
is more non-uniform. The problem will be more complex
if the topographic effect is added into the radiative transfer
model. In the future, we intend to perform studies of the topographic effect by improving the I3RC Monte Carlo model,
or by using other effective models. The present work can be
used as a foundation upon which we can build and think about
how to extract the surface shortwave radiation values by using
more accurate methods and satellite data. It is imperative to
establish inhomogeneous surface–atmosphere coupling into
radiative transfer models.
Acknowledgements. This research was supported by the National Natural Science Foundation of China (Grant No. 41127901)
and the Strategic Priority Research Program–Climate Change: Carbon Budget and Relevant Issues (Grant No. XDA05040300). The
authors would like to thank Profs. HUANG Jian-Ping, ZHANG Wu,
MA Yao-Ming, XUAN Yue-Jian, and CHEN Hong-Bin for their
provision of in situ data. The authors would also like to thank Prof.
770
SURFACE PROPERTIES IMPACT ON DOWNWARD SURFACE SHORTWAVE RADIATION
Tamas VARNAI and Prof. Robert PINCUS for their many suggestions and discussions on the Monte Carlo model.
REFERENCES
Cahalan, R. F., and Coauthors, 2005: The I3RC: Bringing together
the most advanced radiative transfer tools for cloudy atmospheres. Bull. Amer. Meteor. Soc., 86(9), 1275–1293.
Cong, Z. Y., S. C. Kang, A. Smirnov, and B. Holben, 2009:
Aerosol optical properties at Nam Co, a remote site in central Tibetan Plateau. Atmos. Res., 92(1), 42–48.
Dubayah, R. C., and S. Loechel, 1997: Modeling topographic solar
radiation using GOES data. J. Appl. Meteor., 36(2), 141–154.
Dubayah, R. C., and P. M. Rich, 1995: Topographic solar radiation models for GIS. Int. J. Geographical Inform. Syst., 9(4),
405–419.
Evans, K. F., and A. Marshak, 2005: Numerical methods. 3D Radiative Transfer in Cloudy Atmospheres. A. Marshak and A.
B. Davis, Eds., Springer, Berlin, 261–274.
Geiger, M., L. Diabate, L. Menard, and L. Wald, 2002: A web
service for controlling the quality of measurements of global
solar irradiation. Solar Energy, 73(6), 475–480.
Gui, S., S. L. Liang, and L. Li, 2009: Validation of surface radiation data provided by the CERES over the Tibetan Plateau.
2009 17th International Conference on Geoinformatics, Fairfax, VA, 1–6.
Gui, S., S. L. Liang, K. C. Wang, and L. Li, 2010: Assessment of
three satellite-estimated land surface downwelling shortwave
irradiance data Sets. IEEE Geosci. Remote Sens. Lett., 7(4),
776–780.
Gupta, S. K., D. P. Kratz, Jr. P. W. Stackhouse, and A. C.
Wilber, 2001: The Langley parameterized shortwave algorithm (LPSA) for surface radiation budget studies (version1.0). NASA/TP-2001-211272.
Hayasaka, T., K. Kawamoto, G. Shi, and A. Ohmura, 2006: Importance of aerosols in satellite-derived estimates of surface
shortwave irradiance over China. Geophys. Res. Lett., 33,
L06802, doi:10.1029/2005GL025093.
Helbig, N., H. L¨owe, and M. Lehning, 2009: Radiosity approach
for the surface radiation balance in complex terrain. J. Atmos.
Sci., 66, 2900–2912.
Houborg, R., H. Soegaard, W. Emmerich, and S. Moran, 2007:
Inferences of all-sky solar irradiance using Terra and Aqua
MODIS satellite data. Int. J. Remote Sens., 28(20), 4509–
4535.
Huang, J. Y., 2004: Meteorological Statistical Analysis and Forecast Method. China Meteorological Press, Beijing, 298 pp. (in
Chinese)
¨ 2012: Cloud amount analysis at YangbaHuo, J., and D. R. LU,
jing of Tibet in 2009–2010 using all-sky images. Climatic and
Environmental Research, 17(4), 393–399. (in Chinese)
Kang, S., S. Kim, and D. Lee, 2002: Spatial and temporal patterns
of solar radiation based on topography and air temperature.
Canadian Journal of Forest Research, 32(3), 487–497.
Kim, H. Y., and S. L. Liang, 2010: Development of a hybrid
method for estimating land surface shortwave net radiation
from MODIS data. Remote Sens. Environ., 114, 2393–2402.
Kurosaki, Y., and F. Kimura, 2002: Relationship between topography and daytime cloud activity around Tibetan Plateau. J.
Meteor. Soc. Japan, 80(6), 1139–1355.
Kuwagata, T., A. Numaguti, and N. Endo, 2001: Diurnal variation
VOLUME 32
of water vapor over the central Tibetan Plateau during summer. J. Meteor. Soc. Japan, 79, 401–418.
Lee, W. L., K. N. Liou, and C. C. Wang, 2013: Impact of 3D topography on surface radiation budget over the Tibetan
Plateau. Theor. Appl. Climatol., 113, 95–103.
Li, Z., H. G. Leighton, K. Masuda, and T. Takashima, 1993: Estimation of SW flux absorbed at the surface from TOA reflected
flux. J. Climate, 6(2), 317–330.
Liou, K. N., 2002: An Introduction to Atmospheric Radiation. 2nd
ed., Academic Press, Boston, 583 pp.
Liou, K. N., W. Lee, and A. Hall, 2007: Radiative transfer in
mountains: Application to the Tibetan Plateau. Geophys. Res.
Lett., 34, L23809, doi: 10.1029/2007GL031762.
Loeb, N. G., N. M. Smith, S. Kato, W. F. Miller, S. K. Gupta,
P. Minnis, and B. A. Wielicki, 2003: Angular distribution
models for top-of-atmosphere radiative flux estimation from
the clouds and the Earth’s radiant energy system instrument
on the Tropical Rainfall Measuring Mission satellite. Part I:
Methodology. J. Appl. Meteor., 42, 240–265.
Ma, Y., and R. T. Pinker, 2012: Modeling shortwave radiative
fluxes from satellites. J. Geophys. Res., 117, D23202, doi:
10.1029/2012JD018332.
Ma, Y., and Coauthors, 2005: Diurnal and inter-monthly variation
of land surface heat fluxes over the central Tibetan Plateau
area. Theor. Appl. Climatol., 80, 259–273.
Maddux, B., S. A. Ackeman, and S. Platnick, 2010: Viewing geometry dependencies in MODIS cloud products. J. Atmos.
Oceanic Technol., 27(9), 1519–1528.
Manners, J., S. B. Vosper, N. Roberts, 2012: Radiative transfer over resolved topographic features for high-resolution
weather prediction. Quart. J. Roy. Meteor. Soc., 138, 720–
733.
Moeng, C. H., and Coauthors, 1996: Simulation of a stratocumulustopped planetary boundary layer: Intercomparison among
different numerical codes. Bull. Amer. Meteor. Soc., 77(2),
261–278.
Ohring, G., B. Wielicki, R. Spencer, B. Emery, and R. Datla, 2005:
Satellite instrument calibration for measuring global climate
change. Bull. Amer. Meteor. Soc., 86, 1303–1314.
Pincus, R., and K. F. Evans, 2009: Computational cost and accuracy in calculating three-dimensional radiative transfer: Results for new implementations of Monte Carlo and SHDOM.
J. Atmos. Sci., 66, 3131–3146.
Qin, J., K. Yang, S. Liang, and W. Tang, 2012: Estimation of daily
mean photosynthetically active radiation under All-Sky conditions based on relative sunshine data. J. Appl. Meteor. Climatol., 51, 150–160.
Ryu, Y., S. Kang, S. K. Moon, and J. Kim, 2008: Evaluation of
land surface radiation balance derived from moderate resolution imaging spectroradiometer (MODIS) over complex terrain and heterogeneous landscape on clear sky days. Agric.
Forest. Meteorol., 148(10), 1538–1552.
Spencer, J. W., 1971: Fourier series representation of the position
of the sun. Search, 2, 172.
Stevens, B., and D. H. Lenschow, 2001: Observations, experiments, and large eddy simulation. Bull. Amer. Meteor. Soc.,
82(2), 283–294.
St¨ockli, R., 2013: The HelioMont Surface Solar Radiation Processing. Scientific Report MeteoSwiss, No. 93, 122 pp.
Stroeve, J., J. E. Box, F. Gao, S. Liang, A. Nolin, and C. Schaaf,
2005: Accuracy assessment of the MODIS 16-day albedo
product for snow: Comparisons with Greenland in suit mea-
JUNE 2015
WANG ET AL.
surements. Remote Sens. Environ., 94(1), 46–60.
Wang, K. C., X. J. Zhou, J. M. Liu, and M. Sparrow, 2005: Estimating surface solar radiation over complex terrain using
moderate-resolution satellite sensor data. Int. J. Remote Sens.,
26(1), 47–58.
Wang, L. D., D. R. L¨u, and W. X. Zhang, 2013: Study on characteristic of solar radiation at Nam Co and Yangbajain in
Qinghai-Xizang Plateau. Plateau Meteorology, 32(2), 315–
326. (in Chinese)
Wang, L. D., D. R. L¨u, and J. Huo, 2014: Observation and simulation of abnormal transmittance over Yangbajing, Tibet. Atmospheric and Oceanic Sciences Letters, 7, 190–197, doi:
10.3878/j.issn.1674-2834.13.0086.
Wang, S., R. F. Grant, D. L. Verseghy, and T. A. Blac, 2002: Modelling carbon dynamics of boreal forest ecosystems using the
Canadian land surface scheme. Climatic Change, 55(4), 451–
477.
Yang, K., T. Koike, P. Stackhouse, C. Mikovitz, and S. J. Cox,
2006: An assessment of satellite Surface radiation Products
for highlands with Tibet instrumental data. Geophys. Res.
771
Lett., 33, L22403, doi: 10.1029/2006GL027640.
Yang, K., R. T. Pinker, Y. M. Ma, T. Koike, M. M. Wonsick,
S. J. Cox, Y. C. Zhang, and P. Stackhouse, 2008: Evaluation of satellite estimates of downward shortwave radiation
over the Tibetan Plateau. J. Geophys. Res., 113, D17204, doi:
10.1029/2007JD009736.
Yang, K., J. He, W. J. Tang, J. Qin, and C. C. K. Cheng, 2010:
On downward shortwave and longwave radiations over high
altitude regions: Observation and modeling in the Tibetan
Plateau. Agric. Forest. Meteor., 150(1), 38–46.
Zhang, Y. C., W. B. Rossow, and Jr. P. W. Stackhouse, 2006:
Comparison of different global information sources used in
surface radiative flux calculation: Radiative properties of the
near-surface atmosphere. J. Geophys. Res., 111, D13106, doi:
10.1029/2005JD006873.
Zhang, Y. C., W. B. Rossow, and Jr. P. W. Stackhouse, 2007: Comparison of different global information sources used in surface
radiative flux calculation: Radiative properties of the surface.
J. Geophys. Res., 112, D01102, doi: 10.1029/2005JD007008.


© Copyright 2026