
Judicial and Agency Enforcement of Nondiscrimination Laws
JUDICIAL AND AGENCY ENFORCEMENT OF NONDISCRIMINATION LAWS
By
Blair Druhan Bullock
Dissertation
Submitted to the Faculty of the
Graduate School of Vanderbilt University
In partial fulfillment of the degree of
DOCTOR OF PHILOSOPHY
In
Law and Economics
May, 2015
Nashville, TN
Approved:
Professor Joni Hersch
Professor Michael Selmi
Professor Kevin Stack
Professor Kip Viscusi
Copyright © 2015 by Blair Druhan Bullock
All rights reserved
ii
To my peers, who are encouraging and supportive
and
To my husband, who is loving, caring, and patient
iii
ACKNOWLEDGMENTS
This dissertation would not have been possible without the complete support of the
Vanderbilt Ph.D. Program in Law and Economics. Professor Joni Hersch and Professor Kip
Viscusi created a program that is challenging, creative, structured, and supportive. Each of these
qualities helped me develop all of the skills necessary to complete this dissertation, find the
yearning to answer important and complex empirical questions, and overcome the challenges that
I faced during these six years. The program also attracted the most supportive, encouraging, fun,
and diverse group of students. Without any one of my peers, specifically Caroline Cecot, Jacob
Byl, Benjamin McMichael, and Elissa Phillip, my dissertation would not be what it is today.
My dissertation committee has truly been one for the record books. They have provided
such valuable feedback throughout the entire process: from picking a general topic, to narrowing
that topic to three distinct questions, helping me answer those questions, and helping me perfectly
package it through editing and organizing. From day one of this process, Professor Joni Hersch
has made sure that I was focused and prepared for the task of completing this dissertation. Without
her high expectations, willingness to collaborate with me, and understanding of my need for
encouragement, I would not have reached this point.
I am also eternally grateful for the love and support of Wes Bullock, my husband. During
this process, he knew exactly how to comfort me during times of stress, celebrate with me in times
of success, and provide confident words of encouragement in the times when I needed it most. My
parents, Ross and Ginger Druhan, also knew how to provide the exact support and encouragement
I needed throughout this process. They asked the appropriate questions when I struggled with ideas
and provided helpful distractions when I needed to take some time away. They also provided me
with the education and drive that I needed to get to this point.
iv
TABLE OF CONTENTS
Dedication ..................................................................................................................................... III
Acknowledgements ....................................................................................................................... IV
List of Tables ............................................................................................................................... VII
List of Figures ............................................................................................................................... IX
List of Abbreviations ..................................................................................................................... X
Introduction ................................................................................................................................... XI
Chapter
I. DETERMINANTS OF ADVERSE EMPLOYMENT ACTIONS AFTER WORKPLACE
SEXUAL HARASSMENT............................................................................................................. 1
Introduction ................................................................................................................................. 1
Legal Background ....................................................................................................................... 3
Sexual Harassment Literature and Limitations ........................................................................... 6
Sexual Harassment Datasets .................................................................................................... 6
MSPB Survey Literature ......................................................................................................... 9
Literature on Victim’s Response to Harassment ................................................................... 10
Literature on Sexual Harassment Consequences ................................................................... 11
Conceptual Framework ............................................................................................................. 12
Employee’s Response to Harassment .................................................................................... 13
Employer’s Response to Harassment .................................................................................... 15
Empirical Framework ................................................................................................................ 19
Empirical Specification ......................................................................................................... 19
Data ........................................................................................................................................ 20
Summary Statistics ................................................................................................................ 23
Regression Results ................................................................................................................. 26
Legal Implications ..................................................................................................................... 35
Conclusion................................................................................................................................. 39
References ................................................................................................................................. 40
v
II. STOPPING THE NUISANCE: EMPIRICAL EVIDENCE THAT FEDERAL COURTS CAN
DETER FRIVOLOUS EEOC CHARGES ................................................................................... 56
Introduction ............................................................................................................................... 56
Background on Frivolous Claims: Relevant Literature............................................................ 59
Background on the EEOC: How Federal Courts Could Affect EEOC Filings ......................... 63
EEOC Administration and How It Reveals the Strength of a Charge ................................... 65
Mechanism Complications .................................................................................................... 67
Empirical Analysis: Do Federal Court Decisions Affect Filing of EEOC Charges? ................ 70
Relevant Circuit Court Decisions .......................................................................................... 70
Data ........................................................................................................................................ 75
Empirical Analysis ................................................................................................................ 78
Regression Framework .......................................................................................................... 81
Regression Results ................................................................................................................. 85
Implications, Explanations, and Conclusions ........................................................................... 88
References ................................................................................................................................. 93
Appendix ................................................................................................................................. 105
III.THE EEOC’S POSITIVE EFFECT ON REDUCING THE WHITE/BLACK WAGE GAP110
Introduction ............................................................................................................................. 110
Previous Analyses of Nondiscrimination Laws and The EEOC ............................................. 112
Measuring the Impact of Nondiscrimination Laws on Employment Outcomes ................. 112
The Deterrent Effect of Other Agencies .............................................................................. 113
The Effect of the EEOC on Employment Outcomes ........................................................... 114
The EEOC and the Enforcement of Title VII ......................................................................... 116
Empirical Analysis .................................................................................................................. 122
Data ...................................................................................................................................... 122
Empirical Specification ....................................................................................................... 127
Results ................................................................................................................................. 130
Conclusions and Implications ................................................................................................. 132
References ............................................................................................................................... 135
vi
LIST OF TABLES
Table
Page
CHAPTER I
Table 1. Definitions of MSPB Variables .................................................................................. 43
Table 2. MSPB Retaliation Summary Statistics for Females and Males .................................. 44
Table 3a. MSPB Summary Statistics for Female Sample: Personal Demographics ................. 45
Table 3b. MSPB Summary Statistics for Male Sample: Personal Demographics .................... 46
Table 4a. MSPB Summary Statistics for Female Sample: Harassment Characteristics ........... 47
Table 4b. MSPB Summary Statistics for Male Sample: Harassment Characteristics .............. 48
Table 5. OLS Regression Results .............................................................................................. 49
Table 6. OLS Regressions Results with Interaction Variable ................................................... 51
Table 7. 2SLS Regression Results for Female Sample ............................................................. 52
Table 8. Heckman Selection Regression Results for Male and Female Samples ..................... 54
CHAPTER II
Table 1. Summary Statistics of the Impact of the Seventh Circuit’s Mixed-Motive Standard on
Retaliation Charges ................................................................................................................... 99
Table 2. Summary Statistics of the Impact of the Seventh Circuit’s But-For Causation
Standard on ADA Charges ...................................................................................................... 100
Table 3. DDD Estimates of the Impact of the Seventh Circuit’s Mixed-Motive Standard on
Retaliation Charges ................................................................................................................. 101
Table 4. DDD Estimates of the Impact of the Seventh Circuit’s But-For Standard on ADA
Charges .................................................................................................................................... 102
Table 5. Estimates from OLS Regressions Estimating the Effect of the Fifth Circuit’s MixedMotive Causation Standard on Retaliation Charges ............................................................... 103
Table A: Descriptive Statistics ................................................................................................ 105
Table B. The Effect of the Fifth Circuit’s Mixed-Motive Causation Standard on Retaliation
Charges .................................................................................................................................... 106
Table C. The Effect of the Seventh Circuit’s But-For Causation Standard on ADA Charges 108
CHAPTER III
Table 1. EEOC Race Charges and Cases Per Year ................................................................. 138
Table 2. Average EEOC Race Charge and Case Rates Reported by Race and Sex ............... 138
vii
Table 3. EEOC Race Charge and Case Rates Reported by Industry ...................................... 139
Table 4. EEOC Race Charge and Case Rates Reported by State ............................................ 141
Table 5. Descriptive Statistics for CPS Sample, Means and Percentages............................... 142
Table 6. Regression Results for Rate of Race Charges ........................................................... 143
Table 7. Regression Results for Rate of Race Charges, Male Sample.................................... 144
Table 8. Regression Results for Rate of EEOC Race Cases ................................................... 145
viii
LIST OF FIGURES
Figure
Page
CHAPTER II
Figure 1. Illustration of the Seventh Circuit’s But-For ADA Causation Standard ................... 97
Figure 2. Illustration of the Fifth Circuit’s Mixed-Motive Retaliation Causation Standard ..... 98
ix
LIST OF ABBREVIATIONS
ADA: Americans with Disabilities Act
ADEA: Age Discrimination Employment Act
AFDC: Aid to Families with Dependent Children
CPS: Current Population Survey
DD: difference-in-differences
DDD: triple-differences
EEOC: Equal Employment Opportunity Commission
EPA: Environmental Protection Agency
FEPA: Fair Employment Practices agencies
FOIA: Freedom of Information Act
GSS: General Social Survey
MSPB: Merit Systems Protection Board
NACIS: North American Industry Classification System
NBER: National Bureau of Economic Research
NSLCS: National Survey of Lawyer’s Career Satisfaction
OLS: Ordinary Least Squares
OSHA: Occupational Safety and Health Administration
POWDA: Protecting Older Workers Against Discrimination Act
SES: Senior Executive Service
TERO: Tribal Employment Rights offices
2SLS: two-stage least squares model
x
INTRODUCTION
Equality in the workplace and equal opportunity to join the workforce are values that
American society expects and promotes. Nationwide acceptance of such values is evident in state
and federal government actions taken to promote equality and in the large amount of civil litigation
resulting from such actions. Preventing and remedying discrimination are now tasks that each
branch of the federal government plays an active role in, and this dissertation analyzes the active
roles of the federal courts and of the Equal Employment Opportunity Commission (“EEOC”).
Under Title VII of the Civil Rights Act., it is illegal to discriminate against employees
based on sex, race, national origin, color, and religion. Following the Supreme Court’s 1986
decision, Meritor Savings Bank v. Vinson, employers can be liable for sexual harassment in the
workplace as a form of sex discrimination under Title VII. In Chapter I, I provide empirical
evidence that supports the Supreme Court’s current standard for employer liability in sexual
harassment cases under the 1998 U.S. Supreme Court cases Burlington Industries, Inc. v. Ellerth
and Faragher v. City of Boca Raton. Specifically, I empirically analyze a sexual harassment survey
of federal employees finding that employees that have been harassed in the workplace are more
likely to experience adverse employment action following the harassment if they report the
harassment and if they are harassed by their supervisor. This evidence supports the elevated
standard of vicarious liability for the employer if the harasser is the victim’s supervisor, but it does
not support the narrowing of the affirmative defense that the employer receives if the victim does
not report the harassment.
Under Title VII, every charge alleging discrimination under Title VII and other
nondiscrimination statutes, including the Americans with Disabilities Act (“ADA”), must first be
filed with the EEOC before the claim can be filed in federal court. Generally, scholars,
xi
practitioners, and judges have expressed concern over the prevalence of frivolous employment
discrimination charges filed with the EEOC and in the federal courts (Bennett 2013). In addition,
when adopting a strict but-for causation standard in University of Texas Southwestern Medical
Center v. Nassar, a five justice majority of the Supreme Court expressed concern that both the
federal courts and the EEOC would be overwhelmed by frivolous charges if it adopted the weaker
mixed-motive standard. In Chapter II, I present the first empirical analysis of whether federal
courts can affect the filing of frivolous employment discrimination charges. By analyzing the
universe of EEOC changes using difference-in-differences analyses, I provide empirical evidence
that a but-for causation standard can decrease the filing of frivolous charges and a weak mixedmotive standard can increase these filings.
In the final chapter of my dissertation, I develop empirical evidence showing whether
EEOC actions and charges, which may or may not be influenced by federal court decisions, in turn
deter discrimination in the workplace. Unlike other enforcement agencies, such as the
Environmental Protection Agency (“EPA”), the EEOC cannot promulgate regulations to attempt
to decrease discrimination in the workplace. The EEOC’s power to affect discrimination in the
workplace instead rests with the investigations of each charge and its ability to litigate certain
charges. In Chapter III, I include rates of EEOC action in analyses of wage equations finding that
the rate of charges that include a charge of race discrimination filed in an industry in a state two
years earlier positively affects the wages of black male employees. However, I do not find a
positive relationship between race charges and black female wages or between EEOC litigation
and black wages. Overall, this result suggests that the EEOC can play a beneficial role in deterring
potentially discriminatory acts by decreasing the white/black wage gap for males.
xii
CHAPTER I
DETERMINANTS OF ADVERSE EMPLOYMENT ACTIONS
AFTER WORKPLACE SEXUAL HARASSMENT
INTRODUCTION
While it is difficult to estimate the number of individuals that have experienced sexual
harassment in the workplace, it is known that the overwhelming majority of sexual harassment
instances in the workplace is not reported to employers, supervisors, or any outside agency. Only
19% of the over 2,000 employees who responded to the 1994 Merit Systems Protection Board
sexual harassment survey that they had been sexually harassed in the previous two years reported
the harassment. In addition, a 2013 survey of 1,000 adults conducted by the Huffington Post found
that 30% of the respondents who had ever been harassed reported the harassment (Berman and
Swanson 2013). In this chapter, I seek to understand why such a large percentage of workplace
harassment goes unreported by examining a potential fear of employees when they decide whether
to report the harassment: the prospect of experiencing an adverse employment action following
the harassment. In this chapter, I present the first empirical analysis of workplace retaliation
following incidents of sexual harassment. To determine what characteristics of sexual harassment
increase the likelihood that a victim experiences an adverse employment action, I analyze the 1994
Merit Systems Protection Board (“MSPB”) survey, which provides information on how victims of
harassment responded to the harassment and how the employer reacted to that response. In this
analysis, I find that employees who were harassed are statistically significantly more likely to
experience an adverse employment action if they report the harassment as compared to those who
do not report and if they are harassed by their supervisor as compared to their coworker.
Currently, under the 1998 U.S. Supreme Court cases Burlington Industries, Inc. v. Ellerth
and Faragher v. City of Boca Raton, if an employee is harassed by his or her supervisor and the
1
harassment resulted in a tangible employment action, then the employer is automatically liable for
the harassment. While this standard should help address the fact that supervisor harassment is more
likely to result in a tangible employment action, the employer has an affirmative defense if the
employee does not reasonably take advantage of workplace procedures in place to prevent
harassment.1 In addition, lower courts continually expand this defense by broadly interpreting
“reasonably” and altering the standard for one-time occurrences. The Supreme Court also
decreased the likelihood of employer liability when it narrowly defined “supervisor” in the 2013
case, Vance v. Ball State University. In this chapter, I discuss how these standards can and should
be tailored based on my empirical results, which show that employees often have a reasonable fear
of experiencing an adverse employment, especially when they report the harassment and when
they are harassed by their supervisors. The empirical results of this chapter suggest that the
Faragher and Ellerth defense should be narrowed instead of broadened, and this is the solution I
suggest in the legal implications section of this chapter.
I first present a review of how the legal system currently addresses employer liability for
sexual harassment and a literature review covering the law, psychology, and economic literature
on sexual harassment in the workplace. I then present a conceptual framework of a harassment
victim’s decision to report the harassment and an employer’s response to that harassment. The
conceptual framework incorporates legal standards and the social science literature related to these
decisions to make predictions regarding how the employer will respond. I then explore these
predictions through an empirical analysis of the employer’s response to workplace sexual
harassment that addresses each decision of the conceptual framework. Based on the empirical
findings, I conclude this chapter by discussing how the current sexual harassment legal framework
1
The defense also requires that the employer take precautions to prevent workplace harassment.
2
can be tailored to address the fact that reporting harassment and being harassed by one’s supervisor
greatly increases the likelihood of experiencing an adverse employment action following instances
of sexual harassment.
LEGAL BACKGROUND
Courts, Congress, and the Equal Employment Opportunity Commission (“EEOC”) have
continually modified sexual harassment law since the Supreme Court of the United States
recognized it as a form of sex discrimination under Title VII of the Civil Rights Act in the 1986
case, Meritor Savings Bank v. Vinson. Congress drafted Title VII with such vague language that it
has become known as a common-law enabling statute (Lemos 2010). As a result, the federal courts
have played a major role in defining sexual harassment and in determining an employer’s liability
for sexual harassment in the workplace. In Meritor Savings Bank v. Vinson, the Court recognized
and defined two forms of sexual harassment. Quid pro quo harassment occurs when an employer
makes a workplace decision because of an employee’s submission to or rejection of sexual
harassment, and hostile work environment harassment is defined as unwanted sexual conduct that
is so severe or pervasive that it alters an employee’s workplace conditions. While the Supreme
Court addressed what forms of harassment are actionable in Meritor, it did not explicitly address
when an employer should be liable for such harassment.
In 1998 the Supreme Court explicitly addressed and defined employer liability for sexual
harassment. Under the Supreme Court decisions Faragher and Ellerth, if an employee experiences
a tangible employment action after being harassed by her supervisor, then the employer will be
vicariously liable for that harassment. However, if the employer has taken measures to prevent the
harassment and the victim does not take advantages of the procedures in place by reasonably
reporting the harassment, then the employer will likely not be liable because the employer also has
3
an affirmative defense under Faragher and Ellerth. The employer will also not be liable if the
employee is harassed by her coworker and the employee does not take advantage of workplace
harassment procedures because the current standard for employer liability for coworker
harassment is whether the employer knew or should have known about the harassment and whether
the employer took reasonable steps to prevent the harassment.
Each of these standards created by the Supreme Court left room for the lower courts to
interpret the requirements for both employer liability and actionability of sexual harassment.
Disagreements between the courts of appeals have led to several circuit splits regarding sexual
harassment standards and definitions. After Meritor was decided in 1986, circuit splits first
developed regarding the actionability of harassment. Courts and legal scholars first disagreed over
interpretations of the severe and pervasive requirement. For example, a circuit split arose over
whether the severe and pervasive standard should be looked at from the perspective of a reasonable
person or a reasonable woman, if the victim is a female (Druhan 2013). Legal scholars disagreed
over this interpretation as well (Juliano and Schwab 2001).
Today, courts continue to disagree over the enforcement of the Faragher and Ellerth
defense. Courts have narrowed the liability standard and expanded the affirmative defense such
that legal scholars have expressed concern for the tension that exists between the standards for
liability and actionability. White (2006) recognized the conflict that exists between the requirement
that the harassment be pervasive and the affirmative defense if the victim does not reasonably
respond to the harassment. Following Faragher and Ellerth, several courts expanded the
affirmative defense, such that the victim must timely report the harassment, and these
interpretations further increased the presence of the conflict between actionability and liability.
4
Herbert (2007) noted that several courts have held that victims who did not report the
harassment in as little as two weeks were unreasonable. In addition, some courts have held that
concerns about embarrassment, discomfort, or even workplace consequences were unreasonable
reasons for not reporting. Instead, these courts required more than an “unsupported subjective fear
that the employee would suffer physical harm” (Herbert 2007). While the EEOC recognizes
several reasonable explanations for why an employee may not follow her employer’s procedures
after harassment, including the fear of retaliation, these courts have elevated the standard in such
a way that it competes with the actionability requirement that the harassment be pervasive.
An additional interpretation adopted by several courts of appeals narrows the defense even
further. Some circuits (at least the Second, Fourth, and Eighth) only require the employer to meet
the first prong of the Faragher and Ellerth defense when the harassment is a one-time severe
incident (Neals 2013). In these circuits, the employer will not be liable for this supervisor
harassment if the employer “promptly exercise[s] reasonable care to prevent and correct any
sexually harassing behavior.” These courts argue that this interpretation helps to avoid strict
liability and advocates fairness (Neals 2013). The Supreme Court also recently narrowed the
liability standards of Faragher and Ellerth. In the summer of 2013, the Supreme Court settled a
circuit split over what employees qualify as “supervisors” under Ellerth and Faragher. In Vance,
the Supreme Court narrowly interpreted supervisor as an employee who is empowered to make
employment decisions against the victim. The Supreme Court’s definition of supervisor and the
circuit decisions that expand the affirmative defense greatly lessen the likelihood that an employer
will be liable for supervisor harassment under Faragher and Ellerth.
Ultimately, since Faragher and Ellerth, many lower courts, and even the Supreme Court
have made it substantially less likely that the employer will be liable for actionable sexual
5
harassment. Several scholars have expressed similar concerns over the expansion of the Faragher
and Ellerth defense and suggested solutions, including White (2006), Herbert (2007), and Bankers
(2014). Herbert (2007) suggested that courts should take a reasonable woman approach when they
determine whether a victim was reasonable instead of “finding a harassed employee’s failure to
formally report sexual harassment to the employer to be unreasonable.” White (2006) suggested
that courts reverse decisions requiring employees to report harassment in all situations and in a
very timely fashion. Bankers (2014) suggested that in Faragher and Ellerth, the Supreme Court
actually established that the affirmative defense is unavailable when the harasser is a proxy for the
employer (Bankers 2014). However, lower courts have not determined when an employee is a
“proxy,” nor do they often follow this standard.2 Perhaps, when adopting one of these solutions or
a different solution, the courts could look to empirical evidence, including the results of this
chapter, to stop and reverse the expanding of the Faragher and Ellerth defenses.
SEXUAL HARASSMENT LITERATURE AND LIMITATIONS
Sexual Harassment Datasets
In this chapter, I present the first study of the empirical relationships between the
characteristics of harassment, including the employee’s response to harassment, and adverse
employment actions following harassment. To uncover this relationship, it is necessary to survey
a sample of employees who have experienced harassment and elicit information on the
characteristics of that harassment, including their response to that action and how the employer
responded to the harassment. Very few surveys ask individuals to report their experience with
sexual harassment, and even fewer surveys ask individuals about the employer’s response. The
nationally representative surveys that have included questions regarding sexual harassment in the
2
Bankers (2014) suggested that an employee is a proxy when they have the ability to impute the intent of the employer.
6
workplace generally only ask about the existence of harassment in the respondent’s workplace and
whether the respondent has been sexually harassed. Two national representative surveys have
included a sexual harassment survey question. The General Social Survey (“GSS”) included a
sexual harassment question in its 1994, 2002, and 2006 surveys. However, the sexual harassment
questions were limited to one question asking if the individual had experienced any form of sexual
harassment in the previous twelve months or ever.3 The 1990 National Survey of Lawyer’s Career
Satisfaction (“NSLCS”) also simply included a question addressing the prevalence of sexual
harassment in the workplace. Because the sexual harassment questions inn these surveys only refer
to whether the respondent had been sexually harassed, neither of these surveys can be used to
analyze a victim’s response to harassment, the employer’s response, or the effect of harassment on
the workplace.
A large number of sexual harassment surveys with smaller and non-representative samples
have been conducted primarily by psychology and sociology researchers. While these surveys
often elicit information about the characteristics of sexual harassment in the workplace and its
consequences, a major limitation of these surveys is the size of their sample and the
representativeness of the sample. Examples of these surveys can be found in Chan et al. (2008).
Chan et al. (2008) conducted a meta-analysis of 49 sexual harassment studies and found that sexual
harassment in general leads to an increased likelihood of negative health and productivity effects.
The 49 studies that Chan et al. (2008) included in their meta-analysis are listed in the article, along
with the sample sizes of each. The largest sample analyzed is the Armed Services Gender Relations
Survey, discussed below. Though several additional studies analyzed by Chan et al. (2008) had
sample sizes over 1,000 observations, these studies are not nationally representative because they
3
The 1994 survey asked if the respondent had ever experienced sexual harassment, and the 2002 and 2006 surveys
asked if the respondent had experienced sexual harassment in the previous twelve months.
7
are limited to employees of one company. For example, Mueller et al. (2001) analyzed a dataset
consisting of employees of a large national telephone company, and Lim and Cortina (2005)
analyzed a dataset consisting of employees of a federal judicial circuit. Gettman and Gelfand
(2007) analyzed a large sample of employees who work for a national grocery store chain. An
additional important limitation of these studies is the fact that they also did not elicit information
on adverse employment consequences. Each of these studies found that an increase in the presence
of sexual harassment in the workplace was associated with lower job satisfaction and self-reported
well-being; however, none of these samples included information on whether an individual
experienced retaliation following the sexual harassment.
Additional sexual harassment studies have analyzed surveys and experiments primarily
composed of college students. While these surveys and experiments often elicit information such
as how a hypothetical victim would respond to harassment, these surveys are limited in two ways:
they are not nationally representative or comparable to the workplace, and they are, of course,
hypothetical. As a result, one cannot discern the actual consequences of sexual harassment in the
workplace. An example of such studies can be found in Katz et al. (1996). Katz et al. (1996)
analyzed the responses of 197 students, finding that men and women were less likely to believe
that an action constituted sexual harassment when the harasser was a friend or coworker as
compared to a supervisor.
The largest publicly available sexual harassment dataset is the Armed Services Gender
Relations Survey of Active Duty Members, which the Department of Defense issued in 1995,
2002, 2006, and 2010. While this survey asks very similar questions to the MSPB survey that I
analyze, including questions about retaliation, the survey is limited to harassment in the military,
which is not representative of private or public employment in the United States. Because of the
8
described data limitations, to analyze an employee’s likelihood of being harassed, perceptions of
being harassed, the consequences of harassment, and the victim’s response to harassment on a
nationally representative sample, the best and available dataset is the 1994 MSPB survey,
discussed in detail in the empirical framework section below.
MSPB Survey Literature
While several studies have empirically analyzed the MSPB sexual harassment survey, no
one has empirically analyzed the respondent’s answers to the questions addressing the employer’s
responses to sexual harassment. The studies that have analyzed the MSPB generally analyzed the
answers to the questions regarding what workplace and personal characteristics influence an
employee’s likelihood of experiencing workplace sexual harassment and what influences the
respondent’s perceptions of sexual harassment. For example, Antecol and Cobb-Clark (2003)
found that based on the 1994 MSPB survey responses, sexual harassment training may lead to
more sensitive perceptions of sexual harassment. Newman et al. (2003) analyzed the 1994 MSPB
survey and concluded that an employee’s personal characteristics had the greatest effect on the
likelihood that the employee is sexually harassed. Jackson and Newman (2004) also used the 1994
survey to analyze how the percentage of men in the workplace affects the likelihood of sexual
harassment; they found that women more frequently received unwanted sexual attention as the
percentage of male employees in their workplace increased and that men were more likely to
experience harassment as the ratio of women to men in their workplace increased. Druhan (2013)
also analyzed the 1994 survey and found that women were significantly more likely than men to
believe certain unwanted actions constitutes sexual harassment and that respondents were
significantly more likely to believe that unwanted actions by a supervisor constitute harassment as
compared to a coworker. To date, scholars have not used the MSPB survey to analyze a victim’s
9
decision to report the harassment or to analyze the consequences of the harassment, including
experiencing an adverse employment action.
Literature on Victim’s Response to Harassment
Though no scholar has empirically analyzed a victim’s decision to report sexual harassment
using nationally representative data such as the MSPB survey, scholars have theoretically modeled
a victim’s decision to report. In these models, one of the main factors presented as a factor the
victim will consider when deciding whether to report the harassment is the probability that the
employer will change her employment status. Knapp et al. (1997) constructed a theoretical model
of the victim’s decision to report and suggested that whether an employee avoids, copes with,
confronts, or seeks advocacy for harassment depends on the harassment policy of the firm, the
severity of the harassment, and the victim’s level of distress. Knapp et al. (1997) also argued that
the employee’s perceived outcome of the employer’s reactions to the harassment directly affects
her response.
Empirical evidence on an actual victim’s decision to report sexual harassment is limited.
Alexander and Prassad (2014) analyzed a 2009 survey of workplace safety violations and found
that three of the top four reasons that employees did not report workplace violations (one of which
was related to sexual harassment) were related to retaliation fears. In addition, several social
scientists have analyzed a hypothetical victim’s decision to report through laboratory experiments.
Through these experiments and hypothetical surveys, social scientists have empirically analyzed
what factors influence a victim’s decision to report harassment. For example, Perry et al. (1997)
presented 434 individuals with hypothetical scenarios and found that the personal power of the
victim and the organization’s previous reactions to harassment affected the respondent’s likelihood
of reporting harassment. Espinoza and Cunningham (2010) surveyed 183 individuals and found
10
that individuals who associate with more liberal ideologies and those who observed harassment
were more willing to report it. These results show that several characteristics of employees and
employers are likely to affect a victim’s decision to report, and that individuals are less likely to
report sexual harassment if they believe there is a high probability that they experience negative
consequences after reporting.
Literature on Sexual Harassment Consequences
In addition to examining what characteristics affect a victim’s response to sexual
harassment, social scientists have examined how sexual harassment affects the victim’s position
and performance in the workplace. As discussed above, the meta-analysis conducted by Chan et al.
(2008) found that sexual harassment in general leads to an increased likelihood of negative health
and productivity effects. Herbert (1994) also discussed the major economic consequences of sexual
harassment found in several studies. Herbert (1994) analyzed the 1980 MSPB survey and reported
that 36% of the respondents had negative thoughts about work following sexual harassment and
11% of the respondents had decreased work attendance following sexual harassment. Herbert
(1994) also reported that the 1979 Working Women’s Institute study found that 75% of the
respondents reported that following the harassment, they experienced distraction and loss of
motivation that interfered with the workplace. In addition, when noting that women who do not
report almost always have a reasonable fear of harassment, Herbert (2007) cited several studies
that found that women who reported harassment were labeled as troublemakers and that women
who took more assertive responses experienced negative job-related and health-related
consequences.4 In addition, Hersch (2011) found that employees who work in industries with high
rates of harassment actually received a compensating differential for working in such
4
The studies that Herbert (2007) cites include the 1995 Department of Defense sexual harassment study.
11
environments. This result suggests that the consequences of sexual harassment are so negative that
employees must be compensated to withstand its presence. This result also suggests that it might
be cheaper to incur these wage costs than to control harassment.
This literature review has provided insight into the probability that an individual
experiences sexual harassment, potential reasons for why victims do not report harassment, and
certain negative consequences of harassment in the workplace. However little is known about
additional consequences of harassment, including the employer’s reaction to workplace sexual
harassment. We also know little about the consequences of the response of a victim to harassment
and the relationship between certain characteristics of harassment and the likelihood of
experiencing an adverse employment action. In this chapter, I utilize the 1994 MSPB survey, the
most comprehensive sexual harassment dataset currently available, to analyze the employer’s
response to workplace sexual harassment by developing a conceptual framework that addresses
the employer’s response to harassment and the victim’s decision to report and by empirically
testing the predictions developed in this framework.
CONCEPTUAL FRAMEWORK
In this section, I lay out a conceptual framework, which will motivate the following
empirical model. This framework models the victim’s choice to report and the probability that the
victim experiences retaliation following that decision. Before an employee must decide to report
the harassment, an employee is harassed. While this framework does not model an employee’s
likelihood of being harassed, several characteristics have been shown to affect the likelihood that
an employee is harassed, including characteristics of the workplace and the employee. As
discussed above, studies that analyzed MSPB surveys found that women are more likely to be
harassed in male dominated workplaces (Newman et al. 2003; Druhan 2013). In addition, age, sex,
12
education level, and marital status each affect the likelihood that an individual experiences sexual
harassment (Newman et al. 2003). Scholars also found that sexual harassment training does not
influence sexual harassment in the workplace, but that it may affect perceptions of sexual
harassment (Newman et al. 2003; Antecol and Cobb-Clark 2003). Each of these characteristics
will influence whether an employee is harassed, but this initial stage of being harassed is not
formally modeled below.
Assume an employee is harassed. Following the harassment, the victim must decide how
to respond. While this decision could involve many choices and a combination of choices, the
victim will always have to decide whether to formally report the harassment. In this framework,
the employee’s decision is a dichotomous decision to report the harassment or to not report the
harassment. Throughout this framework, the following notation is followed: Capital letters indicate
components unique to the victim’s decision and lower case letters indicate components unique to
the employer’s decision. In addition, if a component is common to both parties, but slightly
different for each party, the number 1 indicates the victim’s component, and the number 2 indicates
the employer’s component.
Employee’s Response to Harassment
Let R denote the victim’s decision to report, and NR denote the victim’s decision to not
report. The victim will ultimately choose the option with the highest expected payoff (EPi for
i = NR, R). Each payoff will be comprised of costs and benefits. The victim will consider how this
decision changes her health (µi), which decreases with probability Q. The health of the victim
includes mental health, which can be affected by suffering a loss in reputation or the conscious
pressure to report. This model assumes that the employee will suffer a change in health in both
13
scenarios. As such, Q does not vary with whether the victim reports, but µi will be larger in one of
the scenarios and is thus indexed by i = NR, R.
The victim’s decision will also depend on and affect the costs associated with experiencing
a change in employment, and the victim’s total compensation for the job is denoted as X. A change
in employment occurs with probability Pi for i = NR, R. This model assumes the victim either
keeps or loses X in whole. As a result, X does not vary with the victim’s decision to report, but P
does. The final component of the victim’s decision is the expected payoff from litigation if the
victim decides to file a claim of harassment or discrimination against his or her employer. 5 The
expected payoff from litigation is made up of the following components: the expected damages
Φi, which is equivalent to the probability that the plaintiff prevails times the amount the judge or
jury awards.6 The victim views this expected damages with error, ε1. The total expected payoff is
comprised of Φi + ε1 minus the expected costs of the litigation, (C1), including attorney’s fees and
opportunity costs. The victim will choose to report the harassment only if the expected payoff from
reporting is greater than the expected payoff from not reporting.7
EPR > EPNR
-PR (X) - Q*(µR) + ΦR + ε1 – C1 > - PNR (X) – Q*(µNR) + ΦNR + ε1 – C1
5
Note that this model assumes that the victim always considers the expected payoff from litigation. In reality, a victim
of harassment may only consider the expected payoff of litigation if the victim is aware of sexual harassment law and
Equal Employment Opportunity Commission (“EEOC”) procedures. The victim will also only consider this payoff if
the victim is considering filing a lawsuit. As a result, the victim must be motivated to file a claim, which likely occurs
if the victim is fired and if the victim reports (as these are components that affect the expected payoff of litigation).
However, the victim does not have to report or be fired for litigation to occur or for the victim to consider the expected
payoff of litigation. For the charge to result in actual litigation, the charge must first proceed through the EEOC. For
the purposes of this model, settlement during the EEOC process is considered a litigation payoff that is also affected
by the same components that affect payoff from an actual trial.
6
Although not modeled here, this payoff could also include their desire to deter the employer from any future
harassment.
7
Note that this model assumes that the employee and employer are risk neutral.
14
Note that C does not vary whether or not the victim reports, nor does Q, X, or P. However,
each of the other factors are dependent on the victim’s decision. Though this model assumes that
the damages of the victim will not be affected by whether the victim reports, because the
probability that the victim prevails is affected by current liability standards, Φi certainly varies
with this decision. Even though the victim views Φi with error, the victim will know (if aware of
current legal standards) that almost always ΦR will be greater than ΦNR; the employer is almost
always more likely to be liable for sexual harassment in the workplace due to the current employer
liability standards. In fact, in many jurisdictions, the employer will have a strong affirmative
defense to liability if the victim does not timely report. Φi is also affected by several other
characteristics of the harassment, including the severity of the harassment. Because this component
also affects the employer’s response, how Φi changes based on the employer’s reaction is discussed
following the employer’s decision.
It is difficult to predict the size of µi in each scenario because it likely depends on a variety
of factors, including characteristics of the workplace, the harassment, and the victim. However, it
is assumed that the victim perfectly views the size of µi because these characteristics are known to
the victim. Because µR and µNR are known to the victim and ΦR will almost always be greater than
ΦNR, the only remaining comparison is PR and PNR. This probability is solely in the hands of the
employer; as a result, the victim will view it with uncertainty. However, several common and
known factors make it such that the victim can make a comparison by using backwards induction
to predict with uncertainty how the employer will act (what the size of PR and PNR will be).
Employer’s Response to Harassment
At the next stage of this framework, the employer will determine how to respond to the
harassment. It is important to note that it is not the case that the employer only learns of the
15
harassment if the victim reports the harassment. Instead, it is assumed that the employer will learn
about the harassment through a variety of measures, including from other employees. Because the
purpose of this model is to predict when the employer will act against the harasser, this model
assumes that the employer has two choices: fire the victim (fv) or fire the harasser (fh). The
employer, like the victim, will choose the option with the largest expected payoff. Each expected
payoff will be made up of the following factors, and if a component varies with the response, then
it is indexed by j = h, v.
Let rcj represent the cost of replacing the harasser or victim, which is a function of the
harasser’s or victim’s education (yk for k = h , v) and the supervisor status of the harasser or victim
(sk for k = h , v). If the employer fires the victim, the employer must pay all of rcfv(rv, sv) to replace
the victim. If the employer fires the harasser, then the employer must pay all of rcfh(yh, sh) to
replace the harasser. When determining how to respond, the employer will also consider the
expected costs of future harassment (αj*f). The costs of future harassment, f, occurs with
probability αj, which varies with each option. The costs of future harassment are a function of the
severity of the harassment (λ): f(λ). If the employer fires the harasser, then αv becomes zero, and as
a result, this component is only present if the employer fires the victim.
Much like the victim, the employer will also consider the expected costs of the litigation. The
expected costs of litigation are comprised of the probability that the victim sues the employer (qj),
the costs of the litigation C2, the expected damages awarded, Φj, which is equivalent to the
probability that the jury or judge awards the plaintiff damages times the amount awarded. The
employer also views Φj with error, ε2. qi and Φj both vary with the employer’s response. In addition,
Φj is a function of the victim’s decision to report (r), the severity of the harassment (λ), and the
supervisor status of the harasser (sh). Note that C2 is not dependent on any of these characteristics.
16
Ultimately, the employer will choose to fire the victim if the expected payoff is greater than the
expected payoff from firing the harasser:
epfv > epfh
-rcfv – qfv(Ce + Φfv + ε2) – αfv*f > -rcfh– qfh (C2 + Φfh + ε2 )
Where rcj can be written rcj(yk, sk), f can be written as f(λ), and Φj can be written as Φj(λ, r, sh).
Because the employer knows yk, sk, λ and r, the employer can make an educated decision, even
though the employer will view the expected costs of a lawsuit with error.
rc is increasing in both yk and sk. As a result, if the employee is a supervisor with a high
education, his replacement cost will be high. f is increasing in λ, meaning more severe harassment
costs more. In addition, due to current sexual harassment standards, Φj is increasing in λ, r, and sh.
If the harasser is the supervisor, then the vicarious liability standard developed in Faragher and
Ellerth apply, however, this higher standard will only apply if the victim reports the harassment.
If the harasser is a coworker, then the liability standards are lower, but the employer is still more
likely to be liable if the victim reports the harassment because the employer will be aware of the
harassment. In addition, if λ is high, the employer is more likely to be liable because the harassment
is likely actionable under Meritor Savings Bank v. Vinson.
The employer will also know how certain factors vary based on his decision to act. For
example, qfv will always be higher than qfg because the victim will have more motivation to sue his
employer if he has been fired, partly because his likelihood of prevailing at trial (Φi) is higher.
Knowing each of these relationships, the employer’s decision will be strongly motivated by rcfv
and rcfh. Because legal liability is always viewed with some uncertainty, ε2, if the employer is
certain that rcfv is high due to the high education (yh) and supervisor status of the harasser (sh), then
the employer will be more likely to act against the victim. On the other hand, if certain
17
characteristics of the harassment are present that make it more likely that the employer will be
liable for the harassment (increasing Φk and decreasing εk) including the harassment being severe
(λ high), the harasser being the supervisor (sh), and the victim reporting the harassment (r), then
the employer will be more likely to fire the harasser.8 Even though, sh increases both rcfh and Φk,
firing the victim results in an increases the probability that a victim files a claim because they want
to react ( - αfv*f). In addition, due to the employment standards that are dependent on an adverse
employment action occurring, firing the victim increases both qfg and Φk. As a result, the only
components that make it likely that rcfh outweighs those additional risks, is sh and yh. As a result,
if the harasser is a supervisor with high education, it is more likely than in any other scenario that
the employer will act against the victim (PR(E) is higher if the harasser is a supervisor with high
education).
Knowing that the employer will be less likely to act against her if she reports the
harassment, the victim should be more likely to report. However, this result also completely
depends on the victim being aware of the nuances of the law, which is likely a stronger assumption
that the employer being aware of the legal standards. As a result, especially if the victim was
harassed by the supervisor (making rcfh high and therefore increasing PR(E)), the victim may be
less likely to report due to fears that making the employer aware of the instance will increase the
likelihood of experiencing an adverse employment action.
While the current legal standards alter some of the basic theoretical predictions, the MSPB
survey analyzed in this chapter occurred in 1994, before Faragher and Ellerth, as a result, only
Meritor governed employer liability. As a result, the supervisor status of the harasser would only
affect rch, and not the likelihood that the employer is liable (Φk), and it should always be the case
8
This result completely depends on the employer being aware of these legal standards, which because the employer
may consult legal counsel before making that decision is not a very strong assumption.
18
that, all things constant, including the severity of the harassment and whether the victim reported
the harassment, the employer should be more likely to act against the victim if the harasser was a
supervisor. Because the liability standards were previously dependent on the victim reporting the
harassment, it should be the case that the victim should at least not be more likely to experience
retaliation if she reports, all things constant, however, this result heavily depends on knowledge of
the legal standards. In my empirical analysis, I seek to answer the following questions: (1) does
being harassed by a supervisor increase the likelihood that a victim experiences an adverse
employment action? (2) does reporting harassment increase the likelihood of experiencing an
adverse employment action? and (3) does reporting supervisor harassment have an additional
effect on experiencing an adverse employment action?
EMPIRICAL FRAMEWORK
Empirical Specification
The effects of certain harassment characteristics on the employer’s response can be
empirically tested by estimating the following reduced form equation:
(1) Adverse Action = β0 + β1Reported + β2Supervisor Harasser + X′βe + Yi′β4 + Z′β5 + ε
Adverse Action is a dichotomous variable equal to one if the victim experiences an adverse
employment action following the harassment. Reported is a dichotomous variable equal to one if
the victim reported the harassment, and Supervisor Harasser is a dichotomous variable equal to
one if the victim was harassed by his or her supervisor. X is a vector of harassment characteristics,
Y is a vector of the victim’s personal characteristics at the time of the harassment, and Z is a vector
of the characteristics of the victim’s workplace at the time of the harassment.
To estimate the effect of Reported on Adverse Action, it is likely necessary to estimate this
specification using several different models. This is likely necessary because the relationship
19
between each of the decisions of the conceptual framework can result in both endogeneity bias and
selection bias when empirically analyzing the employer’s response to the harassment. To correct
for these biases, I utilize instrumental variable models and selection models applying Heckman
correction. A discussion of these models, tests of the requirements of these models, and estimates
from these models follow in the results section.
Data
To estimate each of the specifications discussed above, I use the 1994 MSPB sexual
harassment survey. The 1994 MSPB sexual harassment survey is the most recent and most
comprehensive sexual harassment dataset available. The MSPB is a federal agency that Congress
created in 1978 to monitor prohibited employment practices in the federal workplace. As part of a
Congressional mandate, the agency issued sexual harassment surveys to investigate the prevalence
of sexual harassment in the workplace, the effectiveness of sexual harassment training, and the
agencies’ responses to sexual harassment in 1978, 1987, and 1994. I utilize the 1994 survey in this
analysis, as it is the most recent and comprehensive of the three. The 1978 study did not ask
detailed questions about an employer’s response to sexual harassment. The 1987 survey asked
respondents to report whether they had experiences a range of unwanted behavior, but not
specifically whether they had experienced sexual harassment. In the 1994 survey, the employees
actually answered whether they have experienced “sexual harassment.”
In 1994, the MSPB mailed surveys to thousands of federal employees to complete
anonymously. The response rate was 61%. Other harassment surveys, including a 1995
Department of Defense survey, had similar response rates (58%). This is a high response rates, but
in cause there are concerns that it is not, scholars have proposed that the response rate of most
surveys does not affect the validity of similar empirical results (Holbrook et al. 2007). The final
20
1994 MSPB dataset contains 8,081 observations, 4,259 females and 3,560 males. Of these
respondents, 48% of the females and 24.5% of the males had experienced some form of workplace
sexual harassment in the previous two years. This statistic is similar to the percent of respondents
that responded that they have experienced some form of workplace sexual harassment in the 1978
and 1987 responses, and scholars who have studied the surveys report that sexual harassment rates
did not change over this time period (Newman et al. 2003; Antecol 2004).
Each of the variables included in Equation (1) are constructed from the respondent’s
answers to the 1994 MSPB survey questions. Most importantly, the respondent reports whether
she experienced sexual harassment in the past two years and describes her most prominent
harassment experience during that time frame.9 Specifically, after being directed to skip
18 questions if the respondent has not received any uninvited and unwanted sexual attention, the
respondent answers the following question: “During any particular experience, a person may
receive more than one kind of unwanted sexual attention. During the experience you selected to
describe here, which of the following happened to you? Mark all that apply.” In this section, I
provide a description of the variables created from the 18 sexual harassment questions that follow
this question. In the following paragraph, I describe the specific variables used in Equation (1).
The names of these variables that I include in Equation (1) are listed in parentheses. The variables
are also defined in Table 1.
The dataset includes how the victim responded to the harassment (Reported Within, Formal
Action, Reported Outside). If the victim responds in either of these ways, then the victim is coded
as having reported the harassment (Reported). Reported is an explanatory variable in Equation (1).
The dataset also includes how the employer reacted to the harassment (Work Worse, Denied
9
While men and women responded to this survey, I use female pronouns for simplicity.
21
Promotion, Reassigned, and Fired). If the employer takes any of these actions, then the victim is
coded as having experienced an adverse employment action (Adverse Action). Adverse Action is
the dependent variable in Equation (1).
The respondent also describes the action that occurred during the most prominent
harassment experience, and these harassment variables are independent variables found in H in
Equation (1): attempted or actual sexual assault (Assault), pressure for sexual favors (Favors),
pressure for dates (Dates), sexual comments or teasing (Teasing), sexual looks or gestures (Looks),
unwanted touching (Touching), or stalking (Stalking). Importantly, the respondent also reports the
characteristics of the harasser or harassers, including whether there were multiple harassers
(Multiple Harassers), the sex of the harassers (Male Harasser, Female Harasser, Harassers Both
Sexes), and whether the harasser was the victim’s supervisor (Supervisor Harasser). The
respondent also answers questions addressing the intensity of the harassment: whether the duration
of the harassment was greater than three months (Dur >3 months) and whether the frequency of
the harassment was greater than one month (Freq > 1 a month). Each of the variables described in
this paragraph make up H in Equation (1).
If the respondent was harassed, she provides personal demographics corresponding to the
time she was harassed. These demographics are controlled in X: marital status (Single, Married,
Divorced/Widowed), employment type (Management/Professional, Clerical/Blue Collar,
Trainee/Other Job), pay grade level collapsed into four levels (Pay Grades1-4, 5-10, 11-15, SES
(Senior Executive Service)), education level (Less than College Degree, College Degree, Grad
Degree), age (16-24, 25-34, 35-44, Over 45), and supervisor status (Supervisor). The respondent
also reports workplace demographics at the time of the harassment, which make up Z in
Equation (1), including the sex of her supervisor (Male Supervisor, Female Supervisor) and
22
whether the agency that the respondent was employed by has sexual harassment training
(Training). If the respondent was not harassed, she reports these demographics based on her
current employment.
Summary Statistics
This section and the tables discussed in it report descriptive statistics of the sample of
MSPB respondents analyzed in Equation (1). Each of the summary statistics presented in this
section and the mentioned tables has been weighted with a sample weight provided by the MSPB
to correct for the oversampling of females, certain pay grades, and certain agencies. Table 2 reports
summary statistics on retaliation that are limited to victims who experienced harassment. These
statistics show what response an employer chose to take against the male and female victims
following the prominent harassment experience. Again, Adverse Action is a variable that is equal
to one if the employee was denied a promotion, received work worse assignments, was reassigned,
or was fired.10 12.9% of the female victims and 10.6% of the male victims experienced an adverse
action following the harassment.11
The conceptual framework developed in this chapter predicted that both the demographic
variables and the variables describing the harassment could influence the employer’s response to
the harassment. Tables 3a and 3b illustrate the hypothesized relationships by showing that the
average number of victims that reported certain characteristics is substantially and statistically
10
Although not every court agreed with the definition of adverse employment action in 1994, each of these actions
are considered “adverse employment actions” in current EEOC Guidance developed in 1998 and under the 2006 case,
Burlington Northern & Santa Fe Railway Co. In addition, alternative definitions of Adverse Action and many other
variables does not change the results reported below. Certain definitions that were changed include excluding
terminated from adverse employment action, excluding “work became worse” from adverse employment action, and
including additional agencies.
11
It is difficult to get fired from the federal government (Cauchon 2011), and in fact, only 0.3% of the male victims
and 0.3% of the female victims were fired following the harassment. While these employees may in fact be outliers,
these observations are included in Adverse Action because being fired following harassment is an even more severe
reaction. However, excluding these observations does not change the results.
23
higher for victims who experienced an adverse employment action as compared to all of the
victims. Table 3a reports summary statistics that illustrate this relationship for female victims, and
Table 3b reports the male victim summary statistics. Column 1 of these tables reports the
percentage of the total MSPB sample with these characteristics, and Column 2 reports the
percentage of the sample of respondents that was harassed with that characteristic. Columns 3 and
4 further breakdown these statistics by reporting the percentage for the respondents that did not
experience an adverse action and those that did experience an adverse action, respectively. Finally,
Column 5 reports the difference between the statistics reported in Columns 3 and 4. The statistical
significance of this difference is also indicated.12
Tables 4a and 4b continue this comparison. However, the statistics presented in these tables
are limited to the sample of respondents who were harassed, as the characteristics described in this
table only apply to the respondents who were harassed. Column 1 reports the statistic for the total
sample of victims, Column 2 is limited to the victims that did not experience an adverse action,
and Column 3 is limited to the victims that did experience an adverse action. Column 4 reports
results of a t-test, testing the equivalence of the summary statistics reported in Columns 3 and 4,
as was conducted in Tables 3a and 3b.
Many of these statistics are interesting and statistically significant. However, I will focus
on the statistics and t-test results that illustrate the predictions of the conceptual framework. For
example, the theoretical model predicted that victims with higher education and pay grades would
be less likely to experience an adverse action because of their higher replacement cost. As reported
in Table 3a, a larger percentage of the female victims who did not experience an adverse action
were supervisors as compared to the percentage of female victims who did experience an adverse
12
Note that these differences are slightly off due to rounding.
24
action, and this difference of 4.8 percentage points is statistically significant. In addition, a larger
percentage of the female victims who did experience an adverse action (15.6% to 7.1%) was in the
lowest pay grade, Pay Grade 1-4. As for the male sample, the percentage of victims who
experienced an adverse action with a graduate degree is 17.6 percentage points less than the
percentage of victims who did not experience an adverse action. In addition, the percentage of
victims in the professional or management occupation that experienced an adverse action is 23.9
percentage points less. Both of these differences are statistically significant.
More specifically, the above-described conceptual framework and the current legal system
predict that the supervisor status of the harasser and the victim’s response to the harassment likely
influence the employer’s response. This relationship can be seen in the summary statistics. For
example, as illustrated in Table 4a, 68.6% of the female victims who experienced an adverse
employment action were harassed by their supervisor, as compared to 23.7% of the sample of
victims that did not experience an adverse action. The difference between these groups is 44.8
percentage points, which is statistically significant at the one percent level. Comparatively, the
difference for individuals harassed by their coworker is an insignificant difference of 2.9
percentage points. In addition, 46.6% of the female victims who experiences an adverse
employment action reported the harassment by either reporting the harassment within the
workplace or filing a formal harassment action. Only 17.1% of the sample of victims that did not
experience an adverse action reported the harassment. This difference is also statistically
significant at the ten percent level.
As illustrated in Table 4b, the male statistics illustrate similar relationships. 53.1% of the
male victims who experienced an adverse employment action were harassed by their supervisor,
but only 9.7% of the male victims that did not experience an adverse action were harassed by their
25
supervisor. This difference of 43.5 percentage points is statistically significant at the one percent
level. In addition, 36.4% of the male victims who experienced an adverse employment action
reported the harassment, but only 11.3% of the male victims that did not experience an adverse
action reported the harassment. This difference is also significant at the five percent level.13
To determine the causal relationship between an employer’s response to harassment and
the characteristics of the harassment, including the supervisor status of the harasser and the
victim’s response, it is necessary to isolate the relationships through the equation discussed in the
beginning of this section. The details of these empirical specifications and the empirical results
from the estimations are presented below.
Regression Results
I estimated Equation (1) using ordinary least squares (OLS) regressions separately for
males and females, and the results are reported in Table 5.14 I estimated the equation separately for
males and females because the results of a Chow test indicated that there were structural
differences between the coefficients for the two samples.15 Column 1 of Table 5 reports the
13
The fact that only 36.4% of the male victims and 46.6% of the female victims who experienced adverse employment
actions reported the harassment shows that it is not the case that an employer can only adversely act against the victim
if the victim reports. One may wonder how an employer could respond to the harassment if they are not aware of it.
However, there are many ways that the employer can become aware of the harassment without the victim reporting it.
For example, a coworker could notify the employer, the experience could change the victim’s work performance, or
the employer could have witnessed it. In addition, if the harasser is the supervisor, then the supervisor may be the one
responsible for the employment decision. This is in fact a reason why it is likely that being harassed by your supervisor
increases the likelihood that you experience an adverse action, and why the law is tailored to address that relationship.
14
While some may argue that probit is preferred to OLS because, as a nonlinear model, it limits the predicted values
to values between 0 and 1 (Lynch 2007), it is accepted that OLS provides consistent marginal effects (Angrist and
Pischke 2008). In addition, I report robust standard errors, which lessens concerns about heteroskedaticity. As
expected, marginal effects from probit regressions are very similar in size, magnitude, and direction. OLS is also the
preferable estimation, because due to the small sample, I cannot compute selection corrections for the male sample
nonlinearly.
15
Though a Chow test suggests that the specifications be run separately for men and women, when I pool the
regressions, the direction and significance of the coefficients on the variables of interest (Reported and Supervisor)
are very similar.
26
estimates for the female sample, and Column 2 reports the estimates for the male sample. The
specifications also include indicator variables for missing values.16
The empirical results confirm many of the relationships illustrated by the summary
statistics, follow many of the predictions from the conceptual framework, and support potential
changes in how the law addresses employer liability for sexual harassment. The conceptual
framework predicted that conditional on being harassed, a victim with lower education and with a
role with less responsibility will be more likely to experience an adverse employment action
because of the lower replacement cost. In fact, the empirical results confirm that prediction for
female victims: female victims of pay grades lower than Senior Executive Service (“SES”) are
statistically significantly more likely than their SES counterparts to experience an adverse action,
perhaps because of their lower value to the company. Females in Pay Grade 1-4, 5-10, and 11-15
are statistically significantly more likely to experience an adverse action than their SES
counterpart, as are all other pay grades. Also, females in clerical or management positions are
statistically significantly less likely than their counterparts in training occupations to experience
adverse action.
The conceptual framework also predicted that because of the possibility that severe
harassment would greatly decrease the productivity of the victim, an employer may be more likely
to act against a victim if the harassment was severe. However, this prediction was muddled by
alternative predictions such as the fact that this harassment is more likely to occur again and that
an employer is more likely to be liable for such harassment. The empirical results also do not
16
These indicators are included to increase the number of observations analyzed, which is a standard process. If a
variable was missing from an observation, I coded the variable as equal to zero, but then included indicator variables
for the missing variables. However, when the indicators are excluded and the missing variables are omitted from the
sample, the size, magnitude, and significance of the results remains the same, though the number of observations
decreases.
27
suggest a clear relationship between severe harassment and experiencing an adverse action. For
example, the more frequent the harassment for female victims, the more likely a victim is to
experience an adverse employment action. Female victims who experience harassment that
occurred more than once a month are 7 percentage points more likely to experience an adverse
action. However, this result is not present for males. In addition, the duration of the harassment
does not statistically significantly affect the probability that a victim experiences an adverse
action.17 The fact that these variables do not have a statistically significant impact confirms the
inability to predict how the severity of the harassment would affect a victim’s outcome.
The strongest prediction of the conceptual framework was that without a legal framework
tailored according to the supervisor status of the harasser, a victim who is harassed by their
supervisor is more likely to experience an adverse employment action because the supervisor has
a higher replacement cost, making the supervisor more valuable to the company. The percentage
of victims harassed by their supervisor was higher for individuals who experienced an adverse
employment action. The empirical results further support this prediction, showing that victims who
were harassed by their supervisor as compared to their coworker are statistically significantly more
likely to experience an adverse employment action. Female victims who were harassed by their
supervisor are 18.3 percentage points more likely to experience an adverse action and male victims
harassed by their supervisor are 32.7 percentage points more likely. These results are statistically
significant at the one percent level. These estimates indicate that the probability of experiencing
adverse employment actions following harassment increases from 12.93% to 30.93% for females
17
A few types of harassment statistically affect the likelihood that a victim experiences an adverse action. For example,
if a female victim experiences teasing or receives calls or letters she is actually more likely to experience an adverse
action. Alternatively, if a male employee experiences touching or is asked on a date, then he is less likely to experience
an adverse action. Perhaps these results support the hypothesis that an employer is more likely to act against a
supervisor who acts with severe harassment.
28
who are harassed by their supervisor and from 10.62% to 43.32% for males who are harassed by
their supervisor.
The model also predicted that victims who report the harassment should not be more likely
to experience an adverse employment action because the employer would be more likely to be
liable for the harassment. Despite this prediction, the empirical results show that victims who
report harassment are more likely to experience an adverse action. Female victims who reported
the harassment are 10.0 percentage points more likely to experience an adverse employment action
compared to those that did not report the harassment. Male victims who reported the harassment
increased their likelihood of experiencing an adverse action by 12.7 percentage points. These
results are significant at the one percent level for females and ten percent level for males. These
estimates indicate that the probability of experiencing adverse employment actions following
harassment increases from 12.93% to 22.93% for females who report the harassment and from
10.62% to 22.82% for males who report the harassment.
It is possible that reporting the harassment only has a statistically significant effect if
victims reported the harassment of their supervisor, because of the strong role of the supervisor in
employment decisions and because of the supervisor’s high replacement cost. To explore whether
the statistically significant coefficient on Reported is driven by victims who were harassed by their
supervisor and reported the harassment, alternate specifications include a variable that interacts
the two variables (Reported*Supervisor).18 The results from OLS estimations of these
specifications are presented in Table 6. Column 1 reports the results for the female specifications,
and Column 2 reports the results for the male specifications. The results confirm that for the female
18
Additional interaction terms were included in alternative specifications to explore whether other results were
influence by reporting harassment or by being harassed by a supervisor, however, none of the coefficients on these
interactions was statistically significant.
29
sample, the Reported result was driven by victims who report supervisor harassment: the
coefficient on Reported is no longer significant, but the coefficient on Reported*Supervisor is a
statistically significant 25.7 percentage points. Note that the results show that the Supervisor result
is not driven by those who report harassment, as the coefficient on Supervisor also remains
significant, meaning that the Supervisor result is not limited to those who report the harassment.
The significance of Reported for the male specifications was also affected by the inclusion of this
interaction term. The coefficient on Reported*Supervisor is not statistically significant, and the
coefficient Supervisor is identical to that of the original specification, the coefficient on reported
is no longer significant. These estimates confirm the strong prediction that all things constant,
being harassed by a supervisor increases the likelihood of a harassment victim experiencing an
adverse employment action. However, as indicated in the theoretical framework, victims likely
anticipate possible adverse actions in response to reporting, which means that the effect of
reporting on adverse outcomes may be conflated due to endogeneity. In the next section I examine
this possibility.
Instrumental Variable Model and Results
When determining whether to report the harassment, the victim uses backwards induction
to predict how the employer will respond to the harassment before the victim chooses whether to
report the harassment. As a result, estimates of the coefficients on each variable in Equation (1)
may be biased due to the endogeneity of Reported and Adverse Action. It is likely that a victim
will be less likely to report the harassment if the victim anticipates that the employer is more likely
to respond adversely to the harassment, which would bias the coefficient on Reported
downwards.19 Though I am less concerned about endogeneity because the choice is made before
19
Results from the hypothetical experiments such as Perry et al. (1997) support this likely relationship.
30
the adverse action occurs, I took several measures to test for and correct for the bias and test for
the presence of the bias. To reduce the presence of this bias, I used an instrumental variable model,
which estimates the following equation as the first stage of a two-stage least squares
model (“2SLS”).
(2) Reportedi = β0 + β1Vi + β2Supervisor Harasseri + Xi′β5 + Yi′β4 + Zi′β5 + ε
V is an instrumental variable for Reported. This variable must be correlated with the
endogenous variable, Reported, and as a result, the coefficient on V must be statistically significant
in this first stage estimation. However, the instrument must also meet the exclusion restriction for
instrumental variables: V cannot affect the likelihood that a victim experiences an adverse
employment action following the harassment. The remaining independent variables are defined in
Equation (1). The 2SLS model uses the estimates for the endogenous variable (Reported) from
Equation (2) as the covariates when estimating Equation (1).
The first step in this process is to find a valid instrument. The instrument I use is whether
the victim believed that sexual harassment in the workplace is an attempt by one person to exercise
power over another (Harassment Power). Before answering the harassment questions, the
respondent also provides several opinions on sexual harassment. For example, the respondent
answers whether she strongly agrees that sexual harassment in the workplace is an attempt by one
person to exercise power over another. Harassment Power is a dichotomous variable equal to one
if the victim agrees strongly agreed with that statement. This instrument met the first-stage
requirement in both the specifications analyzing the male and female samples. The first stage
requirement is that the instrumental variable be correlated with the potentially endogenous variable
(whether the victim reported the harassment, Report). Harassment Power had a statistically
31
significant positive effect on whether a victim chose to report the harassment. The first stage results
for the specifications that analyze the female specifications are reported in Column 2 of Table 7.20
It is possible that this instrument does not satisfy the exclusion restriction of a 2SLS model,
which requires that the instrument not be correlated with the error term in the original specification.
Perhaps individuals who believes that harassment is an attempt by one person to exercise power
over another are more likely to be the target of an adverse employment action. However, the
employer would have to be aware of this belief, through the victim’s actions, for this consideration
to affect the analysis. Believing that this instrument likely valid, I used two-stage least squares
(2SLS) specifications, to correct for the endogeneity bias likely present in the OLS specifications.
The results from the 2SLS model are reported in Column 1 of Table 7. Note that with the exception
of Reported, the potentially endogenous variable, the coefficients are quite similar to the OLS
coefficients reported in Column 1 of Table 5. The F-statistic on the excluded instruments in the
first stage with the Harassment Power instrument was 5.07.
One would expect the coefficient on Reported to be larger than the coefficient in the
original specification because it was predicted that victims who are more likely to experience
harassment would not report the harassment, thus the endogeneity should bias the coefficient
downwards. The coefficient on Reported in the 2SLS specifications is larger than the coefficient
reported in Table 5. This increase and the fact that the coefficient is very close to significant at the
ten percent level (but for the large increase in standard errors) suggests that this estimation strategy
may have corrected for the predicted bias.
Assuming that this instrument was valid, I also investigated whether the specifications were
actually likely to suffer from endogeneity bias using Durbin-Wu-Hausman tests for endogeneity.
20
I do not report the results for the specifications that analyze the male samples because the instrument is too weak to
justify using 2SLS at all.
32
The p-value from this test is reported in Table 7. The null hypothesis in a Durbin-Wu-Hausman
test is that the estimates of the same equation without 2SLS corrections would yield consistent
results. The Durbin-Wu-Hausman tests resulted in a large p-value, suggesting that Reported is not
endogenous, and as a result, suggesting that the 2SLS specifications are not necessary and that the
estimates of Equation (1) reported in Table 5 remain valid.
Selection Model and Results
The conceptual framework also predicted that because an individual must first be harassed
before an employer can respond to the harassment, estimates of Equation (1) may suffer from
selection bias. To be more specific, because each empirical specification is limited to individuals
who responded to the MSPB survey saying that they have been sexually harassed in the workplace
during the past two years, the specifications may suffer from selection bias. It may be the case that
individuals who did not formally report the harassment and did experience an adverse employment
action after the harassment are less likely to answer the question positively on the survey. Under
that scenario, those individuals would be missing from the specification, which would bias the
coefficient on Reported upwards. Other scenarios could bias the specification downwards. For
example, individuals who do not report the harassment may wish to finally come clean and may
be more likely to answer the question positively on the survey.
To correct for the potential selection bias in the estimation of Equation (1), I estimated
Heckman selection models. In this first stage, Harassed (an indicator for whether the employee
was harassed in the past two years and therefore included in the sample used to estimate Equation
(1)) is regressed upon variables that are likely to affect the probability that an employee is harassed.
These models analyze the entire 1994 MSPB sample, as the model is not conditioned on being
harassed. The first-stage equation, Equation (3), follows:
33
(3) Harassedi = β0 + Wa′β1 + Xi′β2 + Yi′β3 + Za′β4 + ε
The source of variation in the Heckman selection model is found in the vector W. The
variables in this vector should predict the likelihood that an employee is harassed, 21 but not the
likelihood that a victim experiences an adverse employment action. The remaining independent
variables are defined following the presentation of Equation (1). The Heckman selection model
uses predicted values from Equation (3) to incorporate an additional independent variable, the
inverse Mill’s ratio, in Equation (1).
The first-stage equation includes indicator variables for the sex of the workplace (More
Women, Equal Men/Women) as the identification (W), because the sex of the workplace
significantly affects the employee’s likelihood of being harassed, but not a victim’s likelihood of
experiencing an adverse employment action. The coefficients on these variables were not
significant when included in the main empirical specification, suggesting that the integration of
the workplace does not affect a victim’s likelihood of experiencing an adverse action.
The Heckman results for both the male and female specifications are reported in Table 8.
The large p-values on the Wald statistics suggest that I cannot reject the null hypothesis that the
equations are independent at the ten percent level for the specifications that analyze the male
sample, suggesting that selection is not a problem. Although the p-value on the Wald statistic for
the female sample suggests that I can reject the null hypothesis at the ten percent level, I cannot
reject the null hypothesis at the five percent level. In addition, the fact that the coefficients are
similar to the OLS coefficients is evidence that selection bias is not a concern for the female and
male specifications. As a result, the OLS estimates reported in Table 5 are likely valid.
21
The results presented in Druhan (2013) and Newman et al. (2003) suggest that the sex integration of the workplace
could be a potential instrumental variable.
34
LEGAL IMPLICATIONS
The main empirical results of this chapter showed that victims who were harassed by their
supervisor and victims who report the harassment, especially those who report supervisor
harassment, were statistically significantly more likely to experience an adverse employment
action. These results have implications that can inform how the legal system currently addresses
an employer’s liability for sexual harassment in the workplace and how those legal standards could
be altered to address these severe consequences of sexual harassment. Currently, under Ellerth and
Faragher, if an employee is harassed by his or her supervisor and experiences an adverse
employment action, then the employer will be vicariously liable for the harassment.22 However, if
no tangible employment action occurred and the employer had procedures in place to prevent the
harassment and the employee did not reasonably take advantage of those procedures, then the
employer will not be liable because of the affirmative defense. If an employer is harassed by a
coworker, the defense also applies because the employer is only liable if the employer was aware
of the harassment and did not have preventative measures in place.
The empirical results support the higher standard for supervisor harassment adopted in
Faragher and Ellerth because victims are much more likely to experience an adverse employment
action after harassment if they are harassed by their supervisor. In fact, the Supreme Court
established the higher standard for supervisor harassment in Faragher and Ellerth for a very
similar theoretical reason:
The agency relationship affords contact with an employee subjected to a
supervisor’s sexual harassment, and the victim may well be reluctant to accept the
risks of blowing the whistle on a superior. When a person with supervisory
authority discriminates in the terms and conditions of subordinates’ employment,
22
Of course, the victim must also establish that the unwanted conduct was sexual harassment, by meeting the standards
of Meritor v. Savings Bank: unwanted sexual conduct that is so severe or pervasive it alters an employee’s workplace
conditions.
35
his actions necessarily draw upon his superior position over the people who report
to him, or those under them, whereas an employee generally cannot check a
supervisor’s abusive conduct the same way that she might deal with abuse from a
co-worker. When a fellow employee harasses, the victim can walk away or tell the
offender where to go, but it may be difficult to offer such responses to a supervisor,
whose “power to supervise–[which may be] to hire and fire, and to set work
schedules and pay rates–does not disappear . . . when he chooses to harass through
insults and offensive gestures rather than directly with threats of firing or promises
of promotion.”23
While this quote shows that the Supreme Court acknowledged the supervisor’s power, which could
result in an increase in adverse employment actions, the Court suggested that they did not
acknowledge that power with the creation of the affirmative defense created in Ellerth and
Faragher. My empirical results call into question the employer’s affirmative defense if the victim
is not reasonable in responding to the harassment, the expansion of the defense to a one prong
defense when the harassment is severe, and the Supreme Court’s narrowing of the definition of
supervisor in Vance.
Because it is beneficial for courts to encourage employees to report harassment, I do not
advocate that this affirmative defense be abolished. However, the fact that reporting the harassment
substantially increases the likelihood of experiencing an adverse employment action (particularly
if the harasser is the supervisor) calls into question several lower court interpretations of the Ellerth
and Faragher defense. Certain lower courts have elevated the plaintiff’s responsibility to
reasonably respond to the harassment, such that an employee who was reasonable (given that these
results show that they have a reasonable fear of retaliation when reporting) will be left without
recourse. Several legal scholars have recognized the courts’ tendencies to overlook the reasonable
fear of retaliation (White 2006; Herbert 2007). These scholars were concerned that many courts
overlooked the employees’ reasonable fears of retaliation that prevented them from reporting the
23
This quote is from Faragher v. City of Boca Raton, 524 U.S. 775, 802 (1998).
36
harassment and in turn allowed the employer to have an affirmative defense. My empirical results
substantiate this literature by empirically showing that reporting harassment substantially increases
the likelihood of experiencing an adverse employment action. This result is even stronger when
female victims reported supervisor harassment. These results suggest that victims of harassment
have a reasonable fear that the harassment will result in an adverse action if they report it. As a
result, while it is beneficial to encourage reporting24, the reasonability requirement should not be
interpreted in such a strict manner.
The strength of the relationship between being harassed by a supervisor as opposed to a
coworker and experiencing an adverse employment action also calls into question the expansion
of the Faragher and Ellerth defense when the harassment is a one-time event. Federal courts of
appeals that only require the employer to meet the first prong of the defense when the harassment
is not pervasive substantially broaden the defense, by only requiring employers to take
preventative measures. This substantially lowers the probability that an employer will be liable for
supervisor harassment, making it likely that the Faragher and Ellerth standard will not decrease
the relationship between supervisor harassment and adverse employment actions.
The Supreme Court enforced an additional interpretation that has strengthened the
supervisor harassment liability standard in favor of the employer in the 2013 decision, Vance v.
Ball State University. In Vance, the Supreme Court narrowly interpreted supervisor as one who is
empowered to make employment decisions against the victim. It is likely that the MSPB
respondents considered individuals their “supervisor” when they did not have the ability to fire
The EEOC describes this incentive as: “The Supreme Court’s rulings in Ellerth and Faragher create an incentive
for employers to implement and enforce strong policies prohibiting harassment and effective complaint procedures.
The rulings also create an incentive for employees to alert management about harassment before it becomes severe
and pervasive. If employers and employees undertake these steps, unlawful harassment can often be prevented, thereby
effectuating an important goal of the anti-discrimination statutes.” Hook (2008) actually suggests that the Ellerth and
Faragher affirmative defense should also be adopted in Title VII retaliation claims so that employers also have an
incentive to prevent retaliatory action towards employees that report Title VII violations.
24
37
them. Unfortunately, the MSPB survey respondents do not provide information concerning who
acted against them or had the power to act against them. However, the strength of the relationship
between being harassed by a supervisor and experiencing an adverse employment action (which
is not contingent on reporting the harassment) does not support a strict definition of supervisor.25
One potential solution based on this empirical result is to make the affirmative defense for
supervisor harassment unavailable in most circumstances. Bankers (2014) suggested that
Faragher and Ellerth established that the affirmative defense is unavailable when the harasser is
a proxy for the employer and suggested that an employee is a proxy when they have the ability to
impute the intent of the employer. Perhaps corporate intent can be seen by the increase in the
likelihood of experiencing an adverse employment action when an individual is harassed by his or
her supervisor as compared to a coworker. Ultimately, the empirical results of this chapter suggest
that while the elevated standard for supervisor harassment created by the Court in Faragher and
Ellerth is justified, the Faragher and Ellerth affirmative defense should be limited. After all,
scholars have even noted that it is currently “easy as pie” for employers to meet the defense in
most courts (Bhatheja and Jackson 2014).
I am aware that the court does not always look to empirical evidence to establish standards,
but instead relies on legal theories, such as agency law, the empirical results presented in this study
could have significant legal implications. Because sexual harassment law is a continually
developing area of the law, and sexual harassment has such a prominent and negative effect on the
25
It is possible that because the data analyzed in this chapter was collected before the Supreme Court created this
standard in Faragher and Ellerth, the relationship between supervisor harassment and the reporting of harassment
adverse employment actions may have decreased because of this heightened standard if both are met. If this is the
case, then one would be less concerned about these heightened standards. Unfortunately, data limitations make it
impossible to answer this very interesting question. In addition, it is likely that employees still fear retaliation as a
result of reporting, as a recent 2013 harassment survey found that only 30% of victims reported the harassment
(Berman and Swanson 2013).
38
workplace, perhaps the courts and Congress could turn to such evidence for support when
reversing the expansion of the Faragher and Ellerth affirmative defense.
CONCLUSION
It has been documented that victims of sexual harassment do not report the harassment. A
likely reason for the underreporting is the victims’ fear of experiencing adverse employment
actions. Unfortunately, this study confirms this fear—sexual harassment victims are statistically
significantly more likely to experience an adverse employment action if they report the
harassment, especially when the harasser is the victim’s supervisor. In addition, even if they do
not report the harassment, sexual harassment victims are statistically significantly more likely to
experience an adverse employment action when they are harassed by their supervisor.
The consequences of sexual harassment in the workplace are severe, and the consequences
are even greater when an adverse employment action occurs. While the law has protections in
place to reduce the likelihood of workplace harassment and the likelihood of experiencing an
adverse employment actions, including the discrimination and anti-retaliation provisions of Title
VII, certain standards could be tailored to address the prevalence of adverse employment actions
in the workplace with support from the empirical results of this study. For example, federal courts
should avoid narrowing employer liability under the Faragher and Ellerth standard by narrowly
defining important terms, such as supervisor, and broadening the affirmative defense. The
likelihood of employer liability for harassment and retaliation must be raised to lessen the
prevalence of workplace harassment and corresponding adverse employment actions, and to
encourage victims to report.
39
REFERENCES
Alexander, Charlotte S. and Arthi Prasad. 2014. “Bottom-up Workplace Law Enforcement: An
Empirical Analysis.” Indiana Law Journal 89(3): 1069–1131.
Angrist, Joshua D. and Jorn-Stedden Pischke. 2008. MOSTLY HARMLESS ECONOMETRICS: AN
EMPIRICIST’S COMPANION. Princeton University Press.
Antecol, Heather and Deborah Cobb-Clark. 2003. “Does Sexual Harassment Training Change
Attitudes? A View from the Federal Level.” Social Science Quarterly 84(4): 826–842.
Antecol, Heather. 2004. “The Changing Nature of Employment-Related Sexual Harassment:
Evidence from the U.S. Federal Government, 1978-1994.” Industrial and Labor Relations
Review 57(3): 443–461.
Bankers, Curtis J. 2014. “Identifying Employer’s ‘Proxies’ in Sexual Harassment Litigation.” Iowa
Law Review 99(4): 1785–1815.
Berman, Jillian and Emily Swanson. 2013. “Workplace Harassment Poll Finds Large Share of
Workers
Suffer,
Don’t
Report.”
The
Huffington
Post,
available
at
http://www.huffingtonpost.com/2013/08/27/workplace-sexualharassmentpoll_n_3823671.html.
Bhatheja, Kunal and Blair Thomas Jackson. 2014. “Easy as P.I.E.: Avoiding and Preventing
Vicarious Liability for Sexual Harassment by Supervisors.” Drake Law Review 62(3): 653–
688.
Burlington Industries, Inc. v. Ellerth, 524 U.S. 472 (1998).
Cauchon, Dennis. 2011. “Some Federal Workers More Likely to Die than Lose Jobs.” USA
Today, available at http://usatoday30.usatoday.com/news/washington/2011-07-18-fderal-jobsecurity_n.htm.
Chan, Darius K.-S., Chun Bun Lam, Suk Yee Chow, and Shu Fai Cheung. 2008. “Examining the
Job-related, Psychological, and Physical Outcomes of Workplace Sexual Harassment: A
Meta-analytic Review.” Psychology of Women Quarterly 32(4): 362–376.
Department of Defense, “Department of Defense 1995 Sexual Harassment Study,” available at
http:// www.defenselink.mil/news/ fact_sheets/ sxhas95.html.
Druhan, V. Blair. 2013. “Severe or Pervasive: An Analysis of Who, What, and Where Matters
When Determining Sexual Harassment.” Vanderbilt Law Review 66(1): 355–397.
40
Equal Employment Opportunity Commission. “Enforcement Guidelines on Vicarious Liability
for Unlawful Harassment by Supervisors,” available at http://www.eeoc.gov/ policy/docs/
harassment.html, updated April 6, 2010.
Equal Employment Opportunity Commission. 1998. “EEOC Compliance Manual on
Retaliation,” available at http://www.eeoc.gov/policy/docs/retal.html.
Faragher v. City of Boca Raton, 524 U.S. 775 (1998).
Gettman, Hilary J. and Michele J. Gelfand. 2007. “When the Customer Shouldn’t Be King:
Antecedents and Consequences of Sexual Harassment by Clients and Customers.” Journal of
Applied Psychology, 92(3): 757–770.
Herbert, L. Camille. 1994. “The Economic Implications of Sexual Harassment for Women.”
Kansas Journal of Law & Public Policy 3-SPRG(3): 41–56.
______. 2007. “Why Don’t ‘Reasonable Women’ Complain about Sexual Harassment?” Indiana
Law Review 82(3): 711–743.
Hersch, Joni. 2011. “Compensating Differentials for Sexual Harassment.” American Economic
Review Chapters and Proceedings 101(2): 630–634.
Holbrook, Allyson L., Jon A. Krosnick, and Alison Pfent. 2007. “The Causes and Consequences
of Response Rates in Surveys By the News Media and Government Contractor Survey
Research Firms.” In Advances in TELEPHONE SURVEY METHODOLOGY, ed. James M.
Lepkowski, N. Clyde Tucker, J. Michael Brick, Edith D. De Leeuw, Lilli Japec, Paul J.
Lavrakas, Michael W. Link, and Roberta L. Sangster. New York: Wiley.
Hook, Thomas J. 2008. “Defining Employer Liability in Sexual Harassment and Title VII
Retaliation Claims: The Supreme Court Creates the Same Problem Twice.” Suffolk University
Journal of Trial & Appellate Advocacy 13(1): 121–137.
Jackson, Robert A. and Meredith A. Newman. 2004. “Sexual Harassment in the Federal
Workplace Revisited: Influences on Sexual Harassment by Gender.” Public Administration
Review 64(4): 705–717.
Juliano, Ann and Stewart J. Schwab. 2001. “The Sweep of Sexual Harassment Cases.” Cornell
Law Review 86(3): 548–600.
Katz, Roger C., Roseann Hannon, and Leslie Whitten. 1996. “Effects of Gender and Situation on
the Perception of Sexual Harassment.” Sex Roles 34(1/2): 35–42.
41
Knapp, Deborah Erdos, Robert H. Faley, Steven E. Ekeberg, and Cathy L. Z. Du Bois. 1997.
“Determinants of Target Responses to Sexual Harassment: A Conceptual Framework.”
Academy of Management Review 22(3): 687–729.
Lemos, Margaret H. 2010. “The Consequences of Congress's Choice of Delegate: Judicial and
Agency Interpretations of Title VII.” Vanderbilt Law Review 62(2): 363–435.
Lim, Sandy and Lilia M. Cortina. 2005. “Interpersonal Mistreatment in the Workplace: The
Interface and Impact of General Incivility and Sexual Harassment.” Journal of Applied
Psychology 90(3): 483–496.
Lynch, Scott M. 2007. INTRODUCTION TO APPLIED BAYESIAN STATISTICS AND ESTIMATION FOR
SOCIAL SCIENTISTS.
Meritor Savings Bank v. Vinson, 477 U.S. 57 (1986).
Mueller, Charles, Stacy De Coster, and Sarah Beth Estes. 2001. “Sexual Harassment in the
Workplace: Unanticipated Consequences of Modern Social Control in Organizations.” Work
and Occupations 28(4):411–446.
Neals, Natalie S. 2013. “Flirting with the Law: An Analysis of the Ellerth/faragher Circuit Split
and A Prediction of the Seventh Circuit's Stance.” Marquette Law Review 97(1): 167–213.
Newman, Meredith A., Robert A. Jackson, and Douglas D. Baker. 2003. “Sexual Harassment in
the Federal Workplace.” Public Administration Review 63(4): 472–482.
Perry, Elisa L., Carol T. Kulik, and James M. Schmidtke. 1997. “Blowing the Whistle:
Determinants of Responses to Sexual Harassment.” Basic & Applied Social Psychology 19(4):
457–482.
Title VII of the Civil Rights Act, 42 U.S.C.A. § 2000e.
United States Merit Systems Protection Board. 1995. “Sexual Harassment in the Federal
Workplace: Trends, Progress, and Continuing Challenges.” Washington: Government Printing
Office.
Vance v. Ball State University, 133 S.Ct. 2434 (2013).
White, Evan D. 2006. “A Hostile Environment: How the ‘Severe Or Pervasive’ Requirement and
the Employer's Affirmative Defense Trap Sexual Harassment Plaintiffs in a Catch-22.” Boston
College Law Review 47(4): 853–890.
42
Table 1. Definitions of MSPB Variables
Variables
Employment Action
Work Worse
Denied Promotion
Reassigned
Fired
Adverse Action
Response to Harassment
Reported Within
Formal Action
Reported
Best Report
Harassment Power
Personal Demographics
Age
Education
Pay Grade
Female
Marital Status
Occupation
Supervisor
Type of Harassment
Assault
Favors
Touching
Looks
Calls
Dates
Teasing
Stalking
Experience
Harassment Characteristics
Supervisor Harasser
Coworker Harasser
Female Harasser
Male Harasser
Harassers Both Sex
Multiple Harassers
Freq > 1 a Month
Dur > 3 Months
Workplace Characteristics
More Men
Equal Men/Women
More Women
Male Supervisor
Female Supervisor
DOD
Current Training
Definition
Indicator: After harassment employee received worse work assignments
Indicator: After harassment employee was denied a promotion, pay increase, or
good performance rating
Indicator: After harassment employee was reassigned, detained, or transferred
Indicator: After harassment employee was fired
Indicator: After harassment employee received worse assignments, was denied a
promotion, was reassigned, or was fired
Indicator: After the harassment employee reported to supervisor or to EEOC
Indicator: After the harassment the employee took formal legal actions
Indicator: After the harassment the employee reported the harassment or took
formal legal actions
Indicator: Employee believes the best response to harassment is to report
Indicator: Employee strongly believes that sexual harassment in the workplace is
an attempt by one person to exercise power over another
Indicators: Age 16-24, Age 25-34, Age 35-44, & Age > 45
Indicators: Less than College Degree, College Degree, & Graduate Degree
Indicators: Pay Grade 1-4, Pay Grade 5-10, Pay Grade 11-15, & Pay Grade SES
Indicator: Employee was female
Indicators: Married, Single, and Divorced/Widowed.
Indicators: Trainee/Other Job, Clerical/BlueCollar, & Professional/Management
Indicator: Victim was a supervisor
Indicator: Attempted or actual assault occurred during harassment
Indicator: Unwanted pressure for sexual favors from harasser(s)
Indicator: Unwanted touching or cornering occurred during harassment
Indicator: Unwanted sexual looks or gestures occurred during harassment
Indicator: Unwanted letters or phone calls sent during harassment
Indicator: Unwanted pressure for dates from harasser(s)
Indicator: Unwanted sexual jokes or teasing occurred during harassment
Indicator: Stalking from supervisor occurred
Indicator: Whether the employee was harassed in the previous 2 years
Indicator: Harasser was employee’s supervisor
Indicator: Harasser was employee’s coworker
Indicator: Harasser was female
Indicator: Harasser was male
Indicator: Harassers were male & female
Indicator: There were multiple harassers
Indicator: Harassment occurred more than once a month
Indicator: Harassment lasted for more than three months
Indicator: Workplace was composed of mostly men
Indicator: Workplace was equally male and female
Indicator: Workplace was composed of mostly women
Indicator: Employee’s supervisor was male
Indicator: Employee’s supervisor was female
Indicator: Agency is part of the Department of Defense
Indicator: Agency required employees to attend sexual harassment training
43
Table 2. MSPB Retaliation Summary Statistics for Females and Males
Employment Action
Harassed Females
(1)
(n=1,551)
Harassed Males
(2)
(n=467)
Work Worse
.101
.072
Denied Promotion
.067
.041
Reassigned
.023
.019
Fired
.003
.003
Variable
Adverse Action
.129
Source: 1994 U.S. Merit Systems Protection Board Sexual Harassment Survey.
Notes: Weighted means are reported. n corresponds to the number of observations.
44
.106
Table 3a. MSPB Summary Statistics for Female Sample: Personal Demographics
Full Sample
Harassed
No Adverse
Adverse
Variables
Action
Action
(1)
(2)
(3)
(4)
Education
(n=3,733)
(n=1,524)
(n=1,320)
(n=198 )
Less than College Degree
.669
.612
.605
.635
College Degree
.244
.293
.300
.271
Graduate Degree
.087
.095
.095
.094
Marital Status
(n=3,884)
(n=1,596)
(n=1,308)
(n=207)
Single
.210
.254
.253
.268
Married
.556
.481
.490
.433
Divorced/Widowed
.234
.265
.257
.299
Age
(n=3,961)
(n=1,605)
(n=1,314)
(n=206)
Age 16-24
.029
.054
.057
.023
Age 25-34
.207
.255
.262
.264
Age 35-44
.349
.418
.406
.480
Age > 45
.415
.273
.275
.232
Pay Grade
(n=4,213)
(n=1,626)
(n=1,325)
(n=211)
Pay Grades 1-4
.081
.083
.071
.156
Pay Grades 5-10
.619
.589
.599
.511
Pay Grades 11-15
.299
.326
.328
.332
Pay Grades SES
.001
.002
.004
.000
Occupation
(n=3,878) (n=1,589)
(n=1,306)
(n=205)
Clerical/Blue Collar
.520
.505
.513
.552
Professional/Management
.445
.461
.456
.387
Other Job/Trainee
.035
.034
.031
.060
Supervisor
.149
.144
.143
.094
Difference
(3)-(4)
(5)
-.030
.027
.001
-.015
.057
-.042
.034**
-.003
-.074
.043
-.086*
.088
-.005
.002
-.040
.068
-.029
.048*
(F=3,880, H=1,591, NA=1,303, A= 209)
Workplace Characteristics
Male Supervisor
.628
.673
.660
.825
-.165***
.372
.327
.340
.175
.165***
.391
.432
.426
.528
-.102*
.138
.232
-.093*
(F=3,857, H=1,578, NA=1,295, A=204)
Female Supervisor
(F=3,857, H=1,578, NA=1,295, A=204)
DOD
(F=4,227, H=1,620, NA=1,321, A=209)
Training
(H=1,202, NA=1,004, A=139)
Workplace Sex Integration
(n=3,895)
(n=1,599)
(n=1,309)
(n=209)
More Men
.345
.429
.423
.503
-.080
Equal Men/Women
.357
.303
.314
.207
.108**
More Women
.298
.268
.263
.290
-.028
Source: U.S. Merit Systems Protection Board Sexual Harassment Survey.
Notes: Weighted means are reported. Columns (1)–(4) are labeled with the sample analyzed. Column 5 reports
the difference between columns (3) and (4) and the statistical significance of that difference according to a ttest. *, **, *** indicate significance at the 10, 5, and 1 percent levels. F represents the full sample of females,
H is short for harassed females, NA is short for the sample of females that did not experience an adverse action,
and A is short for the sample that experienced an adverse action. The numbers following H, NA, A, and n are
the number of observations for the respective group.
45
Table 3b. MSPB Summary Statistics for Male Sample: Personal Demographics
Full
No Adverse
Adverse
Variables
Sample
Harassed
Action
Action
(1)
(2)
(3)
(4)
Education
(n=3,067)
(n=469)
(n=389)
(n=44 )
Less than College Degree
.489
.466
.438
.650
College Degree
.331
.370
.379
.344
Graduate Degree
.179
.164
.182
.006
Marital Status
(n=3,203)
(n=499)
(n=409)
(n=53)
Single
.130
.226
.213
.310
Married
.755
.612
.619
.655
Divorced/Widowed
.115
.163
.168
.034
Age
(n=3,278)
(n=499)
(n=409)
(n=54)
Age 16-24
.007
.018
.021
.008
Age 25-34
.155
.211
.203
.228
Age 35-44
.323
.441
.442
.504
Age > 45
.515
.331
.355
.261
Pay Grade
(n=3,521)
(n=502)
(n=409)
(n=54)
Pay Grades 1-4
.036
.060
.052
.099
Pay Grades 5-10
.398
.363
.358
.464
Pay Grades 11-15
.559
.574
.585
.437
Pay Grades SES
.007
.003
.004
.000
Occupation
(n=3,200)
(n=496)
(n=407)
(n=52)
Clerical/Blue Collar
.370
.385
.363
.527
Professional/Management
.584
.577
.603
.365
Other Job/Trainee
.046
.038
.034
.108
Supervisor
.297
.277
.291
.226
Difference
(3)-(4)
(5)
-.212**
.036
.176***
-.097
-.036
.134***
.013
-.025
-.062
.074
-.046
-.106
.147
.004*
-.164
.239**
-.074
.064
(F=3,206, H=496, NA=407, A= 54)
Workplace Characteristics
Male Supervisor
.855
.769
.772
.747
.025
.145
.231
.228
.253
-.025
.521
.449
.442
.578
-.136
.101
.106
-.005
(F=3,189, H=495, NA=406, A=53)
Female Supervisor
(F=3,189 H=495, NA=406, A=53)
DOD
(F=3,541, H=501, NA=409, A=53)
Training
(H=506, NA=298, AA=36)
Workplace Sex Integration
(n=3,895)
(n=500)
(n=410)
(n=53)
More Men
.611
.496
.468
.634
-.166
Equal Men/Women
.142
.197
.199
.124
.074
More Women
.247
.306
.333
.241
.092
Source: U.S. Merit Systems Protection Board Sexual Harassment Survey.
Notes: Weighted means are reported. Columns (1)–(4) are labeled with the sample analyzed. Column 5
reports the difference between columns (3) and (4) and the statistical significance of that difference
according to a t-test. *, **, *** indicate significance at the 10, 5, and 1 percent levels. F represents the full
sample of females, H is short for harassed males, NA is short for the sample of males that did not experience
an adverse action, and A is short for the sample that experienced an adverse action. The numbers following
H, NA, A, and n are the number of observations for the respective group.
46
Table 4a. MSPB Summary Statistics for Female Sample: Harassment Characteristics
Harassed
No Adverse
Adverse
Difference
Variable
Action
Action
(2)-(3)
(1)
(2)
(3)
(4)
Type of Harassment
Assault
Favors
Teasing
Looks
Calls
Dates
Touching
Stalking
Harasser Characteristics
Supervisor Harasser
(H=1,533, NA=1,260, A=206)
Coworker Harasser
(H=1,533, NA=1,260, A=206)
Female Harasser
(H=1,566, NA=, 1,303, A=195)
Male Harasser
(H=1,566, NA=1,303, A=195)
Harassers Both Sexes
(H=1,566, NA=1,303, A=195)
Multiple Harassers
(H=1,500, NA= 1,240, A=197)
Freq >1 a Month
(H=1,613, NA=1,325, A=207)
Dur > 3 Months
(H=1,584, NA=1,303, A=210)
Response to Harassment
Reported
(H=1,531, NA=1,274, A=200)
Harassment Power
(H=1,441, NA=1,171, A=200)
(n=1,642)
.016
.090
.665
.484
.160
.194
.484
.105
(n=1,338)
.011
.081
.658
.454
.142
.187
.473
.095
(n=213)
.057
.162
.839
.657
.300
.220
.597
.197
-.046
-.081**
-.181***
-.203***
-.158***
-.033
-.124**
-.102**
.291
.237
.686
-.448***
.532
.540
.510
.029
.012
.010
.024
-.014
.934
.932
.945
-.012
.054
.058
.032
.026
.217
.199
.335
-.136**
.419
.379
.716
-.337***
.437
.410
.695
-.285***
.205
.171
.459
-.289***
.428
.398
.631
-.233***
**
Source: U.S. Merit Systems Protection Board Sexual Harassment Survey.
Notes: Weighted means are reported. Columns (1)–(3) are labeled with the sample analyzed. Column 4
reports the difference between columns (2) and (3) and the statistical significance of that difference
according to a t-test. *, **, *** indicate significance at the 10, 5, and 1 percent levels. H is short for
harassed females, NA is short for the sample of females that did not experience an adverse action, and A is
short for the sample that experienced an adverse action. The numbers following H, NA, A, and n are the
number of observations for the respective group.
47
Table 4b. MSPB Summary Statistics for Male Sample: Harassment Characteristics
Harassed
No Adverse
Adverse
Difference
Variable
Action
Action
(2)-(3)
(1)
(2)
(3)
(4)
Type of Harassment
(n=506)
(n=412)
(n=55)
Assault
.016
.003
.041
-.038
Favors
.073
.082
.059
.023
Teasing
.578
.589
.610
-.020
Looks
.377
.361
.475
-.114
Calls
.166
.156
.197
-.041
Dates
.154
.163
.045
.118***
Touching
.373
.407
.331
.077
Stalking
.107
.084
.236
-.152*
Harassment Characteristics
Supervisor Harasser
.157
.097
.531
-.435***
(H=467, NA=390, A=51)
Coworker Harasser
.633
.685
.335
.352***
.659
.662
.514
.148
.231
.219
.405
-.187*
.109
.120
.081
.039
.185
.184
.271
-.087
.285
.273
.514
-.242**
.372
.341
.677
-.336***
.139
.113
.359
-.246**
.240
.229
.355
-.125
(H=467, NA=390, A=51)
Female Harasser
(H=471, NA=395, A=49)
Male Harasser
(H=471, NA=395, A=49)
Harassers Both Sexes
(H=471, NA=395, A=49)
Multiple Harassers
(H=453, NA=382, A=47)
Freq > 1 a Month
(H=494, NA=408, A=55)
Dur > 3 Months
(H=478, NA=397, A=54)
Response to Harassment
Reported
(H=461, NA=385, A=51)
HarassmentPower
(H=446, NA=366, A=50)
Source: 1994 U.S. Merit Systems Protection Board Sexual Harassment Survey.
Notes: Weighted means are reported. Columns (1)–(3) are labeled with the sample analyzed. Column 5
reports the difference between columns (2) and (3) and the statistical significance of that difference
according to a t-test. *, **, *** indicate significance at the 10, 5, and 1 percent levels. H is short for harassed
males, NA is short for the sample of males that did not experience an adverse action, and A is short for the
sample that experienced an adverse action. The numbers following H, NA, A, and n are the number of
observations for the respective group.
48
Table 5. OLS Regression Results
Dependent Variable: Adverse Action
Female
Variable
(1)
Reported
0.100***
(0.036)
Supervisor Harasser
0.183***
(0.032)
Favors in Experience
-0.026
(0.055)
Touching in Experience
0.039
(0.025)
Looks in Experience
0.025
(0.023)
Calls in Experience
0.109***
(0.039)
Dates in Experience
-0.016
(0.032)
Teasing in Experience
0.043*
(0.025)
Stalking in Experience
0.075
(0.055)
Frequency > Once a Month
0.070**
(0.028)
Duration > 3 Months
0.006
(0.029)
Harassers Both Sexes
-0.043
(0.055)
Female Harasser
0.099
(0.135)
Multiple Harassers
0.017
(0.040)
Training
0.023
(0.038)
DOD
0.031
(0.025)
Pay Grade 1-4
0.550***
(0.159)
Pay Grade 5-10
0.405***
(0.154)
Pay Grade 11-15
0.451***
(0.153)
Age 25-34
0.116**
(0.048)
Age 35-44
0.139***
(0.050)
49
Male
(2)
0.127*
(0.071)
0.327***
(0.075)
-0.040
(0.054)
-0.078**
(0.035)
0.054
(0.040)
0.034
(0.055)
-0.100**
(0.047)
-0.042
(0.035)
0.094
(0.075)
-0.017
(0.043)
0.072
(0.045)
-0.234*
(0.124)
0.007
(0.047)
0.127
(0.111)
0.035
(0.043)
0.089***
(0.033)
0.113
(0.124)
0.008
(0.076)
-0.018
(0.064)
0.047
(0.110)
0.104
(0.110)
Age > 45
0.131**
(0.052)
0.069***
(0.023)
-0.159*
(0.087)
-0.193**
(0.088)
-0.004
(0.028)
0.019
(0.028)
0.003
(0.037)
0.022
(0.030)
0.020
(0.031)
Male Supervisor
Clerical / Blue Collar
Professional/Management
Supervisor
College
Grad School
Single
Divorced/Widowed
Constant
Number of Observations
R- Squared
-.5178***
(.1644)
1,465
0.247
0.093
(0.109)
-0.002
(0.035)
-0.160
(0.129)
-0.126
(0.129)
0.010
(0.029)
0.004
(0.041)
-0.057
(0.041)
-0.001
(0.042)
-0.098**
(0.042)
0.069
(0.174)
430
0.423
Source: 1994 U.S. Merit Systems Protection Board Sexual
Harassment Survey.
Notes: *, **, *** indicate significance at the 10, 5, and 1 percent
levels. The dependent variable is Adverse Action. Robust standard
errors are reported in parentheses, and the regressions include a
weighting variable. Indicator variables for missing values for each
of the variables, but Adverse Action, are included in the
specifications, but the coefficients are not reported. Omitted
categories are Assault, Coworker Harasser, Male Harasser, Pay
Grade SES, Age 16-24, Female Supervisor, Trainee/Other Job,
Less than College Degree, and Married.
50
Table 6. OLS Regressions Results with Interaction Variable
Dependent Variable: Adverse Action
Variable
Reported
Supervisor Harasser
Supervisor Harasser*Reported
Constant
Number of Observations
R-Squared
Female
(1)
0.015
(0.033)
0.130***
(0.025)
0.257***
(0.086)
-0.456***
(0.153)
1,465
0.266
Male
(2)
0.123
(0.075)
0.323***
(0.077)
0.063
(0.161)
0.070
(0.174)
430
0.423
Source: 1994 U.S. Merit Systems Protection Board Sexual Harassment Survey.
Notes: *, **, *** indicate significance at the 10, 5, and 1 percent levels. The dependent
variable is Adverse Action. Robust standard errors are reported in parentheses, and the
regressions include a weighting variable. Colum 1 reports results for the specifications
analyzing the female sample, and Column 2 reports results for the specifications
analyzing the male sample. Each variable controlled for in the specifications presented
in Table 5 are controlled for in these specifications.
51
Table 7. 2SLS Regression Results for Female Sample
IV
(1)
Variable
Reported
0.610
(0.459)
0.164***
(0.042)
-0.013
(0.081)
0.017
(0.044)
0.006
(0.034)
0.043
(0.069)
-0.026
(0.050)
-0.001
(0.050)
0.032
(0.090)
0.024
(0.055)
0.028
(0.043)
-0.020
(0.059)
-0.044
(0.255)
0.006
(0.051)
0.018
(0.053)
0.004
(0.046)
0.320
(0.260)
0.159
(0.260)
0.191
(0.268)
0.133*
(0.081)
0.141*
(0.085)
Supervisor Harasser
Favors in Experience
Touching in Experience
Looks in Experience
Calls in Experience
Dates in Experience
Teasing in Experience
Stalking in Experience
Frequency > Once a Month
Duration > 3 Months
Harassers Both Sexes
Female Harasser
Multiple Harassers
Training
DOD
Pay Grade 1-4
Pay Grade 5-10
Pay Grade 11-15
Age 25-34
Age 35-44
52
IV First
Stage
(2)
0.042
(0.036)
-0.050
(0.075)
0.076**
(0.032)
0.026
(0.031)
0.102*
(0.053)
0.008
(0.051)
0.078**
(0.035)
0.119*
(0.064)
0.099***
(0.036)
-0.026
(0.035)
-0.022
(0.074)
0.331**
(0.143)
0.004
(0.045)
0.008
(0.050)
0.061*
(0.034)
0.413**
(0.186)
0.447***
(0.171)
0.475***
(0.165)
-0.015
(0.079)
0.014
(0.081)
Age > 45
0.174**
(0.085)
0.072**
(0.035)
-0.168
(0.125)
-0.181
(0.124)
0.006
(0.042)
0.031
(0.039)
0.012
(0.045)
0.053
(0.044)
0.029
(0.041)
Male Supervisor
Clerical / Blue Collar
Professional/Management
Supervisor
College
Grad School
Single
Divorced/Widowed
Harassment Power
Constant
-0.321
(0.290)
1,294
-0.057
(0.080)
0.012
(0.035)
0.024
(0.095)
-0.015
(0.092)
-0.022
(0.040)
-0.049
(0.038)
-0.056
(0.050)
-0.039
(0.037)
0.001
(0.039)
0.066**
(0.033)
-0.457**
(0.192)
1,361
Number of Observations
F-Stat of Excluded
5.07
Instruments
Cragg-Donald Wald F
11.157
Statistic
Durbin-Wu-Hausman test for
0.633
Endogeneity P-Value
Source: 1994 U.S. Merit Systems Protection Board Sexual
Harassment Survey.
Notes: *, **, *** indicate significance at the 10, 5, and 1
percent levels. The dependent variable in the first stage is
Reported. The dependent variable in the second stage is
Adverse Action. Harassment Power is the instrumental
variable. Robust standard errors are reported in parentheses,
and the regressions include a weighting variable. Indicator
variables for missing values for each of the variables, but
Adverse Action, are included in the specifications, but the
coefficients are not reported. Omitted categories are Assault,
Coworker Harasser, Male Harasser, Pay Grade SES, Age 1624, Female Supervisor, Trainee/Other Job, Less than College
Degree, Married, and More Men.
53
Table 8. Heckman Selection Regression Results for Male and Female Samples
Variable
Female
Heckman
First
(1)
Female
Heckman
Second
(2)
0.099***
(0.035)
0.184***
(0.031)
-0.029
(0.054)
0.039
(0.024)
0.025
(0.023)
0.110***
(0.039)
-0.016
(0.031)
0.044*
(0.025)
0.076
(0.054)
0.069**
(0.028)
0.006
(0.029)
-0.041
(0.055)
0.102
(0.133)
0.016
(0.039)
0.023
(0.037)
0.026
(0.025)
0.575***
(0.162)
0.431***
(0.157)
0.470***
(0.156)
0.127***
(0.048)
0.152***
Reported
Supervisor Harasser
Favors in Experience
Touching in Experience
Looks in Experience
Calls in Experience
Dates in Experience
Teasing in Experience
Stalking in Experience
Frequency > Once a Month
Duration > 3 Months
Harassers Both Sexes
Female Harasser
Multiple Harassers
Training
DOD
Pay Grade 1-4
Pay Grade 5-10
Pay Grade 11-15
Age 25-34
Age 35-44
0.131*
(0.072)
-0.904
(0.691)
-0.883
(0.679)
-0.674
(0.674)
-0.500**
(0.204)
-0.548***
54
Male
Heckman
First
(3)
-0.116
(0.093)
0.317
(0.392)
0.173
(0.325)
0.202
(0.310)
-0.253
(0.342)
-0.143
Male
Heckman
Second
(4)
0.126*
(0.067)
0.327***
(0.071)
-0.040
(0.052)
-0.078**
(0.033)
0.054
(0.038)
0.034
(0.052)
-0.100**
(0.045)
-0.042
(0.034)
0.094
(0.071)
-0.018
(0.041)
0.072*
(0.042)
-0.234**
(0.117)
0.006
(0.045)
0.127
(0.105)
0.035
(0.040)
0.090***
(0.032)
0.108
(0.121)
0.005
(0.076)
-0.022
(0.065)
0.050
(0.106)
0.106
Age > 45
Male Supervisor
Clerical / Blue Collar
Professional/Management
Supervisor
College
Grad School
Single
Divorced/Widowed
Equal Men & Women
More Women
Constant
Number of Observations
(0.203)
-1.092***
(0.205)
0.059
(0.080)
-0.164*
(0.087)
-0.195**
(0.088)
-0.002
(0.028)
0.014
(0.028)
0.001
(0.037)
0.015
(0.029)
0.008
(0.030)
-0.319***
(0.090)
-0.306***
(0.086)
(0.050)
0.160***
(0.052)
0.065***
(0.023)
0.193
(0.188)
0.075
(0.191)
-0.043
(0.097)
0.160*
(0.092)
0.066
(0.120)
0.271***
(0.089)
0.452***
(0.088)
-0.525***
(0.172)
1.074
(0.715)
3,562
3,562
(0.342)
-0.642*
(0.343)
0.002
(0.039)
-0.165
(0.125)
-0.129
(0.124)
0.009
(0.028)
0.004
(0.039)
-0.057
(0.039)
-0.005
(0.048)
-0.101**
(0.046)
(0.104)
0.100
(0.114)
-0.226**
(0.113)
0.356*
(0.192)
0.269
(0.194)
0.067
(0.106)
-0.016
(0.116)
-0.083
(0.137)
0.359***
(0.116)
0.315**
(0.147)
0.213
(0.144)
0.263**
(0.105)
0.060
(0.175)
430
Wald Test of Independent
Equations (Prob > chi2)
0.083
0.887
Source: 1994 U.S. Merit Systems Protection Board Sexual Harassment Survey.
Notes: *, **, *** indicate significance at the 10, 5, and 1 percent levels. The first stage Heckman
variables are regressed on Harassed (whether the employee was harassed in the previous 2
years).The dependent variable in each second stage is Adverse Action. Robust standard errors
are reported in parentheses, and the regressions include a weighting variable. Indicator variables
for missing values for each of the variables, but Adverse Action, are included in the
specifications, but the coefficients are not reported. Omitted categories are Assault, Coworker
Harasser, Male Harasser, Pay Grade SES, Age 16-24, Female Supervisor, Trainee/Other Job,
Less than College Degree, Married, and More Men.
55
CHAPTER II
STOPPING THE NUISANCE: EMPIRICAL EVIDENCE THAT FEDERAL
COURTS CAN DETER FRIVOLOUS EEOC CHARGES
INTRODUCTION
In the 2013 case University of Texas Southwestern Medical Center v. Nassar, the Supreme
Court expressed concern that the liberal retaliation standard adopted by the Fifth Circuit would
encourage the filing of frivolous claims, stating, “lessening the causation standard could also
contribute to the filing of frivolous claims, which would siphon resources from efforts by
employer, administrative agencies, and courts to combat.”26 While the court is correct to worry
about the presence of frivolous claims, as scholars have discussed the severe consequences of such
claims for decades, in support of this statement, the Supreme Court cited an increase in the total
number of retaliation charges filed with the Equal Employment Opportunity Commission
(“EEOC”) since 1997. While suggestive, this evidence actually only established that retaliation
claims have increased over time. In theory one may expect a positive relationship between liberal
court decisions and the filing of frivolous claims, or nuisance suits, in court or charges with federal
agencies, such as the EEOC, but little empirical evidence exists establishing this relationship. In
this chapter, I provide the first empirical analysis of whether this relationship exists. By taking
advantage of the variation created by two employment law circuit splits directly related to the
Supreme Court’s Nassar decision, in this chapter, I empirically test whether federal court decisions
affect the filing behavior of affected employees and applicants. Specifically, I test whether the
adoption of a liberal standard that favors employees increases frivolous charges, distinguished by
26
Univ. of Texas Sw. Med. Ctr. v. Nassar, 133 S. Ct. 2517 (2013). The Supreme Court of the United States has cited
its worry about a floodgate of litigation when adopting certain legal standards since as early as 1908, and during 2010–
2013, the Court addressed this concern at least fourteen times (Levy 2013).
56
a label given by the EEOC, and whether the adoption of a strict standard that favors the employer
decreases such charges.
Under Title VII of the Civil Rights Act, a charging party must file any Title VII charge
with the EEOC before the Title VII claim can be filed in federal court. Approximately one hundred
thousand employees file employment discrimination charges with the EEOC each year (Selmi
2001; EEOC Litigation Statistics). While only twenty thousand of these charges are ever filed in
court (Selmi 2001; EEOC Litigation Statistics), the filing of a frivolous charge with the EEOC still
wastes the resources of the government, the employee, and the employer, as the agency is required
to investigate each claim and attempt to mediate each claim. The employer also must respond to
the claim and investigation, generally with the assistance of an attorney, and because of these costs,
an employer may choose to settle a frivolous claim, resulting in an unjust transfer of wealth.
Theoretically, all else equal, a liberal employment discrimination standard (one that is
favorable for the plaintiff, or the employee) should increase the probability that a plaintiff prevails
at trial, and thus, increase the number of charges, including those with less merit, filed with the
EEOC between 2007 and 2013.27 On the other hand, a stricter standard (one that is favorable to
the employer) should decrease the filing of frivolous charges.28 In this chapter, I empirically test
this hypothesis by analyzing a dataset comprised of every charge filed with the EEOC. This dataset
includes the claims made by each charging party and the outcomes of the EEOC process. Several
outcomes of the EEOC process can provide information on whether the agency views a charge as
27
I analyze years 2007–2013, so that I can analyze three years of data before and after the decisions that I analyze.
While such standards may affect charges of merit, in this chapter, I focus on the number of charges filed and whether
these charges included frivolous charges, as these charges are the charges that waste resources. In addition, frivolous
charges are the most likely to be affected by a change in circuit court decisions because they are the marginal charges—
the charges where a change in the probability of success would greatly affect the likelihood that an affected party files
a charge.
28
57
frivolous, where frivolous is defined as having a very low probability of succeeding at trial. These
outcomes include whether the EEOC finds cause and the processing label that the EEOC assigns
a charge at the beginning of its process. These processing categories include whether, based on the
charge alone, the EEOC believes the charge is likely to be dismissed.
In this chapter, I use difference-in-differences specifications that take advantage of the
timing of the decisions of courts of appeals and the fact that these decisions only affect one circuit
to isolate the effect of the adoption of a certain employment law standard on the filing of charges
with the EEOC. In particular, I analyze two circuit splits regarding causation standards for
retaliation claims filed under Title VII and claims filed under the ADA that were directly related
to the Supreme Court’s decision in Nassar. Through this analysis, I find evidence that liberal
standards can increase the rate of charges filed with the EEOC and that decisions that favor the
employer can decrease such filings. In addition, there is evidence that more liberal standards
increase the probability that the EEOC labels a charge as likely to be dismissed or finds no cause
and that the employer-friendly charges actually decrease these probabilities—suggesting that
liberal standards can increase frivolous claims and strict standards can decrease them. These results
also suggest that the Supreme Court’s fears that led it to reject a more liberal retaliation causation
standard in Nassar may have been justified.
I begin by discussing frivolous charges and the relevant literature that models a plaintiff’s
decision to file a frivolous claim and the consequences of such claims being filed. I then provide
background information on the EEOC, including a discussion of how an affected employee may
consider relevant circuit law when filing a charge and how the EEOC process can be used to
determine whether a charge is frivolous. Before discussing my empirical strategy, I review the
circuit splits that I empirically analyze and the framework used to analyze the effect of federal
58
court decisions on EEOC charge filings and outcomes. The empirical results provide statistical
evidence suggesting that courts of appeals decisions affect EEOC proceedings and filings. I
conclude by discussing the potential mechanisms of the specific results and the consequences that
can be drawn from the results.
BACKGROUND ON FRIVOLOUS CLAIMS: RELEVANT LITERATURE
Much like the Supreme Court, legal and economic scholars have expressed concerns over
the presence of frivolous lawsuits for quite some time. The frivolous lawsuit literature has
primarily addressed potential mechanisms to prevent the filing of such lawsuits and the
consequence of such lawsuits. There is also substantial law and economics literature that
theoretically models the filing of frivolous claims.
The Supreme Court has expressed a concern over the costs associated with frivolous law
suits for years, and it has taken several measures to prevent the filing of such claims, including
adopting strict standards and developing and strengthening Rule 11 of the Federal Rules of Civil
Procedure.29 Rule 11 states that sanctions are warranted if a claim does not have reasonable legal
and factual support. This rule was designed to reduce the filing of frivolous lawsuits due to the
costs associated with them. Theoretically, these costs include efficiency costs, including wasted
financial resources and time, and fairness concerns that result when unworthy plaintiffs recover
for frivolous claims during settlement due to the costs of litigation (Katz 1990). However, some
scholars have also suggested, that theoretically, frivolous lawsuits may still assist in optimal
deterrence because the threat of frivolous suits increases as harmful action increases due to the
29
Other mechanisms adopted to prevent such claims include rule of professional conduct and tort reform.
59
assumption that frivolous suits often accompany or follow legitimate suits (referred to as
“piggybacking”) aligning social and private incentives to take care (Miceli and Stone 2014).
Bone (1997) provided a very good summary of the law and economics literature that
models the decision to file a frivolous claim. These models often begin with a definition of what
is considered a frivolous lawsuit, including a suit with a very small probability of success or a suit
with a negative expected value. The models then seek to determine the circumstances under which
a plaintiff will file a frivolous lawsuit and potential mechanisms that can decrease the filing of
such suits. For example, Rosenberg and Shavell (1985) found that because of the costs of
responding to litigation and the promise of settlement, under the American system of the allocation
of attorney’s fees, where litigant’s pay their own fees, a plaintiff may still file a claim if the
defendant is aware that it is frivolous (even if information is perfect). Because defendants can often
simply respond to a frivolous claim with a blanket denial with little costs if the defendant is aware
of the merits of the case, Katz (1990) introduced imperfect information to explain why plaintiffs
continue to file frivolous claims. Bone (1997) expanded these models by addressing both scenarios
and the wealth of knowledge of a plaintiff, and concluded that when the plaintiff or defendant has
critical private information, it is very likely that either unjustified settlement occurs or a frivolous
claim is filed in court. To avoid these fairness and efficiency costs, Bone (1997) suggested that
regulation is often necessary in any situation of asymmetric information. In an EEOC claim, one
party almost always has more factual information about the claim than another. The regulation
suggested by Bone (1997) includes penalties, such as Rule 11, strict pleading standards, much like
the Supreme Court later adopted in Bell Atlantic Corporation v. Twombly (2007)30 and Ashcroft v.
30
Bell Atl. Corp. v. Twombly, 550 U.S. 544 (2007).
60
Iqbal (2009),31 and early screening of claims by the court. While early screening occurs in EEOC
administration though the labeling process, defendants are actually not aware of that process or the
investigation results, and as a result they do not learn any private information known by the
plaintiff.32 In addition, Guthrie (2000) modeled frivolous claims using prospect theory and
behavioral economics, concluding that a plaintiff is likely to prefer trial due to the risk-seeking
behavior that plaintiffs who file frivolous claims exhibit.
There is a lack of empirical evidence on the effect of court decisions or standards such as
Rule 11 on frivolous claims. However, several surveys have been conducted to determine whether
Rule 11 has the potential to reduce such claims. Surveys of federal and state judges have found
that Rule 11 in its previous form did decrease frivolous suits (Bone 1997). Theoretically, Polinsky
and Rubinfeld (1993) walked through the economic framework of sanctioning frivolous claims,
including a defendant’s decision to challenge a claim as frivolous and a plaintiff’s decision to file
the claim, and they concluded that certain sanctions can deter future frivolous claimants. However,
the authors did not provide empirical support of this conclusion. Several studies have analyzed the
effect of the elevated pleading standard created by the Supreme Court in Twombly and Iqbal on
filings for dismissal and dismissal rates (Seiner 2010; Hannon 2008). Generally, these studies
found that the elevated standard increased dismissal rates and motions to dismiss. In fact,
Seiner (2010) found that the elevated standard increased the dismissal of Title VII claims.
However, these studies did not analyze whether the case strength was altered, and they actually
suggest that the elevated standard did not improve the quality of pleadings.
31
Ashcroft v. Iqbal, 556 U.S. 662 (2009).
Although an employer may infer the strength of a charge based on the EEOC’s investigation, the process is still one
of imperfect information.
32
61
Scholars, practitioners, and judges have also expressed a concern over the prevalence of
frivolous employment discrimination charges. Recently, Judge Bennett (2013) pointed out the
great increase in summary judgment in employment discrimination partly due to a rise in frivolous
claims, comparing the claims to prison rights cases.33 Other scholars also recognized the move
toward an increase in granting motions for arbitration and an increase in awarding attorney’s fees
to employers, all in response to the overwhelming increase in frivolous claims. Some even fear
that there is a moral hazard effect of Title VII or that employers would not hire members of a
protected class out of fear of frivolous lawsuits (Coleman et al. 2008). However, Coleman et
al. (2008) used the Multi-City Study of Urban Inequality, in which minority respondents reported
whether they had experienced racial discrimination to confirm that nearly all of the black workers
who said they had experienced workplace discrimination experienced some form of wage
discrimination.34 Of course, this article did not disprove the presence of frivolous employment law
claims, and in fact, it found that the majority of white females who complained of discrimination
did not have evidence of wage discrimination.
Despite all of this focus on the prevalence of and high costs associated with frivolous
claims, there is a general consensus that there is a lack of empirical evidence that supports the
adoption of certain standards or rules to address this problem, even in the employment
discrimination literature (Levy 2013). An empirical analysis of the effect of a legal standard on the
filing of a charge and the merit of a charge is very difficult, as there are almost no publically
available datasets that report detailed information about claims filed in federal court, including the
outcome of the claim. While one could look at published opinions, published opinions are
33
Judge Bennett is a judge for the U.S. District Court Judge in the Northern District of Iowa.
The authors constructed wage equations using the information provided from this survey to test for wage
discrimination.
34
62
generally not representative of all litigation, and analyses of such decisions, especially in the
employment law context can produce biased results (Clermont and Eisenberg 2002). In this
chapter, I overcome these difficulties and provide empirical evidence of whether adopting a strict
standard (in this study, a but-for causation standard) can decrease the presence of frivolous lawsuits
(or whether the adoption of a liberal standard—in this study, a mixed-motive causation standard
can increase this presence) using data that is representative and not subject to the selection bias:
the universe of charges filed with the EEOC between 2007 and 2013.
BACKGROUND ON THE EEOC: HOW FEDERAL COURTS COULD AFFECT EEOC FILINGS
Federal courts require the claimant to timely file a charge with the EEOC and receive a
“right to sue” notice before filing a Title VII claim in federal court (Macfarlane 2011), and Title VII
actually mandates this filing.35 Every charge is filed with a local EEOC office, and each office is
located in a specific federal circuit. As laid out in Title VII, the charge may then be filed in the
district court in the state where the alleged action occurred or where the employment records of
the employer are kept. If filed in federal court, the charges filed in federal court according to these
limitations will clearly be affected by the decisions of the circuit in which they are filed. 36 As a
result, there is always a substantial possibility that federal court interpretations will affect the
outcome of Title VII cases filed in court.37 The relevant circuit law consists of the decisions of the
35
The EEOC must also issue a right to sue notice even if it does not find cause. If the state where the charging party
files a charge has a Fair Employment Practices Agency (“FEPA”), then the charging party can file the claim with the
FEPA, who will then communicate with the EEOC through their worksharing agreements.
36
In the 1990 case Yellow Freight System, Inc. v. Donnelly, the Supreme Court held that federal and state courts have
concurrent jurisdiction over all Title VII claims. As a result, a charging party can file a Title VII claim in state court
after exhausting the agency procedures. Historically, civil rights plaintiffs have favored filing their charges in federal
court (Powley 1991). However, even if plaintiffs favor state court due to recent precedent in either venue or
convenience, the employer always has the ability to remove the entire action to federal court under subject matter
jurisdiction, and very often they choose to do so (Moberly 1997). In addition, though not bound by the decisions of
the courts of appeals, state courts often look to those decisions for persuasive authority.
37
Unfortunately, there is no way to know the percentage of Title VII cases filed in federal court as opposed to state
court due to data limitations (Burbank et al. 2014). Burbank et al. (2014) reported that California tends to have more
discrimination cases filed in state court than federal court, however these cases are not limited to Title VII claims and
63
federal circuit with jurisdiction over the charge. Each of these requirements and circumstances also
applies to charges and claims filed under the ADA.
Before the EEOC process begins, an affected individual must decide to file a charge.
Knowing that relevant circuit law will likely affect the outcome of his or her claim, when making
this decision, the affected individual may consider that law. If a court decision favors an affected
party and applies in the district where the party would file a potential lawsuit and to the potential
case that the charging party would bring, then the affected party should be more likely to file a
charge with the EEOC following that decision. In addition, the charges most likely to be affected
by a change in circuit law are frivolous charges, as these are the marginal charges—the charges
where a small change in the probability of success could increase the likelihood that an affected
individual decides to file the charge. Of course, this prediction assumes that the affected party is
aware of relevant court decisions.38 Because the majority of charging parties are not represented
by an attorney when first filing a charge with the EEOC, this may be a strong assumption
(Selmi 1996). However, in the data I analyze in this chapter, at least 10% of the sample is
represented by an attorney.39 In addition, employees can learn of changes in the law through other
sources, such as learning through the experience of peers who filed a claim in court (who will be
more likely to win if a more liberal standard is adopted), consulting human resource offices, and
the estimates were roughly computed from previous estimations of the percentage of charges filed with the state
agency that are filed in court, again not limited to Title VII claims. Alternatively, Marchand (2009) found that class
action plaintiffs in Michigan prefer to file employment claims in federal court.
38
Finding evidence of this effect on EEOC charges would suggest that courts could have an even greater effect on
frivolous charges filed in federal court. The Supreme Court has mentioned this concern in other cases. For example,
the Court showed concern that a per se rule in antitrust law would promote frivolous claims and thus increase litigation
cost in Leegin Creative Leather Prods. v. PSKS, Inc., 551 U.S. 877, 895 (2007). In addition, scholars have noted that
some courts regard this statement from Nassar as a holding and have relied on it when interpreting other claims
(Sperino and Thomas 2014).
39
This data does not include whether a charging party is represented by an attorney, nor has this data ever been
presented in any other study. However, in this data, approximately 10% of the charging parties request a right to sue
notice before the investigation is complete. It is very unlikely that a party would know to make this request or would
chose to make this request without having counsel.
64
consulting nonprofit organizations designed to promote awareness about filing employment
discrimination claims. Also, as noted in the introduction, five of the current justices of the Supreme
Court of the United States believe that a liberal employment law decision can increase the number
of charges, even frivolous charges, filed with the EEOC.40 Although such a liberal standard
increases the probability that a plaintiff wins in court by changing the causation standard, it does
not change the fact pattern individual cases. As a result, it is very likely that such a decision could
increase the filing of frivolous claims to the extent that affected employees believe they have a
higher probability of success. However, this is an empirical question that has yet to be answered.
The fact that a court decision can change both the rate of and nature of the charges filed
with the EEOC also complicates the ability to predict how a circuit court decision will affect the
outcome of EEOC charges. The following section discusses the EEOC process and what EEOC
outcomes can signal whether the relevant charges were frivolous or not. The next section also
previews potential changes within the labor market and the EEOC process that could complicate
this analysis, making it more difficult to predict the effect of a liberal standard on filing behavior.
EEOC Administration and How It Reveals the Strength of a Charge
In this chapter, I also test whether the adoption of a liberal standard increases the likelihood
that frivolous charges are filed. There are two stages that are illustrative of the merit of a charge
filed with the EEOC. In 1995, the EEOC adopted a Priority Case Handling Process, in which an
EEOC complaint specialist assigns a charge an A, B, or C code based on the charge’s likelihood
of resulting in a reasonable cause finding (Nielsen et al. 2008). The EEOC assigns this label very
soon after receiving a charge. An “A” charge is expected to result in a reasonable cause finding, a
40
Univ. of Texas Sw. Med. Ctr. v. Nassar, 133 S. Ct. 2517, 2531–2532 (2013).
65
“B” charge will likely result in a reasonable cause finding, and a “C” charge has “uncertain merit.”
This determination affects the amount of attention and investigation that each charge will receive.
For example, as discussed below, “C” charges may not be eligible for mediation. Receiving a “C”
charge is indicative of a frivolous charge.41 In fact, in the data analyzed in this chapter, the EEOC
labels such charges as likely to be dismissed, and these charges fare much worse during the EEOC
process (Nielsen et al. 2008).42
The most determinative stage of the administration of a charge is likely the EEOC’s
determination of reasonable cause. After a charge is labeled, the EEOC then will attempt to
mediate the claim, and if mediation fails, the EEOC will begin an investigation. Following the
investigation, the EEOC must determine whether a charge has cause or not. The EEOC will find
reasonable cause if it believes that an unlawful employment practice more likely than not occurred
under Title VII. This determination has several important consequences, including whether the
EEOC will attempt to conciliate a claim and whether the charging party decides to file the charge
in federal court. If the EEOC finds cause, the EEOC must then attempt to conciliate the charge
with the employer. If the EEOC does not find cause, it does not necessarily mean that the charge
was frivolous. However, because the EEOC almost always adopts a liberal standard (Lemos 2010)
and likely considers its promotion of those standards when considering a charge’s merit, if the
41
One benefit of looking at this labeling to determine the nature of the charge filed is that these labels are likely not
affected by the court decisions of each circuit. The EEOC complaint specialist is not always a lawyer (Green 2001;
EEOC Mediation). Although the specialist should still be versed in the law and able to understand relevant precedent,
it is not likely that this officer makes such determinations such as whether the relevant circuit court made a recent
decision.
42
While Nielsen et al. (2008) does not find that “C” cases fair worse when they are filed in federal court, this is likely
due to the selection of cases that are ever filed.
66
EEOC does not find cause, it is suggestive of a charge’s lack of merit. In the data analyzed in this
chapter, the EEOC codes whether it found “no cause.”43
Mechanism Complications
There are two prominent factors that could complicate the analysis performed in this
chapter. All else equal, a liberal standard should increase the filing of affected claims and the
number of frivolous charges labeled as frivolous by the EEOC, however, the response of
employers and the actions of the EEOC could complicate this prediction. A decision that is
favorable to an employee is also unfavorable to an employer. As a result, it may be the case that
an employer responds to such a decision by changing the workplace to prevent discriminatory
actions, such as retaliation. This decision should then lower the instances of retaliation, which
would lower the number of retaliation charges filed. If employers respond in this manner, then I
should be less likely to find that an increase in frivolous charges occurred due to the adoption of a
liberal standard.
The EEOC’s consideration of relevant circuit law could affect its labeling of a charge and
its cause determinations. It should be the case that a more liberal decision would lead to the EEOC
less likely to label a cause as likely to dismiss. If this is the case, then this consideration would
make it more difficult to determine the effect of a strict standard on frivolous charges because a
decrease in dismiss labels may not suggest a lack of frivolous charges. Again, if this analysis
nonetheless finds a decrease in the probability that a charge is labeled frivolous following the
Lemos (2010) labels a charge as “liberal” if it favors the plaintiff and finds that of 98 issues which the EEOC and
the Supreme Court both addressed, the Court and the EEOC disagreed one-third of the time, and the EEOC’s position
was liberal 91% of the time.
43
67
adoption of a certain standard, then this consideration would not negate the conclusion that the
standard decreased the number of frivolous charges filed with the EEOC.
Fortunately, there is evidence that the EEOC does not consider circuit law when making
such decisions. This makes it less likely that this consideration would complicate the analysis of
this chapter. Instead, there is evidence that the EEOC only considers its own position and
interpretation of the law. The EEOC frequently issues guidance in which it takes a strong position
on certain employment discrimination standards that have not been settled by the Supreme Court.
Perhaps the most direct evidence that the EEOC promotes its own policies and interpretations
when administering EEOC charges and determining the merit of the charge appears in a footnote
of a guidance document that addresses employer liability for sexual harassment. In this footnote,
the EEOC directly disagrees with the Fourth Circuit’s interpretation of the definition of “tangible
employment action,” a term used by the Supreme Court to reference the employer liability
standard, stating, “It is the Commission’s view that the Fourth Circuit misconstrued [the Supreme
Court’s meaning in] Faragher and Ellerth.”44
Additional evidence that the EEOC considers its own policies when making decisions is
found in how the EEOC determines whether it would like to represent a charging party in federal
court, a right the EEOC has had since the Equal Employment Opportunity Act of 1972. In 1996,
the EEOC adopted a national enforcement plan in response to the recently developed Task Force
on Charge Processing. The resulting plan identified priorities of the EEOC, including “[c]ases
having the potential of promoting the development of law supporting the antidiscrimination
purposes of the statutes enforced by the Commission.” These cases of priority include “[c]ases
44
Faragher v. City of Boca Raton, 524 U.S. 775 (1998); Burlington Industries, Inc. v. Ellerth, 524 U.S. 472 (1998).
68
involving legal issues where there is a conflict in the federal circuit courts on a Plan priority or in
which the Commission is seeking Supreme Court resolution of such issue.” The fact that the EEOC
prioritizes these cases specifically shows that it considers the decisions in a way contrary to the
merit-based-decision approach discussed above. This consideration could alter the EEOC’s
behavior by making it more likely to label a charge an “A” charge in circuits that have adopted
standards that contradict their policies, or in undecided circuits.45 As a result of this complication,
I do not analyze likely cause labels in this chapter.46
Although anecdotal evidence and theoretical modeling is helpful in predicting how federal
court decisions affect EEOC outcomes, empirical evidence is necessary due to the presence of
these complications. In the following section, I empirically analyze two recent causation circuit
splits expected to affect the outcome of federal court cases using difference-in-differences analysis
to see whether federal court decisions with the potential to affect trial outcomes can actually affect
the outcome of EEOC charges or individual filing behavior.
45
Moss at al. (2001) actually found that the office where the charge was filed explained 42% of the variation in
whether the EEOC labeled a charge an “A” charge. However, they did not find this effect for “C” labels. The authors
attribute this variation to variations in culture, leadership, and what each office prioritizes. While this is a possible
explanation, an additional explanation would be that the EEOC considers relevant circuit law.
46
Although this hypothetical scenario may seem farfetched, in my research of the EEOC, I have frequently heard of
the EEOC “fast-tracking cases” and pursuing cases that directly conflict relevant circuit law. For example, recently,
the Northern District of Iowa ordered the EEOC to pay attorney’s fees of 4.7 million dollars because it did not
substantiate its claim. A Wall Street Journal article recently recognized this case and the growing concern of court
sanctions (Gersham 2014). This article referenced EEOC v. CRST Van Expedited, Inc., No. 07-CV-95-LRR, 2010
WL 520564 (N.D. Iowa Feb. 9, 2010). In fact, the Supreme Court recently heard arguments in the case EEOC v. Mach
Mining regarding whether federal courts can investigate EEOC procedures when they file claims in federal court, as
many courts are concerned they do not do proper investigations and conciliation attempts before filing (Bravin and
Trottman 2015). However, this standard should really only affect a small portion of EEOC charges, as the EEOC only
represents a charging party in approximately 300 cases a year. This number has declined recently. In 2012 and 2013,
the EEOC only represented a charging party in 155 and 148 cases respectively.
69
EMPIRICAL ANALYSIS: DO FEDERAL COURT DECISIONS AFFECT FILING OF EEOC CHARGES?
Relevant Circuit Court Decisions
Congress used many vague and undefined terms to draft Title VII, making Title VII what
scholars refer to as a common-law enabling statute (Lemos 2010). Because of this language, it is
the federal courts’ responsibility to interpret the provisions of the statute during case-by-case
adjudications. These interpretations range from determining what actions constitute sex
discrimination to determining how detailed EEOC investigations should be. However, not all of
these interpretations and resulting standards are strong enough that they are expected to affect trial
outcomes, much less the outcomes of EEOC charges and EEOC filings. As a result, I analyze two
circuit splits that were expected to have “bite” in both arenas. Both splits are directly related to the
causation standard decided by the Supreme Court in University of Texas Southwestern Medical
Center v. Nassar.
Generally, courts, including the Supreme Court of the United States, have adopted two
different causation standards for plaintiffs to satisfy when proving their case under
nondiscrimination statutes. While these standards vary from statute to statute and slightly vary
with evidentiary requirements, they can be generally described as the mixed-motive causation
standard and the but-for causation standard. A mixed-motive causation standard requires the
plaintiff to show that the fact that he or she was a member of a protected class (including the
disabled under the ADA) was a factor in the employer’s adverse action against the plaintiff. On
the other hand, the much stricter but-for standard requires the plaintiff to prove that the employer
would not have made the decision to act adversely against the plaintiff if the plaintiff was not a
member of a protected class (or a disabled individual). It is generally understood that the but-for
standard is much more employer friendly, as it is difficult to prove and easy for the employer to
70
rebut. The analysis that I present in this chapter studies the effect of the but-for standard as adopted
by the Seventh Circuit with respect to claims filed under the ADA and the effect of a lenient mixedmotive standard adopted by the Fifth Circuit with respect to retaliation claims brought under Title
VII. Both of these decisions are directly related to the Supreme Court’s adoption of the but-for
standard for retaliation claims in Nassar.
In Nassar, the five justice majority held that to establish a retaliation claim under the antiretaliatory provision of Title VII, the charging party must prove that they would not have
experienced the relevant adverse employment action but for the fact that they are a member of a
protected class no matter whether the employee presents direct or circumstantial evidence. As
described by Tananbaum (2013), before Nassar, it was not clear what causation standard applied
to Title VII retaliation charges. In 1989 the Supreme Court decided Price Waterhouse v. Hopkins
to address what evidence was necessary to prove that an adverse action was “because” the plaintiff
was a member of a protected class under Title VII.47 The Court held that claims in which the action
that occurred was based on a discriminatory action and a nondiscriminatory action (mixed motive)
were allowed if direct evidence was shown, but that the employer can overcome this burden if he
proves that the action would have occurred even if the member was not a member of the protected
class. While this case did not apply to other nondiscrimination statutes or Title VII retaliation
claims, circuit courts began to apply this standard in cases that brought retaliation claims, claims
under the ADA, and claims under Age Discrimination Employment Act (“ADEA”).
Following Price Waterhouse, Congress amended Section 107 of the Civil Rights Act in
1991.48 The section now states that when being a member of a protected class was a motivating
47
48
Price Waterhouse v. Hopkins, 490 U.S. 228 (1989).
42 U.S.C. § 2000e-2.
71
factor for discrimination, the action is an unlawful employment practice even if other factors
motivated the action, and even if the employer can show that he would have acted if not for the
discrimination.49 Because this section did not directly state that it applied to retaliation claims filed
under Title VII, the circuit courts continued to apply the standard developed in Price Waterhouse
(Rupe et al. 2014). As a result, if direct evidence was shown, mixed-motive retaliation cases could
be entertained under Title VII, but if the plaintiff relied on circumstantial evidence, the courts
required the employee to establish “but-for” causation.
Similarly, courts have been split regarding the causation standard applicable for all claims
filed under the ADA since its passage in 1990, and the Supreme Court has not decided this issue.
Early in the ADA’s history, circuits were split as to whether a motivating factor standard, much
like the standard that applies to Title VII claims, should apply or whether a “solely because of”
standard should apply (Schlesinger 2014). Similar to the original language in Title VII, the ADA
simply says that the employer may not discriminate “because of” a disability. However, after the
adoption of the 1991 amendments, the circuits that previously adopted the solely because of
standard slowly began to reverse the standard, and the overwhelming majority of the circuits that
addressed this issue applied the mixed-motive standard under Price Waterhouse with the exception
of the Sixth Circuit.50
In 2009, the law became even more muddled for both Title VII retaliation claims and ADA
claims when the Supreme Court adopted a much stricter standard for causation, when interpreting
49
Note that following the adoption of these amendments, the circuit courts were still split as to whether direct evidence
was required to shift the burden and apply Price Waterhouse. The Supreme Court held that direct evidence was not
required in Desert Palace, Inc. v. Costa, 539 U.S. 90 (2003).
50
The Sixth Circuit continued to apply the “solely because of” standard until it adopted the but-for standard in 2012.
As a result, the Sixth Circuit is omitted from my analysis. In addition, the Tenth Circuit and the Eleventh Circuit
occasionally applied a but-for standard, and as a result, those circuits are also omitted form the analysis.
72
“because of age” for claims filed under the ADEA. In Gross v. FBL Financial Services, Inc.,51 the
Supreme Court held that no matter what evidence is presented, a but-for causation standard applies
to claims brought under the ADEA. The Supreme Court explained that because Congress did not
amend the ADEA to include the language of Section 107 of Title VII when it amended Title VII
in the 1991, the mixed-motive standard did not apply to ADEA claims. While this decision did not
address ADA claims or Title VII retaliation claims, following Gross, it was now an acceptable
argument that a but-for standard should apply and uncertainty resulted in every circuit. However,
only two circuits were quick to directly address the resulting ambiguity soon after the decision.
Following Gross, the Seventh Circuit was the only circuit to quickly address the
uncertainty and to adopt this but-for causation standard for claims filed under section 201 of the
Civil Rights Act.52 The Seventh Circuit based its decision on the fact that Congress did not address
this statute when amending Title VII. The Seventh Circuit made this position even clearer and
stronger when it later applied this standard to ADA claims in Serwatka v. Rockwell Automation,
Inc.53 The Seventh Circuit had not previously spoken directly to the causation standard of the
ADA. In Serwatka, the court suggested that this logic applied to all federal claims, however, the
holding explicitly applied to ADA claims.54 I hypothesize that following the adoption of this
standard in Serwatka, employees should be less likely to file ADA charges with the EEOC in the
Seventh Circuit and that the rate of frivolous charges should also decrease. Figure 1 illustrates the
dates of the relevant ADA standards and decisions and the relevant comparison groups.
51
Gross v. FBL Financial Services, Inc., 557 U.S. 167 (2009).
Fairley v. Andrews, 578 F.3d 518 (7th Cir. 2009).
53
Serwatka v. Rockwell Automation, Inc., 591 F.3d 957 (7th Cir. 2010).
54
Though many courts continue to apply the mixed-motive standard under the ADA, the Seventh Circuit and the Sixth
Circuit are the only courts to have adopted the but-for standard, and the Supreme Court has not decided this split
(Schlesinger 2014). The Sixth Circuit adopted this in May of 2012.
52
73
On the other hand, in the 2010 case, Smith v. Xerox, the Fifth Circuit, while still recognizing
that Section 107 did not apply to retaliation claims, instead held that a much lower standard applies
for Title VII retaliation claim.55 The Fifth Circuit held that a plaintiff did not need direct evidence
to entertain a mixed-motive retaliation claim. The court only required the plaintiff to prove a
mixed-motive theory, or that being a member of a protected class was one of the employer’s
reasons for acting against the plaintiff.56 Previously, the Fifth Circuit, as with the other circuits that
had addressed causation in retaliation claims, held that the Price Waterhouse burden-shifting
standard applied, requiring the plaintiff to establish “but-for” causation for retaliation claims if
only circumstantial evidence is shown. Of course, the Supreme Court rejected both standards and
directly overruled this decision in Nassar.57 I hypothesize that before Nassar and after the adoption
of the mixed-motive standard, individuals should be more likely to file a retaliation claim in the
Fifth Circuit. In addition, as predicted by the Supreme Court, it is likely that this increase in claims
is due to an increase in frivolous claims. Figure 2 illustrates the dates of the relevant Title VII
retaliation standards and decisions and the relevant comparison groups.
Two characteristics of these standards make them ideal for the analysis in this chapter.
First, this circuit split is expected to have bite. Not only has the Supreme Court spoken to these
causation standards, but experimental studies have shown that causation standards do affect jury
verdicts and awards (Rupe et al. 2014; Sherwyn et al. 2014). In addition, following the Supreme
Court’s adoption of the elevated but-for standard in Nassar and Gross, scholars have expressed
55
Smith v. Xerox Corp., 602 F.3d 320 (5th Cir. 2010).
While many courts had applied a mixed-motive theory to Title VII retaliation claims before Gross (Sperino and
Thomas 2014), this standard generally required direct evidence. To succeed on a mixed-motive claim, these courts
required direct evidence to then apply the Price Waterhouse test. The Fifth Circuit was the only court to directly hold
that a mixed-motive retaliation claim did not require direct evidence to shift the burden. The Supreme Court previously
held that direct evidence is not required in Desert Palace, Inc. v. Costa, 539 U.S. 90 (2003).
57
Smith v. Xerox was the only case mentioned and overruled by the Supreme Court.
56
74
concern that this standard will make it very difficult for charging parties to succeed. For example,
Curry (2014) referred to overcoming the but-for standard as “an onerous task.” Finally, Congress
has also shown concern over the standard; after Gross, it proposed the Protecting Older Workers
Against Discrimination Act (“POWDA”58), which would expand the mixed-motive language
found in Section 107 of Title VII to the ADA, ADEA, and Title VII retaliation claims (Sherwyn
et al. 2014).
Secondly, in 1998, the EEOC issued guidance that suggested that its position was that a
mixed-motive standard applies to Title VII retaliation claims and to ADA retaliation claims.59 This
guidance illustrate that the EEOC has its own agenda which it may enforce in this area, which
makes it more likely that the EEOC will not enforce the stricter standard adopted by the Seventh
Circuit when finding cause or labeling a charge.60 This factor makes it less likely that the EEOC’s
consideration of the circuit law will bias the results of this analysis to no effect.
Data
The data I use to analyze the effect of these two circuit court decisions on employment
discrimination filing behavior were compiled from a Freedom of Information Act (“FOIA”)
request to the EEOC. Through the FOIA process, I received data on every discrimination charge
filed with the EEOC from 1985 through August 2013.61 The information provided for each charge
includes the state where it was filed and the date it was filed, from which I can discern whether it
was filed in a circuit with a certain standard in effect at the time. Before looking at the empirical
58
Protecting Older Workers Against Discrimination Act, H.R. 3721, 111th Cong. (2009), available at
http://www.govtrack.us/congress/billtext.xpd? bill=h111-3721.
59
While it is not clear that the EEOC supported a mixed-motive standard for ADA claims at this time, it is likely that
they did due to this and other guidance.
60
While this consideration may also make it more likely that the EEOC labels a charge likely cause or finds cause,
this analysis focuses on dismiss labels.
61
This dataset is comprised of over two million charges, however, this analysis is limited to charges filed after 2007.
75
strategy used to isolate this effect, it is necessary to describe the available data and define the key
variables used in my analysis.
Currently, when the EEOC receives a charge, it first conducts an intake interview with the
charging party. From this interview, the agency obtains detailed information that is later entered
into a computerized data system. Through my FOIA request, I was able to obtain all of the
information that was not confidential due to privacy restrictions recorded by the EEOC during this
process for all charges filed since 1985, thus covering the period of this analysis (2006–2013). The
EEOC records the date that the charge was received and what local office received the charge. For
each charge, the EEOC also records characteristics of the charging party, including, his or her date
of birth, race, national origin, and gender. The EEOC also records information about the employer,
including the industry of the employer (recorded as North American Industry Classification
System (“NAICS”) codes), the city and state of the employer, and the number of employees of the
employer, which is recorded as a range.
From the intake interview and the formal intake charge that the charging party completes,
the EEOC also records important information about the claim the charging party is making. The
EEOC records what statute or statutes the charging party is filing under and the basis or bases of
the claim. The basis is essentially the type of violation that the charging party is claiming occurred,
for example, sex discrimination, age discrimination, sexual harassment, or disability
discrimination to name a few. The EEOC also records the issue or issues that the charging party
claims illustrated this basis. For example, the charging party could complain that he or she was
fired, denied a promotion, transferred, received less pay, or was not accommodated. It is important
to recognize that charging parties often filed charges with more than one basis and more than one
issue. Very often, retaliation charges are filed with additional charges. In fact, during the years
76
analyzed in this chapter, only 20% of charges that included a retaliation charge did not include any
other bases. Comparatively, approximately 60% of the charges that included a disability basis
(under the ADA) did not include any other bases.
In this empirical analysis, I analyze whether a circuit court decision can affect the
percentage of charges of a certain type filed with the EEOC. The Seventh Circuit’s but-for standard
is expected to affect ADA claims, and the Fifth Circuit’s mixed-motive standard should only affect
retaliation charges. If a claim in my data includes a retaliation charge, then the variable Retaliation
Charge is equal to one. Similarly, if claim includes a charge filed under the ADA, ADA Charge is
equal to one.
Following the intake interview, the EEOC also records the priority case code that the intake
officer assigns the charge. As discussed above, these codes are based on the likelihood that the
EEOC finds cause or litigates the charge, and these codes are generally “A”, “B”, and “C” labels.
For the purpose of this analysis, I analyze a variable equal to one if the charge was labeled a C
charge because it was suitable for dismissal (Dismiss Label) because I believe it is the most likely
signal that a charge is frivolous. The summary statistics presented in Tables 1 and 2 include the
percentage of claims, by the sample analyzed, that received a dismiss label. Approximately 12%
of ADA charges and 12% of retaliation charges receive a dismiss label.62
The EEOC also updates this computerized data as a charge is resolved. A charge can be
resolved in several ways. The charge could be mediated, and the EEOC would code the resolution
as “successful mediation.” Alternatively, the charge could be resolved because the charging party
did not cooperate with the investigation. Importantly, the EEOC also records the outcome of its
62
These statistics are also presented for the full sample in Table A of the Appendix.
77
cause determinations. Although the above legal discussion focused on the EEOC issuing
reasonable cause findings, because the EEOC does this in other situations, such as when the
charging party requests to file litigation on their own, the EEOC actually records whether it found
that the charge had no cause. Again, the EEOC makes this determination following an
investigation of a charge, and as such, it have more information regarding the charges merit. In
this chapter, I also analyze a variable equal to one if the EEOC does not find cause (No Cause
Finding). As seen in Tables 1 and 2, approximately 65% of the ADA charges and 65% that are
evaluated for a charge receive a no cause finding. This variable provides further support that a
charge might be frivolous; if a charge receives a no cause finding, then after the investigation, the
EEOC believed it did not merit a day in court.
Empirical Analysis
To isolate the effect of these standards on the filing of frivolous charges with the EEOC, I
use difference-in-differences estimation (“DD”). As is illustrated in Figure 2, only charges filed in
the Fifth Circuit following the 2010 Smith v. Xerox decision and before the Nassar decision should
be affected by the mixed-motive standard. A DD technique isolates this effect by subtracting the
difference between the types of circuits before the adoption of a standard from the difference
between the types of circuits after the adoption of a standard. For example, to analyze the Fifth
Circuit’s mixed-motive standard alone without the consideration of any other standard, one takes
the difference of the means of the charges filed in the Fifth Circuit before the standard was adopted
in Xerox to those of other circuits at the same time period and compares that difference to the
difference between the means of the charges filed in the Fifth Circuit and the other circuits after
the adoption of the standard in Xerox. The only assumption necessary for this estimation is that
there was not a distinct shock to the number of charge filings in the Fifth Circuit or to the number
78
filed in other circuits (and not the Fifth Circuit) at the time the court decided Xerox.63 The means
needed to construct the differences for this technique are provided in Table 1.64 For the purposes
of Table 1, which provides summary statistics according to this design, if the charge was filed after
the date of the Xerox decision, then the variable PostXerox is equal to one.
As is illustrated in Figure 1, only charges that should be affected by the but-for standard
were filed in the Seventh Circuit following the 2010 Serwatka v. Rockwell decision. Table 2
provides the means of each outcome before and after Serwatka within and out of the Seventh
Circuit. For the purposes of Table 2, if the charge was filed following the date of Serwatka, then
PostSerwatka is equal to one. 65 Each of the total samples is limited to charges filed after 2007 and
before the Supreme Court decided University of Texas Southwestern Medical Center v. Nassar in
June 2013.
Looking at the means, the adoption of the mixed-motive standard by the Fifth Circuit seems
to have a very small effect on the rate of Title VII retaliation charges filed. 66 Note that before the
adoption of the standard, the percentage of retaliation charges in the Fifth Circuit was 1.1
percentage points higher than the percentage in all other circuits. Following the adoption of mixedmotive standard, that difference increased to 2.2 percentage points, implying a DD estimate of a 1
63
The control group used to compare to the Fifth Circuit is all other circuits but the Seventh Circuit, which adopted
the but-for standard in Serwatka three months before the Fifth Circuit decided Xerox, which could have decreased
retaliation charges.
64
Each analysis does not include “duplicates” from the data. I consider an observation a duplicate if the date of filing,
date of resolution, city of charge, and date of birth are the same for an observation. While this process drops
approximately 5% of each sample, results remain very similar when these observations are included. I drop these
duplicates for each analysis. When analyzing “no cause findings,” my analysis is also be limited to charges that were
not dropped because of no jurisdiction, because the charging party failed to respond, or because the charging party
sought a right to sue letter. Each of these decisions would not affect the merit of the charge.
65
All of the other circuits did not change their standard during the time period. The control group used to compare to
the Seventh Circuit is all other circuits but the Eleventh, Tenth, and Sixth Circuits, which applied the but-for standard
or a solely because of standard during this time period without explicitly adopting it.
66
While occasionally I refer to these claims simply as retaliation claims, this analysis is limited to retaliation claims
filed under Title VII, as they are the only ones addressed in Xerox and Nassar.
79
percentage point increase in the rate of retaliation charges. Table 2 also shows evidence that the
Seventh Circuit’s adoption of the but-for standard may have decreased ADA charges: the
difference in the percentage of ADA claims between the Seventh Circuit and all other circuits was
2.1 percentage points and that difference decreased to 0.5 percentage points following the adoption
of the but-for standard, implying a DD estimate of a 1.6 percentage point decrease in the rate of
ADA charges.67
To determine how these standards affect the probability that a charge filed is considered
frivolous, in addition to comparing the differences between circuit and year, I can also compare
the differences between the type of charge that should be affected and all other charges. This
technique is known as triple-difference (“DDD”). In this estimation, the only assumption necessary
to isolate the effect is that there was not an unobserved shock at the time of the adoption that
affected retaliation charges and no other charges. Table 4 illustrates this technique for the effect of
the Seventh Circuit’s but-for standard on ADA charges by presenting each difference in the means.
The means are also presented in the bottom panel of Table 2. To get the DDD estimate, I difference
the means of charges that include an ADA charge and those that do not before and after Serwatka
in the Seventh Circuit (the treated circuit). I then compare that total difference to the same
difference constructed from all other circuits that were not treated, and the DDD estimate is -4.3
percentage points.68 This result suggests that the adoption of the but-for standard decreased dismiss
labels for ADA claims by 4.3 percentage points. Table 3, which provides the same estimation for
67
Because these statistics report a percentage of claims, and a floodgate is often associated with raw numbers, it is
also worthwhile to look at the number of retaliation charges filed in each circuit and each time period. Table 1 also
provides those statistics. Note the decrease in ADA charges that occurred after the Serwatka decision in the Seventh
Circuit and the very large increase that occurred in the other circuits, likely due to the ADA Amendments adopted in
2008.
68
Note that this analysis does not include the Sixth, Tenth, or Eleventh Circuits because of complications due to
their application of a standard similar to a but-for standard.
80
the Fifth Circuit’s standard suggests that the Fifth Circuit’s adoption of the mixed-motive standard
increased the percentage of dismiss labels for retaliation charges by 4.4 percentage points. Similar
constructions performed for no cause findings suggest similar, though much smaller estimates.
The means presented in Table 3 are also presented in the bottom panel of Table 1.
While these summary statistics are interesting and suggest certain patterns, many
differences in characteristics between circuits and time can affect these results, such as a decision
related to the definition of retaliation, and this comparison assumes that the trends in these
characteristics are the same in the treated and non-treated groups. As a result, to further isolate the
effect through a DD or DDD estimation, I use regression analysis to estimate DD and DDD
empirical specifications.
Regression Framework
A regression framework using DD and DDD models further isolate the effect of these
standards on filing behavior by controlling for additional observables, including time and year
fixed effects and characteristics of the charges. The DD specification isolates the policy effect by
controlling for circuit-invariant changes due to differences over time, and time-invariant changes
due to differences in the laws specific to a circuit. My ideal specification for analyzing the effect
of the Fifth Circuit’s mixed-motive standard on the filing of retaliation charges with the EEOC
follows below.
(1)
Retaliation Charge = β0 + β1Post + β2FifthCircuit + β3PostXerox x FifthCircuit
+ Z′β4 + Y′β5 + ε
Retaliation Charge, a variable equal to one if the charge filed is a retaliation charge, is the
dependent variable. PostXerox is a variable equal to one if the observation was filed following the
Xerox decision, and FifthCircuit is a variable equal to one if the observation was filed in a state
81
that is part of the Fifth Circuit (Louisiana, Texas, and Mississippi). PostXerox x FifthCircuit is the
interaction between these two terms, and thus is only equal to one if the observation was filed in
the Fifth Circuit after the court decided Xerox. In this specification, the coefficient on β3 is the DD
estimate. If this coefficient is positive and statistically significant, then the mixed-motive standard
increased the rate of retaliation charges filed as compared to all other charges filed with the EEOC
which should not have been affected by that decision. This regression framework allows me to
control for characteristics of each year and circuit that could affect the result, such as a change in
political administration or an additional relevant employment law decision in a circuit court: Z is
the vector of year fixed effects and Y is the vector of circuit fixed effects. This specification
controls for time-invariant characteristics of a circuit that may affect charge filings and circuitinvariant characteristics of time that may affect filings.
When analyzing the potential effect of the Seventh Circuit’s but-for standard on ADA
claims the specification is very similar:
(2)
ADA Charge = β0 + β1PostSerwatka + β2SeventhCircuit +
β3PostSerwatka x SeventhCircuit + Z′β4 + Y′β5 + ε
ADA Charge is equal to one if the charge filed included an ADA claim. Seventh Circuit is equal
to one if the charge was filed in the SeventhCircuit, and PostSerwatka is equal to one if the charge
was filed after the decision. Again, the DD estimate is the coefficient on the interaction of these
two variables, and if it is negative and statistically significant, then the Seventh Circuit’s but-for
standard decreased the rate of ADA charges filed in the circuit. All other variables are defined the
same as in Equation (1).
The above-described specifications test the likelihood that a circuit court decision changes
the rate of filings of a certain type of charge following a decision, however, it cannot tell us
82
anything about the merit of the charge filed. In an attempt to answer this question, I also estimate
the effect of circuit court decisions on the probability that the charge receives a dismiss label and
the probability that a charge receives a no cause finding. Because I also have the ability to isolate
time- and circuit-invariant differences due to charge type differences, I estimate this effect using
triple-differences (DDD). The following specifications are a DDD specification that I use to
estimate the DDD coefficients for the two causation standards.
(3) ChargeLabel = β0 + β1′ PostXerox + β2FifthCircuit + β3RetaliationCharge +
β4PostXerox x FifthCircuit + β5PostXerox x RetaliationCharge +
β6FifthCircuit x ChargeType + β7PostXerox x FifthCircuit x
RetaliationCharge + X′ β8 + Z′β9 + Y′β10 + ε
(4) ChargeLabel = β0 + β1PostSerwatka + β2SeventhCircuit + β3ADACharge +
β4PostSerwatka x SeventhCircuit + β5PostSerwatka x ADACharge +
β6SeventhCircuit x ADACharge + β7PostSerwatka x SeventhCircuit x
ADACharge + X′ β8 + Z′β9 + Y′β10 + ε
I use the above equations to analyze two dependent variables: DismissLabel and NoCauseFinding.
ChargeLabel is a stand in for these two variables. The main difference between this equation and
Equation (1) is the inclusion of the triple interactions.69 The coefficient on the interaction between
all three of the variables (PostXerox x FifthCircuit x RetaliationCharge and PostSerwatka x
SeventhCircuit x ADACharge)
of interest (β7) is the DDD estimate. β7 represents the effect of
the relevant decision, controlling for the unobserved differences associated with the difference in
circuit, the difference in types of charges, and the difference in time (before and after the decision).
In these specifications, I also control for a vector of charge characteristics (X), such as personal
demographics of the charging party and the other bases brought by the party that can be expected
69
When analyzing the effect of the mixed-motive standard on retaliation charges in equation (3), these interactions
include PostXerox x RetaliationCharge and FifthCircuit x RetaliationCharge. When analyzing the effect of the butfor standard in equation (4) on ADA charges, these interactions include: PostSerwatka x ADACharge and
SeventhCircuit x ADACharge.
83
to affect the outcome of a charge and could be affected by unobserved shocks.70 A positive and
statistically significant β7 suggests an increase in the probability that a charge of a certain type (the
charge type expected to be affected) receives a certain label due to the standard adopted by the
court/or courts.
The data includes all of the information necessary to isolate the true effect of the above
circuit court decisions on filing outcomes by estimating Equations (1)–(4). In the following
paragraphs, I define each of the additional variables used to estimate Equations (1)–(4) to analyze
the effect of each standard as created from this EEOC data The names of each of these variables
are provided in italics and in parentheses.
When estimating Equations (3) and (4), X includes the characteristics of the charging party,
including age of the charging party when the charge was filed (Age), the sex of the charging party
(Female), the race of the charging party (Asian, White, Indian, Black, Other Race), and the national
origin of the charging party (Hispanic NO, Mexican NO, Asian NO, Eastern NO, African NO, and
Arab NO). X also includes whether the employer was federal or state government (Education
Employer, Federal Government Employer, and State Government Employer).71 Additionally X
includes legal information about the charge: the basis or bases of charge (Race Basis, Sex Basis,
Sexual Harassment Basis, National Origin Basis, Age Basis, Pay Male Basis, Pay Female Basis,
Religion Basis, Color Basis, Mental Disability Basis, Marital Status Basis, and Sexual Orientation
Basis) and the employment issue or issues that support the charge (Terms Issue, Hiring Issue,
70
I control for these characteristics to lessen any concerns that certain factors that could affect the outcome of a change
at the same time of this decision. I do not control for these characteristics in Equations (1) and (2), because I do not
believe they should affect the type of charge filed. In addition, I am interested in the total change in charge filings, not
the change controlling for whether an individual of a certain type filed a charge. However, if I include this information,
the results remain the same in size, significance, and direction.
71
The data includes also includes two digit NAICS codes for industry when available (23 industry categories, labeled
industry). However, because these codes are frequently missing, I only control for industry in specifications that I
estimated for robustness checks.
84
Demotion Issue, Discharge Issue, Wages Issue, and Discipline Issue). In the ADA analyses, X also
includes types of disability claims (Hearing Basis, Vision Basis, Mental Retardation Basis,
Physical Basis, and Alcohol or Drug Basis).72 X also includes whether the charge was filed in an
EEOC office (EEOC Office) as opposed to a state agency office. Table A in the Appendix provides
the means of each of these variables for each EEOC charge filed during the time period analyzed,
2007–2013.
Regression Results
The empirical results provide evidence that suggests that circuit court decisions affect the
filing of charges with the EEOC. Each analysis was conducted using Ordinary Least Squares
(“OLS”) estimations of Equations (1)–(4). Table 5 provides the DD and DDD estimates from the
estimations of Equations (1) and (3), which analyze the effect of the Fifth Circuit’s mixed-motive
standard on retaliation charges. Table 6 provides the DD and DDD estimates from the estimations
of Equations (2) and (4), which analyze the effect of the Seventh Circuit’s but-for standard on
ADA claims. Full results from these regressions are provided in Tables B and C of the Appendix.
There is evidence that the adoption of the mixed-motive standard in the Fifth Circuit
increased the share of charges that are retaliation charges. The results provided in Table 5 suggest
that the adoption of the mixed-motive standard increased the probability that a charge filed is a
retaliation charge by 1 percentage point. This result is statistically significant at the 5% level and
suggests a 3.1 percent increase. These results provide some evidence that the Supreme Court’s fear
of an increase in retaliation charges due to the adoption of a mixed-motive causation standard
could have been warranted.
72
None of these categories are exhaustive, however, they are the most common categories represented in the data and
the most relevant to this analysis. As a result, the omitted category in the data is simply all other issues, bases, or
disability type.
85
Table 6 provides evidence that the Seventh Circuit’s adoption of the but-for standard
decreased the percentage of ADA filings. In each specification where the Seventh Circuit’s
standard is analyzed, the coefficients on SeventhCircuit x PostSerwatka are negative and
statistically significant. The results suggest a 1.4 percentage point decrease, implying a 5.5 percent
decrease in ADA claims. These results suggests that the but-for causation standard adopted in the
Serwatka decision decreased ADA charges and that, therefore, Nassar could have decreased the
rate of retaliation charges filed with the EEOC. But, these results do not tell us whether the charges
that the mixed-motive standard increased and the but-for standard decreased were frivolous.
Tables 5 and 6 provide results that suggest that the charges that were affected by the
standards were frivolous charges. The results suggests that the mixed-motive standard increased
the probability that a retaliation charge receives a dismiss label by 4.1 percentage points. These
results are statistically significant and amount to increases of 34.2% in the rate of charges that are
considered frivolous. The fact that the standard did not increase no cause findings is not too
surprising, as often charges that receive a “C” label may not continue throughout the entire process.
Ultimately, these results suggest that the weak standard increased the probability that a charge was
considered frivolous.
There is also strong evidence that the adoption of the but-for standard decreased the
probability that an ADA charge received a dismiss label. The results suggest that the but-for
standard decreased dismiss labels by 4.5 percentage points and no cause findings by 1.3 percentage
points for ADA claims. These results translate into a decrease of 32.4% for dismiss labels and
2.2% for no cause findings. These results clearly indicate that this employer-friendly standard
decreased the percentage of frivolous charges filed. The difference in percentage effect for dismiss
86
labels and no cause findings is not surprising, because the majority of frivolous charges may not
ever reach this stage, and the majority of charges that reach this point receive a no cause finding.
Each of the results discussed above are robust when several characteristics of the estimated
specifications or samples are altered. Each of the specifications discussed above do not include
controls for industry because a large percentage of the observations (close to 50% of the sample
for the causation specifications) are missing an industry variable. Alternative specifications
include industry controls, and the results remained very similar in size, direction, and significance.
In addition, each of the Post variables was constructed such that the actual date of the decision
marks the beginning of the post period. Alternatively, it could be assumed that it takes several
months for a decision to affect filing behavior as the affected parties must learn of the change. In
alternative specifications, I alter the creation of these variables such that the post period does not
begin until three months after the decision and, in other specifications, until six months after the
decision. Again, this alteration does not change the significance, or direction of the coefficients.
To address additional changes were made to address concerns that the control group is generally
much larger than the affected circuit, I randomly drop circuits from the control group, and again,
the coefficients remained similar. In addition, the results provided that address the retaliation
causation standard are for estimations of each specification limited to charges filed after 2007;
however, limiting this analysis to charges filed after 2009 (the Gross decision) does not alter the
results.73
73
In addition, the relevant coefficients were not statistically significant in falsification tests in which the affected group
of charges was altered to a different type of charges or to different circuits.
87
IMPLICATIONS, EXPLANATIONS, AND CONCLUSIONS
Levy (2013) called for the Supreme Court to justify its fear of opening the litigation
floodgates with empirical evidence of a likely increase in litigation rates and empirical evidence
of a likely burden resulting from that increase.74 While he acknowledged that the need to protect
branches of government (which would include the EEOC and the executive branch) may justify
the Court’s fear, the empirical results (and strategy) provided in this chapter could also assist the
Court in answering Levy’s call. The evidence in this chapter suggests that the adoption of a strict
standard can decrease the filing of charges by up to 5%. As a result, when the Supreme Court
adopted the but-for standard in Nassar, it may have decreased the number of (likely frivolous)
charges by up to 1,500 charges a year.75 If one considers the full effect on the labeling of a charge,
the effect could be closer to a 30% decrease on the number of frivolous charges. This evidence
could also be relevant to Congress’s potential adoption of POWDA,76 which proposes the
expansion of the mixed-motive language found in Section 107 of Title VII to the ADA, ADEA,
and Title VII retaliation claims (Sherwyn et al. 2014).
The results that I presented in this chapter suggest a small increase in the probability that a
charge filed included a retaliation charge and a large increase in the likelihood that these charges
are without merit. This is not good news, as frivolous charges likely expend government and
potentially court resources and result in unfair settlements.77 In addition to evidence of a potential
increase in the number of charges, there is clear evidence that the probability that a retaliation
74
In this article, the author also recognized that when this fear was based on state courts it was justified in constitutional
doctrine.
75
This is 5% of the total number of retaliation charges filed during the analyzed time period divided by six years.
76
Protecting Older Workers Against Discrimination Act, H.R. 3721, 111th Cong. (2009), available at
http://www.govtrack.us/congress/billtext.xpd? bill=h111-3721.
77
However, there could also be benefits of such filings if one believes that EEOC charges have a deterrent effect
despite their merit.
88
charge received a dismiss label or a no cause finding increased due to the Fifth Circuit’s adoption
of the mixed-motive standard, suggesting that these charges were frivolous. This suggests that the
standard did increase the percentage of retaliation charges that the EEOC views as meritless. The
Fifth Circuit’s adoption of this standard was the only clear adoption of a mixed-motive standard
following Gross and it was the first adoption of a standard that did not require direct evidence;
however, other lower courts continued to apply a mixed-motive standard if direct evidence was
shown. The fact that this adoption was not a clear change, but it still had an effect on the labeling
of a charge, suggests that a clearer adoption of a liberal standard, such as the first adoption of a
mixed-motive standard could have an even greater effect.
It is also clear from the analysis that the decrease in ADA charges due to the Seventh
Circuit’s adoption of the but-for standard was a decrease in frivolous charges, as the probability
that a charge was labeled as likely to be dismissed by the EEOC decreased by upwards of 30%. It
has been proven through experimental evidence that a but-for causation standard can change the
outcome of lawsuits by decreasing the likelihood that a plaintiff prevails in trial or lowering the
damages they receive (Rupe et al. 2014; Sherwyn et al. 2010). As a result, it is not surprising that
such a strong standard can affect the filing behavior of individual parties. Overall, these results
suggest that the Supreme Court’s adoption of the but-for causation standard for Title VII retaliation
claims in Nassar likely did decrease the number of frivolous retaliation charges filed in all of the
circuits that had not adopted such a standard. While this hypothesis cannot be empirically tested
in this analysis because the case was decided in June 2013, the results suggest that such a standard
would likely decrease the total number of retaliation charges filed and decrease the probability that
the charges filed were considered frivolous by the EEOC.
89
Earlier in this chapter, I mentioned alternative considerations that could conflate this
analysis—the EEOC could consider circuit law and employers could react to a change in standards.
These results suggest that the EEOC does not follow relevant circuit law when labeling a charge
or finding cause. If the EEOC considered the but-for standard when labeling ADA claims in the
Seventh Circuit, then it should be more likely to label a charge likely to dismiss. If the EEOC
considered the mixed-motive standard in the Fifth Circuit, then it should be less likely to label a
charge likely to dismiss. The results contradict this potential consideration. In addition, the fact
that the Fifth Circuit’s mixed-motive standard did slightly increase the number of charges filed
suggests that employers did not respond to the liberal standard by changing policies and reducing
retaliation. However, the decrease in ADA charges following the Seventh Circuit’s adoption of the
but-for standard suggests that employers did not respond by lowering protections and increasing
retaliation in the workplace.78
One consideration that further complicates the results and could result in each of the
changes in the EEOC’s labeling process and cause findings is the EEOC altering behavior with
the desire to promote its own policies. The EEOC had adopted guidance supporting a
mixed-motive standard for retaliation charges under each statute well before these courts adopted
this standard. As a result, when the Seventh Circuit adopted the but-for standard, the EEOC could
have been less likely to label a charge likely to dismiss, as the results suggested. In addition, with
the hopes of changing the law following Gross, the EEOC may have been less likely to dismiss a
charge in circuits that were undecided. If this was the case, then this change could have also
affected the results suggesting an increase in frivolous charges in the Fifth Circuit. Recently, the
78
Of course, these results do not rule out this possibility as the change in filing behavior could have outweighed the
change in employer behavior that occurred.
90
EEOC’s behavior when promoting pregnancy discrimination claims and arrest record charges that
goes against federal court precedent in certain circuits suggests that the EEOC could act in such a
manner. I believe that the large effects on dismiss labels suggested by these results could be the
result of both of these mechanisms, but that it cannot be the result of just the EEOC’s change of
behavior.79 Such a change in behavior should only affect charges that the EEOC wishes to litigate,
and the EEOC litigates less than 300 charges a year. In addition, in a similarly constructed analysis,
I found that there was actually no evidence that the EEOC increased likely cause labels for ADA
claims following Serwatka.80 Ultimately, individual filing behavior was likely affected (as is
suggest by the empirical results of the but-for standard decreasing ADA and retaliation charge
filings) but the EEOC could also have reacted by promoting its policies.81
Both potential mechanisms of the results of this study, an increase in frivolous charges or
the EEOC’s promotion of its own polices, have negative consequences. When a liberal standard is
adopted, the EEOC should be less likely to label a charge a “C” charge because the standard favors
the employee. If instead the EEOC is more likely to label a charge frivolous, then a charge with
merit might not see its day in court. In addition, if the EEOC promotes its own policies by being
more likely to find merit in a charge in a circuit where the court is less likely to find merit, then
the EEOC greatly wastes resources as those charges may be filed in court only to be dismissed. As
79
While the results could be explained by both positions, the numbers actually align such that change in frivolous
charges can mostly be explained by a change in filing behavior (or fully in the Seventh Circuit). The increase in
retaliation charges and decrease in ADA charges can be fully explained by the change in frivolous charges. A 34.2%
increase in dismiss labels equates to an increase of approximately 597 charges in the Fifth Circuit, and a 32.4%
decrease in dismiss labels in the Seventh Circuit equates to a decrease of approximately 273 charges. In addition the
3.1% increase in retaliation charges equates to 409 charges in the Fifth Circuit, and the 5.5% decrease in ADA charges
also equates to a decrease of 409 charges.
80
In fact, there was evidence that the likely cause labels decreased following this adoption, perhaps because the EEOC
did consider how the relevant decision raised the standard. There was no evidence that the Fifth Circuit’s Xerox
decision affected the probability that a retaliation charge received a likely cause label.
81
The fact that the effect on labeling is much larger than the effect on number of charges suggests that some additional
shift in policy may explain this difference.
91
illustrated by the concerns of the Supreme Court and legal and economic scholars, an increase in
frivolous charges clearly wastes resources because they expend the EEOC’s resources when the
EEOC is required to investigate and attempt to mediate each charge and increase the possibility
that an unjust transfer of wealth occurs through settlement. Unfortunately, there is no Rule 11 that
prevents such a filing with the EEOC or any other federal agency.82
It is possible that these results depend on the decisions being analyzed. A but-for standard
is easily understood by judges as it is a very common standard for determining causation in tort
law cases (Wright 1985). Other standards such as the definitions of sexual harassment or an
adverse employment action may be more difficult for lower courts to implement, and thus, changes
in these standards may be less likely to affect EEOC behavior or the filing of frivolous charges by
an affected party. I leave this question to be answered by a later study. However, this chapter, as
the first empirical study of whether court decisions can affect the filing of frivolous lawsuits,
provides evidence that decisions can do just that; liberal decisions with “bite” are likely to increase
the presence of frivolous claims, and strict decisions are likely to decrease them. As a result, courts
may be warranted when they consider the consequences of frivolous suits and how their creation
of certain standards may affect them.
82
Rule 11 of the Federal Rules of Civil Procedure sanctions attorneys for making frivolous arguments in a complaint.
92
REFERENCES
Age Discrimination in Employment Act, 29 U.S.C. §§ 621–634.
Americans with Disabilities Act, 42 U.S.C. §§ 12101–12213.
Ashcroft v. Iqbal, 556 U.S. 662 (2009).
Bell Atl. Corp. v. Twombly, 550 U.S. 544 (2007).
Bennett, Honorable Mark W. 2013. “Essay: From the ‘No Spittin', No Cussin' and No Summary
Judgment" Days of Employment Discrimination Litigation to the "Defendant's Summary
Judgment Affirmed Without Comment’ Days: One Judge's Four-Decade Perspective.” New
York Law School Law Review 57: 685–717.
Bone, Robert G. 1997. “Modeling Frivolous Suits.” University of Pennsylvania Law Review 145:
519–604.
Burbank, Stephen B.; Sean Farhang, and Herbert M. Kritzer. 2014. “Private Enforcement of
Statutory and Administrative Law in the United States (and other common law countries).” In
PROCEDURAL JUSTICE, P. Gottwald & B. Hess (Eds.), pp. 197–318.
Burlington Industries, Inc. v. Ellerth, 524 U.S. 472 (1998).
Clermont, Kevin M. and Theodore Eisenberg. 2002. “Litigation Realities.” Cornell Law Review
88: 119–154.
Coleman, Major G., William A. Darity, Jr., Rhonda V. Sharpe. 2008. “Are Reports of
Discrimination Valid? Considering the Moral Hazard Effect.” American Journal of Economics
and Sociology 67(2): 149–175.
Curry, Steven. 2014. “After University of Texas Southwestern Medical Center v. Nassar,
Another Call to Congress to Restore Title VII's Protections.” Wisconsin Law Review 2014:
1001–1029.
Desert Palace, Inc. v. Costa, 539 U.S. 90, 123 S. Ct. 2148, 156 L. Ed. 2d 84 (2003).
Equal Employment Opportunity Commission, Enforcement & Litigation Statistics,
http://www.eeoc.gov/ eeoc/ statistics/ enforcement/index.cfm (last visited Oct 13 8, 2014).
(EEOC Litigation Statistics).
Faragher v. City of Boca Raton, 524 U.S. 775 (1998).
Gersham, Jacob. 2014. “EEOC Sues Less, but Tactics Draw Flak.” Wall Street Journal,
February 9, 2014.
93
Green, Michael Z. 2001. “Proposing a New Paradigm for EEOC Enforcement After 35 Years:
Outsourcing Charge Processing by Mandatory Mediation.” Dickinson Law Review 105: 305–
363.
Gross v. FBL Financial Services, Inc., 557 U.S. 167 (2009).
Guthrie, Chris. 2000. “Framing Frivolous Litigation: A Psychological Theory.” University of
Chicago Law Review 67: 163–216.
Hannon, Kendall W. 2008. “Much Ado About Twombly? A Study on the Impact of Bell Atlantic
Corp. v. Twombly on 12(b)(6) Motions.” Notre Dame Law Review 83(4): 1811–1846.
Katz, Avery. 1990. “The Effect of Frivolous Suits on the Settlement of Litigation.” International
Review of Law and Economics 10: 3–27.
Leegin Creative Leather Prods. v. PSKS, Inc., 551 U.S. 877, 895 (2007).
Lemos, Margaret H. 2010. “The Consequences of Congress's Choice of Delegate: Judicial and
Agency Interpretations of Title VII.” Vanderbilt Law Review 63(2): 363–435.
Levy, Martin K. 2013. “Judging the Flood of Litigation” University of Chicago Law Review 80:
1007–1077.
Macfarlane, Katharine A. 2011. “The Improper Dismissal of Title VII Claims on ‘Jurisdictional’
Exhaustion Grounds: How Federal Courts Require That Allegations Be Presented to an
Agency Without the Resources to Consider Them.” George Mason University Civil Rights
Law Journal 21:213–257.
Marchand, Neil J. 2009. “Where’s the Party: Do Class Action Plaintiffs Really Prefer State Court?”
George Washington Law School Working Paper.
Miceli, Thomas J. and Michael P. Stone. 2014. “ ‘Piggyback’ Lawsuits and Deterrence: Can
Frivolous Litigation Improve Welfare?” International Review of Law and Economics 39: 49–
57.
Moberly, Michael. 1997. “Proceeding Geometrically: Rethinking Parallel State and Federal
Employment Discrimination Litigation.” Whittier Law Review 18: 499–536.
Moss, Kathryn, Scott Burris, Michael Ullman, Matthew Johnsen, and Jeffrey Swanson. 2001.
“Unfunded Mandate: An Empirical Study of the Implementation of the Americans with
Disabilities Act by the Equal Employment Opportunity Commission.” University of Kansas
Law Review 50: 1–110.
94
Nielsen, Laura Beth Robert L. Nelson, and Ryon Lancaster. (2008). “Uncertain Justice: Litigating
Claims of Employment Discrimination in the Contemporary United States.” Researching Law
(American
Bar
Foundation,
Chicago,
Ill.)
1,
available
at
http://
www.americanbarfoundation.org/uploads/cms/ documents/rlspring08.pdf.
Polinsky, Mitchell and Daniel L. Rubinfeld. 1993. “Sanctioning Frivolous Suits: An Economic
Analysis.” Georgetown Law Journal 82: 397–435.
Powley, Susan Elizabeth. 1991. “Exploring A Second Level of Parity: Suggestions for Developing
an Analytical Framework for Forum Selection in Employment Discrimination Litigation.”
Vanderbilt Law Review 44(3): 641–688.
Price Waterhouse v. Hopkins, 490 U.S. 228 (1989).
Protecting Older Workers Against Discrimination Act, H.R. 3721, 111th Cong. (2009), available
at http://www.govtrack.us/congress/billtext.xpd? bill=h111-3721.
Rosenberg, David and Steven Shavell. 1985. “A Model in Which Suits Are Brought for Their
Nuisance Value.” International Review Law and Economics 5: 3–13.
Rupe, Alan Jason Stitt, and Mark Kanaga. 2014. “U.S. Supreme Court Clarifies the Plaintiff's
Burden of Proof in Title VII Retaliation Actions.” Journal of Kansas Bar Association, 24–29.
Schlesinger, Lisa. 2014. “The Social Model's Case for Inclusion: ‘Motivating Factor’ and ‘But for’
Standards of Proof Under the Americans with Disabilities Act and the Impact of the Social
Model of Disability on Employees with Disabilities. Cardozo Law Review 35: 2115–2145.
Seiner, Joseph A. 2009. “The Trouble with Twombly: A Proposed Pleading Standard for
Employment Discrimination Cases.” University of Illinois Law Review 2009(4): 1011–1060.
Selmi, Michael. 2001. “Why Are Employment Discrimination Cases So Hard to Win?” Louisiana
Law Review 61(3): 555–575.
Serwatka v. Rockwell Automation, Inc., 591 F.3d 957 (7th Cir. 2010).
Sherwyn, David, Michael Heise, Zev J. Eigen. 2014. “Experimental Evidence that Retaliation
Claims Are Unlike Other Employment Discrimination Claims.” Seton Hall Law Review 44:
455–504.
Sperino, Sandra F. and Suja A. Thomas. 2014. “Fakers and Floodgates.” Stanford Journal of Civil
Rights and Liberties 10:223–250.
Tananbaum, Robert. 2013. “Grossly Overbroad: The Unnecessary Conflict over Mixed Motives
Claims in Title-VII Anti-Retaliation Cases Resulting From Gross v. FBL Financial Services.”
Cardozo Law Review 34(3):1129–1161.
95
Title VII of the Civil Rights Act, 42 U.S.C. § 2000e.
Univ. of Texas Sw. Med. Ctr. v. Nassar, 133 S. Ct. 2517, 2531–2532 (2013).
Wright, Richard W. 1985. “Causation in Tort Law.” California Law Review 73: 1735—1828.
96
Figure 1. Illustration of the Seventh Circuit’s But-For ADA Causation Standard
2007
First
Circuit
Second
Circuit
Third
Circuit
Fourth
Circuit
Fifth
Circuit
Seventh
Circuit
2008
2009
2010
2011
2012
2013
Serwatka v.
v. Rockwell
Automation,
Inc.
Eighth
Circuit
Ninth
Circuit
DC Circuit
Notes: The dark grey represents the but-for causation standard, and the white represents the mixed-motive
standard under Price Waterhouse or uncertainty.
97
Figure 2. Illustration of the Fifth Circuit’s Mixed-Motive Retaliation Causation Standard
2007
First
Circuit
Second
Circuit
Third
Circuit
Fourth
Circuit
Fifth
Circuit
2008
2009
2010
2011
2012
2013
Nassar
Smith v.
Xerox
Corporation
Sixth
Circuit
Eighth
Circuit
Ninth
Circuit
Tenth
Circuit
Eleventh
Circuit
DC Circuit
Notes: The dark crosshatch represents the strictest but-for standard adopted by the Supreme Court in Nassar,
the grey represents the mixed-motive requirement of direct evidence or uncertainty, and the white represents
the Fifth Circuit’s standard that mixed-motive cases do not require direct evidence.
98
Table 1. Summary Statistics of the Impact of the
Seventh Circuit’s Mixed-Motive Standard on Retaliation Charges
Fifth Circuit
Not Fifth Circuit
All
Pre
Post
Pre
Post
Circuits
Xerox
Xerox
Xerox
Xerox
.321
.347
.310
.325
.320
Retaliation
[13,185] [14,872]
[71,106]
[77,899]
[177,084]
Charge
(41,077) (42,858) (229,675) (239,761) (553,439)
.150
.193
.099
.120
.119
Dismiss
(40,909)
(42,449)
(229,182)
(238,110)
(550,650)
Label
Retaliation
.133
.212
.095
.124
.120
Charge
(13,133) (14,763)
(71,010)
(77,483)
(176,389)
No
.159
.183
.100
.118
.118
Retaliation
(27,776) (27,686) (158,172) (160,627) (374,261)
.754
.787
.728
.751
.744
No Cause
(36,094) (35,929) (201,512) (201,889) (475,424)
Finding
Retaliation
.749
.793
.717
.750
.740
Charge
(11,076) (12,022)
(60,463)
(63,624)
(147,185)
No
.755
.784
.733
.751
.746
Retaliation
(25,018) (23,907) (141,049) (138,265) (328,239)
Source: EEOC Charge Data, 2007–2013 (Nassar), all Circuits but the Sixth.
Notes: All duplicates have been dropped. For the No Cause Finding statistics,
all charges that were dismissed because there was no jurisdiction, because the
charging party asked for a right to sue letter, or because the charging party failed
to respond were also dropped.
99
Table 2. Summary Statistics of the Impact of the Seventh Circuit’s
But-For Causation Standard on ADA Charges
Seventh Circuit
Not Seventh Circuit
All
Pre
Post
Pre
Post
Circuits
Serwatka Serwatka Serwatka Serwatka
.249
.276
.229
.271
.253
[7,451]
[8,620]
[36,093]
[51,232]
[103,194]
ADA Charge
(29,924)
(31,232)
(157,610) (189,047) (407,881)
.132
.237
.123
.145
.143
Dismiss
(29,879)
(31,113)
(157,012)
(187,510)
(405,581)
Label
ADA
.113
.158
.121
.113
.120
Charge
(7,451)
(8,603)
(35,970)
(50,764)
(102,788)
No ADA
.138
.266
.124
.156
.150
(22,428)
(22,510)
(121,066) (136,789) (302,793)
.705
.772
.733
.757
.745
No Cause
(26,655)
(27,748)
(137,751) (157,203) (349,399)
Finding
ADA
.679
.721
.714
.720
.715
Charge
(6,653)
(7,556)
(31,382)
(41,945)
(87,536)
No ADA
.713
.791
.739
.771
.755
(20,002)
(20,192)
(106,386) (115,283) (261,863)
Source: EEOC Charge Data, 2007–2013, all circuits but the Sixth, Tenth, and
Eleventh.
Notes: All duplicates have been dropped. For the No Cause Finding statistics, all
charges that were dismissed because there was no jurisdiction, because the
charging party asked for a right to sue letter, or because the charging party failed
to respond were also dropped.
100
Table 3. DDD Estimates of the Impact of the Seventh Circuit’s
Mixed-Motive Standard on Retaliation Charges
Variable of Interest: Dismiss Labels
Circuit \Time Period
A. Treated Group: Fifth Circuit
Retaliation Charges
Non Retaliation Charges
Location Difference at Time
Difference-in-Difference
B. Control Group: All Other
Circuits (Less 7th)
Retaliation Charges
Non Retaliation Charges
Location Difference at Time
Difference-in-Difference
Pre
Xerox
Post
Xerox
Difference over
Time
0.133
[13,133]
0.159
[27,776]
0.212
[14,763]
0.183
[27,686]
0.079
-0.026
0.055
.029
0.055
0.095
[71,010]
0.100
[158,172]
-0.005
0.011
0.124
[77,483]
0.118
[160,627]
0.006
-0.029
0.024
-0.018
0.011
DDD
0.044
Source: EEOC Charge Data, 2007–2013, all circuits but the Sixth
Notes: Means of DismissLabel are reported and the number of observations for each cell
are reported in brackets.
101
Table 4. DDD Estimates of the Impact of the Seventh Circuit’s
But-For Standard on ADA Charges
Variable of Interest: Dismiss Labels
Circuit \Time Period
A. Treated Group: Seventh Circuit
ADA Charges
Non ADA Charges
Location Difference at Time
Difference-in-Difference
B. Control Group: All Other Circuits
(Less 6th, 10th,and 11th)
ADA Charges
Non ADA Charges
Location Difference at Time
Difference-in-Difference
Pre
Serwatka
Post
Serwatka
Difference
over Time
0.113
[7,451]
0.138
[22,428]
0.158
[8,603]
0.266
[22,510]
0.045
-0.025
-0.083
-0.108
0.121
[35,970]
0.124
[121,066]
-0.003
-0.040
0.113
[50,764]
0.156
[136,789]
-0.043
0.128
-0.008
0.032
DDD
-0.043
Source: EEOC Charge Data, 2007–2013, all circuits but the Sixth, Tenth, and Eleventh.
Notes: Means of DismissLabel are reported and the number of observations for each cell
are reported in brackets.
102
Table 5. Estimates from OLS Regressions Estimating the Effect of the Fifth Circuit’s
Mixed-Motive Causation Standard on Retaliation Charges
Retaliation
Dismiss
No Cause
Charge
Label
Finding
(1)
(2)
(3)
DD Analysis
FifthCircuit*PostXerox
0.010**
(0.004)
DDD Analysis
FifthCircuit*PostXerox*
0.041***
0.001
RetaliationCharge
(0.004)
(0.006)
Number of Observations
550,337
501,671
434,337
Source: EEOC Charge Data, 2007–2013, all circuits but the Seventh.
Notes: *, **, *** indicate significance at the 10, 5, and 1 percent levels. Robust
standard errors clustered by circuit are reported in parentheses and the numbers
of observations are reported in brackets. The coefficients reported in each row
panel and each column are from individual regressions. Each regression
presented includes the controls presented in columns 1, 2, and 3 respectively of
Table A in the Appendix. All duplicates have been dropped. For the No Cause
Finding regressions, all charges that were dismissed because there was no
jurisdiction, because the charging party asked for a right to sue letter, or because
the charging party failed to respond were also dropped.
103
Table 6. Estimates from OLS Regressions Estimating the Effect of the Seventh Circuit’s But-For
Causation Standard on ADA Charges
ADA
Charge
(1)
DD Analysis
SeventhCircuit x Post Serwatka
Dismiss
Label
(3)
No Cause
Finding
(3)
-0.014**
(0.0005)
DDD Analysis
SeventhCircuit x Post Serwatka
-0.045***
-0.013***
X ADA Charge
(0.007)
(0.006)
Number of Observations
405,372
368,268
318,045
Source: EEOC Charge Data, 2007–2013, all circuits but the Sixth, Tenth, and Eleventh.
Notes: *, **, *** indicate significance at the 10, 5, and 1 percent levels. Robust standard
errors clustered by Circuit are reported in parentheses and the numbers of observations are
reported in brackets. The coefficients reported in each row panel and each column are from
individual regressions. Each regression includes the controls presented in columns 2 and 3
respectively of Table A in the Appendix. All duplicates have been dropped. For the No
Cause Finding regressions, all charges that were dismissed because there was no
jurisdiction, because the charging party asked for a right to sue letter, or because the
charging party failed to respond were also dropped.
104
APPENDIX
Table A: Descriptive Statistics
All
ADA
Variable
Charges
Charges
Dismiss Label
0.126
0.108
[611,408]
[151,118]
No Cause Finding
0.659
0.633
[597,689]
[146,623]
ADA Basis
0.247
-Retaliation Basis
0.368
0.307
Race Basis
0.355
0.137
Sex Basis
0.297
0.122
NO Basis
0.113
0.042
Age Basis
0.228
0.192
Pay Female Basis
0.009
0.003
Pay Male Basis
0.0008
0.0003
Marital Basis
0.00005
0.00
Sex Orientation Basis
0.00002
0.00004
Religion Basis
0.037
0.021
Arrest Conviction Basis
0.00004
0.00
Color Basis
0.027
0.013
Sexual Harassment Basis
0.084
0.020
Asian
0.023
0.016
Black
0.407
0.257
Indian
0.009
0.011
Other Race (not white)
0.013
0.009
Eastern NO
0.004
0.002
Arab NO
0.008
0.004
Hispanic NO
0.055
0.045
Mexican NO
0.033
0.028
African NO
0.020
0.010
Female
0.548
0.518
Age
44.54
46.04
Terms Issue
0.244
0.215
Hiring Issue
0.059
0.059
Demotion Issue
0.031
0.027
Discharge Issue
0.545
0.593
Wages Issue
0.061
0.031
Discipline Issue
0.134
0.124
Education Employer
0.049
0.053
Federal Gov’t Employer
0.0007
0.0001
State Gov’t Employer
0.100
0.114
EEOC Office
0.982
0.981
Hearing Basis
0.008
0.030
Vision Basis
0.006
0.023
Mental Retardation Basis
0.002
0.007
Alcohol or Drug Basis
0.003
0.012
Number of Observations
614,358
105
151,803
Retaliation
Charges
0.123
[225,043]
0.630
[219,331]
0.161
-0.338
0.355
0.118
0.160
0.009
0.00006
0.00004
0.0004
0.045
0.00
0.036
0.154
0.027
0.408
0.010
0.013
0.005
0.010
0.058
0.035
0.022
0.586
43.40
0.317
0.029
0.037
0.547
0.064
0.192
0.055
0.00009
0.119
0.983
----225,867
Table B. The Effect of the Fifth Circuit’s Mixed-Motive
Causation Standard on Retaliation Charges
Retaliation
Dismiss
Variable
Charge
Label
(1)
(2)
FifthCircuit x PostXerox
0.041***
x RetaliationCharge
(0.004)
FifthCircuit x PostXerox
0.010**
0.005
(0.004)
(0.005)
Post Xerox
-0.007
-0.004
(0.004)
(0.008)
Retaliation Charge
-0.001
(0.004)
Post Xerox x Retaliation Charge
0.008*
(0.004)
Fifth Circuit x Retaliation Charge
-0.016***
(0.004)
Fifth Circuit
0.071***
0.102***
(0.002)
(0.004)
Race Any Basis
-0.015***
(0.003)
Sex Any Basis
-0.009***
(0.002)
NO Any Basis
0.000
(0.006)
Age Basis
-0.015***
(0.002)
Pay Female Basis
-0.041***
(0.005)
Pay Male Basis
0.005
(0.015)
Marital Status Basis
-0.050***
(0.013)
Sex Orientation Basis
-0.034
(0.023)
Religion Basis
0.025**
(0.011)
Arrest Conviction Basis
0.004
(0.018)
Color Basis
0.023***
(0.005)
Sexual Harassment Basis
-0.051***
(0.004)
ADA Charge
-0.033***
(0.004)
Asian
-0.003
(0.010)
Black
0.022***
(0.005)
Indian
0.035***
106
No Cause
Finding
(3)
0.001
(0.006)
0.008
(0.005)
0.001
(0.006)
-0.008
(0.006)
0.008
(0.006)
0.013
(0.007)
0.014***
(0.004)
0.033***
(0.004)
0.004
(0.005)
0.028***
(0.006)
0.012***
(0.003)
-0.011
(0.012)
0.039
(0.022)
-0.279***
(0.024)
-0.141
(0.094)
-0.001
(0.006)
-0.800***
(0.019)
-0.002
(0.008)
-0.086***
(0.007)
-0.029***
(0.002)
-0.025
(0.014)
0.022***
(0.004)
0.026***
Other Race
Eastern NO
Arab NO
Hispanic NO
Mexican NO
African NO
Female
Age
Terms Issue
Hiring Issue
Demotion Issue
Discharge Issue
Wages Issue
Discipline Issue
Education Employer
Federal Gov’t Employer
State Gov’t Employer
EEOC Office
Constant
0.230***
(0.004)
(0.009)
-0.010
(0.006)
0.005
(0.013)
0.012
(0.022)
0.002
(0.008)
0.011**
(0.004)
-0.016
(0.013)
-0.009***
(0.002)
0.001***
(0.000)
-0.039***
(0.005)
-0.051***
(0.006)
-0.039***
(0.004)
-0.003
(0.003)
-0.046***
(0.007)
-0.019***
(0.001)
0.007**
(0.003)
-0.147***
(0.025)
0.014**
(0.005)
0.090***
(0.013)
-0.039*
(0.020)
(0.007)
-0.008
(0.010)
0.029**
(0.013)
-0.005
(0.014)
0.013
(0.008)
-0.002
(0.007)
0.010
(0.014)
-0.009**
(0.003)
-0.000
(0.000)
-0.020***
(0.003)
0.020**
(0.007)
-0.030***
(0.005)
0.038***
(0.003)
-0.038***
(0.006)
0.024***
(0.003)
0.044***
(0.005)
0.330***
(0.021)
0.066***
(0.005)
-0.016
(0.022)
0.715***
(0.020)
Number of Observations
550,337
501,671
434,337
R-Squared
0.004
0.029
0.021
Source: EEOC Charge Data, 2006–2013, all circuits but the Sixth.
Notes: *, **, *** indicate significance at the 10, 5, and 1 percent levels. Robust standard
errors clustered by Circuit are reported in parentheses. Each regression controls for year
and circuit fixed effects. Indicators for whether a charge did not include race or national
origin are included.
107
Table C. The Effect of the Seventh Circuit’s But-For Causation Standard on ADA Charges
Retaliation
Dismiss
No Cause
Variable
Charge
Label
Finding
(1)
(2)
(3)
SeventhCircuit x Post Serwatka
-0.014**
0.094***
0.048***
(0.005)
(0.009)
(0.006)
SeventhCircuit x Post Serwatka
-0.045***
-0.013**
x ADACharge
(0.007)
(0.004)
ADA Charge
-0.015***
-0.016***
(0.004)
(0.002)
Post Serwatka
0.002
-0.001
0.005
(0.002)
(0.013)
(0.010)
Seventh Circuit
-0.045***
0.093***
-0.016***
(0.003)
(0.006)
(0.004)
Post Serwatka x ADACharge
-0.037***
-0.023***
(0.005)
(0.003)
SeventhCircuit x ADACharge
-0.025***
-0.008**
(0.005)
(0.003)
Hearing Basis
-0.028***
-0.028**
(0.004)
(0.012)
Vision Basis
-0.024**
-0.031***
(0.007)
(0.007)
Mental Retardation Basis
0.007
-0.018
(0.010)
(0.017)
Alcohol or Drug Basis
0.011*
0.019
(0.006)
(0.014)
Race Basis
-0.016**
0.033***
(0.005)
(0.004)
Sex Basis
-0.013**
0.000
(0.004)
(0.002)
NO Basis
0.004
0.033***
(0.008)
(0.007)
Age Basis
-0.005
0.014***
(0.008)
(0.003)
Pay Female Basis
-0.043***
-0.011
(0.004)
(0.015)
Pay Male Basis
0.016
0.060**
(0.018)
(0.026)
Marital Basis
-0.042*
-0.264***
(0.020)
(0.037)
Sex Orientation Basis
-0.007
-0.178
(0.027)
(0.116)
Religion Basis
0.031*
0.004
(0.014)
(0.006)
Color Basis
0.027***
-0.001
(0.005)
(0.006)
Sexual Harassment Basis
-0.058***
-0.092***
(0.005)
(0.005)
Retaliation Charge
0.002
-0.001
(0.003)
(0.004)
108
Asian
0.002
-0.023
(0.014)
(0.017)
Black
0.028**
0.027***
(0.009)
(0.008)
Indian
0.038**
0.017
(0.014)
(0.012)
Other Race
-0.001
-0.008
(0.008)
(0.013)
Eastern NO
0.001
0.034**
(0.015)
(0.013)
Arab NO
0.029
-0.011
(0.026)
(0.016)
Hispanic NO
0.015
0.020
(0.009)
(0.011)
Mexican NO
0.019**
0.005
(0.006)
(0.011)
African NO
-0.001
0.021**
(0.012)
(0.007)
Female
-0.007**
-0.011***
(0.003)
(0.003)
Age
0.001**
0.000
(0.000)
(0.000)
Terms Issue
-0.040***
-0.022***
(0.006)
(0.004)
Hiring Issue
-0.068***
0.015
(0.013)
(0.011)
Demotion Issue
-0.047***
-0.038***
(0.006)
(0.007)
Discharge Issue
-0.010
0.029***
(0.009)
(0.008)
Wages Issue
-0.059***
-0.039***
(0.012)
(0.009)
Discipline Issue
-0.021***
0.021***
(0.002)
(0.004)
Education Employer
0.006
0.039***
(0.004)
(0.007)
Federal Gov’t Employer
-0.175***
0.304***
(0.031)
(0.028)
State Gov’t Employer
0.018**
0.068***
(0.007)
(0.006)
EEOC Office
0.096***
-0.000
(0.019)
(0.033)
Constant
0.287***
-0.072**
0.686***
(0.004)
(0.027)
(0.030)
Number of Observations
405,372
368,268
318,045
R-Squared
0.007
0.034
0.023
Source: EEOC Charge Data, 2007—2013, all circuits but the Sixth, Tenth, and Eleventh.
Notes: *, **, *** indicate significance at the 10, 5, and 1 percent levels. Robust standard
errors clustered by Circuit are reported in parentheses. Each regression controls for year
and circuit fixed effects. Indicators for whether a charge did not include race or national
origin are included.
109
CHAPTER III
THE EEOC’S POSITIVE EFFECT ON REDUCING THE WHITE/BLACK
WAGE GAP
INTRODUCTION
“The EEOC has been widely viewed as ineffective since its inception” (McCormick 2009).
This statement is the prevailing attitude found in legal analyses of the Equal Employment
Opportunity Commission (“EEOC”), and it is also the sentiment of national media (Wall Street
Journal Sept. 11, 2013). Title VII of the Civil Rights Act of 1964 made it illegal to discriminate
against employees based on sex, race, national origin, color, and religion. Title VII also created
the EEOC, an administrative agency tasked with monitoring employment discrimination by
managing all charges of such discrimination.83 Critics of the agency point to the inefficiencies and
ineffectiveness of the agency as the result of a system flawed at inception. Generally, these
critiques are founded in theoretical and anecdotal arguments, and the primary sources of data
supporting the arguments are summary statistics on the persistent, large backlog of charges that
have not been resolved. This chapter introduces empirical evidence that shows some success for
the EEOC in the beginning of the twenty-first century: specifically, a higher rate of race charges
filed within an industry and state leads to higher wages for black male employees in that industry
and state and decreases in the white/black wage gap following that action.
The EEOC’s procedural mandate is described in Section 706 of Title VII. 84 This section
mandates that each discrimination claim filed under Title VII be first filed with and reviewed by
the EEOC. Unlike other enforcement agencies, the EEOC cannot promulgate regulations to
83
Today, the EEOC also handles age discrimination charges (under the Age Discrimination in Employment Act),
disability discrimination and accommodation charges (under the Americans with Disability Act), and charges alleging
unequal pay due to gender (under the Equal Pay Act).
84
Now codified in 42 U.S.C 2000e-5(f).
110
attempt to decrease discrimination in the workplace. Instead, the EEOC’s power to affect
discrimination in the workplace rests with its investigations and conciliation attempts of each
charge and its ability to litigate certain charges. However, it is not clear that these processes
actually reduce potential discriminatory acts. This chapter provides evidence of whether the risk
of liability for discriminatory acts or potential exposure as a firm that discriminates decreases the
white/black wage gap, which is often associated with discrimination. I proxy for this risk with the
rate of race charges filed against a firm in an industry and a specific state and with the EEOC’s
litigation of a claim.
Some empirical analyses of the agency’s deterrent effect have been performed (see, e.g.,
Beller 1978; Wilhem 2002; Hirsh 2009), either finding no deterrent effect or recently finding an
improvement for black females in wages or occupational segregation. Recent analyses have
focused on the effect of EEOC action on gender disparities; however, this chapter focuses on the
effect of EEOC action on the white/black wage gap. This chapter updates these previous analyses
by using more recent data, constructing the action measure by industry and state, and analyzing
the additional effect of EEOC litigation and the merit of the charge filed as determined by the
EEOC. While I cannot provide direct evidence that the EEOC is efficient or effective, I do provide
some evidence of EEOC success and the first evidence that EEOC action may decrease the
white/black wage gap for men.
I begin this chapter by describing the literature that has analyzed whether
nondiscrimination laws, including Title VII, have improved employment outcomes for employees
that are protected under such statutes and the literature that has studied the deterrent effect of the
actions of federal agencies. In particular, I discuss previous analyses that directly analyzed the
EEOC’s effectiveness soon after the adoption of Title VII and more recently. I then discuss the
111
EEOC, its roles, and its powers that have the potential to deter discrimination in the workplace.
Next, I discuss the data that I use to construct rates of EEOC action, how these rates vary by
industry and state, and the empirical analysis, which utilizes individual wage equations to isolate
the impact of the EEOC. I conclude by presenting the results of the empirical analysis and the
implications of the results.
PREVIOUS ANALYSES OF NONDISCRIMINATION LAWS AND THE EEOC
Measuring the Impact of Nondiscrimination Laws on Employment Outcomes
Scholars have studied the impact of civil rights laws on employment outcomes of minority
individuals since the federal government adopted the Civil Rights Act in 1964. Following the
adoption of the Civil Rights Act, studies attempted to measure the effect of Title VII and its
provisions on employment outcomes of minorities. Most of these studies were time-series studies
that analyzed the changes that occurred after the law was passed in 1964 and controlled for other
time trends (Brown 1982). These studies found mixed results, likely because of two competing
consequences of the Title VII requirements: Title VII increased the cost of employing a member
of a protected class, by increasing the likelihood of liability, which could decrease employment,
but it also increased the penalty for discrimination, which could increase employment (Hersch and
Shinall 2015).
Additional studies have specifically linked Title VII litigation to employment benefits for
employees of protected classes and to other labor market outcomes. Leonard (1984) analyzed the
effect of class action litigation filed under Title VII in a state and industry on the number of
minority employees in certain occupations. Leonard (1984) found that litigation regarding race
discrimination increased the number of black employees, specifically black women, in certain
occupations during 1960s and 1970s. Hersch (1991) analyzed how publicized employment
112
litigation between 1964 and 1986, including litigation brought by the EEOC, negatively affected
firm profitability, finding that such litigation did decrease stock values in the short run. More
recently, Skaggs (2008) indirectly analyzed the impact of Title VII by analyzing the effect of
high-profile employment discrimination litigation on labor market outcomes (women in
supermarkets). Skaggs (2008) found that litigation filed during 1983–1998 against specific
supermarket corporations did reduce the presence of male/female occupational segregation in the
supermarket industry in general, suggesting that such litigation does not only affect the firm
involved in the case.
The Deterrent Effect of Other Agencies
While not directly related to employment discrimination, several scholars have analyzed
the effect of other federal administrative agencies tasked to improve certain outcomes. Much like
the EEOC, these agencies often investigate potential violations, and these investigations or
findings of a violation have been found to deter negative actions in firms within the industry or
state where the agency was active. In particular, the Occupational Safety and Health
Administration (“OSHA”) monitors working conditions such that injuries and fatalities on the job
decrease. OHSA frequently investigates firms and fines those that violate any regulations and do
not properly report injury statistics. Several early studies found that firm-specific or industryspecific OSHA inspections statistically significantly decreased injuries in that firm or industry
during the late 1970s and early 1980s by upwards of 20% (Viscusi 1986; Gray and Scholtz 1993).
However, Gray and Mendeloff (2005) found that the effect fell to 11% in the late 1980s and was
113
no longer present in the 1990s. These studies also found that inspections where penalties are levied
had a greater effect than those without.
Scholars have also studied the deterrent effect of the Environmental Protection
Agency (“EPA”), which is tasked with improving environmental conditions, partially by
decreasing the amount of pollution emitted by firms. These studies also analyzed the impact of
investigations and fines. While many of these studies looked at the impact of an inspection on a
specific firm’s or plant’s pollution rates (Gray and Shadbegian 2008), others looked at the effect
more broadly. For example, Shimshack and Ward (2005) found that a fine or an inspection on any
firm in a jurisdiction led to statistically significant decreases in emissions from other firms in that
jurisdiction. While the EEOC cannot directly fine a firm for employment discrimination, its
investigations can lead to costly outcomes, including damages awarded following litigation. As a
result, scholars have also examined the effect of the EEOC on employment outcomes for minorities.
The Effect of the EEOC on Employment Outcomes
The first study to empirically analyze the impact of the EEOC was Freeman (1973), finding
a decrease in the white/black wage gap of 15% for males and 27% for females when the total of
EEOC expenditure per black worker (or a larger EEOC budget) increased. However, this study
was soon contradicted by Butler and Heckman (1977) who attributed this increase to an increase
in real benefits with the adoption of programs such as the Aid to Families with Dependent Children
(“AFDC”). Butler and Heckman found no effect of EEOC expenditure on the wages of black
employees once they controlled for this increase.
Beller (1978) was the first study to directly analyze EEOC action through measuring the
EEOC’s presence by the rate of the total number of discrimination charges filed with the EEOC to
the total number of employees within a state during 1966–1970. Beller used EEO-1 records to
114
match EEOC action in a state to covered firms.85 Beller also did not find a positive effect of the
EEOC on black employment outcomes, including wages, during the late 1960s and early 1970s.
Two recent studies have updated this earlier analysis with more recent data and slightly different
techniques. Hirsh (2009) matched EEOC discrimination charge data to EEO-1 records to see
whether firms with high levels of charges responded to the charges by improving workplace sex
and race occupational segregation.86 Hirsh found that EEOC enforcement, measured by the dollar
amount of an EEOC settlement for any Title VII charges filed between 1991 and 2002, did not
have a direct effect by reducing the firm’s sex segregation, but that instead, the industry-level
enforcement had an indirect effect on other firms in the industry. Hirsh found no improvements in
race segregation.
The analysis performed in this chapter closely resembles the analysis found in
Wilhem (2002). Wilhem (2002) analyzed individual wage equations for the time period, 1988–
1996 and found that black women in industries with more EEOC charges alleging sex
discrimination had higher wages than those in industries with lower charges. Wilhem did not find
an effect for race charges and did not analyze the wages of men. In this chapter, I expand and alter
this analysis in several ways. Firstly, this chapter examines data from 2002–2008 and focuses on
race discrimination, including the wage gap between white and black males. In addition, Wilhem
analyzed the total number of race charges filed against an industry, whereas, I analyze the rate of
race charges per 100,000 employees in an industry and state to isolate a measure of the risk of
incurring the costs associated with responding to an EEOC charge. In addition, this is the first
study to analyze EEOC action by industry and state with the assumption that firms may be more
85
Each employer with more than 100 employees must file EEO-1 records with the EEOC each year. These forms
are meant to provide information about the employment of individuals protected under the nondiscrimination laws.
86
Hirsh (2009) analyzed a 1% random sample of the firms that filed EEO-1 forms.
115
aware of these charges than charges filed nationally in their industry or charges filed in their state
against any industry. An additional benefit of my analysis is that due to the construction of the
wage equations, which are not limited to black employees, I can examine the effect of EEOC action
on the white/black wage gap. This is also the first analysis of the effect of litigation filed by the
EEOC and the first to analyze the effect of certain types of charges filed, including those that the
EEOC views as meritless and those that the charging party files in federal court before the EEOC
completes its administrative process. In the following section, I discuss these different types of
charges, the EEOC’s ability to litigate a claim, and why these charges may or may not be expected
to deter potentially discriminatory actions, such as a difference in pay by minority status.
THE EEOC AND THE ENFORCEMENT OF TITLE VII
Under Section 706 of Title VII of the Civil Rights Act, any individual with a claim of
employment discrimination must first file the claim with the EEOC, and then the EEOC must
investigate each charge of employment discrimination before it can be filed in federal court.
Approximately 100,000 charges are filed with the EEOC each year, and as reported in Table 1,
almost 30,000 of these include a charge of race discrimination. Two characteristics of these charges
make it likely that they not only directly deter potentially discriminatory acts of the responding
employer, but also indirectly deter acts of other employers in the industry and state: the charges
are costly, with the potential to result in litigation and reputational harm, and the charges are
frequently publicized.
Although, it is generally understood that a number of meritless charges are filed with the
EEOC, and according to the EEOC statistics that are publically available, only 20% of such
charges result in some kind of conciliation, mediation, or litigation, any potentially offending
employer is required to respond to every charge (no matter the merit of the charge) filed against
116
them with the EEOC. These costs include completing a position statement in response to every
charge filed, hiring an attorney to complete the EEOC’s required mediation process, and
complying with investigations, which include detailed discovery requests. It is possible that these
costs alone are enough to explain a potential deterrent effect of EEOC charges. However, as the
merit of the charge increases, these charges can also result in costly settlements and litigation.
Charges that result in settlement during the EEOC process are often quite costly. Generally,
if the opposing parties settle a charge during the EEOC process, the monetary benefits average
around $19,000 (Hirsh 2009), however, those publicized are almost always much larger,
approaching hundreds of thousands of dollars. For example, on the EEOC recently publicized a
$95,000 settlement against a Memphis, TN company for racial harassment.87 These settlements
can also include injunctions and enjoinments, often requiring the employer to develop a certain
policy or reinstate the employment of a charging party who was fired due to discriminatory
reasons. The EEOC also releases quarterly statements of major settlements, which are publicized
on their website.
Approximately one-fifth of the charges filed with the EEOC are subsequently filed in
federal court (Selmi 2001). Of course, charges that are filed in court have the potential to generate
large costs. Under Title VII of the Civil Rights Act, an employee alleging discrimination (either
disparate impact or disparate treatment) under Title VII can always recover equitable relief such
as back pay and attorney’s fees, and the court can also issue injunctions and can force the employer
to correct the discriminatory act.88 In addition, following the Civil Rights Act of 1991, if the
charging party alleges intentional discrimination, the charging party can also recovery
compensatory damages of a limited amount for pain and suffering and emotional loss, and if the
87
88
This article on Skanska USA is available at http://www.eeoc.gov/eeoc/newsroom/release/1-29-15.cfm.
42 U.S.C. 2000e.
117
charging party shows “malice” or “reckless indifference,” the charging party can also recover a
limited amount of punitive damages (Johnson 1994). As reported in Van der Veer (2005),
employment discrimination litigation, even for a single plaintiff, has resulted in awards of tens of
millions of dollars, and class action litigation, has the potential to result in awards of hundreds of
millions.
Under the Civil Rights Act of 1991, after investigating a charge and attempting to conciliate
a charge that the EEOC believes has merit, the EEOC “may bring a civil action against any
respondent not a government.”89 While the EEOC only represents at most 400 charging parties per
year in litigation, these cases are generally highly publicized and they have the ability to result in
large damages and in injunctions and enjoinments. EEOC settlement and award amounts published
on the EEOC’s “Newsroom” website since October 2009 range from several thousand dollars to
240 million dollars. These injunctions and enjoinments can directly affect employment
discrimination, and damages can indirectly affect employment discrimination by deterring such
actions not only in the one firm, but also, in other firms that become aware of the action.
One way that other firms can become aware of EEOC action is through the publicity of
this action. Stories such as the $95,000 settlement reported on the EEOC’s website are often
reported by local and national news sources. In fact, even when charges do not result in settlement,
but the EEOC finds cause, these charges can be publicized. For example, a local Chicago news
source recently reported that the EEOC found cause in race discrimination charges brought against
Sara Lee.90 Charges that are filed in court are certainly not confidential and often publicized, and
it has been shown that such litigation can have an indirect and direct impact on employment
89
42 U.S.C. 2000e-5(f).
This article is available at http://chicago.cbslocal.com/2015/02/10/feds-side-with-sara-lee-workers-subjected-toracist-taunts/.
90
118
outcomes: Skaggs (2008) found that prominently publicized employment litigation did have an
impact on women in the supermarket industry, including those not involved in the litigation. In
addition, Leonard (1984) found that litigation decreased race occupational segregation.
Even before a case has been resolved, the EEOC often publicizes its litigation. For
example, the EEOC recently publicized a lawsuit against Ruby Tuesday for sex discrimination.91
In addition, these cases are often represented in the national media, for example, in October 2014,
the New York Times published an article about the EEOC’s lawsuit against FedEx for disability
discrimination (New York Times Oct. 10, 2014). The data collected in Hersch (1991) showed that
EEOC litigation is very public, as 45 of the 123 suits written about in the Wall Street Journal
during 1964–1986 were charges brought by the EEOC.92 The common publicity of each of these
types of action can act as an information source for other firms in an industry and state not currently
involved in EEOC action, making them aware of the potentially large consequences and willing to
change the equity in their office to avoid future action. However, this publicity can also create
reputation costs, which further deters potential discriminatory action.
Many scholars have analyzed the costs associated with adverse publicity. While largely
unexplored, such publicity could include public accusations that a firm discriminates in its
employment practices. As noted in James and Wooten (2006), generally, the literature on
reputation costs has focused on the costs associated with organizational crises, such as tort liability
and recalls following the malfunctioning of a product, liability or fines for pollution and other
environmental mishaps, and findings of securities fraud, and on the importance of maintaining a
positive corporate image during these crises. The major costs associated with these crises include
91
This article is available at http://www.eeoc.gov/eeoc/newsroom/release/1-22-15.cfm.
Today with the presence of online media and social media, the presence of such negative publicity from an EEOC
lawsuit is likely greater.
92
119
costs to shareholders because it is a signal of effectiveness to a market, which affects investments
and consumer perceptions (Riordan et al. 1997). However, these costs also include deterring good
employees from applying for jobs, affecting the performance and attitude of current employees,
and changing the reaction of employees to certain actions of leadership, including turnover rates
(Riordan et al. 1997). James and Wooten (2006) recognized that these costs could all be associated
with employment discrimination. As noted previously, Hersch (1991) showed that the publicity of
employment litigation also has the potential to negatively affect a firm’s profits. In addition, these
costs have also been assumed to have deterrent effects on the firms involved in the litigation. In
fact, with anecdotal and theoretical evidence, James and Wooten (2006) suggested that firms are
most likely to improve employment equal opportunity policies in the wake of demonstrations,
boycotts, and negative publicity.
Ultimately, every charge will certainly result in administrative costs, and has the potential
to result in settlement costs, litigation costs and damages, and often negative publicity. In addition,
employers can learn of the threat of these costs due to this publicity and through other channels.
These employers could become aware of the action by discussing practices with other employers
in their state and industry, and through the actions of their employees as they discuss recent actions
with employees of the other firms. After becoming aware of such threats, employers may respond
in a variety of ways to avoid being the target of any such charges or litigation and liability.
Employers could introduce grievance policies as suggested by Edelman (1992), they could reduce
any potentially discriminatory practices in occupation sorting or hiring or wages, and they could
improve working conditions to avoid deter an employee’s desire to sue.
Because of the costs and publicity of EEOC action discussed above, I hypothesize that
firms in an area with a higher rate of EEOC action in the past will respond by improving wages at
120
the current time; this will equate to a positive relationship between past EEOC action and current
wages for black employees.93 While previous studies have found some effect within a state or
within an industry (Wilhem 2002; Hirsh 2009), I believe that action within an industry and state
will be most salient and have the strongest potential to affect actions of other firms. I also
hypothesize that this deterrent effect will be stronger for EEOC action such as EEOC litigation
and charges that the employer files in court because these actions are also more salient and have
greater potential for reputation costs and high damages; however, because these actions are very
low risk, as the EEOC only litigates 400 charges a year (0.4% of the total amount of charges) and
a charge only results in litigation 20% of the time, this hypothesis is likely weak.
Many employers have Employment Practices Liability Insurance policies that cover most
instances of liability for employment discrimination. While some may argue that these policies
make it less likely that employers react to EEOC action, these policies show that employers fear
these costs. In addition, these policies do not cover intentional discrimination; as a result, they
would not cover punitive damages. These policies also cannot prevent costs associated with a
negative reputation. As noted in Van der Veer (2005), insurance companies are also active in risk
management, making it such that they encourage employers to protect against actions that could
be considered discriminatory. Insurance companies also provide another mechanism for
dissemination about EEOC action, as they could encourage employers to become better actors
when another client is involved in EEOC action.
In this chapter, I analyze whether there is a relationship between the rate of EEOC action
involving race discrimination for firms in a certain industry and state and the wages of black
93
I lag the action variable by two years because I believe it gives the employer ample time to respond to the action
and because it lessens endogeneity concerns. In addition, because the year of the charge is the year when the charge
was filed, two years gives the EEOC ample time to actually make other determinations on the charge. However, my
results are the same if the variable is lagged by one year instead of two.
121
employees in that industry and state. I analyze the effect of the total rate of charges filed in that
industry and state and the specific effect of charges that the charging party filed in federal court
before the EEOC completed its investigation. To determine whether the likelihood that a charge is
meritorious matters, I also analyze the effect of charges that the EEOC believed lacked merit.
Specifically, I analyze whether higher rates of charges that the EEOC labels as “likely to be
dismissed” when the charge is first processed also have the ability to deter employers. In 1996, the
EEOC adopted a policy through which it labels a charge based on its potential merit when it is first
processed. These labels include, A, B, and C labels, where a C label is considered “likely to be
dismissed.” Finally, I also analyze the relationship between EEOC litigation and the white/black
wage gap.
EMPIRICAL ANALYSIS
Data
Limited data exists to analyze the number of claims alleging race discrimination that are
actually filed in federal court. In fact, the only data available aside from collecting individual court
filings from other sources, is the Federal Court Cases: Integrated Database, which does not include
information on the specific type of claim filed, but only on the statute that the claim was filed
under. This data also does not include information on the industry of the responding employer. In
this chapter I overcome this difficulty by analyzing EEOC data that I includes the universe of
charges filed with the EEOC and very detailed information about each charge, including the
specific bases of the charge and the industry of the responding employer. Matching this EEOC
data to wage and employment information provides one of the most comprehensive ways to
specifically analyze the relationship between any type of employment discrimination action under
122
Title VII and employment outcomes for minorities. In addition, this process allows be to test the
deterrent effect of charges that might never be filed in court.
The basis of my empirical analysis is the standard hedonic wage equation, and I introduce
the rate of EEOC action (either charges or litigation) to this equation. Generally, to construct the
rates of EEOC action, I match the number of charges and cases against an industry and state from
the EEOC data to the number of employees in an industry and state as recorded in the 2000–2008
Current Population Survey (“CPS”). The CPS data is comprised of responses to government issued
monthly surveys of a nationally representative subset of Americans, and it provides a large amount
of employment and demographic information. The EEOC charge data is the result of a Freedom
of Information Act (“FOIA”) request that I recently completed. I created rates of EEOC action
using this data and matched these variables through the industry variable provided in the CPS. The
EEOC charge data provides three digit North American Industry Classification System (“NAICS”)
codes, which I use to match to the 51 two-digit industry codes provided in the CPS with a
crosswalk provided by the National Bureau of Economic Research (“NBER”).
When the EEOC receives a charge of employment discrimination, it first conducts an
intake interview and records information including demographic information about the charging
party, characteristics of the employer, and the basis or bases of the charge. The EEOC then follows
each charge through its investigation and administration of the charge, and then records the final
outcome of each investigation and administration. The data includes the majority of the
non-confidential charge information recorded by the EEOC since 1985. For the purposes of this
analysis, the following variables are relevant: the bases of the charge, such as whether the charging
party claimed race, or sex discrimination; the state of the responding employer; the industry of the
employer; the outcome of the charge, including whether it was settled, whether the EEOC litigated
123
the charge, and whether the EEOC found cause; and the processing label that the EEOC first gives
a charge following its intake interview, including whether it labeled a charge “C” or “likely to be
dismissed.”
Based on this information provided in the EEOC data for years 2000–2006 and
employment and industry information provided in the CPS for the same years, I create variables
measuring the rate of EEOC action by state, industry, and year per 100,000 employees. The
numerator of these rates comes from the EEOC data and the denominator is constructed from
employment information reported in the CPS. These yearly rate variables include RateCharges,
which is equal to the number of race charges filed against the industry in the relevant state divided
by the number of employees in the industry and the state as reported in the CPS data (per 100,000
employees). I also include analyses of the effect of the rate of race charges in which a party
preemptively filed the claim in court (RateCPCharges) and the effect of the rate of race charges
that the EEOC labeled “likely to be dismissed” (RateDismissCharges), where the denominator is
the same as RateCharges and the numerator is the number of the type of charge filed in the industry
and state. In addition, I analyze the effect of EEOC litigation using the following variable:
RateEEOCCases, which is equal to the ratio of the number of cases brought by the EEOC against
firms in the industry and the state that include a charge of race discrimination to the number of
employees in the industry in the state per 100,000 employees.94
While industry is missing for approximately 23% of the charges within the time period
analyzed in the EEOC data, when analyzing the effect of the rate of sexual harassment in the
workplace on wages, Hersch (2011) showed that observable characteristics that are expected to
affect the wage of an individual do not strongly predict whether industry is missing. Similarly,
94
The construction of this variable is modeled after the construction of the rate of injuries and fatalities in Viscusi and
Hersch (2008) and the rate of sexual harassment charges in Hersch (2011).
124
through my own analysis, I discovered that whether industry is missing also has very little
predictive power on whether the EEOC litigated a charge or any other charge outcome. Though
the frequency of missing variables means that the rate of EEOC action is underestimated, these
factors show that this information is most likely missing at random. As a result, this construction
should not affect the analysis in anyway except for introducing classical measurement error.95
Because the number of missing industry labels increased in 2006 to approximately 48%, I limit
my analysis to charges filed between 2000 and 2006.96
Table 1 provides the number of race cases brought by the EEOC and the number of race
charges filed with the EEOC during this sample. As illustrated, the EEOC litigates less than 1%
of the total amount of race charges filed each year.97 The EEOC was most active in litigation in
2003, bringing 278 cases charges of race discrimination. In 2002, the highest number of race
charges were filed with the EEOC: 29,089 race charges. Table 2 provides the average rates of
EEOC action by industry, state, and year per 100,000 employees for the entire sample. The means
of these rates are separately reported by black and white men and black and white women. The
average rate of yearly EEOC race charges ranges from 20.87 to 31.64 per 100,000 employees in
an industry and state, with black men working in the industries and states with the highest average
rates of race charges and white women working in the industries and states with the lowest rates
of race charges. The average yearly rate of EEOC race litigation ranges from 0.07 to 0.10 per
100,000 employees, with white and black men working in industries and states with the highest
rates of race litigation (0.10).
95
Measurement error will bias the results of this analysis downwards.
While industry is missing more often for smaller firms than larger firms, I expect that the construction of EEOC
action as a ratio to the total number of employees should limit any concern.
97
Approximately 70% of the charges the EEOC chooses to litigate are Title VII cases. As noted in the table notes in
Table 1, the litigation statistics may be slightly skewed because the construction of the year comes from the date the
charge was filed with the EEOC.
96
125
The average rates of EEOC charges and litigation are reported by industry in Table 3 and
by state in Table 4. While these are reported separately by industry and state, the reported rates are
each constructed by industry, state, and year per 100,000 employees. There is interesting variation
in both breakdowns. During the years 2000–2006, the highest rate of EEOC action by industry and
state per 100,000 employees was in the Internet Service Providers and Data Processing Services
industry, with over 127.71 race charges per 100,000 workers being brought on average by state
and year. Other industries with very high rates of race charges included Beverage and Tobacco
Products Manufacturing, which had an average rate of 84.52 race charges per 100,000 employees
by state and year, Rental and Leasing Services, and Telecommunications. These are the only
industries where the average yearly rate of race charges exceeded 60 per 100,000 employees. The
highest average rate of EEOC litigation occurred in the Beverage and Tobacco Products industry,
and the second highest average rate occurred both in Internet Service Providers and Data
Processing Services and Mining. The average rate of race cases per state, industry, and year (per
100,000 employees) never exceeded 0.50.
Table 4 provides the variation in the average rates of EEOC action by state. Again, these
rates are constructed by state, industry, and year per 100,000 employees. While the rate of EEOC
race charges never exceeded 100 charges per 100,000 employees, the average rate of EEOC race
charges per 100,000 employees was 87.38 in Alabama, 69.57 in Arkansas, 72.94 in Mississippi,
65.88 in Georgia, 74.09 in Mississippi, 58.93 in Tennessee, 56.32 in Louisiana, and 52.89 in the
District of Columbia. Not surprisingly, these highest rates of race charges are all concentrated in
the Southern United States. These were the only states that had an average rate over 50 charges
per 100,000 employees per year. Interestingly, the highest rates of EEOC litigation were not
always found in the states with the highest rates of EEOC charges. However, the highest rate of
126
EEOC race litigation did occur in Tennessee (0.34 per 100,000 employees). The average rates of
EEOC litigation were lower when broken down by state as compared to by industry, suggesting
there is greater variation by state than industry.
The CPS provides much of the relevant information necessary to analyze individual wage
equations for a representative sample of the US population. This information includes the
respondent’s age, educational attainment, race, national origin, sex, state of residence, occupation,
working hours, hourly wage or weekly earnings, and industry. If hourly wage was not provided, I
constructed hourly wage by dividing the self-reported usual weekly wage by the number of hours
worked. Table 5 provides the mean hourly wage of each of these subgroups, ranging from 15.39
for black women to 21.36 for white men. All wages are in 2008 dollars, and the sample is limited
to all employed individuals ages 16–64 that were not self-employed. Self-employed individuals
are not covered under Title VII and do not have an employer to sue. What is not reported in any
of these descriptive statistics tables is the relationship between these rates and the wages of
minority employees. Because many things contribute to an individual’s wage, other than state and
industry, I do not report average wages by state and industry. Instead, I use regression analyses to
analyze the relationship between EEOC action and the white/black wage gap.
Empirical Specification
I analyze the specific relationship between certain EEOC action and the wages of black
employees through individual level wage equations. These equations follow the form:
(1) Ln (Wage)i,t = β0 + β1 Blacki,t + β2 EEOCActiony,s, t-2 + β3 EEOCAction y,s, t-2 x Blacki,t +
Xi,t′β4 + Zt′ β5 + Rs′ β6 + ε
In Equation (1), the dependent variable is the natural log of the individual’s wage at time,
t, where t is in years. In this equation, i indexes the individual, y indexes the industry, and s indexes
state. EEOCAction is the rate of EEOC action by industry and state per 100,000 employees at time,
127
t-2. EEOCAction is constructed in the ways discussed above. Black is a dummy variable equal to
one if the individual reports that their race is black or if the individual reports multiple races and
one of those races is black. The coefficients on EEOCAction and the interaction,
EEOCAction x Black are of interest. If EEOC action has a positive relationship with the wages of
black employees beyond any association that it has with the wages of white employees, the
coefficient on the interaction term, β3, should be positive and statistically significant. This result
would suggest that firms that are in industries and states in which the EEOC acted more often in
the previous two years are associated with an improvement in wages that white employees in that
industry did not experience and that black employees in industries and states with lower EEOC
action did not experience. Because the EEOCAction rates are constructed per 100,000 employees
any effect is separate from the size of the industry.98
To isolate the effect of EEOCAction, I also control for a vector of individual demographics
(X) expected to influence an individual’s wage. X includes the following variables: the individual’s
potential work experience, constructed by subtracting the individual’s highest level of education
from his or her age minus five years (Potential Experience) and the square of this variable
(Potential Experience2), the individual’s highest year of school completed (Years of Education),
the individual’s marital status (Married), the sex of the individual (Female), whether the individual
worked full time, defined as working more than 35 hours a week (Full Time), whether the
individual worked in the government (Government Employee),99 whether the individual was
covered by a union (Union Covered Employee), whether the individual worked in a metro area
98
Because of the construction of the sample, this analysis is limited to employees who work in firms and states where
at least one EEOC charge (of any type) has been filed in the past three years.
99
While the federal government has its own procedures for handling Title VII charges, the EEOC still administers
this process. In fact, approximately 12% of the charges filed in the EEOC data were filed by federal or state employees.
This percentage is very similar to the percentage of government employees in the CPS data. However, excluding
government employees from this analysis does not change the results.
128
(Metropolitan Location), and controls for 22 occupations. Each specification also includes year
fixed effects (Z) and region fixed effects (R). R includes individual controls for the 15 EEOC
district offices, with the assumption that these offices each have their own policies and procedures
that could affect wages and the strength of EEOC action.100 R also includes industry by year fixed
effects to control for any trends in each district. Because wages and EEOCAction could be affected
by state law, R also includes a variable that is equal to one if the employee worked in one of the
three states that do not have state laws governing employment discrimination and do not have a
Fair Employment Practices Agency (No FEPA State).101
As discussed above, EEOCAction is constructed in several different ways to test the effect
of specific types of EEOCAction. Generally, it is the ratio of EEOC action in the industry in the
state at time, t-2, to the number of employees in the industry in the state at time t-2 (per 100,000
employees). Again, the specific variables analyzed include the following: RateCharges,
RateCPCharges, RateDismissCharges, and RateEEOCCases. Each of these variables measures
the action two years before to lower concerns of endogeneity and to give the employer ample time
to respond to the action.102 I estimate the effect of each of these actions in separate regressions for
100
In fact, when analyzing the outcome of charges filed under the ADA within the EEOC, Moss et al. (2001) found
that the outcomes greatly varied based on the office that the charge was filed in. For example, the authors found that
34% of the variation in whether a claim was settled during the EEOC could be explained by where a charge was filed.
While the authors acknowledge that this difference could be a systematic difference in the merit of cases filed with
each office, they attribute at least part of this difference to differences in leadership and the culture of an office. If a
certain office is known to encourage settlement and to investigate charges more thoroughly than another, it is likely
that charges filed in that office are more likely to deter employers in a certain industry. The EEOC currently has 38
local offices and 15 district offices. In addition, the EEOC often works in conjunction with state Fair Employment
Practices agencies (“FEPA”) and Tribal Employment Rights offices (“TERO”). Each of these offices has their own
practices and policies. In particular, each EEOC district follows a local enforcement plan, specifically tailored to
unique needs of the region, and these plans change over time (Igasaki 2001),. EEOC district office controls were
created using the state variable. Generally, such offices cover several states in their entirety. However, four offices
cover half of a state. For simplicity, and due to data limitations, the controls for these offices include each observation
from the entire state.
101
I do not control for individual state fixed effects because EEOCAction is created by industry and state. Instead, I
control for district offices and No FEPA.
102
If the variable is constructed at time, t, then it is likely that the EEOC is acting against the industry in the state
because they are known discriminators. This endogeneity would likely bias the coefficient of interest downwards. In
addition, the time period begins when the charge is filed, as such, the EEOC may not have decided to litigate a charge
129
male and female employees using Ordinary Least Squares (“OLS”) regressions. These regressions
include the earnings weight provided in the CPS, and because the EEOC rates are created by
industry and state, the residuals between industry and state may be correlated. As a result, I cluster
the standard errors by industry and state.103 In addition, I limit the regressions to black and white
individuals, as these charges or cases could also positively affect other racial minorities. In fact,
black employees may not benefit any more from these charges than other racial minorities. Results
from the estimations of this analysis follow below.
Results
Results from OLS regressions estimating versions of Equation (1) are presented in
Tables 6–8. As seen in Table 6, the rate of EEOC race charges did not have a statistically
significant effect on the wages of the entire sample of black employees or on black women two
years following the action. The coefficient on RateCharges x Black (the interaction) is only
significant in specifications limited to male employees, suggesting a positive relationship between
the rate of EEOC race charges per industry and state at time t-2 on the wages of black men at time
t that only black men (and not white men) experience. 104 The effect of increasing the rate of race
charges from zero risk to the mean rate for black men (31.64) on the log wages of a black male is
0.012, or 1.2%. This suggests a small, though statistically significant, increase of 21 cents in the
hourly wages of black male employees. The coefficient on black suggests a 12.35% gap in the
wages between black men and white men. As a result, this 21 cent per hour decrease suggests a
9.72% decrease in the white/black wage gap for men.
or fully investigated the charge until t-2. While t-1 might be sufficient time for the employer to respond, I also wanted
to test whether this effect was lasting. Results for variables lagged by one year are similar in size, significance, and
direction.
103
The standard errors are also robust.
104
Interestingly, when the rate is constructed at time t, there is no significant effect for race charges or litigation as
well. In addition, these rates only had an effect when constructed by industry and state and not industry or state alone.
130
Interestingly, the coefficients in column 3 suggest that while on average, higher rates of
race charges are positively associated with black female wages, black females benefit less than
white females. The coefficient on RateCharges is positive and statistically significant, however,
the coefficient on RateCharges x Black is negative and statistically significant. Adding the two
coefficients together, suggests a 0.9% effect for going from zero risk to the average rate of race
charges for black women (30.55). However, because white females benefit much more than white
females, this result does not signify a decrease in the white/black wage gap for female workers. In
fact, the results suggest that this action is associated with a larger wage gap worse.105 The results
did not show a positive relationship between the number of EEOC race charges in an industry and
state and the wages of black females, this is not surprising as the wage gap between black women
and white women is very low, if present at all (Chandra 2000).106
Knowing that a higher rate of race charges at time t-2 is associated with a significant
increase in black male wages, in Table 7, I present results showing that even if the rate of charges
that are likely to dismiss is higher, charges have a positive relationship with black male wages.
The coefficients in Column 1 show that controlling for the number of race charges brought, the
number of race charges that the charging party files in court have a positive impact on black male
earnings. Going from zero risk to the mean rate of dismiss charges (5.23) increases black wages
(and not white wages) by 1.3%, or 22 cents. This effect suggests that employers are deterred by
the costs associated with all charges, and that the effect of all charges is not driven by those with
merit or those that are eventually filed in court.107
105
Interestingly, limiting the specification to black females and not including the interaction would suggest a positive
effect of the rate of EEOC charges on black females. This suggests that such analyses may be flawed.
106
While some argue that the estimated female wage gaps are too small (Neal 2004), most scholars agree that it is
smaller than the male white / black wage gap. The coefficient on black in the female specification presented in this
chapter suggests a six percent gap as compared to a twelve percent gap for the male sample.
107
This result holds when I control for the total number of race charges in addition to these charges and when I do not.
131
Column 1 in Table 7 and Columns 1–3 in Table 8 show that contrary to my hypothesis,
when the rate of EEOC litigation or charging party litigation did not have a statistically significant
impact on the wages of black men or black women. The coefficient on RateCPCharges x Black
and RateEEOCCases x Black were insignificant in all equations. As noted before, the probability
that a firm experiences either of these types of actions is very low. The average rate of CP Charges
was 0.10 per 100,000 employees for black males and 0.07 per 100,000 employees for black
females. Overall, these results suggest that the rate of EEOC charges related to race discrimination
in total can have a significant impact on black male wages. However, likely due to the small
probability of experiencing one of the events, litigation rates do not positively affect black wages.
CONCLUSIONS AND IMPLICATIONS
Scholars have criticized the EEOC since its inception, and many have suggested that its
purpose could be achieved through the federal court system alone. However, the EEOC’s ability
to litigate charges of importance and its ability to act as a gatekeeper, such that more charges of
employment discrimination are filed with the EEOC as compared to the federal courts, have been
suggested as important characteristics of the agency. These two characteristics, respectively, have
the ability to change the law such that it is more likely to deter discrimination and to allow plaintiffs
unlikely to file a claim due to the costs of litigation an opportunity to have recourse. These two
characteristics also have the potential to indirectly deter future discrimination in the responding
firm and in other related firms due to the potential high costs of response and frequent publicity
associated with these actions. However, empirical evidence suggests mixed results as to whether
this deterrent effect is actually present. The evidence presented in this chapter suggests that higher
rates of charges filed with the EEOC, including charges that are not likely to have merit, can
132
decrease the gap in wages between white and black men. However, litigation associated with the
EEOC is not likely to have an effect.
In this analysis, the rate of race charges filed with the EEOC in an industry and state had a
positive impact on the wages of black men in that industry and state two years following that
action. The results suggest that this effect decreased the gap between white and black wages for
men in the industry and state combination where the EEOC acted by 9.7%. While this is a positive
result and shows that EEOC action can improve working conditions for black male employees, it
does not necessarily show that the EEOC is more beneficial than the federal court system without
the EEOC. Interestingly, the results showed that the sheer rate of charges was driving the effect
and not the potential merit of the charge, and it is possible that the average yearly rate would
decrease if the EEOC did not administer each charge.
What does not suggest EEOC success is the fact that EEOC litigation does not have the
deterrent effect that I expected it to due to its highly publicized nature and potential for large
damages. This result is likely because the EEOC litigates a very small percentage of charges, and
as a result, these firms may not view it as a real threat. Perhaps this result would be different if the
EEOC litigated cases more frequently, and some scholars (see Engstrom 2013) are proponents of
this change, which would of course require a change in the structure of the EEOC and expanded
resources. Future research could inform the general deterrent effect of all Title VII lawsuits filed
in federal court on the industries in which they were filed against and in the state in which they
were filed as compared to the EEOC effect presented in this chapter and earlier research.
Surprisingly, only approximately 10% of the race discrimination charges in the EEOC
charge data that I analyze in this chapter claim discrimination in wages. As a result, it may be
surprising that I find an effect on EEOC action on minority wages. However, wages are correlated
133
with other factors associated with potentially discriminatory actions, including promotion and
hiring behavior. In addition, if an employer responds to such a risk by improving working
conditions, they likely attract better employees worth compensating with higher wages or other
employment benefits. It is likely that these results also suggests that EEOC action may have a
positive impact on other employment outcomes as well. The analysis that I present in this chapter
is also the first empirical evidence since Freeman (1973) that shows that EEOC action may be
positively associated with improvements for black males.108 Overall, I presented some evidence
that the EEOC has helped decrease the white/black pay gap for men through the number of charges
filed against the agency, and perhaps, this evidence suggests that the EEOC has not been
“ineffective since its inception.”
108
Many of the studies cited in this chapter did not analyze the effect of EEOC action on outcomes for male employees.
In addition, none of the studies discussed in this chapter analyzed the effect on an industry and state level, and it might
be that the deterrent effect is only present on such a level.
134
REFERENCES
Bravin, Jess and Melanie Trottman. 2015. “Supreme Court Hears Argument on EEOC
Complaints.” The Wall Street Journal, January 13, 2015, available at
http://www.wsj.com/articles/supreme-court-hears-arguments-on-eeoc-complaints-142119
6058.
Brown, Charles. 1982. “The Federal Attack on Labor Market Discrimination: The Mouse that
Roared?” Research in Labor Economics 5: 33–68.
Butler, Richard and James Heckman. 1977. “The Government’s Impact on the Labor Market
Status of Black Americans,” in Equal Rights and Industrial Relations, ch. 9, at 235–81 (ed. L.
J. Housman).
Chandra, Amitabh. 2000. “Labor-Market Dropouts and the Racial Wage Gap: 1940–1990.” A.E.R.
Papers and Proceedings 90 (May): 333–38.
Edelman, Lauren. 1992. “Legal Ambiguity and Symbolic Structures: Organizational Mediation of
Civil Rights Laws.” American Journal of Sociology 97(6): 1531–1576.
Engstrom, David. 2013. “Agencies as Litigation Gatekeepers.” Yale Law Journal 123(3): 616–
703.
Freeman, Richard B. 1973. “Changes in the Labor Market for Black Americans, 1948–7.”
Brookings Papers on Economic Activity 4 (1):67–132.
Gray, Wayne B. and John Mendeloff. 2005. “The Declining Effects of OSHA Inspections in
Manufacturing, 1979–1998.” Industrial and Labor Relations Review 58(4): 571–587.
Gray, Wayne B. and John T. Scholz. 1993. “Does Regulatory Enforcement Work? A Panel
Analysis of OSHA Enforcement.” Law & Society Review 27(1):177–214.
Gray, Wayne B. and Ronald J. Shadbegian. 2005. “When and Why Do Plants Comply? Paper
Mills in the 1980s.” Law and Policy 27(2):238–61.
Hersch, Joni, 1991. “Equal Employment Opportunity Law and Firm Profitability.” Journal of
Human Resources 26(1): 139–153.
________. 2011. “Compensating Differentials for Sexual Harassment.” American Economic
Review Papers and Proceedings 101(2): 630–634.
Hersch, Joni and Jennifer Bennett Shinall. 2015. “Fifty Years Later: The Legacy of the Civil Rights
Act of 1964.” Journal of Policy Analysis Management, forthcoming, Vanderbilt Law and
Economics Research Paper No. 14-33.
135
Hirsh, C. Elizabeth. 2009. “The Strength of Weak Enforcement: The Impact of Discrimination
Charges, Legal Environments, and Organizational Conditions on Workplace Segregation.”
American Sociological Review 74(2): 245–271.
Igasaki, Paul M. 2001. “Doing the Best with What We Had: Building A More Effective Equal
Employment Opportunity Commission During the Clinton-Gore Administration.” Labor
Lawyer 15(2): 261–284.
James, Erika Hayes and Lynn Perry Wooten. 2006. “Diversity Crises: How Firms Manage
Discrimination Lawsuits.” Academy of Management Journal 49(6):1103–1118.
Johnson, Judith J. 1994. “A Standard for Punitive Damages Under Title VII.” Florida Law Review
46: 521–561.
Leonard, Jonathan S. 1984. “The Impact of Affirmative Action on Employment.” Journal of Labor
Economics 2(4): 439–463.
McCormick, Marcia. 2009. “The Truth Is Out There: Revamping Federal Antidiscrimination
Enforcement for the Twenty-First Century.” Berkeley Journal of Employment and Labor Law
30(1): 193–231.
Moss, Kathryn, Scott Burris, Michael Ullman, Matthew Johnsen, and Jeffrey Swanson. 2001.
“Unfunded Mandate: An Empirical Study of the Implementation of the Americans with
Disabilities Act by the Equal Employment Opportunity Commission.” University of Kansas
Law Review 50(1): 1–110.
Neal, Derk. 2004. “The Measured Black-White Wage Gap Among Women Is Too Small.” Journal
of Political Economy112 (1): 1–28.
New York Times. October 10, 2014. “The EEOC Sues FedEx for Not Accommodating Deaf
Workers.”
Riordan, Christine M., Robert D. Gatewood, and Jodi Barnes Bill. 1997. “Corporate Image:
Employer Reactions and Implications for Managing Corporate Social Performance.” The
Journal of Business Ethics 16(4): 501–412.
Selmi, Michael. 2001. “Why Are Employment Discrimination Cases So Hard to Win?” Louisiana
Law Review 61(1): 555–575.
Shimshack, Jay P., and Michael B. Ward. 2005. “Regulator Reputation, Enforcement, and
Environmental Compliance.” Journal of Environmental Economics and Management 50
(2005): 519–540.
Skaggs, Sheryl. 2008. “Producing Change or Bagging Opportunity? The Effects of Discrimination
Litigation on Women in Supermarket Management.” American Journal of Sociology 113(4):
1148–1182.
136
Van der Veer, Nancy H. 2005. “Employment Practices Liability Insurance: Are EPLI Policies a
License To Discriminate? Or Are They a Necessary Reality Check for Employers?”
Connecticut Insurance Law Journal 12:173–206.
Viscusi, W. Kip. 1986. “The Impact of Occupational Safety and Health Regulation, 1973–1983.”
Rand Journal of Economics 17(2): 567–580.
Viscusi, W. Kip, and Joni Hersch. 2008. “The Mortality Cost to Smokers.” Journal of Health
Economics, 27(4): 943–58.
Wall Street Journal. September 11, 2013. “Sue First, Investigate Later.”
Wilhem, Sarah A. 2002. “The Impact of Equal Employment Opportunity Commission
Enforcement on the Wages of Black and White Women, 1988-1996.” The Review of Black
Political Economy 2002(2): 25–51.
137
Table 1. EEOC Race Charges and Cases Per Year
Year
Number of
Number of
Race Charges
Race Cases
2000
28,377
91
2001
28,276
87
2002
29,089
102
2003
27,675
160
2004
26,879
123
2005
25,990
145
2006
26,418
163
Source: 2000–2006 EEOC Charge Data.
Notes: The total number of cases, while always less than
the total number of cases reported on the EEOC website,
is often quite close to the total. This is likely because
many of these cases include both a race and sex bases. In
addition, these numbers are based on when the charge
was filed, not when the actually case was filed in court,
and, as a result, the years may be measured with error.
Table 2. Average EEOC Race Charge and Case Rates Reported by Race and Sex
Black
White
Black
White
Men
Men
Women
Women
RateCharges
31.64
21.14
30.55
20.87
RateEEOCCases
0.10
0.10
0.07
0.07
RateCPCharges
0.04
0.02
0.03
0.02
RateDismissCharges
5.23
3.62
5.52
3.65
Number of Observations
49,337
413,692
64,284
407,946
Source: EEOC Charge Data, 2000-2006
Notes: The rates are constructed by state, industry, and year, per 100,000 employees.
Variable
138
Table 3. EEOC Race Charge and Case Rates Reported by Industry
Industry
Agriculture
Forestry, Logging, Hunting, Fishing, and Trapping
Mining
Construction
Nonmetalic Mineral Products
Primary Metals and Fabricated Metal Products
Machinery Manufacturing
Computer and Electronic Products
Electrical Equipment, and Electronic Manufacturing
Transportation Equipment Manufacturing
Wood Products Manufacturing
Furniture and Fixtures Manufacturing
Miscellaneous and Non Specified Manufacturing
Food Manufacturing
Beverage and Tobacco Products
Textile, Apparel, and Leather Manufacturing
Paper and Printing
Petroleum and Coal Products
Chemical Manufacturing
Plastic and Rubber Products
Wholesale Trade
Retail Trade
Transportation and Warehousing
Utilities
Publishing Industries (except internet)
Motion Picture and Sound Recording Industries
Broadcasting (except internet)
Internet Publishing and Broadcasting
Telecommunications
Internet Service Providers and Data Processing Services
Other Information Services
Finance
Insurance
Real Estate
Rental and Leasing Services
Professional and Technical Services
Management of Companies and Enterprises
Administrative and Support Services
Waste Management and Remediation Services
Educational Services
Hospitals
139
Rate
Rate
Charges Cases
22.18
0.01
42.45
0.00
28.97
0.43
7.48
0.09
22.24
0.19
26.01
0.23
16.79
0.30
13.44
0.05
34.62
0.17
19.56
0.05
24.78
0.07
20.27
0.15
36.47
0.02
31.31
0.18
84.52
0.47
23.89
0.03
16.81
0.08
42.00
0.00
26.90
0.11
17.17
0.08
0.70
0.00
14.29
0.09
26.37
0.19
23.34
0.10
22.07
0.10
10.95
0.04
12.54
0.09
0.00
0.00
63.09
0.08
127.71
0.43
8.37
0.00
20.59
0.05
9.93
0.01
10.73
0.02
65.24
0.50
22.47
0.07
19.53
0.00
24.56
0.07
24.20
0.05
9.89
0.01
16.05
0.03
Health Care Services, Except Hospitals
17.71
0.06
Social Assistance
12.94
0.02
Arts, Entertainment, and Recreation
11.04
0.01
Accommodation
44.01
0.11
Food Services and Drinking Places
11.74
0.06
Repair and Maintenance
14.54
0.04
Personal and Laundry Services
20.58
0.08
Membership Associations and Organizations
21.18
0.04
Private Households
2.75
0.00
Public Administration
32.02
0.02
Source: EEOC Charge Data 2000–2006, CPS Data 2000–2006.
Notes: The rates are constructed by state, industry, and year, per 100,000
employees for each industry represented in the EEOC charges data.
140
Table 4. EEOC Race Charge and Case Rates Reported by State
State
Alabama
Alaska
Arizona
Arkansas
California
Colorado
Connecticut
Delaware
District of Columbia
Florida
Georgia
Hawaii
Idaho
Illinois
Indiana
Iowa
Kansas
Kentucky
Louisiana
Maine
Maryland
Massachusetts
Michigan
Minnesota
Mississippi
Missouri
Montana
Nebraska
Nevada
New Hampshire
New Jersey
New Mexico
New York
North Carolina
North Dakota
Ohio
Oklahoma
Oregon
Pennsylvania
Rhode Island
South Carolina
South Dakota
Rate Charges
87.39
4.89
20.96
69.57
7.95
13.53
2.13
11.99
52.89
17.21
65.88
10.33
0.88
32.24
23.76
1.98
13.29
23.56
56.32
0.58
12.56
1.57
14.20
10.54
72.94
19.57
1.73
2.94
5.67
0.48
12.55
31.75
8.28
39.71
1.21
14.83
33.93
1.78
11.66
1.65
16.19
1.51
141
Rate Cases
0.03
0.12
0.13
0.10
0.03
0.05
0.00
0.16
0.00
0.06
0.07
0.10
0.00
0.27
0.03
0.05
0.01
0.02
0.12
0.00
0.09
0.02
0.08
0.12
0.12
0.08
0.00
0.00
0.10
0.00
0.09
0.07
0.08
0.09
0.00
0.04
0.04
0.00
0.12
0.00
0.03
0.00
Tennessee
58.93
0.34
Texas
27.61
0.12
Utah
1.38
0.00
Vermont
1.52
0.00
Virginia
18.19
0.04
Washington
7.14
0.03
West Virginia
4.03
0.00
Wisconsin
11.86
0.02
Wyoming
1.18
0.00
Source: EEOC Charge Data, 2000–2006; CPS Data 2000–2006.
Notes: Rates are constructed by state, industry, and year per 100,000
employees for each industry represented in the EEOC charge data.
Table 5. Descriptive Statistics for CPS Sample, Means and Percentages
Variable
Black
Men
17.41
2.72
19.49
16.48
17.40
13.14
49.42
89.72
87.15
49,336
White
Men
21.36
2.88
20.27
13.51
15.27
13.33
59.19
84.22
91.32
435,771
Black
Women
15.39
2.59
20.13
24.24
15.51
13.45
34.98
90.14
85.05
65,278
White
Women
17.63
2.70
20.55
18.34
12.29
13.78
55.16
83.07
77.43
430,518
Hourly Wage
Log of Hourly Wage
Potential Experience
Government Employer
Union Covered Employee
Years of Education
Married
Metropolitan Location
Full Time
Number of observations
Source: CPS, 2002-2008
Notes: All values are weighted by the CPS earnings weight. The sample is comprised of
employed workers ages 16–64, with hourly wages between $1.00 and $100, and that are not
self-employed. Wages are in 2008 dollars.
142
Table 6. Regression Results for Rate of Race Charges
Dependent Variable Log of Hourly Wages
Full Sample
Men
Women
Variables
(1)
(2)
(3)
RateCharges x Black
0.007
0.039**
-0.029*
(0.015)
(0.018)
(0.017)
RateCharges
0.021
-0.012
0.059***
(0.013)
(0.014)
(0.016)
Black
-8.549***
-11.653***
-6.048***
(1.237)
(1.844)
(0.582)
Female
-15.326***
(0.426)
Potential Experience
2.864***
3.399***
2.357***
(0.079)
(0.158)
(0.054)
Potential Experience 2/100
-4.634***
-5.685***
-3.676***
(0.172)
(0.341)
(0.113)
Full Time
16.364***
18.003***
14.635***
(1.720)
(4.150)
(0.526)
Government Employee
0.673
-0.623
2.208***
(0.768)
(0.954)
(0.794)
No FEPA State
-6.584***
-6.241***
-6.802**
(2.233)
(2.378)
(2.728)
Union Covered Employee
11.445***
12.032***
10.516***
(0.589)
(0.710)
(0.669)
Metropolitan Location
10.240***
9.260***
10.770***
(0.436)
(0.509)
(0.520)
Years of Education
7.003***
6.517***
7.210***
(0.141)
(0.176)
(0.125)
Married
7.888***
12.092***
3.383***
(0.602)
(1.012)
(0.296)
Constant
166.235***
165.001***
155.524***
(2.713)
(2.964)
(2.771)
Number of Observations
854,345
414,686
439,659
R-Squared
0.483
0.471
0.478
Robust standard errors clustered by two-digit industry and state are reported in parentheses. All
coefficients and standard errors have been multiplied by 100. The sample is the CPS years 2002–
2008: individuals that are employed, between ages 16 and 64, with hourly wages between $1.00
and $100. Regressions are limited to black and white individuals. All values are weighted by
the CPS earnings weight. Each regression also includes occupation fixed effects, district office
fixed effects, and year fixed effects. Wages are in 2008 dollars. *** indicates significance at the
1 percent level; ** indicates significance at the 5 percent level; and * indicates significance at
the 10 percent level.
143
Table 7. Regression Results for Rate of Race Charges, Male Sample
Dependent Variable: Log of Hourly Wages
CP
Dismiss
Variables
Charges
Charges
(1)
(2)
RateCPCharges x Black
1.826
(1.248)
RateCPCharges
0.235
(0.210)
RateDismissCharges x Black
0.240**
(0.100)
RateDismissCharges
-0.021
(0.044)
RateCharges
-0.007
-0.008
(0.013)
(0.016)
Black
-10.560***
-11.697***
(2.012)
(1.651)
Constant
164.818***
165.009***
(2.958)
(2.971)
Number of Observations
414,686
414,686
R-Squared
0.471
0.471
Robust standard errors clustered by two-digit industry and state are
reported in parentheses. All coefficients and standard errors have been
multiplied by 100. The sample is the CPS years 2002–2008: individuals
that are employed, between ages 16 and 64, with hourly wages between
$1.00 and $100. Regressions are limited to black and white males. All
values are weighted by the CPS earnings weight. Each regression also
includes occupation fixed effects, district office fixed effects, and year
fixed effects. Wages are in 2008 dollars. *** indicates significance at the
1 percent level; ** indicates significance at the 5 percent level; and *
indicates significance at the 10 percent level.
144
Table 8. Regression Results for Rate of EEOC Race Cases
Dependent Variable: Log of Hourly Wages
Full Sample:
Men:
Women:
Rates by
Rates by
Rates by
Variables
Industry
Industry &
Industry &
&State
State
State
(1)
(2)
(3)
EEOCRateCases x Black
-0.052
-0.128
0.928
(0.435)
(0.443)
(0.715)
EEOCRateCases
-0.052
0.143
-0.571
(0.199)
(0.176)
(0.387)
EEOCRateCharges
0.023*
-0.006
0.053***
(0.012)
(0.012)
(0.015)
Black
-8.322***
-10.478***
-6.960***
(1.366)
(2.066)
(0.557)
Female
-15.324***
(0.426)
Constant
166.197***
164.805***
155.736***
(2.715)
(2.959)
(2.772)
Number of Observations
854,345
414,686
439,659
R Squared
0.483
0.471
0.478
Robust standard errors clustered by two-digit industry and state are reported in
parentheses. All coefficients and standard errors have been multiplied by 100. The
sample is the CPS years 2000–2008: individuals that are employed, between ages 16
and 64, with hourly wages between $1.00 and $100. All values are weighted by the
CPS earnings weight. Each regression also includes occupation fixed effects, district
office fixed effects, and year fixed effects. Wages are in 2008 dollars. *** indicates
significance at the 1 percent level; ** indicates significance at the 5 percent level;
and * indicates significance at the 10 percent level.
145
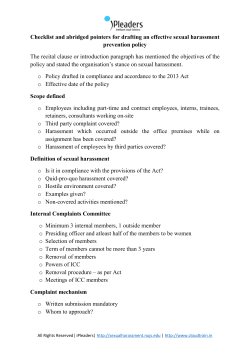


© Copyright 2026