
THE RIGHT SCHOOL - Leslie Lerner Properties
Houston Chronicle
SCHOOL REPORT CARD
@HoustonChron
Houston Chronicle | Sunday, April 26, 2015 | HoustonChronicle.com and Chron.com
Pre-K teacher Vanessa de Simone-Canseco has her students enthralled as she reads to her class at Marshall Elementary School in Spring.
Section M
Brett Coomer / Houston Chronicle
THE RIGHT SCHOOL
2015 SCHOOL
RANKINGS
From the best to the
worst, find out if your
child’s school passed
the test this year.
PRE-K
Navigating the maze of Houston-area school systems
can be panic-inducing. To help parents choose which school
is right for their kids, the nonprofit Children at Risk just
released its 2015 rankings, based on student test scores.
Inside, we tell the stories of three families looking for the place
where their children can flourish. Story, Page M2
SCHOOL PROFILE
ONLINE
FULL-DAY CLASSES NEW PARTNERSHIP FOR MORE DATA
Districts expand pre-K programs to get
the most bang for their buck. Page M8
Baylor College of Medicine partners with a
reinvented Third Ward school. Page M9
Find a searchable database and interactive
map: HoustonChronicle.com/reportcard
M2 | Sunday, April 26, 2015 |
Houston Chronicle | HoustonChronicle.com and chron.com x x
Families navigate maze of school choices
Three stories show
stress involved in
searching for ideal
place for your child
By Ericka Mellon
Deciding where to send a child
to elementary school can be as
stressful as selecting a college.
Move to the suburbs or the city?
Go to the campus down the street
or apply to a specialty school?
More than 23,000 students applied to magnet programs in the
Houston Independent School
District for next year. Some waiting lists are more than 100 students deep.
The area’s three biggest charter school networks — KIPP, YES
Prep and Harmony — placed at
least 22,790 children on waiting
lists last year. “The good news
is that parents are applying to
schools that are doing really well.
But I don’t think there’s enough
quality supply,” said Colleen
Dippel, executive director of the
nonprofit Families Empowered
and the wife of KIPP co-founder
Mike Feinberg.
Families Empowered works
with families on the charter
school waiting lists and with others seeking help with the school
search process.
The best school, of course, can
mean something different to everyone. One resource that Dippel
said she consults is the school
rankings from Children at Risk.
The nonprofit annually grades
public schools, based largely on
student test scores in reading and
math. The 2015 rankings for the
eight-county Houston region are
published in the Houston Chronicle’s Sunday edition.
The journey to find the right
school can be a challenge, bringing frustration, confusion, hope
and — ideally — success. Three
families shared their stories with
the Chronicle.
‘Better our lives’
Chrystal Jenkins-Washington
calls herself a fighter, at least
when it comes to her grandson,
Jordan Melancon. The clean-cut
10-year-old has been mocked
by his classmates, she said, and
his grades have slipped at Houston ISD’s Woodson Leadership
Academy, a combined elementary and middle school on the
south side.
She said she has tried to get
Jordan into the nearby Sunnyside KIPP school, but he landed
on the waiting list.
Jenkins-Washington said she
didn’t know about other options until she attended a schoolchoice fair hosted by Families
Empowered in January. She happened to hear about the event,
held at Gallery Furniture, thanks
to a Facebook posting.
Getting there wasn’t easy. She
boarded a METROLift van in her
wheelchair and made the 20-mile
trek north with her grandson.
“If it’s something for Jordan
or something that will better our
lives, I don’t mind,” said JenkinsWashington, who has emphysema.
The 56-year-old grandmother
earned her GED after dropping
out of high school and is pursuing a master’s degree in mental
health counseling.
At the school-choice fair,
Jenkins-Washington said that
Houston ISD’s Fondren Middle
School caught her attention. It
had a global perspective, newly
authorized as an International
Baccalaureate school, and Jordan
Mayra Beltrán / Houston Chronicle
Chrystal Jenkins-Washington, 56, is unhappy with her neighborhood school, Woodson. She is considering trying to transfer her
grandson, Jordan Melancon, 10, elsewhere. She said his grades have slipped, and he gets picked on at the HISD campus.
Billy Smith II / Houston Chronicle
From left, Jeff, Jeri, Ryan and Kami Norus recently relocated to Houston, their third move in four
years. Their friends with kids praised schools in The Woodlands, so the Noruses worked with
Realtors to narrow down their home search to have their kids zoned to schools in the area.
liked the soccer teams.
“Can I start tomorrow?” Jordan, now in fourth grade, asked
his grandma.
The middle school won’t be an
option for another year. JenkinsWashington also had missed
HISD’s December deadline to apply to magnet schools, so Jordan’s
chance at getting into the most
popular programs was shot.
Jenkins-Washington is considering having Jordan stay put for
fifth grade.
In the 2015 Children at Risk
rankings, Woodson earned an
F grade, as did the nearby KIPP
school (KIPP Spirit serves fifthgraders; KIPP ZENITH serves
the lower grades). Fondren Middle also received an F.
The Woodson principal, Staci
Taylor Fullmighter, said her
school is making progress. State
test scores rose in most grade
levels and subjects from 2013 to
2014, though the school performs
well below the district average.
Melissa Phillip / Houston Chronicle
Susann and Matthias Stein are searching for a house zoned to
Bellaire High, where they hope their children Mathilda, 4, and
Hermann, 1, eventually will attend.
The school added an hour to
the schedule last year as part of
Superintendent Terry Grier’s
reform efforts, and the principal
uses the extra time for tutoring or
enrichment activities. In an effort
to improve the middle school,
Fullmighter said, she has moved
to single-gender classes after a
positive pilot program for sixthgraders.
“Woodson is on the upswing,”
said Diana Gibson-Johnson, who
supervises the campus.
A spokeswoman for KIPP,
Chris Gonzalez, said the Children at Risk grades don’t tell the
full story. About half the KIPP
schools received A’s and B’s.
“We believe we have a wait-list
because families want something
beyond an annual ranking,” she
said. “They want a school that
will provide many opportunities
for great futures, and families
value our college matriculation
and graduation results more
than any of the various rankings
we receive, no matter how good
those rankings are.”
For his part, Jordan said he enjoys going to the Woodson computer lab, where he does online
reading activities, but he wishes
he got more science lessons and
that the other kids didn’t call him
names.
Jenkins-Washington said Jordan’s classmates tell him “he tries
to act white” — he and most of the
students at Woodson are black
— and he feels he has to “dummy
down to fit in.”
“I’ve got to do something,” Jenkins-Washington said. “I’m just
not sure.”
‘Not really calm’
With a background in architecture, Susann Stein has taken a
methodical approach to searching for a home in Houston. The
main factor, she said, is the quality of the neighborhood schools.
She and her husband, Matthias, moved here a year ago from
Malaysia for his engineering job.
The German natives have two
children, Mathilda, 4, and Hermann, 1, and another on the way.
“We believe we have
a wait-list because
families want
something beyond an
annual ranking. They
want a school that
will provide many
opportunities for great
futures.”
Chris Gonzalez, KIPP spokeswoman
They decided to rent first,
picking an apartment in the Galleria area, near Matthias’ office.
They ultimately wanted to settle nearby, so that kept them in
Houston ISD.
Susann visited the district’s
website and started mapping
schools, focusing on those that
earned A grades from Children
at Risk. She and her husband
agreed they wanted to be zoned
to a high-performing school.
They were worried about taking
a chance on a magnet school lottery, and Susann said she wasn’t
clear on the deadlines and criteria
(for kindergarten entry, testing is
only required for the gifted magnet programs, called Vanguard).
“We’re still not really calm,”
Stein said. “At first we thought
we had it all figured out, and then
new facts come in.”
Stein said she realized living
near some of the top elementary
schools didn’t guarantee she
would be zoned to a top middle or
high school.
“If we’re buying a house,” she
said, “we don’t want to sell it in
five years.”
The Steins have targeted houses zoned to Bellaire High, which
earned an A+ grade from Children at Risk and ranked No. 22
in the region this year. The eight
HISD high schools that ranked
higher are application-only magnet or specialty schools. Bellaire
has a magnet program for world
languages, but the school mostly
enrolls zoned students.
For elementary schools, Stein
likes Kolter (rank: 45; grade: A+)
and Lovett (rank: 120; grade: A).
She has visited both.
The couple’s Realtor, Wendy
Lusky Rosenfeld, remains on the
lookout for houses. The family
may rent in the Kolter or Lovett
zones before buying or building.
Rosenfeld said she often counsels her clients on schools.
“Some people are thoroughly
confused,” Rosenfeld said. “I try
to push my clients to apply to as
many schools as they might want
to magnet-transfer into. They
end up putting all their eggs in
one basket, and then they have
to change their whole buying
plan because they don’t get into a
school.”
For now, Stein said, Mathilda
enjoys her private preschool in
West University Place, where
most of the children are not from
Houston. Her English skills are
improving.
“I think she has a Texas accent,” Stein said.
‘Incredibly friendly’
Jeff and Jeri Norus have become experts at moving, changing
states three times in four years.
Their latest stop: The Woodlands.
House-hunting last year, they
came across one of the newer
areas, the Village of Creekside
Park. Jeri said she worried it
wasn’t being developed as carefully as other developments in the
master-planned community. The
neighborhood is zoned to Tomball
ISD.
“People kept saying, ‘That’s not
The Woodlands High School,’ ”
she said.
The Noruses had been set on
sending their children to schools
in The Woodlands, as part of Conroe ISD. They were used to good
public schools in northern Virginia’s Loudoun County, where Jeri
taught elementary school. Their
friends with kids also praised
The Woodlands’ schools, so they
worked with Realtors Cathy Cole
and Jo Anne Johnson to narrow
their search.
Their son, Ryan, now attends
kindergarten at Conroe ISD’s
Deretchin Elementary in The
Woodlands. The school earned
an A+ grade from Children at Risk
this year and ranked No. 12 among
the region’s elementary schools.
“Everyone is incredibly friendly,” Jeri said. “His teacher has
been amazing.”
Their daughter, Kami, is an
eighth-grader at Conroe ISD’s
McCullough Junior High, ranked
No. 16 with a grade of A+ from
Children at Risk. She eventually
will go to The Woodlands High
School, No. 21 on the list with an
A+ grade. (Tomball High ranked
No. 46 with an A- grade.)
Kami, getting ready for cheerleading practice on a recent
night, said the schoolwork at McCullough is tougher than at her
school in Virginia.
“That’s not a negative thing,”
said her dad, Jeff, a vice president
for an energy-services company
in The Woodlands.
“They are definitely preparing
them for high school and college,”
Jeri added.
[email protected]
twitter.com/e_mellon
xx
Houston Chronicle | HoustonChronicle.com and chron.com | Sunday, April 26, 2015 |
Families Empowered
founder offers advice
By Ericka Mellon
Colleen Dippel entered the
education arena in 1996 as a
Teach for America participant.
She taught elementary school
for three years in the Houston
Independent School District and
at KIPP Academy. Her husband, Mike Feinberg, was one
of KIPP’s founders. Dippel recently spoke with Chronicle reporter Ericka Mellon about her
latest venture, running Families
Empowered, a local nonprofit
that provides free services to
families searching for the best
schools for their children. An
edited transcript follows.
Q: What made you start
Families Empowered in
2009?
A: I had obviously been
involved with KIPP and then
knowing Chris Barbic at YES
(Barbic is the founder). I knew
there was growing demand
for these two charters. It just
seemed like a natural question:
Who helps these parents get
into your schools? And they
both said, ‘We don’t know. We
don’t have the resources to do
that.’ And I said, ‘Well, someone ought to help them.’
Q: So, are you trying to
steer parents just to charter
schools?
A: No, no. Really, for us to be
effective, it can’t be about promoting a certain school agenda.
We actually are model-agnostic.
Our primary source of families is these charter wait-list
parents. But we certainly work
with any families who come to
us.
Inside the rankings
TOP 10 ELEMENTARY SCHOOLS
1. T.H. Rogers, Houston ISD
2. West University, Houston ISD
3. River Oaks, Houston ISD
4. Colony Meadows, Fort Bend ISD
5. Commonwealth, Fort Bend ISD
6. Horn, Houston ISD
7. Creekside Forest, Tomball ISD
8. Colson Tough, Conroe ISD
9. David, Conroe ISD
10. Sampson, Cypress-Fairbanks
ISD
Parents need to navigate a
very complex choice system in
Houston. It’s not our job to tell
the parent what they should believe. It’s our job to try to connect
families with as many schools
and with accurate, actionable
information — which is why we
try to promote the Children at
Risk ranking. We feel like when
parents have information that’s
accurate and actionable, they
can engage more meaningfully
in the market.
Q: Do you think we will
ever return to students just
going to their closest neighborhood school? Does that
not work in the urban core
anymore?
A: I think the ideal is that the
parent has a school that’s close
to their home, although we have
parents who are looking for a
school close to work.
Q: Can you share some
secret tips?
A: (Laughs.) They’re not secret. Families with means know
the rules of the game. The rules
of the game with K-12, where
you have a high choice environment, they’re the same rules
that apply to college.
Our families generally don’t
know the rules of the game. So,
the tips for us are, start early.
Start looking in the fall. Really,
by late November/early December, start filling out your applications. Apply to three or more
schools. Know the deadlines,
and get your stuff in on time.
Q: You also recommend
touring schools. What
should parents look for?
M3
TOP 10 MIDDLE SCHOOLS
Courtesy photo
Colleen Dippel, founder and
executive director of Families
Empowered.
A: Parents should ask to
quietly sit in a classroom. Look
at the instruction. The climate
of the school, the culture of
the school, is something that’s
observable. How engaged are
the students? Are they really
interacting? You can sort of
get that just peering through
the window. Look at multiple
classrooms. Is everything
teacher-created and bought at
the teacher supply store, or are
they displaying student work?
Does the school feel safe?
Q: Has the landscape
changed since you started
Families Empowered? It’s
been several years now.
A: Yes. Each year demand
increases. We’re seeing more
demand in the outer suburbs.
That was crystal clear last year.
[email protected]
1. T.H. Rogers, Houston ISD
2. Fort Settlement Middle, Fort
Bend ISD
3. Beckendorff Junior High, Fort
Bend ISD
4. Seven Lakes Junior High, Katy
ISD
5. Wharton K-8 Dual Language
Academy, Houston ISD
6. Garland McMeans Junior High,
Katy ISD
7. Pin Oak Middle, Houston ISD
8. Lanier Middle, Houston ISD
9. League City Intermediate, Clear
Creek ISD
10. Harmony School of Excellence,
charter school
TOP 10 HIGH SCHOOLS
1. DeBakey High School for Health
Professions, Houston ISD
2. Carnegie Vanguard, Houston
ISD
3. Kerr, Houston ISD
4. High School for the Performing
and Visual Arts, Houston ISD
5. Clements, Fort Bend ISD
6. Clear Horizons Early College,
Clear Creek ISD
7. Eastwood Academy, Houston ISD
8. YES Prep - Southwest, charter
school
9. Clear Lake, Clear Creek ISD
10. North Houston Early College,
Houston ISD
HIGH-PERFORMING, HIGHPOVERTY SCHOOLS
ELEMENTARY SCHOOLS
1. KIPP SHINE, charter
2. Park Place Elementary, Houston ISD
3. De Chaumes Elementary,
Houston ISD
4. Houston Gateway Academy Elite, charter
5. The Varnett School - East,
charter
6. Accelerated Interdisciplinary
Academy, charter
7. Two Dimensions Preparatory
Academy - Veterans, charter
8. KIPP SHARP, charter
MIDDLE SCHOOLS
1. Houston Gateway Academy Elite, charter
2. Project Chrysalis Middle, Houston ISD
3. Two Dimensions Preparatory
Academy - Veterans, charter
4. Houston Gateway Academy Evergreen, charter
5. Houston Gateway Academy Coral, charter
6. YES Prep - West, charter
7. Energized For Excellence
Middle, Houston ISD
8. Two Dimensions Preparatory
Academy - Vickery, charter
HIGH SCHOOLS
1. Eastwood Academy, Houston
ISD
2. YES Prep - Southwest, charter
3. North Houston Early College
High, Houston ISD
4. East Early College High, Houston ISD
5. Harmony Science Academy,
charter
6. YES Prep - North Central,
charter
7. Alief Early College High, Alief
ISD
8. YES Prep - East End, charter
xx
Houston Chronicle | HoustonChronicle.com and chron.com | Sunday, April 26, 2015 |
M5
Area districts juggle accelerating growth
Officials say they
plan to continue
proposing bonds
every three years
By Leah Binkovitz
A number of school
districts in Houston’s
booming suburbs have responded to the challenges
and opportunities of surging enrollment in recent
years. Leaders of others,
watching the subdivisions
rise, know the new students are coming.
In the shadow of bigger
districts like Katy and Fort
Bend, Lamar Consolidated ISD, for example, has
quickly become one of the
fastest-growing districts
in the state. The district
of some 28,500 students
added 1,700 in the past
year alone and expects
20,000 more over the next
10 years. Now its leaders
must pursue an aggressive bond schedule to accommodate these students
with new schools.
“It’s a juggling act for
sure,” said Kevin McKeever, administrator of operations for Lamar CISD,
based in Rosenberg.
It’s a challenge for many
area districts facing rapid
growth. They have responded with a series of
bond issues, including
Cypress-Fairbanks ISD’s
$1.2 billion package last
year, and many are struggling to attract teachers
and bus drivers. Groups
like the Austin-based Fast
Growth School Coalition
have taken up such issues
as tax rate caps that many
districts are approaching
as they scramble to fund
new construction. The
coalition represents 85
districts across the state,
including many in the
Houston region.
Alvin ISD in Brazoria
County, with just over
20,000 students, added
some 3,600 students, or
22 percent, in five years,
Eric Kayne
Hallways at George Ranch High School are packed with students between classes. Lamar Consolidated ISD is responding to rapid growth
in the district by pursuing an aggressive bond schedule to build new schools.
“For the longest time, it was just steady growth, no matter
what the economy did. ... (Now,) the growth is starting to
accelerate.”
Kevin McKeever, administrator of operations for Lamar CISD
according to the coalition. Like other booming
districts, Alvin has had to
reconsider school boundaries to balance demand
with available classroom
space. With developments
like the 1,300-home Meridiana in the works, the
district expects to add
more than 5,000 students
in the next five years.
“Addressing the needs
of a growing student population is a top priority in
Alvin ISD,” said the district’s director of communications, Daniel Combs.
A 2013 bond issue funded
four high schools now
under construction, and
community leaders are
again evaluating needs to
make more recommendations to the school board.
Smaller districts have
felt the impact as well.
In Montgomery County,
New Caney ISD, with
roughly 12,300 students
in the 2013-2014 school
year, grew by 35 percent
from 2009 to 2014. Lamar
CISD, meanwhile, added
some 4,100 students in
that time, growing by 18
percent. In those districts,
every new housing development is eyed with great
interest.
Community support
McKeever has been
with the Lamar district for
20 years and remembers
when it was less than half
the size it is today. “For the
longest time, it was just
steady growth, no matter
what the economy did,”
said McKeever.
Now, he said, “The
growth is starting to accelerate.”
The district has passed
bond issue after bond issue with hearty community support, including its
most recent $240.6 million
bond package in November. This one included
plans for five new elementary schools, a new middle
school and practice swimming pools as well as
new land purchases. The
district plans to continue
asking voters to approve
bonds every three years or
so, said Mike Rockwood,
executive director of community relations.
The construction funded by the bonds has helped
the district keep up with
the growth. Only a handful of elementary schools
are over capacity and only
two exceed it by more than
40 students. And the district has maintained its
unusual practice of capping high school enrollment at 2,000 students,
with two exceptions. With
a fifth high school set to
open in Fulshear in the fall
of 2016, McKeever said he
isn’t worried about enrollment getting out of hand.
Smaller campuses are
a district priority, set by
the school board. While
the district has kept its eye
on Katy as it experiences
similar growth, McKeever said, “Our district
is a little different than
other districts because we
have smaller high schools
and we put all of our secondary schools on one
campus.” That allows for
students across grade levels to share facilities and
helps teachers work together to coordinate curriculum.
As the district — which
received an A-rating in an
annual report from the
nonprofit Children at Risk
for nearly half of its campuses this year — finds
its footing, it will contend
with challenges familiar
to many districts. These
include performance gaps
between economically
disadvantaged students
and their more affluent
peers and between African-American and Latino
students and their Anglo
classmates. They also see
minority students punished at disproportionate
rates.
As the district competes
for teachers, bus drivers
and other employees, its
leaders for the first time
have sent recruiters as
far away as Puerto Rico
to seek qualified bilingual
teachers, according to
Laura Lyons, the district’s
executive director of elementary education.
Special programs
District officials also
are trying to keep up with
a changing job market
for students. Much of the
area’s growth is tied to a
boom in science and technology jobs, said academic administrator Valerie
Vogt, who has worked to
make sure those skills are
taught in the classrooms.
Last year, the district
piloted a program that
would give students credit
at any major university in
Texas for computer science and calculus classes.
Another career and technical education program
offers welding and other
certificates.
“You kind of run the
gamut with those kinds
of programs,” Vogt said,
whether a student wants
to go on to college or
straight to work.
But the program that
has the most buzz right
now is definitely the new
Barrington Irving summer program. Irving, who
made a name for himself
as the youngest person
to fly around the world
alone, has partnered with
the district to guide a
handful of eighth-grade
students as they build a
race car from scratch over
12 weeks.
Students will rotate
through several units,
learn to use a design software used by architects
and engineers and design
their own dragsters. By
the end of it, said Creighton Jaster, an assistant
principal who helped
design the program, “I
should have a fully functioning, street-legal, wonderful car.”
The idea is to give students a taste of science
and technology career
paths before they even enter high school and have to
settle on an endorsement
under new state requirements.
“I’ve been in the business since 1974 and I’ve
never seen anything like
this,” said Vogt.
[email protected]
M6 | Sunday, April 26, 2015 |
Houston Chronicle | HoustonChronicle.com and chron.com x x
Principals of top schools share their take
The Chronicle posed
questions to principals of
several high-performing
schools. Here is a sampling
of their answers:
John T. Threet
Principal, West University
Elementary, Houston ISD,
No. 2 elementary school
Q: What makes your
school special?
A: We have a high expectation for all children. We are the
largest HISD elementary school
at 1,274 students.
Of this number,
over 96 percent
live within our
school zone.
Threet
Our school has
moved from a magnet school
with 37 percent of our students
transferring from other schools
in 1996 to becoming a neighborhood school with less than 4
percent who do not live within
our zone this year. Over time
that number will drop as the
former magnet students matriculate through our school and
move on to middle school.
Q: How do you deal with
the pressure of high-stakes
testing?
A: We focus on teaching and
learning. I became principal
here at West U in 1996 after
three years as the principal at
a Title I (high-poverty) school.
At that time I told the teachers if we focus on high-quality
instruction that is aligned
to the state objectives (now
called TEKS), our children will
perform well on state assessments. The emphasis must
be on teaching the objectives,
not on test review. We also
begin interventions for children who struggle in the fall
semester. Between classroom
preparation and tutoring or
other interventions, our kids
are well-prepared by the time
the STAAR rolls around in the
spring. This takes pressure
off of both the teachers and
the children. Vince Lombardi
wisely said, “Practice does not
make perfect. Perfect practice
makes perfect.” This is as true
for learning as it is for sports.
What we do in practice is what
we will do when game time arrives on testing day.
Q: How do you keep your
staff motivated?
A: I am a firm believer in hiring the best people I can, giving
them their marching orders,
and then getting out of the way
to let them do their job. There
are a few non-negotiables in
our instructional program, but
generally I give teachers a lot of
freedom to use methodologies
that work for them. I also treat
my co-workers like professionals. We have mutual respect
and trust for each other. They
don’t work for me; they work
for HISD. While there is no
doubt who is in charge, I follow
a leadership principle taught
to me by my grandfather: “The
No. 1 rule in business is take
care of your people. If you take
care of them, they will take
care of you.” This means if I
take care of our faculty, they
will accomplish the goals and
mission of this school for me.
It’s worked for the last 19 years
at West U and worked for three
years prior to that at my other
school.
Q: How do you balance
budget constraints with your
programmatic priorities?
A: It is a matter of looking at
the budget to see what we have
to have versus what we would
like to have. There are certain
elements of the school budget
that are driven by state law.
Once these are covered, it is a
matter of determining which
elements are “nice to have”
and which are “have to have.”
Instruction takes precedence
over everything. I also believe
in keeping administrative costs
to a minimum. Given the size
of our school, I have a relatively
small office staff and administrative staff. This frees up funds
for instruction.
Q: How much does class
size matter?
A: There have been many
small research studies on the
impact of class size on student
performance conducted across
the country going back to the
1980s. Most of this research
indicates that classes would
need to be 15:1 in order for there
to be substantial improvement
in student performance. It has
been our experience that the
key lies in hiring good teachers.
Whether a class has 22 or 24
doesn’t make much difference.
The greatest impact on student
performance is teacher performance.
Keri Fovargue
Head of school, River Oaks
Elementary, Houston ISD,
No. 3 elementary school
Q: How do you deal with
the pressure of high-stakes
testing?
A: In order to deal with the
pressures of
high-stakes testing, our faculty
participates in
careful and strategic planning.
Grade level
teams have a
Fovargue
road map years
in advance that
includes alignment across all
grade levels and subjects. The
curriculum chosen is relevant
and meaningful and pacing is
critical. We also think of testing
as a process. The preparation
starts in kindergarten, and
skills scaffold as developmentally appropriate. We transcend
learning across the disciplines
such as connecting literature
to science and social studies,
and we dissect the extent of the
depth and complexity of each
and every task we ask students
to perform. By the time the
“test” appears, the students are
ready!
Q: What is the one piece
of advice you’d give a parent
trying to choose a school?
A: First and foremost, I encourage parents to decide what
they want from a school. Then,
find a school that aligns with
those expectations. Visit the
school to make sure that it will
be a great fit for the student and
the family.
Q: What’s the one thing
you wish people better understood about your school?
A: It is easy to stereotype
River Oaks Elementary by the
location alone. Sixty percent
of our students travel to us
each day from all over the city.
Because they bring a range
of experiences, cultures and
abilities, differentiation drives
every conversation. If you were
to take a snapshot of the city of
Houston, you would find the
“mini” Houston right here at
ROE!
Q: What is your biggest
brag about your campus?
A: The kids! The teachers!
The families! The kids are truly
amazing. Everyone has the
learning of the child front and
center. We exemplify what public education should be everywhere — families, schools and
communities working together
to propel children forward. I
know we do a pretty great job
of this!
Joanna Hagler
Principal, Commonwealth
Elementary, Fort Bend ISD,
No. 5 elementary school
Q: What makes your
school special?
A: Students at Commonwealth have a
strong sense
of belonging
because of the
long-standing
partnership
with parents,
the community,
Hagler
and the schools
in our feeder
pattern. This is a place where
the community has banded
together to create an environment for families. Our school is
just one part of the greater community striving to do our best
of our kids. This is just a great
place to be a kid!
Q: How do you define success at your campus?
A: Success is when all
students reach their goals. Any
parent with more than one
child will tell you that what
works for one, may not work
for another. We feel successful
when we create the path to success for every child.
Q: What are the extracurriculars that you feel benefit
students the most? How
does your school provide
those?
A: Our extracurricular
activities are eclectic, which
helps us meet the wide variety
of interests of our students.
Staff and parents partner to
provide the Math Masters Club,
Cougar Fit Club, Garden Club,
and Green Team, just to name
a few. We want our students to
try new things so staff is always
thinking of ways to entice them.
Q: What is your biggest
brag about your campus?
A: My biggest brag about
Commonwealth is how beautifully children from different
countries and cultures can
become unified within a school.
We are very diverse, which
makes for the most fascinating
discussions in classrooms. Our
students share their experiences to create such a rich learning
environment.
Heather Motzny
Principal, Sampson,
Cy-Fair ISD,
No. 10 elementary school
Q: What makes your
school special?
A: We have a very talented
and dedicated
staff that are
willing to do
whatever it
takes to help
our students be
successful. We
are also very
Motzny
fortunate to
have the support of not only our parents,
but the entire community.
Q: What is your biggest
brag about your campus?
A: We are very proud of
the many community service
projects that our Sampson
Stallions have participated in
this year. The students have
created items for local chil-
Principals continues on M7
xx
Principals from page M6
dren’s hospitals and nursing
homes, raised money for local
charities, and collected school
supplies for students. Our
goal is to ensure that each child
becomes a contributing and
responsible member of society.
Q: How do you deal with
the pressure of high-stakes
testing?
A: The focus at Sampson
is on student growth. We
provide high-quality first-time
instruction for our students
and then target specific student
needs. We are very thankful
that our superintendent, Dr.
Mark Henry, allows us to focus
on our students, and not the
tests.
Susan Monaghan
Principal, Pin Oak Middle,
Houston ISD,
No. 7 middle school
Q: What makes your
school special?
A: Pin Oak Middle School is
an exceptional
school because
we create
smaller learning environments within a
large campus.
Students are
assigned a
Monaghan
grade-level cluster in one of the three houses.
This allows for a much smaller
group of students to work with
a cluster of teachers and have
the flexibility to meet with
parents, students, and to plan
for instruction. Pin Oak is a
separate and unique school. We
are a magnet school for foreign
language, offering five different
languages, as well as a boundary option school, providing the
opportunity for students zoned
to Pershing, Johnston, or Jane
Long to apply to our school. The
diversity of our student popula-
tion makes us different and
unlike other middle schools.
Students share in a dynamic
learning experience and take
away positive memories that
last a lifetime.
Q: What are the extracurriculars that you feel benefit
students the most? How
does your school provide
those?
A: Pin Oak Middle School
is all about providing choices
for our students. The middle
school years are the time to
explore and decide where you
want to excel. We have bright,
fun and ambitious students
who enjoy selecting from
the following options: UIL
academics, outstanding sports
programs, dance, large variety
of clubs, theater, choir, band,
orchestra, Name That Book, architecture, intro to engineering,
sports history, debate, chess,
reel-to-real, technology, robotics, home economics, guitar,
photography, art, clay sculpting
and more. The outstanding
staff at Pin Oak are able to provide these opportunities for our
students because of their own
personal area of excellence.
Jennifer Day
Principal, Wharton Dual
Language Academy,
No. 5 middle school
Q: What makes your
school special?
A: Wharton PK-8th Dual
Language
Academy is a
magnet school
that houses the
only 100 percent Spanish/
English dual
language proDay
gram in HISD
and an International Baccalaureate Primary
Years Program World School.
Wharton students are academically prepared for high
Houston Chronicle | HoustonChronicle.com and chron.com | Sunday, April 26, 2015 |
school and college when they
graduate from 8th grade. Our
PK-5th grade IB program of
inquiry prepares our middle
school students to take on the
rigorous academic curriculum
we provide in middle school,
including pre-AP courses,
algebra and AP Spanish.
Q: What are the extracurriculars that you feel benefit
students the most? How
does your school provide
those?
A: We have many community partnerships with art
organizations that provide artist-in-residence programs and
presentations for PK-8th grade
students, like FotoFest Literacy
Through Photography, Art
League of Houston, Writers in
the Schools, Da Camera and
Houston Grand Opera. Our
students participate in several
UIL activities like spelling
bees, oral reading, impromptu
speaking and cross-country.
Other extracurricular activities
on our campus include Name
That Book, Spanish Book Club,
Odyssey of the Mind, and Student Council.
Our after-school program provides academic and
extracurricular programs for
PK-8th grade and is sponsored
in part by our CASE grant.
Students receive support in
both English and Spanish during homework time or tutorials and then enjoy a variety of
activities including ballet folklorico dance, hip-hop, world
percussion, culinary class,
gardening, sports and chess.
Q: What is your biggest
brag about your campus?
A: I am exceedingly proud
of the hard work and dedication of our staff, who promote
high expectations and provide
rigorous instruction in two
languages. Our students leave
Wharton well-prepared to
tackle the challenges of high
school and college. We are a
small school that thinks big!
David Yaffie
Principal, Clements High,
Fort Bend ISD,
No. 5 high school
Q: What makes your
school special?
A: Clements is unique
because our
students are
highly engaged
in their passions. Whether
those interests
are in academics, athletics, the
Yaffie
arts or student
organizations,
our kids strive to be the best.
I believe that Clements students are successful due to five
main factors: their high level
of engagement in school, their
respect of others, their creativity, their ability to collaborate
and the high expectations they
have of themselves. Another
unique thing about CHS: the
building could be open 24-7-365
and we would have kids here.
I arrive to school most days by
6:30 a.m. and there are already
many kids in the building. Also,
there are students here well into
every evening. There is always
something happening at CHS!
Q: What are the extracurriculars that you feel benefit
students the most? How does
your school provide those?
A: The extracurricular
activity that matters the most
is the one in which a given
student finds a connection to
his or her passion and to other
students and an adult sponsor.
We have over 60 active student clubs and organizations.
That number does not include
athletic teams. Each club has
a volunteer faculty sponsor.
Our clubs range from the
traditional (chess, FFA, etc.), to
the academic (honor societies,
language clubs, robotics, etc.),
M7
to the service-oriented (Habitat
for Humanity, Red Cross, etc.),
to the playful (badminton, table
tennis, etc.).
Q: How much does class
size matter?
A: For most classes, the number of students enrolled in a
given period is not a big issue as
long as there is physical space
and enough desks in the classroom. The tipping point is that
teachers have too many total
kids each day. There is no way
for a teacher to give the needed
feedback and support to 160180 kids each day. Just think of a
high school English teacher that
wants to provide detailed written feedback to each student
about essays and research papers. Or, think about the math
teacher that wants to diligently
grade homework and provide
assistance beyond marks indicating right or wrong. This is a
daunting challenge.
Q: What is the one piece
of advice you’d give a parent
trying to choose a school?
A: I am confident that almost
all parents want their children
to attend a school that is safe,
has teachers that genuinely
care about their kids, provides
a relevant academic challenge,
and will prepare their students
for life. The best way to learn if a
school has these characteristics
is to visit it during the school
day, talk with faculty and staff,
attend school events, and meet
parents whose children attend
the school. The worst way to
pick a school is to base one’s
choice solely on standardized
test scores or social media sites.
Q: What is your biggest
brag about your campus?
A: The most recent point of
pride for CHS is that we have
seven current seniors who have
been accepted to Stanford. That
is a very high number as most
high schools usually only get
a maximum of one or two students accepted each year.
M8 | Sunday, April 26, 2015 |
Houston Chronicle | HoustonChronicle.com and chron.com x x
Pre-K not just about quantity, but quality
By Mihir Zaveri
The 12 children in Vanessa
DeSimone-Canseco’s pre-kindergarten class marched to the front
of the room and pasted on an easel
the paper body parts of an ant.
Most of the picture was complete, with brown circles diligently glued on for the insect’s head,
thorax and abdomen, which the
children had also labeled.
But 5-year-old Abigail Castro
noticed something was missing. “We need two more,” Castro
called out. The ant only had four
legs.
Castro, like much of the class,
had learned that insects have six
legs — an exercise not just in life
science, but also in counting, classification and comprehension
that could potentially boost the
child’s academic achievement in
kindergarten and beyond, experts say.
Like most districts in the Houston area, Spring ISD offers only
half-day pre-K due to limited
state funding. But as momentum
for pre-K expansion grows at the
state and federal level, districts
increasingly are eyeing the expansion of early childhood programs
to improve academic outcomes.
“If we went to a full-day program, there ... could have a greater, and longer lasting impact with
more instructional time,” said
Spring ISD spokeswoman Sheleah Reed.
The pre-K focus is widespread.
Klein ISD has included an early
childhood and pre-kindergarten
center as one of the larger components of a bond measure coming
before voters in May. Trustees in
several districts, including Houston ISD and Cypress-Fairbanks
ISD, Texas’ largest and third-largest school systems, have formally
urged the state to fund full-day
Brett Coomer / Houston Chronicle
Marshall Elementary School pre-K teacher Vanessa DeSimone-Canseco sits with her students during a lesson.
pre-K.
The state helps fund halfday pre-K programs for at-risk
students, including those from
low-income families and those
with limited English skills. Most
districts in the Houston area provide half-day programs; a few, including the Houston, Aldine and
Spring Branch districts, provide
full-time instruction.
Christopher P. Brown, a professor of early childhood education at the University of Texas at
Austin, said research has shown
consistently that pre-K programs
improve academic outcomes, especially for the at-risk children
many programs target.
“You get more bang for your
buck than waiting until later in
their lives,” Brown said.
Sharee Cantrell, early child-
hood director for Spring Branch
ISD, who runs one of the district’s
pre-K centers, said data show
that students who went through
its full-day pre-K program outperformed non-pre-K students
on every standardized test from
elementary school all the way to
ninth and 10th grade.
The gains were particularly
pronounced for economically
disadvantaged students. On
ninth grade end-of-course exams
in 2013, students who took pre-K
in 2002-03 passed at rates 14 to
20 percentage points higher than
non pre-K students.
Cantrell said a half-day program simply isn’t long enough to
realize the full impact of pre-K.
“When you have a half day, the
teacher has twice as many kids
to teach the same information in
half as much time,” Cantrell said.
“It’s kind of difficult all the way
around.”
Full-day pre-K costs about $6
million more than the state funds
for half-day, money that the district picks up from its general
fund, tuition from more affluent
parents and federal funds, among
other sources, according to the
district’s data.
Brown said simply instituting
a program — full day or half day
— is not enough. The structure
of the programs is critical. And
even when the classes are well designed, rankings like those from
Children at Risk continue to be
correlated with factors like poverty.
For example, Conroe ISD,
where 85 percent of elementary
schools were ranked A or B by
Children at Risk, has only a halfday program, with no plans to
expand, according to district officials. Just over 35 percent of Conroe ISD students are economically disadvantaged, and the district
encompasses upscale areas like
The Woodlands.
In comparison, 20 percent of
Spring ISD students ranked A
or B, but almost 75 percent of its
students were economically disadvantaged. That’s part of the reason the district wants to expand
its pre-K offerings.
Walking into a classroom and
seeing if kids and teachers are engaged is a good way for parents to
evaluate a pre-K program, Brown
said.
[email protected]
twitter.com/mihirzaveri
xx
Houston Chronicle | HoustonChronicle.com and chron.com | Sunday, April 26, 2015 |
Reinvented Third Ward school thrives
Principal personally
fields parent calls
for Baylor-partnered
magnet academy
By Jennifer Radcliffe
An unlikely factor influenced
Baylor College of Medicine Academy’s ascent to No. 32 in this
year’s Children at Risk regional
middle school ratings: unlimited
cell phone minutes.
Principal Jyoti Malhan plastered her number all over town
as she recruited students to the
Third Ward magnet, once home of
the troubled Ryan Middle School.
She forwarded the district and
campus phones to her cell, fielding calls from prospective parents
while driving and late at night.
“I pay my phone bill and I used
it,” said Malhan, who helped open
the Young Women’s College Preparatory Academy prior to being
tapped for the Baylor school two
years ago.
The goal was to open the school
with at least 100 students, an ambitious endeavor considering its
location and nonexistent track
record. (Or worse, the record of
Ryan Middle School, which was
last ranked by Children at Risk
in 2013 with an F — No. 277 of 283
middle schools in the region.)
Despite the obstacles and the lastminute opening, Malhan received
450 applications.
This year, the 480-student
school, which now enrolls sixthand seventh-graders, received
nearly 1,800 applications and has
a wait list more than 900 deep.
Success, however, depended
on more than numbers. Malhan
had to take the 250 students who
were selected through a random lottery — from all different
academic backgrounds — and
make sure they succeeded in the
college-prep curriculum that includes classes like Latin and neuroscience. From hiring the best
teachers to motivating students
to attend Saturday tutorials, it’s
been a massive undertaking.
Sixty-nine of the original 250
sixth-graders ended up on academic probation after the first
academic term. Sixteen were sent
back to their zoned schools at the
end of the year because of aca-
Melissa Phillip / Houston Chronicle
Sixth-graders Joseph Mazariego, 12, left, and Roland Reyes, 12, right, play chess during their
lunchtime at Baylor College of Medicine Academy.
demic shortfalls.
The hard work has paid off.
In just two years, the reinvented
campus has emerged as a rare
success story among open-enrollment middle schools in Houston
ISD, debuting in the 2015 rankings with an A+ rating and as the
sixth best middle school in the
state’s largest district.
“I would only feel good if I was
No. 1, 2 or 3,” said Malhan, who
is quick to point out that all of
the Houston ISD schools ranked
above hers have selective admission.
While the open-enrollment
model is mandated by a federal
magnet grant for the campus,
Malhan said it creates tremendous challenges, especially for a
small, specialty school. Some students enter the school — where all
classes are pre-Advanced Placement — ready for high-school level math, while others are failing
standardized tests and working
at a third-grade level.
Most started in the middle, but
“the middle has shrunk and that
is the challenge,” Malhan said.
Because of the disparity in
From left, sixth-graders Matthew Jimenez, 12, and Ronit Pillai,
Serena Hammond, and Anjni Patel, all 11, talk about the school.
students’ backgrounds, the staff
spends considerable time ranking, tracking and scheduling
students to make sure students’
needs are met.
Students said they enjoy the
higher expectations.
“You get hooked on it,” said
Matthew Jimenez, 12, who came
to Baylor Academy from Wilson
Montessori in Montrose. “The
staff makes it really nice because
you know you’re in a safe place.”
Anjni Patel, 11, who came from
River Oaks Elementary, said her
favorite class is neuroscience.
She’s enjoyed dissecting a chicken
wing and a cow eye.
“It’s so much fun,” she said.
”You have such great teachers
who help you get through all the
hard times.”
The partnership with Baylor
College of Medicine, which provides training, curriculum and a
full-time faculty member, sets the
school apart. Ideally, Malhan said,
her campus would feed students
into the prestigious and selective
DeBakey High School for Health
Professions, which opened in the
1970s as a partnership with Baylor
College of Medicine to guide more
minorities and low-income students into the medical profession.
M9
Doubts about whether the students could learn Latin melted
within 15 minutes, said Robert
Giasson, one of three full-time
Latin teachers at the school. Students were quickly enchanted by
the language.
“Everyone was really a little
skeptical and dubious at first —
the parents and the students,”
Giasson said. “All those questions
are gone now ... Latin is often
thought of as a really archaic, elitist language, but we have students
from the Third Ward reading and
speaking it.”
And while middle school tends
to be a wasteland, options that
enable students to specialize in
particular themes seem to work
well. They provide a focus to
adolescents who are easily overwhelmed by hormones, life and
increasingly difficult academics,
experts said.
“Middle schools are traditionally where students perform the
worst,” said Robert Sanborn,
head of Children at Risk. “They
go from these little elementaries
to these factory-sized middle
schools. It’s really tough on kids.”
When kids don’t make a connection with their school — by
finding a mentor, a career path or
an extracurricular activity — they
often decide to drop out. Highperforming middle schools are a
student’s best chance to stay on
track, Sanborn said.
“We absolutely need more of
these,” he said.
While most embrace the Baylor Academy, Malhan said she
has felt some backlash from community members who wondered
why improvements weren’t
made when the school served the
neighborhood. When it closed
in 2013, Ryan Middle School had
dwindled to 272 students, 84 percent of them black and 15 percent
Hispanic.
Today, the campus is about
45 percent Hispanic, 30 percent
black and 25 percent white and
Asian, better reflecting the city’s
population, as is mandated by the
federal magnet grant.
“My intention is to reach out to
everyone,” Malhan said, adding
that children from the neighborhood aren’t given any preference
in the lottery.
[email protected]
M10 | Sunday, April 26, 2015 |
Houston Chronicle | HoustonChronicle.com and chron.com x x
Alley Theatre offers way to mix
STEM lessons, arts methods
ABOUT THE
RANKINGS
The 2015 public school rankings
from Children at Risk include
nearly 1,350 campuses from the
eight-county Houston region. The
local nonprofit used data from the
Texas Education Agency to rank
the schools from best to worst and
to assign each a letter grade, from
A+ to F.
The rankings were based largely
on student performance on state
exams in reading and math. The
analysis also takes into account
annual student progress on the
tests and the relative scores of
low-income students.
The 2015 rankings are not directly
comparable to those from last
year. Children at Risk revised its
statistical analysis and changed
the variables for high schools.
The ranking indexes
Marie D. De Jesus / Houston Chronicle
Guest teacher Sarah Bassinger combines theater techniques with a lesson about the carbon dioxide cycle at Emerson Elementary.
Districts part of growing trend to add arts
in classrooms, turning STEM into STEAM
By Ericka Mellon
The fifth-graders at Emerson
Elementary sat on the floor in a
circle and awaited instructions
from their guest teacher, Sarah
Bassinger, from the Alley Theatre.
“Today, my friends, we’re going to the grasslands,” she told
them on a recent morning. “Grab
your ecologist jacket.”
The children slid their arms
through their imaginary gear,
then Bassigner led them through
a lesson on the oxygen-carbon dioxide cycle, a key concept in fifthgrade science.
The two-week, hour-long lessons offered by the Alley Theatre to public schools across the
Houston area are part of a growing national trend to integrate
the arts more into academics. In
education lingo, the idea is called
STEAM, for science, technology, engineering, arts and math.
The term inserts the “A” into the
better-known buzzword, STEM,
which has gotten most of the attention and federal funding because of concerns that the United
States has fallen behind in science- and math-related fields.
Critics question whether a
focus on STEAM dilutes the
science and math or whether
schools may be spread too thin.
“It’s not anti-STEM. It’s
STEM-plus,” said Babette Allina, an executive director at the
Rhode Island School of Design.
Mary Sutton, who became the
Alley Theatre’s director of education two years ago, adapted her
“Staging STEM” program from
her work in California. Teaming
with local teachers, she and her
staff craft the lessons to ensure
they cover the concepts in the
Texas curriculum standards.
They give students written preand post-tests to measure their
results.
“There’s just a whole list of
learners who don’t learn by reading in a book or doing rote memory exercises,” said Sutton.
The Houston Ballet also sends
teachers into schools with its
“Dance To Learn” program,
helping explain magnetism or
Newton’s laws of motion, for example, said Jennifer Sommers,
the outreach coordinator.
The principal of Emerson
Elementary, Alexander Rodriguez, said he learned about the
Alley Theatre program from
representatives at a local farmer’s market. He liked the idea of
exposing his mostly low-income
students to theater professionals.
He thought the children, many of
them still learning English, could
benefit from instruction that let
them move and express themselves beyond desks and pencils.
“What we have learned is, the
more we give them opportunities to be creative, they can solve
problems better,” he said.
Rodriguez also was aware that
Emerson’s passing rate on the
state science exam had dropped
to 68 percent in 2014, down from
85 percent the year before. He
said he hired a more experienced
science specialist this school
year, and fifth-graders go to the
lab twice a week.
Emerson earned a grade of
C+ in the latest Children at Risk
rankings, based largely on highlevel test scores in reading and
math.
Zulema Esparza, an Emerson
fifth-grade teacher, said she started off skeptical of the Alley Theatre lessons — which finished a
few days before students had to
take the state science exam.
“At first I thought, ‘Oh my
God, there’s not enough science
content,’ ” Esparza said midway through the two-week stint.
“But as the days are progressing,
there’s more and more.”
She saw her students laughing, shouting out answers to
Bassinger and volunteering to
participate in scenes.
“They love it,” Esparza said.
“The second day, they were already hugging her.”
At Spring ISD’s Winship
Elementary, Principal Lauren
Thompson said she took a “leap
of faith” to devote two weeks of
science classes to the Alley Theatre program this year. To her relief, her students fared well on an
internal science test, with 83 percent passing, a few points above
the district average.
“Sometimes when students
are having fun, they don’t know
they’re learning,” said Thompson, whose school earned a C
grade from Children at Risk.
In Klein ISD, district officials are exposing students to
STEAM-related careers such
as engineering and architecture
through a traveling truck filled
with activities. The “STEAM Express” was funded by $400,000
in donations.
On a recent morning, Ehrhardt Elementary third-grader Aidan Jakobsohn headed
straight for the computer program allowing him to design a
roller-coaster. He clicked to create a loop, making it 397 feet tall,
with the car going 207 miles per
hour.
Too fast, the program said.
The 8-year-old tried again,
changing the measurements.
Then again.
“SUCCESS!” the screen
flashed at last.
[email protected]
twitter.com/e_mellon
Do letter grades leave struggling schools behind?
Lawmakers disagree on party lines whether
to use A-F system in judging districts
By Benjamin Wermund
Several years ago, the nonprofit education group Children
at Risk gave Briargrove Elementary a “C” on its annual school
report card. It wasn’t a failing
grade, but it was low enough to
motivate parents to do something. The PTO started tutoring
services for students who needed
extra help and put pressure on
the principal.
This year, Briargrove is an “A-”
school. It’s an example of how
an A-F ratings system — which
Children at Risk switched to
years ago and which lawmakers
are considering for the state’s annual school ratings — can help
prompt a school to improve, said
Robert Sanborn, president and
CEO of Children at Risk.
“What we found was when we
made the switch, parents seemed
to understand it a lot more,”
Sanborn said. “You had parents
working together to try to make
their school better, or parents
sort of using the marketplace ...
whether it’s ‘top tier’ or ‘meets
standards’ or whatever the jargon is — the A-F is just super
easy to understand.”
But the experience at Briargrove, in the Galleria area, also
makes a point for those who
don’t want the state to make the
switch to the A-F system: More
affluent schools will make better
grades — or improve more easily
— in part because parents at those schools
tend to be more engaged. In an A-F
system, detractors say, it
will be easy
to guess
w h i c h
schools will
get the worst
grades, largely
based on the
neighborhood
the campus is
in.
“I have serious
concerns that,
rather than help
u n de r p e r f o r ming schools, an
A-F grading system
merely stigmatizes underfunded schools and those
serving disadvantaged
communities,” state Sen.
Rodney Ellis, a Houston
Democrat, said.
Under a law approved two
years ago, individual schools
were to be ranked starting in 2016
as “exemplary,” “recognized,”
“acceptable” or “unacceptable.”
This would replace the current
categories, “met standard” or
“improvement required.”
A bill filed by Sen. Larry Taylor, R-Friendswood, and approved by the Senate last month,
would change that to letter
grades. Taylor said this system
would be easier for parents and communities to
understand.
“The campus A-F rating system provides Texas parents with a universally recognized, more
transparent way to
determine
t h e
quality of
their local
schools,” Taylor
said. “This knowledge
gives parents another tool
to make the best decisions
regarding their child’s education.”
Taylor also has filed a
bill to create a Texas Commission on Next
Generation Assessments and
Accountability to
provide a forum for
parents, educators
and
community
leaders to discuss
how the state should
redesign its school
assessment and accountability systems. Before assigning
A-F campus ratings, the Legislature intends to fully consider the
recommendations made by the
commission, he said.
So far the proposed shift to letter grades has drawn party-line
votes: Republicans have supported the move and Democrats
have opposed it. But now the bill
is headed to the House, where
opposition appears to be much
stronger. Such a grading system
was included in a bill approved
by the Senate two years ago, but
the letter grading was removed
by the House during negotiations over concerns similar to
those aired during last month’s
Senate debate.
Democrats argued that most
low-grade schools will be in poor
and minority neighborhoods.
Parents in most of those schools
will have little or no way to ensure improvement, Sen. Royce
West, D-Dallas, argued at the
time.
Focusing on the ratings themselves, however, is missing the
point, said Mike Petrilli, president of the Thomas B. Fordham
Institute, a national educationpolicy think tank. The ratings
assigned to a school are only
meant to communicate how well
the school is doing, and an A-F
system typically is the easiest to
understand, he said. But states
should really focus on building
the best accountability system.
Petrilli argued, though, that
a single grade doesn’t give full
picture. Instead, schools should
earn grades on multiple measurements, like students’ proficiency and the progress they
make over time.
“In my ideal world we would
use A-F, but have at least a handful of grades — just like a kid gets
on a report card,” Petrilli said.
“Parents can handle at least a
handful of grades.”
[email protected]
twitter.com/benjaminew
Student achievement: The
biggest factor in the formula was
the percentage of students scoring
“advanced” in reading and math on
the State of Texas Assessments of
Academic Readiness exams in 2014.
This measure counted 60 percent
for elementary and middle schools
and 30 percent for high schools.
Socioeconomic performance:
This factor credited campuses
that helped low-income students
succeed academically. Campuses
were rated on their deviation from
expected STAAR scores based on
their percentage of low-income
children. This index counted 20
percent for all schools.
Student growth: Schools were
evaluated on the gains their
students made on the STAAR
reading and math tests from the
prior year, compared with students
who scored similarly. This index
counted 20 percent. For schools
without sufficient data, Children at
Risk used their relative performance
on a different measure: the
percentage of students who met
the final recommended passing
standard on the STAAR exams.
College readiness: High schools
were judged on their graduation
rates; student participation on the
SAT and ACT college-entrance
exams and their average scores;
and the percentage of students
taking Advanced Placement and
International Baccalaureate exams
and their average passing rates.
Children at Risk calculated its own
graduation rates, giving schools
credit for freshmen who graduated
within six years from any Texas
public school. Students who may
have left for private school or
moved out of the state or country
count against the school. This index
counted 30 percent.
Key
The charts on the following
pages include some of the data
used in the rankings plus other
information. Schools are listed
by district, then ordered by their
Children at Risk rank and letter
grade. The list includes 870
elementary schools, 314 middle
schools and 163 high schools.
The reading and math scores
indicate the percentage of
students scoring at the “advanced”
level on the STAAR in 2014 and
the percentage meeting a lower
bar, the state’s final recommended
passing standard. The state’s
current school accountability
system uses an easier standard.
The list also includes student
enrollment for 2013-14 and the
percentage of economically
disadvantaged students.
The high schools show the
Children at Risk graduation rate.
Letter grades
A: Campuses at or above the 75th
percentile
B: At or above the 55th percentile
C: At or above the 35th percentile
D: At or above the 15th percentile
F: Below the 15th percentile
Notes
Schools were excluded from
the rankings for various reasons,
including if they lacked certain
data.
Schools that span numerous
grade levels, such as a K-8
campus, appear on both the
elementary and middle school
lists. The test scores used cover all
the grade levels, not the specific
grade spans.
The achievement index holds
schools accountable for the
“advanced” standard, a high bar
for many students. The data also
include, in some cases, a larger
pool than those counted in the
state’s accountability system.
Research by Children at Risk from
LaPorcha Carter, Jesus Davila,
Katie McConnell, Robert Sanborn
and Torey Tipton. Associate
professor Lori Taylor, of Texas
A&M University, conducted the
growth score analysis. Houston
Chronicle reporters Ericka Mellon,
Matt Dempsey, Jennifer Radcliffe,
Leah Binkovitz, Mihir Zaveri and
Benjamin Wermund contributed
data review and analysis and
reporting for this special section.
xx
ELEMENTARY SCHOOLS
HARRIS COUNTY
School
No.
of
stud.
Aldine ISD
Sammons
801
Carter Academy 952
Carroll Academy 1065
Stephens
977
Raymond Acad. 1,060
Marcella Int
811
Johnson
897
Oleson
1013
Worsham
904
Spence
1033
Odom
800
Magrill
1074
Ermel
698
Stehlik Int
988
Bethune Acad.
414
Anderson Acad. 687
Parker Int
898
Calvert
914
Kujawa
883
Orange Grove
937
Escamilla Int
957
Eckert Int
831
Houston Academy 655
Carmichael
1056
Reed Academy
914
Wilson Int
971
Bussey
1,095
Thompson
856
Goodman
843
Dunn
1,017
Harris Academy 682
Mendel
346
Rayford Int
728
Black
846
Francis
771
Jones
1076
Conley
854
Hill Int
759
Gray
977
Stovall Academy 571
Caraway Int
758
Smith Academy 583
Alief ISD
Outley
1,052
Mahanay
746
Miller Int
933
Liestman
894
Youngblood Int
1,110
Boone
892
Petrosky
680
Chancellor
781
Martin
929
Mata Int
815
Holmquist
1,167
Alexander
875
Budewig Int
1,185
Rees
722
Chambers
752
Cummings
604
Hicks
735
Hearne
1,173
Collins
1,069
Heflin
746
Owens Int
1,046
Landis
942
Klentzman Int
966
Youens
1,004
Kennedy
791
Bush
972
Horn
1,139
Smith
811
Sneed
1,190
Best
878
Channelview ISD
B H Hamblen
695
Crenshaw
577
De Zavala
604
McMullan
553
Harvey S Brown 766
Schochler
530
Viola Cobb
444
Crosby ISD
Drew Int
756
Newport
657
Crosby
215
Cy-Fair ISD
Sampson
1,166
Pope
965
Hamilton
980
Warner
942
Swenke
1,276
Gleason
888
Birkes
1,305
Keith
854
Black
1,022
Lamkin
969
Farney
1125
Adam
947
Lee
925
Moore
944
Millsap
782
Copeland
1,054
Rennell
1,102
Ault
969
Yeager
1,046
Postma
1,004
Bang
1,011
Wilson
1,056
Hairgrove
946
Matzke
934
Kirk
963
Lowery
860
Jowell
957
Danish
1,107
Sheridan
865
Holmsley
902
Robison
937
Post
1,103
Tipps
1,287
Hancock
1,050
Andre
1,296
Hemmenway
830
Emmott
832
Willbern
968
Fiest
1,129
Owens
967
Walker
1,095
McFee
1,234
Dr Debbie Emery 883
Robinson
1,027
Holbrook
1,123
Lieder
1,018
Metcalf
958
Duryea
1,029
Reed
975
Frazier
1,071
Horne
1,092
Bane
894
Francone
1,019
Deer Park ISD
Deer Park
779
Fairmont
831
San Jacinto
935
JP Dabbs
742
Carpenter
825
Deepwater
723
Galena Park ISD
Pyburn
697
North Shore
915
Tice
735
Purple Sage
521
Cloverleaf
862
Sam Houston
838
Normandy Cross. 646
MacArthur
727
Cimarron
813
Jacinto City
856
Shirley Williamson 694
Green Valley
764
Woodland Acres 427
James B Havard 681
Galena Park
681
Goose Creek CISD
Austin
969
Crockett
708
Walker
1024
Alamo
616
James Bowie
792
San Jacinto
550
Houston Chronicle | HoustonChronicle.com and chron.com | Sunday, April 26, 2015 |
M11
Working together at Liestman Elementary
Econ.
disad.
%
Adv.
read.
%
Adv.
math
%
Pass
read.
%
Pass
math
%
C@R Hou.
grade rank
85.0
88.0
92.0
86.8
85.6
93.7
95.5
89.8
91.9
90.9
94.9
79.0
88.5
87.9
75.8
81.4
84.6
91.0
87.5
92.7
92.6
91.9
79.8
82.3
86.9
79.2
93.4
88.8
87.9
81.9
93.0
91.6
73.5
89.6
91.7
77.0
87.6
85.8
90.5
90.0
89.8
90.2
15
10
11
12
11
7
9
9
9
7
8
9
7
8
7
15
8
9
8
9
8
6
9
10
8
9
5
9
8
9
4
7
9
7
5
9
6
5
5
5
5
3
24
22
16
17
17
19
19
16
13
16
15
13
12
13
14
8
12
9
11
10
10
11
11
10
11
10
9
9
9
7
9
9
8
7
8
8
9
10
7
8
6
4
32
31
30
29
35
26
29
27
28
19
26
28
26
27
21
38
25
23
25
29
29
20
31
27
29
30
25
21
26
26
20
17
31
23
17
27
21
25
19
15
17
14
43
40
33
45
33
44
33
37
32
31
38
30
33
28
27
23
28
21
28
24
27
30
24
23
24
27
19
22
23
24
22
24
23
18
18
19
23
25
21
18
18
13
B+
B
B
BBC+
C
C
C
CCCD+
D
D
D
D
D
D
D
D
DDDDDDDDDDDF
F
F
F
F
F
F
F
F
F
319
360
378
414
423
486
519
536
541
553
565
596
652
662
672
674
676
680
686
705
713
716
718
729
731
742
745
751
755
756
759
760
763
778
783
790
792
794
806
811
831
849
61.2
77.3
72.9
79.4
84.0
83.5
72.8
81.0
81.6
84.8
78.4
82.3
81.0
74.8
91.5
82.8
82.0
84.2
92.5
81.6
91.8
90.8
90.7
83.6
84.8
92.0
89.4
81.3
87.2
93.2
28
18
15
16
15
20
17
12
9
12
12
14
12
9
6
10
10
9
5
12
8
4
7
9
5
7
5
7
4
2
27
26
25
21
24
24
15
23
21
16
14
13
15
16
16
16
16
12
16
9
13
15
11
11
11
10
9
7
8
1
53
48
42
38
40
37
35
33
24
35
34
33
36
28
18
25
29
27
16
25
24
21
25
25
22
18
18
22
18
9
50
47
47
39
46
42
36
41
40
36
35
23
33
36
29
24
35
31
33
26
28
34
26
26
28
20
24
18
19
8
A
A
AAAB+
B
B
B
BC+
C
C
C
C
CCCCD+
D+
D+
D
DDDF
F
F
F
135
148
242
262
264
277
351
362
377
438
472
511
522
530
540
549
560
583
598
615
632
639
681
725
748
761
805
822
838
868
81.0
89.1
92.2
87.3
67.1
84.9
82.0
15
11
5
10
8
7
4
31
13
17
12
13
12
15
39
21
22
28
26
23
16
55
28
40
31
30
32
25
A
CD+
D+
D
DD-
154
582
618
630
687
727
730
45.8
51.0
40.9
13
14
14
17
15
7
41
33
44
37
30
23
C
CD-
544
594
744
2.1
6.6
7.3
9.8
9.5
43.8
25.7
11.1
32.0
50.2
25.6
46.5
61.7
31.0
51.0
30.3
22.6
24.3
49.8
31.1
59.2
54.0
84.4
54.0
67.6
39.1
77.1
70.7
67.3
59.9
21.6
67.4
79.2
56.9
76.8
73.6
62.6
62.2
48.8
63.4
71.1
77.2
68.7
74.2
89.3
80.2
82.9
74.1
75.5
76.7
67.5
93.4
84.7
54
47
45
43
38
34
29
37
32
26
28
27
24
27
25
30
30
29
26
25
21
19
15
20
21
26
13
19
17
19
23
17
15
18
15
13
14
17
19
19
13
15
13
14
10
12
13
11
12
9
12
7
10
57
52
50
49
44
36
41
41
34
29
36
28
34
33
26
31
36
33
24
32
26
29
25
26
27
23
26
23
22
25
30
24
22
20
20
20
23
20
21
18
19
19
18
18
18
18
16
18
16
13
14
12
12
80
77
76
71
67
56
59
68
57
51
58
53
52
53
54
52
59
57
51
54
46
46
34
44
38
55
35
42
41
46
51
42
34
41
36
37
34
37
46
39
36
38
35
39
30
27
31
33
29
28
31
22
24
81
78
77
74
68
59
69
68
58
53
59
53
57
55
49
55
61
59
48
54
46
53
49
52
45
47
53
46
44
48
56
44
43
41
43
38
42
37
43
37
39
35
44
38
34
38
32
35
33
32
28
31
28
A+
A+
A+
A+
A+
A+
A+
A+
A+
A+
A
A
A
A
A
A
A
A
A
AAAAAAAAAAAAAB+
B+
B
B
B
B
BBBBBBC+
C+
C+
C
CCD+
D+
D+
10
18
26
28
68
77
78
80
92
101
103
119
129
139
141
147
150
162
175
189
191
193
202
206
220
226
234
237
240
253
260
270
311
312
334
354
369
383
395
406
407
412
420
421
476
477
483
535
557
600
616
645
650
21.8
21.3
36.1
44.6
41.6
79.8
31
28
24
11
11
6
34
31
21
18
17
15
57
54
49
32
34
24
63
54
45
41
43
33
A
AB+
CCD+
116
212
325
558
595
634
84.4
86.2
88.0
87.5
92.9
93.6
81.1
89.0
83.8
89.4
68.3
89.1
82.7
68.1
90.3
15
14
13
13
7
10
13
10
13
9
10
5
12
14
7
23
22
19
20
20
19
13
13
12
16
17
14
14
13
15
32
31
34
35
27
30
31
25
28
32
32
24
28
33
24
47
46
37
43
43
40
34
33
29
38
35
31
34
31
33
B+
B+
B
B
BC+
C+
C
C
CCCCD+
D+
302
315
359
364
436
449
480
513
546
554
563
578
585
606
644
38.7
55.9
47.3
77.9
76.5
85.6
24
20
20
9
15
10
25
22
23
20
15
18
50
44
40
28
31
25
46
39
42
35
32
37
AB+
B
C+
C+
C+
222
300
372
448
473
474
Mayra Beltrán / Houston Chronicle
From left, Tracy Tran, 4; Evelin Batz-Osorio, 4; Evan Pham, 4; Promise Eche, 5; and Jacob Villanueva, 4, move
between work stations during their pre-kindergarten lesson at Liestman Elementary School, which received an
A- in this year’s Children at Risk school rankings. As part of Alief ISD, Liestman offers only half-day pre-K.
School
No.
of
stud.
Travis
865
De Zavala
770
Lamar
862
Carver
756
Highlands
881
Harlem
1,020
Ashbel Smith
807
Houston ISD
T.H. Rogers
794
West University 1,252
River Oaks
705
Horn
829
Bush
771
Condit
686
Oak Forest
818
Roberts
762
Wharton K-8
474
Harvard
717
Twain
923
Kolter
614
Briarmeadow Ch. 603
Travis
757
Park Place
1,034
De Chaumes
820
Crockett
474
Poe
771
Sutton
1,057
Lyons
1016
Lovett
7,23
De Zavala
553
Red
645
Carrillo
608
Herod
828
Askew
903
White
852
Parker
824
Neff
730
St. George Place 753
Anderson
637
Seguin
664
Elrod
658
Lantrip
765
Southmayd
698
Ketelsen
655
Garden Oaks
674
Golfcrest
790
Field
455
Wilson Montessori 501
Mandarin Chinese 333
Windsor Village 750
Briargrove
917
Walnut Bend
749
Briscoe
421
Scarborough
761
Cornelius
920
Ray Daily
745
Pilgrim Academy 1115
Roosevelt
710
MacGregor
505
Moreno
807
Sinclair
538
Henderson J.P.
795
Bonner
988
Valley West
830
Rice School
1,151
Sanchez
625
Pleasantville
317
Hines-Caldwell
788
Shadowbriar
392
Port Houston
343
Bell
813
Frost
597
Garden Villas
825
Energized-Excel. 1,623
Rucker
611
Durkee
741
Patterson
969
Cunningham
756
Burnet
509
Memorial
391
Emerson
923
Sherman
570
Cage
588
Kennedy
783
Shearn
567
Scroggins
631
Rodriguez
1,023
Braeburn
934
Pugh
434
Davila
479
Gallegos
529
Love
492
Berry
740
Crespo
958
Eliot
570
Longfellow
765
Texas Connections 3,890
Coop
755
Stevens
656
Burbank
919
Janowski
645
Smith
760
Franklin
479
The Rusk School 530
Lockhart
697
Brookline
1,002
Harris J.R.
641
DeAnda
764
Paige
356
Tijerina
491
Northline
616
Hobby
767
Harris R P
624
Benbrook
551
Barrick
718
Browning
612
Montgomery
632
Wainwright
751
Young Scholars
192
Gross
676
Burrus
420
Herrera
901
Robinson
738
Benavidez
905
Whidby
538
Young
389
Martinez R
526
Oates
397
McNamara
825
Econ.
disad.
%
Pass
read.
%
Pass
math
%
School
14
13
8
7
11
11
6
Adv.
math
%
C@R Hou.
grade rank
72.6
78.4
85.2
85.3
61.6
67.9
85.0
Adv.
read.
%
33
35
22
30
29
25
22
C+
C
D
D
D
DF
501
534
664
666
708
739
799
31.0
1.8
10.1
19.1
14.8
35.1
41.0
11.7
57.6
29.0
11.2
25.1
63.2
34.5
92.4
96.1
86.3
35.5
91.4
94.2
32.6
90.8
69.8
90.5
50.5
63.2
87.9
53.9
93.8
51.7
95.6
96.7
96.5
88.0
95.0
94.5
50.6
97.1
91.4
51.7
34.8
89.3
30.8
84.1
92.9
95.9
88.2
50.1
96.0
89.7
74.9
96.8
62.6
92.8
96.1
93.9
68.7
97.1
97.8
87.7
73.7
95.6
86.5
99.7
89.7
91.6
94.4
94.2
89.2
94.3
95.9
79.3
89.2
97.9
94.2
90.7
94.7
94.6
98.1
99.8
95.6
94.8
96.8
91.7
95.0
97.3
96.0
76.9
42.6
98.1
91.9
95.3
96.4
93.8
97.3
85.5
86.5
97.6
95.3
93.7
99.4
94.1
98.5
94.7
97.6
97.6
93.6
94.3
95.4
88.7
82.3
93.9
94.0
94.6
92.4
94.1
90.9
92.0
95.8
94.7
97.3
78
69
63
53
52
44
46
45
39
44
45
46
33
39
17
16
20
35
17
18
33
16
20
17
31
30
19
24
13
24
12
15
11
20
11
15
24
11
15
28
18
18
24
15
18
14
20
21
11
16
17
11
19
11
12
17
20
5
13
14
17
6
18
16
14
12
11
12
15
6
7
14
11
9
12
7
5
13
7
8
10
11
7
11
7
9
6
15
28
6
9
8
9
8
9
11
16
9
10
7
7
6
6
10
9
7
8
12
7
11
9
9
9
7
5
9
7
4
6
5
7
76
67
60
61
60
47
51
53
36
37
47
48
34
35
45
41
31
37
31
31
33
38
27
31
36
26
30
31
34
30
27
30
28
24
27
19
19
24
23
14
27
21
26
21
14
26
20
24
22
21
17
25
20
20
27
18
18
25
14
18
15
25
18
15
17
21
19
16
15
21
20
18
15
15
19
17
23
17
17
19
14
18
23
17
20
17
15
12
8
17
17
18
15
15
13
11
9
12
14
12
14
16
13
12
13
15
15
11
13
11
8
11
10
12
16
11
9
9
13
11
11
95
92
88
82
77
65
75
72
66
65
70
72
65
62
43
37
48
56
42
50
64
39
46
39
54
47
41
49
34
48
33
33
27
43
32
33
47
25
42
53
43
44
56
33
33
31
42
46
29
37
47
29
46
30
30
41
48
16
35
32
37
29
38
33
31
29
31
24
39
21
28
42
27
28
32
27
25
34
21
23
30
36
26
30
22
29
21
38
53
21
24
23
27
29
20
34
40
23
29
22
20
19
17
26
22
23
25
26
22
27
31
24
29
25
15
19
18
15
25
23
18
96
88
83
83
80
68
77
75
69
62
72
68
64
56
67
67
47
56
59
55
60
61
55
53
55
45
49
56
56
47
47
47
52
49
46
40
42
44
46
36
60
44
48
39
43
46
41
48
45
40
42
46
40
40
48
34
39
50
36
38
28
52
37
31
30
38
36
29
36
39
38
36
37
32
38
31
40
38
37
36
25
35
37
29
36
33
35
30
28
33
35
38
28
34
34
28
33
31
30
31
26
32
25
23
29
34
31
28
25
27
24
24
20
28
34
25
20
19
28
26
27
A+
A+
A+
A+
A+
A+
A+
A+
A+
A+
A+
A+
A+
A+
A+
A+
A+
A+
A+
A
A
A
A
A
A
A
A
A
A
A
AAAAAAAAAAAAAB+
B+
B+
B+
B+
B+
B+
B+
B+
B
B
B
B
B
B
B
B
BBBBBBBBBC+
C+
C+
C+
C+
C+
C+
C+
C+
C+
C+
C+
C+
C+
C
C
C
C
C
C
C
C
C
C
C
CCCCCCCCCD+
D+
D+
D+
D+
D+
D+
D+
D+
D+
D
D
D
D
D
D
D
D
1
2
3
6
13
14
17
19
24
33
40
45
52
53
62
67
83
87
99
114
120
123
145
159
167
173
174
181
183
184
205
215
216
225
233
243
244
246
249
250
251
258
272
275
283
284
292
294
308
327
328
331
332
335
341
347
352
365
366
374
390
397
403
408
409
411
427
429
441
445
450
451
455
459
464
471
479
482
489
494
496
499
502
507
509
517
518
523
524
529
538
539
542
547
556
572
576
581
590
591
593
597
599
604
610
612
625
626
627
641
643
648
655
656
661
673
683
684
685
690
693
Kelso
445
Garcia
744
Piney Point
1,207
Kandy Stripe Acad. 356
Gregg
531
Peck
563
Law
754
Mitchell
519
Foerster
673
Petersen
641
Helms
530
Bruce
598
Isaacs
380
Whittier
582
Wesley
439
Martinez C
572
Cook Jr
760
Durham
548
Jefferson
485
Tinsley
812
Dodson
444
Kashmere Garden 430
Reynolds
469
Dogan
616
Blackshear
343
Lewis
961
Milne
747
Grissom
569
Shadydale
804
Hartsfield
374
Bonham
1,059
Gregory-Lincoln 659
Alcott
399
McGowen
437
Ross
423
Codwell
555
Reagan K-8
1,194
Almeda
795
Fondren
465
Thompson
561
Marshall
803
Looscan
482
Mading
592
Woodson
890
Bastian
701
Foster
438
Highland Heights 618
Hiliard
861
Elmore
769
Atherton
536
Henderson N.
370
Huffman ISD
Copeland
493
Huffman Int
493
Humble ISD
Willow Creek
563
Atascocita Springs 928
Hidden Hollow
548
Fall Creek
745
Bear Branch
623
Shadow Forest
583
Eagle Springs
724
Greentree
740
Deerwood
563
Woodland Hills
524
Oak Forest
682
Foster
586
Summerwood
637
Lakeshore
913
Pine Forest
658
Ridge Creek
514
Maplebrook
668
Humble
534
Timbers
719
Elm Grove
472
Oaks
567
Jack M Fields Sr 543
River Pines
751
Park Lakes
700
Whispering Pine 731
North Belt
639
Lakeland
769
Katy ISD
Alexander
1,077
Bonnie Holland
989
Stanley C Stanley 1,312
Griffin
933
Hazel S Pattison 801
Sue Creech
827
Edna Mae Fielder 1,066
James E Williams 723
Katy
541
Tom Wilson
958
Odessa Kilpatrick 1,091
Fred&Patti Shafer 1263
Joella Exley
977
Woodcreek
1408
Roberta Rylander 1339
Ursula Stephens 756
Jeanette Hayes
682
Wolman
1,075
Rhoads
1,109
Winborn
742
Mcroberts
802
Nottingham Cntry 588
West Memorial
756
Schmalz
1,149
Hutsell
825
Robert King
1192
Memorial Parkway 860
Franz
956
Wolfe
446
Cimarron
646
Mayde Creek
765
Bear Creek
762
Morton Ranch
805
Loraine T Golbow 807
Sundown
853
Klein ISD
Hassler
706
Theiss
630
Benignus
939
Brill
738
Frank
606
Haude
707
Ehrhardt
683
Metzler
856
Blackshear
908
14
15
12
14
12
10
8
34
31
23
26
31
30
21
No.
of
stud.
Econ.
disad.
%
Adv.
read.
%
Adv.
math
%
Pass
read.
%
Pass
math
%
C@R Hou.
grade rank
23
22
27
10
28
24
26
22
22
21
26
25
17
21
21
13
18
22
23
22
19
15
14
10
13
18
15
21
14
10
22
16
15
14
13
14
18
15
18
15
17
9
14
12
12
8
7
9
7
8
11
D
D
D
DDDDDDDF
F
F
F
F
F
F
F
F
F
F
F
F
F
F
F
F
F
F
F
F
F
F
F
F
F
F
F
F
F
F
F
F
F
F
F
F
F
F
F
F
699
710
711
721
723
734
736
747
753
757
764
767
770
773
775
777
780
788
791
795
796
797
804
808
809
810
812
814
815
816
819
820
823
825
827
829
833
835
836
840
844
846
848
851
854
858
860
861
863
867
869
38.1
33.3
16
13
13
10
41
34
29
25
D+
D-
605
717
1.4
17.7
16.4
16.1
12.0
5.7
14.6
10.3
10.1
33.4
44.7
39.4
16.3
11.5
21.4
64.6
24.7
74.5
35.0
33.3
54.7
81.6
76.3
68.6
51.8
89.0
86.5
48
32
35
32
38
38
34
30
31
24
21
22
28
30
23
10
19
12
15
18
15
11
10
10
12
5
6
43
34
36
33
33
31
28
30
27
25
23
22
24
24
19
20
22
20
22
18
18
16
14
10
12
5
7
74
54
70
58
70
68
61
54
64
53
50
49
52
57
49
28
49
34
42
39
34
28
29
26
31
16
20
67
58
67
56
59
55
56
51
57
45
44
38
45
47
45
41
48
39
43
34
36
31
32
26
24
19
16
A+
A
A
A
A
A
AAB+
B+
B
B
B
BBBBC+
C+
C+
C
CCD
DF
F
65
107
112
140
142
186
200
254
293
317
357
370
379
404
418
419
425
447
456
467
503
550
567
700
722
818
824
3.2
3.9
5.7
4.0
2.9
12.2
14.4
5.7
23.3
2.6
4.2
2.0
13.5
7.7
13.2
63.1
22.1
2.2
62.7
40.7
64.6
11.6
44.6
55.5
69.5
48.2
48.4
62.4
54.0
32.4
63.1
66.4
58.5
52.0
74.7
54
49
46
46
45
41
42
48
42
40
42
44
41
37
39
23
29
33
18
22
15
32
19
20
14
19
20
16
16
17
15
15
12
13
9
48
53
48
45
45
41
39
42
41
45
53
47
40
39
39
27
37
40
25
26
23
23
24
20
17
15
14
12
16
17
12
11
11
13
10
82
77
76
75
80
70
69
73
71
74
76
77
71
66
65
53
59
67
46
53
41
59
48
49
37
46
47
40
41
43
39
34
34
38
28
75
77
74
71
73
62
64
66
74
69
76
70
66
61
64
53
63
67
47
49
43
50
43
43
38
30
33
27
34
39
32
30
31
32
25
A+
A+
A+
A+
A+
A+
A+
A+
A+
A+
A+
A+
A+
A+
A
A
A
A
AAB+
B+
B+
B
BC+
C+
C+
C+
C
CCD+
D+
D-
20
22
31
35
41
47
51
54
58
59
63
66
84
86
115
125
136
163
213
265
296
297
309
342
389
463
475
491
498
532
568
573
614
629
743
7.9
15.6
18.1
34.3
4.5
16.8
42.9
29.9
39.5
50
38
37
27
38
40
25
24
24
45
38
34
30
40
29
25
31
27
81
63
63
56
64
67
48
50
48
68
67
59
57
62
53
43
54
52
A+
A+
A
A
A
A
A
AA-
44
60
108
126
127
157
165
188
190
96.4
95.7
89.4
86.2
98.1
95.0
88.5
90.6
96.0
97.7
74.3
99.0
94.7
93.1
98.6
98.4
96.2
77.4
96.3
97.2
89.6
93.3
95.7
99.5
98.5
97.2
92.0
98.6
97.6
93.0
91.1
91.0
96.5
96.1
94.6
95.9
91.4
92.1
89.5
92.9
85.1
95.0
94.4
94.2
94.6
99.1
92.1
94.7
94.5
95.9
99.2
5
8
7
10
5
7
6
4
6
5
7
4
6
9
3
8
5
10
4
6
7
3
7
2
5
5
5
3
3
4
4
6
1
2
7
7
5
4
4
3
3
5
3
5
4
4
4
2
3
2
0
12
8
13
5
13
8
11
11
10
11
10
11
9
7
12
5
8
7
11
8
7
4
6
4
5
7
8
9
7
4
9
5
5
5
4
4
6
7
8
6
8
4
5
3
4
2
2
3
3
2
2
17
22
20
27
22
26
19
18
19
17
14
17
20
24
16
20
16
26
18
16
21
15
19
14
16
13
18
15
12
14
13
22
9
11
17
22
19
15
19
18
16
18
13
13
12
11
16
8
11
11
7
Elementary continues on 12
M12 | Sunday, April 26, 2015 |
Houston Chronicle | HoustonChronicle.com and chron.com x x
Elementary from page 11
School
School
Don Jeter
916
Longfellow
501
Walt Disney
555
Alvin
503
Mark Twain
816
Angleton ISD
Frontier
352
Central
609
Westside
1,013
Southside
419
Rancho Isabella 368
Northside
457
Brazosport ISD
Bess Brannen
464
A P Beutel
546
Elisabet Ney
520
Rasco Middle
817
Griffith
531
Gladys Polk
471
O M Roberts
535
T W Ogg
434
Velasco
604
S F Austin
271
O A Fleming
348
Lanier Middle
462
Jane Long
473
Columbia-Brazoria ISD
West Columbia
750
Barrow
635
Wild Peach
355
Damon ISD
Damon
187
Danbury ISD
Danbury
414
Pearland ISD
Silvercrest
832
Shadycrest
583
H C Carleston
788
C J Harris
676
Silverlake
711
Rustic Oak
560
Magnolia
802
Challenger
671
Rogers
923
Sablatura
825
Sam Jamison
818
Cockrel
805
Alexander
660
Massey Ranch
695
E A Lawhon
682
Sweeny ISD
Sweeny
859
No.
of
stud.
Schultz
873
Kuehnle
697
Benfer
693
Mittelstadt
873
Zwink
879
Klenk
783
Greenwood Forest 703
Kreinhop
850
Krahn
755
Roth
694
Northampton
813
Lemm
589
Kohrville
771
Mueller
815
McDougle
659
Bernshausen
675
Eiland
559
Kaiser
787
Epps Island
804
Nitsch
781
La Porte ISD
Leo Rizzuto
588
Heritage
599
Jennie Reid
485
Bayshore
530
La Porte
492
Lomax
519
College Park
461
Pasadena ISD
Meador
608
Turner
513
Atkinson
584
Frazier
565
Stuchbery
740
Jensen
671
Matthys
716
Bailey
800
Melillo
992
Pomeroy
968
Laura Welch Bush 1,003
South Shaver
645
Carter Lomax
1,021
Red Bluff
593
South Belt
529
Richey
895
Young
789
Garfield
921
South Houston
642
Fisher
833
Kruse
725
McMasters
431
Sparks
507
Burnett
672
Parks
527
Milstead
929
Pearl Hall
828
Teague
725
Moore
569
Mae Smythe
715
Schneider
865
L F Smith
843
Golden Acres
515
Keller
648
Morris
863
Morales
541
Jessup
866
Bobby Shaw.
846
Freeman
482
Genoa
811
Williams
815
De Zavala
750
Gardens
632
Sheldon ISD
Royalwood
552
Garrett
518
H M Carroll
728
Sheldon
695
L E Monahan
477
Spring Branch ISD
Frostwood
687
Memorial Drive
470
Wilchester
747
Bunker Hill
702
Hunters Creek
643
Valley Oaks
631
Rummel Creek
679
Meadow Wood
508
Housman
573
Thornwood
489
Nottingham
555
Ridgecrest
903
Buffalo Creek
657
Cedar Brook
898
Westwood
658
Terrace
486
Sherwood
452
Shadow Oaks
706
Edgewood
769
Woodview
643
Pine Shadows
813
Treasure Forest
647
Spring Shadow
814
Spring Branch
632
Hollibrook
799
Spring ISD
Northgate
738
Chet Burchett
710
Milton Cooper
789
Anderson
652
Ponderosa
729
Beneke
791
Carolee Booker
970
Pat Reynolds
735
Heritage
517
John Winship
538
Salyers
720
Mildred Jenkins
764
Smith
612
Meyer
719
Joan Link
683
Ralph Eickenroht 612
Deloras Thompson 692
Ginger McNabb
745
Helen Major
658
Gloria Marshall
673
Hoyland
892
Clark Int
1,509
Donna Lewis
693
Pearl M Hirsch
708
Bammel
894
Tomball ISD
Creekside Forest 769
Timber Creek
497
Willow Creek
861
Lakewood
763
Northpointe Int 942
Tomball Int
723
Rosehill
583
Canyon Pointe
834
Tomball
727
Decker Prairie
588
Charter
KIPP SHINE
810
Harmony Excell. 904
Harmony Sci-Hou 752
Gateway Aca-Elite 398
Varnett-East
387
Alief Montessori 283
Accelerated Inter. 233
Two Dimensions-Vet 223
Harmony Sci-WHou 840
KIPP SHARP
872
Harmony Disc.-Hou 757
Gateway-Coral
708
Gatewa-Evergreen 515
Two Dimensions-Vick 235
Harmony Sci-NW 666
Heights Learning 150
KIPP Explore(E.End) 928
Harmony Innovation 604
Beatrice Mayes
424
Stepping Stones 307
The Rhodes School683
SER-Ninos
572
Amigos Por Vida 522
Bissonet
432
Baker-Ripley
254
Harmony Fine Arts 664
KIPP Dream
821
Raul Yzaguirre
345
Aristoi Classical 430
Harmony Sci-Braes. 348
Acad.-Accel. Learn. 702
Harmony Explor. 350
Harm.Excel.-Endeav 567
Harmony Ingenuity616
Ripley House
330
Meyerpark
199
Varnett-NE
552
Draw Academy
309
KIPP ZENITH/Spirit 900
Zoe-Ambassadors 174
Zoe Learning Acad. 283
SER-Ninos II
272
KIPP Peace/Lib. 571
Magnum
398
Varnett-SW
851
KIPP Legacy
720
Victory Prep
268
Fallbrook Prep.
642
Econ.
disad.
%
Alvin ISD
L. Ingalls Wilder
Mary Burks Marek
Glenn York
Melba Passmore
E C Mason
Hood-Case
Savannah Lakes
Adv.
math
%
44.3
17.9
42.3
47.4
47.9
64.0
58.9
28.6
34.8
42.1
23.9
26.5
38.7
36.7
81.6
52.6
89.1
87.4
88.2
85.3
29
27
26
23
21
16
18
26
25
21
28
23
22
22
10
15
12
7
5
6
26
33
25
26
22
25
22
22
26
21
25
26
21
19
13
13
11
12
7
8
42.2
52.8
46.4
66.2
76.2
37.2
58.4
20
22
17
15
13
22
17
31
25
24
26
19
20
14
76.0
46.8
69.9
68.5
71.2
82.0
85.8
85.9
63.5
92.7
65.3
91.8
63.2
90.6
49.3
92.7
91.3
85.5
93.0
86.0
91.3
83.8
87.2
83.3
93.7
86.2
91.7
62.1
59.4
83.4
89.5
91.1
80.6
89.0
69.5
89.8
91.8
90.8
85.3
81.3
86.4
90.5
88.8
24
29
18
16
16
20
14
12
16
7
17
10
14
10
15
15
11
16
14
11
11
17
9
10
9
9
10
12
13
12
8
8
13
9
13
10
13
7
5
13
7
8
5
83.7
85.1
86.1
78.7
79.7
Pass
read.
%
57
55
48
50
48
41
38
48
53
54
57
50
49
53
33
40
25
25
19
18
Pass
math
%
C@R Hou.
grade rank
47
59
50
43
46
44
43
48
50
48
47
47
45
42
34
32
21
25
22
20
AAAAAAB+
B+
B+
B+
B+
B
B
B
C
CCD+
F
F
196
204
223
236
248
273
288
291
298
299
310
338
345
371
528
569
584
608
769
785
52
54
42
41
30
44
38
56
51
51
51
41
46
29
A
AB+
B+
BC+
C
176
269
314
321
402
453
515
26
30
23
28
19
22
19
24
22
23
16
19
19
17
18
17
16
12
18
14
12
11
14
16
13
16
10
13
15
12
14
13
12
13
12
11
7
12
12
5
9
7
5
53
57
45
40
39
43
34
35
42
28
43
35
39
31
43
32
30
35
31
31
20
34
27
33
28
28
25
35
34
27
26
31
27
29
37
38
30
22
25
25
27
23
21
52
57
40
46
38
42
29
43
46
45
38
34
43
37
37
32
29
27
36
27
27
27
27
32
34
30
28
23
33
31
31
28
30
31
31
34
21
32
22
14
24
20
14
A
AAAB+
B+
B+
B+
B
B
B
BBBBBC+
C+
C+
C+
C+
C
C
C
C
CCCD+
D+
D+
D+
D+
D+
D+
D
D
D
DDF
F
F
113
195
197
221
276
312
318
324
340
343
361
392
398
401
422
424
443
458
462
478
494
505
510
521
543
571
580
587
601
607
619
620
624
631
638
659
667
701
715
733
781
786
821
15
11
11
11
10
17
13
11
13
11
36
26
27
27
22
39
28
24
26
29
B
CD+
D+
D
358
588
651
653
665
4.1
6.6
3.3
9.3
13.8
26.9
2.5
36.0
85.7
81.8
46.3
90.1
91.9
75.9
87.8
67.7
70.1
89.1
86.3
87.7
79.7
94.1
91.4
90.8
98.0
42
49
48
38
40
38
41
28
11
12
19
10
7
10
12
10
13
4
6
10
9
3
6
4
2
56
44
44
41
31
25
28
22
14
14
14
13
11
9
8
9
7
9
9
5
7
10
7
5
3
73
77
75
65
67
60
73
54
31
35
44
23
24
25
25
29
31
21
20
21
20
15
23
13
8
80
70
70
66
58
47
59
42
34
34
32
25
29
25
20
19
22
20
20
18
13
19
20
10
9
A+
A+
A+
A+
A
A
A
AC
C
CCD+
D
D
D
DF
F
F
F
F
F
F
F
27
29
48
73
121
149
185
192
512
533
559
577
654
677
679
704
714
765
771
772
789
793
813
828
856
49.2
63.9
84.0
63.3
74.6
80.7
83.7
73.7
79.9
44.2
69.3
72.8
59.2
82.2
89.5
87.9
75.4
71.3
88.1
64.3
90.0
87.3
91.6
74.6
84.5
24
15
17
17
10
12
10
15
12
17
13
10
14
9
12
7
9
12
5
9
9
5
4
7
5
29
27
21
18
18
18
15
16
17
14
16
13
11
11
11
13
11
8
8
9
5
6
7
3
3
49
36
35
40
29
29
26
32
30
38
31
28
35
29
25
22
23
34
23
25
23
17
21
22
15
49
44
44
39
31
35
28
31
34
30
30
28
29
26
26
28
27
22
24
19
15
17
17
11
12
A
AAB+
BC+
C+
C
C
CCCCD+
D+
D
D
DDF
F
F
F
F
F
137
214
232
326
417
466
500
514
527
562
575
586
589
617
635
657
692
750
758
779
800
832
839
855
857
3.6
7.2
12.8
15.9
14.8
37.6
44.9
23.9
59.6
39.8
54
35
35
30
32
21
21
32
19
20
64
46
41
41
39
35
25
33
13
17
83
67
60
65
67
50
46
62
41
46
88
73
68
65
67
58
51
56
28
43
A+
A+
A+
A+
A
A
AABC+
7
72
93
100
104
180
211
231
426
490
92.8
29.0
51.2
92.0
99.5
64.7
94.8
92.8
46.2
96.2
44.9
93.2
95.9
92.8
41.7
99.3
93.0
73.8
75.0
85.0
72.6
97.2
97.5
97.0
98.8
62.8
95.5
97.7
24.7
85.9
97.9
71.1
73.2
76.3
93.0
91.0
98.7
100.0
88.1
94.8
99.6
96.0
88.6
92.7
99.4
93.6
89.6
57.3
26
39
34
17
17
20
22
27
36
22
26
14
11
9
26
21
16
22
20
15
18
6
8
13
8
17
10
7
20
12
7
16
11
12
3
10
7
8
9
8
3
8
4
3
6
4
3
4
50
39
35
35
32
31
26
20
27
29
27
34
34
26
21
12
28
19
15
16
12
19
18
10
18
13
18
14
9
10
13
10
12
7
11
10
10
4
7
7
7
4
6
5
2
5
4
2
55
67
64
40
39
43
52
40
60
51
57
43
38
37
53
30
36
51
49
37
38
24
25
33
27
47
28
28
50
29
22
38
28
33
18
27
20
28
30
15
25
21
20
19
20
25
15
15
69
62
59
62
48
60
49
40
50
59
53
74
62
41
47
48
46
42
39
41
26
39
46
21
41
33
31
33
30
29
28
23
30
23
25
19
18
18
20
13
15
33
10
19
9
17
10
6
A+
A+
A+
A+
A+
A+
A+
A
A
A
A
A
A
AAAB+
B+
B
B
BBC+
C+
C+
C+
C
C
CD+
D+
D+
D+
D
D
D
DDF
F
F
F
F
F
F
F
F
F
21
39
50
79
88
94
96
105
106
108
124
152
153
224
228
266
285
287
346
385
399
440
444
457
485
493
516
520
579
621
636
646
649
669
675
695
724
762
766
774
798
826
845
849
852
853
859
865
BRAZORIA COUNTY
School
Adv.
read.
%
No.
of
stud.
Econ.
disad.
%
Adv.
read.
%
Adv.
math
%
Pass
read.
%
Pass
math
%
C@R Hou.
grade rank
896
927
823
722
662
733
814
15.3
15.3
29.6
60.2
48.5
68.2
59.3
35
33
23
16
20
19
18
45
41
34
28
25
21
27
61
60
50
42
43
44
47
65
67
55
51
48
44
47
A+
A+
A
AB+
B+
B+
55
91
177
257
278
279
316
No.
of
stud.
Econ.
disad.
%
16
12
13
12
6
Adv.
math
%
Pass
read.
%
Pass
math
%
C@R Hou.
grade rank
71.0
65.9
63.1
62.0
80.9
Adv.
read.
%
46
35
39
35
37
B
C
C
CC-
363
504
506
561
566
57.1
78.7
72.5
70.2
57.1
55.4
19
15
18
18
15
12
38
20
17
20
17
17
48
43
44
44
46
39
62
39
37
41
32
37
A+
B+
B
B
C+
C-
81
286
336
337
469
574
33.8
38.3
50.0
38.3
73.6
57.5
51.4
87.8
87.9
63.5
89.4
84.8
85.4
27
24
21
23
10
17
12
5
8
9
5
4
3
25
17
15
14
18
10
13
11
7
4
1
3
2
57
48
42
49
29
40
42
19
18
28
13
20
18
51
37
37
34
34
28
28
17
17
11
10
11
9
AB
BC+
C
D
D
DF
F
F
F
F
199
387
431
487
537
663
682
749
768
837
842
847
866
53.9
58.7
66.2
13
12
14
16
11
9
38
31
29
38
30
29
C
D
D
508
703
709
No.
of
stud.
Anahuac ISD
Anahuac
597
Barbers Hill ISD
Barbers Hill Int
672
Barbers Hill
738
East Chambers ISD
East Chambers Int 201
E. Chambers
602
80.7
12
4
31
19
F
782
20
33
53
64
A
178
5.5
16.0
52.7
33.0
16.9
22.7
37.4
20.4
12.6
35.5
42.4
39.0
22.1
23.7
53.1
42
33
20
26
43
29
25
35
40
33
23
22
25
28
18
45
40
31
36
34
32
29
38
31
29
28
28
31
27
20
73
66
41
47
70
58
45
59
69
60
50
42
56
53
40
69
66
55
56
58
59
56
60
61
55
52
44
64
45
45
A+
A
A
A
A
A
A
A
A
A
AAAB+
B-
49
102
128
132
134
143
161
168
179
182
219
241
247
282
400
55.4
15
25
41
42
B
356
Econ.
disad.
%
Adv.
read.
%
Adv.
math
%
Pass
read.
%
Pass
math
%
C@R Hou.
grade rank
60.1
17
16
38
34
B-
396
21.1
23.8
25
26
38
31
56
54
70
56
A
A-
156
271
52.7
64.6
13
14
14
12
35
32
36
25
D+
D+
611
623
FORT BEND COUNTY
School
No.
of
stud.
Fort Bend ISD
Colony Meadows 761
Commonwealth 1,040
Cornerstone
918
Walker Station
836
Settlers Way
763
Rita Drabek
861
Austin Parkway 786
Sienna Crossing 976
Scanlan Oaks
989
Highlands
561
Jan Schiff
922
Colony Bend
555
Brazos Bend
600
Meadows
433
Lexington Creek 532
Oakland
1,094
Oyster Creek
836
Sugar Mill
693
Barbara Jordan
907
Barrington Place 789
Pecan Grove
586
Lakeview
556
Mission Bend
810
Mary Austin Holley 754
Palmer
623
Townewest
776
Juan Seguin
651
Dulles
675
Quail Valley
559
Mission Glen
531
Ridgegate
668
Mission West
815
Dr Lynn Armstrong 657
Arizona Fleming 678
Rosa Parks
593
Lantern Lane
487
Blue Ridge
586
Walter Burton
797
Edgar Glover Jr
515
Ridgemont
894
Goodman
667
Heritage Rose
492
E A Jones
658
Hunters Glen
451
Briargate
485
Lamar CISD
Campbell
731
Susanna Dickins 564
Stephen F Austin 575
Frost
395
Taylor Ray
596
H F Mcneill
772
Joe Hubenak
911
Huggins
557
Adolphus
477
William Velasquez 655
Irma Dru Hutchison778
Manford Williams 744
Travis
669
Meyer
636
Jane Long
587
Cora Thomas
943
Bowie
663
Jackson
394
Smith
543
T L Pink
648
Beasley
418
Needville ISD
Needville Middle 445
Needville
1,064
Stafford MSD
Stafford
722
Stafford Int
527
Econ.
disad.
%
Adv.
read.
%
Adv.
math
%
Pass
read.
%
Pass
math
%
C@R Hou.
grade rank
5.8
2.4
2.5
7.5
13.8
26.4
8.4
5.7
2.5
15.5
8.8
20.7
12.8
36.0
21.1
14.2
31.0
27.6
43.9
29.9
19.3
34.5
73.8
58.4
26.3
69.3
38.2
41.9
38.5
59.1
86.5
69.2
84.3
59.1
61.9
60.4
80.5
68.5
70.5
78.7
62.2
68.1
74.9
76.5
77.5
54
54
45
42
45
33
42
42
44
33
34
35
33
27
31
31
25
28
22
25
29
21
15
21
23
15
22
16
22
15
10
13
9
17
14
12
10
11
12
5
12
13
6
6
7
66
64
53
48
47
44
45
47
47
41
40
32
36
34
36
30
26
28
28
30
24
26
21
22
21
20
20
24
22
21
19
18
20
15
11
16
14
14
11
12
8
6
11
9
4
79
79
75
71
74
60
68
71
71
64
66
67
68
58
60
54
55
55
50
53
55
46
39
43
42
35
46
40
48
36
27
35
27
42
34
32
23
30
28
16
32
37
22
23
20
84
84
72
70
70
71
70
69
70
59
65
57
65
61
58
52
47
48
49
57
45
46
39
44
43
39
44
44
44
36
33
35
40
36
30
33
31
34
28
30
20
20
26
30
17
A+
A+
A+
A+
A+
A+
A+
A+
A+
A+
A+
A
A
A
A
AAAAAB+
B+
B+
B+
B
B
B
B
BBBC+
C+
C+
CCCD+
D
DDDF
F
F
4
5
25
34
43
56
57
64
69
71
90
118
146
151
155
210
227
229
235
263
280
289
295
304
344
368
373
380
391
394
428
461
488
492
552
570
592
603
688
741
752
754
784
807
843
3.4
3.9
20.7
11.9
83.9
28.5
22.3
23.3
16.1
52.7
31.4
32.0
84.6
76.9
82.3
55.4
84.6
93.4
82.1
94.0
83.5
41
41
34
31
18
31
29
30
28
21
21
26
10
10
11
13
9
5
7
7
7
50
42
41
44
34
33
43
32
35
25
29
28
22
18
18
20
17
16
14
12
10
74
71
63
63
44
59
59
64
54
47
49
54
30
27
35
36
27
20
26
20
28
72
66
67
78
68
58
72
59
61
53
52
52
41
38
41
42
35
34
32
28
28
A+
A+
A+
A+
A+
A+
A
A
A
AAB+
BC+
C+
C
C
CD+
D
D-
32
70
74
75
85
97
110
130
187
239
268
303
393
465
484
526
531
555
640
696
735
36.9
43.3
23
19
30
15
54
43
59
33
A
B-
171
410
75.1
69.4
12
9
22
16
33
32
41
38
B+
D+
301
647
GALVESTON COUNTY
School
Clear Creek ISD
Brookwood
North Pointe
Robinson
Ferguson
C D Landolt
Clear Lake City
Ed H White
Mossman
Bauerschlag
Stewart
Falcon Pass
Darwin L Gilmore
Weber
P H Greene
Walter Hall
Goforth
Bay
Hyde
John F Ward
Ralph Parr
Armand Bayou
League City
Mcwhirter
Wedgewood
James H Ross
Whitcomb
Dickinson ISD
San Leon
Calder Road
Bay Colony
Hughes Road
Kenneth E Little
Dunbar Middle
Barber Middle
Silbernagel
Friendswood ISD
Zue S Bales Int
Windsong Int
C W Cline
Westwood
Galveston ISD
Oppe
Crenshaw
Coastal Village
Morgan El Magnet
Parker
Weis Middle
Early Child.Univ.
Hitchcock ISD
Stewart
Hitchcock Primary
La Marque ISD
La Marque Int
La Marque
Santa Fe ISD
Kubacak
Texas City ISD
Roosevelt-Wilson
38
39
33
36
23
36.0
CHAMBERS COUNTY
School
21
17
18
16
19
No.
of
stud.
Econ.
disad.
%
Adv.
read.
%
Adv.
math
%
Pass
read.
%
Pass
math
%
C@R Hou.
grade rank
694
783
521
809
902
577
470
786
865
722
582
864
894
761
736
713
791
623
605
808
523
571
759
755
725
740
31.7
26.8
24.8
16.3
43.7
43.7
16.8
14.6
12.1
60.9
31.4
9.0
41.2
42.8
16.8
26.8
37.0
22.6
27.1
26.9
31.9
72.7
71.5
46.4
34.8
48.0
40
35
34
39
24
32
33
30
35
23
34
33
24
23
34
28
23
22
25
30
23
17
18
18
20
14
37
33
37
36
30
23
31
36
30
27
25
26
26
25
30
25
21
24
20
19
22
15
15
15
11
11
67
61
58
68
52
58
60
57
62
51
60
62
52
50
62
57
51
55
50
52
51
36
39
45
41
40
64
58
56
60
53
46
52
60
57
46
50
47
49
42
57
48
43
46
42
42
38
34
33
27
25
26
A+
A+
A+
A+
A
A
A
A
A
A
A
AAAAB+
B+
B
B
B
B
BC+
CD+
D
38
76
82
89
111
122
138
144
160
164
169
252
256
259
261
306
323
350
367
376
384
416
442
548
602
671
789
778
793
699
687
761
675
744
74.7
61.2
49.2
66.8
84.1
55.7
73.3
79.2
13
13
21
14
10
14
8
5
30
29
26
20
18
18
17
18
40
42
44
34
25
39
31
25
53
52
47
39
33
42
40
41
A
AABC
C
D+
D+
166
194
230
434
525
545
609
622
350
527
888
629
12.0
7.0
7.4
17.2
37
38
34
24
45
51
34
15
62
66
67
61
68
73
58
38
A+
A+
A
B
42
46
133
375
695
159
681
603
622
205
418
63.5
89.3
80.8
93.7
83.3
92.7
95.2
23
9
15
4
5
2
0
32
17
14
14
8
2
0
51
38
33
17
18
7
15
48
36
29
32
23
8
15
A+
BC+
D
F
F
F
95
413
470
668
802
864
870
285
513
89.5
89.9
9
12
8
8
29
30
23
21
D
D-
706
719
347
684
68.6
86.0
3
5
7
2
14
15
22
8
F
F
830
862
1,003
39.8
15
13
38
30
D
660
617
65.3
17
20
42
40
B+
290
Leading first-grade musicians
For the Chronicle
Birnham Woods Elementary music teacher Hope
Louviere leads her first graders in their performance
to “The Syncopated Clock” using scarves and
drumsticks to move to the beat. Birnham Woods,
which is part of Conroe ISD, earned a B+ on this
year’s Children at Risk school rankings.
School
Kohfeldt
Heights
Fry Int
Northside
Charter
No.
of
stud.
537
545
909
590
Ambassadors Prep. 329
Mainland Prep.
412
Odyssey Academy 708
Premier Learning 418
Econ.
disad.
%
Adv.
read.
%
Adv.
math
%
Pass
read.
%
Pass
math
%
C@R Hou.
grade rank
27
25
32
24
D
D
DD-
670
694
726
740
88.1
84.5
84.9
77.3
8
14
8
6
16
5
6
3
32
39
24
25
47
16
19
11
C+
D
F
F
446
712
776
841
Econ.
disad.
%
Adv.
read.
%
Adv.
math
%
Pass
read.
%
Pass
math
%
C@R Hou.
grade rank
83.1
78.6
9
10
13
10
28
26
28
28
CD
551
707
63.0
67.0
8
12
15
11
24
34
36
23
D
D-
697
720
60.8
54.7
14
14
14
13
35
32
29
30
C+
D+
454
633
80.5
9
3
26
18
F
801
79.0
82.9
68.8
56.8
LIBERTY COUNTY
School
No.
of
stud.
Cleveland ISD
Northside
609
Eastside
551
Dayton ISD
Brown
733
Richter
731
Hardin ISD
Hardin
584
Hardin Int
179
Hull-Daisetta ISD
Hull-Daisetta
241
Liberty ISD
Liberty
596
Tarkington ISD
Tarkington Int
291
Tarkington Primary585
10
9
10
13
No.
of
stud.
Conroe ISD
Tough
1,127
David
623
Buckalew
739
Deretchin
1,165
Galatas
705
Collins Int
611
Mitchell Int
1,163
Bush
715
Ride
541
Powell
803
Giesinger
632
Broadway
867
Cox Intermediate 964
Snyder
798
Wilkinson
628
Vogel Int
1,109
Reaves
854
Hailey
697
Wilkerson Int
729
Anderson
925
Lamar
742
Oak Ridge
476
Kaufman
890
Runyan
621
Birnham Woods 799
Ford
1,014
Cryar Intermediate 710
Rice
650
Glen Loch
639
Armstrong
770
San Jacinto
569
Creighton
810
Bozman Int
696
Grangerland Int 1,016
Houser
834
Travis Int
539
Milam
916
Austin
931
Houston
941
Magnolia ISD
Bear Branch
645
Tom R Ellisor
685
Sawmill
662
J L Lyon
849
Cedric C Smith
736
Magnolia
738
Magnolia Parkway 693
Williams
654
Montgomery ISD
Madeley Ranch
618
Montgomery
692
Lone Star
778
Stewart Creek
769
Montgomery Int 614
New Caney ISD
Bens Branch
788
New Caney
658
Kings Manor
581
Porter
684
Oakley
914
Robert Crippen
794
Sorters Mill
727
A M Aikin
563
Valley Ranch
618
Splendora ISD
Piney Woods
553
Greenleaf
682
Peach Creek
768
Willis ISD
Turner
569
Meador
795
Cannan
611
Parmley
738
C C Hardy
675
Charter
Texas Serenity
416
64.3
12
19
32
41
C+
497
16
19
13
7
38
43
32
22
CD
564
678
Econ.
disad.
%
Adv.
read.
%
Adv.
math
%
Pass
read.
%
Pass
math
%
C@R Hou.
grade rank
1.6
5.9
1.9
2.2
3.0
5.4
5.2
9.9
11.6
6.4
35.4
14.6
22.7
19.8
34.4
35.0
74.7
41.9
31.8
85.9
32.9
35.1
15.6
85.7
11.5
58.0
53.0
59.1
44.9
85.3
67.8
81.9
66.1
72.4
59.7
93.7
79.9
75.0
91.9
53
53
51
54
51
49
50
44
44
43
36
37
28
29
26
25
17
31
27
15
23
22
31
11
30
22
19
17
24
8
13
16
15
12
15
8
8
6
5
68
62
54
59
60
53
55
56
44
45
36
34
36
35
33
29
26
29
29
31
33
35
28
25
31
18
24
18
23
21
20
13
18
18
20
11
11
10
8
82
80
81
82
82
80
79
70
71
73
68
64
61
56
52
57
37
59
54
37
52
53
59
37
61
47
51
43
53
25
35
33
38
37
41
29
28
22
17
89
81
82
82
84
82
79
80
69
71
65
60
64
61
59
54
48
54
50
55
54
57
55
42
59
41
51
44
39
44
37
32
41
39
45
27
27
17
24
A+
A+
A+
A+
A+
A+
A+
A+
A+
A+
A+
A+
A
A
A
A
AAAAAAAB+
B+
B+
B
B
B
B
BBBC+
C+
D
DF
F
8
9
11
12
15
16
23
30
36
37
61
98
117
131
158
170
198
201
207
208
209
218
238
307
329
330
348
349
386
388
430
437
439
460
481
698
728
803
817
16.0
17.7
26.0
62.0
65.2
58.0
44.6
76.9
29
28
22
18
18
16
18
9
37
25
26
19
18
17
10
8
58
56
47
40
39
35
39
24
64
42
43
35
37
33
31
19
A
AB+
B
BBD
F
172
255
320
382
405
415
658
787
15.7
45.2
19.5
39.9
32.1
27
25
24
19
23
34
24
26
22
25
57
53
53
42
49
62
51
51
47
46
AB+
B+
B
B
267
281
305
333
381
62.7
74.8
27.0
75.6
73.2
72.2
68.5
76.9
55.5
16
19
22
15
10
11
12
10
15
21
20
18
19
14
13
12
9
8
42
46
51
34
27
32
29
28
31
41
39
38
39
30
26
26
22
23
B
B
BBD+
D+
D+
D
D-
353
355
432
435
613
628
637
691
732
53.0
70.7
68.9
17
9
7
18
13
6
44
28
26
37
31
21
C+
D
F
452
702
834
48.3
60.4
77.9
65.9
84.4
20
18
12
12
8
24
24
17
13
11
46
39
36
34
22
45
44
36
30
30
AB+
BD+
D-
245
322
433
642
738
94.0
5
10
19
29
D
689
Adv.
read.
%
Adv.
math
%
Pass
read.
%
Pass
math
%
C@R Hou.
grade rank
WALLER COUNTY
School
Hempstead ISD
Hempstead
Royal ISD
Royal
Waller ISD
Roberts Road
Turlington
Fields Store
I T Holleman
H T Jones
29
29
37
28
51.2
54.5
MONTGOMERY COUNTY
School
10
11
11
10
No.
of
stud.
Econ.
disad.
%
309
83.5
10
9
29
23
D-
737
832
86.4
8
7
22
19
D-
746
523
699
683
726
301
81.8
69.0
56.1
70.7
90.0
17
19
23
18
11
27
24
22
21
17
43
40
51
39
34
46
46
44
42
42
AAAB
C+
203
217
274
339
468
xx
MIDDLE SCHOOLS
School
HARRIS COUNTY
La Porte ISD
Baker Sixth Grade 532
Lomax
609
La Porte
555
Pasadena ISD
Southmore
864
Bondy
1,004
Thompson
957
Jackson
776
South Houston
864
Park View
993
Beverly Hills
1,019
San Jacinto
629
Miller
850
Queens
682
Sheldon ISD
Michael R Null
869
C E King
921
Spring Branch ISD
Memorial
1,411
Cornerstone
369
Westchester
936
Spring Branch
1,163
Spring Forest
804
Spring Woods
938
Northbrook
908
Spring Oaks
820
Landrum
945
Spring ISD
Twin Creeks
967
Edward Roberson 1,122
Dueitt
951
Edwin M Wells
1,274
Rickey C Bailey
1,224
Stelle Claughton 1,183
Bammel
1,273
Tomball ISD
Willow Wood
1,023
Tomball
847
Charter
Harmony-Excell. 904
Harmony Sci-Hou. 706
Gateway Elite
398
Harmony-Discovery 757
Harmony Sci. W.Hou 840
Two Dimensions Vet 223
Gateway Evergreen 515
Gateway Coral
708
YES-West
700
Harmony Sci. NW 666
Two Dimensions Prep. 235
YES-East End
871
Harm. Innov.-Hou 604
YES-SW
855
YES-N. Central.
943
Beatrice Mayes
424
Stepping Stones 307
KIPP Academy
400
Amigos Por Vida 522
SER-Ninos
169
Harmony Fine Arts 664
YES-SE
951
KIPP 3D Academy 404
KIPP Sharpstown 427
KIPP Polaris-Boys 216
YES-Briar Oaks
658
Aristoi Classical 430
HarmonySci.-Braes. 348
YES-Gulfton
895
Harmony Excel. End. 567
YES Prep-N. Forest 692
KIPP Voyage-Girls 233
Harmony Ingenuity616
KIPP Intrepid
303
YES Prep-Northside 413
YES Prep-Fifth Ward 413
Draw Academy
309
KIPP Spirit
308
KIPP Liberation 288
Zoe Ambassadors 174
Zoe Academy
283
Ripley House
157
Raul Yzaguirre
333
Southwest
229
Victory Prep
268
WALIPP-TSU
201
Fallbrook Col. Prep.642
School
Aldine ISD
No.
of
stud.
Shotwell
1,084
Grantham Acad. 1,070
Teague
914
Stovall
1,005
Aldine
927
Hambrick
986
Drew Academy
558
Plummer
947
Lewis
950
Hoffman
892
Alief ISD
Albright
1,265
O’Donnell
1,265
Killough
958
Holub
884
Alief
984
Olle
1,079
Channelview ISD
Alice Johnson
1,021
Aguirre
927
Crosby ISD
Crosby
790
Cy-Fair ISD
Hamilton
1,547
Spillane
1,310
Aragon
1,647
Smith
1,851
Salyards
1,494
Goodson
1,208
Arnold
1,591
Labay
1,522
Cook
1,614
Bleyl
1,572
Truitt
1,406
Watkins
1,278
Kahla
1,451
Campbell
1,237
Dean
1,546
Hopper
1,395
Thornton
1,329
Deer Park
Deer Park
786
Fairmont
791
Deepwater
643
Bonnette
794
Galena Park ISD
Cobb Sixth Grade 1,179
Woodland Acres 462
North Shore
1,328
Cunningham
940
Galena Park
1,038
Goose Creek CISD
Highlands
1,143
Cedar Bayou
1,036
Gentry
1,001
Horace Mann
958
Baytown
759
Houston ISD
T.H. Rogers
794
Wharton K-8
474
Pin Oak
1,205
Lanier
1,396
Briarmeadow Ch. 603
Project Chrysalis 210
Baylor Col.of Med. 236
Garden Oaks
674
Wilson Montessori 501
Energized-Excell. 374
Young Women’s Col. 535
Sharpstown Int’l 1,068
Young Men’s Col. 384
Pilgrim Academy 1,115
West Briar
1,158
Burbank
1,422
Stevenson
1,386
Grady
558
Rice School
1,151
Pershing
1,653
Johnston
1,677
Energized STEM-W. 264
Texas Connections 3,890
The Rusk School 530
Hartman
1,420
Hamilton
1,250
Revere
1,220
Ortiz
1,010
Young Scholars
192
Clifton
920
Williams
490
Deady
861
Black
839
Holland
675
Jackson
931
Edison
745
Gregory-Lincoln 659
Fleming
492
Hogg
722
Reagan K-8
1,194
Thomas
488
Sugar Grove
737
Attucks
459
McReynolds
637
Dowling
1,129
Key
654
Marshall
962
Welch
918
Woodson
890
Fonville
1,111
Long Academy
977
Fondren
780
Henry
938
Cullen
654
Forest Brook
990
Huffman ISD
Huffman
783
Humble ISD
Riverwood
1,101
Creekwood
1,083
Kingwood
1,033
Woodcreek
1,223
Timberwood
1,331
Atascocita
1,145
Humble
1,166
Ross Sterling
868
Katy ISD
Beckendorff
1,675
Seven Lakes
1,550
Garland McMeans 1,085
Beck
1,100
Cinco Ranch
1,209
Woodcreek
1,585
Memorial Parkway 894
Katy
1,354
West Memorial
718
Cardiff
1,027
Morton Ranch
1,268
McDonald
973
Mayde Creek
1,141
Klein ISD
Doerre
1,203
Kleb
1,350
Krimmel
1,139
Strack
1,152
Wunderlich
1,547
Schindewolf
1,348
Ulrich
1,072
Hildebrandt
1,098
Klein
1,230
Econ.
disad.
%
Adv.
read.
%
Adv.
math
%
Pass
read.
%
Pass
math
%
C@R Hou.
grade rank
80.5
87.3
76.9
89.4
90.7
88.0
76.5
80.4
78.7
68.3
10
12
10
9
8
9
11
10
9
6
8
3
5
5
4
3
3
3
3
6
31
30
28
25
23
26
31
28
25
21
36
26
26
25
26
24
24
21
19
17
CD
DDDDD
F
F
F
201
225
249
252
257
264
265
275
279
286
75.3
80.7
83.9
80.7
82.2
88.0
20
14
13
14
10
10
9
9
7
3
6
4
45
32
31
36
27
26
32
38
25
20
23
18
B
BCD+
D
D-
137
141
206
216
230
256
83.4
74.1
8
10
8
7
28
30
27
22
D
D
224
239
42.4
13
7
34
32
D
232
18.2
13.0
28.7
31.2
13.1
22.2
45.7
55.1
49.5
54.3
64.3
66.5
72.0
68.3
82.0
75.4
73.4
41
41
33
30
34
28
23
22
25
21
19
17
17
15
13
15
13
34
34
23
21
26
21
16
13
16
14
13
11
9
11
8
7
6
71
72
63
60
67
57
50
49
51
46
42
39
42
37
32
39
38
67
67
52
53
63
51
44
40
39
36
33
33
30
30
29
27
26
A+
A+
A
A
A
AAAAB+
B+
B
BBC
C
D+
21
22
46
55
57
75
90
91
93
106
113
138
143
151
179
188
214
27.2
31.2
78.2
42.9
25
24
15
17
12
11
4
7
54
52
36
44
48
47
29
35
B+
B
C
C
109
127
186
197
79.8
86.6
76.1
80.3
84.9
10
12
15
13
10
18
14
13
10
9
36
39
39
36
30
42
47
44
40
32
B+
B+
B
C+
C-
104
115
128
163
200
52.8
65.4
51.7
81.7
77.5
17
15
18
12
9
13
11
9
8
6
40
39
44
32
27
41
38
38
27
26
B
BC+
C
D
125
148
164
183
242
31.0
57.6
32.5
29.9
63.2
92.4
70.3
50.6
51.7
98.1
66.5
94.8
76.3
96.0
51.3
94.9
93.1
51.6
68.7
56.5
64.0
89.8
42.6
85.5
94.6
84.2
89.4
97.2
82.3
88.2
96.1
96.4
66.7
91.9
95.6
95.8
91.0
96.7
85.2
91.4
89.5
96.9
91.5
96.4
81.0
93.1
91.4
83.7
94.2
93.8
91.4
91.7
94.8
86.5
87.0
78
39
53
55
33
30
35
24
28
17
32
17
24
11
27
14
17
25
20
23
22
15
28
11
9
18
10
8
9
10
6
8
14
7
6
7
6
3
6
5
4
4
5
4
5
4
5
7
5
6
3
4
3
3
2
76
36
38
41
34
25
29
19
14
22
16
18
17
22
16
19
20
11
18
13
10
14
8
11
12
8
11
9
8
8
5
6
4
4
6
4
5
3
4
6
4
5
4
4
5
3
4
2
3
2
4
3
3
2
1
95
66
79
81
65
71
78
47
53
43
70
44
52
29
55
38
40
52
48
48
51
32
53
34
28
42
30
25
31
31
21
23
33
22
21
22
22
20
24
19
16
15
16
16
21
16
20
21
13
18
15
17
13
15
9
96
69
74
73
64
62
67
42
36
62
44
48
40
45
40
46
44
41
39
33
31
34
28
28
35
31
33
31
24
30
20
21
13
23
21
19
16
19
17
18
18
15
19
21
23
16
18
15
12
13
15
16
12
14
7
A+
A+
A+
A+
A+
A+
A+
A
A
A
A
A
AAAAAAAB+
B
B
BBBBC+
C
C
CD+
D+
DDDDF
F
F
F
F
F
F
F
F
F
F
F
F
F
F
F
F
F
F
1
5
7
8
15
30
32
54
56
59
64
65
74
76
77
80
82
86
88
101
120
123
144
147
156
157
161
181
182
202
218
219
248
250
253
259
269
270
271
277
280
282
283
284
288
289
290
294
296
297
300
302
307
312
314
30.0
16
5
40
29
D
228
5.0
11.7
28.4
29.5
33.1
22.8
75.5
79.4
40
37
28
23
22
19
10
8
29
21
16
15
11
11
5
6
71
67
55
49
48
47
28
26
64
52
48
39
36
36
18
24
A+
A
AB
BC
D
D-
39
69
89
130
148
190
240
251
5.4
4.6
10.9
9.0
13.5
7.4
26.2
44.6
41.1
66.0
62.5
62.0
61.7
55
53
46
43
38
39
30
21
23
15
17
16
15
47
43
44
42
27
27
17
14
10
9
7
8
8
82
80
72
74
68
72
60
49
50
43
43
42
39
78
78
78
76
64
66
53
45
32
37
28
29
31
A+
A+
A+
A+
A+
A+
A
B+
B
BC+
C
C
3
4
6
12
34
37
67
102
133
155
166
192
194
13.9
25.6
31.4
28.3
71.2
32.0
47.4
29.3
82.8
46
31
31
29
17
27
20
26
7
37
26
21
22
22
14
13
14
8
72
61
60
56
41
58
47
56
25
69
60
51
53
53
44
41
44
28
A+
A
A
A
A
AB+
B
D
13
48
51
58
61
97
117
119
243
No.
of
stud.
Econ.
disad.
%
Adv.
read.
%
Adv.
math
%
Pass
read.
%
Pass
math
%
C@R Hou.
grade rank
46.1
47.8
50.3
17
18
16
25
6
4
46
42
39
50
25
19
A
CD
60
209
245
87.8
64.7
63.3
90.2
86.9
84.1
70.2
88.6
87.2
89.9
14
19
19
11
14
11
17
13
13
9
8
7
8
8
7
10
6
5
3
5
32
40
43
26
37
30
37
29
31
27
38
40
35
32
32
30
31
32
26
37
B
BC+
C+
C+
C
C
C
D+
D
135
142
160
169
174
180
191
195
217
227
79.7
80.8
11
8
6
5
31
27
23
21
D
F
223
267
3.5
30.6
58.9
36.1
51.4
91.9
88.7
83.8
91.0
46
37
25
27
18
5
5
8
5
44
37
30
21
10
6
7
3
2
76
72
52
53
42
17
18
21
16
79
70
62
45
32
28
23
15
12
A+
A+
A+
A
C+
D
DF
F
14
19
42
70
165
233
254
272
299
52.8
67.6
69.6
85.2
74.4
82.5
87.0
15
12
9
6
6
7
5
8
4
5
4
4
3
1
35
35
29
21
26
21
22
27
19
23
18
17
14
9
CDF
F
F
F
F
199
258
276
285
291
295
311
19.1
31.4
38
26
24
13
66
53
64
45
A+
B
35
124
29.0
54.0
92.0
44.9
46.2
92.8
95.9
93.2
87.6
41.7
92.8
86.1
73.8
90.3
79.7
75.0
85.0
92.0
97.5
98.8
62.8
77.6
94.8
93.7
85.6
87.7
24.7
85.9
97.3
73.2
83.7
85.4
76.3
91.4
94.4
87.2
100.0
86.0
84.7
94.8
99.6
91.7
97.3
97.8
89.6
72.6
57.3
39
35
17
26
36
27
11
14
21
26
9
18
22
13
14
20
15
20
8
14
17
18
15
13
12
12
20
12
10
11
12
16
12
12
9
12
8
11
9
8
3
10
3
4
3
6
4
39
27
35
27
27
20
34
34
27
21
26
22
19
19
21
15
16
16
18
12
13
12
16
20
9
8
9
10
9
12
7
5
7
8
7
6
4
4
4
7
7
2
3
2
4
1
2
67
63
40
57
60
40
38
43
51
53
37
43
51
40
35
49
37
50
25
33
47
45
37
43
32
36
50
29
31
28
29
35
33
31
28
32
28
31
31
15
25
26
18
17
15
25
15
62
59
62
53
50
40
62
74
61
47
41
49
42
51
48
39
41
39
46
41
33
40
35
44
33
30
30
29
36
30
28
15
23
29
27
24
18
21
23
13
15
13
13
16
10
14
6
A+
A+
A+
A+
A+
A+
A+
A+
A
A
A
A
A
AAAAAB+
B+
B
B
B
B
BC+
C+
C+
C+
C+
C
C
C
C
CCD+
D
D
D
DDF
F
F
F
F
10
20
24
28
29
31
40
41
45
52
62
63
71
73
78
83
95
98
112
116
118
122
126
131
152
162
170
171
173
176
186
189
193
196
205
207
220
228
231
234
247
262
303
304
306
308
313
BRAZORIA COUNTY
School
No.
of
stud.
Alvin ISD
Nolan Ryan
1,180
Alvin
773
Fairview
882
G W Harby
680
Manvel
879
Angleton ISD
Angleton
1,455
Brazosport ISD
Lake Jackson
850
Clute
944
Freeport
566
Columbia-Brazoria ISD
West Brazos
460
Damon ISD
Damon
187
Pearland ISD
Berry Miller
895
Pearland West
773
Pearland South 849
Pearland East
668
Sweeny ISD
Sweeny
463
Econ.
disad.
%
No.
of
stud.
Anahuac ISD
Anahuac
295
Barbers Hill ISD
Barbers Hill
773
East Chambers ISD
East Chambers
222
Fort Bend ISD
Fort Settlement
Sartartia
First Colony
Quail Valley
Garcia
Dulles
James Bowie
Sugar Land
Billy Baines
David Crockett
Hodges Bend
Lake Olympia
Missouri City
Christa McAuliffe
Lamar CISD
Henry Wertheimer
Polly Ryon
Reading
Briscoe
J J Wessendorff
Navarro
Lamar
George
Adv.
math
%
Pass
read.
%
Pass
math
%
C@R Hou.
grade rank
28
14
12
12
8
20
6
7
5
6
55
38
33
31
33
52
33
28
27
26
AD
D
DF
87
237
241
255
281
61.2
16
11
42
38
B-
139
32.8
67.7
77.6
26
8
7
8
3
1
51
24
28
30
13
11
B
F
F
132
293
298
47.4
17
5
40
34
D+
211
80.7
12
4
31
19
D
238
12.2
33.0
39.6
24.3
52
37
27
30
22
11
11
10
73
63
52
60
51
51
40
44
A
AB+
B
43
94
108
129
45.6
22
12
43
38
B-
140
Adv.
read.
%
Adv.
math
%
Pass
read.
%
Pass
math
%
C@R Hou.
grade rank
Econ.
disad.
%
55.6
13
7
37
26
C-
208
18.4
35
25
65
65
A
44
51.8
18
5
38
19
C
185
FORT BEND COUNTY
School
Adv.
read.
%
29.8
50.7
59.2
66.8
56.0
CHAMBERS COUNTY
School
Houston Chronicle | HoustonChronicle.com and chron.com | Sunday, April 26, 2015 |
No.
of
stud.
Econ.
disad.
%
Adv.
read.
%
Adv.
math
%
Pass
read.
%
Pass
math
%
C@R Hou.
grade rank
1,214
1,285
1,247
1,262
1,229
1,218
908
1,261
1,472
845
1,225
1,170
1,197
837
4.8
6.4
12.7
25.4
35.1
29.6
18.0
44.3
26.2
52.5
64.5
51.0
65.0
79.9
59
49
40
47
29
27
28
21
25
20
14
10
7
5
55
43
33
38
28
20
20
14
15
12
10
4
3
3
83
78
71
67
58
55
59
49
52
49
36
32
26
20
86
78
66
56
63
49
54
41
46
36
32
22
21
14
A+
A+
A+
A+
A+
A
AB+
B+
B
C+
F
F
F
2
11
23
26
33
68
79
105
114
134
175
268
287
305
517
530
1,123
1,103
458
528
796
1,032
28.4
26.2
22.1
30.4
66.4
76.1
63.4
76.8
32
29
41
36
13
9
19
14
36
34
17
20
14
16
6
3
62
61
68
59
38
34
40
36
69
58
49
54
33
38
31
24
A+
A+
A
A
BBBD
17
38
47
53
153
154
159
226
M13
Grier pledges to fight inequity
Cody Duty / Houston Chronicle
Houston ISD Superintendent Terry Grier’s sixth
State of the Schools speech, at the Hilton Americas
Hotel on Feb. 11, focused on repairing persistent
inequities across the school district.
School
Needville ISD
Needville
Stafford MSD
Stafford
No.
of
stud.
Econ.
disad.
%
Adv.
read.
%
Adv.
math
%
Pass
read.
%
Pass
math
%
C@R Hou.
grade rank
487
33.5
27
10
52
35
B
136
522
65.7
17
3
39
18
D+
210
Econ.
disad.
%
Adv.
read.
%
Adv.
math
%
Pass
read.
%
Pass
math
%
C@R Hou.
grade rank
14.9
22.4
17.8
27.2
19.4
18.2
22.8
42.1
31.2
35.9
51
45
35
27
26
29
25
25
23
22
34
32
27
18
17
14
17
11
14
10
76
67
66
55
56
62
57
51
56
50
64
60
65
46
51
46
54
39
43
38
A+
A+
A+
AAAAB+
B+
B-
9
18
36
81
92
96
99
103
107
150
GALVESTON COUNTY
School
No.
of
stud.
Clear Creek ISD
League City
868
Westbrook
1,083
Seabrook
1,000
Space Center
1,092
Creekside
830
Victory Lakes
948
Bayside
697
Clear Creek
791
Clear Lake
972
Brookside
802
Dickinson ISD
R D McAdams
1,433
Frienswood ISD
Friendswood
1,512
Galveston iSD
Austin
494
Crenshaw
159
Scott Col. Acad. 515
Coastal Village
224
Central
257
Hitchcock ISD
Crosby
185
La Marque ISD
La Marque
251
Santa Fe ISD
Santa Fe
1,089
Texas City ISD
Blocker
912
Charter
Ambassadors Prep 329
Mainland Prep.
412
Odyssey Academy 708
Premier Learning 418
64.1
12
4
33
22
D-
260
8.5
37
36
70
71
A+
27
50.4
89.3
76.3
86.6
85.2
32
9
7
8
5
28
17
5
4
1
64
38
23
17
15
61
36
18
19
10
A+
B+
F
F
F
25
100
266
274
310
84.9
12
3
23
26
D
236
79.7
4
0
15
5
F
315
36.2
14
7
37
25
D
222
68.8
11
2
31
13
F
278
88.1
84.5
84.9
77.3
8
14
8
6
16
5
6
3
32
39
24
25
47
16
19
11
B+
CD
F
111
204
235
292
Adv.
read.
%
Adv.
math
%
Pass
read.
%
Pass
math
%
C@R Hou.
grade rank
LIBERTY COUNTY
School
Cleveland ISD
Cleveland
Dayton ISD
Nottingham
Wilson
Hardin ISD
Hardin
Liberty ISD
Liberty
Tarkington ISD
Tarkington
No.
of
stud.
Econ.
disad.
%
607
80.9
8
1
19
15
F
301
403
818
65.5
60.8
11
11
16
5
36
30
37
25
C+
D-
172
261
195
50.3
17
8
39
33
C+
167
449
56.8
19
6
40
27
C
177
453
48.1
12
6
38
24
D
246
MONTGOMERY COUNTY
School
No.
of
stud.
Conroe ISD
McCullough
2,254
Knox
1,277
Irons
1,041
York
915
Peet
1,214
Washington JH
630
Moorhead
1,075
Magnolia ISD
Bear Branch
948
Bear Branch 6thGr. 459
Magnolia 6thGr. 484
Magnolia
1,035
Montomery ISD
Montgomery Mid. 611
Montgomery JH 1,258
New Caney ISD
New Caney 6thGr. 956
Keefer Crossing
962
White Oak
880
Splendora ISD
Splendora
544
Willis ISD
Robert P Brabham 752
Lynn Lucas
795
Charter
Texas Serenity
416
Econ.
disad.
%
Adv.
read.
%
Adv.
math
%
Pass
read.
%
Pass
math
%
C@R Hou.
grade rank
4.1
15.8
31.6
20.2
53.0
87.3
65.8
52
41
30
31
22
12
13
33
19
15
14
8
7
4
78
69
61
59
44
33
31
80
64
56
50
40
36
27
A+
A
AB+
BC+
D
16
49
72
110
145
168
244
26.8
31.8
53.3
46.6
29
17
10
17
16
24
14
5
56
50
35
38
51
50
35
29
AACD+
84
85
203
215
24.9
22.7
21
32
33
18
59
59
58
57
A
A
50
66
66.2
65.3
58.5
9
17
16
16
7
5
35
38
35
39
32
28
BC
D+
146
184
213
60.3
10
4
30
26
F
273
48.7
72.1
15
9
6
6
41
28
33
20
D+
D-
212
263
94.0
5
10
19
29
C
198
WALLER COUNTY
School
Hempstead ISD
Hempstead
Royal ISD
Royal
Waller ISD
Schultz
Waller
No.
of
stud.
Econ.
disad.
%
Adv.
read.
%
Adv.
math
%
Pass
read.
%
Pass
math
%
C@R Hou.
grade rank
366
75.4
8
9
24
23
D+
445
84.5
5
1
18
9
F
309
691
682
59.0
68.6
18
15
13
9
41
37
35
31
B
C
121
178
221
M14 | Sunday, April 26, 2015 |
Houston Chronicle | HoustonChronicle.com and chron.com x x
HIGH SCHOOLS
Athletics and academics
HARRIS COUNTY
School
Aldine ISD
No.
of
stud.
Victory Early Col. 441
Carver
911
MacArthur
3,631
Aldine
3,139
Nimitz
2,547
Eisenhower
2,627
Alief ISD
Kerr
809
Alief Early Col. 403
Hastings
3,914
Elsik
3,973
Taylor
2,887
Channelview ISD
Channelview 2,289
Crosby ISD
Crosby
1,488
Cy-Fair ISD
Cypress Ranch 3,257
Cypress Woods 3,152
Cy-Fair
3,526
Langham Creek3,139
Cypress Creek 3,251
Jersey Village 3,449
Cypress Falls 3,544
Cypress Springs2,716
Cypress Ridge 2,962
Cypress Lakes 3,514
Deer Park ISD
Deer Park
4,034
Galena Park ISD
North Shore 4,723
Galena Park 2,033
Goose Creek CISD
Sterling
2,271
Memorial
1,849
Lee
1,440
Houston ISD
DeBakey
823
Carnegie Van. 608
HSPVA
699
Eastwood Aca. 415
N.Hou.Early Col. 413
Challenge Early 450
East Early Col. 470
Int’l Studies 432
Bellaire
3,604
Law Enforce. 506
Lamar
3,225
Westside
2,753
Reagan
2,190
Jordan
883
Waltrip
1,630
Energ.-STEM-W. 231
Lee
1,359
Sharpstown 1,358
Chavez
2,988
Mount Carmel 359
Furr
931
Milby
2,092
Austin
1,695
Washington 773
Davis
1,650
Westbury
2,076
Worthing
639
Jones
443
Yates
977
Scarborough 670
Madison
2,004
Wheatley
859
Sterling
830
Kashmere
500
Huffman ISD
Hargrave
954
Humble ISD
Kingwood
2,554
Quest Early Col.343
Kingwood Park 1,746
Atascocita
3,083
Summer Creek 2,318
Humble
1,577
Katy ISD
Seven Lakes 3,577
Cinco Ranch 3,189
Taylor
2,911
Katy
2,946
Mayde Creek 2,706
Morton Ranch 3,299
Klein ISD
Klein Oak
3,845
Klein Collins 3,506
Klein
3,757
Klein Forest
3,461
La Porte ISD
La Porte
2,190
Pasadena ISD
Memorial
2,961
Dobie
3,847
South Houston 2,515
Pasadena
2,471
Econ. Adv.
disad. read.
%
%
Adv. Pass
math read.
%
%
Pass
math
%
C@R
grade
Hou. Grad.
rank rate
%
72.8
71.4
90.2
85.7
70.9
75.6
16.4
1.5
1.4
1.2
0.7
0.6
25
8
12
11
10
4
88.0
42.0
28.9
24.8
25.5
18.1
65
30
33
33
30
14
A
BC+
C+
CF
34
72
75
79
101
145
98.9
93.9
75.4
71.3
70.1
68.4
65.9
78.9
76.3
77.6
72.6
28.5
13.2
1.8
1.3
2.1
27
12
5
3
2
88.0
81.7
29.1
27.1
31.1
73
36
22
16
15
A+
A+
D
F
F
3
26
119
136
138
96.4
96.5
67.4
70.2
76.3
69.8
2.5
3
31.6
20
C
82
100.0
36.4
3.0
5
36.4
26
D+
104
86.4
14.2
18.0
28.0
44.1
41.5
50.5
45.9
68.6
61.8
62.8
12.0
16.5
13.8
8.3
8.4
8.7
6.9
4.1
3.7
2.8
16
10
6
10
10
4
6
4
3
2
70.3
70.5
65.8
53.3
53.8
47.5
49.9
37.6
36.6
39.9
52
38
31
34
36
25
31
22
19
15
A
A
AAAB+
B+
CCD+
33
38
43
44
45
62
63
92
99
106
92.7
90.5
88.2
84.8
84.7
84.7
83.2
77.0
80.4
84.1
36.2
6.4
7
54.6
31
B-
70
86.9
70.4
78.3
3.4
1.6
2
2
33.1
27.1
15
14
D
D-
121
125
84.8
86.7
51.7
45.9
70.3
3.2
3.7
1.7
11
6
3
37.6
41.3
24.1
35
29
18
C+
C
D-
74
89
129
81.8
86.3
82.1
45.1
22.0
17.6
84.8
89.3
69.1
84.0
72.7
48.6
82.6
48.3
53.2
76.3
81.2
72.6
85.7
96.0
89.1
84.0
70.8
95.0
79.8
87.6
93.7
95.1
78.8
78.7
85.3
69.7
90.9
76.5
81.8
76.9
85.4
59.4
41.2
46.7
13.1
5.2
19.0
11.1
3.8
14.5
9.7
7.8
6.4
2.6
1.2
2.8
0.6
0.2
0.8
1.7
1.4
0.4
0.8
0.1
0.8
0.4
0.5
0.0
0.0
0.0
0.2
0.2
0.0
0.0
0.3
68
53
26
48
47
14
32
26
15
11
11
7
9
7
9
4
9
6
7
4
6
5
4
3
2
3
3
3
2
0
1
1
1
0
98.6
98.3
93.4
84.5
73.4
91.3
80.7
66.5
56.6
63.8
59.4
51.5
44.9
41.2
31.4
41.9
14.0
16.7
25.2
45.3
16.0
18.6
15.4
22.0
24.9
16.1
8.6
10.8
15.1
18.1
15.3
8.1
9.5
7.5
100
78
64
88
83
64
75
61
43
40
39
30
37
24
27
37
23
22
23
15
30
21
22
14
14
14
14
12
8
9
6
5
3
3
A+
A+
A+
A+
A+
A+
A+
A+
A+
A
A
B+
BBC+
C
CD+
D+
D+
D+
D
DF
F
F
F
F
F
F
F
F
F
F
1
100.0
2
95.3
4
100.0
7
99.0
10
97.0
11
100.0
12
99.1
17
98.6
22
81.1
36
92.8
41
85.8
61
80.9
69
81.8
71
91.1
78
74.4
85
85.2
93
53.3
105 64.3
111
71.0
112
86.6
114
68.4
120
71.8
122
72.3
139 66.2
142
72.0
143 66.0
147 70.0
151
58.9
156 68.5
157 65.8
158
69.7
159 58.5
160 66.8
162 60.9
22.7
5.3
2
44.0
22
C
90
83.5
5.6
32.9
17.7
26.8
47.6
62.9
22.3
16.7
9.8
9.0
3.0
1.1
13
15
11
2
2
0
80.1
83.7
63.8
55.7
39.0
29.3
44
61
35
24
14
6
A+
AABDF
25
47
55
66
127
152
92.6
92.8
92.2
88.1
80.0
80.0
5.7
9.9
16.4
28.8
57.5
54.4
27.9
17.2
18.1
11.2
5.1
3.8
19
23
18
10
10
3
86.0
76.5
73.6
68.8
47.8
41.7
52
61
51
39
38
17
A+
A+
A+
A
B+
C-
13
14
24
40
60
91
89.7
91.3
89.2
85.4
82.7
83.7
23.2
26.8
25.2
70.9
12.2
9.1
9.6
2.7
12
12
10
3
57.0
52.3
57.0
33.1
36
34
36
14
AAAF
52
53
58
134
85.0
86.5
88.1
76.0
39.4
4.3
2
42.6
14
D+
115
87.6
62.3
58.6
82.4
82.2
3.1
2.6
1.2
1.4
16
6
7
5
39.2
36.7
25.6
24.4
46
27
34
23
B+
C
C
D
59
81
88
118
86.9
85.0
78.5
75.2
Clear Creek High School
football players take the
field at CCISD Veterans
Stadium last fall for a
game against Dickinson
High School. In this
year’s Children at Risk
school rankings, Clear
Creek earned an A- and
Dickinson earned a C-.
Craig H. Hartley
School
No.
of
stud.
Sam Rayburn 2,876
Sheldon ISD
C E King
1,812
Spring Branch ISD
Westchester 936
Memorial
2,567
Stratford
2,010
Spring Woods 2,094
Northbrook
2,119
Spring ISD
Westfield
3,218
Dekaney
2,704
Spring
3,451
Tomball ISD
Tomball
1,557
Charter
YES-SW
855
Harmony Sci. 62
YES-N.Cen.
943
YES-E.End
871
YES-SW
951
KIPP Houston 560
Raul Yzaguirre 285
Gateway-Coral 708
Econ. Adv.
disad. read.
%
%
2.3
4
28.9
Pass
math
%
C@R
grade
79.3
Adv. Pass
math read.
%
%
19
D-
128
77.6
73.0
1.6
2
30.2
18
D-
123
83.1
58.9
10.5
29.5
72.2
82.3
9.8
27.0
12.5
3.3
0.7
30
7
8
7
1
69.2
78.2
60.4
33.9
20.8
63
33
27
27
7
A+
A+
AC+
F
20
23
48
77
155
93.3
87.6
85.8
76.3
68.8
73.0
77.6
55.6
1.1
0.1
1.1
7
4
2
21.5
16.3
26.8
29
18
12
CF
F
98
135
153
71.2
71.3
79.4
26.1
6.0
16
50.8
47
A-
46
87.9
90.3
75.6
79.7
86.1
77.6
88.0
94.0
93.2
13.0
8.1
15.4
8.3
15.8
4.5
0.0
0.0
32
18
18
21
30
9
9
10
80.9
55.6
74.7
63.2
71.4
64.4
20.3
30.1
72
48
45
45
60
51
40
34
A+
A+
A+
A
A
A
BC
8
15
19
27
28
37
73
80
90.9
96.9
92.5
92.6
97.1
96.4
79.2
68.8
BRAZORIA COUNTY
School
No.
of
stud.
Econ. Adv.
disad. read.
%
%
Alvin ISD
Manvel
2,521 39.4
Alvin
2,524 47.7
Angleton ISD
Angleton
1,814
47.8
Brazosport ISD
Brazoswood 2,423 36.2
Brazosport
972
69.8
Columbia-Brazoria ISD
Columbia
845
46.4
Pearland ISD
Dawson
2,114
24.8
Pearland
2,896 25.2
Sweeny ISD
Sweeny
564
41.7
Adv. Pass
math read.
%
%
Pass
math
%
C@R
grade
5.3
1.8
6
5
40.0
33.6
22.0
25.0
C
D+
83
110
83.8
82.6
4.0
4
44.9
18.0
D+
107
87.7
4.7
0.4
3
1
42.7
19.7
14.0
7.0
C
F
84
150
85.0
82.2
No.
of
stud.
Anahuac ISD
Anahuac
331
Barbers Hill ISD
Barbers Hill
1,356
East Chambers ISD
East Chambers 383
2
37.4
13.0
F
133
91.9
15.9
9.8
10
6
61.1
51.8
38.0
28.0
A
B
35
64
92.1
88.7
5.4
15
42.9
50.0
A-
56
94.4
Econ. Adv.
disad. read.
%
%
Adv. Pass
math read.
%
%
Pass
math
%
C@R
grade
Hou. Grad.
rank rate
%
41.1
2.9
2
46.8
24
D-
124
85.8
13.7
15.2
25
73.3
59
A
29
92.0
47.0
3.2
4
40.8
25
C-
103
90.3
FORT BEND COUNTY
School
Fort Bend ISD
Clements
Dulles
Austin
Travis
E Elkins
Kempner
Hightower
Bush
Marshall
Willowridge
Lamar CISD
Foster
Lamar Cons.
B F Terry
Hou. Grad.
rank rate
%
3.1
CHAMBERS COUNTY
School
Hou. Grad.
rank rate
%
No.
of
stud.
Econ. Adv.
disad. read.
%
%
Adv. Pass
math read.
%
%
Pass
math
%
C@R
grade
Hou. Grad.
rank rate
%
2,502
2,225
2,280
2,428
2,011
2,343
2,292
2,067
1,316
1,278
7.1
21.2
20.0
26.7
22.9
33.6
44.5
51.7
62.6
70.3
41.9
16.9
16.8
12.2
8.1
6.8
5.7
3.1
0.4
0.4
33
20
28
13
15
15
4
3
3
2
89.2
67.8
70.2
60.1
53.0
50.0
38.9
37.5
23.2
16.9
72
54
58
34
37
36
15
14
17
9
A+
A+
A+
A
AAC+
DF
F
5
16
18
39
49
57
76
126
149
154
92.9
86.7
88.2
88.1
86.8
87.8
87.2
81.3
78.4
72.9
1,953
1,527
1,688
24.8
55.3
70.7
10.4
3.5
1.8
6
4
0
61.4
37.8
34.8
30
24
9
B
D+
F
65
109
146
88.8
80.7
84.8
School
No.
of
stud.
Needville ISD
Needville
835
Stafford MSD
Stafford
986
Econ. Adv.
disad. read.
%
%
Adv. Pass
math read.
%
%
Pass
math
%
C@R
grade
Hou. Grad.
rank rate
%
32.9
5.0
2
49.5
17
C
86
91.2
58.2
2.2
6
29.0
25
C-
96
84.7
GALVESTON COUNTY
School
No.
of
stud.
Clear Creek ISD
Clear Horizons 419
Clear Lake
2,421
Clear Brook
2,375
Clear Springs 2,312
Clear Creek
2,177
Clear View
190
Dickinson ISD
Dickinson
2,554
Friendswood ISD
Friendswood 2,165
Galveston ISD
Ball
1,821
Hitchcock ISD
Hitchcock
327
La Marque ISD
La Marque
636
Santa Fe ISD
Santa Fe
1,416
Texas City ISD
Texas City
1,766
Econ. Adv.
disad. read.
%
%
Adv. Pass
math read.
%
%
Pass
math
%
C@R
grade
Hou. Grad.
rank rate
%
23.6
15.4
26.3
16.1
24.0
41.6
30.1
25.1
12.2
12.7
11.6
0.0
43
30
22
20
11
4
89.4
72.6
58.5
67.9
61.4
36.8
88
64
44
51
38
19
A+
A+
A
A
AF
6
9
31
32
54
148
97.6
90.2
89.3
90.0
83.4
93.8
55.0
4.5
4
34.1
20
C-
100
84.6
6.2
13.2
12
72.7
39
A-
42
94.8
58.5
2.6
1
31.6
6
F
141
76.6
75.8
0.8
4
23.1
22
F
140
75.3
66.0
0.0
0
11.1
1
F
163
68.6
21.2
2.8
3
34.9
15
D+
113
86.3
57.1
2.5
2
34.6
17
D-
132
82.5
Pass
math
%
C@R
grade
Hou. Grad.
rank rate
%
LIBERTY COUNTY
School
No.
of
stud.
Cleveland ISD
Cleveland
931
Dayton ISD
Dayton
1,406
Hardin ISD
Hardin
338
Hull-Daisetta ISD
Hull-Daisetta 187
Liberty ISD
Liberty
581
Tarkington ISD
Tarkington
554
Econ. Adv.
disad. read.
%
%
67.6
0.1
1
15.9
5
F
161
72.3
51.1
4.0
12
36.5
36
B-
68
81.6
32.5
2.4
14
38.0
37
C-
95
81.4
63.6
0.0
4
30.4
32
D-
130
85.4
45.4
1.5
1
34.0
16
F
144
80.9
38.4
2.7
6
40.7
18
C-
102
87.5
MONTGOMERY COUNTY
School
No.
of
stud.
Conroe ISD
The Woodlands 4,131
College Park 2,695
Oak Ridge
3,387
Conroe
3,327
Caney Creek 1,855
Magnolia ISD
Magnolia
1,747
Magnolia West 1,775
Montgomery ISD
Montgomery 2,200
New Caney ISD
New Caney
1,499
Splendora ISD
Splendora
1,023
Willis ISD
Willis
1,849
Econ. Adv.
disad. read.
%
%
Adv. Pass
math read.
%
%
Pass
math
%
C@R
grade
Hou. Grad.
rank rate
%
3.6
12.4
24.2
57.0
59.8
19.8
21.0
7.8
3.2
3.6
28
18
19
9
5
80.6
74.7
61.3
36.5
34.6
65
48
47
27
18
A+
A
AC
D+
21
30
51
87
108
89.1
86.1
83.4
80.9
82.4
23.8
37.9
8.3
2.4
5
4
56.5
42.7
30
22
BC-
67
94
86.0
86.6
19.6
8.4
16
64.0
46
A-
50
89.7
59.8
3.5
2
32.1
12
D-
131
82.4
52.5
5.5
3
40.8
20
D
116
85.8
51.8
1.5
4
31.6
31
D
117
83.0
WALLER COUNTY
School
Royal ISD
Royal
Waller ISD
Waller
Adv. Pass
math read.
%
%
No.
of
stud.
Econ. Adv.
disad. read.
%
%
Adv. Pass
math read.
%
%
Pass
math
%
C@R
grade
Hou. Grad.
rank rate
%
520
79.6
1.1
1
16.4
5
F
137
81.3
1,604
52.3
4.3
3
41.4
23
C-
97
87.8

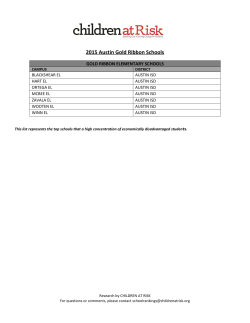


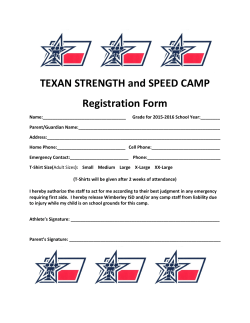
© Copyright 2026