
Gender Inequality in New Media: Evidence from
Gender Inequality in New Media: Evidence from Wikipedia∗ Marit Hinnosaar† May 2015 Abstract Media is considered to be critical for gender equality. I analyze Wikipedia, one of the prominent examples of new media. I study why women are less likely to contribute to Wikipedia, the implications of the gender gap, and what can be done about it. I find that: (1) gender differences in the frequency of Wikipedia use and in beliefs about one’s competence explain a large share of the gender gap in Wikipedia writing; (2) the gender gap among contributors leads to unequal coverage of topics; (3) providing information about gender inequality has a large effect on contributions. JEL codes: L86; L82; J16; H41 Keywords: Gender, Internet, Media, Public goods 1 Introduction United Nations is engaged in an initiative to increase female presence in the media.1 The initiative was established “in recognition that the media are critical to the achievement of gender equality and women’s empowerment”.2 In most traditional media outlets, men vastly outnumber women, and several major media organizations have taken steps to change that. Examples include Bloomberg introducing gender quotas for news stories3 and BBC for panel ∗ I’m grateful to Ainhoa Aparicio, Gabriele Camera, Matthias Doepke, Martin Dufwenberg, Avi Goldfarb, Shane Greenstein, Toomas Hinnosaar, Ryan McDevitt, David McKenzie, Mario Pagliero, Andrea Prat, Stephan Seiler, Alex Tetenov, and Michael Zhang for helpful comments and discussions. † Collegio Carlo Alberto, [email protected]. 1 http://www.unesco.org/new/en/communication-and-information/crosscutting-priorities/ gender-and-media/global-alliance-on-media-and-gender/about-gamag/, accessed May 15, 2015. 2 The Global Alliance on Media and Gender. Framework and Plan of Action. http://www.unesco. org/new/fileadmin/MULTIMEDIA/HQ/CI/CI/pdf/gamag_framework_and_action_plan_30sep2014.pdf, accessed May 15, 2015. 3 Posetti, Julie. 2015. “The Bloomberg News recipe for newsroom transformation,” World News Publishing Focus by World Association of Newspapers and News Publishers, March 17. http://blog.wan-ifra.org/ 2015/03/17/the-bloomberg-news-recipe-for-newsroom-transformation. 1 shows.4 One reason to introduce these measures, is that historically rigid institutions, work arrangements, and hiring policies in media, might otherwise inhibit women to be heard. In this paper, I analyze a new media source, which is not restricted by these institutions, but which nevertheless faces similar issues. I analyze Wikipedia, which is a widely used encyclopedia and one of the most prominent examples of collective knowledge production and new media. It is the sixth most popular website both in the US and in the world5 and many people rely on its information.6 Although anyone can write and edit Wikipedia entries, there is evidence that the majority of Wikipedia writers are men. According to surveys conducted among Wikipedia contributors, only 9 percent7 to 16 percent8 of them are women. The Wikimedia Foundation, which owns Wikipedia, views the lack of female contributors as a problem and has set itself goals to increase their share.9 Why does it matter who contributes to Wikipedia? Who contributes to its production matters if a gender gap among contributors leads to biased content. There is some evidence that Wikipedia’s coverage of topics is gender biased. In particular, popular media has voiced concerns that Wikipedia has less information about female than male public figures.10 For example, consider the authors whose fiction books reached number one on New York Times’s ”Best Sellers” list for the first time between 2005 and 2014. Wikipedia articles about such male authors are on average 88 percent longer than those of female authors.11 More generally, Reagle and Rhue (2011) document that biographies of women are more likely to be missing 4 BBC. 2014. “BBC TV boss: No all-male panel shows”, February 9. http://www.bbc.com/news/ entertainment-arts-26107011. 5 The popularity of Wikipedia is measured by the web traffic measurement company Alexa Internet (http://www.alexa.com/siteinfo/wikipedia.org, accessed March 16, 2015). 6 Many people unknowingly access information provided by Wikipedia because online services, such as Google and Apple’s Siri, use it. Google’s Knowledge Graph display (the box on the right-hand side of Google’s search results) is often based on Wikipedia (http://en.wikipedia.org/wiki/Knowledge_Graph, accessed January 9, 2015). http://www.siriuserguide.com/siri-faq/, accessed January 9, 2015. 7 Wikimedia Foundation. 2011. ”Editor Survey,” April. http://upload.wikimedia.org/wikipedia/ commons/7/76/Editor_Survey_Report_-_April_2011.pdf; Wikimedia Foundation. 2011. ”Second 2011 Wikipedia Editor Survey,” December. https://upload.wikimedia.org/wikipedia/commons/8/84/ December_2011_Wikipedia_Editor_Survey_topline.pdf. 8 Glott, Ruediger; Schmidt, Philipp; Ghosh, Rishab. 2010. ”Wikipedia Survey: Overview Results”, March. http://web.archive.org/web/20100414165445/http://wikipediasurvey.org/docs/ Wikipedia_Overview_15March2010-FINAL.pdf. 9 BBC. 2014. ”Wikipedia ’completely failed’ to fix gender imbalance,” BBC interview with Jimmy Wales, August 8. http://www.bbc.com/news/business-28701772. 10 Cohen, Noam. 2011. ”Define Gender Gap? Look Up Wikipedia’s Contributor List,” New York Times, January 30. http://www.nytimes.com/2011/01/31/business/media/31link.html. 11 From 2005 to 2014, there were 32 female authors and 28 male authors whose fiction books reached number one on New York Times’s ”Best Sellers” list and whose previous books had not been at the position. Of these bestselling books by female authors, 47 percent don’t have a Wikipedia page, but only 19 percent of the books by male authors don’t have a page. 2 from Wikipedia compared to Encyclopedia Britannica than those of men. Coverage of public figures is important because they are role models. Literature provides evidence that role models influence educational attainment (Beaman, Duflo, Pande, and Topalova, 2012; Fairlie, Hoffmann, and Oreopoulos, 2014) and political aspirations (Wolbrecht and Campbell, 2007) and that exposure to female leaders weakens stereotypes about gender roles and reduces gender bias (Beaman, Chattopadhyay, Duflo, Pande, and Topalova, 2009). In this paper, I study gender inequality in new media. My goal is to learn why women are less represented and how to change that. I restrict attention to Wikipedia, a prominent example of new media. Specifically, the questions I ask are the following: (1) Why are women less likely to contribute to Wikipedia? (2) What are the implications of this gender gap on Wikipedia’s content? (3) What can be done about it? The analysis also sheds some light to gender inequality in traditional media. It highlights the importance of representing diverse opinions and informs about measures to achieve that. To answer these questions, I use a large dataset of Wikipedia editing histories, and I conduct a survey and a randomized survey experiment with 1,000 participants on Amazon Mechanical Turk. The dataset of Wikipedia editing histories includes all registered editors who have reported their gender. I analyze their editing behavior on almost 900,000 biographies in the English-language edition of Wikipedia. I use the data to learn whether female editors are more likely than male editors to edit biographies of women. To complement the dataset, I conducted an online survey and a randomized survey experiment with 1,000 people on Amazon Mechanical Turk.12 This sample consists of internet users who could potentially contribute to Wikipedia (and some of them have done that), which allows me to study why individuals do or do not contribute to Wikipedia. The goal of the survey was to understand which factors influence Wikipedia editing behavior and how Wikipedia editing behavior is related to contributions to other online and offline public goods. The goal of the experiment was to test whether providing information about gender inequality in Wikipedia changes editing behavior, specifically, whether the information provided to the treatment group (1) increases the likelihood of editing Wikipedia articles about women and (2) increases the likelihood that survey participants, especially women, edit Wikipedia in the future. It has been puzzling that women contribute less to Wikipedia than men. There are no gender differences in the amount of free time.13 The gender gap in Internet usage is small, and there are no large gender differences in online behaviors, such as social networking, online news consumption, communication, and e-commerce.14 Moreover, women contribute 12 The randomized survey experiment is registered at the AEA RCT Registry with the number AEARCTR0000500. 13 Aguiar and Hurst (2007) document that in the US, men and women allocate about equal time to leisure. 14 Of US adults, 87 percent of men and 86 of women used the Internet in 2014 according to the Pew 3 no less than men to another example of online public good provision, writing user reviews for products and services.15 Based on the survey, I find that almost half of the gender gap in Wikipedia writing is explained by gender differences in two characteristics: frequency of Wikipedia use and belief about one’s competence. The fact that most contributors are men could lead to biased coverage in Wikipedia. I look at the articles about human beings. Based on both the survey and the dataset of Wikipedia editing histories, I find that women are about twice as likely as men to contribute to Wikipedia articles about women. The result continues to hold when restricting attention to specific groups of people, such as professionals or cultural figures. I analyze whether the distribution of editorial input reflects demand for the articles among readers. However, I find no evidence that articles about women have lower demand than those about men. On the contrary, the number of readers per editor is higher for articles about women, and the share of articles that no one reads is larger in the case of articles about men. What can be done about gender inequality in Wikipedia? From a randomized survey experiment, I find that providing information about gender inequality in Wikipedia almost doubles the likelihood of contributing to articles about women. However, the treatment of providing information decreases men’s likelihood of contributing to Wikipedia and has no effect on women. That is, the treatment leads editors to redirect their editorial input and equalizes participation among men and women but decreases overall participation in Wikipedia editing. Because there are other ways to increase overall contributions to Wikipedia, the informational treatment can still provide a useful way to decrease gender inequality. In conducting the randomized survey experiment, I follow the approach taken by Kuziemko, Norton, Saez, and Stantcheva (2015), who studied how information about inequality changes reported preferences for redistribution in a similar research design on Amazon Mechanical Turk. Amazon Mechanical Turk has recently gained popularity as a platform for experiments in economics (for other examples, see Horton, Rand, and Zeckhauser, 2011). Methodological papers have evaluated the platform’s suitability for surveys and experiments (see, for example, Research Center (”The Web at 25.” 2014, Pew Research Center, February 28. http://www.pewinternet. org/2014/02/25/the-web-at-25-in-the-u-s). In the UK in 2014, 82 percent of men and 81 percent of women between 16 and 74 years old used the Internet daily according to Eurostat. In the same sample in the UK, more women participated in online social networks (62 percent of women versus 58 of men), and more men read online news (64 percent of men versus 55 of women). In other activities, such as sending emails, making online purchases, and doing online banking, the differences are even smaller. (”Information Society Statistics,” Eurostat. http://ec.europa.eu/eurostat/web/information-society/data/database.) 15 Chen, Harper, Konstan, and Li (2010) found that women contribute more to online movie ratings. Surveys by Pew Research Center find no gender difference in writing user reviews (”Health Online 2013,” 2013, Pew Research Center. http://www.pewinternet.org/files/old-media//Files/Reports/PIP_HealthOnline. pdf; ”Online Product Research,” 2010, Pew Research Center. http://www.pewinternet.org/files/ old-media//Files/Reports/2010/PIP%20Online%20Product%20Research%20final.pdf). 4 Mason and Suri, 2012), and I followed their advice. The paper contributes to an emerging field in economics that studies contributions to new media. Contributions to Wikipedia have been studied by Zhang and Zhu (2011), Aaltonen and Seiler (2015), and Algan, Benkler, Morell, and Hergueux (2013).16,17 Zhang and Zhu (2011) studied the relationship between contributions to Wikipedia and group size using an exogeneous decrease in group size in Chinese-language Wikipedia. Aaltonen and Seiler (2015) studied the impact of the cumulative growth of content on new contributions. Algan, Benkler, Morell, and Hergueux (2013) conducted online experiments with current Wikipedia editors to test whether pro-social motives explain their contributions to Wikipedia. None of these papers examined the role of gender in contributions, which is the subject of this paper. More generally, the paper contributes to empirical studies of media bias. These have concentrated mainly on measuring media bias (Groseclose and Milyo, 2005) and analyzing sources of bias, including how consumer demand affects news (Gentzkow and Shapiro, 2010), how online, user-generated content affects print newspapers (Yildirim, Gal-Or, and Geylani, 2013), and advertisers’ influence on news content in politics (Tella and Franceschelli, 2011), in financial media (Reuter and Zitzewitz, 2006), and in blogs (Sun and Zhu, 2013). This paper studies bias in a relatively new media source, Wikipedia. Bias in Wikipedia has been studied in the case of Democrat versus Republican bias in political articles (Greenstein and Zhu, 2012, 2014) and gender bias in biographies (Reagle and Rhue, 2011). Reagle and Rhue (2011) compared biographies in Wikipedia and Encyclopedia Britannica and documented that Wikipedia biographies of women are more likely to be missing than biographies of men relative to Britannica. Although they measured the bias in coverage, they did not analyze the sources of bias or how to overcome it, which are the main questions studied in my paper. This paper also relates to literature on gender economics, in particular gender differences in contributions in a group, confidence, and the provision of public goods. The results presented in the paper are consistent with the findings of Coffman (2014), who shows that women are less likely to contribute their ideas to a group. I find that one of the reasons women contribute less to Wikipedia is differences in beliefs about one’s own competence.18 This is related to the results on gender and competition (for an overview, see Niederle and Vesterlund, 2011), where the difference in confidence is found to be one of the reasons for gender difference in competitiveness. Interestingly, literature on public good provision does 16 Contributions to other forms of new media have been studied, for example, in the case of user reviews (e.g., Chen, Harper, Konstan, and Li, 2010), Twitter (e.g., Toubia and Stephen, 2013), mobile-phone-based content generation (Ghose and Han, 2011), and local information provision to an extreme sports website (Shriver, Nair, and Hofstetter, 2013). 17 Data from Wikipedia has also been used to study questions that are less related to this paper, such as the impact of copyright (Nagaraj, 2014). 18 However, in this paper, we cannot confirm whether the beliefs about one’s competence are correct. 5 not provide a clear reason for why we should expect women to contribute less to Wikipedia. Experimental evidence on the role of gender in public good provision and, more generally, social preferences is mixed (for overviews, see Eckel and Grossman, 2008; Croson and Gneezy, 2009; Bertrand, 2011). This paper does not analyze how gender inequality in new media affects real-life decisions. However, the above cited literature on the importance of role models suggests that it might have an impact on educational choices and political aspirations. Additionally, several studies in media economics provide evidence that media matters. For example, local television news affected voter turnout in the US (Oberholzer-Gee and Waldfogel, 2009), voting decisions were affected by candidate endorsements by newspapers in the US (Chiang and Knight, 2011) and by independent TV in Russia (Enikolopov, Petrova, and Zhuravskaya, 2011), access to cross-border radio had an impact on nationalism in Croatia (DellaVigna, Enikolopov, Mironova, Petrova, and Zhuravskaya, 2014), cable television affected women’s status in India (Jensen and Oster, 2009), and soap operas affected fertility decisions in Brazil (Ferrara, Chong, and Duryea, 2012). The remainder of the paper is organized as follows. Section 2 describes the Wikipedia’s editing process, the dataset of Wikipedia editing histories, the survey, and the randomized survey experiment. Section 3 presents empirical results that answer three questions. First, why are women less likely to edit Wikipedia compared to men? Second, how does the gender gap in participation affect biographies on Wikipedia? Third, how does the treatment of providing information affect gender inequality in Wikipedia? Section 4 concludes. 2 Background and data 2.1 Wikipedia’s editing process Wikipedia is a free-access Internet encyclopedia. As of January 1, 2015, it contains 34 million articles, including 4.7 million articles in English-language Wikipedia.19 Wikipedia is owned by the Wikimedia Foundation, a non-profit foundation. It is written by volunteers. Anyone can create Wikipedia articles and edit almost any of its existing articles. There are two types of editors: anonymous and registered. Registration is not required for most editing activities. However, to create new articles or to upload images, editors have to register. For each article, Wikipedia records who, when, and how edited the article. In the case of anonymous editors, their computers’ IP addresses are recorded. 19 http://en.wikipedia.org/wiki/Wikipedia, accessed January 1, 2015. 6 Wikipedia’s editing community is large. According to Wikimedia Statistics,20 as of December 2014, about 5.3 million registered editors had contributed to the English-language edition of Wikipedia. Most editors made only a few edits, but about 976,000 editors had edited at least 10 times. Registered editors made about 61 percent of edits in English-language Wikipedia. 2.2 Dataset of Wikipedia editing histories 2.2.1 Dataset construction The dataset is constructed from editing histories of the English-language edition of Wikipedia. To analyze editing by the gender of the editor, I restrict attention to the editors who have reported their gender when registering their Wikipedia username. I analyze their editing behavior of articles about human beings. In particular, I’m interested in whether they edit articles about men or women. To learn whether a Wikipedia article is about a human being, I use information from Wikidata, which is a database managed by the Wikimedia Foundation. From Wikidata, I also learn the gender and year of birth of the human being. I include in the sample all the human beings in Wikidata as of July 2014 who were born in any year from 1000 to 2000 and who were either male or female. There are almost one million such human beings. When there was more than one birth year in the database, the earliest was taken (there were 1,445 such human beings in the database). I exclude all human beings whose gender is not determined to be either male or female in Wikidata (either gender is missing, it is not male or female, or the person has more than one gender in the database), there are 41 such cases. After excluding those, we are left with the Wikidata final sample of 924,371 human beings. From the Wikidata database, I also obtain information about the professions of the human beings. I use the information to look at subgroups and exclude celebrities like actors, athletes, and pop stars. Of the sample of human beings selected above, 490,023 have at least one profession in the Wikidata database. I categorize all the professions that are held by at least 1,000 human beings in the sample, which is 88% of all the professions held by these people, into three groups. The first group I call Professionals, this includes lawyers, politicians, and scientists among others. The second group I call Culture, where I include writers, painters, composers, etc. but exclude actors and singers. The third group called Other consists mostly of athletes but also includes actors and singers. The exact list is in Appendix C in Table C.1. As of July 2014, 259,638 registered editors of English-language Wikipedia had reported their gender when registering their Wikipedia username. Of those, 14.4 percent reported their 20 http://stats.wikimedia.org/EN/TablesWikipediaEN.htm, accessed January 31, 2015. 7 gender as female. The number of editors who reported their gender is not small; however, the majority of registered editors have not reported their gender. This is not surprising because Wikipedia requires almost no information to register, no real name or even an email address. That only a small percentage of editors reports their gender is one of the reasons why I complement the Wikipedia editing histories with the survey data. The editors who report their gender tend to be more active, with a larger number of edits. Note that for my analysis it is not important that male and female editors report their gender at equal rates. For example, it might be that women are less likely to report their gender for fear of harassment. For this analysis that is not a problem. What is important is that editors don’t systematically report wrong gender. Since the default option is not specifying one’s gender, I would not expect that they are massively reporting wrong gender. The sample of editors used in the paper consists of all the editors who reported their gender and who have edited English-language Wikipedia articles about human beings in the Wikidata final sample. There are 74,817 such editors. They have edited 866,431 articles about the human beings in the Wikidata final sample. 2.2.2 Summary statistics Table 1 presents summary statistics of the Wikipedia editors in the sample. 12.6 percent of editors are women. Women contribute somewhat longer texts than men, both per article and in total per year. Changes over time in the number of active editors and the share of female editors are depicted in Figure 1. The percentage of female editors has increased from 3.7 percent in 2002 to a peak of 11.5 percent in 2011. In 2013, 10.4 percent of the active editors were female. Changes in the percentage of female editors mirrored changes in the total number of active editors. The number of active editors increased monotonically from 81 in 2002 to 27,600 in 2011 and was 22,600 in 2013. 2.3 Survey and experiment The survey together with the randomized survey experiment was administered in September 2014. The survey had the following structure: (1) background socioeconomic questions including gender, age, education, work status, and children; (2) questions about previous Wikipedia use and editing; (3) randomized treatment providing information about gender inequality in Wikipedia shown only to the treatment group; the control group was shown information about Wikipedia that was not related to gender; (4) hypothetical situation where one is asked to edit Wikipedia; specifically, respondents were asked to choose a Wikipedia page of a person and find some information from the Internet that is missing from the 8 Wikipedia page; note that the respondents were not asked to actually edit Wikipedia; (5) questions about Wikipedia editing, including respondents’ beliefs about their competence and the likelihood of editing Wikipedia in the future; and (6) questions about charitable giving, volunteering, writing user reviews, and free time. 2.3.1 Randomized survey experiment The goal of the experiment was to test whether providing information about gender inequality in Wikipedia changes editing behavior. Individuals were randomly assigned to either a treatment or a control group with equal probabilities. The information provided to the treatment group is a quote from the Wikipedia page, ”Gender Bias on Wikipedia”21 : ”Wikipedia has been criticized by some academics and journalists for having only 9% to 13% female contributors and for having fewer and less extensive articles about women or topics important to women.” The control group read the following information about Wikipedia, which has nothing to do with gender bias: ”Wikipedia started in 2001. English-language Wikipedia has over 4.5 million articles.” After reading the information, respondents were asked to imagine a hypothetical situation in which they edit a person’s Wikipedia page. Respondents were asked to look at Wikipedia articles and find some relevant information from the web that is missing from a Wikipedia article. Note that respondents were never asked to actually edit Wikipedia. Respondents were only asked to report the Wikipedia page they would choose and the information they would hypothetically add to the page. In the end, they were also asked how likely they are to edit Wikipedia in the future. 2.3.2 Data collection The survey was posted on Amazon Mechanical Turk. Amazon Mechanical Turk is an Internet marketplace, where workers perform tasks, including answering surveys and participating in experiments. The survey was described as a 20-minute research study on Wikipedia, which pays the participant $1.50. The payment gives an effective hourly wage close to the average effective hourly wage on Amazon Mechanical Turk according to Kuziemko, Norton, Saez, and Stantcheva (2015). To ensure high-quality responses, several measures were taken based on advice from previous studies that used Amazon Mechanical Turk. First, only workers with good a track record were allowed to take the survey. The exact qualification criteria were that a worker 21 The Wikipedia page, ”Gender Bias on Wikipedia”, was from August 24, 2014: http://en.wikipedia. org/w/index.php?title=Gender_bias_on_Wikipedia&oldid=622670577 9 must have completed and approved at least 50 tasks, and his or her approval rate must be 95 percent or higher. Second, only workers from the US were eligible to take the survey. I chose to limit the set of possible respondents to those in somewhat similar environments because the survey asked about volunteering and writing user reviews. The location was checked and restricted by Amazon itself. According to computer IP addresses of the workers who completed the survey, a very small percentage came from locations outside of the US. Third, respondents were told that payment would be contingent on completing the survey and providing a survey code visible only after finishing. The respondents were not allowed to skip any questions. Fourth, respondents were told that they can start the survey only once. The main concern was that they reach the treatment page multiple times and see both the treatment group’s and control group’s information. One respondent reached the treatment page twice, but by chance, he received the same treatment both times, so I still include his responses in the sample. The survey stayed open until 1,000 workers reported that they had completed it. Of the 1,000 Amazon Mechanical Turk workers, 26 did not provide a valid survey response: four workers could not be matched to any survey response (because they either had not started the survey or did not provide enough information to match to the survey response), three started but did not complete the survey, and 19 did not provide a link to the Wikipedia page of a person (because they either misunderstood the question or ignored the instructions). After excluding these respondents, 974 remained. 2.3.3 Summary statistics Table 2 shows characteristics of the 974 respondents who completed the survey. In terms of demographic characteristics, the sample is quite representative of the general population: 49.5 percent of the sample is female, 54.0 percent has at least a college degree, 57.7 percent works at least 35 hours per week, and 10.0 percent is unemployed. However, the sample is on average younger, only 35.4 percent is at least 35 years old. This is similar to other studies using Amazon Mechanical Turk, including Kuziemko, Norton, Saez, and Stantcheva (2015). Compared to a representative sample of U.S. adults, the population on Amazon Mechanical Turk is restricted to Internet users. However, this fits well the purpose of my study, because these individuals edit or potentially could edit Wikipedia. 21.9 percent of the sample has edited Wikipedia previously. Of those who have edited, 31.5 percent are women. It is difficult to say how close is this to a representative sample of U.S. Internet users, because anyone can edit Wikipedia without registering. A back-of-theenvelope calculation says that in 2008, 16 percent of Internet users had edited Wikipedia. This calculation is subject to caveats, because it combines information from two different 10 surveys in 2008, according to which: 47 percent of U.S. Internet users used Wikipedia22 and 33 percent of Wikipedia users had edited Wikipedia.23 Table 3 presents respondents characteristics for men and women in the control group separately by gender. The treatment group is excluded here to make sure the responses are not affected by the treatment. In terms of demographic characteristics, there are significant differences between men and women only in employment: 65 percent of men and 46 percent of women work at least 35 hours per week. There are several significant differences between men and women in terms of Wikipedia-related behavior and attitudes. Women use and edit Wikipedia significantly less than men. Note that the frequency of Wikipedia use depends on both the frequency of using encyclopedias and preference for Wikipedia over other sources, such as Encyclopedia Britannica. A larger share of women believe they are less competent than other editors to edit Wikipedia. There are no significant differences between men and women in writing user reviews, in the amount of free time, and in volunteering. However, women are significantly more likely than men to give to charity. 2.4 Additional data sources I use data on Wikipedia viewership statistics to describe pages’ popularity. The dataset includes for each Wikipedia page the number of page views in September 2014.24 Page views are from a time period outside the editing histories in the sample. On average, the number of page views is rather stable across months, and there is no reason to believe that September 2014 is somehow different from other time periods. 3 Empirical results This section provides empirical results that answer three questions. First, why are women less likely to contribute to Wikipedia? Second, what are the implications of the gender gap in participation on the information available on Wikipedia? Third, how does the treatment of providing information about gender inequality in Wikipedia affect editing behavior? 22 Pew Internet & American Life Project Poll, Nov, 2008. http://www.ropercenter.uconn.edu/psearch/ question_view.cfm?qid=1727230&pid=53&ccid=50, accessed May 14, 2015. 23 Glott, Ruediger; Schmidt, Philipp; Ghosh, Rishab. 2010. ”Wikipedia Survey: Overview Results”, March. http://web.archive.org/web/20100414165445/http://wikipediasurvey.org/docs/ Wikipedia_Overview_15March2010-FINAL.pdf. 24 The data on page views is downloaded from: http://dumps.wikimedia.org/other/pagecounts-raw/ 11 3.1 Why are women less likely to edit Wikipedia? To answer the question why women contribute less to Wikipedia, I use the survey data. I present two sets of results. First, I analyze which characteristics and behaviors are correlated with editing Wikipedia. Second, I analyze how much of the gender difference in Wikipedia editing is explained by the gender differences in these characteristics. I use two measures for Wikipedia editing: (1) whether the respondent has edited Wikipedia in the past and (2) whether the respondent reports that he or she is likely to edit Wikipedia in the future. Throughout the analysis, the sample is restricted to the control group in the survey experiment. Table 4 presents results from logit regressions where the dependent variable, an indicator for editing Wikipedia, is regressed on gender and other characteristics. These include demographic characteristics (indicators for being 35 or older, having a college degree, being unemployed, and working at least 35 hours per week), behaviors and attitudes toward Wikipedia (indicators for using Wikipedia daily, using Wikipedia at least weekly, and belief about one’s competence compared to other Wikipedia editors), and other behaviors (indicators for donating to charity in the past year, volunteering at least one hour per week in the past year, writing a user review in the past six months, and having at least three hours of leisure time per weekday). In column 1, the dependent variable is an indicator for whether the respondent has edited Wikipedia in the past. Estimates show that those who use Wikipedia daily or who have written a user review in the past six months are more likely to have edited Wikipedia. A stronger belief about one’s competence compared to other potential editors is positively associated with the likelihood of having edited Wikipedia. The gender difference in the belief about competence could be due to women being less competent or due to women underestimating their competence. The survey data does not allow to distinguish these. In column 2, the dependent variable is an indicator for whether the respondent reports he or she is likely to edit Wikipedia in the next 30 days. Specifically, the variable takes value one if the respondent answered that he or she is either “very likely” or “quite likely” to the question: “How likely or unlikely is it that you will actually edit Wikipedia over the next 30 days?” The only characteristics that are statistically significantly associated with the likelihood of editing are daily use of Wikipedia and belief about one’s competence. Appendix C presents Table C.2 with the same regressions estimated separately for men and women. Let’s address the role of editor’s gender in the decision to edit Wikipedia. The estimates in the first column of Table 4 imply that women are significantly less likely to have edited Wikipedia in the past even controlling for other factors. But according to the estimates in the second column, gender itself is not statistically significant, implying that the gender gap in the likelihood of editing in the future is explained by other characteristics. To learn how 12 much of the gender difference in Wikipedia editing is explained by gender itself and how much comes from men and women having different attitudes and behaviors toward Wikipedia, I decompose the gender difference in editing Wikipedia using Oaxaca (1973) decomposition, which was extended to non-linear equations by Fairlie (2005).25 For the explanatory variables, I include indicators for daily Wikipedia use, at least weekly Wikipedia use, and belief about one’s competence compared to other editors. The coefficient estimates of these variables were statistically significant in the logit regressions in Table 4, and the variables have a large gender difference as presented in Table 3. Table 5 presents the results from the non-linear decomposition. In the first row, the dependent variable is an indicator of whether the respondent has edited Wikipedia in the past. The difference in editing rates of men and women is 15.0 percentage points. Gender differences in the frequency of Wikipedia use and the belief about one’s competence explain a large share, namely, 43 percent of the gender gap in editing. In the second row, the dependent variable is whether the individual is likely to edit Wikipedia in the next 30 days. The difference in editing rates of men and women is 5.2 percentage points. Gender differences in these characteristics explain 79 percent of the gender gap in editing. 3.2 The effects of gender gap on Wikipedia content In this subsection, I study whether gender gap among editors leads to gender inequality in the biographical information available on Wikipedia. Specifically, I test whether female editors are more likely than males to edit biographies of women. I use two alternative data sources: (1) Wikipedia editing histories of editors who have reported their gender and (2) the survey data. One reason why more editorial input could be directed to the biographies of men is demand for the articles among Wikipedia users. In the last part of the subsection, I study 25 ˆ can be written as The decomposition for the non-linear equation Y = F (X β) M W N X F (X M βˆP ) N X F (X W βˆP ) i i Y¯ M − Y¯ W = − M W N N i=1 i=1 M W M W N N X F (X M βˆM ) N X F (X M βˆP ) X F (X W βˆW ) N X F (X W βˆP ) i i i i + + − − M M W W N N N N i=1 i=1 i=1 i=1 where Y¯ j is the average probability of the binary outcome variable Y by gender j = M, W , N j is the sample size by gender, F is the cumulative distribution function of the logistic distribution, Xij is a row vector of explanatory variables of individual i of gender j, βˆj is a vector of coefficient estimates for gender j, and βˆP is a vector of coefficient estimates from a pooled sample of both genders. The term in the first brackets captures the part of the gender gap in editing that is explained by the gender differences in explanatory variables. 13 whether the allocation of editorial input is proportional to readership. Specifically, I analyze whether there is less demand for existing articles about women compared to those about men. Note that there could also be gender differences in demand for Wikipedia pages that do not exist, but I concentrate only on demand for existing articles using data about Wikipedia page views. 3.2.1 Evidence from Wikipedia editing histories In this part, I simply document that Wikipedia female editors direct relatively more of their editorial input to biographies of women. Table 6 presents the average (over editors) percentage of contributions to biographies of women from contributions to all biographies. An observation here is an editor. In column 2, the average percentage is calculated over male editors and, in column 3, over female editors. Contributions can be measured in multiple ways. In rows 1-3, contributions are measured in the length of text added. The first row of Table 6 shows that the average percentage of text added to biographies of women is 31% in the case of female editors and 17% in the case of male editors. To make sure that the gender difference does not come only from celebrities like actors, athletes, and pop stars, rows 2 and 3 restrict attention to subgroups of biographies. In row 2, the sample includes lawyers, politicians, scientists, etc. (group Professionals); in row 3, it includes writers, painters, composers, etc. (group Culture); the exact list of the groups is presented in Appendix C, Table C.1. A large gender difference remains in both groups. Rows 4-6 measure contributions by the number of biographies edited. The measure gives similar results. Figure 2 presents the percentage of text added to biographies of women from text added to all biographies, separately by male and female editors. Excluding the beginning of Wikipedia when the number of editors was very small, the relative share of contributions to biographies of women has increased, but the difference between male and female editors remained large. In Appendix D, Figure D.1 presents the same statistics for the same subgroups of biographies as above. The trends are similar to aggregate statistics. 3.2.2 Survey evidence The dataset of Wikipedia editing histories is limited by the fact that editors must report their gender, and relatively few editors do so. Therefore, I complement the analysis with survey results. The survey data has two advantages. First, it represents a more general population. Second, it includes more information about (potential) editors than only their gender. Hence, it allows to test whether gender matters for the choice which article to edit, even when we control for other characteristics of the editor. 14 This part presents two sets of results using survey data. First, I redo a similar exercise of comparing the likelihood of editing biographies of women versus men by male and female editors. The results largely confirm the ones from Wikipedia editing histories. Second, I test whether gender has a statistically significant impact on the likelihood of choosing to edit biographies of women versus biographies of men, even when controlling for other characteristics of the respondent. Throughout this part, the sample is restricted to the control group in the survey experiment. Table 7 presents the likelihood of choosing to edit a Wikipedia article about a woman over an article about a man, by the gender of the survey respondent. The first row shows that 31 percent of female respondents choose to edit a biography of a woman, and only 11 percent of male respondents do that. Note that 31 percent of female respondents choosing to edit a biography of a woman is not a small percentage, because they had to choose from the existing biographies in Wikipedia and only 15.2 percent of those are biographies of women. Rows 2 - 7 of Table 7 present the statistic by survey respondents’ education, age, and whether they have edited Wikipedia in the past. In all the groups, female respondents are more likely to edit biographies of women. The last rows of the table restrict attention to subgroups of biographies (as defined in Table C.1): first, lawyers, politicians, scientists, etc. (group Professionals); and second, writers, painters, composers, etc. (group Culture). A large gender difference remains in both groups. Table 8 predicts whether survey respondents chose to edit a Wikipedia article about a women based on respondents’ gender and other characteristics. The characteristics included are an indicator for being at least 35 years old, having a college degree, being unemployed, working at least 35 hours per week, using Wikipedia daily, using Wikipedia at least weekly, and having edited Wikipedia in the past. The results show that women are statistically significantly more likely than men to edit an article about a women versus a man; no other included characteristic has a significant impact. 3.2.3 Is the allocation of editorial input proportional to readership? This section analyzes whether the allocation of editorial input to the Wikipedia articles about men and women is proportional to readership. Each day, there is a large share of Wikipedia articles that noone reads. I will start by restricting attention to those. Second, I will look at all the biographies. The data on readership is from page views for the month of September 2014 for more than 900,000 biographies in Wikipedia. First, I simply document that on a typical day, the percentage of biographies of men that no one reads is larger than that of women. Table 9 presents the daily statistics regarding the percentage of biographies in Wikipedia that no one reads. On a typical (median) day in 15 September 2014, no one read 26 percent of the biographies of men versus only 16 percent of the biographies of women.26 Note that over a longer period of time almost all the articles have readers. The above statistics could be interpreted that at the lower tail of the readership distribution, biographies of men have fewer readers than biographies of women. We see this also when we look at the whole distribution of readership. Figure 3 presents the cumulative distribution of the number of page views of biographies of men and women, where the page views are divided by the number of editors in the sample who edited the page. As confirmed by the Kolmogorov-Smirnov test in Table C.3 in Appendix C, biographies of women receive more page views per editor. Appendix B.1 repeats the analysis for survey data, and results are similar. Overall, this seems to imply that demand side cannot be the only reason for gender inequality in Wikipedia coverage. Instead, gender inequality in coverage seems to originate, at least partially, from the supply side of Wikipedia production. 3.3 How to reduce gender inequality in Wikipedia? There are many potential ways how to reduce gender inequality in Wikipedia. I look at only one of these, which is providing information. The main reason to concentrate on this one, is that it is cheap and simple to implement. This section presents evidence from a randomized survey experiment on the impact of providing information about gender inequality in Wikipedia. First, I look at how the treatment affected respondents’ answers regarding their choice of which Wikipedia article to edit. Specifically, I’m interested in the gender of the person whose biography they chose to edit. Second, I look at whether the treatment affects answers about the likelihood of editing Wikipedia in the future. 3.3.1 Choice of pages to edit Table 10 presents the effect of the treatment on the answers about the choice of the Wikipedia article respondents would edit. Column 1 shows that the treatment is associated with a 95 percent increase in the share of women’s biographies. Note that in the control group, the share of women’s biographies is only 20 percent. With the treatment, it gets close to 40 percent. Inclusion of demographic characteristics (column 2) decreases the scaled treatment effect from 95 to 90 percent. The scaled treatment effect is larger for men than women as shown in columns 3-6. 26 The median is taken over the days, and it is calculated separately for the biographies of men and the biographies of women. 16 Column 3 shows that the treatment in the case of men is associated with a 119 percent increase in the share of women’s biographies. The result is robust to inclusion of demographic characteristics (column 4). Column 5 shows that the treatment in the case of women is associated with a 77 percent increase in the share of women’s biographies, and it is robust to inclusion of demographic characteristics (column 6). The larger treatment effect for male respondents reflects the fact that the starting point for men was lower. In the control group, only 11 percent of male respondents would edit biographies of women compared to 31 percent of female respondents. Overall, the treatment redirects editorial input and almost doubles the likelihood of contributing to an article about a woman. Appendix B.2 describes how the treatment affects the allocation of editorial input in terms of readership. There is no evidence that the treatment makes the allocation significantly worse or better in terms of readership. 3.3.2 Participation Table 11 presents the effect of the treatment on the answers about the likelihood of editing Wikipedia in the future. Column 1 shows that the treatment is associated with a 35 percent decrease in the likelihood of editing Wikipedia in the future. When including demographic characteristics (column 2), the decrease is 37 percent. That the treatment decreases the likelihood of editing is somewhat unexpected. Columns 3-6 look at the effect of the treatment on men and women separately, and this helps to clarify the finding. We see that the treatment is associated with a decrease in the likelihood of editing in the case of men (columns 3-4), and it has no effect on women (columns 5-6). Namely, column 3 shows that the treatment in the case of men is associated with a 62 percent decrease in editing. When including demographic characteristics (column 4), the decrease is 64 percent. To analyze the robustness of the finding regarding the likelihood of editing, I restrict the sample using three characteristics: Wikipedia use, beliefs about competence, and writing user reviews. The results from the restricted samples are presented in Table C.4 in Appendix C and are similar to those from the main sample. The information that the majority of Wikipedia editors are men, leads men to reduce their editing effort, but it does not change the behavior of women. There are other examples in the literature where informational treatment has backfired (e.g., Beshears, Choi, Laibson, Madrian, and Milkman, 2015). On the one hand, the informational treatment in this paper can be considered a moral reminder and, on the other hand, a peer information intervention (information about what peers typically do, also called social norms marketing). There is mixed evidence on whether moral reminders work.27 For example, Pruckner and Sausgruber 27 For an overview of the impact of moral reminders on tax compliance, see Luttmer and Singhal (2014). 17 (2013) find that a moral reminder increases honesty in payments, but Fellner, Sausgruber, and Traxler (2013) find that moral reminders have no effect on tax compliance. Note that in the treatment in this paper, it’s less costly for men to react to the moral reminder than for women. Men can reduce the gender gap among editors by editing less, and this is easy to do in terms of effort; but for women to reduce gender inequality, the solution is more costly, they should edit more. That women don’t report an increase in editing is in line with the studies that have found that peer information intervention moves behavior closer to the peer group average.28 There is also some evidence from field experiments that information about negative social norms does not encourage good behavior (e.g., Yeomans and Herberich, 2014). 4 Conclusions This is the first comprehensive study of gender inequality in a new media environment such as Wikipedia. Combining survey data, experimental evidence, and a large dataset of Wikipedia editing histories, I study the reasons why women are less likely to contribute to Wikipedia, the implications of this gender gap, and what can be done about it. The findings are important for a widely used reference source like Wikipedia and there are wider implications for both traditional and new media.29 I find that men and women tend to contribute to different topics. This implies that gender gap among contributors leads to an unequal coverage of topics. Moreover, I find that almost half of the gender gap in contributions is explained by gender differences in two characteristics: frequency of Wikipedia use and belief about one’s competence. Combining the difference in Wikipedia use with the finding that men and women contribute to different topics, it points toward a possible equilibrium effect: if a media channel covers fewer topics that women are interested in, then women use it less frequently and are less interested in contributing. The results of the paper suggest that providing information to the editors about the gender inequality can alleviate the gender gap in contributions. The informational treatment changes the allocation of editorial input. Although, it comes at the cost of decreasing the editorial input of men. The result provides an example where encouraging gender equality can partially backfire. Wikipedia has set a goal to increase the share of female editors. One 28 For example, information about peers moved outcomes closer to the average in case of energy conservation (Schultz, Nolan, Cialdini, Goldstein, and Griskevicius, 2007), charitable giving (Croson and Shang, 2008; Jones and Linardi, 2014), restaurant dining choices (Cai, Chen, and Fang, 2009), and contributions of movie ratings (Chen, Harper, Konstan, and Li, 2010). 29 Wikies and other online collaboration tools are used in many public and private content production environments. For example, a for-profit site, Wikia hosts several hundred thousand wikies on a variety of topics. 18 way to achieve this is by discouraging male editors. However, this might not be desirable, especially, considering the finding by Aaltonen and Seiler (2015) that past contributions tend to motivate further contributions in Wikipedia. The implication for Wikipedia and other forms of media is that it is important to balance the efforts of attracting new contributors and keeping the current ones. This paper has concentrated on gender, but more broadly, it highlights the importance of representing diverse opinions. Similar issues arise in case of other demographic characteristics. For example, it has been noted that information about black history is lacking in Wikipedia and the Wikimedia Foundation is trying to engage new editors in order to change that.30 References Aaltonen, A., and S. Seiler (2015): “Cumulative Growth in User Generated Content Production: Evidence from Wikipedia,” Management Science, p. forthcoming. Aguiar, M., and E. Hurst (2007): “Measuring Trends in Leisure: The Allocation of Time Over Five Decades,” The Quarterly Journal of Economics, 122(3), 969–1006. Algan, Y., Y. Benkler, M. F. Morell, and J. Hergueux (2013): “Cooperation in a Peer Production Economy: Experimental Evidence from Wikipedia,” Working Paper. NBER Workshop on the Economics of IT and Digitization. Beaman, L., R. Chattopadhyay, E. Duflo, R. Pande, and P. Topalova (2009): “Powerful Women: Does Exposure Reduce Bias?,” The Quarterly Journal of Economics, 124(4), 1497–1540. Beaman, L., E. Duflo, R. Pande, and P. Topalova (2012): “Female Leadership Raises Aspirations and Educational Attainment for Girls: A Policy Experiment in India,” Science, 335(6068), 582–586. Bertrand, M. (2011): “New Perspectives on Gender,” in Handbook of Labor Economics, ed. by David Card and Orley Ashenfelter, vol. Volume 4, Part B, pp. 1543–1590. Elsevier. Beshears, J., J. J. Choi, D. Laibson, B. C. Madrian, and K. L. Milkman (2015): “The Effect of Providing Peer Information on Retirement Savings Decisions,” The Journal of Finance, p. forthcoming. 30 Smith, Jada F. 2015. “Howard University Fills in Wikipedias Gaps in Black History,” New York Times, February 19. http://www.nytimes.com/2015/02/20/us/ at-howard-a-historically-black-university-filling-in-wikipedias-gaps-in-color.html. 19 Cai, H., Y. Chen, and H. Fang (2009): “Observational Learning: Evidence from a Randomized Natural Field Experiment,” American Economic Review, 99(3), 864–82. Chen, Y., F. M. Harper, J. Konstan, and S. X. Li (2010): “Social Comparisons and Contributions to Online Communities: A Field Experiment on MovieLens,” American Economic Review, 100(4), 1358–98. Chiang, C.-F., and B. Knight (2011): “Media Bias and Influence: Evidence from Newspaper Endorsements,” The Review of Economic Studies, 78(3), 795–820. Coffman, K. B. (2014): “Evidence on Self-Stereotyping and the Contribution of Ideas,” The Quarterly Journal of Economics, 129(4), 1625–1660. Croson, R., and U. Gneezy (2009): “Gender Differences in Preferences,” Journal of Economic Literature, 47(2), 448–474. Croson, R., and J. Y. Shang (2008): “The impact of downward social information on contribution decisions,” Experimental Economics, 11(3), 221–233. DellaVigna, S., R. Enikolopov, V. Mironova, M. Petrova, and E. Zhuravskaya (2014): “Cross-Border Media and Nationalism: Evidence from Serbian Radio in Croatia,” American Economic Journal: Applied Economics, 6(3), 103–132. Eckel, C. C., and P. J. Grossman (2008): “Differences in the Economic Decisions of Men and Women: Experimental Evidence,” in Handbook of Experimental Economics Results, ed. by Charles R. Plott and Vernon L. Smith, vol. Volume 1, pp. 509–519. Elsevier. Enikolopov, R., M. Petrova, and E. Zhuravskaya (2011): “Media and Political Persuasion: Evidence from Russia,” American Economic Review, 101(7), 3253–3285. Fairlie, R. W. (2005): “An extension of the Blinder-Oaxaca decomposition technique to logit and probit models,” Journal of Economic and Social Measurement, 30(4), 305–316. Fairlie, R. W., F. Hoffmann, and P. Oreopoulos (2014): “A Community College Instructor Like Me: Race and Ethnicity Interactions in the Classroom,” American Economic Review, 104(8), 2567–2591. Fellner, G., R. Sausgruber, and C. Traxler (2013): “Testing Enforcement Strategies in the Field: Threat, Moral Appeal and Social Information,” Journal of the European Economic Association, 11(3), 634–660. 20 Ferrara, E. L., A. Chong, and S. Duryea (2012): “Soap Operas and Fertility: Evidence from Brazil,” American Economic Journal: Applied Economics, 4(4), 1–31. Gentzkow, M., and J. M. Shapiro (2010): “What Drives Media Slant? Evidence From U.S. Daily Newspapers,” Econometrica, 78(1), 35–71. Ghose, A., and S. P. Han (2011): “An Empirical Analysis of User Content Generation and Usage Behavior on the Mobile Internet,” Management Science, 57(9), 1671–1691. Greenstein, S., and F. Zhu (2012): “Is Wikipedia Biased?,” American Economic Review: Papers and Proceedings, 102(3), 343–348. (2014): “Do Experts or Collective Intelligence Write with More Bias? Evidence from Encyclopedia Britannica and Wikipedia,” Harvard Business School Working Paper, 15-023. Groseclose, T., and J. Milyo (2005): “A Measure of Media Bias,” The Quarterly Journal of Economics, 120(4), 1191–1237. Horton, J. J., D. G. Rand, and R. J. Zeckhauser (2011): “The online laboratory: conducting experiments in a real labor market,” Experimental Economics, 14(3), 399–425. Jensen, R., and E. Oster (2009): “The Power of TV: Cable Television and Women’s Status in India,” The Quarterly Journal of Economics, 124(3), 1057–1094. Jones, D., and S. Linardi (2014): “Wallflowers: Experimental Evidence of an Aversion to Standing Out,” Management Science, 60(7), 1757–1771. Kuziemko, I., M. I. Norton, E. Saez, and S. Stantcheva (2015): “How Elastic Are Preferences for Redistribution? Evidence from Randomized Survey Experiments,” American Economic Review, 105(4), 1478–1508. Luttmer, E. F. P., and M. Singhal (2014): “Tax Morale,” Journal of Economic Perspectives, 28(4), 149–68. Mason, W., and S. Suri (2012): “Conducting behavioral research on Amazon’s Mechanical Turk,” Behavior Research Methods, 44(1), 1–23. Nagaraj, A. (2014): “Does Copyright Affect Creative Reuse? Evidence from the Digitization of Baseball Digest,” manuscript. Niederle, M., and L. Vesterlund (2011): “Gender and Competition,” Annual Review of Economics, 3(1), 601–630. 21 Oaxaca, R. (1973): “Male-Female Wage Differentials in Urban Labor Markets,” International Economic Review, 14(3), 693. Oberholzer-Gee, F., and J. Waldfogel (2009): “Media Markets and Localism: Does Local News en Espanol Boost Hispanic Voter Turnout?,” American Economic Review, 99(5), 2120–2128. Pruckner, G. J., and R. Sausgruber (2013): “Honesty on the Streets: A Field Study on Newspaper Purchasing,” Journal of the European Economic Association, 11(3), 661–679. Reagle, J., and L. Rhue (2011): “Gender Bias in Wikipedia and Britannica,” International Journal of Communication, 5(0), 21. Reuter, J., and E. Zitzewitz (2006): “Do Ads Influence Editors? Advertising and Bias in the Financial Media,” The Quarterly Journal of Economics, 121(1), 197–227. Schultz, P. W., J. M. Nolan, R. B. Cialdini, N. J. Goldstein, and V. Griskevicius (2007): “The Constructive, Destructive, and Reconstructive Power of Social Norms,” Psychological Science, 18(5), 429–434. Shriver, S. K., H. S. Nair, and R. Hofstetter (2013): “Social Ties and UserGenerated Content: Evidence from an Online Social Network,” Management Science, 59(6), 1425–1443. Sun, M., and F. Zhu (2013): “Ad Revenue and Content Commercialization: Evidence from Blogs,” Management Science, 59(10), 2314–2331. Tella, R. D., and I. Franceschelli (2011): “Government Advertising and Media Coverage of Corruption Scandals,” American Economic Journal: Applied Economics, 3(4), 119–151. Toubia, O., and A. T. Stephen (2013): “Intrinsic vs. Image-Related Utility in Social Media: Why Do People Contribute Content to Twitter?,” Marketing Science, 32(3), 368–392. Wolbrecht, C., and D. E. Campbell (2007): “Leading by Example: Female Members of Parliament as Political Role Models,” American Journal of Political Science, 51(4), 921–939. Yeomans, M., and D. Herberich (2014): “An experimental test of the effect of negative social norms on energy-efficient investments,” Journal of Economic Behavior & Organization, 108, 187–197. 22 Yildirim, P., E. Gal-Or, and T. Geylani (2013): “User-Generated Content and Bias in News Media,” Management Science, 59(12), 2655–2666. Zhang, X., and F. Zhu (2011): “Group Size and Incentives to Contribute: A Natural Experiment at Chinese Wikipedia,” The American Economic Review, 101(4), 1601–1615. 23 Tables Table 1: Summary statistics of Wikipedia editors, split by gender Male editors Female editors Percentiles 25th 50th 75th 25th 50th 75th Number of biographies edited, per year 1 2 4 1 1 3 Length of text added, per year 22 169 1169 26 188 1247 Length of text added, per biography 13 80 294 16 98 474 Observations 65398 9419 Note: A unit of observation is an editor. Columns 1-3, present the 25th, 50th, and 75th percentile for male editors, and columns 4 - 6, for female editors. Length of text added measures in characters the length of text added to biographies in Wikipedia. Sample of editors includes all the editors who reported their gender and who have edited the English language Wikipedia articles about human beings in the Wikidata final sample. Table 2: Mean values of survey respondents’ characteristics All respondents Only editors Female 0.495 0.315 At least 35 years old 0.354 0.286 Has college degree 0.540 0.596 Works at least 35 hours per week 0.577 0.592 Unemployed 0.100 0.085 Use Wikipedia daily 0.277 0.460 Use Wikipedia at least weekly 0.811 0.906 Has edited Wikipedia 0.219 1.000 Observations 974 213 Note: Each cell presents the mean value of a characteristic that takes values either 1 or 0. In column 1, the sample includes all valid survey responses. In column 2, the sample is restricted to those who have edited Wikipedia in the past. 24 Table 3: Summary statistics of survey respondents in the control group, split by gender Men Women p-value Demographic characteristics At least 35 years old 0.320 0.382 0.154 Has college degree 0.514 0.536 0.611 Works at least 35 hours per week 0.653 0.459 0.000 Unemployed 0.089 0.116 0.322 Wikipedia Use Wikipedia daily 0.359 0.176 0.000 Use Wikipedia at least weekly 0.838 0.742 0.009 Has edited Wikipedia 0.313 0.163 0.000 Likely to edit Wikipedia 0.147 0.094 0.077 Believe: more competent than other editors 0.085 0.043 0.059 Believe: at least as competent as other editors 0.761 0.670 0.025 Other Donated to charity 0.475 0.554 0.081 Volunteering at least one hour per week 0.332 0.365 0.447 Wrote user review in previous six months 0.517 0.545 0.540 Leisure at least 3 hours per weekday 0.741 0.734 0.852 Observations 259 233 Note: The sample is restricted to the control group. Columns 1 and 2, present the means of the survey respondents characteristics separately for men and women. Column 3, presents the p-value of the t-test for whether the difference between men and women is significantly different from zero. Likely to edit Wikipedia is an indicator variable that takes value one if answered “very likely” or “quite likely” to question “How likely or unlikely is it that you will actually edit Wikipedia over the next 30 days?” Believe: more competent than other editors is an indicator variable that takes value 1 if answered “more knowledgeable/competent” to the question “Think of the Wikipedia article of the human being that you chose. On the whole, do you think that you are more or less knowledgeable and competent to edit the article than other people who will edit it in the future?” Believe: at least as competent as other editors is an indicator variable that takes value 1 if answered either “more knowledgeable/competent”, “somewhat more”, or “same” to the same question above. 25 Table 4: Estimated role of survey respondents’ characteristics in Wikipedia editing (1) (2) Female -0.669*** -0.148 (0.245) (0.317) At least 35 years old -0.104 -0.184 (0.251) (0.322) Has college degree 0.429* 0.310 (0.238) (0.310) Unemployed -0.055 0.105 (0.411) (0.597) Works at least 35 hours per week -0.345 0.192 (0.256) (0.338) Use Wikipedia daily 1.025*** 1.156*** (0.254) (0.331) Use Wikipedia at least weekly 0.475 0.063 (0.358) (0.468) Believe: more competent than other editors 0.782* 0.414 (0.415) (0.479) Believe: at least as competent as other editors 0.743** 1.946*** (0.297) (0.614) Donated to charity 0.238 0.387 (0.253) (0.336) Volunteering at least one hour per week -0.146 0.345 (0.256) (0.322) Wrote user review in previous six months 0.552** 0.294 (0.236) (0.306) Leisure at least 3 hours per weekday -0.025 0.094 (0.260) (0.338) Observations 492 492 Log-likelihood -238.921 -156.098 Note: Each column presents estimation results from a separate logit equation. In column 1, the dependent variable is an indicator for whether the individual has edited Wikipedia in the past. In column 2, the dependent variable is whether the individual reports he is likely to edit Wikipedia in the next 30 days, specifically, the variable takes value one if the respondent answered that he is either “very likely” or “quite likely” to the question: “How likely or unlikely is it that you will actually edit Wikipedia over the next 30 days?” Believe: more competent than other editors is an indicator variable that takes value 1 if answered “More knowledgeable/competent” to the question “Think of the Wikipedia article of the human being that you chose. On the whole, do you think that you are more or less knowledgeable and competent to edit the article than other people who will edit it in the future?” Believe: at least as competent as other editors is an indicator variable that takes value 1 if answered either “more knowledgeable/competent”, “somewhat more”, or “same” to the same question above. The sample is restricted to the control group. Standard errors are in parantheses. *** Significant at the 1 percent level. ** Significant at the 5 percent level. * Significant at the 10 percent level. 26 Table 5: Decomposition of gender gap in Wikipedia editing Total gap Explained gap Explained percentage Dependent variable: Has edited 0.1497 0.0642 42.9 Dependent variable: Likely to edit 0.0523 0.0412 78.8 Note: Each row presents a separate decomposition. In the first row, the dependent variable is an indicator for having editing Wikipedia in the past. In the second row, the dependent variable is an indicator for whether the individual believes he is likely to edit Wikipedia in the next 30 days, defined in the same way as in Table 3. There are four explanatory variables: indicator for daily Wikipedia use, indicator for at least weekly Wikipedia use, Believe: more competent than other editors, and Believe: at least as competent as other editors, defined in the same way as in Table 4. In the columns, Total gap is the difference between the average outcome variable of men and women; Explained gap is the difference between the outcome variable of men and women that is explained by the differences in these explanatory variables; Explained percentage is the percentage of the Total gap that is explained by the differences in these explanatory variables. The sample consists of the survey respondents in the control group. Table 6: The average (over editors) percentage of contributions to the biographies of women vs men, by the gender of Wikipedia editor Mean % of biographies of women p-value Male editors Female editors Total length of text added 16.6 31.4 0.000 – Subset of biographies: Professionals 8.0 16.7 0.000 – Subset of biographies: Culture 15.7 31.7 0.000 Number of biographies edited 17.1 31.1 0.000 – Subset of biographies: Professionals 8.3 15.9 0.000 – Subset of biographies: Culture 15.7 31.5 0.000 Note: A unit of observation is a Wikipedia editor. Columns 1 and 2, present the means separetely for male and female Wikipedia editors. Column 3, presents the p-value of the t-test for whether the difference between male and female editors is significantly different from zero. In rows 1 - 3, the average percentage of contributions to the biographies of women is measured in terms of the total length of text added. In rows 4 - 6, it is measured in terms of the number of biographies. Total sample includes 65,398 male and 9,419 female editors. In rows 2 and 5, the sample is restricted to the biographies of lawyers, politicians, scientists, etc (Professionals). In rows 3 and 6, the sample is restricted to the biographies of writers, painters, composers, etc (Culture). The exact definition of these groups of professions is in Table C.1. 27 Table 7: Likelihood of choosing to edit a Wikipedia article about a woman vs a man, by the gender of survey respondent Likelihood of choosing an article about a woman Male respondents Female respondents Total 0.112 0.305 Demographic characteristics Has edited Wikipedia 0.148 0.395 Hasn’t edited Wikipedia 0.096 0.287 College 0.128 0.272 No college 0.095 0.343 Less than 35 years of age 0.084 0.270 At least 35 years of age 0.125 0.326 Wikipedia articles Subset of articles: Professionals 0.076 0.205 Subset of articles: Culture 0.123 0.279 p-value 0.000 0.003 0.000 0.004 0.000 0.001 0.000 0.015 0.016 Note: A unit of observation is a survey respondent. Each survey respondent chose a Wikipedia article either about a man or a woman. Columns 1 and 2 present the mean of the indicator variable that the chosen article was about a woman, separately for male and female survey respondents. Column 3, presents the p-value of the t-test for whether the difference between male and female respondents is significantly different from zero. In the first row, the sample consists of the survey respondents in the control group, there are 259 male and 233 female respondents. In the following rows, the sample is further restricted by the survey respondents’ demographic characteristics that are listed in the leftmost column. In the last two rows, the sample is restricted to the subgroups of biographies: group Professionals includes lawyers, politicians, scientists, etc; and group Culture includes writers, painters, composers, etc; the exact definition of groups is in Table C.1. 28 Table 8: Estimated role of survey respondents’ characteristics on the likelihood of choosing to edit a Wikipedia article about a woman vs a man Article about a woman Female 1.368*** (0.261) At least 35 years old -0.308 (0.253) Has college degree -0.109 (0.239) Unemployed -0.325 (0.415) Works at least 35 hours per week -0.165 (0.252) Use Wikipedia daily 0.138 (0.292) Use Wikipedia at least weekly 0.055 (0.305) Has edited Wikipedia 0.460 (0.282) Observations 492 Log-likelihood -230.888 Note: Estimation results are from a logit equation. Dependent variable is an indicator for whether the respondent chose to edit an article about a woman. The explanatory variables are the characteristics of the survey respondent. The sample is restricted to the control group. Standard errors are in parantheses. *** Significant at the 1 percent level. ** Significant at the 5 percent level. * Significant at the 10 percent level. Table 9: The daily percentage of biographies Median Biographies of men 25.8 Biographies of women 16.2 in Wikipedia Min Max 18.6 28.4 11.9 18.6 that noone read Obs 30 30 Note: A unit of observation is a day. The sample consists of daily data of page views from September 2014 for 784,178 biographies of men and 140,193 biographies of women in Wikipedia. 29 Table 10: The effect of treatment on the likelihood of choosing to edit a Wikipedia article about a woman Total Male respondents Female respondents (1) (2) (3) (4) (5) (6) Treated 0.193*** 0.182*** 0.133*** 0.132*** 0.233*** 0.236*** (0.029) (0.028) (0.034) (0.034) (0.044) (0.044) Covariates No Yes No Yes No Yes Control group mean 0.203 0.203 0.112 0.112 0.305 0.305 Scaled treatment effect 0.950 0.898 1.185 1.182 0.766 0.774 Observations 974 974 492 492 482 482 Note: Each columns presents estimates from a separate regression. Dependent variable is an indicator for whether the respondent chose to edit an article about a woman. Covariates include demographic characteristics from Table 3. The sample includes both the control and treatment group of the survey respondents. The sample is restricted to men in columns 3 - 4 and women in columns 5-6. In columns 2, 4, and 6, regression include the standard set of demographic characteristics used in the paper and described below Table 4. Scaled treatment effect measures the percentage change of the share of women’s pages. Standard errors are in parantheses. *** Significant at the 1 percent level. ** Significant at the 5 percent level. * Significant at the 10 percent level. Table 11: The effect of treatment on the likelihood of editing Wikipedia Treated Covariates Control group mean Scaled treatment effect Observations Total (1) (2) -0.043** -0.045** (0.019) (0.019) No Yes 0.122 0.122 -0.354 -0.369 974 974 Male respondents Female respondents (3) (4) (5) (6) -0.091*** -0.094*** 0.006 0.002 (0.027) (0.027) (0.027) (0.027) No Yes No Yes 0.147 0.147 0.094 0.094 -0.620 -0.638 0.063 0.023 492 492 482 482 Note: Each columns presents estimates from a separate regression. Dependent variable is an indicator for whether the individual believes he is likely to edit Wikipedia in the next 30 days, defined in the same way as in Table 3. Covariates include demographic characteristics from Table 3. The sample includes both the control and treatment group of the survey respondents. The sample is restricted to men in columns 3 - 4 and women in columns 5-6. In columns 2, 4, and 6, regression include the standard set of demographic characteristics used in the paper and described below Table 4. Scaled treatment effect measures the percentage change of the share of respondents who believe it is likely they will edit Wikipedia. Standard errors are in parantheses. *** Significant at the 1 percent level. ** Significant at the 5 percent level. * Significant at the 10 percent level. 30 12 0 0 2 4 6 8 10 Percentage of female editors Number of active editors, thousands 10 20 30 Figures 2002 2003 2004 2005 2006 2007 2008 2009 2010 2011 2012 2013 Year Number of active editors Perc. of female editors Figure 1: Number of Wikipedia editors (left y-axes) and percentage of female editors (right y-axes), in 2002 - 2013 Note: The dataset is restricted to the registered editors of Wikipedia who have reported their gender and edited at least one article in a given calendar year. 31 Percentage of biographies of women 10 20 30 0 2002 2003 2004 2005 2006 2007 2008 2009 2010 2011 2012 2013 Year Male editors Female editors Figure 2: Average (over Wikipedia editors) percentage of contributions to the biographies of women vs men, in 2002 - 2013 Note: The percentage is calculated as the average (over Wikipedia editors) percentage of the total length of text added to the biographies of women vs men. 1 Cumulative Probability .8 .6 .4 .2 0 0 200 400 600 800 Number of page views divided by number of editors per biography c.d.f.: biographies of men 1000 c.d.f.: biographies of women Figure 3: Cumulative distribution functions of the number of page views divided by the number of editors per biography Note: The sample includes page views data from September 2014 for 784,178 biographies of men and 140,193 biographies of women in Wikipedia. The number of page views divided by the number of editors is constructed based on the pages and editors in the sample of historical editing data from Wikipedia. 32 A Appendix: Survey attrition The survey had an overall attrition rate of 19.4%.31 This section tests whether attrition is random or depends on demographic characteristics and treatment status. 98% of the individuals who dropped out, did that on the page of the survey that displayed the task of choosing the Wikipedia page which to edit and finding information what to add to the page. This is probably where the participants realized that the task is more difficult than they expected. Two percent of those who dropped out, did that before seeing the treatment page. None dropped out of on the treatment page. Altogether, this is likely to indicate that treatment itself was not a reason for dropping out. Table C.5 in Appendix C shows that although, attrition is not random, it doesn’t depend on treatment status nor gender. However, as could be expected, people who use or edit Wikipedia, are more likely to finish the survey. Table C.5 presents estimates from linear regressions32 of the form: F inishedSurveyi = Constant + βV ariablei + εi , where the dependent variable F inishedSurveyi is an indicator of whether person i finished the survey. Each row of the table presents the estimate of coefficient β and corresponding p-value from a separate regression where the V ariablei of the regression is listed in the first column. In each regression, the sample includes only those respondents who have remained in the survey to answer the question; in case of treatment status, the sample includes those who have remained in the survey until they were assigned the status. The first row of the table shows that gender has no statistically significant impact on finishing the survey. The last row shows that treatment status has no statistically significant impact either. The table also shows that attrition depends on demographic characteristics and those who use Wikipedia more are more likely to finish the survey. Specifically, people who have at least a college degree are more likely to finish the survey; and those who are older or unemployed are less likely to finish the survey. People who use Wikipedia at least weekly or who have edited it, are more likely to finish the survey. Overall the sample is not fully representative of the general population, although, it is closer to it than students in a class room. The sample is more likely to be younger and spend more time online than the general population. In terms of these characteristics, it is the relevant sample to survey, as these are the people who are more likely to potentially edit Wikipedia. Similarly, in terms of attrition, the participants who are more likely to finish the survey are the ones who use or edit Wikipedia. When interpreting the survey results, we 31 When counting the number of people who dropped out, I exclude 2 responses that don’t have unique Amazon Mechanical Turk IDs. When calculating the attrition rate, I include only the 974 valid completed responses and the uncompleted responses. 32 Estimates from analogous logit regressions are available from the author. The results are very similar. 33 should remember that these don’t represent the general population, but instead the group of people for whom Wikipedia is more important. To test it further that the attrition does not depend on treatment status, Table C.6 in Appendix C presents results from a regression, where the dependent variable is an indicator for finishing the survey. It is regressed on the treatment status, demographic characteristics and treatment status interacted with the demographic characteristics. Treatment status has no significant effect on finishing the survey. There are two characteristics that matter for attrition: those who have edited Wikipedia before and those who are younger are more likely to finish the survey. Table C.7 in Appendix C shows that conditional on finishing the survey, assignment into treatment group was random in terms of most characteristics. The table presents estimates from linear regressions33 of the form: T reatmentGroupi = Constant + βV ariablei + εi , where the dependent variable T reatmentGroupi equals one if person i was assigned into the treatment group and zero if he was assigned into the control group. Each row of the table presents the estimate of coefficient β and corresponding p-value from a separate regression where the V ariablei of the regression is listed in the first column. In each regression, the sample includes only those respondents who finished the survey. The table shows that conditional on finishing the survey, assignment into treatment group was random in terms of the demographic characteristics, attitudes towards Wikipedia, frequency of Wikipedia use, charity, writing user reviews, and free time. From the 15 outcomes, two are significant at the 10 percent level. Those who have edited Wikipedia before, conditional on finishing the survey are less likely to be in the treatment group, with p-value equal 0.077. Note that the question was asked before treatment, hence, the treatment couldn’t affect the answers. Those who volunteer more are also less likely to be in treatment group, with p-value 0.075. The treatment provided information about Wikipedia and was designed to change Wikipedia editing behavior. Two concerns were that the treatment could lead to differential attrition or change the answers to the survey questions. From Table C.5 we saw that there is no evidence that the treatment lead to differential attrition. Table C.7 showed that in terms of most characteristics the randomization into treatment was successful. In any case, when analyzing the survey responses, I restrict attention to the control group, to make sure that the treatment does not affect the answers. 33 Estimates from analogous logit regressions are available from the author. The results are very similar. 34 B B.1 Appendix: Additional empirical analysis Is the editorial input proportional to readership: evidence from the survey The evidence from the Wikipedia editing histories showed that pages of men receive relatively fewer readers than the pages of women. A similar exercise with the survey data confirms the results. Figure D.2 in Appendix D presents the cumulative distribution of the number of page views of the Wikipedia pages of men and women, where the page views are divided by the number of survey respondents editing the page. The measure is constructed only based on the editors and pages from the control group in the survey. As partly confirmed by the Kolmogorov-Smirnov test, presented in Table C.8 in Appendix C, the c.d.f. of the pages of women seems to be larger than that of the pages of men. In Table C.8, the null hypothesis is that the samples are drawn from the same distribution. The first row of the table presents the test statistic and p-value from the one-sided hypothesis test, where alternative hypothesis is that the c.d.f. of the pages of women is larger than the c.d.f. of the pages of men. The one-sided test rejects the null hypothesis at the 10 percent significance level. The second row of the table presents the test statistic and p-value from the two-sided hypothesis test, where the alternative hypothesis is that the samples are drawn from two different distributions. The two-sided test does not reject the null hypothesis. B.2 In terms of total readership, does the treatment improve the allocation of editorial input? In this section, I compare the allocation of editorial input in the treatment and control group. The goal is to learn whether in the treatment group compared to the control group more editorial input is allocated to the pages with a larger or smaller number of readers. Figure D.3 in Appendix D presents the cumulative distribution of the number of page views of the Wikipedia pages in the control and treatment groups, where the page views are divided by the number of survey respondents editing the page in control and treatment groups respectively. As confirmed by the Kolmogorov-Smirnov test in Table C.9 in Appendix C, the distributions look similar. In Table C.9, the null hypothesis is that the the samples are drawn from the same distribution. The first row of the table presents the test statistic and p-value from the one-sided hypothesis test, where alternative hypothesis is that the c.d.f. of the pages in control group is smaller than the c.d.f. of the pages in treatment group. The second row presents the results from the one-sided hypothesis test, where the alternative hypothesis 35 is that the c.d.f. of the pages in treatment group is smaller than the c.d.f. of the pages in control group. The third row presents results from the two-sided hypothesis test, where the alternative hypothesis is that the samples are drawn from two different distributions. All three tests cannot reject the null hypothesis that the samples are drawn from the same distribution at the 10 percent significance level. Hence, we can conclude that although the treatment moved the allocation of editorial input towards the pages of women, this didn’t make the allocation worse nor better in terms of the readership. 36 C Appendix: Additional tables Table C.1: Professions of human beings in Wikidata Profession Number of professions football player 105871 actor 42096 politician 40084 sportsperson 23040 baseball player 20423 writer 15515 cricketer 15448 lawyer 14812 painter 12746 ice hockey player 11751 composer 11692 priest 11242 film director 9794 basketball player 8561 singer 8122 journalist 7619 poet 7273 screenwriter 6807 musician 6325 diplomat 6214 Australian-rules footballer 6122 judge 5767 officer 5509 mathematician 5352 linguist 5229 photographer 4750 tennis player 4498 conductor 4428 boxer 4305 rugby league player 4222 physicist 4197 film producer 4192 economist 3922 author 3485 architect 3425 anthropologist 3082 bicycle racer 3065 Table continues on next page 37 Category Other Other Professionals Other Other Culture Other Professionals Culture Other Culture Professionals Other Other Other Professionals Culture Other Other Professionals Other Professionals Professionals Professionals Professionals Culture Other Culture Other Other Professionals Other Professionals Culture Professionals Professionals Other Profession Number basketball coach golfer explorer singer-songwriter chemist botanist film actor rugby union player astronomer television actor motorcycle racer television presenter sculptor historian theologian model philosopher biologist computer scientist physician pianist field hockey player voice actor entrepreneur alpine skier swimmer librarian soldier civil engineer badminton player Table continued from previous page 38 of professions Category 3048 Other 2919 Other 2856 Professionals 2841 Other 2651 Professionals 2585 Professionals 2432 Other 2374 Other 2271 Professionals 2164 Other 1961 Other 1924 Other 1915 Culture 1904 Professionals 1672 Professionals 1606 Other 1594 Professionals 1580 Professionals 1546 Professionals 1515 Professionals 1457 Culture 1452 Other 1409 Other 1282 Professionals 1281 Other 1255 Other 1211 Professionals 1159 Professionals 1075 Professionals 1064 Other Table C.2: Estimated role of survey respondent’s characteristics for Wikipedia editing, by gender At least 35 years old Has college degree Unemployed Works at least 35 hours per week Use Wikipedia daily Use Wikipedia at least weekly Believe: more competent than other editors Believe: at least as competent as other editors Donated to charity Volunteering at least one hour per week Wrote user review in previous six months Leisure at least 3 hours per weekday Observations Log-likelihood (1) -0.415 (0.326) 0.673** (0.301) -0.319 (0.595) -0.502 (0.335) 0.901*** (0.312) 0.419 (0.487) 0.774 (0.494) 0.405 (0.378) 0.223 (0.324) -0.116 (0.336) 0.472 (0.298) 0.016 (0.332) 259 -144.593 (2) 0.313 (0.403) -0.010 (0.411) 0.160 (0.598) -0.116 (0.409) 1.236*** (0.456) 0.492 (0.553) 0.908 (0.794) 1.249** (0.528) 0.343 (0.450) -0.246 (0.422) 0.814** (0.412) -0.254 (0.451) 233 -90.465 (3) -0.465 (0.445) 0.478 (0.409) -0.442 (1.134) -0.418 (0.452) 1.212*** (0.426) 0.724 (0.818) 0.493 (0.553) 2.533** (1.058) 0.740 (0.459) 0.078 (0.446) 0.428 (0.407) -0.236 (0.424) 259 -87.920 (4) 0.063 (0.498) 0.039 (0.508) 0.557 (0.770) 0.847 (0.535) 1.025* (0.562) -0.217 (0.627) -0.566 (1.144) 1.574** (0.771) 0.128 (0.543) 0.608 (0.500) 0.157 (0.495) 0.716 (0.623) 233 -63.547 Note: Each column presents estimation results from a separate logit equation. In columns 1 and 2, the dependent variable is an indicator for whether the individual has edited Wikipedia in the past. In columns 3 and 4, the dependent variable is whether the individual is likely to edit Wikipedia in the next 30 days, specifically, the variable takes value one if the respondent answered that he is either “very likely” or “quite likely” to the question: “How likely or unlikely is it that you will actually edit Wikipedia over the next 30 days?” The sample in columns 1 and 3 is restricted to men in the control group; in columns 2 and 4, it’s women in the control group. Believe: more competent than other editors is an indicator variable that takes value 1 if answered “More knowledgeable/competent” to the question “Think of the Wikipedia article of the human being that you chose. On the whole, do you think that you are more or less knowledgeable and competent to edit the article than other people who will edit it in the future?” Believe: at least as competent as other editors is an indicator variable that takes value 1 if answered either “More knowledgeable/competent”, “Somewhat more”, or “Same” to the same question above. Standard errors are in parantheses. *** Significant at the 1 percent level. ** Significant at the 5 percent level. * Significant at the 10 percent level. 39 Table C.3: Kolmogorov-Smirnov test of whether the samples of the number of page views divided by the number of editors of the pages of men and women are drawn from the same distribution Test statistic p-value One-sided hypothesis test 0.1414 0.000 Two-sided hypothesis test 0.1414 0.000 Note: The number of page views divided by the number of editors is constructed based on the pages and editors in the sample of historical editing data from Wikipedia. Page views data from September 1, 2014. The null hypothesis is that the samples are drawn from the same distribution. In row 1, the alternatie hypothesis is that the c.d.f. of the pages of women is larger than the c.d.f. of the pages of men. In row 2, the alternative hypothesis is that the samples are drawn from two different distributions. Table C.4: Differences in the effect of treatment on the likelihood of editing Wikipedia: by Wikipedia use, believed competence, and whether writes user reviews Wikipedia use Competence Writing reviews (1) (2) (3) (4) (5) (6) Treated -0.048** -0.049** -0.064** -0.066*** -0.058** -0.059** (0.022) (0.022) (0.025) (0.026) (0.028) (0.028) Covariates No Yes No Yes No Yes Control group mean 0.136 0.136 0.161 0.161 0.146 0.146 Scaled treatment effect -0.356 -0.360 -0.399 -0.410 -0.400 -0.404 Observations 790 790 693 693 513 513 Note: Each columns presents estimates from a separate regression. Dependent variable is an indicator for whether the individual believes he is likely to edit Wikipedia in the next 30 days, defined in the same way as in Table 3. Covariates include demographic characteristics from Table 3. The sample includes both the control and treatment group of the survey respondents. In columns 1-2, the sample is restricted to those who use Wikipedia at least weekly. In columns 3-4 the sample is restricted to those who believe they are at least as competent and knowledgeable as other people who will edit Wikipedia in the future. In columns 5-6 the sample is restricted to those who wrote a user review during the past six months. In columns 2, 4, and 6, regression include the standard set of demographic characteristics used in the paper and described below Table 4. Scaled treatment effect measures the percentage change of the share of respondents who believe it is likely they will edit Wikipedia. Standard errors are in parantheses. *** Significant at the 1 percent level. ** Significant at the 5 percent level. * Significant at the 10 percent level. 40 Table C.5: Ability of covariates to predict whether respondents finish the survey Variable Coef. p-value Female -0.026 0.252 At least 35 years old -0.058 0.013 Has college degree 0.045 0.047 Works at least 35 hours per week 0.036 0.113 Unemployed -0.095 0.008 Use Wikipedia at least weekly 0.057 0.045 Know can edit Wikipedia 0.050 0.146 Has edited Wikipedia 0.116 0.000 Treatment group 0.029 0.200 Note: Each row presents estimates from a separate linear regression of the form F inishedSurveyi = Constant + βV ariablei + εi , where the V ariablei is listed in the first column. A unit of observation is a survey respondent. In each regression, the sample includes only those respondents who have remained in the survey to answer the question; in case of treatment status, the sample includes those who have remained in the survey until they were assigned the status. Number of observations is 1205 for demographic characteristics and 1204 for Wikipedia related questions and treatment status. 41 Table C.6: Ability of covariates to predict whether respondents finish the survey (1) (2) Female -0.015 -0.179 (0.156) (0.215) At least 35 years old -0.323** -0.444** (0.152) (0.208) Has college degree 0.205 0.344* (0.153) (0.208) Works at least 35 hours per week 0.032 -0.088 (0.169) (0.232) Unemployed -0.512** -0.565* (0.232) (0.319) Use Wikipedia daily -0.075 -0.211 (0.185) (0.254) Use Wikipedia at least weekly 0.207 0.067 (0.188) (0.256) Has edited Wikipedia 0.864*** 0.882*** (0.241) (0.315) Treatment group 0.204 -0.439 (0.150) (0.469) Treatment group * Female 0.345 (0.314) Treatment group * At least 35 years old 0.276 (0.308) Treatment group * Has college degree -0.291 (0.308) Treatment group * Works at least 35 hours per week 0.265 (0.341) Treatment group * Unemployed 0.085 (0.467) Treatment group * Use Wikipedia daily 0.289 (0.376) Treatment group * Use Wikipedia at least weekly 0.342 (0.378) Treatment group * Has edited Wikipedia -0.025 (0.492) Constant 1.153*** 1.438*** (0.239) (0.314) Observations 1204 1204 Log-likelihood -569.392 -566.992 Note: Each column presents estimates from a separate logit regression. Dependent variable is an indicator of whether respondent finished the survey. Standard errors are in parentheses. *** Significant at the 1 percent level. ** Significant at the 5 percent level. * Significant at the 10 percent level. 42 Table C.7: Ability of covariates to predict treatment status, conditional on finishing the survey Variable Coef. p-value Female 0.043 0.180 At least 35 years old 0.010 0.761 Has college degree 0.032 0.323 Works at least 35 hours per week 0.033 0.307 Unemployed -0.011 0.830 Use Wikipedia daily 0.012 0.733 Use Wikipedia at least weekly 0.061 0.138 Has edited Wikipedia -0.069 0.077 Believe: more competent than other editors -0.003 0.963 Believe: at least as competent as other editors -0.015 0.678 Donated to charity -0.035 0.275 Volunteering at least one hour per week -0.020 0.560 Wrote user review in previous six months -0.008 0.811 Leisure at least 3 hours in a weekday 0.015 0.691 Note: Each row presents estimates from a separate regression of the form T reatmentGroupi = Constant + βV ariablei + εi , where T reatmentGroupi equals one if person i was assigned into the treatment group and zero if he was assigned into the control group, the V ariablei is listed in the first column. A unit of observation is a survey respondent. In each regression, the sample includes only those respondents who have finished the survey. Number of observations is 974. Table C.8: Kolmogorov-Smirnov test of whether the samples of the number of page views divided by the number of editors of the pages of men and women are drawn from the same distribution Test statistic p-value One-sided hypothesis test 0.1339 0.082 Two-sided hypothesis test 0.1339 0.147 Note: The sample is restricted to the control group of the survey respondents. The null hypothesis is that the samples are drawn from the same distribution. In row 1, the alternatie hypothesis is that the c.d.f. of the pages of women is larger than the c.d.f. of the pages of men. In row 2, the alternative hypothesis is that the samples are drawn from two different distributions. 43 Table C.9: Kolmogorov-Smirnov test of whether the samples of the number of page views divided by the number of editors of the pages in control and treatment groups are drawn from the same distribution Test statistic p-value One-sided hypothesis test: control group smaller 0.0280 0.724 One-sided hypothesis test: treatment group smaller -0.0478 0.393 Two-sided hypothesis test 0.0478 0.710 Note: The sample is includes both treatment and control group of the survey participants. The null hypothesis is that the samples are drawn from the same distribution. In row 1, the alternatie hypothesis is that the c.d.f. of the pageviews of the pages chosen in control group are smaller than the c.d.f. of the pages in treatment group. In row 3, the alternative hypothesis is that the samples are drawn from two different distributions. 44 Appendix: Additional figures Percentage of biographies of women 0 10 20 30 D 2002 2003 2004 2005 2006 2007 2008 2009 2010 2011 2012 2013 Year Male editors; biographies: Professionals Female editors; biographies: Professionals Male editors; biographies: Culture Female editors; biographies: Culture Figure D.1: Average (over Wikipedia editors) percentage of contributions to the biographies of women vs men, by gender of editor and profession of the person in the biography, in 2002 – 2013 Note: The percentage is calculated as the average (over editors) percentage of the total length of text added to the biographies of women in the total length added to all biographies. The sample of Male editors; biographies: Professionals is restricted to male editors and a subgroup of biographies that includes lawyers, politicians, scientists, etc; the sample of biographies: Culture includes writers, painters, composers, etc; the exact definition of the subgroups of biographies is in Table C.1. 45 1 Cumulative Probability .8 .6 .4 .2 0 0 20000 40000 60000 80000 100000 Number of page views divided by number of editors per biography c.d.f.: biographies of men c.d.f.: biographies of women Figure D.2: Cumulative distribution functions of the number of page views divided by the number of editors from the survey editing the article, by gender (of the person in the article) Note: Page views data is from September 2014 for the first week after the survey was conducted. The number of page views divided by the number of editors is constructed based on the editors and articles from the control group in the survey. 1 Cumulative Probability .8 .6 .4 .2 0 0 20000 40000 60000 80000 100000 Number of page views divided by number of editors per biography c.d.f. of control group c.d.f. of treatment group Figure D.3: Cumulative distribution functions of the number of page views divided by the number of editors from the survey editing the article, by control and treatment group Note: Page views data is from September 2014 for the first week after the survey was conducted. The number of page views divided by the number of editors is constructed based on the editors and articles from the survey. 46


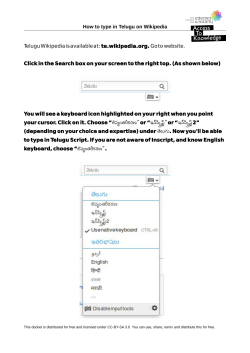


© Copyright 2026