
MA Racial Profiling Report
Massachusetts Racial and Gender
Profiling Study
Final Report
May 4, 2004
Prepared by:
Dr. Amy Farrell
Associate Director, Institute on Race and Justice
Dean Jack McDevitt
Director, Institute on Race and Justice
Lisa Bailey
Assistant Director of Community Outreach, Institute on Race and Justice
Carsten Andresen
Research Associate, Center for Criminal Justice Policy Research
Erica Pierce
Research Associate, Center for Criminal Justice Policy Research
ACKNOWLEDGEMENTS
This report is the result of the dedication of a large number of individuals who have worked hard
to help produce one of the most comprehensive statewide studies of racial disparities in traffic
enforcement to date. We would like to begin by thanking the Secretary of Public Safety, Edward
Flynn, whose leadership and dedication to the issue has been instrumental in producing as fair
and comprehensive of a study possible. We are particularly grateful to the work of Susan
Prosnitz and Jane Wiseman for their representation of the Executive Office during our Working
Group meetings and their efforts to support and provide guidance to this project.
The Massachusetts Racial and Gender Profiling Working Group has worked with us tirelessly to
discuss difficult statistical questions, express their concerns and the concerns of the community,
and where necessary to raise issues so that this report could be as fair and useful to both
community members and police as possible. Jose Barros, Dudley Street Neighborhood
Initiative; Christina Beaumud, Cambridge Police Department; Pastor Jeffrey Brown, Union
Baptist Church; Albert Cardarelli, University of Massachusetts-Boston; Richard Cole, Office of
the Attorney General; Jack Collins, Massachusetts Chiefs of Police Association; Kenneth
Daddabbo, Massachusetts Minority State Police Officers Association; Chief Edward Davis,
Lowell Police Department; Peter Didomenica, Massachusetts State Police; Barbara Dougan,
Lawyers Committee for Civil Rights; King Downing, National Coordinator, ACLU; Jill Soffiyah
Elijah, Harvard Law School; Denise Gonsalves, Cape Verdean Community Task Force; Ann
Marie Harris, Salem State College; Jim Machado, Massachusetts Patrolmen’s Association; Jorge
Martinez, Project R.I.G.H.T.; Chief Kevin Mearn, Milton Police Department; Don
Muhammead, Nation of Islam; Stacey Fortes-White, Suffolk County District Attorney’s Office;
Noel Richardson, La Alianza Hispana; John Roberts, ACLU; Carol Rose, ACLU; Renee Scott
Grey; Debra Shopteese, Roxbury Defenders Service; Rev. Filipe Teixeira, Dioceses of St.
Francis of Assisi, Michael Van, Lowell Juvenile Court; Samuel Williams, Youth Opportunity
Boston; Carl Walters, Boston Police Department; Linda Wick, Office of Senator Rosenberg;
Onyen Yong, Suffolk Country District Attorney’s Office. In addition to the working group,
Northeastern University was assisted by a statewide task force who provided leadership and
feedback on the issue. A full list of the statewide task force is appended to this report.
The Legislators who sponsored this study have been full participants in this process and have
assisted the working group and Northeastern University in many areas including answering the
working group’s questions about legislative intent. Particular thanks goes to the work of Senator
Stanley Rosenberg, Senator Diane Wilkerson and Representative Byron Rushing.
Also we would like to acknowledge the support of many police and governmental officials who
have worked with us over this period. During the course of the study, a number of law
enforcement executives reached out to provide feedback on the data collection process and
answer questions from the research team.
The report would not have been possible without the support of staff at the Institute of Race and
Justice and the College of Criminal Justice at Northeastern University. The authors would
especially like to thank the Dean of the College of Criminal Justice Jack Greene and those
individuals who spent endless hours assisting with data entry, retrieving information,
participating in road surveys and conducting various analyses. We are particularly grateful to the
work of Shea Cronin who oversaw much of the original project and devoted countless hours to
data cleaning and analysis. In addition we would like to thank particular members of the
Northeastern University staff Wendy Alexander, Danielle Dignan, Chris Eggiman, Jared
Garland, Nghi Nguyen, Sasha O’Connell, Glenn Pierce, Jennifer Paniello, Tane Peterson, Jana
Rumminger, Alan Saiz, Marion Sullivan, Matt White, and Mary Yee for all their hard work on
the project.
ii
Table of Contents
Introduction………………………………………. ……………………………………...
1
National Debate About Racial and Gender Profiling ………………………………….. 3
Data Collection as a Management Tool…………………………………………………
5
Limitations of the Massachusetts Study…………………………………………………
7
Summary Measures Design………………………………………………………………
9
Release of Preliminary Report…………………………………………………………...
20
Summary of Findings……………………………………………………………………
23
Issues to Consider………………………………………………………………………..
30
List of Tables
Table 1: Summary Measures……………………………………………………………
10
Table 2: Distribution of Searches with Racial Disparity Across City Types………….
28
Appended Materials and Data Tables
Instructions on Reading Tables………………………………………………………….
35
Summary Table………………………………………………………………………….
36
Residents Cited Compared to Resident Population Data……………….……………...
50
Citations Compared to Driving Population Estimate Data…………………………….
63
Search Data……………………………………………………………………………….
76
Warnings vs. Citation Data……………………………………………………………..
89
Massachusetts Racial and Gender Profiling Task Force Members………………….
102
iii
INTRODUCTION
Questions about whether law enforcement officers stop, cite, and search motorists differently
based on race or gender is one of the most troublesome issues facing contemporary law
enforcement today. Truly effective policing can only be achieved when police both protect the
members of their communities from crime and simultaneously respect civil liberties.
Confronting the controversial issue of racial profiling is a necessary step toward building and
enhancing effective police-community partnerships.
In response to national and local concerns about issues of racial and gender profiling the
Massachusetts legislature passed Chapter 228 of the Acts of 2000 providing for data collection
on traffic citations issued in the Commonwealth. The Act was intended to provide data
necessary for a statewide assessment of racial and gender profiling with the overall aim of
identifying and eventually eliminating any instances of profiling. One component of this Act
required the Registry of Motor Vehicles (RMV) to record data on the race, gender, and search
status of individuals receiving a written warning or citation.1 The data collected by RMV
between April 1, 2001 and June 30, 2003 provides the basis for the statewide analysis presented
in this report.
Using data on traffic citations and written warnings collected by the RMV, this study examines
the existence of racial and gender disparities in approximately 1.6 million traffic citations issued
between April 1, 2001 and June 30, 2003.2 It is important to note at the outset that research on
racial profiling in traffic stops is a relatively new area of inquiry. Although numerous studies
have begun to address questions of differential treatment in traffic stops, no absolute consensus
exists about the best way to determine disparities.3 Racial disparities in citations can result from
1
Due to resource limitations the RMV computerized data on written warnings only between April 1, 2001 and May
31, 2001.
2
The original intent of the legislation was to conduct an analysis for one year. Northeastern University received
data from the Registry of Motor Vehicles which covered a much larger time period. In consultation with the
Executive Office of Public Safety and the Racial and Gender Profiling Working Group, Northeastern University
conducted an analysis on all citations for the full time period that data was available in order to provide communities
with the most information that was possible to assess any potential disparities in traffic citations. A breakdown of
the racial demographic of citations by year is included in the technical report.
3
For an overview of the most common racial profiling analysis methods and benchmarks see: Lorie Fridell (2003)
By the Numbers: A Guide for Analyzing Race Data From Vehicle Stops, Police Executive Research Forum.
a number of factors that social scientists are just beginning to understand. Bias on the part of an
individual officer is one of several possible explanations for disparities in citations. Racial
disparities can also be caused by departmental deployment decisions, targeted enforcement
actions or by differential rates of traffic violations. Although there are limits to the types of
questions that traffic citation data can answer, this study addresses four important questions that
commonly arise in public concern over racial profiling:
1. Are non-white drivers who are residents in a community cited more often than their
representation in the residential population would predict?
2. Are non-white drivers overall cited more often their representation in the population of
people driving on the roadways would predict?
3. Once stopped are non-white drivers more likely to receive a citation than white drivers?
4. Once stopped are non-white drivers more likely to be subject to a search than white
drivers?
While these questions do not represent the full set of inquiries that community members or law
enforcement officials may have about the existence of racial profiling, they address the issues
that we are most confident can be answered with the data that is available in this study. No
statistical analysis can adequately address all the concerns about racial profiling that may exist in
a local community. However, the analysis conducted in this report can serve as a very useful
starting point for addressing concerns about racial profiling that may exist in communities
throughout the state.
From the outset it is important to note that aggregate data, such as the data presented in this
report, can indicate patterns of disparate traffic citation activity in a department but cannot
identify the motives involved in individual traffic stops, citations or other enforcement decisions.
Racial profiling involves an individual decision by a particular police officer – something that
this report cannot measure. Social science cannot provide reliable explanations for what
individual officers are thinking when they decide to stop or cite a particular motorist. Bias on the
part of individual officers may be just one of many reasons that racial or gender disparities exist
in traffic stops, citations or searches. For example, certain department enforcement strategies or
2
allocation of patrol resources – while perhaps race neutral on their face – may result in the
disparate treatment of particular racial groups. In some communities, police commanders may
assign a larger number of officers to a particular neighborhood because that neighborhood has
more crime and thus an increased need for police services. It may then be the case that police
assigned to this high crime area engage in traffic enforcement as part of their normal patrol
activities and since there are more police working in this neighborhood, individuals who live,
work or drive through this neighborhood are more likely to be stopped and cited than individuals
who live in other neighborhoods. If the neighborhoods where police assign additional patrols are
neighborhoods where people of color are more likely to live, then the deployment decision may
result in racial disparities in traffic citations. While this report cannot determine whether
disparities are caused by institutional practices or individual bias by officers, the report does
identify whether certain groups are treated differently in traffic stop encounters based on a
number of different measures.
Regardless of why they occur, racial disparities in traffic stops, citations and searches can impose
serious costs on minority citizens as well as create societal costs on race relations which may
influence how community members perceive the police in their community. As indicated in a
previous news story and analysis by The Boston Globe, disproportionate traffic citations may
result in increased insurance premiums for those targeted by the police.4 In addition to the
individual financial costs, these kinds of disparities may erode the trust between the police and
members of their local community. If members of certain communities perceive that they are
targeted by the police, they may be reluctant to report crimes, and equally important, to work
with police to solve the crimes that have been reported. This situation can have serious
implications for the overall public safety of a community.
NATIONAL DEBATE ABOUT RACIAL AND GENDER PROFILING
Recently, there has been an increased public debate about the discretionary decisions officers
make during traffic enforcement, including the decisions to stop, search and cite motorists. While
a number of factors may influence an officer’s decision to stop and search an individual, it has
4
Bill Dedman and Francie Latour (2003) “Speed Trap: Who Gets A Ticket, Who Gets A Break” Boston Globe,
July 20, A1.
3
been suggested that some police officers inappropriately use race when making decisions about
whom to stop, search or cite.5 Allegations of racial bias in traffic stops have become so common
that the practice has been popularly labeled “driving while black” or “driving while brown.”
Racial profiling is generally understood as the practice of targeting or stopping a pedestrian or
motor vehicle based primarily on the person’s race, rather than any individualized suspicion.6
The popular understanding of the term racial profiling is derived from the “profile” of drug
couriers developed by the Drug Enforcement Agency during the mid-1980s to interdict interstate
drug trafficking. Although originally targeting particular types of stops, the term racial profiling
has come to represent the full range of potential disparate treatment that can occur during a
traffic stop.
In the context of vehicle stops, racially biased police actions often involve the use of a legitimate
traffic violation in combination with race as the justification for a traffic stop. Although
employing a traffic violation as a justification for pre-textual traffic stops is supportable under
the Fourth Amendment doctrine of reasonable suspicion or probable cause,7 such action if
practiced in a racially biased manner would constitute a violation of the Fourteenth
Amendment’s guarantee of equal protection under the law.
National surveys have confirmed that a majority of Americans, regardless of race, believe that
racial bias in police stops is a significant social problem. In a widely cited poll taken by the
Gallop Organization in 1999, 59% of all Americans reported that they believed the practice
known as racial profiling was widespread. The poll reported differences by race in this
perception, with 56% of the white respondents believing that racial profiling was widespread and
77% of the African-American respondents responding that the practice was widespread.
Although some suggested that the public’s acceptance of racial profiling would increase after the
5
Although there are numerous public claims of racial profiling for a general review of the issues see: Gary Webb
(1999). “DWB.” Esquire, April, pp. 118-127; David Harris (2000). “Driving While Black” American Civil
Liberties Union, and Ronald Weitzer (1999). “Citizens’ Perceptions of Police Misconduct: Race and Neighborhood
Contexts” Justice Quarterly, 16: 819-846.
6
The statute in Massachusetts defines racial profiling as “the practice of detaining a suspect based on a broad set of
criteria which casts suspicion on an entire class of people without any individualized suspicion of the particular
person being stopped.” An Act Providing for the Collection of Data Relative to Traffic Stops (Section 1, Chapter
228 of the Acts of 2000).
7
US v. Whren, 517 U.S. 806 (1996)
4
attacks of September 11, 2001, recent polling data indicates that public concern about racial
profiling remains strong overall and for some groups concern has actually increased. In a Gallup
Poll taken in February 2003 responses were identical to the 1999 data with 59% of Americans
believing the practice was widespread. For African-American respondents, however, the
perception that racial profiling is widespread actually increased from 77% in 1999 to 85% in
2003.8
Similar questions about gender disparities in traffic stops have recently been given new attention.
Following a number of highly publicized incidents of officers sexually abusing women following
routine traffic stops, some have begun to question whether certain officers use their traffic
enforcement powers disproportionately against female drivers.9 In fact, preliminary analysis
from other jurisdictions indicates that young males may be disproportionately likely to be
stopped, cited, and searched. At the present time there is little empirical evidence about how
gender influences the discretionary decisions of police. Moreover, scholarship on profiling is
only beginning to address the interactive effects of gender and race in an officer’s decision to
stop, cite, or search motorists.
DATA COLLECTION AS A MANAGEMENT TOOL
The controversy around racial and gender profiling in traffic stops has prompted local and state
officials across the country to request information about the characteristics and demographics of
those who are stopped and cited. Although traffic stops are the most frequent form of contact
that law enforcement has with the citizenry, they are one area of policing where we have kept
very little systematic information. A recent study by the Bureau of Justice Statistics indicates
that traffic stops are the most common cause of police citizen interaction, reported three times
more often than any other type of contact.10 Because they are such a common source of
interaction, traffic stops have the potential to dramatically shape how individuals perceive the
8
Jack Ludwig (2003) “Americans See Racial Profiling As Widespread” Gallup Poll Tuesday Briefing, May 13,
www.gallup.com.
9
Michael Luo (2001) "Officers May Face Federal Charges," Newsday, March 9.
10
Patrick Langan, Lawrence Greenfeld, Steven Smith, Matthew Dunrose and David Levin (2001). Contacts
Between Police and the Public: Findings from the 1999 National Survey. Washington, D.C.: Bureau of Justice
Statistics.
5
police and thus have been the national focus of much of the debate around racial profiling.
Massachusetts is one of nine states who have collected or who are in the process of collecting
state-wide data on racial disparities in traffic stop practices.11
Today the collection and analysis of data on traffic enforcement is seen by many law
enforcement agencies as simply a good management practice. Historically, most law
enforcement agencies have not systematically collected or analyzed information about their
traffic enforcement practices. Despite the limited information on traffic stops, police agencies
have taken a leadership role among many public sector organizations when it comes to using
data to organize and manage day-to-day operations of their organizations in many other areas.
For example, police routinely analyze information on calls for service, incidents reported to the
police and on arrests to determine where problems exist. In recent years police managers have
used this information to identify the characteristics of problems as a tool for developing unique
and focused strategies to address the problems. While this has been the practice in many police
agencies when dealing with crime, few have conducted similar analyses of traffic enforcement
information.
Most police agencies cannot identify where traffic stops are occurring, for what violations their
officers are making traffic stops and most importantly who is being stopped in their jurisdiction.
In light of the Justice Department finding cited above that traffic stops are the most common
interaction between police and their community members many local police agencies have
identified data on traffic stops as essential information which can allow them to manage their
practices more efficiently. In fact the Commission on Accreditation for Law Enforcement
(CALEA) has mandated collecting and analyzing information on traffic enforcement as a
standard for all its member agencies. CALEA believes that analyzing information on all traffic
stops is critical to professionalizing of law enforcement operations nationally.
11
Other states requiring all jurisdiction to collect data include Connecticut, Missouri, Texas, Nebraska, Rhode
Island, Utah, Illinois and Maryland.
6
LIMITATIONS OF THE MASSACHUSETTS STUDY
There are a number of limitations concerning the data collected in Massachusetts that affect the
types of questions that this study can address and depth of the potential analysis. One of the
most serious limitations in Massachusetts is that as prescribed in the enabling legislation
information on the race and gender of drivers was only collected for traffic stops that resulted in
a citation being issued. In all other statewide studies data is being collected on every traffic stop
regardless of the outcome. Having only citation data limits our analysis in a number of ways.
We do not have information across the whole study period on those individuals stopped who
received a verbal warning and were told to go on their way. In other statewide studies of traffic
stops, approximately one-half of the drivers stopped received a citation.12 While there is much
local variation in the likelihood of receiving a citation once stopped, it remains true that many
drivers are stopped and do not receive any formal citation.
The absence of data on all traffic stops also limits our ability to fully identify racial disparities in
searches. Some drivers are subject to searches as part of the traffic stop but it is possible that no
traffic citation is issued. As a result we do not have any information on some number of traffic
stops where searches occurred but no citation was written. If these kinds of traffic stops were
more likely to happen to one racial or gender group more than another we would have no
information on that disparity.
An additional limitation of the Massachusetts study is that due to an expressed prohibition in the
legislation, no information was collected on the identity of the officers who issued the citations.
It should be noted that the term profiling refers to the individual motivation of an officer to make
a stop, issue a citation or search a vehicle. In Massachusetts our analysis cannot determine
officer motives, and can only note aggregate trends in citations by jurisdictions. It may be the
case that aggregate patterns of disparities for any given law enforcement agency are the
12
For example in Rhode Island only 54% of all stops resulted in the issuance of a citation, for more information see:
Amy Farrell, Jack McDevitt, Shea Cronin, Erica Pierce (2003) Rhode Island Traffic Stop Statistics Final Report.
Submitted to Rhode Island Attorney General. In Connecticut 46% of all stops resulted in a formal citation, for more
information see: Stephen Cox, Susan Pease, Daniel Miller and C. Benjamin Tyson (2001) Report on Traffic Stop
Statistics For the State of Connecticut, July 1, 2000 to June 30, 2001. Submitted to the Office of the Chief State’s
Attorney.
7
cumulative result of the underlying motives of individual officers. It also may be the case that
aggregate patterns of disparity are the result of institutional decisions about deployment or
enforcement prerogatives of the department. Therefore, this study cannot determine if an
individual officer is engaged in racial profiling, but rather determines whether there are patterns
in the traffic citation and search activities in a department that result in racially disparate
treatment and suggests areas where it would be necessary to gather more information to
understand the underlying motivation of officers. This analysis also cannot identify those
jurisdictions where a single officer is engaged in racial profiling but his or her behavior is not
individually identified and may be masked by the enforcement activity of the majority of other
officers in the department. Rooting out such individual level disparities is best addressed at the
local agency level where the actions of an individual officer can be identified and addressed.
Although this study cannot evaluate the existence of bias on the part of any individual officers, it
is important to note that the study relied on law enforcement officers to self-report the race and
gender of drivers on the Massachusetts Uniform Citation.13 While we believe that the majority
of officers completely and accurately recorded information about traffic citation activity to the
best of their ability, it is important to note that the level of inaccurate information reported on
citations is unknown. Following the release of the preliminary report some police agencies
contacted Northeastern University and suggested that officers in their departments incorrectly
specified whether or not a non-inventory search was conducted. It is impossible for us to
determine the accuracy of the non-inventory search measure considering that some officers may
have over-reported searches while others may have under-reported such activity.
Another significant limitation of the study stems from the lack of specific neighborhood or
street-level information about the location of citations and written warnings. Citation and
warning data received from the RMV only indicates the city or jurisdiction in which the citation
or written warning was issued, with the exception of Boston where district level information is
specified in the RMV data. The lack of specific neighborhood information limits our ability to
determine if certain neighborhoods in a city have greater levels of disparity than others.
13
Through the Executive Office of Public Safety, a protocol was developed advising police departments and officers
how to complete the revised Uniform Citation. The protocol instructs that the race of the driver is to be recorded
based on upon the officer’s perception at the time he or she decides to engage in a motor vehicle stop.
8
Additionally, we are unable to assess whether city-wide disparities may be explained by targeted
traffic enforcement activities in particular neighborhoods or sections of a community.
One of the most unique aspects of the Massachusetts Racial and Gender Profiling legislation is
that the mandate for data collection is broken down into two phases. In an attempt to minimize
the burden to law enforcement agencies the Massachusetts Legislature decided to conduct an
initial study of racial and gender disparities in traffic citations and then in a second phase,
communities that had the appearance of engaging in a pattern of racial or gender profiling would
be required to collect data on all traffic stops. This two-phase process has had a number of
important implications. First the burden on all police departments in Massachusetts has indeed
been minimal when compared to most other states collecting data on traffic enforcement. The
uniform citation was modified to include a box to indicate whether or not a non-inventory search
was conducted and a box to indicate the driver’s gender. In addition, officers were advised as to
the six race codes to be used in completing a box to indicate the driver’s race.14 This information
in addition to the information routinely collected on the uniform citation constitutes the data used
for the analysis in the present study. In phase-two, departments, either voluntarily or as required
by the statute, will collect significantly more information from which researchers, policymakers,
department leaders and community members will be able to understand, monitor and reduce any
disparities that cannot be explained by legitimate law enforcement factors.
SUMMARY MEASURES DESIGN
This study reviews data from over 366 law enforcement agencies in the Commonwealth of
Massachusetts. Any study that attempts to review such a large number of jurisdictions and draw
fair conclusions about the existence of a disparity must by definition treat each jurisdiction
similarly. In this study we have analyzed the data for each jurisdiction using the same set of
procedures and analytic rules. Unfortunately, the process of drawing conclusions about
disparities across an entire state does not allow for the in-depth analysis that can and should
occur in a particular community. This report is intended to highlight the main areas of concern,
offer interpretations of different types of disparities and hopefully serve as a springboard for
14
Officers were instructed to identify drivers as White, Black, Hispanic, Asian, Native American or Middle Eastern.
9
more detailed analysis that can best be done at the community level between local police and
members of their community.
Through the process of conducting preliminary analysis, receiving extensive comment from the
working group and task force members, and reviewing comments received from community
members and law enforcement across the state we identified four main areas of concern which
could be measured by the data available in the Massachusetts study: 1) disparities in traffic
citations given to residents, 2) disparities in traffic citations given to all drivers including those
who drive through but do not reside in a particular community, 3) disparities in receiving a
citation versus a written warning, and 4) disparities in the likelihood of being searched once
cited. For each of these measures we established a comparative population (where necessary)
and a threshold above which policymakers could conclude that racial disparities were most
problematic. Each of the four summary measures will be described in more detail and we have
provided a table that briefly outlines each summary measure (Table 1).
Table 1. Summary Measures
Measure
Data Source
Comparative
Population
Threshold for
Substantial Disparity
1. Citations of
Residents
Only citations of residents
2000 Residential
Census
Above Positive Statewide
Median
2. Citations of
All Drivers
All citations
Driving Population
Estimate
Above Positive Statewide
Median
3. Searches
All citations
None
4. Warnings vs.
Citations
Matched sample of written
warnings and citations
None
Test of Statistical
Significance
Test of Statistical
Significance
Measure One: Citations of Residents to Residential Population
To determine if racial disparities exist in traffic stops or citations it is critical to first develop an
estimate of the demographics of populations who are driving on roads that are patrolled by the
law enforcement agency in question. By themselves, the demographics of traffic stops or
citations are difficult to interpret. For example, if after collecting data, a particular city discovers
that 45% of its traffic citations are of Black drivers, that number by itself does not reveal very
much. Instead, we would want to know the proportion of traffic stops compared to an
10
appropriate benchmark or base rate of those driving in that community. In Massachusetts the
present study utilized two measures to determine the degree of disparity that exists in traffic
citations across the state. First we compare the racial demographics of town residents who are
cited against the residential population of that community. Second we compare the racial
demographics of all traffic citations made by an agency (both citations of residents and citations
of non-residents) to an estimate of the demographics of the driving population. This second
measure is described in more detail in the section below.
The first measure, a comparison of citations of residents to the residential population assumes
that the demographic of residential traffic citations should be similar to the demographics of the
people who live in that community. We used the 2000 U.S. Census Bureau statistics of 18
individuals who are 18 years old and older to determine the racial and gender demographics of
individuals who live in each community in Massachusetts. Some agencies such as colleges,
universities and transportation police have no census population against which to compare the
demographics of their citations. The comparative population numbers for these agencies are
designated as not available (NA).
Measure Two: All Citations Compared to the Driving Population Estimate (DPE)
The second measure of disparity compares the race of all citations against an estimate of the
racial breakdown of the driving population for each community in Massachusetts.15 The driving
population is calculated using a sophisticated model to predict how strongly the residential
population and the population of surrounding communities influence the driving population for
each community.
Research in the field of transportation planning provides rich information about the influence of
city characteristics on driving behavior. Transportation planners have created models to better
estimate traffic flow in and out of communities in order to forecast the effect of traffic on road
construction, maintenance and safety. Although transportation studies have not traditionally
focused on the racial demographics of traffic patterns, we have used this literature as a starting
15
No driving population estimate calculations were conducted for the sex of the driving population demographics
because the distribution of male and female residents is nearly identical in most Massachusetts communities.
11
point for understanding how populations of surrounding communities may influence the driving
population in Massachusetts cities and towns.
The driving population estimate (DPE) begins with the assumption that cities and towns close to
a particular city contribute more people to the driving population of the target city.16 Other
factors besides distance, however, influence travel. Research on transportation has long shown
that people will drive further if attractive features such as shopping, employment or
entertainment exist in the target city.17 For example, the DPE model assumes that if distances
were equal a driver is more likely to go to a city with some economic draw (e.g.: shopping,
employment, entertainment) than a city without such draws. Fundamentally, the DPE seeks to
measure the factors that both push drivers out of surrounding communities and draw drivers into
target cities from surrounding communities.
The first step in creating the DPE is estimating the degree to which surrounding cities contribute
to the driving population of the target city. To create the pool of contributing cities for each
target city in Massachusetts we began with the assumption that the driving population of a
jurisdiction is primarily influenced by communities that fall within a 30 minute drive time
perimeter.18 Once we calculated the total population and demographic breakdown of each
potential contributing city we determined how many people were eligible to be “pushed” from
the cities. The factors that we used to measure “push” were 1) the percentage of people within
the community who own cars, making them eligible to drive out of the city; 2) the percentage of
people who drive more than 10 miles to commute to work based on the 2000 Journey To Work
data provided by the 2000 United States Census Data; and 3) the travel time (in minutes)
between the contributing city and the target city. These three factors were used in the following
16
J.D. Carroll (1955). “Spatial Interactions and the Urban-Metropolitan Description” Traffic Quarterly, April, 149161; Lothlorien Redmond and Patricia Mokhtarian (2001). “The Positive Utility of the Commute: Modeling Ideal
Commute Time and Relative Desired Commute Amounts” Transportation, 28: 179-205.
17
Raith, Michael (1996). “Spatial Retail Markets with Commuting Consumers” International Journal of Industrial
Organizations, 14: 447-463.
18
James Anderson (1979). "A Theoretical Foundation for the Gravity Equation," American Economic Review,
69:106-116; K. Mikkonen-and M. Luoma (1999). The Parameters of the Gravity Model are Changing - How and
Why?” Journal-of-Transport-Geography, 7(4): 277-283; Tim Schwanen and Martin Dijst (2002). “Travel-Time
Ratios for Visits to the Workplace: The Relationship Between Commuting and Work Duration” Transportation
Research 36: 573-592.
12
formula to determine how many people were “pushed” out of each contributing community
toward our target city.
The second step in calculating the DPE was determining the level at which each city in
Massachusetts draws in drivers from surrounding communities. People travel to or pass through
cities to shop, to go out to dinner or see entertainment, to go to work, or to take care of other
business. While there are certainly reasons to travel to or through every city in Massachusetts,
certain cities exhibit relatively high degrees of draw compared to others. There can be
innumerable factors that influence travel, but there are certain major economic and social
indicators that can be measured using the same standard for every city. To determine the degree
to which each city in Massachusetts “draws” in drivers from surrounding communities we
created a measure of the relative economic and social attraction of each city. Five indicators
were used to construct measures of “draw” in each target city: 1) percent of State employment,
2) percent of State retail trade, 3) percent of State food and accommodation sales, 4) percent of
State recreation and amusement sales, and 5) percent of State average daily road volume. The
average of these five measures was taken for each city to create a final ranking of the relative
“draw” power for each city. A more in-depth explanation of the draw ranking for individual
cities is found in the technical report.
The driving population estimate is meant to provide the best possible estimation of the racial
demographics of drivers in Massachusetts communities. It was designed using principles from
transportation planning and economic literature. This model was previously used in a statewide
study of racial disparities in traffic stops in Rhode Island and has recently been used by the
Prairie Village Kansas Police Department as a benchmark against which traffic stop data was
compared. 19 During the Rhode Island study, the model was field tested on different communities
to determine how closely the racial demographics of the DPE matched the racial demographics
of the roadways made through physical observation protocols. In two separate tests of the DPE
19
In the 2003 Bias-Based Policing Report the Prairie Village Police Department compared the demographics of
traffic from both the Driving Population Estimate model designed by Northeastern University and an observational
traffic survey previous conducted for the city by the firm Bucher, Willis and Ratliff in 2000. The non-white driving
population from the observational traffic survey was 15.8% non-white and the non-white population from the
Driving Population Estimate model was 14.1% non-white. The department concluded that the Driving Population
Estimate was a useful and reliable model for predicting the demographics of drivers in their community.
13
in different Rhode Island communities the model successfully predicted the racial breakdown of
drivers for all racial groups within less than one percent when compared to physical observations
of the roadways. 20 Although the DPE is still a relatively new form of benchmarking traffic stop
data, the Police Executive Research Forum recently argued that the DPE is one of the most
promising models for constructing estimates of traffic demographics for statewide studies of
racial profiling.21 It is important to note that one of the limitations of the driving population
estimate is that it may be less accurate at measuring driving populations for jurisdictions where a
larger proportion of drivers travel over 30 minutes to work, shop or recreate in that community.
This limitation would be particularly important when examining the data for jurisdictions that
experience heavy driving volume of tourists for example that is demographically different from
their resident drivers.
Traffic citations for the Massachusetts State Police are compared to the demographics of drivers
observed on the roadways of each State Police Troop through a rolling observation survey
protocol. The rolling road survey methodology used in Massachusetts was adapted from other
methods used by researchers in Rhode Island, New Jersey, Maryland and North Carolina.22 The
goal of the Massachusetts rolling road survey was to observe representative traffic demographics
in each State Police Troop area (excluding Troop F, Logan Airport, since traffic was deemed too
difficult to observe at that location). To determine such demographics we placed observers out
on the roadways in cars to visually assess the racial make-up of drivers on particular roadways.
A summary of the demographics of drivers for each State Police Troop Area was constructed as
the benchmark against which to compare traffic citations from those Troops. Additional
information about the roadway observation survey for the State Police can be found in the
technical report.
20
Farrell, et al., supra note 12.
Fridell, supra note 3, pg. 109.
22
For information on other uses of road survey methodology see: Matthew Zingraff, William Smith, and Donald
Tomaskovic-Devey (2001). “North Carolina Highway Traffic and Patrol Study: “Driving While Black.” The
Criminologist, 25: 1-3; John Lamberth (2003). Racial Profiling Study and Services: A Multijurisdictional
Assessment of Traffic Enforcement and Data Collection in Kansas. Washington D.C.: Police Foundation.
21
14
Creating a Threshold for Comparative Population Disparities
For the comparison of traffic citations of residents to census population and the comparison of
traffic citations to the driving population estimate it is difficult to determine the appropriate
threshold at which disparities become meaningful. Various standards have been used in other
studies to draw conclusions about racial profiling based on comparisons between the
demographics of those stopped and the demographics of those in the comparative population, but
as a recent report by the Office of Community Oriented Policing (COPS) states “current research
has failed to establish a consistent set of criteria to determine the nature and extent of racial
profiling.”23 As with other studies, we faced a problem of establishing a “bright line” above
which the conclusion is that all departments are engaged in disparate citation practices that
constitute racial profiling and below which all departments are not engaged in disparate citation
practices.
In studies of disparity, regardless of topic area, it is generally inappropriate to conclude that any
difference between the studied population and the comparative population automatically
constitutes a meaningful disparity or racial bias. Such differences may be the result of real
differences or may be a product of sampling or measurement error. Different studies rely on
various thresholds above which they determine that observed differences are not solely
attributable to error or chance. These thresholds differ dramatically depending on the type of
sample used and the analytic methodology employed.
Studies of racial profiling nationwide have not been able to establish a uniform threshold for
differences between the demographics of drivers stopped and the demographics of the
comparison population. Although some studies have used differences in percent of 3% or 5%24
and others have relied on ratios of varying amounts25 to determine disparity, these levels were
often arrived at haphazardly and as a result the conclusions have largely been overlooked.26
Understanding the limitations of establishing definitive measure of racial profiling, we instead
seek to simply identify disparities between the racial demographics of citations and racial
23
Joyce McMahon, Joel Garner, Ron Davis and Amanda Kraus. How to Correctly Collect and Analyze Racial
Profiling Data: Your Reputation Depends on It! Office of Community Oriented Policing, 2003. pg. 39
24
Howard Greenwald, 2003. Sacramento Vehicle Stop Data Collection Report: 2001-2002.
25
2000 Annual Report on Missouri Traffic Stops, Office of the Attorney General.
26
McMahon et al., supra note 17.
15
demographics of the census and/or driving population estimates for each jurisdiction and identify
those agencies that have the greatest levels of disparity when compared to other Massachusetts
law enforcement agencies. As a result, the statewide positive median (mid-point) for each
measure of disparity was chosen as a threshold for comparisons of citations to residents or to the
driving population estimate.27
As with most studies of racial profiling, it is not possible to explain fully whether or not such
disparities are justified or legitimate with the information that was made available through the
Massachusetts citation data. It is important to remember that the existence of disparities may be
attributable to officer bias, institutional bias, or differential law enforcement action in particular
neighborhoods in response to crime control problems. How much disparity is acceptable to a
community is fundamentally a question that should be addressed by stakeholders and policy
makers in each jurisdiction. Our goal in this report is to identify jurisdictions with disparities
above the statewide median and where we are most confident observed differences between
groups are not due to error or chance.
Measure Three: Searches
The third summary measure examines the differences in the likelihood of being searched by race
and gender. Nationwide, racial disparities in the likelihood of being searched once a vehicle is
stopped have become one of the most persistent concerns in assessments of racial profiling.
Racially disparate search rates have raised a great deal of concern both locally and nationally. In
the mind of many motorists, searches transform a traffic stop from a potentially benign civil
enforcement action to a more serious suspicion of criminal activity. Motorists of color report
that once a search is instigated the traffic stop itself is viewed as only a pre-text to justify
searching and harassing motorists.28 Searches heighten the perception that law enforcement
perceives particular motorists as potential criminals.
27
The statewide median for disparity of non-white residents cited to non-white residents in the population was a
difference in percent of 2.1 and the statewide median for disparities of non-white citations to the driving population
was a difference in percent of 3.2.
28
For numerous examples of such perceptions see David Harris, (2002). Profiles in Injustice: Why Racial Profiling
Can’t Work, New York: New Press.
16
An officer’s decision to conduct a search during a traffic stop is limited by a number of legal
protections. Most importantly, police searches of vehicles are protected by the Fourth
Amendment doctrine that we are secure in our “persons, houses, papers and effects, against
unreasonable searches and seizures.”29 Throughout the years the courts have clarified exactly
how this phrase applies to the searches of motor vehicles. In a landmark decision in 1925, the
Supreme Court reasoned that drivers of vehicles have a lower expectation of privacy than
residents in a home and therefore police are not required to obtain a warrant prior to searching a
vehicle.30 While the court has clearly specified that in most instances the police are required to
obtain a warrant prior to the search of a home, motor vehicle searches are subject to the
“automobile exception” to the warrant requirement. Because automobiles are mobile, allowing
for easier escape of valuable evidence or suspects, and because drivers expect regulations to
govern their driving privileges, such as a driver’s license, speed limits, and equipment
regulations, vehicle searches are subject to a lower threshold of protection.31
In Massachusetts officers are required to identify on the uniform citation whether or not a noninventory search of the motorists or motor vehicle occurred. Analysis was conducted on all
citations to determine what proportion of white citations and what proportion of non-white
citations resulted in a non-inventory search. Racial differences that are considered statistically
significant are marked with asterisks (*). Statistical significance measures the probability that
the observed differences are solely due to chance. Unlike the threshold problem we identified
for measures one and two (described above as residents cited compared to resident population
and all citations compared to the driving population estimate) a test of statistical significance is
an appropriate and commonly accepted threshold for identifying substantial disparity in search
analysis. For some jurisdictions the total number of citations or searches of particular groups is
too small to conduct meaningful analysis. In these cases we report the proportion of drivers who
are searched but do not conduct an analysis of disparity. Instead, the term IC is placed in the
disparity column to indicate an insufficient number of cases for analysis. In this analysis any
29
Fourth Amendment, United States Constitution
Carroll v. U.S., 267 U.S. 132 (1925).
31
Five basic legal thresholds govern the search of automobiles or persons following a lawful traffic stop. Searches
may be conducted on the basis of individual consent, probable cause, reasonable suspicion, as an inventory for
impounded vehicles, or incident to arrest. Only inventory searches which followed the impounding of a vehicle
were excluded from the search category on the uniform citation.
30
17
agency that conducted less than 50 total searches over the 27 month period of the study or less
than 50 citation of non-white motorists overall was identified as having an insufficient number of
cases for analysis.
Measure Four: Warnings vs. Citations
Our final summary measure identified racial differences in those drivers who received written
warnings versus those drivers who received citations. There are a number of reasons why the
disposition of a traffic stop has received attention in the racial profiling context. The decision to
write a citation or issue a written warning is an area in which officers possess a great deal of
discretion. In deciding to make a stop, the officer confronts one decision with only two possible
outcomes: pull the vehicle over or allow the driver to continue. In deciding on a disposition, the
officer must choose from several outcomes. Therefore, it is possible that the same offense
committed by five different people might result in five different dispositions. Such discretionary
power may become a cause for concern when racial differences in stop dispositions are
identified.
The officer’s decision to write a written warning as opposed to a ticket has serious financial
implications for the driver. The driver faces the immediate effects of the fine attached to the
offense, which can be quite large in some cases. The driver may also have to deal for at least a
couple of years with an increased insurance premium. Further, the penalties for a moving
violation offense often follow a driver over state lines to affect his/her insurance premiums. The
financial impact of citation and warning decisions in Massachusetts was highlighted in a Boston
Globe series which examined racial disparities in traffic citations.32
Another troublesome aspect of racial disparities in traffic stop dispositions involves the concern
that official records of police action might be interpreted as a reflection of trends in driving
behavior. If non-white drivers receive more traffic citations because of their race or ethnicity
rather than differences in driving behavior, these practices may create a record that could be used
in subsequent decisions by other governmental units. Social scientists and policy makers are just
32
Dedman and Latour, supra note 4.
18
now beginning to examine how differential driving records may have a race effect on other
decisions made in the criminal justice system such as criminal sentencing.33
The Massachusetts study was originally limited by a lack of information on written warnings.
While the RMV initially computerized two months of data for April and May of 2001, due to
funding limitations, they concluded shortly into the study that it was not financially possible to
continue to computerize data on written warnings. Two months of data on written warnings
would have been insufficient to serve as a basis for any reliable statistical analysis of racial or
gender disparities disposition outcomes. With an additional $150,000 that was appropriated by
the legislature, the Registry of Motor Vehicles computerized a sample of 200,000 additional
written warnings issued throughout the full study period. These warnings were then matched
with citations from the original database we received from the RMV by date giving us a
complete sample of all warnings and citations issued by a jurisdiction on sampled days. Due to
the limitations of the sampling design we were only able to conduct reliable estimates of racial
disparities in citations versus warnings for 142 of the 366 agencies in Massachusetts.34 Although
this limited sample design means that no analysis of disparities in dispositions could be
conducted for some communities in Massachusetts, we are quite confident that the sample of 142
jurisdictions provides a reliable measure of the racial disparities that may exist between citations
and warnings across the whole study period for these sampled jurisdictions. More detailed
information about the matched sample design for written warnings is included in the technical
report.
As with searches, the analysis of racial disparities in warnings versus citations does not have to
rely on a comparative population. We can simply compare the proportion of drivers receiving a
warning or citation by race. Therefore, a measure of statistical significance is used as the
threshold to determine when observed racial differences in dispositions are not due to chance or
error alone.
33
Kevin Blackwell (2001). “Traffic Stops and Race: Its Effects on Criminal History” Paper Presented at the
American Society of Criminology.
34
In order to be included in the disposition outcomes measure a sufficient numbers of warnings had to be sampled
from a jurisdiction to ensure a margin of error less than 5 at a 95% confidence level.
19
Reporting Disparities in All Four Summary Measures
In all four summary measures of disparity we utilize a comparison between white and non-white
populations. While the non-white population group is comprised of multiple racial and ethnic
groups (Black, Hispanic, Asian and Native American) we chose this more simplistic measure to
help clarify instances of disparity. In response to specific concerns about disparate treatment of
Black and Hispanic drivers and non-white male drivers raised by members of our working group
and community meetings which following the release of the preliminary report we also
conducted a separate analysis on Black citations compared to white citations, Hispanic citations
compared to white citations and non-white male citations compared to white male citations.
Although concern about disparate traffic citations of Asian drivers has been raised in many
communities, statewide there were too few citations of Asian drivers to conduct a reliable
analysis of disparities for citations, searches and warnings. If communities have a particular
concern about Asian disparities they should refer to the technical report where statistics and
disparities for all racial groups are individually reported.
For all four measures of disparity we present differences between groups using a measure of the
difference in percent. For example, if 7.4% of the traffic citations in a particular jurisdiction
were given to non-white drivers and that same jurisdiction had a 3.1% non-white driving
population estimate, the difference in percent would be 4.3% (7.4% minus 3.1%). For purposes
of further illustrating these differences we also calculated the disparities based on a ratio
measure. Using the above example, a 7.4% non-white citation population is 2.39 times the
jurisdiction’s 3.1% non-white driving population estimate. Although both differences in percent
and ratios are calculated in the report, we use the measures of difference in percent to determine
whether or not disparities rise above our determined threshold.35
RELEASE OF PRELIMINARY REPORT
In keeping with our goal of creating an open analytic process that included feedback from
community members, law enforcement leaders and other stakeholders the Northeastern
35
The Massachusetts Racial and Gender Profiling working group spent some time discussing the possibility of using
both the median of ratios and the median of the differences in percent measures to draw thresholds. Although there
are strengths and weaknesses of each measurement technique we determined that a measure of differences in percent
was the most stable method for assessing disparity for a statewide study where the base rates of non-white residents
and drivers vary vastly between communities.
20
University research team worked with the Executive Office of Public Safety and the
Massachusetts Racial and Gender Profiling Working Group to release a preliminary report and
begin a statewide dialogue about the issue of racial profiling. This represents the most extensive
public discussion and comment process that has been attempted in any racial profiling study to
date. In January 2004, Northeastern University released the preliminary report which identified
levels of disparity in traffic citations and searches for all communities in Massachusetts. The
goal of the preliminary report was to provide official statistics about the demographics of traffic
citation data so that police departments and community members could review the information,
offer comment about the analytic approach and on any potentially unaddressed sources of racial
or gender disparity.
To solicit feedback from community members and law enforcement the preliminary report was
posted on the Institute on Race and Justice website along with a comment box that allowed
general readers to provide feedback on the findings or any concerns relevant to particular
communities. Community members and law enforcement officials were invited to send us
written comments about the report’s methodology, analysis, findings and any specific concerns
that the preliminary report raised in their particular community (Copies of these letters and a list
of changes can be found in the technical report).
In addition to the public release of the report we conducted six regional community meetings
aimed at bringing police and community members together to discuss the findings and offer
comment (see the technical report for a more in-depth discussion of the community meeting
organizational process and feedback). We also presented the report to members of the
Massachusetts Chiefs of Police Association, regularly scheduled community meetings and
special forums designed to address the issues of racial profiling in specific communities. The
information and suggestions that we received from this comment period have been important for
designing the final analysis presented in this report. For example, in some cases departments
disagreed with the driving population estimates that were created for their community. Some
agencies sent in updated information on road density, economic data for their community and
information on the city employment which was integrated into our driving population estimate.
In other cases departments conducted their own independent road survey observations. Although
21
the observational data submitted from departments was not used as the basis of our driving
population estimate, this data was nonetheless useful in reviewing the reliability of the Driving
Population Estimate and a notation has been placed next to these communities indicating that
they have provided comment on our estimates. In other cases community members indicated
that certain groups of drivers (young non-white males, Hispanic drivers, etc.) were targeted by
the police in their communities. Such comments prompted us to utilize disparity measures that
looked at individual racial group differences and the interactive effects of race and gender in our
final analysis. Additionally, many community members spoke of being stopped in communities
where they drive (but do not live). They discussed particular communities or roadways where
they hesitate to drive for fear of being stopped. In response to this feedback we suggest that the
driving population estimate is important method of measuring disparities that have been
identified by non-resident drivers.
From the comments received as part of this process a number of themes emerged that can
provide a context for the issues addressed in this report. Many community members expressed
the opinion that regardless of the data collection outcomes, they perceive that the practice of
stopping drivers based on their race or ethnicity is real, damaging, and something people from
communities of color regularly experience. In addition, a number of those who spoke at
community forums told of having to deal with this issue for generations and expressed a hope
that this report will serve as a starting point for developing strategies aimed at reducing the
practices in the locations where they have been identified.
Many of the law enforcement representatives who spoke expressed the firm belief that if the
practice of stopping drivers based on their race or ethnicity was happening anywhere it was
wrong and should be dealt with and eliminated. Law enforcement members suggested that they
had not encountered such practices very often in their years serving as police officers and at
times expressed frustration with allegations of bias because they felt it was not something they
had observed or engaged in during their career. In addition, many law enforcement officials
expressed a strong willingness to address such issues if they were brought to their attention and
they had the appropriate tools to identify the sources of the problem.
22
These comments help illuminate the need for concrete information around which departments
can begin to identify problems and respond to the concerns of the community. Without such
tools the disconnect between community and law enforcement perceptions about this issue could
unfortunately remain firmly entrenched.
While the process of receiving public comment about traffic citation disparities identified in the
preliminary report was at times challenging we firmly believe that this feedback makes the
Massachusetts Racial and Gender Profiling Report one of the strongest statewide reports on
racial profiling to date. It was our goal from the outset to produce a fair, accurate and
understandable report about the existence of racial and gender disparities in traffic citations. We
believe that these elements are necessary for such a report if it is ever expected to help identify
areas of concern and bring about real change.
SUMMARY OF FINDINGS
The goal of the Massachusetts Racial and Gender Profiling Study is unique. Unlike most studies
which seek to provide descriptive information about the characteristics of traffic stops in a
particular community or statewide, the Legislature specified that the Massachusetts study would
identify communities that appear to have engaged in racial and gender profiling so that these
communities can be required to collect additional information (such as information on all stops)
in an effort to determine if the documented disparities are based on race or ethnicity. In most
studies there is no legislatively or administratively mandated sanction that results from the
findings in the study. This places an additional burden on policy makers such as the Secretary of
Public Safety and the Attorney General as they attempt to make informed decisions about the
degree of disparity necessary to prompt such additional action. This is fairly new territory for any
state and thus Massachusetts policy makers are working in somewhat uncharted territory.
To provide the most accurate, fair and easily interpretable conclusions on the existence of
disparities we have utilized multiple measures of disparity in an attempt to best identify those
jurisdictions with patterns of racial disparity. The Massachusetts legislation called for a study
23
which would identify jurisdictions where the data suggests the appearance of racial profiling.36
Although as we have indicated earlier in this report the Massachusetts data does not allow for
definitive findings of racial profiling on the part of individual officers or within a department, we
believe that the use of multiple measures of disparity allows conclusions to be drawn about the
existence of patterns of racial disparity in traffic enforcement which may best help policymakers
identify those jurisdictions that are in need of additional monitoring. In the following section we
provide a brief overview of the results of each measure and then present final conclusions about
the existence of disparity for all communities.
Gender Disparities
Overall we found that males were more likely to be cited than their representation in either the
residential or the driving population estimate. Males were uniformly more likely to be subject to
a search and to be cited than women. These findings were consistent across virtually all
communities in Massachusetts. This report finds no indication that female drivers, in the
aggregate, are more likely to be stopped, cited or subject to a search than their male counterparts.
In fact, quite the opposite appears to be the case. Part of the legislative intent of including
gender disparities in the analysis was to identify cases where female drivers were stopped and
searched or harassed because they were a woman. Some high profile reports of sexual assault or
harassment of women during traffic stops raise concern about this important issue.
Unfortunately, since these egregious events are presumed to be fairly rare and they most likely
would not be documented by official citation records, this type of data may be inappropriate for
measuring the actual frequency of such incidents. This issue could be much more accurately
addressed by having traffic citation data that included officer identification. With this data
departments or outside analysts could identify if certain groups of officers made
disproportionately more stops of women than their similarly situated peers.
Measure One: Residents Cited Compared to Residential Population
The resident cited measure presents information about the degree to which residents of a
jurisdiction are disproportionately stopped and cited by their local police agency. Statewide the
36
An Act Providing for the Collection of Data Relative to Traffic Stops, Massachusetts Chapter 228 of the Acts of
2000.
24
average disparity between non-white residents cited and non-white residents in the census
population was .06% with non-white residents being cited slightly more frequently than their
representation in the residential population. Statewide the largest racial difference between
citations to residents and residential population was for Black drivers (average disparity of 1.3%)
and non-white male drivers (average disparity 2.2%). Although the statewide disparity is
relatively low 18 communities in the state had extreme levels of disparity above 10% (See
Resident Citation Tables in Appendix for detailed information).
Across the 366 agencies we found racial disparities of residents that rose above the statewide
positive median in 141 communities or approximately 38% of Massachusetts jurisdictions.37 This
measure is useful because it only includes citations given to residents and is unaffected by people
who drive through a community for work or other reasons. In these cases disparities are likely
caused by disproportionate enforcement action against a group, potentially because of where
they normally live or drive. Such disparities may be the result of deployment of officers to
particular parts of towns which results in differential enforcement against one group of residents.
Additional information, such as the location of the stop, would be useful for helping departments
understand why non-white residents are disproportionately cited.
Measure Two: Citations Compared to the Driving Population Estimate
The comparison of all citations to the racial demographics of the driving population estimate is
an important feature of this report. While comparing citations of residents to residential
populations may be useful for evaluating the existence of certain types of bias, only the driving
population estimate comparisons can measure the effect of bias against individuals traveling
through communities in the Commonwealth. The concern that some law enforcement officers
stop non-white drivers when they are perceived to be “out of place” is one of the most visible
areas of concern in both the local and national dialogue about racial profiling.
37
It is important to note that although statewide averages are given as a reference for all measures, the thresholds for
resident citations and citations compared to the driving population estimate were based on the positive statewide
median (mid-point) which is different than the overall statewide average. The positive statewide median is a more
conservative estimate of the degree of disparities among those communities who had positive racial disparities.
25
Across the 366 agencies in the study, we found racial disparities in citations compared to the
driving population estimate that rose above the statewide positive median in 56% or 201
communities. This measure suggests that racial disparities in traffic enforcement in
Massachusetts affect out-of-town drivers more than residents, and that the perception of many in
the community that they are more likely to be stopped when they drive through certain
communities may in fact be true.
Statewide the average disparity between non-white drivers cited and non-whites in the driving
population estimate was 2.6%. Very consistent disparities were found when Black citations
(average disparity of 2.3%) and Hispanic citations (average disparity 2.2%) were compared to
the driving population estimate.
Measure Three: Searches
Searches following a traffic citation are a relatively rare event in Massachusetts. Only 1.3% of
all traffic citations resulted in a non-inventory search of the motorists or their vehicle statewide.
Even though searches were a relatively rare event there are important racial differences in the
likelihood of being searched that emerge from this analysis. Across the state, non-white drivers
were more likely to be searched following a citation than white drivers (1.3% of white drivers
searched compared to 1.8% of non-white drivers). Some level of racial disparity in searches was
observed in 208 jurisdictions throughout the state. Although some agencies will be more likely
to conduct searches due to organizational mandates and community needs, Table 3 illustrates that
racial disparities in searches are found across all types of communities. While searches are
clearly an issue that should be addressed by communities with large populations, as 100% of
these communities have racial disparities in searches, however, 45% of the jurisdictions with the
smallest populations (less than 10,000) have racial disparities in searches. As a result of these
findings, racially disparate search practices should be taken seriously by all communities
throughout the Commonwealth.
The finding that searches are conducted in only 1.3% of the stops resulting in a citation raises a
number of important questions. This rate of searches is much lower than in most other research
on racial disparities in traffic stops. For example, in Rhode Island searches were conducted in
26
7.9 % of the stops,38 in Missouri searches were conducted in 7.9% of stops39 and in Connecticut
searches were conducted in 7% of the stops.40 These statewide study estimates also include a
large number of stops that did not receive a citation. The low number of searches in
Massachusetts may be an indication of some data quality issues that should be addressed before
additional data collection is implemented. Since in many studies racial disparities, searches are a
significant area of concern, some discussion should take place among law enforcement leaders
and community representatives about the optimal criteria for conducting searches as we move
forward. This discussion should include the goals of searches, the productivity of searches and
the impact of differential search rates on members of the community of color.
Since searching as part of a traffic stop is a relatively rare event, some communities with
observed disparities actually conducted very few searches. Consequently, some communities
with disparities had to be removed from the overall disparity analysis.41 Table 3 illustrates that
smaller communities who had racial disparities in searches were less likely to be included in the
final search analysis due to insufficient cases. In fact, for the smallest population type (under
10,000) only 12% of the jurisdictions with racial disparities in searches could be analyzed. Even
after removing these cases, however, we found that non-white drivers were significantly more
likely to be searched than white drivers in 40 of 87 jurisdictions.
38
Farrell, et al., supra note 12.
2002 Annual Report of Missouri Traffic Stops, Office of the Missouri Attorney General.
40
Cox, supra note 11.
41
Jurisdictions with less than 50 searches or less than 10 citations of non-white drivers were removed from the
analysis to address the problem of small numbers. The search tables in the appendix identify these jurisdictions with
the designation IC for insufficient cases.
39
27
Table 2: Distribution of Searches with Racial Disparity Across City Types
Population Size
100,000+
50,000-99,999
25,000-49,999
10,000-24,999
Under 10,000
Number of Cities
with Racial
Disparity
% of Cities in
Group with
Disparity
5
14
35
67
87
100%
78%
72%
65%
45%
Range of
Disparity
% with
Sufficient Cases
(Diff in %)
0.43-1.17
0.14-6.72
0.08-6.72
0.05-10.02
0.03-19.44
100%
100%
37%
25%
12%
From the data collected in Massachusetts it is impossible to determine whether or not a search
occurred and a motorist was subsequently arrested, or whether a lawful arrest resulted in the
search of a motorist or vehicle. In these later cases officers may have little discretion in the
decision to search a motorist. To provide the most conservative estimate of any potential racial
disparity in searches that arise from officer’s discretionary decisions an analysis was also
conducted on racial disparities in searches after all citations that had a corresponding arrest were
removed from the database. After removing all citations with a corresponding arrest we found
that non-white drivers were still significantly more likely to be searched than white drivers in 26
communities.
Measure Four: Warnings vs. Citations
Statewide, in our sample of warnings and citations 32.9% of all the stops resulted in a written
warning and 67.1% of the stops resulted in a citation. When citations and warnings are analyzed
by race we find that statewide non-white drivers were significantly more likely to receive a
citation than white drivers (72% of non-white drivers receive citations compared to 65.9% of
white drivers). This suggests that in some communities in Massachusetts officers may be more
likely to use their discretion to give written warnings to white drivers rather than to non-white
drivers. In fact out of the 142 communities that could be included in our sample of citations and
warnings non-white drivers were significantly more likely to receive a citation in 58% or 83 of
the communities.
While all drivers may be more likely to be cited for egregious violations of the law, differential
behavior patterns do not appear to explain away racial differences in citation and warning rates.
When examining only drivers who were cited for speeding violations 15 mph or less over the
28
posted speed limit, 73.6% of white drivers received a citation compared to 82.6% of non-white
drivers - a statistically significant difference of 9%. Race differences still exist even when the
most serious speeding offenses are isolated. For drivers cited for speeding over 15 miles per
hour or more above the speed limit 81.6% of whites are cited compared to 86.8% of non-whites
– a statistically significant difference of 5.2%). More sophisticated analysis could be done for
each jurisdiction to determine whether or not the type of offense mediated the effect of race,
however there is no indication from the statewide data that differential violation rates explain
away racial differences in dispositions.
Summary Findings
As a final step to the analysis we identified whether disparities that fell above the specified
threshold existed in any categories for the above four summary measures. If communities were
found to have disparities in any single category that fell above the specified threshold of
disparity for that category, then they were identified as having a disparity in that particular
summary area. For example, if a jurisdiction had a statistically significant disparity in searches
of Hispanics they would be identified as having a disparity on the summary measure of searches.
Once disparities were tabulated across all summary measures we identified the total number of
summary areas in which communities had disparities. The summary table appended to this
report, identifies disparities in a single category (non-white, Black, Hispanic, or non-white male)
within each summary measure with an “*”. If any of the individual categories within a summary
measure had disparities that fell above the specified threshold, an “X” was placed next to that
summary measure. Communities in Massachusetts were then classified into two groups. First,
communities with substantial disparity are defined as communities with disparities that fall
above the defined threshold for at least one of the summary measures (marked with an X).
Second, communities with minimal or no disparity are defined as those jurisdictions having
either racial disparities on one or more measures that did not rise to the specified threshold or
having no disparities across any of the summary measures.
29
In summary, 249 agencies were identified as having substantial racial disparity in one or more
measures that fell above our specified threshold, 92 agencies were identified as having minimal
or no disparities, and no measure of disparity could be calculated in 25 of the agencies.
This report provides much more information than simply the number of measures of disparity for
each jurisdiction. The report provides information on the level of disparity for each of 16
individual race, ethnic and gender measures. This information can be very useful as departments
begin to focus their efforts to understand and reduce areas of greatest disparity. Each department
should review their individual information on disparity to determine the greatest areas of need
and to help identify strategies that might be implemented to reduce disparities. For example, the
report identifies if a particular jurisdiction has a disparity with citations to specific groups, such
as Hispanic drivers or non-white males. In additional, a community may find that racial
disparities do not appear in citations but do appear to be a problem with respect to searches.
The detailed level of information provided in this report will be extremely important as
departments develop strategies to reduce the disparities that have been identified. If for example,
citations to Black drivers are a problem area, a police agency might look to where and when
these stops are occurring. Officers could then discuss the goals they are attempting to meet with
stops in certain neighborhoods and supervisors can evaluate whether or not such stops are
effectively meeting the goals of the department. In some cases the department may determine
that they could better meet their goals using stop and search methods that do not produce racial
disparities. By using the full analysis that is presented in the tables for this report and the larger
technical report, local community members and police officials have a starting point to begin
discussions about the most effective ways to address and reduce disparities in their community.
ISSUES TO CONSIDER
Based the findings of the Massachusetts study, national research on the issue and
recommendations from the Working Group and other stakeholders we offer the following set of
issues to consider which provide guidance to those who must begin to formulate policies based
on the findings in this report.
30
1. All law enforcement agencies, as a part of good professional police practices, should
establish a system to collect and monitor data on all traffic stop activity.
Data on all traffic stops provides the only reliable way to determine if disparities exist in traffic
enforcement and to determine if those communities with disparities are effectively reducing the
disparities that have been identified. Consequently we believe that all communities in
Massachusetts should join the thousands of other law enforcement agencies across the nation
currently collecting information on all traffic stops.
By collecting and analyzing information on all traffic stops departments can apply the same
analytic approach currently being utilized to understand and reduce crime to their efforts to make
the roadways safer. Nationally over 6,000 law enforcement agencies have begun collecting data
on all traffic stops. In addition, the Commission on Accreditation for Law Enforcement
(CALEA) has mandated collecting and analyzing information on traffic enforcement for all its
member agencies. CALEA believes that analyzing information on all traffic stops is critical to
professionalizing of law enforcement operations nationally.
Understanding this need to collect detailed information on traffic stops, a number of
Massachusetts law enforcement agencies including Boston Police Department, Cambridge Police
Department, Lowell Police Department, Brookline Police Department, Provincetown Police
Department and the MBTA Police have already either begun to collect information on all stops
or have committed to begin such data collection regardless of the decision of the Secretary of
Public Safety.
2. Following national models for traffic stop data collection, a uniform set of data elements
to be collected on all stops should be identified. It is important that any new data collection
system include information on officer identification and the location of the stop in the
required data collection elements. Additionally a specific timetable for data collection,
auditing and reporting should be established.
Creating a uniform process for data collection will guarantee that sufficient information is
collected from all agencies to conduct a full analysis of disparities in traffic stop activity.
Uniformity in the type of data collected is important because it allows departments to make
31
comparisons with the present study so that agencies can document progress in reducing any
disparities that have been identified. Additionally, a uniform data collection system allows
comparisons to be made across various agencies.
The collection of officer identification and location of the stop are two important elements of any
new data collection process. In order to deal with disparities at the departmental level, command
staff members and supervisors must be able to identify individual officers who may be causing
disparities in parts of their community. This information could then become part of the ongoing
monitoring process that would be implemented within each agency. Information on the traffic
stop behavior of individual officers would also allow the department to begin to address
questions of gender disparities in stop practices to determine if some officers are stopping larger
number of female drivers compared to their similarly situated peers. Additionally, in response
to the present study many law enforcement agencies have suggested that deployment decisions
based on traffic safety may contribute to their overall community disparity. Without street,
neighborhood or district information this question cannot be answered.
3. All local police agencies should begin or continue a conversation with members of their
community about the existence of disparities in traffic stops, the goals of traffic
enforcement and strategies to monitor and reduce such disparities.
This process has begun in some jurisdictions and was already ongoing in others. One challenge
that has been identified by some communities is that many local police agencies, particularly
those with very small non-white populations, have expressed frustration identifying members of
their community who are concerned about this issue. We suggest that police departments utilize
a broader definition of community than is typically used. This data supports the conclusion that
in some communities non-resident drivers are more likely to stopped and cited than resident
drivers. Therefore, the effected population of drivers is much broader than only the residents of a
particular community. As a result, police may need to expand their notion of community to
include those who drive through the city or town for many purposes. In this definition of
community, police officials may want to reach out to stores, churches, business, entertainment
and other locations that may attract non-resident drivers. In addition police officials may have to
develop partnerships with police departments from neighboring communities with a larger non-
32
white population to hold regional community meetings about the racial disparities identified in
the report. It is interesting to note that most police departments who submitted feedback in the
comment period could identify sources of non-white drivers driving to and through their
jurisdiction. These sources might be the very groups that could be contacted to begin a
conversation about traffic stop disparities.
4. Local community groups and representatives can assist departments that express a
sincere willingness to work on the issue by gathering participants who could provide
meaningful feedback to police agencies about the goals of traffic enforcement and the levels
of disparity identified in the report.
While we recognize that certain members of the community may not feel comfortable coming
forward to discuss the issue of racial profiling and others may not have faith in a dialogue
process due to negative experiences with the police, it is important that community-police
dialogues about this issue include as many voices as possible. In most cases this means ensuring
that the voices of youth, non-English speaking populations, and other disenfranchised groups be
represented and encouraged to participate in ongoing police-community discussions about the
existence of racial disparities in traffic enforcement.
33
Appended Materials
and Data Tables
Instructions on Reading Summary Tables
Overall Summary Table
The overall summary table summarizes the disparities found across multiple categories for each summary
measure. For each agency an “*” is placed in each categories if the level of disparity falls above the specified
threshold for that category. If no analysis could be conducted for that agency due to missing or insufficient data
the category is marked with a “–.” If disparities fall above the specified threshold for any category within a
summary measure an “X” is placed at the end of that summary measure. The jurisdictions listed in this table
are grouped alphabetically by the total number of summary measures in which that jurisdiction was found to
have a disparity.
Summary Measure 1: Residents Cited Compraed to the Residential Population
Threshold for disparities marked with * = above the statewide median.
• Disparities in Non-White vs. White Resident Citations Compared to the Residential Population.
• Disparities in Black vs. White Resident Citations Compared to the Residential Population.
• Disparities in Hispanic vs. White Resident Citations Compared to the Residential Population.
• Disparities in Non-White Male vs. White Male Resident Citations Compared to the Residential
Population.
Summary Measure 2: All Citations Compared to the Driving Population Estimate
Threshold for disparities marked with * = above the statewide median.
• Disparities in Non-White vs. White Citations Compared to the Driving Population Estimate.
• Disparities in Black vs. White Citations Compared to the Driving Population Estimate.
• Disparities in Hispanic vs. White Citations Compared to the Driving Population Estimate.
Summary Measure 3: Searches
Threshold for disparities marked by * = statistically significant disparities.
IC indicates that departments had an insufficient number of searched upon which reliable analysis of disparities
could be conducted.
• Disparities in Non-White Search Rates vs. White Search Rates
• Disparities in Black Search Rates vs. White Search Rates
• Disparities in Hispanic Search Rates vs. White Search Rates
• Disparities in Non-White Male Search Rates vs. White Male Search Rates
Summary Measure 4: Citations vs. Warnings
Threshold for disparities marked by * = statistically significant disparities.
• Disparities in Non-White Citation Rates vs. White Citation Rates
• Disparities in Black Citation Rates vs. White Citation Rates
• Disparities in Hispanic Citation Rates vs. White Citation Rates
• Disparities in Non-White Male Citation Rates vs. White Male Citation Rates
35
+
*
*
*
*
*
*
*
*
*
*
*
*
*
*
*
*
*
*
*
*
*
*
*
*
*
*
*
*
*
*
*
*
*
*
*
*
*
*
*
*
*
*
*
*
*
*
*
*
*
*
*
*
*
*
*
*
*
*
*
*
*
*
*
*
*
*
*
*
*
*
*
*
*
*
*
*
*
*
*
X
X
X
X
X
X
X
X
X
X
X
X
X
X
X
X
X
X
X
X
X
X
X
X
X
X
*
*
*
*
*
*
*
*
*
*
*
*
*
*
*
*
*
*
*
*
*
*
*
*
*
*
*
*
*
*
*
*
*
*
*
*
*
*
*
*
*
*
*
*
*
*
*
*
*
*
*
*
*
*
*
*
*
*
*
*
*
*
*
*
*
*
*
NonBlack Hispanic
White
NonNW
Black Hispanic
White
Male
X
X
X
X
X
X
X
X
X
X
X
X
X
X
X
X
X
X
X
X
X
X
X
X
X
X
X
X
-
-
*
*
-
*
-
-
-
*
-
-
-
-
-
*
*
-
*
-
-
-
*
*
-
*
-
-
-
*
-
*
-
NW
NonNW
Black Hispanic
no
White
Male
arrest
*
*
*
*
*
*
*
*
*
*
*
*
*
*
*
*
*
*
*
*
*
*
*
*
*
*
*
*
*
*
*
*
*
*
*
*
*
*
*
*
*
*
*
*
*
*
3. Search Disparities
X
X
X
X
X
X
X
X
X
X
X
X
X
X
X
X
X
X
*
*
*
*
*
*
*
*
*
*
*
*
*
*
*
*
*
*
*
*
*
*
*
*
*
*
*
*
*
*
*
*
*
*
*
*
*
*
*
*
*
*
*
*
*
*
*
*
*
*
*
*
*
*
*
*
*
*
*
*
*
*
*
*
*
*
*
*
NonNW
Black Hispanic
White
Male
4. Citations vs. Warnings
X
X
X
X
X
X
X
X
X
X
X
X
X
X
X
X
X
X
X
X
X
X
X
X
X
X
X
36
Overall
4
4
4
4
4
4
4
4
4
4
4
4
4
4
4
3
3
3
3
3
3
3
3
3
3
3
3
3
Denotes that the agency presented Northeastern University with road survey data that differed from the Northeastern University driving population estimate used in this report.
Barnstable
Boston (All)
Brookline
Cambridge
Framingham
Leicester
Lynn
New Bedford
Peabody
Quincy
Springfield
Stoughton
W. Bridgewater
Waltham
Worcester
Abington
Andover+
Arlington
Auburn
Berlin
Braintree
Bridgewater
Brockton
Canton
Chicopee
Dedham+
Everett
Falmouth
Agencies with Disparity
2. Driving Population
1. Resident Citations
Summary Table of Disparities
Fitchburg
Haverhill
Hudson
Lawrence
Leominster
Longmeadow
Lowell
Malden
Marlborough
Mattapoisett
Medway
Methuen
Milford
N. Adams
Needham
Northampton
Pittsfield
Randolph+
Revere
Shrewsbury+
Somerville
Southborough
State Police (All)
Taunton
Townsend
Wareham
Watertown+
Westborough
Yarmouth
Adams
Agencies with Disparity
Summary Table
2. Driving Population
3. Search Disparities
4. Citations vs. Warnings
NW
NonNonNW
NonNW
NonNW
Black Hispanic
Black Hispanic
Black Hispanic
no
Black Hispanic
White
Male
White
White
Male
White
Male
arrest
*
*
*
*
*
*
*
*
*
*
X
X
*
*
*
*
*
*
*
*
*
*
*
X
X
X
*
*
*
*
*
*
*
*
X
X
*
*
*
*
*
*
*
*
X
X
*
*
*
*
*
*
*
*
*
*
X
X
*
*
*
X
X
*
*
*
*
*
*
*
*
*
X
X
X
*
*
*
*
X
X
X
*
*
*
*
*
*
*
*
*
X
X
*
*
*
*
*
X
X
*
*
*
*
*
*
*
*
*
X
X
*
*
*
*
*
*
*
*
X
X
*
*
*
*
*
*
*
*
*
X
X
*
*
*
*
*
*
*
*
X
X
X
*
*
*
*
*
X
X
*
*
*
*
X
X
*
*
*
*
*
*
*
X
X
*
*
*
*
*
*
*
*
*
X
X
*
*
*
*
*
*
*
*
*
*
X
X
*
*
*
*
*
*
*
X
X
*
*
*
*
*
*
*
*
X
X
*
*
*
*
*
*
X
X
*
*
*
*
*
*
*
*
*
*
*
X
X
X
*
*
*
*
*
*
*
X
X
X
*
*
*
*
*
X
X
X
*
*
*
*
*
*
X
X
X
*
*
*
*
*
*
*
*
*
X
X
*
*
*
*
X
X
*
*
*
*
*
*
*
*
X
X
*
*
*
X
X
1. Resident Citations
X
X
X
X
X
X
X
X
X
X
X
X
X
X
X
X
X
X
X
X
X
37
Overall
3
3
3
3
3
3
3
3
3
3
3
3
3
3
3
3
3
3
3
3
3
3
3
3
3
3
3
3
3
2
*
*
*
*
*
*
*
*
*
*
*
*
*
*
*
*
*
*
*
*
*
*
*
*
*
*
*
*
*
*
*
*
*
*
*
*
*
*
*
*
*
*
*
*
*
*
X
X
X
X
X
X
X
X
X
X
X
X
X
X
X
X
X
X
X
X
X
X
*
*
*
*
*
*
*
*
*
*
*
*
*
*
*
*
*
*
*
*
*
*
*
*
*
*
*
*
*
*
*
*
*
*
*
*
*
*
*
*
*
*
*
*
*
*
*
*
*
*
*
*
*
NonBlack Hispanic
White
NonNW
Black Hispanic
White
Male
Agencies with Disparity
Amesbury
Amherst
Ashland
Athol
Avon
Belchertown
Bellingham
Belmont
Billerica
Bourne
Boxborough
Chatham
Chelsea
Cheshire
Chilmark
Clinton
Dennis
Dracut
Dudley
Dunstable
E. Bridgewater
E. Brookfield
Easton
Edgartown
Fairhaven
Fall River
Foxborough
Georgetown
Hanson
Harwich
2. Driving Population
1. Resident Citations
Summary Table
X
X
X
X
X
X
X
X
X
X
X
X
X
X
X
X
X
X
X
X
X
X
X
X
X
X
X
4. Citations vs. Warnings
*
*
-
-
-
*
*
-
*
-
*
-
-
-
*
*
-
-
-
*
-
-
-
X
X
X
-
*
*
-
*
-
-
-
-
-
-
-
-
*
-
*
-
-
-
-
*
-
NW
NonNW
NonNW
Black Hispanic
no
Black Hispanic
White
Male
White
Male
arrest
*
*
*
*
*
X
*
*
*
*
*
*
*
*
3. Search Disparities
X
X
X
X
X
X
X
38
Overall
2
2
2
2
2
2
2
2
2
2
2
2
2
2
2
2
2
2
2
2
2
2
2
2
2
2
2
2
2
2
Hatfield
Holbrook
Holyoke
Kingston
Lancaster
Lexington
Littleton
Marion+
Mashpee
Maynard
Medford
Mendon
Millbury
Milton+
Montague
N. Andover
Nantucket
Natick
Newton
Northbridge
Northborough
Norton
Norwood
Oak Bluffs
Oakham
Orange
Orleans
Paxton
Raynham
Rochester
Agencies with Disparity
Summary Table
2. Driving Population
3. Search Disparities
4. Citations vs. Warnings
NW
NonNonNW
NonNW
NonNW
Black Hispanic
Black Hispanic
Black Hispanic
no
Black Hispanic
White
Male
White
White
Male
White
Male
arrest
*
*
*
*
*
*
X
X
*
*
X
X
*
*
*
*
X
X
*
*
*
*
*
X
X
*
*
*
*
X
X
*
*
*
*
X
*
*
*
*
*
X
X
*
*
*
*
*
X
X
*
*
*
*
*
X
X
*
*
*
*
*
*
X
X
*
*
*
*
*
X
X
*
*
*
X
X
*
*
*
*
X
X
*
*
*
*
*
*
X
X
*
*
*
*
X
X
*
*
*
*
*
X
*
*
*
*
*
X
X
*
*
*
*
*
X
*
*
*
*
*
X
*
*
*
X
X
*
*
*
*
*
*
X
X
*
*
X
X
*
*
*
*
*
X
*
*
*
*
*
X
X
*
*
*
X
X
*
*
*
*
X
X
*
*
*
*
X
X
*
*
*
*
X
X
*
*
X
X
*
*
X
X
-
1. Resident Citations
X
X
X
X
X
39
Overall
2
2
2
2
2
2
2
2
2
2
2
2
2
2
2
2
2
2
2
2
2
2
2
2
2
2
2
2
2
2
*
*
*
*
*
*
*
*
*
X
*
X
X
X
X
X
X
X
X
*
*
*
*
*
*
*
*
*
*
*
X
X
*
*
*
X
*
X
X
*
*
*
*
*
*
*
*
*
*
*
*
*
*
*
*
*
*
*
*
*
*
*
*
*
*
*
*
*
*
*
*
*
*
*
*
*
*
*
*
*
*
*
*
*
*
*
*
*
*
*
*
*
*
*
NonBlack Hispanic
White
NonNW
Black Hispanic
White
Male
Agencies with Disparity
Rockland
Salem
Salisbury
Sharon
Shirley
Shutesbury
Southbridge
Sturbridge
Sudbury
Sutton
Tewksbury
Tisbury
Truro
Upton
W. Springfield
W. Tisbury
Walpole
Ware
Warwick
Wayland
Webster
Wellesley
Weston
Weymouth
Wilmington
Winthrop
2. Driving Population
1. Resident Citations
Summary Table
X
X
X
X
X
X
X
X
X
X
X
X
X
X
X
X
X
X
X
X
X
X
X
X
4. Citations vs. Warnings
*
-
*
*
-
-
-
-
-
-
*
-
*
-
-
*
-
X
X
-
*
*
*
*
*
*
*
*
*
-
-
*
*
-
*
*
*
*
*
*
*
-
-
*
*
*
*
*
*
NW
NonNW
NonNW
Black Hispanic
no
Black Hispanic
White
Male
White
Male
arrest
*
*
*
*
X
*
*
*
-
3. Search Disparities
X
X
X
X
X
X
X
X
X
X
X
40
Overall
2
2
2
2
2
2
2
2
2
2
2
2
2
2
2
2
2
2
2
2
2
2
2
2
2
2
X
*
*
X
X
X
X
*
*
-
*
*
*
*
X
*
-
X
-
*
-
*
-
*
*
*
*
*
*
*
*
*
*
*
*
*
*
*
*
*
*
*
*
*
*
*
*
*
*
*
*
*
*
*
*
*
*
X
*
*
*
X
X
X
X
X
X
X
X
X
X
X
X
X
X
X
X
X
NonBlack Hispanic
White
NonNW
Black Hispanic
White
Male
Agencies with Disparity
Acushnet
Aquinnah
Ashburnham
Ashby
Attleboro
Ayer
Bedford
Berkley
Bernardston
Beverly
Blackstone
Bolton
Boylston
Buckland
Carver
Charlton
Chelmsford
Chester
Clarksburg
Cohasset
Dartmouth
Douglas
Dover
E. Longmeadow
Erving
Franklin
Freetown
Gill
Gloucester
2. Driving Population
1. Resident Citations
Summary Table
4. Citations vs. Warnings
-
-
-
-
-
-
-
-
-
*
-
-
-
NW
NonNW
NonNW
Black Hispanic
no
Black Hispanic
White
Male
White
Male
arrest
*
*
*
X
*
X
*
*
-
3. Search Disparities
X
X
41
Overall
1
1
1
1
1
1
1
1
1
1
1
1
1
1
1
1
1
1
1
1
1
1
1
1
1
1
1
1
1
Goshen
Granby
Granville
Greenfield
Groveland
Hadley
Hampden
Heath
Hingham
Holden
Holland
Holliston
Hopedale
Hopkinton
Hull
Huntington
Ipswich
Lakeville
Lanesborough
Lee
Lenox
Lincoln
Lunenburg
Lynnfield
Mansfield
Marblehead
Melrose
Merrimac
Middleborough
Millis
Agencies with Disparity
Summary Table
2. Driving Population
3. Search Disparities
4. Citations vs. Warnings
NW
NonNW
NonNonNW
NonNW
Black Hispanic
Black Hispanic
Black Hispanic
no
Black Hispanic
White
Male
White
White
Male
White
Male
arrest
*
*
X
*
*
*
X
*
X
*
*
X
*
*
X
*
*
*
X
*
X
*
*
X
*
X
*
X
*
*
*
X
*
*
X
*
*
X
*
X
*
*
X
*
X
*
X
*
*
X
*
X
*
*
X
*
*
*
*
*
X
*
X
*
*
*
X
*
X
*
X
*
*
X
*
X
*
*
X
-
1. Resident Citations
X
X
42
Overall
1
1
1
1
1
1
1
1
1
1
1
1
1
1
1
1
1
1
1
1
1
1
1
1
1
1
1
1
1
1
*
*
*
*
-
*
*
*
*
*
*
*
*
*
*
*
*
*
*
*
NonNW
Black Hispanic
White
Male
Agencies with Disparity
Millville
N. Attleboro
Nahant
New Marlborough
New Salem
Newburyport
Northfield
Palmer
Pelham
Pepperell
Plymouth
Rehoboth
Rockport
Rowley
Royalston
S. Hadley
Sandwich
Saugus
Scituate
Seekonk
Sherborn
Somerset
Southwick
Spencer
Sterling
Stockbridge
Stoneham
Stow
Sunderland
Swampscott+
Topsfield
1. Resident Citations
Summary Table
X
X
X
X
X
X
X
3. Search Disparities
*
*
*
*
*
*
*
*
*
*
*
*
*
*
*
*
*
*
*
*
*
*
*
*
*
*
*
*
*
*
X
X
X
X
X
X
X
X
X
X
X
X
X
X
X
X
-
*
-
-
-
-
-
-
-
*
-
-
-
-
-
-
-
-
-
-
NW
NonNonNW
Black Hispanic
Black Hispanic
no
White
White
Male
arrest
*
X
2. Driving Population
X
*
*
-
-
*
-
*
*
-
-
-
-
-
-
-
-
-
-
*
-
*
-
*
-
*
-
-
-
*
-
-
-
-
-
NonNW
Black Hispanic
White
Male
4. Citations vs. Warnings
X
X
X
X
X
X
43
Overall
1
1
1
1
1
1
1
1
1
1
1
1
1
1
1
1
1
1
1
1
1
1
1
1
1
1
1
1
1
1
1
X
*
*
X
X
X
*
*
*
*
*
*
*
*
*
*
*
*
*
*
*
*
*
*
*
*
*
NonBlack Hispanic
White
NonNW
Black Hispanic
White
Male
Agencies with Disparity
Tyngsborough
W. Brookfield
W. Newbury
Wakefield
Wellfleet
Wendell
Wenham
Westfield
Westwood
Whitman
Wilbraham
Winchendon
Windsor
Woburn
Wrentham
2. Driving Population
1. Resident Citations
Summary Table
X
X
X
X
X
X
X
X
X
-
-
-
-
-
NW
NonNW
Black Hispanic
no
White
Male
arrest
-
3. Search Disparities
-
-
*
-
*
-
-
-
-
-
-
-
-
-
*
-
-
-
-
*
NonNW
Black Hispanic
White
Male
4. Citations vs. Warnings
X
X
44
Overall
1
1
1
1
1
1
1
1
1
1
1
1
1
1
1
-
-
-
-
-
-
-
-
-
-
-
-
-
-
-
-
-
-
-
NonNW
Black Hispanic
White
Male
Agencies with Minimal
or No Disparity
Acton
Agawam
AMTRAK
Ashfield
B&M Railroad
Barre
Becket
Blandford
Boxford
Brewster
Bridgewater SC
Brimfield
Brookfield
Bunker Hill CC
Burlington
Carlisle
Charlemont
Chesterfield
Colrain
Concord
Conway
CSX
Cummington
Dalton
Danvers
Deerfield
Dighton
Duxbury
Eastham
Easthampton
1. Resident Citations
Summary Table
-
-
-
-
-
-
-
-
-
-
-
-
-
-
-
NonBlack Hispanic
White
2. Driving Population
NW
NonNW
Black Hispanic
no
White
Male
arrest
-
3. Search Disparities
-
-
-
-
-
-
-
-
-
-
-
-
-
-
-
-
-
NonNW
Black Hispanic
White
Male
4. Citations vs. Warnings
45
Overall
0
0
0
0
0
0
0
0
0
0
0
0
0
0
0
0
0
0
0
0
0
0
0
0
0
0
0
0
0
0
1. Resident Citations
Egremont
Environmental PD
Essex
Fernald State School
Gardner
Grafton
Groton
Gt. Barrington
Halifax
Hamilton
Hanover
Hardwick
Harvard
Hinsdale
Hubbardston
Leverett
Leyden
Ludlow
MA Maritime Police
Manchester
Marshfield
Massasoit CC
MBTA
Medfield
Metro Police Lwr. Basin
Metro Police Marine
Middleton
Monroe
Monson
Monterey
-
-
-
-
-
-
-
-
-
-
-
-
-
-
-
-
-
-
-
-
-
-
-
-
-
-
-
Agencies with Minimal or NonNW
Black Hispanic
No Disparity
White
Male
Summary Table
-
-
-
-
-
-
-
-
-
-
-
-
-
-
-
NonBlack Hispanic
White
2. Driving Population
-
-
-
-
-
-
-
NW
NonNW
Black Hispanic
no
White
Male
arrest
-
3. Search Disparities
-
-
-
-
-
-
-
-
-
-
-
-
-
-
-
-
-
-
-
NonNW
Black Hispanic
White
Male
4. Citations vs. Warnings
46
Overall
0
0
0
0
0
0
0
0
0
0
0
0
0
0
0
0
0
0
0
0
0
0
0
0
0
0
0
0
0
0
1. Resident Citations
Mt Wachusett CC
N. Brookfield
N. Reading
New Braintree
Newbury
Norwell
Norfolk
Otis
Oxford
Pembroke
Peru
Petersham
Phillipston
Plainfield
Plainville
Plympton
Princeton
Provincetown
Reading
Registry of MV
Rowe
Rutland
Sandisfield
Savoy
Sheffield
Shelburne
Somerville Housing Auth.
Southampton
State Fire Marshal
Swansea
-
-
-
-
-
-
-
-
-
-
-
-
-
-
-
-
-
-
-
-
-
-
Agencies with Minimal or NonNW
Black Hispanic
No Disparity
White
Male
Summary Table
-
-
-
-
-
-
-
-
-
-
-
-
NonBlack Hispanic
White
2. Driving Population
NW
NonNW
Black Hispanic
no
White
Male
arrest
-
3. Search Disparities
-
-
-
-
-
-
-
-
-
-
-
-
-
-
-
NonNW
Black Hispanic
White
Male
4. Citations vs. Warnings
47
Overall
0
0
0
0
0
0
0
0
0
0
0
0
0
0
0
0
0
0
0
0
0
0
0
0
0
0
0
0
0
0
1. Resident Citations
Templeton
Templeton Dev. Cent.
Tolland
Tufts University
Tyringham
Univ Of Mass Amherst
Univ Of Mass Boston
Univ Of Mass Dartmouth
Univ Of Mass Lowell
Univ Of Mass Worcester
Uxbridge
W. Boylston
W. Stockbridge
Wales
Warren
Washington
Westfield SC
Westford
Westhampton
Westminister
Westport
Whately
Williamsburg
Williamstown
Winchester
Worcester Co. Sheriff
Worthington
-
-
-
-
-
-
-
-
-
-
-
-
-
-
-
-
-
-
Agencies with Minimal or NonNW
Black Hispanic
No Disparity
White
Male
Summary Table
-
-
-
-
-
-
-
-
-
-
-
-
-
-
-
NonBlack Hispanic
White
2. Driving Population
-
-
-
-
-
NW
NonNW
Black Hispanic
no
White
Male
arrest
-
3. Search Disparities
-
-
-
-
-
-
-
-
-
-
-
-
-
-
-
-
NonNW
Black Hispanic
White
Male
4. Citations vs. Warnings
48
Overall
0
0
0
0
0
0
0
0
0
0
0
0
0
0
0
0
0
0
0
0
0
0
0
0
0
0
0
-
*
*
*
*
-
-
*
SP Other (All)
SP Troop A (All)
SP Troop B (All)
SP Troop C (All)
SP Troop D (All)
SP Troop E (All)
SP Troop F (All)
SP Troop H (All)
SP Troop I (All)
*
State Police (All)
-
-
-
-
-
-
-
*
*
*
*
*
-
*
*
*
*
-
*
*
*
*
*
*
*
*
*
*
*
*
*
Massachusetts State Police Units
Boston (All)
Boston Area A
Boston Area B
Boston Area C
Boston Area D
Boston Area E
Boston Area F
Boston Area G
Boston Area H
Boston Area J
Boston Area K
Boston Area L
Boston Special OPS
-
-
-
-
-
-
-
*
*
-
*
*
*
*
*
*
-
-
-
-
-
-
-
-
-
NonNW
Black Hispanic
White
Male
Boston Police Department Districts
Summary Table
1. Resident Citations
X
X
X
X
X
X
X
X
X
X
X
X
X
X
X
X
NA
*
NA
*
*
*
*
NA
*
-
NA
*
NA
*
*
NA
*
-
NA
*
NA
*
*
*
NA
*
-
NonBlack Hispanic
White
2. Driving Population
X
X
X
X
X
*
*
*
*
*
*
*
*
-
*
*
*
*
*
*
*
*
-
*
*
*
*
*
*
*
-
*
*
*
*
*
*
*
*
-
*
*
*
*
*
*
*
-
NW
NonNW
Black Hispanic
no
White
Male
arrest
*
*
*
*
*
*
*
*
*
*
*
*
*
*
*
*
*
-
3. Search Disparities
X
X
X
X
X
X
X
X
X
X
X
X
X
X
-
*
*
*
*
*
*
*
*
*
*
*
*
*
-
*
*
*
*
*
*
*
*
*
-
*
*
*
*
*
*
*
*
*
*
*
*
-
*
NonNW
Black Hispanic
White
Male
4. Citations vs. Warnings
X
X
X
X
X
X
X
X
X
X
X
X
X
X
1
1
2
3
3
4
2
3
49
Overall
3
2
3
2
3
2
2
1
3
2
2
2
2
Abington
Acton
Acushnet
Adams
Agawam
Amesbury
Amherst
AMTRAK
Andover
Aquinnah
Arlington
Ashburnham
Ashby
Ashfield
Ashland
Athol
Attleboro
Auburn
Avon
Ayer
B&M Railroad
Barnstable
Barre
Becket
Bedford
Belchertown
Bellingham
Belmont
Berkley
Agency
1.6
-1.2
-2
2
-1.1
0.2
3.3
0.3
1.8
-1.6
-2.2
-2.7
2.9
2.1
-1.1
0.5
1.3
-3
4.3
-2
-2.6
-0.3
-0.5
-0.5
1.5
-0.3
Non-White
Disparity
1. Traffic Citations to Residents
*
*
*
1.6
0.1
0.2
2.2
0.4
1.0
6.1
0.2
2.9
0.4
-0.2
-0.8
1.3
2.0
0.8
0.2
3.1
-0.6
5.4
-0.5
-0.7
0.1
1.6
-0.3
-0.1
1.9
*
*
*
*
*
*
*
*
*
*
Above
Above
Black
Median
Median
Disparity
(2.1)
(1.1)
1.5
1.1
-0.6
0.1
-0.2
1.1
2.3
1.1
-0.5
-0.8
-0.8
-0.4
5.7
1.2
-0.2
-0.2
0.1
0.7
2.6
-0.5
-0.8
-0.6
-0.7
0.4
-0.5
0.4
Hispanic
Disparity
*
*
*
*
2.2
0.4
-0.7
2.1
0.6
1.1
10.7
2.1
3.4
-0.4
-1.1
-1.6
5.2
2.7
0.7
0.6
3.3
1.6
5.3
-1.0
-1.1
0.6
0.7
0.6
1.5
1.0
Above
Non-White
Median
Male Disparity
(1.3)
*
*
*
*
*
*
*
*
*
Above
Median
(1.9)
50
-0.4
-1
0.4
-1.2
-1.4
-1.6
-0.6
23.2
0.7
4.2
-1.9
-1.3
0.7
-0.2
-11.3
-2.8
18.2
-0.3
-1.7
9.2
-5.3
2.1
4.2
1.3
-2.2
-1.7
-1.2
2
-0.1
Blackstone
Blandford
Bolton
Boston (All)
Bourne
Boxborough
Boxford
Boylston
Braintree
Brewster
Bridgewater
Bridgewater SC
Brimfield
Brockton
Brookfield
Brookline
Buckland
Bunker Hill CC
Burlington
Cambridge
Canton
Carlisle
Carver
Charlemont
Charlton
Chatham
Chelmsford
Non-White
Disparity
1. Traffic Citations to
Residents (continued)
Agency
Berlin
Bernardston
Beverly
Billerica
*
*
*
*
*
*
0.0
-0.5
-0.1
25.7
3.7
0.3
-0.3
1.0
2.6
0.1
-1.4
-0.5
25.4
0.3
0.4
-0.3
1.1
11.3
4.6
-0.2
0.2
-0.3
0.3
2.0
-0.1
*
*
*
*
*
*
*
Above
Above
Black
Median
Median
Disparity
(2.1)
(1.1)
-0.2
-0.1
1.3
*
-0.4
-0.2
-0.3
-0.6
4.6
-0.6
4.7
-0.7
-0.5
0.3
0.3
-2.7
-1.1
6.3
0.7
-1.3
-0.7
0.2
-1.1
0.6
-1.2
-0.7
-1.2
-0.5
1.0
-0.6
1.7
-0.4
0.5
0.6
Hispanic
Disparity
*
*
*
-0.3
-0.9
0.9
26.7
0.9
6.6
0.5
0.3
2.4
0.8
-6.6
-1.6
23.9
0.8
2.6
11.1
-1.4
8.1
3.0
0.0
-0.6
0.6
-0.1
2.6
1.2
Above
Non-White
Median
Male Disparity
(1.3)
*
0.8
-0.5
1.2
-0.1
*
*
*
*
*
*
*
*
*
Above
Median
(1.9)
51
1. Traffic Citations to
Residents (continued)
Agency
Chelsea
Cheshire
Chester
Chesterfield
Chicopee
Chilmark
Clarksburg
Clinton
Cohasset
Colrain
Concord
Conway
CSX
Cummington
Dalton
Danvers
Dartmouth
Dedham
Deerfield
Dennis
Dighton
Douglas
Dover
Dracut
Dudley
Dunstable
Duxbury
E. Bridgewater
E. Brookfield
E. Longmeadow
Eastham
-8.7
0.3
-1.9
-1.3
0.8
22.5
2.2
1.1
0.2
-1.8
-4.9
-1.9
-4.8
-0.9
-1.8
-7.8
2
-0.9
2.4
-1.3
-0.8
0.9
-1.9
0.3
-1.3
-1.2
-1.1
1.9
-1.3
-0.7
Non-White
Disparity
Above
Above
Black
Median
Median
Disparity
(2.1)
(1.1)
-0.5
1.5
*
-0.1
0.0
0.6
*
9.7
*
*
1.7
*
0.4
1.2
*
-0.1
-2.4
-0.1
-0.7
-0.1
0.2
0.9
3.2
*
0.5
*
4.0
*
0.8
0.3
-0.3
0.2
0.2
-0.2
0.6
0.7
3.3
*
-0.3
-1.2
-3.5
-0.3
-0.8
-0.1
1.6
-0.7
0.7
3.4
-0.5
-0.8
-2.5
-1.0
-1.8
-0.7
-0.5
-1.2
0.2
-0.2
0.4
-0.9
0.2
-1.1
0.4
1.5
-0.6
-0.6
-0.4
-0.8
0.2
0.7
Hispanic
Disparity
Above
Non-White
Median
Male Disparity
(1.3)
8.3
1.1
-1.2
-0.4
*
1.8
3.8
2.2
*
3.3
0.8
-0.6
-5.2
-1.0
-2.3
-0.1
-0.6
-4.0
3.6
0.8
3.5
0.0
-0.1
0.7
-0.3
*
1.2
-1.1
0.1
0.4
-0.6
-1.1
-0.2
*
*
*
*
*
Above
Median
(1.9)
*
52
1. Traffic Citations to
Residents (continued)
Agency
Easthampton
Easton
Edgartown
Egremont
Environmental PD
Erving
Essex
Everett
Fairhaven
Fall River
Falmouth
Ferneld State School
Fitchburg
Fitchburg SC
Foxborough
Framingham
Franklin
Freetown
Gardner
Georgetown
Gill
Gloucester
Goshen
Grafton
Granby
Granville
Greenfield
Groton
Groveland
Gt. Barrington
Hadley
0.4
-4.5
6.3
-0.3
-1.1
4.9
-1.9
0.4
4.8
20.9
2
7.8
-1.8
-2.4
1.3
1.1
0.0
1.4
-1.1
-3.7
-2.6
1.3
0
-0.9
0.5
-2.9
1.8
Non-White
Disparity
Above
Above
Black
Median
Median
Disparity
(2.1)
(1.1)
1.1
1.8
*
*
3.0
*
-0.2
-0.1
*
4.5
*
0.9
1.9
*
*
6.9
*
*
4.3
*
1.8
*
*
1.6
*
0.1
0.5
0.8
2.1
*
-0.2
1.0
0.0
-0.8
-0.4
-0.1
1.6
*
-0.4
0.5
-1.1
0.9
-0.1
-1.3
7.9
2.2
-0.8
6.6
-0.4
0.7
1.1
17.2
0.8
13.6
-0.7
-0.5
1.2
0.0
0.7
1.9
-0.6
-1.2
-1.1
-0.7
0.9
0.3
0.8
-0.3
0.4
Hispanic
Disparity
Above
Non-White
Median
Male Disparity
(1.3)
1.3
-2.0
*
6.0
*
1.2
0.1
*
8.6
-0.3
2.6
2.9
*
23.9
31.6
*
11.3
-0.4
-0.6
0.8
1.4
0.2
*
2.1
-0.7
-1.6
-1.2
-0.5
2.0
0.6
1.0
-0.4
1.8
*
*
*
*
*
*
*
*
*
Above
Median
(1.9)
53
1. Traffic Citations to
Residents (continued)
Agency
Halifax
Hamilton
Hampden
Hanover
Hanson
Hardwick
Harvard
Harwich
Hatfield
Haverhill
Heath
Hingham
Hinsdale
Holbrook
Holden
Holland
Holliston
Holyoke
Hopedale
Hopkinton
Hubbardston
Hudson
Hull
Huntington
Ipswich
Kingston
Lakeville
Lancaster
Lanesborough
Lawrence
Lee
0
-5.3
-1.3
-1.5
1.3
-0.9
-11.2
3
2.4
7.3
-1.3
-1
-0.1
0.2
-3.1
0.4
9.5
-1.1
-2.6
2.7
-0.4
-2.8
0.3
3.2
-1.6
9.2
-2.3
24.2
2
Non-White
Disparity
Above
Above
Black
Median
Median
Disparity
(2.1)
(1.1)
0.4
-0.4
-0.2
-0.3
3.3
*
0.9
-5.0
*
5.1
*
*
1.7
*
*
1.8
*
0.1
0.5
0.3
0.6
0.0
0.7
*
1.1
-0.5
-0.1
*
0.0
0.8
-0.4
1.2
*
*
2.0
*
0.9
*
11.8
*
-0.7
*
0.3
0.7
0.8
-0.3
-0.6
-0.2
-0.3
-0.8
-5.7
1.0
1.9
7.3
-0.4
-0.3
1.3
0.3
-1.0
1.1
10.0
0.6
-1.0
5.4
0.2
-1.2
-0.3
2.2
-0.7
-1.3
-0.4
26.0
2.2
Hispanic
Disparity
Above
Non-White
Median
Male Disparity
(1.3)
0.9
-2.4
-0.5
-0.2
1.7
0.1
-9.2
4.6
*
1.8
*
8.3
-0.2
-1.0
3.3
0.7
-1.6
1.8
*
18.2
-0.6
-0.8
*
5.2
0.5
-1.5
0.9
*
3.0
-0.1
8.7
-1.0
*
37.8
*
1.6
*
*
*
*
*
*
*
*
Above
Median
(1.9)
54
1. Traffic Citations to
Residents (continued)
Agency
Leicester
Lenox
Leominster
Leverett
Lexington
Leyden
Lincoln
Littleton
Longmeadow
Lowell
Ludlow
Lunenburg
Lynn
Lynnfield
MA Maritime Police
Malden
Manchester
Mansfield
Marblehead
Marion
Marlborough
Marshfield
Mashpee
Massasoit CC
Mattapoisett
Maynard
MBTA
Medfield
Medford
2.9
1.1
13.7
-3.6
4.5
-3.3
2.4
-0.9
17.6
-9.5
-1.5
19.6
-0.5
1.5
-0.5
-1.6
0
3.9
20.5
0.1
13.4
-0.2
11.7
-3.6
1
Non-White
Disparity
Above
Above
Black
Median
Median
Disparity
(2.1)
(1.1)
*
3.6
*
1.0
*
2.9
*
-0.3
*
0.3
-0.7
*
0.1
1.2
*
*
4.6
*
-2.1
0.5
*
5.7
*
1.1
5.4
*
-0.1
0.7
0.7
*
10.2
*
*
0.8
0.2
*
16.5
*
1.7
*
*
2.7
*
-0.6
1.6
*
0.4
0.1
12.6
-0.9
-0.7
-1.9
1.7
-0.6
10.2
-5.8
-0.4
15.8
-0.6
1.1
-0.2
-0.6
0.1
-0.4
25.0
1.2
-0.9
0.6
9.9
-0.7
2.4
Hispanic
Disparity
Above
Non-White
Median
Male Disparity
(1.3)
2.3
1.4
*
16.1
-1.0
3.1
-0.3
*
1.4
0.8
*
21.3
-7.7
0.2
*
22.1
1.4
7.4
-0.1
-0.1
0.2
7.1
*
19.8
1.3
10.9
1.6
*
9.1
-1.7
*
4.8
*
*
*
*
*
*
*
*
*
*
Above
Median
(1.9)
*
55
1. Traffic Citations to
Residents (continued)
Agency
Medway
Melrose
Mendon
Merrimac
Methuen
Metro Police Lwr. Basin
Metro Police Marine
Middleborough
Middleton
Milford
Millbury
Millis
Millville
Milton
Monroe
Monson
Montague
Monterey
Mt Wachusett CC
N. Adams
N. Andover
N. Attleboro
N. Brookfield
N. Reading
Nahant
Nantucket
Natick
Needham
New Bedford
New Braintree
New Marlborough
2.8
-1.9
1.9
-1
13.5
-0.9
-7.5
7.4
-0.5
1.7
-0.8
12.1
-0.5
2.9
-3.2
2.1
-1.9
-1.2
-0.8
-1.8
-2.4
3.8
-2.5
0.4
7
-1.2
-2.2
Non-White
Disparity
Above
Above
Black
Median
Median
Disparity
(2.1)
(1.1)
*
2.4
*
1.1
1.7
*
-0.2
*
0.5
1.6
*
0.2
*
1.3
*
1.2
*
1.5
*
-0.7
*
14.7
*
0.4
*
-0.3
-0.5
4.1
*
-0.3
0.9
-0.7
0.1
-0.3
*
2.0
*
-0.1
1.1
*
9.7
*
0.0
-1.0
1.3
-0.1
1.6
-0.6
14.6
-0.5
-7.3
9.2
-0.4
0.3
0.7
0.3
-0.5
3.9
-1.4
-0.1
0.4
0.6
-0.8
-0.7
-0.1
3.5
0.5
0.6
6.6
-0.5
-0.9
Hispanic
Disparity
Above
Non-White
Median
Male Disparity
(1.3)
3.1
-1.1
*
1.1
0.0
*
13.3
0.6
-8.2
*
7.5
0.6
2.4
0.5
13.8
0.6
*
4.0
-1.9
3.3
0.2
0.0
-0.4
-0.3
-0.7
*
7.8
-0.4
2.1
*
12.2
-0.8
-1.2
*
*
*
*
*
*
*
*
*
Above
Median
(1.9)
*
56
-4.0
-1
-0.5
-4
-14
-0.7
2.5
-2.3
1.4
-5
-1.4
1.5
2.1
2.3
1.8
2.2
-3.1
0.6
-1
3.7
5
4.0
-1.1
-2
-1.9
-3.3
4.8
-2.3
-3
0.1
Northampton
Northborough
Northbridge
Northfield
Norton
Norwell
Norwood
Oak Bluffs
Oakham
Orange
Orleans
Otis
Oxford
Palmer
Paxton
Peabody
Pelham
Pembroke
Pepperell
Peru
Petersham
Phillipston
Pittsfield
Plainfield
Plainville
Plymouth
Non-White
Disparity
1. Traffic Citations to
Residents (continued)
Agency
New Salem
Newbury
Newburyport
Newton
Norfolk
*
*
*
*
*
*
*
0.6
-0.2
2.0
1.2
2.4
-0.1
2.9
6.2
-0.4
1.6
0.0
-0.6
0.2
0.4
4.4
0.9
3.5
-0.5
-0.3
-0.2
-0.4
5.0
0.0
-0.7
0.7
*
*
*
*
*
*
*
*
*
Above
Above
Black
Median
Median
Disparity
(2.1)
(1.1)
-0.9
-0.2
0.5
-0.1
-5.3
2.0
2.5
-0.2
1.3
-0.3
-0.5
2.6
2.4
-0.6
1.8
3.2
-0.4
0.9
-0.2
1.2
6.6
-1.0
-0.1
-0.2
-0.2
-1.0
1.6
-0.9
-0.9
1.2
-0.6
-0.5
-0.4
-1.4
-6.3
Hispanic
Disparity
*
*
*
*
*
*
*
*
3.5
2.8
2.1
2.2
0.0
-0.7
1.9
5.9
3.3
2.5
3.1
-1.3
1.6
-0.6
3.3
5.9
4.4
-0.6
-0.8
-1.0
-1.5
5.9
-1.6
-1.3
1.1
Above
Non-White
Median
Male Disparity
(1.3)
-2.3
-0.2
0.2
-0.8
-13.0
*
*
*
*
*
*
*
*
*
*
*
*
Above
Median
(1.9)
57
1. Traffic Citations to
Residents (continued)
Agency
Plympton
Princeton
Provincetown
Quincy
Randolph
Raynham
Reading
Registry of MV
Rehoboth
Revere
Rochester
Rockland
Rockport
Rowe
Rowley
Royalston
Rutland
S. Hadley
Salem
Salisbury
Sandisfield
Sandwich
Saugus
Savoy
Scituate
Seekonk
Sharon
Sheffield
Shelburne
Sherborn
Shirley
-3
-2.6
-6.9
7.1
13.2
0.6
0.1
-0.6
2.4
-0.6
0.7
-0.7
0.1
3.6
-1.6
-3.5
13.1
0
-1.3
-0.7
1.5
-0.8
-1.6
-0.1
-0.8
-2.9
-10
Non-White
Disparity
Above
Above
Black
Median
Median
Disparity
(2.1)
(1.1)
-0.9
-0.2
-1.8
*
2.7
*
*
17.7
*
2.3
*
0.8
0.6
*
1.0
1.5
*
1.0
-0.2
0.7
*
0.0
0.9
0.4
*
2.2
*
0.7
0.8
0.0
3.4
*
0.6
1.9
*
0.7
-0.2
-0.4
-0.5
-0.4
-0.9
-1.1
2.4
1.0
-0.2
0.7
-0.4
2.5
0.5
1.6
0.9
-0.2
4.2
-1.0
-0.7
13.2
0.0
-0.7
-0.2
-0.2
0.1
-0.9
-0.2
1.3
0.3
-5.6
Hispanic
Disparity
Above
Non-White
Median
Male Disparity
(1.3)
-1.4
-1.2
-2.5
*
10.5
17.9
0.9
0.5
-0.2
*
5.4
1.3
*
1.9
0.0
0.1
*
4.2
0.1
1.2
*
12.8
0.8
-0.6
0.2
2.2
0.0
0.6
1.9
0.4
-0.8
-9.0
*
*
*
*
*
*
Above
Median
(1.9)
58
-0.4
-0.6
-1
5.7
-1.2
-0.8
4.6
-2.1
-1.1
22.3
4.4
1
2.7
1.4
3.7
-3.3
-2.2
0.1
5.8
0.7
0
-1.3
2.4
-0.4
-2.3
8.5
-3.1
0.3
Stow
Sturbridge
Sudbury
Sunderland
Sutton
Swampscott
Swansea
Taunton
Templeton
Templeton Dev. Cent.
Tewksbury
Tisbury
Tolland
Topsfield
Non-White
Disparity
1. Traffic Citations to
Residents (continued)
Agency
Shrewsbury
Shutesbury
Somerset
Somerville
Somerville Housing Auth.
Southampton
Southborough
Southbridge
Southwick
Spencer
Springfield
State Fire Marshal
State Police (All)
Sterling
Stockbridge
Stoneham
Stoughton
*
*
*
-0.4
0.0
1.0
3.2
1.8
0.3
0.4
4.1
0.7
-0.2
3.1
-0.6
0.2
*
*
*
*
Above
Above
Black
Median
Median
Disparity
(2.1)
(1.1)
1.5
*
4.7
*
0.5
*
5.1
*
-0.2
0.0
*
1.8
*
0.3
-0.1
*
12.5
*
*
4.3
*
0.4
*
-0.9
-0.7
*
4.4
*
-0.2
-0.6
0.1
1.4
-0.2
0.5
-0.5
1.3
-0.7
-0.6
9.9
-1.2
0.2
2.3
-1.5
-0.2
10.1
-0.1
0.6
5.2
-1.2
-0.2
12.2
2.7
1.3
4.4
5.1
2.9
Hispanic
Disparity
*
*
-0.9
-0.7
1.3
8.8
1.9
0.7
-0.4
4.7
0.0
-1.2
10.7
-1.9
1.7
Above
Non-White
Median
Male Disparity
(1.3)
*
1.6
-0.4
-0.2
*
11.9
-0.1
1.1
*
9.9
-0.9
-0.1
*
27.9
*
0.5
*
4.8
*
3.4
*
5.8
*
*
*
*
*
*
*
*
*
Above
Median
(1.9)
59
1. Traffic Citations to
Residents (continued)
Agency
Townsend
Truro
Tufts University
Tyngsborough
Tyringham
Univ Of Mass Amherst
Univ Of Mass Boston
Univ Of Mass Dartmouth
Univ Of Mass Lowell
Univ Of Mass Worcester
Upton
Uxbridge
W. Boylston
W. Bridgewater
W. Brookfield
W. Newbury
W. Springfield
W. Stockbridge
W. Tisbury
Wakefield
Wales
Walpole
Waltham
Ware
Wareham
Warren
Warwick
Washington
Watertown
Wayland
Webster
0.4
-2.5
-1.8
-3.9
-0.3
-1
-11.7
4.1
-2
-0.4
-0.5
-2.1
-1.6
-2
-1.8
-2.1
9.8
0.2
2.9
-2.4
11.8
-0.7
0.8
1.9
2.8
Non-White
Disparity
Above
Above
Black
Median
Median
Disparity
(2.1)
(1.1)
1.7
*
0.5
-0.1
-0.4
0.6
0.4
-5.7
*
2.3
*
-0.2
0.3
0.8
-0.2
1.0
0.5
-0.4
-0.8
*
5.1
*
1.5
*
*
11.5
*
-0.4
*
14.3
*
0.0
1.4
*
2.3
*
*
1.9
*
-0.3
-0.9
-1.0
-0.4
-0.6
0.2
-5.5
2.4
-0.7
0.1
0.8
-0.7
-0.5
-0.5
-0.4
-0.5
8.7
0.3
-0.5
-0.5
-0.5
-0.5
0.4
1.1
2.4
Hispanic
Disparity
Above
Non-White
Median
Male Disparity
(1.3)
1.0
0.7
0.3
-1.8
0.0
-0.2
-11.2
*
2.7
-1.1
-0.7
2.1
-0.7
0.4
-0.5
-0.6
-1.5
*
13.3
0.4
6.6
-1.0
13.4
-0.8
2.1
2.8
*
3.9
*
*
*
*
*
*
*
*
Above
Median
(1.9)
60
1. Traffic Citations to
Residents (continued)
Agency
Wellesley
Wellfleet
Wendell
Wenham
Westborough
Westfield
Westfield SC
Westford
Westhampton
Westminister
Weston
Westport
Westwood
Weymouth
Whately
Whitman
Wilbraham
Williamsburg
Williamstown
Wilmington
Winchendon
Winchester
Windsor
Winthrop
Woburn
Worcester
Worcester Co. Sheriff
Worthington
Wrentham
Yarmouth
-3.5
2
0.3
-2.7
-1.1
-1.7
-0.5
-1.3
0.3
-4.1
-1.2
-3.8
3.1
-2.5
-0.1
-1.6
-0.4
-6.5
-1
-0.5
-1.4
-0.9
1.9
-0.5
13
-2.3
0.4
2.6
Non-White
Disparity
Above
Above
Black
Median
Median
Disparity
(2.1)
(1.1)
-0.5
4.1
*
0.9
-0.5
0.2
0.5
0.7
0.0
0.2
0.4
0.7
-0.4
*
1.3
*
-0.7
0.5
0.1
0.7
-0.4
0.4
1.6
*
0.0
0.0
1.0
2.1
*
*
8.7
*
-0.1
0.6
*
3.3
*
-1.1
0.1
-1.4
-0.5
4.1
-0.6
0.1
-0.5
-0.1
0.2
-0.6
-0.8
3.6
-1.1
0.5
-0.6
-0.1
-1.9
0.4
-0.1
-0.8
0.0
2.1
1.6
7.0
-0.9
1.1
1.5
Hispanic
Disparity
Above
Non-White
Median
Male Disparity
(1.3)
0.9
2.9
2.5
-1.2
*
1.7
0.3
1.1
-0.7
-0.5
-1.4
-0.3
-1.8
*
3.7
-1.8
0.6
-0.5
0.4
-1.1
0.1
0.8
0.9
-0.3
*
2.3
*
1.6
*
15.7
-1.3
1.8
*
3.3
*
*
*
*
*
*
Above
Median
(1.9)
61
Non-White
Disparity
4.4
NA
5.1
5.8
5.9
3.9
NA
NA
3.6
NA
0.60
4.39
-0.50
2.1
State Police
State Police (All)
SP Other (All)
SP Troop A (All)
SP Troop B (All)
SP Troop C (All)
SP Troop D (All)
SP Troop E (All)
SP Troop F (All)
SP Troop H (All)
SP Troop I (All)
Average Overall
Average Positive
Median Overall
Positive Median
Boston Police Department Districts
Boston (All)
23.2
Boston Area A
1.2
Boston Area B
15.4
Boston Area C
-1.3
Boston Area D
18.9
Boston Area E
20.0
Boston Area F
20.6
Boston Area G
-4.1
Boston Area H
22.2
Boston Area J
25.6
Boston Area K
0.3
Boston Area L
22.8
Boston Special OPS
NA
1. Traffic Citations to
Residents (continued)
Agency
*
*
*
*
*
*
*
*
*
*
*
*
*
*
*
*
1.3
2.4
0.5
1.1
25.2
4.2
21.5
7.0
26.4
13.1
16.9
0.9
29.0
13.2
1.9
18.0
NA
*
*
*
*
*
*
*
*
*
*
*
Above
Above
Black
Median
Median
Disparity
(2.1)
(1.1)
0.9
3.0
-0.1
1.3
4.5
2.9
6.0
-2.5
0.7
10.3
4.4
0.8
2.0
16.7
1.1
39.9
NA
Hispanic
Disparity
*
*
*
*
*
*
*
*
2.2
4.4
0.7
1.9
NA
NA
NA
NA
NA
NA
NA
NA
NA
NA
NA
NA
NA
Above
Non-White
Median
Male Disparity
(1.3)
Above
Median
(1.9)
62
4
7,283
93
2,901
1,056
723
380
1,145
929
12,249
4,948
1,754
2,704
68
8,342
462
301
3,298
2,114
3,377
4,767
AMTRAK
Andover+
Aquinnah
Arlington
Ashburnham
Ashby
Ashfield
Ashland
Athol
Attleboro
Auburn
Avon
Ayer
B&M Railroad
Barnstable
Barre
Becket
Bedford
Belchertown
Bellingham
Belmont
4.1
-0.1
2.7
0.4
2.1
4.9
2.4
10.6
-28.8
6.5
3.9
7.1
-0.9
5.4
2.7
-1.1
6.7
29.9
-1.7
5.0
-1.5
3.4
3.2
-1.4
1.8
-2.2
Non-White
Disparity
*
*
*
*
*
*
*
*
*
*
*
Above Median
(3.2)
5.4
-0.1
1.6
0.4
2.3
2.5
3.1
0.6
7.5
5.2
1.8
3.4
-0.3
2.1
1.6
1.4
2.9
25.2
-0.6
5.2
1.5
4.9
3.4
-0.2
1.4
4.0
Black
Disparity
*
*
*
*
*
*
*
*
*
*
*
*
*
*
Above Median
(1.8)
1.9
1.0
1.5
0.3
-1.0
3.0
1.1
13.1
3.8
3.0
3.0
3.2
0.1
7.7
1.9
0.2
3.7
7.9
1.8
2.8
1.1
0.9
0.3
0.4
1.6
-1.4
Hispanic
Disparity
*
*
*
*
*
*
*
*
*
*
*
*
Above Median
(1.7)
*
Denotes that the agency presented Northeastern University with road survey data that differed from the Northeastern University driving population estimate used in this report.
1,941
3,547
996
949
2,003
3,963
2,323
Abington
Acton
Acushnet
Adams
Agawam
Amesbury
Amherst
+
Number
Agency
2. Driving Population Estimate
63
Number
980
1,182
317
4,022
5,418
2,174
61
653
136,608
1,327
1,301
582
1,079
2,840
763
3,745
351
730
16,098
1,955
18,552
345
146
5,445
11,505
3,551
903
539
547
2,481
1,424
3,268
Agency
Berkley
Berlin
Bernardston
Beverly
Billerica
Blackstone
Blandford
Bolton
Boston (All)
Bourne
Boxborough
Boxford
Boylston
Braintree
Brewster
Bridgewater
Bridgewater SC
Brimfield
Brockton
Brookfield
Brookline
Buckland
Bunker Hill CC
Burlington
Cambridge
Canton
Carlisle
Carver
Charlemont
Charlton
Chatham
Chelmsford
2. Driving Population Estimate
Non-White
Disparity
-3.6
14.0
3.4
-1.4
2.2
1.4
-1.6
11.0
16.8
0.3
4.9
-0.7
22.3
3.4
0.6
-5.6
1.2
11.6
1.3
1.2
-0.4
NA
-6.0
1.7
3.6
0.9
-0.2
-1.8
7.6
2.1
9.5
*
*
*
*
*
*
*
*
*
*
*
Above Median
(3.2)
Black
Disparity
0.4
2.6
2.4
0.5
-0.1
1.0
-0.5
3.0
18.3
3.7
2.2
-0.1
5.8
4.8
0.9
2.5
0.7
18.4
1.4
4.7
0.6
NA
-0.1
6.8
5.1
1.5
2.0
1.0
2.0
1.9
2.7
*
*
*
*
*
*
*
*
*
*
*
*
*
*
*
*
*
Above Median
(1.8)
Hispanic
Disparity
-0.9
11.6
0.9
0.4
2.7
0.9
-0.3
7.5
2.6
-0.5
6.5
1.1
16.6
1.2
0.9
-1.2
1.5
3.7
1.0
0.0
1.0
NA
-0.6
0.4
1.1
0.1
-0.1
-1.0
6.3
1.4
3.4
*
*
*
*
*
*
*
*
*
Above Median
(1.7)
64
+
9,957
486
460
442
6,513
129
219
893
1,308
178
5,889
184
1
232
1,053
4,972
2,897
5,224
902
3,160
381
1,795
527
1,597
1,524
1,094
876
2,881
681
1,095
Number
Non-White
Disparity
-10.5
3.6
4.0
-0.2
6.4
12.2
1.9
3.9
2.4
-0.7
-0.1
-0.8
-1.4
-0.2
-1.8
-4.3
8.4
0.3
4.0
0.4
3.7
4.4
3.6
5.3
3.3
-1.2
0.7
5.3
5.0
*
*
*
*
*
*
*
*
*
*
*
*
*
*
Above Median
(3.2)
Black
Disparity
1.1
3.5
1.2
0.5
2.5
5.1
0.8
2.4
2.1
-0.1
0.1
0.4
0.6
0.8
0.5
3.8
8.8
1.0
4.9
1.2
1.1
1.6
2.0
1.6
1.9
0.4
2.7
3.2
4.3
*
*
*
*
*
*
*
*
*
*
*
*
*
Above Median
(1.8)
Hispanic
Disparity
-6.8
0.3
3.8
-0.1
5.2
5.5
0.7
3.9
0.4
-0.8
0.6
-1.0
-0.5
-0.2
0.2
-1.0
2.6
0.2
1.1
0.4
2.6
4.4
4.2
4.3
2.1
0.3
0.4
0.8
1.5
*
*
*
*
*
*
*
*
*
*
Above Median
(1.7)
Denotes that the agency presented Northeastern University with road survey data that differed from the Northeastern University driving population estimate used in this report.
Chelsea
Cheshire
Chester
Chesterfield
Chicopee
Chilmark
Clarksburg
Clinton
Cohasset
Colrain
Concord
Conway
CSX
Cummington
Dalton
Danvers
Dartmouth
Dedham+
Deerfield
Dennis
Dighton
Douglas
Dover
Dracut
Dudley
Dunstable
Duxbury
E. Bridgewater
E. Brookfield
E. Longmeadow
Agency
2. Driving Population Estimate
65
Number
3,316
1,922
1,747
511
1,338
2,050
1,076
1,194
8,007
1,862
22,681
3,715
4
3,515
1
1,114
9,883
2,725
2,791
2,815
863
1,320
2,088
424
1,029
1,271
161
2,672
1,087
2,563
1,076
Agency
Eastham
Easthampton
Easton
Edgartown
Egremont
Environmental PD
Erving
Essex
Everett
Fairhaven
Fall River
Falmouth
Ferneld State School
Fitchburg
Fitchburg SC
Foxborough
Framingham
Franklin
Freetown
Gardner
Georgetown
Gill
Gloucester
Goshen
Grafton
Granby
Granville
Greenfield
Groton
Groveland
Gt. Barrington
2. Driving Population Estimate
Non-White
Disparity
2.0
-1.7
0.1
8.5
0.7
NA
1.2
-1.4
6.1
-0.1
-3.2
4.5
NA
14.2
NA
1.4
3.1
-2.2
0.4
-2.1
6.1
3.2
1.2
3.4
-2.7
5.1
2.7
-1.3
-0.1
5.4
-2.8
*
*
*
*
*
*
*
*
Above Median
(3.2)
Black
Disparity
0.8
0.6
6.1
4.3
0.9
NA
0.9
0.2
5.8
2.6
1.6
6.5
NA
3.3
NA
2.9
0.8
-0.3
3.5
0.3
2.7
1.9
1.1
2.4
0.3
2.9
3.6
1.2
0.4
1.1
-0.9
*
*
*
*
*
*
*
*
*
*
*
*
*
Above Median
(1.8)
Hispanic
Disparity
1.0
-0.9
0.0
8.5
0.4
NA
0.8
-0.1
5.6
0.4
-1.5
1.1
NA
12.3
NA
0.3
8.7
0.1
-0.3
-0.8
4.4
1.4
1.7
0.8
-0.9
2.5
-0.7
-0.2
0.7
4.2
-0.5
*
*
*
*
*
*
*
Above Median
(1.7)
66
Number
1,494
874
1,095
1,291
3,558
2,521
394
557
1,828
596
6,688
5
2,907
795
655
2,222
446
1,699
6,710
975
2,871
1,102
2,118
2,365
215
1,081
1,186
1,535
1,460
547
15,024
Agency
Hadley
Halifax
Hamilton
Hampden
Hanover
Hanson
Hardwick
Harvard
Harwich
Hatfield
Haverhill
Heath
Hingham
Hinsdale
Holbrook
Holden
Holland
Holliston
Holyoke
Hopedale
Hopkinton
Hubbardston
Hudson
Hull
Huntington
Ipswich
Kingston
Lakeville
Lancaster
Lanesborough
Lawrence
2. Driving Population Estimate
Non-White
Disparity
8.6
1.4
-4.9
2.9
-2.7
2.6
0.0
-4.3
3.9
9.6
4.2
17.4
0.7
-0.5
1.7
1.9
-1.1
10.6
1.4
6.3
3.5
2.2
5.4
2.7
3.2
-2.1
2.2
2.5
-1.2
4.6
23.1
*
*
*
*
*
*
*
*
*
*
Above Median
(3.2)
*
Black
Disparity
3.2
1.2
-0.4
2.1
-0.2
2.7
1.1
-1.4
4.8
3.2
1.4
0.0
0.0
0.2
3.9
2.1
0.9
0.5
1.1
1.4
1.5
0.9
0.3
2.4
1.9
0.2
1.5
3.1
2.3
3.7
0.3
*
*
*
*
*
*
*
*
*
*
*
Above Median
(1.8)
*
Hispanic
Disparity
2.8
0.9
0.1
0.9
0.3
1.3
-0.3
-1.8
1.9
6.8
5.1
19.3
3.0
0.2
0.9
1.2
-0.1
12.0
2.2
5.6
3.3
1.7
8.4
1.3
2.5
-0.8
3.1
0.9
-1.1
1.1
25.1
*
*
*
*
*
*
*
*
*
*
*
*
*
Above Median
(1.7)
*
67
Non-White
Disparity
0.4
10.5
3.5
14.5
-2.8
1.7
-1.1
-1.1
5.5
1.9
12.2
-7.6
9.4
12.7
2.3
NA
-3.2
1.8
-2.2
1.6
7.3
15.9
-2.5
9.6
NA
6.5
8.2
NA
0.0
2.4
*
*
*
*
*
*
*
*
*
*
*
*
Above Median
(3.2)
Black
Disparity
1.8
4.8
3.3
3.3
0.6
1.6
-0.4
-0.5
2.0
2.0
3.6
-1.2
2.8
4.1
1.8
NA
3.0
0.5
0.7
0.7
12.2
1.4
-0.8
11.7
NA
5.2
1.2
NA
1.5
2.4
*
*
*
*
*
*
*
*
*
*
*
*
*
Above Median
(1.8)
Hispanic
Disparity
-0.7
6.7
1.1
13.5
-1.1
0.7
0.1
1.3
3.2
1.7
7.6
-5.0
7.9
11.8
3.9
NA
1.3
0.9
-0.3
3.0
0.6
19.3
0.7
0.6
NA
2.9
7.4
NA
1.3
2.6
*
*
*
*
*
*
*
*
*
*
*
*
Above Median
(1.7)
Denotes that the agency presented Northeastern University with road survey data that differed from the Northeastern University driving population estimate used in this report
2,035
2,153
2,012
3,891
1,010
4,716
196
2,625
3,687
1,194
12,884
1,397
1,106
21,641
751
5
4,999
1,398
3,027
1,311
528
9,531
2,974
1,571
460
952
3,336
1,477
424
6,515
Lee
Leicester
Lenox
Leominster
Leverett
Lexington
Leyden
Lincoln
Littleton
Longmeadow
Lowell
Ludlow
Lunenburg
Lynn
Lynnfield
MA Maritime Police
Malden
Manchester
Mansfield
Marblehead
Marion+
Marlborough
Marshfield
Mashpee
Massasoit CC
Mattapoisett
Maynard
MBTA
Medfield
Medford
+
Number
Agency
2. Driving Population Estimate
68
Non-White
Disparity
6.2
0.1
2.0
5.5
29.1
NA
NA
-1.2
-1.1
3.8
5.9
2.9
2.0
40.3
0.0
1.4
2.6
-1.1
NA
1.8
8.8
-0.3
-0.3
0.0
6.3
1.5
5.6
2.4
5.1
0.8
*
*
*
*
*
*
*
*
*
Above Median
(3.2)
*
Black
Disparity
1.8
1.9
1.2
0.9
1.5
NA
NA
1.5
0.8
1.7
4.1
1.3
-0.1
37.9
0.0
1.0
1.6
0.8
NA
3.1
1.4
0.4
1.0
0.9
5.1
0.2
2.2
1.7
7.7
1.3
*
*
*
*
*
*
*
Above Median
(1.8)
Hispanic
Disparity
5.6
0.6
2.3
3.9
29.7
NA
NA
-0.2
0.5
5.4
3.1
1.7
2.0
5.5
0.0
0.8
2.6
-0.8
NA
0.0
9.6
1.4
-0.2
0.7
3.4
3.0
6.1
3.2
5.2
0.2
*
*
*
*
*
*
*
*
*
*
*
*
*
*
*
Above Median
(1.7)
Denotes that the agency presented Northeastern University with road survey data that differed from the Northeastern University driving population estimate used in this report
1,226
1,524
3,717
641
4,552
38
4
4,789
1,939
2,041
1,511
1,153
491
2,160
2
1,111
651
633
2
1,735
5,031
6,457
397
767
1,016
1,263
10,734
1,695
7,731
150
Medway
Melrose
Mendon
Merrimac
Methuen
Metro Police Lwr. Basin
Metro Police Marine
Middleborough
Middleton
Milford
Millbury
Millis
Millville
Milton+
Monroe
Monson
Montague
Monterey
Mt Wachusett CC
N. Adams
N. Andover
N. Attleborough
N. Brookfield
N. Reading
Nahant
Nantucket
Natick
Needham
New Bedford
New Braintree
+
Number
Agency
2. Driving Population Estimate
69
New Marlborough
New Salem
Newbury
Newburyport
Newton
Norfolk
Northampton
Northborough
Northbridge
Northfield
Norton
Norwell
Norwood
Oak Bluffs
Oakham
Orange
Orleans
Otis
Oxford
Palmer
Paxton
Peabody
Pelham
Pembroke
Pepperell
Peru
Petersham
Phillipston
Pittsfield
Plainfield
Plainville
Agency
2. Driving Population Estimate
12
771
1,088
3,197
9,789
733
4,159
2,411
1,222
1,799
1,296
1,413
3,986
1,969
332
538
1,240
282
1,186
2,564
973
7,591
1,365
897
1,147
95
709
476
3,853
12
1,381
Number
Non-White
Disparity
6.1
7.3
2.7
-0.9
-3.8
-10.1
-2.5
8.4
0.1
2.9
-4.2
-0.8
-2.9
-1.2
3.2
2.9
2.4
0.8
1.7
-1.6
1.4
8.4
2.5
1.0
1.3
-0.8
0.2
0.5
4.2
-2.3
-1.9
*
*
*
Above Median
(3.2)
*
*
Black
Disparity
7.3
2.6
1.4
0.6
0.1
-4.2
0.5
3.4
2.0
1.6
2.2
1.0
1.4
2.1
1.4
2.1
1.5
1.2
1.6
0.5
2.1
1.8
1.8
0.4
0.6
0.9
1.3
0.3
4.3
0.0
0.3
*
*
*
*
*
*
*
Above Median
(1.8)
*
*
Hispanic
Disparity
-0.9
2.3
1.2
-0.6
-0.8
-4.1
-0.2
6.4
-0.1
0.9
0.2
1.2
0.2
3.9
1.8
1.7
1.9
1.0
1.3
-1.1
0.6
9.5
-0.6
0.9
1.9
-0.2
0.1
1.3
1.1
-0.9
0.1
*
*
*
*
*
*
*
Above Median
(1.7)
70
2.4
7.2
5.7
-2.9
1.1
1.3
-2.8
-1.7
1.9
0.5
1.6
Non-White
Disparity
1.0
-0.3
1.4
-7.4
6.4
11.9
1.5
0.4
NA
7.9
10.4
1.7
-2.0
1.1
-1.4
4.6
0.5
0.9
*
*
*
*
*
*
*
Above Median
(3.2)
1.6
2.0
2.8
-0.6
2.3
1.9
-0.8
1.3
3.7
2.3
1.2
Black
Disparity
1.4
0.0
1.1
-3.2
4.7
17.0
3.2
1.2
NA
4.0
5.2
2.7
0.5
0.3
0.0
1.2
0.0
0.8
*
*
*
*
*
*
*
*
*
*
*
*
Above Median
(1.8)
3.4
8.2
3.9
-0.8
0.2
1.4
-0.6
-0.7
0.6
1.8
0.7
Hispanic
Disparity
1.5
1.1
1.1
-0.7
1.3
1.5
0.7
0.8
NA
4.2
7.5
1.2
1.1
2.0
-1.4
3.6
0.5
0.8
Department disagrees with NU driving population estimate based on independent road surveys of the driving population conducted by the department
1,578
8,987
2,394
18
974
2,973
70
638
4,068
1,770
1,408
S. Hadley
Salem
Salisbury
Sandisfield
Sandwich
Saugus
Savoy
Scituate
Seekonk
Sharon
Sheffield
+
3,668
956
1,011
707
3,069
4,433
1,889
909
1
1,950
5,621
771
3,629
413
3
1,442
180
603
Number
Plymouth
Plympton
Princeton
Provincetown
Quincy
Randolph+
Raynham
Reading
Registry of MV
Rehoboth
Revere
Rochester
Rockland
Rockport
Rowe
Rowley
Royalston
Rutland
Agency
2. Driving Population Estimate
*
*
*
*
*
*
*
*
Above Median
(1.7)
71
Non-White
Disparity
-0.3
4.9
-2.4
9.9
-1.4
-0.4
6.1
NA
-1.2
12.0
-1.5
0.8
-1.2
18.1
NA
7.0
10.2
0.2
-1.0
4.1
3.1
2.9
5.7
-2.4
13.0
11.0
-3.1
2.1
0.1
NA
*
*
*
*
*
*
*
*
*
*
*
Above Median
(3.2)
Black
Disparity
0.4
2.0
2.1
5.5
2.6
1.6
5.5
NA
-0.5
1.8
1.9
1.0
0.0
9.6
NA
3.0
2.9
-0.2
0.2
7.0
0.9
1.7
0.6
1.6
6.2
4.0
0.3
4.9
1.1
NA
*
*
*
*
*
*
*
*
*
*
*
*
*
Above Median
(1.8)
Hispanic
Disparity
0.5
5.4
-0.6
8.2
-0.8
-0.2
7.7
NA
0.2
12.2
-0.7
0.7
-0.3
10.7
NA
3.8
7.5
0.4
1.7
1.5
3.0
2.3
7.1
0.5
6.1
9.1
-1.2
0.7
-0.3
NA
*
*
*
*
*
*
*
*
*
*
*
*
Above Median
(1.7)
Denotes that the agency presented Northeastern University with road survey data that differed from the Northeastern University driving population estimate used in this report
773
1,805
610
6,528
363
2,636
8,078
19
679
2,007
2,627
877
2,522
19,523
27
358,777
1,551
119
863
4,129
625
4,415
2,756
1,070
1,609
1,648
2,991
3,244
847
3
Shelburne
Sherborn
Shirley
Shrewsbury+
Shutesbury
Somerset
Somerville
Somerville Housing Auth.
Southampton
Southborough
Southbridge
Southwick
Spencer
Springfield
State Fire Marshal
State Police (All)
Sterling
Stockbridge
Stoneham
Stoughton
Stow
Sturbridge
Sudbury
Sunderland
Sutton
Swampscott+
Swansea
Taunton
Templeton
Templeton Dev. Cent.
+
Number
Agency
2. Driving Population Estimate
72
Tewksbury
Tisbury
Tolland
Topsfield
Townsend
Truro
Tufts University
Tyngsborough
Tyringham
Univ Of Mass Amherst
Univ Of Mass Boston
Univ Of Mass Dartmouth
Univ Of Mass Lowell
Univ Of Mass Worcester
Upton
Uxbridge
W. Boylston
W. Bridgewater
W. Brookfield
W. Newbury
W. Springfield
W. Stockbridge
W. Tisbury
Wakefield
Wales
Walpole
Waltham
Ware
Wareham
Warren
Warwick
Washington
Agency
2. Driving Population Estimate
2,975
1,195
50
1,721
1,704
1,596
13
1,741
88
2,287
263
209
177
148
1,810
726
1,856
3,253
1,115
1,343
3,076
956
372
1,442
78
2,188
6,246
2,363
3,289
278
108
90
Number
Non-White
Disparity
2.7
5.5
0.9
0.3
2.6
6.1
6.9
-2.8
3.7
0.1
-1.6
11.9
5.2
3.9
2.4
1.2
4.0
-1.7
-1.8
-0.1
4.2
3.1
1.3
0.1
1.2
-0.7
*
*
*
*
*
*
*
*
*
Above Median
(3.2)
Black
Disparity
0.6
2.4
1.4
-0.1
1.7
2.1
2.2
0.7
1.8
1.0
-1.3
8.3
2.5
0.5
2.0
1.5
4.4
1.1
-0.4
-0.1
3.3
2.9
9.0
1.0
1.9
0.0
*
*
*
*
*
*
*
*
*
*
*
Above Median
(1.8)
Hispanic
Disparity
2.8
7.9
0.8
1.9
2.3
2.7
2.4
-0.4
2.5
0.8
0.8
5.8
1.2
3.7
2.7
0.1
1.1
0.1
-0.4
2.0
3.9
0.8
-0.9
0.2
-0.5
-0.5
*
*
*
*
*
*
*
*
*
*
Above Median
(1.7)
*
*
73
Non-White
Disparity
6.1
5.1
3.3
3.5
2.1
-1.6
2.5
2.9
-2.9
0.9
0.3
2.5
4.7
-1.2
-1.3
-2.6
1.3
3.7
2.4
1.5
-3.7
2.0
0.0
-1.3
3.2
4.7
-2.6
1.9
*
*
*
Above Median
(3.2)
*
*
*
*
Black
Disparity
3.9
1.1
1.9
3.3
1.8
0.8
0.9
2.2
0.7
1.0
0.3
1.5
2.7
0.9
1.9
0.1
0.5
3.0
2.9
1.3
0.3
1.1
1.8
1.5
2.2
1.8
0.9
4.4
*
*
*
*
*
*
*
*
*
Above Median
(1.8)
*
Hispanic
Disparity
2.4
6.5
2.3
3.0
1.5
-1.4
2.3
5.2
-1.8
1.7
0.4
1.4
6.9
-0.4
-0.2
0.9
0.8
3.0
0.7
0.4
-1.1
2.8
-0.1
0.3
1.0
5.0
0.4
0.9
Department disagrees with NU driving population estimate based on independent road surveys of the driving population conducted by the department
17,972
1,301
1,202
7,060
1,848
135
917
3,614
6,112
159
3,611
573
2,008
2,787
2,527
612
8,175
1,290
5,502
2,380
1,622
1,234
4,235
931
1,113
315
1,488
8,103
24,195
Watertown+
Wayland
Webster
Wellesley
Wellfleet
Wendell
Wenham
Westborough
Westfield
Westfield SC
Westford
Westhampton
Westminister
Weston
Westport
Westwood
Weymouth
Whately
Whitman
Wilbraham
Williamsburg
Williamstown
Wilmington
Winchendon
Winchester
Windsor
Winthrop
Woburn
Worcester
+
Number
Agency
2. Driving Population Estimate
*
*
*
*
*
*
Above Median
(1.7)
*
*
*
*
74
7.0
9.4
5.9
7.3
-0.5
4.0
NA
10.5
NA
NA
358,777
50,555
45,477
61,304
45,683
89,204
623
44,882
41
21,012
Massachusetts State Police Units
Daytime Citations Only 6 A.M.-8:00 P.M
State Police (All)
SP Troop A (All)
SP Troop B (All)
SP Troop C (All)
SP Troop D (All)
SP Troop E (All)
SP Troop F (All)
SP Troop H (All)
SP Troop I (All)
SP Other (All)
Non-White
Disparity
0.1
9.8
4.1
2.6
4.8
1.8
3.2
341
169
1,552
3,169
Number
Average Overall
Average Positive
Median Overall
Median Positive
Worcester Co. Sheriff
Worthington
Wrentham
Yarmouth
Agency
2. Driving Population Estimate
*
*
*
*
*
*
*
Above Median
(3.2)
3.0
2.6
-0.3
1.4
0.0
3.5
NA
6.2
NA
NA
2.3
2.6
1.6
1.8
Black
Disparity
1.1
5.6
5.0
*
*
*
*
*
*
Above Median
(1.8)
3.8
6.2
6.1
5.4
0.0
1.3
NA
4.6
NA
NA
2.2
3.1
1.1
1.7
Hispanic
Disparity
0.3
4.2
1.7
*
*
*
*
*
*
Above Median
(1.7)
75
Agency
Statewide
Abington
Acton
Acushnet
Adams
Agawam
Amesbury
Amherst
AMTRAK
Andover
Aquinnah
Arlington
Ashburnham
Ashby
Ashfield
Ashland
Athol
Attleboro
Auburn
Avon
Ayer
B&M Railroad
Barnstable
Barre
Becket
Bedford
Belchertown
Bellingham
Belmont
Berkley
Berlin
NonTotal
White
Searched % Diff
19,506
0.5
71
1.01
45
0.67
22
1.92
21
-0.39
27
0.73
122
5.34
12
0.38
0
NA
138
-1.29
0
NA
24
0.09
5
5.30
14
6.19
5
-1.40
20
1.23
40
0.71
78
0.63
56
1.60
14
-0.35
18
0.99
1
-1.82
136
2.31
4
-0.96
2
6.77
66
0.28
13
1.29
73
-1.32
28
0.36
18
-1.93
10
0.03
3. Search Disparities
NonWhite
Ratio
1.4
1.26
1.53
1.85
0.84
1.55
2.79
1.79
NA
0.45
NA
1.11
21.97
5.46
0.00
1.68
1.16
2.06
2.37
0.71
2.64
0.00
2.53
0.00
19.21
1.14
2.37
0.62
1.58
0.00
1.04
Black
Sig Diff in %
*
0.7
-0.2
IC
0.4
IC
3.6
IC
0.4
IC
2.6
*
3.0
IC
0.1
IC
NA
-0.6
IC
NA
IC
-0.4
IC
10.3
IC
10.6
IC
-1.4
IC
-1.8
IC
0.8
*
1.1
*
2.4
IC
0.0
IC
1.2
IC
-1.9
*
4.1
IC
-1.0
IC
-0.4
1.4
IC
3.5
-0.5
IC
0.2
IC
-1.9
IC
-1.0
Black
Ratio
1.5
1.0
1.3
2.6
1.2
3.0
2.0
1.2
NA
0.7
NA
0.5
41.6
8.6
0.0
0.0
1.2
2.8
3.0
1.0
3.0
0.0
3.7
0.0
0.0
1.7
4.7
0.9
1.3
0.0
0.0
Hispanic Hispanic
Non-White Non-White
Non-White Diff Non-White No
Sig Diff in % Ratio Sig Male Diff % Male Ratio Sig % No Arrest
Arrest Ratio
*
0.7
1.5
*
0.5
1.3
*
3.4
1.9
0.6
1.1
0.7
1.4
IC
2.4
2.8
IC
0.7
1.4
IC
0.6
2.2
IC
-2.2
0.0
IC
2.5
2.0
IC
2.1
2.6
IC
-2.4
0.0
IC
-0.5
0.9
IC
-0.9
0.0
IC
-0.4
0.7
IC
1.0
1.6
IC
0.2
1.2
7.1
3.4
*
6.2
2.9
*
4.0
3.4
IC
0.6
2.3
IC
0.3
1.4
IC
0.3
1.6
IC
NA
NA
IC
NA
NA
IC
NA
NA
-1.3
0.4
-1.5
0.5
-0.4
0.6
IC
NA
NA
IC
NA
NA
IC
NA
NA
IC
1.4
2.6
IC
0.0
1.0
IC
-0.2
0.5
IC
3.0
12.7
IC
6.5
19.6
IC
6.4
22.3
IC
5.5
5.0
IC
6.6
6.0
IC
4.7
4.9
IC
-1.4
0.0
IC
-1.9
0.0
IC
-0.9
0.0
IC
2.8
2.5
IC
1.3
1.6
IC
0.0
1.0
IC
2.0
1.4
IC
0.9
1.2
IC
1.3
1.4
*
0.6
2.0
0.7
1.8
*
0.1
1.5
1.9
2.6
*
1.6
2.1
*
1.1
2.4
IC
-1.2
0.0
IC
0.4
1.4
IC
-0.7
0.3
IC
1.3
3.1
IC
1.0
2.7
IC
0.1
1.3
IC
-1.9
0.0
IC
-2.6
0.0
IC
0.0
0.0
*
-1.1
0.3
2.7
2.4
*
2.2
3.0
IC
-1.0
0.0
IC
-1.3
0.0
IC
-0.5
0.0
IC
13.9
37.9
IC
7.7
0.0
IC
7.3
19.3
3.9
3.0
*
-0.9
0.6
0.5
1.4
IC
-0.9
0.0
IC
1.4
2.1
IC
1.3
2.4
-1.1
0.7
-0.7
0.8
-1.2
0.6
IC
1.1
2.8
IC
0.8
2.6
IC
-0.2
0.6
IC
-1.9
0.0
IC
-2.6
0.0
IC
-1.1
0.0
IC
0.4
1.5
IC
0.3
1.3
IC
-0.6
0.0
76
IC
IC
IC
IC
IC
IC
IC
IC
IC
IC
IC
IC
IC
IC
IC
*
IC
IC
IC
IC
IC
IC
IC
*
IC
IC
Sig
IC
Agency
Bernardston
Beverly
Billerica
Blackstone
Blandford
Bolton
Boston (All)
Bourne
Boxborough
Boxford
Boylston
Braintree
Brewster
Bridgewater
Bridgewater SC
Brimfield
Brockton
Brookfield
Brookline
Buckland
Bunker Hill CC
Burlington
Cambridge
Canton
Carlisle
Carver
Charlemont
Charlton
Chatham
Chelmsford
Chelsea
3. Search
Non- NonTotal
White White
Searched % Diff Ratio
8
-2.72
0.00
31
-0.87
0.40
40
-0.16
0.79
10
0.64
2.43
0
NA
NA
8
-1.47
0.00
872
0.43
1.76
51
-2.91
0.30
24
-0.04
0.98
4
4.81
7.41
10
0.32
1.30
121
0.63
1.13
41
-2.43
0.60
50
1.44
2.08
19
1.20
1.19
10
2.13
2.61
460
1.75
1.77
16
0.58
1.58
111
0.84
2.48
4
-1.24
0.00
2
2.20
0.00
21
0.29
1.66
110
1.17
2.84
49
2.79
2.57
14
2.18
2.14
26
-0.38
0.93
3
-0.60
0.00
48
1.02
1.49
11
-0.84
0.00
37
0.75
1.69
32
0.36
2.74
Black
Sig Diff in %
IC
-2.7
IC
0.0
IC
-0.8
IC
3.1
IC
NA
IC
-1.5
*
0.5
-2.6
IC
2.9
IC
-0.8
IC
-1.1
0.4
IC
2.3
*
0.6
IC
-1.2
IC
-1.3
*
2.0
IC
-1.0
*
1.9
IC
-1.2
IC
2.4
IC
0.5
*
1.6
IC
4.1
IC
14.7
IC
1.0
IC
-0.6
IC
-2.1
IC
-0.8
IC
1.1
IC
0.6
Black
Ratio
0.0
1.0
0.0
8.0
NA
0.0
1.8
0.4
2.5
0.0
0.0
1.1
1.4
1.5
0.8
0.0
1.9
0.0
4.2
0.0
0.0
2.2
3.4
3.3
8.5
1.2
0.0
0.0
0.0
2.0
3.6
Hispanic Hispanic
Non-White Non-White
Non-White Diff Non-White No
Sig Diff in % Ratio Sig Male Diff % Male Ratio Sig % No Arrest
Arrest Ratio
IC
-2.7
0.0
IC
-4.3
0.0
IC
-1.8
0.0
IC
-1.4
0.0
IC
-1.2
0.4
IC
0.1
1.2
IC
0.2
1.3
IC
-0.2
0.8
IC
0.0
1.0
IC
-0.4
0.0
IC
0.8
2.5
IC
-0.2
0.0
IC
NA
NA
IC
NA
NA
IC
NA
NA
IC
-1.5
0.0
IC
-1.7
0.0
IC
-1.0
0.0
*
0.5
1.8
0.6
2.0
0.3
1.6
-4.2
0.0
-3.0
0.4
-2.9
0.0
IC
-2.0
0.0
IC
-0.8
0.7
IC
0.0
1.0
IC
6.4
9.4
IC
7.6
12.1
IC
-0.5
0.0
IC
1.0
1.9
IC
0.2
1.2
IC
0.4
1.7
1.3
1.3
1.8
1.3
0.2
1.0
IC
-6.0
0.0
IC
-2.8
0.6
IC
-2.2
0.0
5.3
5.0
*
1.7
2.2
*
1.8
3.3
IC
-6.2
0.0
IC
1.6
1.2
IC
-1.3
0.0
IC
3.9
4.0
IC
2.6
2.6
IC
3.2
3.9
*
1.1
1.5
*
1.9
1.7
*
0.6
1.5
IC
3.6
4.6
IC
1.5
2.4
IC
0.9
2.3
*
0.9
2.5
*
1.1
2.4
*
0.3
1.8
IC
-1.2
0.0
IC
-1.0
0.0
IC
-1.3
0.0
IC
0.0
0.0
IC
3.3
0.0
IC
2.3
0.0
IC
1.4
4.2
IC
0.1
1.3
IC
0.2
1.7
*
1.9
3.9
*
1.5
3.0
*
0.4
2.0
IC
0.4
1.2
IC
3.8
2.7
IC
1.5
2.3
IC
-2.0
0.0
IC
1.0
1.5
IC
1.2
2.2
IC
-5.7
0.0
IC
0.2
1.0
IC
-3.3
0.0
IC
-0.6
0.0
IC
-0.9
0.0
IC
-0.6
0.0
IC
1.5
1.7
IC
1.9
1.8
IC
0.6
1.4
IC
-0.8
0.0
IC
-1.1
0.0
IC
-0.6
0.0
IC
1.0
1.9
IC
0.7
1.5
IC
0.7
1.7
IC
0.3
2.5
IC
0.4
3.0
IC
0.0
1.0
77
IC
IC
IC
IC
*
IC
*
IC
IC
IC
*
IC
IC
IC
IC
IC
IC
IC
IC
Sig
IC
IC
IC
IC
IC
IC
*
IC
IC
IC
IC
Agency
Cheshire
Chester
Chesterfield
Chicopee
Chilmark
Clarksburg
Clinton
Cohasset
Colrain
Concord
Conway
CSX
Cummington
Dalton
Danvers
Dartmouth
Dedham
Deerfield
Dennis
Dighton
Douglas
Dover
Dracut
Dudley
Dunstable
Duxbury
E. Bridgewater
E. Brookfield
E.Longmeadow
Eastham
Easthampton
3. Search
NonTotal
White
Searched % Diff
2
4.32
30
5.38
11
-2.61
86
0.65
13
9.13
0
NA
27
-2.53
13
1.25
0
NA
44
0.27
5
-2.78
0
NA
4
-2.35
17
3.94
33
0.95
68
0.91
43
0.21
7
-0.88
45
0.33
17
-5.30
7
-0.83
9
0.27
23
4.10
40
-0.22
72
3.43
6
2.49
14
2.27
9
0.88
11
-0.35
12
-0.40
12
0.95
NonWhite
Ratio
19.77
1.81
0.00
1.49
1.95
NA
0.37
1.77
NA
1.37
0.00
NA
0.00
3.45
2.43
1.38
1.20
0.00
1.23
0.00
0.00
1.15
4.53
0.94
1.48
3.59
7.43
1.66
0.70
0.00
2.63
Black
Sig Diff in %
IC
-0.2
IC
-6.6
IC
-2.6
1.1
IC
7.1
IC
NA
IC
-0.7
IC
-1.6
IC
NA
IC
0.7
IC
-2.8
IC
NA
IC
-2.4
IC
6.1
IC
0.2
0.2
IC
0.1
IC
-0.9
IC
1.0
IC
-5.3
IC
-0.8
IC
-1.8
IC
1.1
IC
1.3
15.6
IC
-1.0
IC
1.2
IC
3.0
IC
0.3
IC
-0.4
IC
-0.6
Black
Ratio
0.0
0.0
0.0
1.8
1.7
NA
0.8
0.0
NA
2.0
0.0
NA
0.0
4.8
1.3
1.1
1.1
0.0
1.7
0.0
0.0
0.0
1.9
1.4
3.2
0.0
4.3
3.2
1.2
0.0
0.0
Hispanic Hispanic
Non-White Non-White
Non-White Diff Non-White No
Sig Diff in % Ratio Sig Male Diff % Male Ratio Sig % No Arrest
Arrest Ratio
IC
24.8
108.3 IC
5.2
14.1
IC
0.0
0.0
IC
9.2
2.4
IC
0.1
1.0
IC
5.9
2.0
IC
0.0
0.0
IC
-3.0
0.0
IC
-1.5
0.0
0.6
1.4
0.7
1.4
0.7
2.0
IC
4.7
1.5
IC
8.5
1.7
IC
8.7
7.7
IC
NA
NA
IC
NA
NA
IC
NA
NA
IC
-3.0
0.2
IC
-1.2
0.6
IC
-2.5
0.3
IC
9.5
6.9
IC
1.5
1.7
IC
2.1
3.1
IC
NA
NA
IC
NA
NA
IC
NA
NA
IC
0.4
1.5
IC
0.2
1.2
IC
0.0
1.0
IC
0.0
0.0
IC
-4.5
0.0
IC
-2.8
0.0
IC
NA
NA
IC
NA
NA
IC
NA
NA
IC
-2.4
0.0
IC
-2.4
0.0
IC
-2.4
0.0
IC
-1.6
0.0
IC
4.4
3.5
IC
-0.9
0.0
IC
2.0
4.0
IC
0.8
2.2
IC
0.3
1.8
3.8
2.6
1.5
1.5
0.4
1.2
IC
0.4
1.4
IC
-0.3
0.8
IC
0.2
1.3
IC
-0.9
0.0
IC
-1.0
0.0
IC
-0.4
0.0
IC
-1.4
0.0
IC
0.5
1.3
IC
-0.3
0.6
IC
-5.3
0.0
IC
-5.4
0.0
IC
-4.4
0.0
IC
-0.8
0.0
IC
-0.6
0.0
IC
-0.5
0.0
IC
-1.8
0.0
IC
0.0
1.0
IC
0.7
1.5
IC
4.8
5.1
IC
3.2
3.7
IC
3.6
4.0
IC
-0.2
0.9
IC
-0.1
1.0
IC
0.0
1.0
*
-3.6
0.5
4.7
1.6
2.8
2.8
IC
6.7
7.9
IC
3.4
6.8
IC
3.6
10.0
IC
5.6
17.0
IC
0.9
3.0
IC
2.3
24.0
IC
-1.3
0.0
IC
1.3
1.9
IC
1.9
3.1
IC
-1.2
0.0
IC
-0.3
0.8
IC
-0.7
0.0
IC
-0.4
0.0
IC
-0.5
0.0
IC
-0.2
0.0
IC
2.5
5.3
IC
1.4
2.6
IC
1.2
4.0
78
Sig
IC
IC
IC
IC
IC
IC
IC
IC
IC
IC
IC
IC
IC
IC
IC
IC
IC
IC
IC
IC
IC
IC
IC
IC
IC
IC
IC
IC
IC
IC
IC
*
Black
Sig Diff in %
IC
0.8
5.9
IC
-0.1
IC
-1.2
IC
-0.4
IC
-3.4
-0.3
*
6.9
*
1.1
IC
0.6
IC
NA
IC
-0.2
IC
-1.1
*
1.0
IC
6.4
IC
-1.1
IC
-2.3
IC
-4.4
IC
-0.1
IC
-2.4
IC
-2.0
IC
-2.5
IC
0.7
IC
-3.8
IC
0.3
IC
5.5
3.4
IC
9.3
IC
3.1
Black
Ratio
1.7
1.4
0.0
0.0
0.0
0.0
0.7
3.1
2.8
1.5
NA
0.8
0.6
2.4
4.9
0.4
0.0
0.0
0.0
0.0
0.0
0.0
1.3
0.0
1.2
3.0
2.6
14.1
4.9
Hispanic Hispanic
Non-White Non-White
Non-White Diff Non-White No
Sig Diff in % Ratio Sig Male Diff % Male Ratio Sig % No Arrest
Arrest Ratio
IC
1.4
2.3
IC
1.1
1.8
IC
0.0
1.0
-0.4
1.0
-0.3
1.0
5.2
1.7
IC
-0.1
0.0
IC
-0.1
0.0
IC
0.0
0.0
IC
4.8
5.1
IC
0.7
1.6
IC
1.5
2.5
IC
-0.4
0.0
IC
-0.1
0.0
IC
-0.4
0.0
IC
7.7
3.2
IC
3.0
1.8
IC
1.9
2.0
0.6
1.6
0.4
1.3
0.1
1.1
*
5.0
2.5
5.7
2.4
*
3.2
2.4
*
1.9
4.1
*
1.5
2.7
*
0.9
4.0
IC
1.5
2.4
IC
0.7
1.6
IC
-0.1
0.9
IC
NA
NA
IC
NA
NA
IC
NA
NA
IC
2.2
4.1
IC
1.8
3.5
IC
0.7
2.2
IC
0.1
1.0
IC
-0.6
0.8
IC
0.1
1.1
*
0.4
1.7
0.6
1.7
*
0.2
1.5
IC
-1.6
0.0
IC
2.0
2.0
IC
0.7
1.9
IC
1.0
1.5
IC
-0.6
0.7
IC
-0.4
0.8
IC
4.6
3.0
IC
2.2
1.9
IC
0.6
1.5
IC
4.0
1.9
IC
2.4
1.6
IC
2.7
2.0
IC
-0.1
0.0
IC
0.0
0.0
IC
-0.1
0.0
IC
3.0
2.2
IC
-0.9
0.7
IC
-0.2
0.8
IC
-2.0
0.0
IC
-2.5
0.0
IC
-1.2
0.0
IC
-2.5
0.0
IC
-3.1
0.0
IC
-2.0
0.0
IC
-2.0
0.0
IC
-1.3
0.5
IC
-0.6
0.6
IC
0.0
0.0
IC
-4.8
0.0
IC
-3.7
0.0
IC
0.8
1.5
IC
0.7
1.4
IC
0.1
1.1
IC
0.7
1.2
IC
1.1
1.4
IC
0.8
1.5
-0.4
0.8
0.6
1.2
1.6
2.1
IC
-0.7
0.0
IC
4.9
15.9
IC
3.5
8.0
IC
2.2
3.8
IC
2.1
4.1
IC
1.6
3.3
Submitted information to Northeastern University about error in search designation
Non- NonTotal
White White
Agency
Searched % Diff Ratio
Easton
14
0.85
1.75
*
Edgartown
68
2.21
1.14
Egremont
1
-0.08
0.00
Environmental PD
24
1.22
1.99
Erving
4
-0.41
0.00
Essex
31
3.22
1.93
Everett
78
0.14
1.14
Fairhaven*
58
5.81
2.77
Fall River
138
1.28
3.09
Falmouth
42
0.66
1.60
Ferneld State School
0
NA
NA
Fitchburg
37
1.55
3.20
Foxborough
26
-0.96
0.68
Framingham
73
0.47
1.69
Franklin
43
2.38
2.47
Freetown
36
-0.70
0.62
Gardner
44
1.12
1.49
Georgetown
34
0.93
1.21
Gill
1
-0.08
0.00
Gloucester
44
0.72
1.30
Goshen
7
-1.98
0.00
Grafton
23
-2.48
0.00
Granby
18
-1.04
0.49
Granville
4
-3.74
0.00
Greenfield
38
0.38
1.25
Groton
30
0.93
1.33
Groveland
58
0.62
1.27
Gt. Barrington
7
3.30
5.70
Hadley
11
1.40
2.80
3. Search
79
IC
*
IC
IC
IC
IC
IC
IC
IC
IC
IC
IC
IC
IC
IC
IC
IC
IC
IC
IC
IC
IC
Sig
IC
IC
IC
IC
IC
IC
Agency
Halifax
Hamilton
Hampden
Hanover
Hanson
Hardwick
Harvard
Harwich
Hatfield
Haverhill
Heath
Hingham
Hinsdale
Holbrook
Holden
Holland
Holliston
Holyoke
Hopedale
Hopkinton
Hubbardston
Hudson
Hull
Huntington
Ipswich
Kingston
Lakeville
Lancaster
Lanesborough
Lawrence
Lee
3. Search
Non- NonTotal
White White
Searched % Diff Ratio
32
3.72
1.94
21
3.83
2.87
23
1.66
1.96
85
-0.94
0.68
39
0.60
1.32
3
-1.46
0.00
12
1.38
1.56
14
1.95
4.12
9
-0.11
0.93
156
2.06
1.96
0
NA
NA
144
-0.33
0.94
5
-0.72
0.00
11
0.85
1.49
36
6.50
1.77
11
8.74
4.68
9
0.23
1.39
144
0.55
1.21
20
-1.12
0.51
69
-0.58
0.78
25
7.32
4.33
31
0.25
1.16
54
0.65
1.27
4
-2.26
0.00
24
3.62
2.60
31
2.07
1.73
14
0.37
1.36
2
-0.26
0.00
5
-1.02
0.00
215
-0.39
0.79
38
-0.93
0.53
Black
Sig Diff in %
IC
-4.0
IC
-2.1
IC
-1.7
0.4
IC
2.2
IC
-1.5
IC
4.7
IC
3.5
IC
-1.6
*
2.6
IC
NA
7.7
IC
-0.6
IC
2.2
IC
17.8
IC
22.6
IC
-0.6
-0.9
IC
-2.3
-1.1
IC
7.8
IC
4.9
-0.7
IC
-2.3
IC
-2.3
IC
10.1
IC
1.2
IC
-0.3
IC
-1.0
-0.2
IC
0.1
Black
Ratio
0.0
0.0
0.0
1.1
2.2
0.0
2.9
6.5
0.0
2.2
NA
2.5
0.0
2.3
3.1
10.5
0.0
0.7
0.0
0.6
4.5
4.1
0.7
0.0
0.0
4.6
2.2
0.0
0.0
0.9
1.1
Hispanic Hispanic
Non-White Non-White
Non-White Diff Non-White No
Sig Diff in % Ratio Sig Male Diff % Male Ratio Sig % No Arrest
Arrest Ratio
IC
5.1
2.3
IC
6.0
2.4
IC
2.7
2.7
IC
2.9
2.4
IC
4.7
2.9
IC
4.7
4.4
IC
8.3
5.8
IC
2.6
2.2
IC
2.8
5.0
-1.6
0.5
-1.7
0.5
0.5
1.5
IC
-1.9
0.0
IC
1.3
1.6
IC
0.8
1.7
IC
0.0
0.0
IC
-2.0
0.0
IC
-1.0
0.0
IC
1.2
1.5
IC
2.4
1.9
IC
1.6
4.2
IC
-0.6
0.0
IC
2.3
3.9
IC
0.5
2.7
IC
0.7
1.4
IC
0.0
1.0
IC
-0.6
0.0
*
2.3
2.0
*
2.7
2.2
*
1.2
1.7
IC
NA
NA
IC
NA
NA
IC
0.0
NA
-3.9
0.3
-0.6
0.9
-0.6
0.6
IC
-0.6
0.0
IC
-0.9
0.0
IC
-0.4
0.0
IC
-1.7
0.0
IC
1.6
2.2
IC
3.7
5.6
IC
-2.7
0.7
IC
6.1
1.6
IC
6.1
2.0
IC
-2.4
0.0
IC
10.1
5.2
IC
10.1
11.1
IC
0.4
1.7
IC
0.3
1.4
IC
-0.4
0.0
0.7
1.3
1.1
1.4
-0.3
0.8
IC
-0.7
0.7
IC
-0.7
0.7
IC
-1.0
0.0
-1.2
0.5
-0.9
0.7
-0.9
0.4
IC
8.5
4.9
IC
5.4
2.9
IC
6.4
8.1
IC
-0.2
0.9
IC
-1.5
0.2
IC
-0.2
0.7
2.0
1.8
1.0
1.3
0.9
2.0
IC
-2.3
0.0
IC
-1.6
0.0
IC
-1.1
0.0
IC
9.5
5.2
IC
3.8
2.2
IC
5.3
4.8
IC
-2.8
0.0
IC
2.8
1.8
IC
-2.1
0.0
IC
-1.0
0.0
IC
0.2
1.2
IC
-0.4
0.0
IC
-0.3
0.0
IC
-0.2
0.0
IC
0.0
0.0
IC
-1.0
0.0
IC
-1.1
0.0
IC
-0.7
0.0
-0.4
0.8
-0.4
0.8
-0.1
0.9
IC
-2.0
0.0
IC
-0.4
0.8
IC
-1.2
0.0
80
IC
IC
IC
IC
IC
IC
IC
IC
IC
IC
IC
IC
Sig
IC
IC
IC
IC
IC
IC
IC
IC
IC
*
IC
IC
IC
IC
IC
IC
IC
Non- NonTotal
White White
Agency
Searched % Diff Ratio
Leicester
121
0.97
1.17
Lenox
10
0.28
1.52
Leominster
35
0.37
1.44
Leverett
1
-0.11
0.00
Lexington
28
-0.09
0.85
Leyden
2
-16.67 0.00
Lincoln
34
2.03
2.86
Littleton
26
0.95
2.56
Longmeadow
7
2.21
6.86
Lowell
118
0.51
1.61
Ludlow
7
-0.66
0.00
Lunenburg
18
1.02
1.62
Lynn
154
0.39
1.65
Lynnfield
3
1.83
4.32
MA Maritime Police
0
NA
NA
Malden
99
0.73
1.36
Manchester
12
1.31
2.51
Mansfield
104
2.87
1.83
Marblehead
14
1.08
1.92
Marion
22
2.08
1.50
Marlborough
58
-0.27
0.62
Marshfield
76
-2.81
0.00
Mashpee
66
1.64
1.38
Massasoit CC
11
4.05
3.93
Mattapoisett
55
-5.70
0.17
Maynard
37
-0.10
0.92
MBTA
25
2.00
2.57
Medfield
2
-0.69
0.00
Medford
82
-0.23
0.87
Medway
13
-0.48
0.62
Melrose
25
-2.01
0.00
3. Search
Black
Sig Diff in %
2.7
IC
-0.6
IC
0.5
IC
-0.1
IC
1.0
IC
0.0
IC
2.9
IC
0.3
IC
1.5
*
0.4
IC
-0.7
IC
-1.7
*
0.3
IC
-0.6
IC
NA
1.4
IC
-0.8
*
2.7
IC
-1.2
IC
2.9
-0.1
-2.8
1.0
IC
4.4
-5.0
IC
-0.1
IC
2.7
IC
-0.7
0.1
IC
-1.3
IC
-2.0
Black
Ratio
1.5
0.0
1.6
0.0
2.7
0.0
3.6
1.5
5.0
1.5
0.0
0.0
1.5
0.0
NA
1.7
0.0
1.8
0.0
1.7
0.9
0.0
1.2
4.1
0.3
0.9
3.1
0.0
1.0
0.0
0.0
Hispanic Hispanic
Non-White Non-White
Non-White Diff Non-White No
Sig Diff in % Ratio Sig Male Diff % Male Ratio Sig % No Arrest
Arrest Ratio
0.6
1.1
1.6
1.3
2.0
1.7
IC
1.9
4.5
IC
0.3
1.4
IC
-0.3
0.0
IC
0.4
1.5
IC
0.2
1.2
IC
0.2
1.5
IC
-0.1
0.0
IC
-0.2
0.0
IC
0.0
0.0
IC
0.0
1.0
IC
0.1
1.1
IC
0.0
1.0
IC
0.0
0.0
IC
0.0
0.0
IC
0.0
0.0
IC
2.3
3.1
IC
2.1
2.6
IC
0.8
1.9
IC
2.4
4.9
IC
0.7
1.8
IC
0.4
2.3
IC
1.6
5.3
IC
3.2
13.6
IC
0.9
5.5
0.4
1.5
0.4
1.5
0.3
1.4
IC
-0.7
0.0
IC
-0.8
0.0
IC
-0.4
0.0
IC
2.3
2.4
IC
0.4
1.2
IC
0.5
1.5
0.5
1.9
*
0.4
1.6
*
0.3
1.8
IC
3.6
7.5
IC
2.4
7.7
IC
2.1
4.5
IC
NA
NA
IC
NA
NA
IC
NA
NA
*
0.5
1.2
1.2
1.5
0.5
1.4
IC
4.0
6.0
IC
2.0
2.9
IC
-0.2
0.0
7.2
3.1
3.5
1.8
*
3.2
2.0
IC
0.5
1.5
IC
1.6
2.2
IC
1.1
3.8
IC
-4.2
0.0
IC
3.0
1.7
IC
1.1
1.3
-0.3
0.6
-0.3
0.6
-0.2
0.5
-2.8
0.0
-3.3
0.0
-2.0
0.0
-4.3
0.0
1.6
1.3
3.2
1.9
IC
4.5
4.2
IC
1.7
2.3
IC
4.2
4.0
-7.0
0.0
-8.1
0.0
-1.8
0.5
IC
0.2
1.2
IC
0.0
1.0
IC
-0.6
0.5
IC
2.1
2.6
IC
2.2
2.7
IC
0.8
2.0
IC
-0.7
0.0
IC
-0.9
0.0
IC
-0.7
0.0
-0.6
0.7
-0.5
0.8
-0.3
0.7
IC
-1.3
0.0
IC
-0.3
0.8
IC
-0.1
0.9
IC
-2.0
0.0
IC
-2.6
0.0
IC
-1.3
0.0
81
IC
IC
IC
IC
IC
IC
IC
IC
IC
IC
*
IC
IC
IC
Sig
*
IC
IC
IC
IC
IC
IC
IC
IC
*
IC
IC
*
IC
IC
Agency
Mendon
Merrimac
Methuen
Metro Police Lwr.
Basin
Metro Police Marine
Middleborough
Middleton
Milford
Millbury
Millis
Millville
Milton
Monroe
Monson
Montague
Monterey
Mt Wachusett CC
N. Adams
N. Andover
N.Attleborough
N. Brookfield
N. Reading
Nahant
Nantucket
Natick
Needham
New Bedford
New Braintree
New Marlborough
New Salem
3. Search
0
0
32
28
23
6
2
9
32
0
7
25
0
0
149
49
73
4
44
52
13
25
19
407
1
0
2
NA
NA
-0.30
0.20
0.89
0.20
-0.34
10.16
0.25
NA
1.90
2.82
NA
NA
10.02
0.41
0.89
-1.36
7.23
-3.36
-0.67
0.10
-0.16
3.54
-0.75
NA
-0.30
NA
NA
0.59
1.14
1.72
1.43
0.00
7.34
1.18
NA
4.17
1.65
NA
NA
2.11
1.41
1.77
0.00
2.31
0.49
0.44
1.43
0.87
1.68
0.00
NA
0.00
IC
IC
IC
*
IC
IC
IC
IC
IC
IC
IC
IC
IC
IC
IC
IC
IC
IC
IC
IC
IC
IC
IC
*
IC
NA
NA
-0.1
1.8
-1.3
0.9
-0.3
-1.6
0.3
NA
5.3
2.8
NA
NA
10.8
-1.0
0.1
-1.4
-0.3
-0.3
-0.4
0.5
2.2
4.7
-0.8
NA
-0.3
Non- NonTotal
White White
Black
Searched % Diff Ratio Sig Diff in %
25
0.84
2.22 IC
-0.7
13
2.53
2.25 IC
-2.0
177
-1.11
0.75
-1.1
NA
NA
0.9
2.2
0.0
3.0
0.0
0.0
1.2
NA
9.8
1.6
NA
NA
2.2
0.0
1.1
0.0
1.0
1.0
0.7
3.2
2.7
1.9
0.0
NA
0.0
IC
IC
IC
*
IC
IC
IC
IC
IC
IC
IC
IC
IC
IC
IC
IC
IC
IC
IC
IC
IC
IC
IC
*
IC
NA
NA
-0.7
-0.8
1.1
-0.5
-0.3
16.6
0.2
NA
-0.6
3.7
NA
NA
12.8
1.0
1.3
-1.4
15.3
-6.5
-1.2
0.0
-1.2
2.5
-0.8
NA
-0.3
NA
NA
0.0
0.4
1.9
0.0
0.0
11.3
1.1
NA
0.0
1.8
NA
NA
2.4
2.0
2.1
0.0
3.8
0.0
0.0
0.9
0.0
1.5
0.0
NA
0.0
IC
IC
IC
*
IC
IC
IC
IC
IC
IC
IC
IC
IC
IC
IC
IC
IC
IC
IC
IC
IC
IC
IC
*
IC
NA
NA
-0.2
0.3
1.1
0.1
-0.5
12.2
0.1
NA
2.2
4.0
NA
NA
8.8
1.0
0.6
-1.4
8.3
-4.9
-0.7
0.0
-0.3
4.2
-1.2
NA
-0.2
NA
NA
0.7
1.1
1.7
1.2
0.0
6.8
1.1
NA
3.7
1.8
NA
NA
1.8
2.2
1.4
0.0
2.4
0.3
0.5
0.9
0.8
1.7
0.0
NA
0.0
IC
IC
IC
*
IC
IC
IC
IC
IC
IC
IC
IC
IC
IC
IC
IC
IC
IC
IC
IC
IC
IC
IC
*
IC
0.0
NA
0.1
0.1
0.7
0.3
0.0
13.7
-0.2
NA
2.6
0.6
0.0
NA
5.1
0.1
0.6
-1.5
3.0
-1.4
-1.0
-0.1
-0.3
1.7
-0.7
NA
-0.3
NA
NA
1.3
1.1
1.8
1.8
0.0
23.8
0.9
NA
9.7
1.2
NA
NA
2.2
1.1
2.5
0.0
2.3
0.6
0.0
0.5
0.7
1.5
0.0
NA
0.0
82
IC
IC
IC
IC
IC
IC
IC
IC
IC
IC
IC
IC
IC
IC
*
IC
IC
IC
IC
IC
IC
IC
IC
*
IC
IC
IC
Black
Hispanic Hispanic
Non-White Non-White
Non-White Diff Non-White No
Ratio Sig Diff in % Ratio Sig Male Diff % Male Ratio Sig % No Arrest
Arrest Ratio Sig
0.0 IC
1.8
3.7
IC
1.3
2.6
IC
-0.4
0.0
IC
0.0 IC
5.1
3.5
IC
0.5
1.2
IC
1.9
3.4
IC
0.8
-1.1
0.8
-1.2
0.8
-0.7
0.8
Agency
Newbury
Newburyport
Newton
Norfolk
Northampton
Northborough
Northbridge
Northfield
Norton
Norwell
Norwood
Oak Bluffs
Oakham
Orange
Orleans
Otis
Oxford
Palmer
Paxton
Peabody
Pelham
Pembroke
Pepperell
Peru
Petersham
Phillipston
Pittsfield
Plainfield
Plainville
Plymouth
Plympton
3. Search
Non- NonTotal
White White
Searched % Diff Ratio
3
-0.37
0.00
21
2.09
4.06
53
0.81
2.56
6
2.23
3.76
96
1.71
1.78
17
0.05
1.07
20
5.98
5.37
6
1.04
4.47
53
-0.96
0.78
15
1.22
1.93
37
-0.28
0.72
23
0.07
1.05
2
-0.68
0.00
18
-3.85
0.00
109
-0.94
0.91
0
NA
NA
35
6.67
3.18
7
0.74
3.95
15
-1.71
0.00
103
0.61
1.41
0
NA
NA
31
-3.92
0.00
33
-0.89
0.70
2
-2.50
0.00
23
-5.16
0.00
5
5.27
6.38
28
2.45
5.53
0
NA
NA
15
4.02
5.10
66
-0.60
0.70
60
6.72
2.06
Black
Sig Diff in %
IC
-0.4
IC
2.2
*
1.3
IC
-0.8
*
-0.7
IC
0.2
IC
4.5
IC
3.7
-2.6
IC
3.9
IC
0.0
IC
1.2
IC
-0.7
IC
-3.9
-2.6
IC
NA
IC
7.3
IC
1.8
IC
-1.7
0.3
IC
NA
IC
-3.9
IC
5.3
IC
-2.5
IC
-5.2
IC
-1.0
IC
2.2
IC
NA
IC
-1.0
0.9
IC
4.8
Black
Ratio
0.0
4.2
3.5
0.0
0.7
1.3
4.3
13.4
0.4
4.0
1.0
2.0
0.0
0.0
0.7
NA
3.4
8.3
0.0
1.2
NA
0.0
2.7
0.0
0.0
0.0
5.0
NA
0.0
1.5
1.8
Hispanic Hispanic
Non-White Non-White
Non-White Diff Non-White No
Sig Diff in % Ratio Sig Male Diff % Male Ratio Sig % No Arrest
Arrest Ratio
IC
-0.4
0.0
IC
-0.5
0.0
IC
0.0
0.0
IC
3.2
5.7
IC
2.5
4.2
IC
-0.2
0.0
*
2.3
5.3
*
1.2
2.6
*
0.5
2.7
IC
5.9
8.2
IC
2.4
3.8
IC
3.3
9.3
2.3
2.1
1.8
1.6
-0.5
0.4
IC
0.3
1.4
IC
0.2
1.3
IC
0.0
1.0
IC
9.7
8.1
IC
7.0
5.6
IC
1.7
9.5
IC
-0.3
0.0
IC
1.7
10.8
IC
-0.1
0.0
3.0
1.7
-1.2
0.8
-2.9
0.0
IC
-1.3
0.0
IC
1.2
1.6
IC
0.9
2.5
IC
-1.0
0.0
IC
0.1
1.1
IC
-0.3
0.6
IC
-1.2
0.0
IC
-0.5
0.7
IC
0.1
1.3
IC
-0.7
0.0
IC
-0.5
0.0
IC
-0.7
0.0
IC
-3.9
0.0
IC
-4.2
0.0
IC
-3.5
0.0
2.6
1.2
-1.4
0.9
2.2
1.6
IC
NA
NA
IC
NA
NA
IC
0.0
NA
IC
8.4
3.7
IC
4.6
2.4
IC
0.9
1.8
IC
-0.3
0.0
IC
1.0
3.8
IC
-0.1
0.0
IC
-1.7
0.0
IC
-1.9
0.0
IC
-1.2
0.0
0.8
1.6
1.0
1.7
*
0.4
1.4
IC
NA
NA
IC
NA
NA
IC
0.0
NA
IC
-3.9
0.0
IC
-4.9
0.0
IC
-1.6
0.0
IC
-3.0
0.0
IC
-0.6
0.8
IC
0.5
1.3
IC
0.0
0.0
IC
0.0
0.0
IC
-2.5
0.0
IC
-5.2
0.0
IC
-5.8
0.0
IC
-3.5
0.0
IC
-1.0
0.0
IC
6.7
7.4
IC
-0.7
0.0
IC
3.8
8.0
IC
2.6
4.4
IC
0.1
1.3
IC
NA
NA
IC
NA
NA
IC
NA
NA
IC
10.6
11.7
IC
4.6
4.8
IC
1.2
3.0
-2.0
0.0
-0.4
0.8
-0.3
0.7
IC
2.8
1.4
IC
7.3
2.6
IC
6.6
2.0
83
IC
IC
IC
IC
IC
IC
IC
IC
IC
IC
IC
Sig
IC
IC
IC
IC
IC
IC
IC
IC
IC
IC
IC
IC
IC
IC
IC
IC
IC
IC
IC
Agency
Princeton
Provincetown
Quincy
Randolph
Raynham
Reading
Registry of MV
Rehoboth
Revere
Rochester
Rockland
Rockport
Rowe
Rowley
Royalston
Rutland
S. Hadley
Salem
Salisbury
Sandisfield
Sandwich
Saugus
Savoy
Scituate
Seekonk
Sharon
Sheffield
Shelburne
Sherborn
Shirley
Shrewsbury
3. Search
Non- NonTotal
White White
Searched % Diff Ratio
1
-0.10
0.00
13
0.51
1.25
112
-0.30
0.93
48
0.08
1.07
20
0.31
1.28
33
-1.15
0.71
0
NA
NA
59
0.55
1.18
69
-0.17
0.88
29
7.40
3.00
23
0.56
1.90
15
17.64 4.85
0
NA
NA
70
-0.98
0.84
9
-5.56
0.00
8
-1.46
0.00
30
1.67
1.83
47
0.70
2.39
112
2.87
1.51
0
NA
NA
47
1.64
1.29
22
1.44
2.90
0
NA
NA
19
3.48
1.95
23
1.15
3.40
9
-0.07
0.89
9
-0.82
0.00
2
-0.30
0.00
27
0.64
1.41
10
-0.73
0.61
85
0.49
1.40
Black
Sig Diff in %
IC
-0.1
IC
1.6
5.4
IC
0.2
IC
0.0
IC
-3.9
IC
NA
1.9
-0.4
IC
0.3
IC
0.2
IC
-4.6
IC
NA
3.4
IC
0.0
IC
-1.5
IC
-2.0
IC
0.4
-1.0
IC
NA
IC
-1.7
IC
1.3
IC
NA
IC
1.6
IC
1.0
IC
-0.7
IC
-0.8
IC
-0.3
IC
-1.5
IC
0.4
0.7
Black
Ratio
0.0
1.8
2.2
1.2
1.0
0.0
NA
1.6
0.7
1.1
1.3
0.0
NA
1.6
0.0
0.0
0.0
1.8
0.8
NA
0.7
2.7
NA
1.4
3.1
0.0
0.0
0.0
0.0
1.2
1.5
Hispanic Hispanic
Non-White Non-White
Non-White Diff Non-White No
Sig Diff in % Ratio Sig Male Diff % Male Ratio Sig % No Arrest
Arrest Ratio
IC
-0.1
0.0
IC
-0.1
0.0
IC
-0.1
0.0
IC
-2.1
0.0
IC
0.4
1.2
IC
-1.5
0.0
*
-1.2
0.7
-0.2
1.0
0.0
1.0
IC
0.3
1.2
IC
0.2
1.2
IC
0.0
1.0
IC
1.3
2.2
IC
0.5
1.4
IC
0.7
2.0
IC
3.5
1.9
IC
-0.9
0.8
IC
-2.0
0.0
IC
NA
NA
IC
NA
NA
IC
NA
NA
0.3
1.1
1.5
1.5
0.8
1.3
0.1
1.1
-0.2
0.9
0.0
1.0
IC
18.5
6.0
IC
10.1
3.4
IC
4.1
2.6
IC
1.3
3.3
IC
0.8
2.1
IC
-0.5
0.0
IC
20.4
5.4
IC
20.3
5.3
IC
20.1
5.1
IC
NA
NA
IC
NA
NA
IC
NA
NA
-2.3
0.6
-0.9
0.9
-0.6
0.9
IC
-5.6
0.0
IC
-6.8
0.0
IC
-5.2
0.0
IC
-1.5
0.0
IC
-1.7
0.0
IC
-0.6
0.0
IC
4.3
3.1
IC
1.5
1.6
IC
0.6
1.7
IC
0.9
2.9
IC
0.8
2.1
IC
0.5
2.7
5.3
1.9
*
3.1
1.6
3.8
2.0
IC
NA
NA
IC
NA
NA
IC
NA
NA
IC
4.3
1.8
IC
-2.2
0.6
IC
3.1
2.2
IC
2.4
4.2
IC
1.3
2.2
IC
1.0
2.7
IC
NA
NA
IC
NA
NA
IC
NA
NA
IC
21.3
6.8
IC
5.3
2.4
IC
-1.5
0.0
IC
1.8
4.8
IC
1.5
3.6
IC
0.6
2.5
IC
1.2
2.7
IC
-0.2
0.8
IC
-0.4
0.0
IC
-0.8
0.0
IC
-0.8
0.0
IC
-0.4
0.0
IC
-0.3
0.0
IC
-0.2
0.0
IC
-0.3
0.0
IC
2.1
2.3
IC
1.0
1.7
IC
0.7
1.6
IC
-1.9
0.0
IC
0.6
1.6
IC
0.5
1.5
0.4
1.3
0.6
1.4
0.1
1.1
84
IC
IC
IC
IC
IC
IC
IC
IC
IC
IC
IC
IC
IC
IC
IC
IC
IC
IC
IC
IC
IC
IC
IC
IC
IC
IC
Sig
IC
IC
Agency
Shutesbury
Somerset
Somerville
Somerville Housing
Auth.
Southampton
Southborough
Southbridge
Southwick
Spencer
Springfield
State Fire Marshal
State Police (All)
Sterling
Stockbridge
Stoneham
Stoughton
Stow
Sturbridge
Sudbury
Sunderland
Sutton
Swampscott
Swansea
Taunton
Templeton
Templeton Dev. Cent.
Tewksbury
Tisbury
Tolland
Topsfield
3. Search
0
18
53
58
12
59
222
0
5,869
53
0
32
56
11
77
13
13
38
44
48
68
7
0
223
26
0
13
NA
1.63
3.06
1.14
-1.47
3.95
0.93
NA
1.01
-0.90
NA
3.46
1.01
-0.55
0.72
0.00
2.06
2.13
0.26
-0.54
5.07
-0.97
NA
6.72
0.80
NA
0.25
NA
1.60
2.45
1.50
0.00
2.71
2.20
NA
1.92
0.76
NA
1.65
1.80
0.85
1.33
0.99
2.87
1.99
1.09
0.71
2.98
0.00
NA
1.58
1.34
NA
1.28
IC
IC
IC
IC
IC
*
IC
IC
*
IC
IC
IC
IC
IC
*
IC
IC
*
*
IC
*
IC
IC
*
NA
30.6
1.1
0.8
-1.5
2.5
1.2
NA
1.2
-0.2
NA
21.5
1.7
21.4
1.7
-0.5
1.6
0.8
-0.9
-1.8
3.5
-1.0
NA
-4.4
1.3
NA
-0.9
Non- NonTotal
White White
Black
Searched % Diff Ratio Sig Diff in %
1
-0.30
0.00 IC
-0.3
28
-0.11
0.90 IC
-1.1
80
-0.17
0.85
0.6
NA
12.3
1.5
1.3
0.0
2.1
2.5
NA
2.1
0.9
NA
5.2
2.4
7.0
1.8
0.0
2.4
1.4
0.7
0.0
2.3
0.0
NA
0.6
1.6
NA
0.0
IC
IC
IC
IC
IC
IC
IC
IC
*
IC
IC
IC
IC
*
IC
*
IC
*
IC
IC
IC
NA
-2.7
4.2
1.4
-1.5
5.2
0.8
NA
1.5
-1.5
NA
-1.7
-0.6
-3.6
0.1
-0.1
6.6
4.6
1.3
2.2
8.4
-1.0
NA
9.8
0.8
NA
0.9
NA
0.0
3.1
1.6
0.0
3.3
2.0
NA
2.3
0.6
NA
0.7
0.6
0.0
1.1
0.8
6.9
3.1
1.4
2.2
4.3
0.0
NA
1.9
1.3
NA
2.0
IC
IC
IC
IC
IC
IC
IC
IC
IC
IC
IC
IC
IC
IC
*
*
IC
*
IC
IC
*
NA
1.8
3.8
1.7
-1.8
3.4
1.4
NA
1.1
-0.7
NA
2.4
0.7
-0.1
0.2
-0.4
1.4
2.0
0.8
-0.6
5.2
-1.0
NA
7.1
1.1
NA
0.3
NA
1.6
2.5
1.7
0.0
2.2
2.8
NA
1.8
0.8
NA
1.4
1.4
1.0
1.1
0.5
2.2
1.7
1.3
0.7
2.9
0.0
NA
1.6
1.4
NA
1.3
IC
IC
IC
IC
IC
*
IC
IC
*
IC
IC
IC
IC
IC
IC
*
IC
*
IC
IC
IC
*
0.0
-1.1
2.6
-0.6
-1.1
2.9
0.6
0.0
0.8
-0.7
0.0
5.6
0.8
1.8
0.2
0.1
2.4
1.2
0.2
-1.4
4.1
-0.6
NA
5.3
1.3
NA
0.6
NA
0.0
3.4
0.5
0.0
3.2
2.0
NA
1.9
0.7
NA
2.2
2.0
2.1
1.2
1.5
4.0
1.9
1.1
0.0
3.7
0.0
NA
1.5
5.3
NA
1.7
Black
Hispanic Hispanic
Non-White Non-White
Non-White Diff Non-White No
Ratio Sig Diff in % Ratio Sig Male Diff % Male Ratio Sig % No Arrest
Arrest Ratio
0.0 IC
-0.3
0.0
IC
-0.5
0.0
IC
-0.3
0.0
0.0 IC
1.9
2.7
IC
0.0
1.0
IC
0.6
1.9
1.6
-0.6
0.5
-0.2
0.8
0.0
1.0
85
IC
IC
IC
IC
IC
IC
*
IC
*
IC
IC
IC
IC
IC
IC
IC
IC
IC
IC
IC
IC
IC
IC
*
IC
IC
IC
Sig
IC
IC
IC
Agency
Townsend
Truro
Tufts Univ.
Tyngsborough
Tyringham
UMass Amherst
UMass Boston
UMass Dartmouth
UMass Lowell
UMass Worcester
Upton
Uxbridge
W. Boylston
W. Bridgewater
W. Brookfield
W. Newbury
W. Springfield
W. Stockbridge
W. Tisbury
Wakefield
Wales
Walpole
Waltham
Ware
Wareham
Warren
Warwick
Washington
Watertown
Wayland
Webster
3. Search
Total
Searched
58
17
0
12
0
14
5
23
8
8
22
19
29
128
19
15
21
4
9
22
9
33
59
30
71
7
2
0
18
19
31
Non- NonWhite White
% Diff Ratio
5.71
2.77
-1.24
0.00
NA
NA
-1.16
0.00
NA
NA
-0.05
0.93
0.39
1.22
19.74 3.35
0.95
1.20
14.61 6.77
-0.35
0.73
0.57
1.21
1.92
2.35
2.23
1.58
-1.96
0.00
2.09
2.84
0.40
1.57
-0.44
0.00
-2.77
0.00
0.76
1.48
NA
NA
-0.71
0.58
0.47
1.47
0.00
1.00
2.51
2.25
-3.30
0.00
-2.41
0.00
NA
NA
0.09
2.10
-2.04
0.00
5.58
3.33
Black
Sig Diff in %
*
13.0
IC
-1.3
IC
NA
IC
-1.2
IC
NA
IC
-0.7
IC
-0.4
IC
14.8
IC
10.7
IC
5.7
IC
1.2
IC
-2.8
IC
2.7
*
2.4
IC
-2.0
IC
-1.1
IC
-0.1
IC
-0.4
IC
-2.8
IC
1.0
IC
NA
IC
0.0
0.4
IC
1.4
*
2.8
IC
-3.3
IC
-2.4
IC
NA
IC
0.2
IC
-2.1
IC
0.6
Black
Ratio
5.0
0.0
NA
0.0
NA
0.0
0.8
2.9
4.0
3.2
1.9
0.0
2.9
1.6
0.0
0.0
0.9
0.0
0.0
1.6
NA
1.0
1.4
2.0
2.4
0.0
0.0
NA
4.3
0.0
1.3
Hispanic Hispanic
Non-White Non-White
Non-White Diff Non-White No
Sig Diff in % Ratio Sig Male Diff % Male Ratio Sig % No Arrest
Arrest Ratio
*
2.7
1.8
6.9
2.9
*
2.4
3.4
IC
-1.3
0.0
IC
-1.4
0.0
IC
-0.8
0.0
IC
NA
NA
IC
NA
NA
IC
0.0
NA
IC
-1.2
0.0
IC
-1.3
0.0
IC
-0.9
0.0
IC
NA
NA
IC
NA
NA
IC
0.0
NA
IC
2.5
4.5
IC
0.1
1.1
IC
-0.1
0.8
IC
4.4
3.3
IC
-0.4
0.8
IC
1.4
2.6
IC
25.5
4.2
IC
21.2
3.5
IC
17.8
3.9
IC
2.2
1.6
IC
2.3
1.6
IC
1.1
1.2
IC
22.4
9.6
IC
18.8
10.0
IC
9.8
4.6
IC
-1.3
0.0
IC
-0.4
0.8
IC
0.4
1.6
IC
2.5
1.9
IC
1.0
1.3
IC
-1.8
0.0
IC
1.2
1.8
IC
3.2
2.7
IC
0.8
1.6
*
1.6
1.4
2.1
1.5
1.4
1.8
IC
-2.0
0.0
IC
-2.5
0.0
IC
-1.4
0.0
IC
-1.1
0.0
IC
0.8
1.6
IC
2.9
4.2
IC
0.7
2.0
IC
0.1
1.1
IC
0.0
1.0
IC
-0.4
0.0
IC
-0.7
0.0
IC
-0.4
0.0
IC
-2.8
0.0
IC
-3.7
0.0
IC
-1.4
0.0
IC
1.3
1.8
IC
1.1
1.6
IC
2.3
5.6
IC
NA
NA
IC
NA
NA
IC
NA
NA
IC
-0.8
0.5
IC
-0.8
0.6
IC
-0.4
0.6
*
1.1
2.0
0.9
1.9
*
-0.1
0.9
IC
-1.4
0.0
IC
0.4
1.3
IC
0.4
1.3
-2.0
0.0
2.7
2.2
*
1.6
2.2
IC
-3.3
0.0
IC
-4.1
0.0
IC
-2.8
0.0
IC
0.0
0.0
IC
-3.4
0.0
IC
-2.5
0.0
IC
NA
NA
IC
NA
NA
IC
NA
NA
IC
0.1
2.4
IC
0.1
1.7
IC
0.0
1.0
IC
-2.1
0.0
IC
-2.3
0.0
IC
-0.6
0.0
IC
9.1
4.8
IC
7.4
3.6
IC
1.8
2.3
86
Sig
IC
IC
IC
IC
IC
IC
IC
IC
IC
IC
IC
IC
IC
*
IC
IC
IC
IC
IC
IC
IC
IC
IC
IC
IC
IC
IC
IC
IC
IC
IC
Total
Agency
Searched
Wellesley
28
Wellfleet
30
Wendell
7
Wenham
12
Westborough
25
Westfield
44
Westfield SC
9
Westford
40
Westhampton
1
Westminster
28
Weston
6
Westport
63
Westwood
2
Weymouth
119
Whitman
63
Wilbraham
36
Williamsburg
10
Williamstown
15
Wilmington
65
Winchendon
71
Winchester
46
Windsor
7
Winthrop
12
Woburn
89
Worcester
107
Worcester Co. Sheriff
4
Worthington
1
Wrentham
62
Yarmouth
40
3. Search
NonWhite
% Diff
0.20
0.41
15.24
10.18
0.13
0.48
18.80
-0.54
-0.18
-0.03
0.69
0.75
-0.40
0.14
-0.25
2.28
4.71
0.20
2.53
3.93
-2.40
7.74
-1.43
0.31
0.66
0.42
-0.61
-1.11
1.32
NonWhite
Ratio
1.54
1.23
4.20
9.19
1.15
1.67
4.03
0.55
0.00
0.98
5.09
1.26
0.00
1.09
0.79
2.65
11.18
1.16
2.88
1.46
0.46
4.42
0.00
1.27
3.17
1.41
0.00
0.74
2.01
Black
Sig Diff in %
IC
0.5
IC
2.5
IC
20.2
IC
11.2
IC
-0.9
IC
0.9
IC
18.8
IC
2.3
IC
-0.2
IC
0.8
IC
2.2
2.3
IC
-0.4
1.4
0.3
IC
2.8
IC
3.5
IC
-1.3
*
5.3
IC
10.5
IC
-4.5
IC
17.7
IC
-1.4
-0.1
*
0.4
IC
1.6
IC
-0.6
-0.1
IC
2.5
Black
Ratio
2.4
2.4
5.3
10.0
0.0
2.2
4.0
2.9
0.0
1.5
13.7
1.8
0.0
1.9
1.3
3.0
8.6
0.0
4.9
2.2
0.0
8.8
0.0
0.9
2.4
2.6
0.0
1.0
2.9
Hispanic Hispanic
Non-White Non-White
Non-White Diff Non-White No
Sig Diff in % Ratio Sig Male Diff % Male Ratio Sig % No Arrest
Arrest Ratio
IC
0.3
1.8
IC
0.2
1.4
IC
0.2
3.0
IC
-1.8
0.0
IC
0.7
1.4
IC
-0.5
0.0
IC
0.0
0.0
IC
14.3
3.5
IC
15.8
4.8
IC
14.5
12.6
IC
12.9
7.9
IC
5.9
6.9
IC
1.0
2.1
IC
0.3
1.2
IC
0.6
2.2
IC
0.2
1.3
IC
0.4
1.5
IC
0.0
1.0
IC
0.0
0.0
IC
41.9
6.2
IC
20.1
5.1
IC
-1.2
0.0
IC
-0.6
0.6
IC
-0.6
0.3
IC
-0.2
0.0
IC
-0.3
0.0
IC
-0.2
0.0
IC
0.1
1.0
IC
-0.2
0.9
IC
-0.3
0.7
IC
-0.2
0.0
IC
0.9
4.8
IC
0.2
3.0
0.5
1.2
0.8
1.2
-1.7
0.0
IC
-0.4
0.0
IC
-0.6
0.0
IC
-0.2
0.0
-0.5
0.7
0.1
1.0
0.5
1.6
-0.8
0.4
-0.1
0.9
0.5
1.6
IC
2.1
2.6
IC
2.7
2.7
IC
1.9
2.7
IC
-0.5
0.0
IC
5.7
11.8
IC
4.9
17.3
IC
-1.3
0.0
IC
-1.6
0.0
IC
0.7
1.7
*
2.2
2.6
2.5
2.6
*
0.8
1.9
IC
-2.3
0.7
IC
7.5
1.9
IC
5.7
2.7
IC
-1.0
0.8
IC
-4.7
0.2
IC
0.0
1.0
IC
-2.3
0.0
IC
9.6
4.3
IC
8.5
6.7
IC
-1.4
0.0
IC
-1.7
0.0
IC
-1.2
0.0
0.9
1.7
0.5
1.4
-0.2
0.7
*
0.9
4.0
0.8
3.1
*
0.3
4.0
IC
0.1
1.1
IC
1.7
2.3
IC
0.4
1.4
IC
-0.6
0.0
IC
-0.8
0.0
IC
0.0
0.0
-1.7
0.6
-1.9
0.6
-0.2
0.9
IC
-1.3
0.0
IC
0.8
1.5
IC
-0.2
0.7
87
IC
IC
IC
IC
IC
IC
IC
IC
IC
IC
IC
IC
IC
Sig
IC
IC
IC
IC
IC
IC
IC
IC
IC
IC
IC
IC
IC
872
51
102
90
51
36
48
126
159
31
21
112
44
5,869
327
1,199
1,214
1,567
682
150
12
717
1
State Police
State Police (All)
SP Other
SP Troop A
SP Troop B
SP Troop C
SP Troop D
SP Troop E
SP Troop F
SP Troop H
SP Troop I
1.0
2.1
0.9
1.2
1.1
1.2
0.1
0.5
1.1
3.0
0.4
-0.3
0.8
1.3
0.7
-1.0
1.3
3.1
0.4
0.2
-0.3
0.0
0.1
*
*
*
*
*
*
*
IC
*
IC
IC
*
*
*
IC
IC
*
*
IC
IC
*
1.2
2.5
1.2
1.3
1.5
1.4
0.2
-1.3
1.4
-3.3
0.5
0.3
1.2
1.3
0.5
-0.2
1.1
2.6
0.5
0.3
-0.4
0.0
0.1
*
*
*
*
*
*
*
IC
*
IC
*
1.5
2.5
1.3
1.4
1.5
1.3
0.0
3.2
1.3
-3.3
0.5
-1.2
-0.1
1.2
1.9
-2.2
1.2
3.9
0.2
0.1
-0.1
-0.4
0.0
*
*
*
*
*
*
IC
IC
*
IC
IC
IC
IC
*
*
IC
IC
*
1.1
2.6
1.1
1.3
1.1
1.4
0.2
0.7
1.2
-4.0
0.6
-0.3
0.9
1.8
0.7
-1.1
0.9
3.0
0.6
0.2
-0.2
0.1
0.1
*
*
*
*
*
*
*
IC
*
IC
IC
*
*
*
IC
IC
*
*
IC
IC
0.8
1.2
0.8
1.0
0.9
0.8
0.1
-0.3
0.9*
0.0
0.3
-0.1
0.4
0.6
0.5
-1.1
0.8
2.0
0.2
0.2
-0.3
-0.1
0.0
88
*
*
*
*
*
IC
*
IC
*
IC
IC
IC
IC
IC
IC
IC
*
*
IC
Non- NonTotal
White White
Black Black
Hispanic Hispanic
Non-White Non-White
Non-White Diff Non-White No
Searched % Diff Ratio Sig Diff in % Ratio Sig Diff in % Ratio Sig Male Diff % Male Ratio Sig % No Arrest
Arrest Ratio Sig
Boston Districts
Boston (All)
Boston Area A
Boston Area B
Boston Area C
Boston Area D
Boston Area E
Boston Area F
Boston Area G
Boston Area H
Boston Area J
Boston Area K
Boston Area L
Boston Special OPS
Agency
3. Search
Agency
Statewide
Abington
Acton
Acushnet
Adams
Agawam
Amesbury
Amherst
AMTRAK
Andover
Aquinnah
Arlington
Ashburnham
Ashby
Ashfield
Ashland
Athol
Attleboro
Auburn
Avon
Ayer
B&M Railroad
Barnstable
Barre
Becket
Bedford
Belchertown
Bellingham
Belmont
Berkley
Berlin
NonNonWhite White
Black
Total Citations Warnings Disparity Ratio Sig. Disparity
807,791 542,195 265,596
6.1
1.1
*
4.1
932
348
584
9.6
1.2
*
9.0
587
210
377
9.5
1.2
20.3
1,253
454
799
6.1
1.1
14.3
1,618
845
773
14.4
1.4
*
8.3
2,434
563
1,871
-4.1
0.9
-7.2
3,606
2,279
1,327
14.0
1.6
*
3.3
2,659
709
1,950
10.3
1.2
*
15.2
898
310
588
-7.0
0.9
-20.7
3,199
2,747
452
-1.0
0.9
-1.5
1,763
1,375
388
6.0
1.4
*
1.2
1,508
597
911
-1.1
1.0
-5.9
5,512
3,015
2,497
4.5
1.1
*
3.2
2,181
1,081
1,100
5.1
1.1
-4.6
1,928
1,215
713
15.0
1.6
*
17.8
4,285
2,216
2,069
3.7
1.1
5.5
226
142
84
21.1
2.1
*
-9.8
4. Summary Table Citations vs. Warnings
Black
Ratio
1.1
1.2
1.6
1.4
1.2
0.7
1.1
1.6
0.4
1.0
1.0
0.9
1.1
0.9
1.3
1.1
0.8
Hispanic
Sig. Disparity
*
9.3
17.6
-18.6
4.7
11.3
3.1
19.4
*
14.9
5.0
-0.6
8.4
7.9
6.4
2.1
*
11.4
13.5
32.2
NW
Hispanic
NW Male Male
Ratio Sig. Disparity Ratio
1.2
*
4.7
1.1
1.5
8.8
1.2
0.5
1.0
1.0
1.1
3.5
1.1
1.2
8.1
1.1
1.1
-3.1
0.9
1.3
*
11.5
1.2
1.6
*
10.5
1.4
1.1
-14.7
0.6
1.0
-0.4
1.0
1.1
2.3
1.0
1.2
6.1
1.1
1.1
0.7
1.0
1.0
1.2
1.0
1.2
*
12.8
1.2
1.3
*
3.6
1.1
1.5
*
22.0
1.3
-
*
-
-
-
-
*
*
-
Sig.
*
89
Agency
Bernardston
Beverly
Billerica
Blackstone
Blandford
Bolton
Boston (All)
Bourne
Boxborough
Boxford
Boylston
Braintree
Brewster
Bridgewater
Bridgewater SC
Brimfield
Brockton
Brookfield
Brookline
Buckland
Bunker Hill CC
Burlington
Cambridge
Canton
Carlisle
Carver
Charlemont
Charlton
Chatham
Chelmsford
Chelsea
4. Citations & Warnings
Total
1,364
2,593
1,231
676
92,879
1,174
3,031
5,565
6,982
11,934
4,760
12,446
2,253
2,261
4,403
NonWhite
Citations Warnings Disparity
808
556
5.7
1,635
958
17.3
560
671
17.9
122
554
6.7
55,668
37,211
11.0
347
827
69.5
1,028
2,003
8.3
1,419
4,146
12.3
5,495
1,487
-1.6
6,056
5,878
2.9
2,248
2,512
3.5
5,245
7,201
6.0
945
1,308
2.8
1,254
1,007
3.6
3,547
856
3.9
NonWhite
Black
Ratio Sig. Disparity
1.2
5.7
1.8
*
0.6
1.5
*
2.3
1.1
-2.3
1.3
*
10.1
70.5
0.7
1.1
*
3.3
1.2
*
10.9
0.9
-0.7
1.1
*
-2.8
1.1
-4.8
1.1
*
5.6
1.1
-1.7
1.1
2.2
1.2
*
-2.7
Black
Ratio
1.1
1.0
1.1
0.9
1.2
1.0
1.1
1.4
1.0
0.9
0.9
1.1
1.0
1.0
1.0
Hispanic
Sig. Disparity
12.4
24.6
27.4
16.0
*
12.2
20.5
19.4
*
21.6
-4.5
7.1
9.9
*
8.4
18.3
-1.0
5.5
NW
Hispanic
NW Male Male
Ratio Sig. Disparity Ratio
1.2
4.6
1.1
1.4
*
12.9
1.2
1.6
*
12.4
1.3
1.9
4.4
1.2
1.2
10.0
1.2
1.7
0.5
1.0
1.6
*
4.8
1.1
1.9
*
10.2
1.3
0.9
-0.7
1.0
1.1
*
1.9
1.0
1.2
-3.2
0.9
1.2
*
4.6
1.1
1.4
*
-1.4
1.0
1.0
2.8
1.0
1.1
*
3.2
1.0
*
-
*
-
-
*
-
-
*
-
*
Sig.
-
90
Agency
Cheshire
Chester
Chesterfield
Chicopee
Chilmark
Clarksburg
Clinton
Cohasset
Colrain
Concord
Conway
CSX
Cummington
Dalton
Danvers
Dartmouth
Dedham
Deerfield
Dennis
Dighton
Douglas
Dover
Dracut
Dudley
Dunstable
Duxbury
E. Bridgewater
E. Brookfield
E. Longmeadow
Eastham
Easthampton
4. Citations & Warnings
Total
3,818
3,574
1,122
3,358
1,975
1,225
2,151
1,702
1,118
2,554
-
NonNonWhite White
Black
Citations Warnings Disparity Ratio Sig. Disparity
2,145
1,673
11.9
1.4
*
12.5
1,537
2,037
0.6
1.0
0.1
717
405
5.4
1.2
3.8
1,577
1,781
1.0
1.0
-1.8
770
1,205
3.9
1.1
2.0
391
834
0.4
1.0
-8.0
518
1,633
11.3
1.2
*
9.7
291
1,411
9.1
1.1
11.3
639
479
14.7
1.5
*
14.0
941
1,613
1.7
1.0
-1.7
Black
Ratio
1.2
1.0
1.1
1.0
1.1
0.7
1.4
1.7
1.2
1.0
-
Hispanic
Sig. Disparity
*
11.7
2.6
13.2
9.2
13.5
1.5
19.6
16.6
19.9
-4.3
-
NW
Hispanic
NW Male Male
Ratio Sig. Disparity Ratio
1.2
*
9.2
1.2
1.1
-1.3
1.0
1.2
9.0
1.1
1.2
*
-0.3
1.0
1.3
1.3
1.0
1.0
-11.5
0.7
1.9
*
9.1
1.3
2.0
7.7
1.4
1.4
13.9
1.2
0.9
-0.4
1.0
-
-
-
-
-
-
Sig.
*
-
91
Hamilton
Agency
Easton
Edgartown
Egremont
Environmental PD
Erving
Essex
Everett
Fairhaven
Fall River
Falmouth
Ferneld State School
Fitchburg
Foxborough
Framingham
Franklin
Freetown
Gardner
Georgetown
Gill
Gloucester
Goshen
Grafton
Granby
Granville
Greenfield
Groton
Groveland
Gt. Barrington
Hadley
Halifax
4. Citations & Warnings
-
Total
2,644
9,801
4,999
2,428
6,027
2,683
1,127
653
-
-
-
-
-
-
NonNonWhite White
Black
Citations Warnings Disparity Ratio Sig. Disparity
1,870
774
4.6
1.2
*
-0.6
8,527
1,274
1.5
1.1
-2.6
1,196
3,803
5.7
1.1
*
6.9
917
1,511
9.9
1.2
*
-9.9
3,454
2,573
5.1
1.1
*
-4.1
967
1,716
5.5
1.1
-6.2
604
523
1.6
1.0
13.3
249
404
-0.7
1.0
-9.5
-
Black
Ratio
1.0
1.0
1.3
0.7
0.9
0.8
1.2
0.8
-
-
Hispanic
Sig. Disparity
9.0
4.2
*
1.9
15.3
9.7
16.7
4.5
6.3
-
-
-
-
NW
Hispanic
NW Male Male
Ratio Sig. Disparity Ratio
1.1
*
2.1
1.0
1.0
1.9
1.0
1.1
3.1
1.1
1.4
*
11.0
1.3
1.2
*
5.0
1.1
1.5
*
8.3
1.2
1.1
5.4
1.1
1.2
-7.0
0.8
-
-
-
*
*
-
Sig.
-
92
Agency
Hampden
Hanover
Hanson
Hardwick
Harvard
Harwich
Hatfield
Haverhill
Heath
Hingham
Hinsdale
Holbrook
Holden
Holland
Holliston
Holyoke
Hopedale
Hopkinton
Hubbardston
Hudson
Hull
Huntington
Ipswich
Kingston
Lakeville
Lancaster
Lanesborough
Lawrence
Lee
Leicester
Lenox
4. Citations & Warnings
Total
1,685
1,146
1,741
1,794
191
1,231
576
1,830
7,735
1,022
1,738
NonNonWhite White
Black
Citations Warnings Disparity Ratio Sig. Disparity
990
695
0.2
1.0
-7.3
330
816
4.4
1.1
7.1
617
1,124
8.3
1.1
10.5
646
1,148
3.6
1.1
6.9
51
140
40.6
2.2
73.9
649
582
1.5
1.0
-6.8
247
329
5.4
1.1
-5.1
497
1,333
15.3
1.3
*
-7.8
5,385
2,350
5.7
1.2
*
-1.8
549
473
15.2
1.5
*
13.7
719
1,019
6.1
1.1
4.7
Black
Ratio
0.9
1.2
1.3
1.2
3.8
0.9
0.9
0.7
1.0
1.3
1.1
Hispanic
Sig. Disparity
9.5
-1.2
13.3
14.3
73.9
5.3
24.1
25.1
6.0
*
19.1
18.2
NW
Hispanic
NW Male Male
Ratio Sig. Disparity Ratio
1.2
-0.3
1.0
1.0
5.2
1.2
1.4
5.7
1.1
1.4
-4.3
0.9
3.8
71.1
3.5
1.1
-3.0
0.9
1.6
3.8
1.1
2.0
*
11.2
1.4
1.1
*
5.4
1.1
1.4
*
8.2
1.2
1.4
1.0
1.0
*
*
-
*
-
-
-
-
Sig.
-
93
Agency
Leominster
Leverett
Lexington
Leyden
Lincoln
Littleton
Longmeadow
Lowell
Ludlow
Lunenburg
Lynn
Lynnfield
MA Maritime Police
Malden
Manchester
Mansfield
Marblehead
Marion
Marlborough
Marshfield
Mashpee
Massasoit CC
Mattapoisett
Maynard
MBTA
Medfield
Medford
Medway
Melrose
Mendon
Merrimac
4. Citations & Warnings
Total
1,541
2,344
1,599
1,217
4,073
10,334
4,227
776
518
1,582
-
NonNonWhite White
Black
Citations Warnings Disparity Ratio Sig. Disparity
762
779
8.7
1.2
*
1.4
1,379
965
11.8
1.4
*
0.6
764
835
12.9
1.3
*
11.8
289
928
4.3
1.1
0.7
3,291
782
-0.1
1.0
-4.0
6,493
3,841
2.2
1.1
*
21.4
2,489
1,738
12.1
1.4
*
8.6
178
598
6.6
1.1
-4.2
88
430
8.3
1.1
16.5
311
1,271
21.6
1.4
*
24.5
Black
Ratio
1.0
1.0
1.3
1.0
1.0
1.6
1.2
0.8
2.0
2.4
-
Hispanic
Sig. Disparity
12.7
4.1
18.4
18.4
3.2
28.3
*
14.8
25.0
8.2
*
22.1
-
NW
Hispanic
NW Male Male
Ratio Sig. Disparity Ratio
1.3
*
11.2
1.2
1.1
9.3
1.2
1.4
*
9.0
1.2
1.8
*
3.7
1.1
1.0
-1.4
1.0
1.7
*
3.8
1.1
1.3
*
9.4
1.2
2.1
8
3.9
1.1
1.5
3.6
1.2
2.2
*
21.5
2.0
*
-
-
*
*
-
-
Sig.
*
*
-
94
Agency
Methuen
Metro Police Lwr. Basin
Metro Police Marine
Middleborough
Middleton
Milford
Millbury
Millis
Millville
Milton
Monroe
Monson
Montague
Monterey
Mt Wachusett CC
N. Adams
N. Andover
N. Attleborough
N. Brookfield
N. Reading
Nahant
Nantucket
Natick
Needham
New Bedford
New Braintree
New Marlborough
New Salem
Newbury
Newburyport
Newton
4. Citations & Warnings
Total
2,580
1,686
415
2,846
2,452
4,959
1,517
2,669
1,961
9,301
NonNonWhite White
Black
Citations Warnings Disparity Ratio Sig. Disparity
1,486
1,094
9.6
1.3
*
1.5
443
1,243
15.5
1.3
*
5.9
226
189
13.3
13.1
1.4
1,896
950
11.7
1.5
*
6.0
1,649
803
0.8
1.0
-19.5
3,496
1,463
6.5
1.3
*
4.0
422
1,095
9.2
1.1
*
2.8
1,926
743
6.9
1.3
*
4.2
782
1,179
13.9
1.3
*
-3.8
2,918
6,383
1.9
1.0
-4.9
Black
Ratio
1.0
1.2
1.2
1.1
0.7
1.1
1.1
1.1
0.9
0.8
Hispanic
Sig. Disparity
10.4
26.4
21.6
15.0
10.4
7.1
15.4
12.3
6.7
6.3
NW
Hispanic
NW Male Male
Ratio Sig. Disparity Ratio
1.2
*
7.8
1.1
2.1
*
14.0
1.5
1.4
18.7
1.3
1.2
*
8.6
1.1
1.2
*
-3.2
1.0
1.1
*
2.6
1.0
1.6
*
13.6
1.5
1.2
*
4.5
1.1
1.2
1.1
1.0
1.2
*
2.9
1.1
-
*
-
*
Sig.
*
*
95
Agency
Norfolk
Northampton
Northborough
Northbridge
Northfield
Norton
Norwell
Norwood
Oak Bluffs
Oakham
Orange
Orleans
Otis
Oxford
Palmer
Paxton
Peabody
Pelham
Pembroke
Pepperell
Peru
Petersham
Phillipston
Pittsfield
Plainfield
Plainville
Plymouth
Plympton
Princeton
Provincetown
Quincy
4. Citations & Warnings
Total
900
1,989
2,137
840
3,259
1,772
3,141
1,105
1,950
5,211
364
4,014
NonNonWhite White
Black
Citations Warnings Disparity Ratio Sig. Disparity
177
723
-1.5
1.0
-7.2
1,134
855
7.6
1.2
*
6.9
326
1,811
2.0
1.0
-5.8
308
532
-6.2
0.9
-1.6
1,192
2,067
9.4
1.2
*
6.3
746
1,026
11.7
1.3
*
8.3
1,709
1,432
12.7
1.4
*
3.3
275
830
4.8
1.1
-24.5
1,165
785
-2.2
0.9
-11.0
1,373
3,838
8.4
1.1
*
4.2
149
215
12.6
1.3
13.3
837
3,177
8.3
1.1
*
4.7
Black
Ratio
0.6
1.1
0.6
1.0
1.2
1.2
1.1
0.0
0.8
1.2
1.3
1.2
Hispanic
Sig. Disparity
10.3
7.9
12.1
-5.5
19.5
40.1
18.3
14.0
18.2
23.1
-7.2
16.6
NW
Hispanic
NW Male Male
Ratio Sig. Disparity Ratio
1.5
0.6
1.0
1.1
7.3
1.1
1.8
1.2
1.1
0.9
-4.4
0.9
1.5
*
9.8
1.3
2.0
*
11.0
1.2
1.3
*
7.7
1.1
1.6
0.1
1.0
1.3
*
-1.1
1.0
1.9
*
8.8
1.3
0.8
18.1
1.4
1.9
*
6.6
1.3
*
*
-
-
*
-
*
-
-
-
Sig.
96
Agency
Randolph
Raynham
Reading
Registry of MV
Rehoboth
Revere
Rochester
Rockland
Rockport
Rowe
Rowley
Royalston
Rutland
S. Hadley
Salem
Salisbury
Sandisfield
Sandwich
Saugus
Savoy
Scituate
Seekonk
Sharon
Sheffield
Shelburne
Sherborn
Shirley
Shrewsbury
Shutesbury
Somerset
Somerville
4. Citations & Warnings
Total
1,909
1,995
2,973
1,769
489
655
454
2,142
227
996
489
3,444
2,056
2,368
NonNonWhite White
Black
Citations Warnings Disparity Ratio Sig. Disparity
1,219
690
9.1
1.3
*
8.2
164
1,831
5.3
1.1
4.0
2,133
840
19.3
2.5
*
17.9
1,032
737
14.1
1.5
*
5.6
253
236
12.2
1.3
17.3
170
485
6.7
1.1
-4.0
93
361
-3.9
1.0
-29.1
1,258
884
-12.5
0.8
-31.0
181
46
-30.8
0.4
8.6
418
578
5.9
1.1
2.9
105
384
4.5
1.1
11.9
1,763
1,681
15.6
1.4
*
4.1
681
1,375
11.8
1.2
*
0.0
1,812
556
3.8
1.2
*
5.8
Black
Ratio
1.1
1.5
1.3
1.1
1.7
0.8
0.5
0.6
1.2
1.1
1.2
1.1
1.0
1.1
Hispanic
Sig. Disparity
*
13.1
5.8
*
21.2
29.0
-5.6
-20.7
2.8
-31.0
5.8
4.2
*
22.7
27.1
6.8
16.5
NW
Hispanic
NW Male Male
Ratio Sig. Disparity Ratio
1.2
*
8.7
1.1
1.7
4.5
1.4
1.3
*
15.6
1.2
1.5
*
13.5
1.2
0.8
-3.5
0.9
0.0
1.4
1.1
1.0
-15.0
0.8
0.6
-27.5
0.7
1.1
3.2
1.1
1.2
3.9
1.2
1.5
*
10.2
1.2
1.8
*
6.8
1.2
1.1
*
3.0
1.0
1.3
10.6
1.2
-
*
-
-
-
-
*
*
-
Sig.
*
-
97
NonNonWhite White
Black
Agency
Total Citations Warnings Disparity Ratio Sig. Disparity
Somerville Housing Auth.
Southampton
Southborough
1,509
581
928
1.4
1.0
-3.4
Southbridge
950
584
366
-2.3
0.9
-6.2
Southwick
485
175
310
34.0
2.1
*
40.0
Spencer
Springfield
10,471 6,409
4,062
10.8
1.3
*
7.6
State Fire Marshal
State Police (All)
346,137 297,615 48,522
-0.2
1.0
-2.0
Sterling
Stockbridge
Stoneham
Stoughton
1,717
1,370
347
4.1
1.2
-1.8
Stow
Sturbridge
1,595
1,080
515
13.6
1.7
*
2.5
Sudbury
2,629
692
1,937
12.6
1.2
*
4.5
Sunderland
Sutton
Swampscott
Swansea
Taunton
1,342
816
526
3.4
1.1
4.2
Templeton
Templeton Dev. Cent.
Tewksbury
Tisbury
Tolland
Topsfield
Townsend
1,145
351
794
4.6
1.1
2.9
Truro
590
303
287
21.6
1.7
*
32.0
Tufts University
Tyngsborough
1,134
574
560
-1.1
1.0
-0.4
4. Citations & Warnings
Black
Ratio
0.9
0.9
2.1
1.1
1.0
1.0
1.0
1.2
1.1
1.1
1.7
1.0
Hispanic
Sig. Disparity
9.5
1.5
22.1
*
13.9
0.2
14.8
16.8
18.1
2.5
12.5
*
1.0
-0.4
NW
Hispanic
NW Male Male
Ratio Sig. Disparity Ratio
1.2
*
-2.8
0.9
1.0
-0.9
1.0
1.6
31.7
1.8
1.2
*
9.6
1.2
1.0
-0.7
1.0
1.2
*
2.8
1.0
1.3
*
11.1
1.2
1.7
*
12.2
1.4
1.0
1.6
1.0
1.4
0.0
1.0
1.0
21.5
1.4
1.0
3.3
1.1
*
-
-
*
*
-
-
*
-
Sig.
-
98
Agency
Tyringham
Univ Of Mass Amherst
Univ Of Mass Boston
Univ Of Mass Dartmouth
Univ Of Mass Lowell
Univ Of Mass Worcester
Upton
Uxbridge
W. Boylston
W. Bridgewater
W. Brookfield
W. Newbury
W. Springfield
W. Stockbridge
W. Tisbury
Wakefield
Wales
Walpole
Waltham
Ware
Wareham
Warren
Warwick
Washington
Watertown
Wayland
Webster
Wellesley
Wellfleet
Wendell
Wenham
4. Citations & Warnings
8,799
4,618
1,371
-
Total
1,287
920
867
1,482
488
1,122
1,375
7,919
663
NonNonWhite White
Black
Citations Warnings Disparity Ratio Sig. Disparity
468
819
15.1
1.3
*
5.4
159
761
4.2
1.1
5.0
409
458
1.3
1.0
-1.7
914
568
9.7
1.3
*
5.0
64
424
17.5
1.2
*
15.2
372
750
14.4
1.3
*
17.4
516
859
17.8
1.4
*
6.8
2,617
5,302
5.1
1.1
*
1.9
345
318
4.1
1.1
12.3
5.3
6,018
2,781
5.7
1.2
*
4.4
2,207
2,411
9.0
1.2
*
4.0
571
800
-2.9
1.0
-12.8
Black
Ratio
1.2
1.3
1.0
1.1
2.3
1.5
1.2
1.1
1.2
1.1
1.1
1.1
0.7
-
Hispanic
Sig. Disparity
25.6
7.8
9.5
15.4
*
54.6
34.1
36.6
9.6
5.1
1.5
*
9.9
12.4
13.9
-
NW
Hispanic
NW Male Male
Ratio Sig. Disparity Ratio
1.7
*
8.7
1.2
1.5
11.1
1.6
1.2
-7.3
0.9
1.3
*
7.8
1.1
5.5
*
19.6
2.4
2.0
*
26.7
1.7
2.0
*
11.7
1.3
1.3
*
4.6
1.1
1.1
1.5
1.0
1.0
3.0
1.0
1.1
*
3.3
1.0
1.3
*
7.3
1.1
1.3
-7.9
0.8
-
*
*
*
*
*
-
Sig.
99
Total
2,923
2,730
2,284
1,781
5,109
1,507
3,081
1,678
3,815
11,106
903
37,211
3,082
1,890
11.0
3.1
4.9
1.3
1.1
1.1
*
*
*
10.1
5.6
2.5
NonNonWhite White
Black
Citations Warnings Disparity Ratio Sig. Disparity
1,101
1,822
3.0
1.1
-5.1
1,410
1,320
6.8
1.2
*
5.1
1,021
1,263
3.4
1.1
-10.9
812
969
3.2
1.1
*
8.0
2,797
2,312
9.1
1.2
*
6.7
619
888
-3.0
1.0
-1.0
1,394
1,687
2.2
1.0
2.2
325
1,353
2.4
1.0
-1.1
2,465
1,350
2.2
1.1
-2.0
9,400
1,706
5.7
1.5
*
2.4
405
498
11.4
1.3
*
19.2
Boston Police Department Districts
Boston (All)
92,879 55,668
District A1 and A15
5,513
2,431
District B2
4,468
2,578
Agency
Westborough
Westfield
Westfield SC
Westford
Westhampton
Westminster
Weston
Westport
Westwood
Weymouth
Whately
Whitman
Wilbraham
Williamsburg
Williamstown
Wilmington
Winchendon
Winchester
Windsor
Winthrop
Woburn
Worcester
Worcester Co. Sheriff
Worthington
Wrentham
Yarmouth
4. Citations & Warnings
1.2
1.1
1.0
Black
Ratio
0.9
1.1
0.8
1.2
1.1
1.0
1.0
0.9
1.0
1.0
1.4
*
*
1.2
1.0
1.2
Hispanic
Sig. Disparity
10.1
7.8
9.4
14.8
8.0
-7.4
7.7
1.5
5.9
*
7.6
*
1.8
*
*
26.2
0.9
5.9
*
NW
Hispanic
NW Male Male
Ratio Sig. Disparity Ratio
1.3
*
5.1
1.1
1.2
5.8
1.1
1.2
-3.5
0.9
1.3
*
3.0
1.1
1.1
6.8
1.1
0.8
-9.0
0.8
1.2
1.9
1.0
1.1
2.8
1.1
1.1
0.4
1.0
1.1
*
5.2
1.1
1.0
7.9
1.2
*
-
-
-
-
*
-
-
-
Sig.
100
Total
4,347
8,535
8,364
4,315
NA
8,905
4,232
6,386
5,799
32,015
Massachusetts State Police Units
State Police (All)
346,137
SP Other (All)
14,582
SP Troop A (All)
53,629
SP Troop B (All)
49,228
SP Troop C (All)
64,418
SP Troop D (All)
53,793
SP Troop E (All)
66,546
SP Troop F (All)
281
SP Troop H (All)
43,630
SP Troop I (All)
NA
Agency
District B3
District D4
District E5
District C6
District A7
District C11
District E13
District D14
District E18
BPD Special Ops
4. Citations & Warnings
297,615
12,656
48,026
39,904
54,459
43,930
60,152
168
38,320
NA
48,522
1,926
5,603
9,324
9,959
9,863
6,394
113
5,310
NA
-0.2
-1.8
1.2
0.3
-0.4
-1.6
-2.0
16.0
-0.7
NA
1.0
0.9
1.1
1.0
1.0
0.9
0.8
1.6
0.9
NA
NA
*
*
-2.0
-6.0
-0.5
-1.4
-2.8
-2.7
-3.0
21.8
-2.2
NA
NonNonWhite White
Black
Citations Warnings Disparity Ratio Sig. Disparity
2,207
2,140
-1.7
1.0
-2.6
3,897
4,638
11.6
1.2
*
11.6
773
7,591
1.3
1.0
*
4.3
1,487
2,828
12.4
1.2
*
9.8
NA
NA
NA
NA NA
NA
5,127
995
5.2
1.3
*
4.0
2,165
2,067
11.1
1.2
*
6.6
2,361
4,025
7.3
1.1
*
-0.2
4,002
1,797
7.5
1.3
*
5.4
26,454
5,561
2.4
1.2
*
0.3
1.0
0.9
1.0
1.0
1.0
1.0
1.0
1.4
1.0
NA
Black
Ratio
1.0
1.3
1.5
1.3
NA
1.1
1.1
1.0
1.1
1.0
NA
*
1.0
1.1
1.0
1.0
1.0
1.0
1.0
1.2
1.0
NA
Hispanic
Sig. Disparity
1.1
*
1.4
*
1.9
*
1.5
NA
NA
*
1.1
*
1.4
1.2
*
1.2
1.1
NA
*
*
NW
Hispanic
NW Male Male
Ratio Sig. Disparity Ratio
-2.6
*
10.9
*
3.7
*
15.5
NA
0.0
*
4.5
*
12.1
*
6.3
*
9.2
*
2.5
Sig.
101
FULL TASK FORCE MEMBERS
Name
Title
Organization
Community:
Lenny Alkins
Mary Bonauto
President
Civil Rights Director
Jeffrey Brown
Pastor & Founder
Al Cardarelli
Lee Charlton
Ray Hammond
Rob Leikind
Professor
President
President
Executive Director
John T. Lu
Jacinta Ma
Associate Justice
Legal and Advocacy
Ron Madnick
Janina Mollett
William Newman
John Reed
Lisa Riddick
William Rodriguez
Executive Director
President
Executive Director
President
President
Executive
Carol Rose
Martin Rosenthal
Henry M. Thomas, III
Juan Vega
Darnell L. Williams
Executive Director
Attorney
President & CEO
Executive Director
President & Chief
Samuel Williams
Director of Transitional
Employment
NAACP-Boston Chapter
Gay and Lesbian Advocates and
Defenders
Union Baptist Church/Boston TenPoint Coalition
UMASS-Boston
NAACP - New Bedford Chapter
Boston Ten Point Coalition
Anti-Defamation League of New
England
Boston Municipal Court Department
Civil Rights Project at Harvard
University
ACLU-Worcester, Massachusetts
NAACP- Springfield Chapter
ACLU-Northampton, Massachusetts
NAACP - Cape and Islands Chapter
NAACP-Merrimack Valley Chapter
La Alianza Hispana and
Director Co-Chair of Institute
on Race and Justice
Advisory Board
ACLU- Massachusetts (Boston)
Brookline, Massachusetts
Urban League of Springfield
Center Latino Chelsea
Urban League of Eastern
Massachusetts
Youth Opportunity Boston and
Co-Chair of Institute on Race
& Justice Advisory Board
District Attorneys:
Andrea Cabral
Dan Conley
Sandra Edwards
Michael O’Keefe
Sheriff
District Attorney
Assist. District Attorney
First Assistant
Suffolk County Sheriff
Suffolk County District Attorney
Plymouth County District Attorney
Cape and Islands District Attorney
102
Federal Government
Michael J. Sullivan
US Attorney
United States Attorneys Office
Law Enforcement:
Kelly Apt
Christina Beaumud
Joseph Carter
Edward F. Davis, III
Ann Marie Doherty
Paul Evans
John Finnegan
Tom Foley
Paula Meara
Kevin Mearn
Merrick
Association
Daniel C. O’Leary
Peter Scott
Ronnie Watson
Chief
Legal Advisor
Chief
Chief
Superintendent
Commissioner
Chief
Col.
Chief
Chief
President
New Bedford Police Department
Cambridge Police Department
MBTA Police Department
Lowell Police Department
Boston Police Department
Boston Police Department
Barnstable Police Department
Massachusetts State Police
Springfield Police Department
Milton Police Department
Massachusetts Police Chiefs
Chief
Captain
Commissioner
Brookline Police Department
Brookline Police Department
Cambridge Police Department
Legislators
Stanley Rosenberg
Byron Rushing
Reed Hillman
Diane Wilkerson
Senator
State Representative
State Representative
Senator
Hampshire/Franklin District
9th Suffolk District
1st Hamden District
2nd Suffolk District
Commonwealth of Massachusetts
State Government Officials
Erin Devoney
Legal Council
Kimberly Hinden
Registrar
Mary Ann Mulhall
Director
Registry of Motor Vehicles
Registry of Motor Vehicles
Registry of Motor Vehicles and
Merritt Rating Board
103
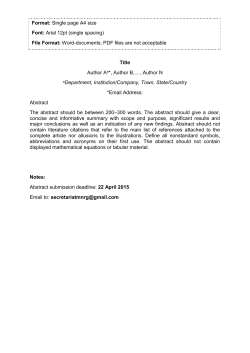


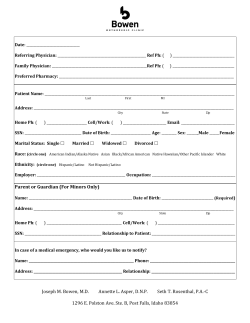
© Copyright 2026