
Matthews Asia Small Companies Fund
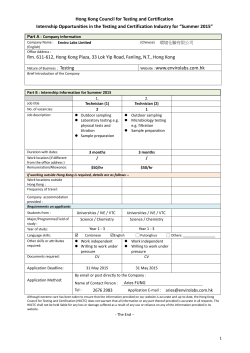
Matthews Asia Small Companies Fund
ASIA small company
Strategies
March 31, 2015
Investment Objective
Long-term capital appreciation
Strategy
FUND FACTS
Investor Class Institutional Class
Ticker
CUSIP
Inception
NAV
Initial Investment
Gross Expense Ratio1
MSMLX
577125206
09/15/08
$21.96
$2,500
1.47%
Portfolio Statistics
Total # of Positions
Net Assets
Weighted Average Market Cap
Portfolio Turnover
MISMX
577125867
04/30/13
$21.97
$3 million
1.25%
79
$747.8 million
$1.2 billion
21.70%2
Benchmark
MSCI AC Asia ex Japan Small Cap Index3
Redemption Fee
2% within first 90 calendar days of purchase
Under normal market conditions, the Matthews Asia Small Companies Fund seeks to
achieve its investment objective by investing at least 80% of its total assets, which
include borrowings for investment purposes, in the common and preferred stocks of
Small Companies located in Asia Ex Japan, which consists of all countries and markets in
Asia excluding Japan but including all other developed, emerging and frontier countries
and markets in the Asian region. The Fund seeks to invest in smaller companies capable
of sustainable growth based on the fundamental characteristics of those companies,
including balance sheet information; number of employees; size and stability of cash
flow; management’s depth, adaptability and integrity; product lines; marketing
strategies; corporate governance; and financial health.
Risks
All investments involve risks, including possible loss of principal. Investing in small companies is
more risky and volatile than investing in large companies. Investing in international and
emerging markets may involve additional risks, such as social and political instability, market
illiquidity, exchange-rate fluctuations, a high level of volatility and limited regulation.
PERFORMANCE AS OF MARCH 31, 2015
Average Annual Total Returns
3 Months
YTD
1 Year
3 Years
5 Years
Matthews International Capital Management,
LLC, the advisor to Matthews Asia Funds, believes
in the long-term growth of Asia, one of the
world’s fastest-growing regions. Since 1991,
we have focused our efforts and expertise in
these countries, investing through a variety of
market environments. Matthews is the largest
dedicated Asia-only investment specialist in the
United States. With $30.0 billion in assets under
management as of March 31, 2015 Matthews
employs a bottom-up, fundamental investment
philosophy with a focus on long-term investment
performance.
Since
Inception
Investor Class (MSMLX)
2.33%
2.33%
9.29%
9.85%
9.33%
n.a.
15.94%
Institutional Class (MISMX)
MSCI AC Asia ex Japan Small Cap
Index
2.38%
2.38%
9.54%
n.a.
n.a.
n.a.
7.29%
5.57%
5.57%
4.95%
7.25%
4.52%
n.a. 10.37%4
GROWTH OF A $10,000 INVESTMENT SINCE INCEPTION—INVESTOR CLASS
$30,000
INVESTMENT APPROACH
10 Years
$26,307
$25,000
Matthews Asia Small Companies Fund
MSCI AC Asia ex Japan Small Cap Index
$20,000
$19,065
$18,558
$15,000
Lipper Pacific ex Japan Funds Category
Average5
$10,000
$5,000
09/08
01/10
05/11
09/12
01/14
03/15
The performance data and graph do not reflect the deduction of taxes that a shareholder would pay on dividends, capital
gain distributions or redemption of fund shares. Values are in US$.
1 Matthews Asia Funds does not charge 12b-1 fees.
2 The lesser of fiscal year 2014 long-term purchase costs or sales proceeds divided by the average monthly market value
of long-term securities.
3 The MSCI All Country Asia ex Japan Small Cap Index is a free float-adjusted market capitalization-weighted small cap
index of the stock markets of China, Hong Kong, India, Indonesia, Malaysia, Philippines, Singapore, South Korea,
Taiwan and Thailand. It is not possible to invest directly in an index. Source: Index data from Morgan Stanley Capital
International and Bloomberg; total return calculations performed by BNY Mellon Investment Servicing (US) Inc.
4 Calculated from 9/15/08.
5 The Lipper Category Average does not reflect sales charges and is based on total return, including reinvestment of
dividends and capital gains for the stated periods. Calculated from 9/30/08.
Performance assumes reinvestment of all dividends and/or distributions before taxes. All performance quoted represents past performance and is no guarantee of future results. Investment
return and principal value will fluctuate with market conditions so that when redeemed, shares may
be worth more or less than their original cost. Current performance may be lower or higher than the
return figures quoted. Returns would have been lower if certain of the Fund’s fees and expenses had
not been waived. For the Fund’s most recent month-end performance visit matthewsasia.com.
FS012_MSMLX_1Q15
Matthews Asia Small Companies Fund
Portfolio Management
March 31, 2015
Lydia So, CFA
Lead Manager
Kenichi Amaki
Co-Manager
TOP TEN HOLDINGS 6
% of Net
Assets
Country
PChome Online, Inc.
Taiwan
2.6%
Sunny Optical Technology Group Co., Ltd.
China/Hong Kong
2.1%
Vitasoy International Holdings, Ltd.
China/Hong Kong
2.0%
Kerry Logistics Network, Ltd.
China/Hong Kong
2.0%
Lee's Pharmaceutical Holdings, Ltd.
China/Hong Kong
1.9%
Security Bank Corp.
Philippines
1.9%
Towngas China Co., Ltd.
China/Hong Kong
1.9%
China Biologic Products, Inc.
China/Hong Kong
1.8%
Vista Land & Lifescapes, Inc.
Philippines
1.8%
ARA Asset Management, Ltd.
Singapore
1.7%
% OF ASSETS IN TOP TEN
19.7%
COUNTRY ALLOCATION (%) 7
Fund
SECTOR ALLOCATION (%) 7
Benchmark Difference
Fund
Benchmark Difference
China/Hong Kong
25.5
30.8
-5.3
Industrials
21.3
14.9
6.4
Taiwan
15.0
19.7
-4.7
Consumer Staples
India
13.4
10.2
3.2
Financials
18.8
6.2
12.6
13.2
20.7
-7.5
South Korea
8.8
18.3
-9.5
Health Care
13.1
7.1
6.0
Singapore
8.0
7.5
0.5
Consumer Discretionary
13.0
18.5
-5.5
Indonesia
7.9
3.4
4.5
Information Technology
12.6
17.8
-5.2
Malaysia
6.5
4.2
2.3
Materials
2.3
9.3
-7.0
Philippines
5.5
1.8
3.7
Utilities
1.9
2.5
-0.6
Thailand
5.1
4.1
1.0
Energy
0.0
2.0
-2.0
Japan
0.4
0.0
0.4
0.0
1.0
-1.0
Vietnam
Cash and Other Assets,
Less Liabilities
0.1
0.0
0.1
Telecom Services
Cash and Other Assets,
Less Liabilities
3.8
0.0
3.8
3.8
0.0
3.8
Source: FactSet Research Systems
Sector data based on MSCI’s revised Global Industry
Classification Standards. For more details,
visit www.msci.com.
Source: FactSet Research Systems
MARKET CAP EXPOSURE (%) 7,8
P/E RATIOS 9
Fund
You should carefully consider the investment objectives, risks, charges and
expenses of the Matthews Asia Funds
before making an investment decision.
A prospectus or summary prospectus
with this and other information about
the Funds may be obtained by visiting matthewsasia.com. Please read the
prospectus carefully before investing
as it explains the risks associated with
investing in international and emerging
markets.
Matthews Asia Funds are distributed in the
United States by Foreside Funds Distributors LLC
Matthews Asia Funds are distributed in Latin
America by HMC Partners
Benchmark Difference
Mega Cap (over $25B)
0.0
0.0
0.0
P/E Using FY1 Estimates
18.2x
Large Cap ($10B-$25B)
0.0
0.0
0.0
P/E Using FY2 Estimates
15.5x
Mid Cap ($3B-$10B)
1.4
5.1
-3.7
94.8
94.9
-0.1
3.8
0.0
3.8
Small Cap (under $3B)
Cash and Other Assets,
Less Liabilities
Beini Zhou, CFA
Co-Manager
Source: FactSet Research Systems
Source: Factset Research Systems (P/E est. as of 03/31/15)
6 Holdings may combine more than one security from the same issuer and related depositary receipts.
7 Percentage values in data are rounded to the nearest tenth of one percent; the values may not sum to 100% due to
rounding.
8 Equity market cap of issuer. The Fund defines Small Companies as companies with market capitalization generally between
$100 million and $3 billion or the largest company included in the Fund’s primary benchmark, the MSCI All Country Asia
ex Japan Small Cap Index. The Portfolio’s market cap exposure breakdown presented is used for comparison purpose and
the definition of the capitalization breakdown is from MSCI.
9 The P/E figures represent the Weighted Harmonic Average P/E—which measures the price/earnings ratio of the Fund’s
entire portfolio, excluding negative earners—weighted by the size of the company’s position within the portfolio. P/E
estimates are forward looking. There is no guarantee that portfolio composition will remain unchanged or P/E estimates
will be achieved.
800.789.ASIA | matthewsasia.com
©2015 Matthews International Capital Management, LLC


© Copyright 2026