
- McCutcheon Lab: Membrane Separations Laboratory
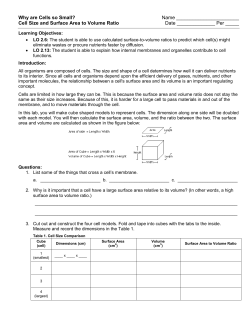
Desalination 312 (2013) 23–30
Contents lists available at SciVerse ScienceDirect
Desalination
journal homepage: www.elsevier.com/locate/desal
Point of use water treatment with forward osmosis for emergency relief
Ethan Butler, Andrew Silva, Kyle Horton, Zachary Rom, Malgorzata Chwatko,
Arie Havasov, Jeffrey R. McCutcheon ⁎
Department of Chemical and Biomolecular Engineering, University of Connecticut, Center for Environmental Sciences and Engineering, Engineers Without Borders, USA-UCONN
H I G H L I G H T S
►
►
►
►
►
A commercially available forward osmosis system was evaluated for use in disaster relief.
Heavy metal rejection was evaluated using a sugar–electrolyte draw solution.
The impact of various cleaning agents on membrane performance was tested.
System dilution factors were tested for various draw solution flow rates.
An economic model demonstrated ways to minimize cost of the clean drink product.
a r t i c l e
i n f o
Article history:
Received 2 September 2012
Received in revised form 18 December 2012
Accepted 18 December 2012
Available online 20 January 2013
Keywords:
Forward osmosis
Disaster relief
Heavy metals
a b s t r a c t
In emergencies, access to water plays a critical role in limiting loss of life. Point of use water treatment (PoUWT) is
increasingly being used to fill this need. One emerging PoUWT technology is Hydration Technology Innovations'™
(HTI's) osmotic water purification system, which produces a clean sugar–electrolyte drink from almost any water
source. This drink not only hydrates users, but also relieves malnutrition and diarrheal illness, two of the most
prolific killers in refugee camps and disaster relief scenarios. In this study, HTI's HydroWell™ system is independently evaluated for on contaminant removal, cost, and material availability. Bench-top testing showed that
HTI's systems have superior contaminant removal, rejecting >88.3% of copper, lead, arsenic, and chromium at
concentrations of 10 mg/L. The cost of the drink could be minimized to 0.23 USD/L by adjusting process variables.
A sensitivity analysis showed significant room for cost reductions, especially if draw solutes could be locally
sourced or if the system lifetime could be extended through the use of cleaning reagents or pretreatment. Further
research on long-term operations and maintenance and community–technology interaction could yield more
information about the efficacy of forward osmosis for this application.
© 2013 Elsevier B.V. All rights reserved.
1. Introduction and background
1.1. Water's role in emergency and population migration scenarios
Globally, 780 million people do not have access to an improved
water source [1]. Many of these people are victims of emergencies,
including: 1.) natural disasters such as hurricanes, tsunamis, and
flooding; 2.) complex emergencies, where external or internal conflict causes some major erosion of authority or 3.) disease outbreaks
such as cholera, typhoid fever, and dysentery. There have been a total
of 1934 emergencies reported between 1995 and 2004 [2] and the
rate at which these events occur is increasing [3]. Moreover, the
⁎ Corresponding author at: 191 Auditorium Road, Unit 3222, Storrs, CT 06269-3222,
USA. Tel.: +1 860 486 4601.
E-mail address: [email protected] (J.R. McCutcheon).
0011-9164/$ – see front matter © 2013 Elsevier B.V. All rights reserved.
http://dx.doi.org/10.1016/j.desal.2012.12.013
impact of these emergencies is significant. Between 1995 and 2004,
natural disasters alone affected 2.5 billion people, caused 890,000
deaths, and cost 570 billion USD in economic consequences [4].
Emergencies often result in population migration, during which
populations become: 1.) refugees by fleeing across an international
border; 2.) internally displaced people (IDP) by fleeing, but remaining
within their own country or 3.) entrapped people, by remaining within
their own community. People in all these scenarios suffer from poor
public health and lack of availability to basic resources [5,6].
During emergencies and the resulting population migration,
access to safe drinking water plays a critical role in saving lives. Excess mortality is often contributed to by diarrheal illness caused by
unsafe drinking water in refugee and IDP camps [5]. In fact, in the
1988 flooding disaster in Bangladesh, diarrheal illness was found
to be the largest cause of death for people under the age of 26 [7].
To prevent mortality from diarrheal illness, the first priority for
emergency mitigation is to provide potable water, sanitation and
site planning [6].
24
E. Butler et al. / Desalination 312 (2013) 23–30
1.2. Point-of-use water treatment (PoUWT) for emergency relief
There are two conventional methods of providing potable water
during emergencies and population migration. The first is to package
treated water and transport it by truck, air or foot to the site. Distributing water in this way is costly and logistically difficult. Another
standard practice is boiling. Though boiling does improve the microbiological quality of waters [8], it has been shown to be ineffective in
certain scenarios due to lack of fuel availability, and poor communication of proper boiling and safe water storage (SWS) techniques
[9].
A promising alternative to providing access to safe drinking water
in emergencies is through the use of point-of-use water treatment
(PoUWT) technologies. In humanitarian development scenarios, water
is increasingly being provided to people in need by PoUWT technologies
such as flocculants, disinfectants, ceramic filters, sand filters and solar
disinfection (SODIS). These technologies have been proven to be effective in many controlled studies [10–18], which is why the World Health
Organization (WHO) promotes PoUWT to produce safe drinking water
in the development context. The effectiveness of PoUWT in humanitarian development scenarios has led to an exponential increase in its use
for emergencies and population migration, from 1999 to 2007 [9].
PoUWT can be exceptionally effective in certain types and stages
of emergencies. Three stages of emergencies are commonly defined
on what is known as the relief-to-development continuum: the ‘acute
emergency stage,’ when acute needs take precedence; the ‘late emergency stage,’ when the focus shifts to public health programming; and
the ‘post emergency stage,’ when the focus shifts from relief to development [19]. In a recent review conducted by the London School of Hygiene
and Tropical Medicine and the United States Agency for International
Development (USAID) [9], PoUWT was shown to have a no more than
20% adoption in the acute emergency stage. However, PoUWT has been
shown to be effective in the late emergency stage, and can have continued
use during the post emergency stage. Moreover, the review identified
three emergency scenarios under which PoUWT has been shown to be
particularly effective: disaster relief, complex emergencies where relief
cannot progress into development and in response to disease outbreaks
caused by unsafe drinking water.
1.3. Evaluating PoUWT technologies
For the purposes of this work, five metrics are proposed to evaluate
PoUWT technologies for use in emergencies and population migration:
1.) Production capacity. Any PoUWT technology must have an adequate water production capacity for the targeted community
size. Ideally, the PoUWT must have a flexible production capacity to accommodate for any logistic and social challenges.
2.) Contaminant removal/deactivation. Treatment for bacteria, viruses
and protozoa is essential. Treatment for more persistent contaminants, such as heavy metals, is also worthy of consideration since
these contaminants, which can include elements such as arsenic,
chromium, cadmium, lead, mercury amongst others, are increasingly being found in the waters of disaster-prone regions [20,21].
3.) Process economics. The total cost of materials, distribution, training, and follow-up must be considered, as cost can be a limiting
factor in emergencies.
4.) Operations and maintenance (O&M). Any PoUWT technology must
be simple, durable, robust, and easy to operate and maintain,
particularly as it is likely that unskilled workers will be responsible for O&M.
5.) Material availability. Locally available materials must be leveraged
in as many aspects of construction, operations, and maintenance
as possible because material availability significantly impacts distribution costs, community acceptance and project sustainability.
6.) Community–technology interaction. This can include a broad range
of factors that impact the adoption of PoUWT technologies, including but not limited to: taste of water, ease of use, historical
experiences with water, and social/cultural aspects.
The metrics outlined above are useful for evaluating and improving
PoUWT technologies. However, many of the metrics are qualitative and
based on community-specific considerations, making objective comparisons between different technologies difficult. Such a comparison
can be made with quantitative data about PoUWT methods such as
treatment efficiency, cost per liter of water, community compliance
rate, and community diarrheal illness reduction. Table 1 summarizes
these metrics for PoUWT technologies that have documented use in
emergency situations. Boiling was not included in this review, as few
studies could be found on its efficacy.
Most of the systems in Table 1 have high treatment efficiency and
are reasonably priced. There are also large discrepancies in compliance rate and diarrheal illness reduction for all PoUWT options. This
is due to the fact that these metrics are largely driven by training,
follow-up and implementation programming, which varies from
study to study.
Although many of the technologies in Table 1 have been shown to
be effective, none have been shown to remove a broad range of persistent contaminants, such as inorganics like heavy metals.
1.4. Forward Osmosis (FO)
Forward Osmosis (FO) is an emerging water purification technology
that could be used to remove biological, inorganic, and organic contaminants with no electricity [22,23]. FO exploits osmotic flow, which is
defined as the movement of water from a region of higher water potential to a region of lower water potential.
A concentrated draw solution is used to draw water from a contaminated source across a selectively-permeable membrane. This membrane allows water to pass, while rejecting the contaminants. The result
is concentrated feed water, which can be diluted into the source, and a
dilute draw solution. This draw solution can be made of removable or
edible solutes so that the end product can be pure water, or a consumable
hydrating solution, respectively. In the latter case, the process could be
considered an osmotic dilution (OD), which is similar to direct osmotic
concentration (DOC), with the exception that the final product in OD is
the diluted draw-solution instead of the concentrated feed-solution.
The generalized equation describing water transport for FO [24] is:
J w ¼ Aðσ D πD −σ F πF Þ
ð1Þ
where Jw is the water flux, A is the hydraulic water permeability, σ is
the reflection coefficient, and π is the osmotic pressure. The subscripts
D and F denote the draw solution and feed solution, respectively.
1.5. Hydration technology innovations' osmotic water purification systems
Hydration Technology Innovations™ (HTI) has designed osmotic
water purification systems that utilize a concentrated sugar–electrolyte
solution as a draw solution [25,26]. The result is a hydrating drink, similar to Gatorade™ or Pedialyte™ that can also alleviate users from
malnutrition and diarrheal illness, two of the most prolific killers
in emergencies and population migration.
Two systems of particular interest are the HydroWell™ and
HydroWell Village System™. Both systems use essentially the same
process, but the HydroWell is designed for a household-scale use, producing 0.7 to 1.2 L/h, while the HydroWell Village System is designed
for community-scale use, producing 600 to 800 L/h per module. The
HydroWell's and HydroWell Village System's membrane modules are
both about 47 cm tall and 7.5 and 34 cm in diameter respectively.
E. Butler et al. / Desalination 312 (2013) 23–30
25
Table 1
Existing PoUWT technologies surveyed in the literature [9,50,51].
Treatment efficiency (%)
Cost per liter (USD/L)a
Compliance ratea (%)
Diarrheal Illness Reduction (%)
a
Flocculent/disinfectant
powders (PuR)
Chlorine tablets
(Aquatabs)
Sodium hypochlorite
(SWS)
Ceramic filtration
BioSand filtration
Solar disinfection
Bacteria: >99
Viruses: >99
Protozoa: >99
0.0035
10 to 95.4
19 to 83
Bacteria: >99
Viruses: >99
Protozoa: >99
0.0005
10 to 30
5
Bacteria: >99
Viruses: >99
Protozoa: >99
0.00008–0.00033
3 to 76.7
25 to 84
Bacteria: 99
Viruses: 68
Protozoa: >99
0.001–0.004
23 to 96
Not available
Bacteria: 90
Viruses: 68
Protozoa: 99
0.0008–0.007
Not available
Not available
Bacteria: >99
Viruses: 99
Protozoa: 90
0.0006
Not available
Not available
Only raw material costs included.
HTI's process is depicted by Fig. 1. Draw solution is gravity fed into
the membrane module. This module rests in a container of feed water.
In the module, the draw solution is osmotically diluted. The final drink
product is pushed out of the module, via osmosis, into a separate storage container.
HTI's containment vessels, tubing, and fittings are made of either
high density polyethylene or food-grade polyvinyl chloride. The membrane module is spiral-wound, similar to that described by Cath et. al.
[22]. The HydroWell has one leaflet while HydroWell Village System
has four. The membrane used in both modules is HTI's proprietary cartridge membrane, which is referred to as “HTI's membrane” throughout
the rest of this paper. This membrane is comprised of cellulose triacetate with an integrated mesh support and is used widely in previous
literature [27,28].
1.6. Research objectives
The purpose of this work is to evaluate HTI's systems for use in emergency and population migration relief and to establish a foundation upon
which future system improvements can be made. This evaluation will be
based on the metrics for a PoUWT technology established in Section 1.3.
HTI's two systems already have been shown to have an adequate production capacity; however, there are still questions remaining about contaminant removal, process economics, material availability, operations and
maintenance, and community–technology interaction. Three of these
aspects are explored in this work: contaminant removal, process economics, and material availability.
Though the HydroWell and HydroWell Village System have been
shown to meet or surpass reductions in bacteria, viruses, and cysts specified by the US Environmental Protection Agency (US EPA) [26], no data
has been published on the systems' removal of more persistent
contaminants, such as heavy metals. Moreover, though many studies
have been conducted on heavy metal rejection for reverse osmosis
(RO) systems [29,30], none could be found on the rejection of heavy
metals in FO systems. For these reasons, inorganic contaminant removal
in the RO and FO modes are one focus of this work.
For HTI's systems to be a viable PoUWT option, they must be cost
competitive with existing technologies. Due to the high cost of the
membrane and draw solution, HTI's systems will cost more than the
PoUWT options outlined in Table 1. However, it is important to
note that HTI's systems produce a potable drink that can alleviate
diarrheal illness and malnutrition and hydrate the user. Regardless
of the systems' technical advantages, it will still be important to minimize costs and consider the precise scenario where such a system
could be integrated. In this work, the primary system costs are identified and used to model the overall system cost as a function of
process variables. This model is used to determine a cost-minimal operating condition and to conduct a sensitivity analysis on the impact of
cost reductions in key areas.
The membrane module is the primary concern for material availability since the vessels, fittings, and tubing can be easily replaced
with a variety of materials, and the draw solution can be made with
materials that are widely available. The membrane module can
only be made in high-end manufacturing facilities. Furthermore,
like most filters, the membrane is susceptible to fouling. Fouling
can reduce water flux, increase contaminant passage, and reduce
the membrane lifetime [31–33]. Therefore, fouling control and
foulant removal is critical. HTI's recommended cleaning reagent
for fouling control, 10% aqueous sodium metabisulfite (SMBS),
may be available in limited supply in different regions of the world.
For this reason, it is important to assess the impact of other common
cleaning reagents on HTI's membrane. Some reagents can degrade the
Fig. 1. Diagram of HTI's process.
26
E. Butler et al. / Desalination 312 (2013) 23–30
membrane, so the impact of various cleaning reagents on membrane
performance is studied in this work.
were prepared according to EPA Standard Method 200.7 and run
at 10, 5 and 1 times dilution respectively. Triplicates were conducted
for all trials and mean values were reported.
2. Materials and methods
2.2. Process economics
2.1. Contaminant rejection
2.1.1. Reverse Osmosis (RO) mode
HTI's membrane was tested in a bench-top cross-flow RO system.
Copper nitrate trihydrate (Acros Organics, Pittsburgh, PA), lead nitrate
(Fischer Scientific, Pittsburgh, PA), chromium nitrate nonahydrate
(Acros Organics, Pittsburgh, PA), and diarsenic pentoxide (Acros Organics,
Pittsburgh, PA) were tested as model heavy metal contaminants. Feed
solutions of 0.01 M NaCl (Fischer Scientific, Pittsburgh, PA) and 10 ppm
of each heavy metal were prepared in polypropylene vessels with
ultrapure Milli-Q water produced with a Millipore Integral 10
system (Millipore Corporation, Billerica, MA) within an hour before
testing. All solutions were adjusted to a pH of 5.0 ± 0.1 with
0.1 M NaOH(aq) (Fischer Scientific, Pittsburgh, PA) or 0.1 M HCl(aq)
(Sigma Aldrich, St. Louis, MO). No feed spacers were used and the
active layer of the membrane faced the feed solution. All tests
were conducted at 104 psig, 25 °C and 0.6 L/m cross-flow. Rejection was calculated with the following equation:
C
%R ¼ 1− P 100
CF
ð2Þ
where %R is percent rejection, CF is the concentration of the feed
solution and CP is the concentration of the permeate.
2.1.2. Forward Osmosis (FO) mode
HTI's membrane was tested in a lab-scale cross-flow FO system
described previously in the literature [27]. The same feed solutions
as those used in the RO testing were used. Since water flux can impact
observed rejection [29], a draw solution of 260 g/L food-grade sugar
(Domino, Yonkers, NY) was used to produce the same area normalized water flux as that in the RO testing: about 2.4 LMH. No feed
spacers were used and the membrane was oriented in the FO mode,
with the active layer facing the feed solution, to mimic conditions in
the RO system. All tests were conducted at 25 °C and 0.6 L/m crossflow. Tests were run until 25 ± 1 mL of permeate passed through the
membrane in order to insure that contaminants would be within a
detectable range and that the dilution factor, which was about 1.01,
did not exceed a point at which flux would significantly change. Since
the permeate is diluted into the draw solution, Cp cannot be directly
measured in the FO mode. Therefore, the rejection was calculated
using the following equation, in which Cp is substituted by experimentally determinable quantities through the use of a contaminant mass
balance:
Cf;D Vf;D −Ci;D Vi;D
%R ¼ 1−
100
VP CF
ð3Þ
where Cf,D is the final concentration of metal in the draw solution, Vf,D is
the final volume of the draw solution, Ci,D is the initial concentration of
metal in the draw solution, Vi,D is the initial volume of the draw solution
and VP is the total volume of permeate.
2.1.3. Inorganic contaminant concentrations
Heavy metal samples were stored for no more than one week before
analysis in polypropylene centrifuge tubes (CELLTREAT Scientific
Products, Shirley, MA) at 5 °C, after being acidified to a pH below 2
with Optima grade nitric acid (Fischer Scientific, Pittsburgh, PA).
All tests were conducted with a PerkinElmer ELAN DRC-e inductively coupled plasma mass spectrometer (ICP-MS) (PerkinElmer,
Waltham, MA). The feed, draw, and permeate sample solutions
2.2.1. Cost model
The draw solution and membrane module are the two primary
material costs. These costs are related to the total cost per volume
of drink produced (C_ total ) by Eq. (4):
C_ total ¼
Cm
Lm
1
Cb
1
:
þ
D
Vb
Q_
ð4Þ
Where Cm is the cost of the membrane module, Lm is the lifetime of
the membrane module, Q_ is the drink product flow rate, Cb is the cost
of the draw solution per bag of draw solution, Vb is the volume of
draw solution per bag of draw solution, and D is the dilution factor,
which is equivalent to the total volume of product produced divided
by the volume of draw solution used to produce that product. CLmm and
Cb
V b are considered the membrane and draw solution cost constants,
respectively.
2.2.2. HydroWell testing
To determine the cost-minimal operating conditions, tests were
conducted with HTI HydroWell systems (HTI, Albany, OR). NoShok
100 Series Mini Needle Valves (NoShok, Berea, OH) were plumbed
between the draw solution bag and membrane module to control
the draw solution flow rate. Product and draw solution flow rates
were measured each hour. Stock draw solution provided by HTI was
used. All tests were conducted at ambient conditions (22 ± 2 °C).
2.3. Material availability: impact of alternative cleaning reagents on
membrane performance
HTI's membranes were soaked for 24 h in hydrogen peroxide
(Fischer Scientific, Pittsburgh, PA), sodium hypochlorite (Fischer
Scientific, Pittsburgh, PA), ethanol (ENG Scientific, Clifton, NJ), sodium
dodecyl sulfate (Acros Organics, Pittsburgh, PA), Minncare™ (Mar Cor
Purification, Philadelphia, PA), and sodium metabisulfite (Acros Organics,
Pittsburgh, PA), at the concentrations shown in Table 2.
These cleaning reagents and concentrations were chosen based on
reagents and values found in the literature [34–36]. The 24 h soak
time corresponds to the expected time of exposure to the cleaning
reagents during the membrane's lifetime, given a consistent cleaning
protocol. These membranes were soaked in ultrapure Milli-Q water
for 24 h prior to characterization. After exposure, membranes were
characterized with hydraulic water permeability tests and NaCl
rejection tests. Hydraulic water permeability tests were conducted
at 0.5 L/m cross-flow, 25 °C, and 150, 200, 250 and 300 psig with
an ultrapure Milli-Q water feed. NaCl rejection was determined at
0.5 L/m cross-flow, 25 °C, and 225 psig with a 2000 mg/L NaCl feed
solution.
Table 2
Test matrix of cleaning solutions used in the membrane degradation study.
Reagents
Concentration (% mass)
Minncare™ (MC)a
Ethanol (EtOH)
Sodium hypochlorite (NaClO)
Hydrogen peroxide (H2O2)
Sodium dodecyl sulfate (SDS)
Sodium metabisulfite (SMBS)
100
50
0.5
0.1
0.4
14
a
A proprietary blend of peracetic acid, acetic acid, and hydrogen peroxide.
E. Butler et al. / Desalination 312 (2013) 23–30
3. Results and discussion
3.1. Contaminant rejection
Fig. 2 is a summary of all the observed rejection data from RO and
FO testing. All average observed rejections exceed 88.3% for both
tests. Previous studies of HTI's membranes also show high rejection
of monovalent salts [27,37]. It has been shown that cations with
higher valences are rejected more easily than cations with lower
valences because hydrated radius increases with valence [30]. Moreover, previous studies show comparably high rejections of heavy
metals for cellulose acetate membranes [29,30]. Therefore, the high
observed rejections were expected. Arsenic and chromium should
show higher rejections in the RO testing due to their higher valence;
however, since rejections are so high for all species, there was no
discernible difference within experimental error.
The sugar draw solution used for the FO studies was composed of
mostly nonpolar solutes. Having a nonpolar draw solution should
negate any charge effects that could impact rejection. Without charge
effects, the FO and RO process should have similar rejections of species
under similar conditions. Though the observed rejection in the FO tests
is lower for copper, arsenic and lead and higher for chromium compared to the observed rejection in the RO tests, the rejection values
are similar within experimental error. Discrepancies in rejection could
be caused by a variety of factors, including solute coupled diffusion
[37], as the sugar used for the draw solution did have impurities.
It is also important to qualify the observed rejections in Fig. 2
with the experimental limits of the test. In the FO tests, the permeate
is diluted into a bulk draw solution. From this dilution, and the minimum detection limit of the ICP-MS, it is possible to calculate the
maximum observable rejection. For the chromium, copper, lead and
arsenic tests, the maximum observable rejections are 99.5, 99.5, 99.9
and 99.5% respectively. Observed rejections for chromium exceeded
maximum observable rejection for the FO tests, but it can only confidently be said that the maximum observable rejections have been
achieved.
This study does not necessarily indicate the performance of HTI's
system for all conditions. Though the metals used in this study should
be indicative of the rejection of metals with similar hydrated radii and
chemistry, it is not indicative for all inorganic pollutants. For instance,
mercury can be found in a variety of forms, including methyl mercury.
It is possible that such organometallic contaminants would exhibit
different rejection values. Heavy metal rejection is largely dependent
on the feed water. For instance, pH can change both the speciation of
heavy metals [38–42] and membrane properties [43]. Moreover, the
presence of other solutes, such as natural organic matter or electrolytes, can significantly impact the rejection by either complexing with
Reverse Osmosis Mode
Forward Osmosis Mode
27
heavy metals, or by contributing to charge effects [44–47]. Beyond considerations of the feed water, HTI's system is stagnant on the feed water
side unlike the cross-flow systems used to characterize HTI's membrane. This results in significant concentration polarization differences
that can impact salt flux. Additionally, the tests conducted were at a
higher area normalized water flux than that of HTI's systems, which
could lead to higher observed rejections. Nevertheless, the results
shown in Fig. 2 indicate that the rejections of these metals are quite
high, particularly given that the feed concentrations used in this work
far exceed what is typically found in the natural environment [20,21].
3.2. Process economics
3.2.1. Cost model
Data collected on product flow rate and dilution factor from HTI's
HydroWell system is presented in Fig. 3. A fourth order polynomial
was used to average the experimental data obtained for dilution
factors over a range of product flow rates (R = 0.92). The polynomial
terms were not manipulated once the equation was calculated for the
line of best fit. This equation was then used in the overall cost model
to calculate variable process and product costs across a range of product flow rates. Note that the product flow rate and dilution factor are
inversely related. This is an expected result since, if the draw solution
flow rate is slow, each volume of draw solution has a long residence
time within the membrane module and the draw solution is diluted
significantly by the permeate before exiting the module. The dilution
results in a lower mean osmotic pressure in the membrane module,
which, by Eq. (1), leads to a low water flux through the membrane.
A low draw solution flow rate and a low water flux result in a low
product flow rate since the product flow rate is the sum of the draw
solution flow rate and water flux, assuming negligible reverse solute
flux across the membrane. On the other hand, if the draw solution
flow rate is fast, each volume of draw solution has a small residence
time and the draw solution is still concentrated while exiting the module. This results in a high mean osmotic pressure throughout the system, which leads to a high water flux. This larger water flux and draw
solution flow rate results in a higher product flow rate.
Since product flow rate and dilution factor are related inversely,
there must be an operating condition that will yield the minimum
cost of product.
3.2.2. Sensitivity analysis
To determine the operating condition for minimal product cost, the
polynomial equation derived in Fig. 3 was combined with Eq. (4). Retail
prices for the HydroWell were used for membrane and draw solution
cost. These values were 178.95 USD and 10.12 USD/L respectively. HTI
claims that their membrane will last 30 to 90 days in the field.
90 days was used for the calculations presented here. Based on these
numbers, the system could be operated at draw solution and product
120
100
Dillution Factor
Rejection (%)
100
90
80
70
80
60
40
20
60
Chromium (III)
Copper (II)
Lead (II)
Arsenic (V)
Fig. 2. Removal of chromium (III), copper (II), lead (II) and arsenic (V) at pH 5, 0.01 M
NaCl, 2.4 LMH water flux, 0.6 L/m cross-flow velocity and 25 °C. The Reynolds numbers
of the feed and draw solution side were 770 and 650, respectively.
0
0
0.5
1
1.5
2
2.5
Product Flow (L/h)
Fig. 3. Dilution factor as a function of product flow rate from HydroWell data at ~22 °C.
E. Butler et al. / Desalination 312 (2013) 23–30
Retail Cost
200% Membrane Longevity
400% Membrane Longevity
Product Cost ($/L)
0.60
0.50
0.40
0.30
0.20
0.10
0.00
0
0.5
1
1.5
2
Retail Cost
50% Draw Solution Cost
25% Draw Solution Cost
0.60
Product Cost ($/L)
flow rate of 0.06 and 0.6 L/h respectively at a minimal cost of 0.23 USD/L
of drink product.
Cost reductions can be achieved through decreasing the membrane and draw solution cost and by increasing the membrane lifetime. The membrane cost can be decreased by reducing manufacturing
and distribution costs. Increased membrane lifetime can be actualized
by using better cleaning reagents and pretreatment systems that remove
harmful foulants. The draw solution cost can be decreased by reducing
manufacturing and distribution costs, purchasing in bulk, or locally sourcing the draw solutes and having methods of synthesizing draw solution
on-site. A sensitivity analysis of these cost reductions was conducted
and the results are illustrated Figs. 4 and 5.
Fig. 4 illustrates that as the membrane cost decreases and lifetime
increases, the optimum product flow rate decreases. This behavior
occurs because the membrane costs become smaller relative to the
draw solution costs, thus the draw solution drives product cost. Therefore, it is desirable to increase the dilution factor so that the maximum
amount of product is produced per liter of draw solution. Since dilution
factor and product flow rate are inversely related, increasing the dilution factor to minimize product cost will result in a low product flow
rate. Conversely, Fig. 5 shows that as the draw solution cost decreases,
the lowest cost product flow rate shifts to higher draw solution flow
rates. This behavior occurs because as the draw solution costs become
smaller relative to the membrane costs, the membrane becomes the
cost-driving material. Therefore, it is desirable to maximize the product
flow rate so that the maximal volume of product is produced before
membrane failure. However, a high product flow rate means a low
dilution factor and, depending on the draw solution, there is a minimal dilution factor of operation. For HTI's draw solution, this number
is approximately 13. If the dilution factor drops below this point, the
product will be too saline for hydration.
A combination of minimizing the draw solution and membrane
cost constants can significantly reduce the overall system cost. Initial
calculations show that the draw solution can reasonably be reduced
to a cost of 0.60 USD per 13.9 oz HydroWell bag. Furthermore, it
might be reasonable to reduce the cost of the membrane to 150.00
USD in humanitarian situations. In this case, the minimum product
cost would be as low as 0.09 USD/L. Note these values assume that
the filters are used for the duration of their lifetime. If the emergency
progresses into the post emergency phase before the filter are
exhausted, costs would be higher due to waste.
Though the price of HTI's system is high relative to other water
purification systems, it must be considered along with its superior
contaminant removal and the fact that it produces a hydrating solution that has caloric and nutritional value. Since transportation costs
can be a significant percentage of total product costs in emergency
situations, HTI's system may have a cost advantage over transporting
0.50
0.40
0.30
0.20
0.10
0.00
0
0.5
1
1.5
2
Product Flow Rate (L/h)
Fig. 5. Cost sensitivity to 50% and 25% reductions in draw solution cost, based on the
cost model developed in Section 3.2.1.
both treated water and food in its place, depending on the availability
of distribution networks in specific regions of the world.
3.3. Material availability: impact of alternative cleaning reagents on
membrane performance
Figs. 6 and 7 show the impact of select cleaning reagents on the
hydraulic water permeability and NaCl rejection of HTI's membrane
after exposure. Hydrogen peroxide, SDS, and SMBS all have a statistically negligible impact on the membrane's hydraulic water permeability and salt rejection, which means that they are all viable cleaning
reagents. Ethanol and sodium hypochlorite increase the hydraulic
water permeability and decrease the NaCl rejection, indicating that
they are causing degradation in the membrane's performance. Sodium hypochlorite has been shown to cause degradation of cellulose
acetate membranes by oxidizing the alcohol groups to carboxyl,
aldehyde and ketone groups [48]. The ethanol could cause degradation by either dehydrating the membrane, which could cause cracking upon rehydration, or by de-acetylation of the cellulose acetate
[49]. Interestingly, Minncare™ increased hydraulic water permeability while not dramatically affecting salt rejections. This result
was unexpected, but still implies that Minncare™ would be an effective cleaning reagent. Further studies could illuminate the mechanism behind this behavior.
4. Conclusions
HTI's osmotic water purification systems have been proven to
meet four of the six criteria outlined in Section 1.3. for evaluating a
Water Permeability (LMH/Bar)
28
2.0
1.8
1.6
1.4
1.2
1.0
0.8
0.6
0.4
0.2
0.0
H2O
MC
EtOH
NaOCl
H2O2
SDS
SMBS
Product Flow Rate (L/h)
Fig. 4. Cost sensitivity to a 200% and 400% extension of membrane longevity, based on
the cost model developed in Section 3.2.1.
Fig. 6. Hydraulic water permeability of HTI's membrane after 48 h of exposure to
cleaning reagent. Data gathered at 0.5 L/m, 25 °C, and at pressures between 150 and
300 psig. The feed-side Reynolds number was 640.
E. Butler et al. / Desalination 312 (2013) 23–30
100
Nikhil Shah for their contributions to the project. Finally the authors
would like to thank Engineers without Borders, USA-UConn for their
advising and support.
90
NaCl Rejection (%)
29
80
70
60
References
50
40
30
20
10
0
H2O
MC
EtOH
NaOCl
H2O2
SDS
SMBS
Fig. 7. NaCl rejection of HTI's membrane after 48 h of exposure to cleaning reagent.
Data gathered at 0.5 L/m, 25 °C, and 225 psig with a feed of 2000 mg/L NaCl. The
feed-side Reynolds number was 640.
PoUWT technology. Between the HydroWell and Village System,
HTI's systems can provide flexible production capacity suited to
households or community-scale use. Additionally, HTI's systems
have contaminant removal capabilities that exceed any PoUWT technology that has been well documented for emergency relief and population migration scenarios. Though the cost per liter of product may
be high compared to other PoUWT technologies, HTI's systems have
an additional value proposition over existing PoUWT technologies in
that they produce a drink that can alleviate malnutrition and diarrheal illness from water sources heavily contaminated with persistent contaminants such as heavy metals. Still, cost saving will most
likely need to be actualized to make HTI's systems competitive
with existing PoUWT technologies. Finally, though the membrane
must be shipped to the site, most of the systems' materials are readily
available in many countries. A variety of cleaning reagents can be used,
and the draw solution can be made from sugars and electrolytes that are
widely available.
Further evaluation must be conducted in order to fully evaluate
HTI's systems' efficacy in emergency and population migration relief.
HTI's systems have been shown to be technically sound; however, one
of the most important aspects to the success of PoUWT technologies is
how they are received by the community. This will largely determine
the effectiveness of the system at reducing diarrheal illness and maximizing compliance rate. Long term operations and maintenance studies
must be conducted to determine ease of use, robustness, and durability
under extreme conditions. Furthermore, community–technology interaction must be evaluated with controlled trials. Improvements to the
current systems' design may need to be made in order to optimize
their efficacy for emergency and population migration relief. Further
work could result in a system that could save the lives of the people
affected by emergencies.
Acknowledgments
The authors would like to acknowledge the National Science
Foundation (CBET 1067564), United Collegiate Honors Council, the
University of Connecticut Summer Undergraduate Research Fund,
and the University of Connecticut's School Engineering for providing
funding support. A special thanks to Hydration Technology Innovations and Ed Beaudry for providing membrane, HydroWells, and
information on their appropriate use. The authors would also like
to thank Chris Perkins and Sneiguole Stapcinskaite at the University
of Connecticut Center for Environmental Science and Engineering for
providing assistance with the heavy metal analysis. Additionally,
the authors would like to acknowledge Erik Anderson, Benjamin
DeMasi-Sumner, Gabriella Frey, Marie Garofoli, Elise Gilcher, and
[1] WHO/UNICEF Joint Monitoring Programme for Water Supply and Sanitation 2012
Update, United Nations Children's Fund and the World Health Organization,
2012.
[2] P.B. Spiegel, P. Le, M.-T. Ververs, P. Salama, Occurrence and overlap of natural disasters, complex emergencies and epidemics during the past decade (1995–2004),
Conflict and Health 1 (2007).
[3] P. Hoyois, J.-M. Scheyren, R. Below, D. Guha-Sapir, Annual Disaster Statistical Review: Numbers and Trends 2006, The United Nations Office for Disaster Risk Reduction, 2006.
[4] S. Llosa, Climate Change and Disaster Risks: ISDR Recommendations for Action
Now and Post-Kyoto, International Strategy for Disaster Reduction, 2008.
[5] M.J. Toole, R.J. Waldman, Prevention of excess mortality in refugee and displaced
populations in developing countries, J. Am. Med. Assoc. (JAMA) 263 (1990)
3296–3302.
[6] J.T. Watson, M. Gayer, M. Connolly, Epidemics after natural disasters, Emerg.
Infect. Dis. 13 (2007) 1–5.
[7] A.K. Siddique, A.H. Baqui, A. Eusof, K. Zaman, 1988 floods in Bangladesh: pattern
of illness and causes of death, J. Diarrhoeal Dis. Res. 9 (1991) 310–314.
[8] T.F. Clasen, D.H. Thao, S. Boisson, O. Shipin, Microbiological effectiveness and cost
of boiling to disinfect drinking water in rural Vietnam, Environ. Sci. Technol. 42
(2008) 4255–4260.
[9] D. Lantagne, T. Clasen, Point of Use Water Treatment in Emergency Response,
London School of Hygiene and Tropical Medicine, London, 2009.
[10] S. Doocy, G. Burnham, Point-of-use water treatment and diarrhoea reduction in
the emergency context: an effectiveness trial in Liberia, Trop. Med. Int. Health
11 (2006) 1542–1552.
[11] B.A. Hoque, S. Khanam, Efficiency and Effectiveness of Point-of Use Technologies
in Emergency Drinking Water: An Evaluation of PuR and Aquatab in Rural
Bangladesh, Dhaka, Bangladesh.
[12] E.M. Powers, C. Hernandez, S.N. Boutros, B.G. Harper, Biocidal efficacy of a flocculating emergency water purification tablet, Appl. Environ. Microbiol. 60 (1994)
2316–2323.
[13] J. Brown, M.D. Sobsey, D. Loomis, Local drinking water filters reduce diarrheal disease in Cambodia: a randomized, controlled trial of the ceramic water purifier,
Am. J. Trop. Med. Hyg. 79 (2008) 394–400.
[14] T.F. Clasen, J. Brown, S. Collin, O. Suntura, S. Cairncross, Reducing diarrhea
through the use of household-based ceramic water filters: a randomized, controlled trial in rural Bolivia, Am. J. Trop. Med. Hyg. 70 (2004) 651–657.
[15] C.E. Stauber, M.A. Elliott, F. Koksal, G.M. Ortiz, F.A. DiGiano, M.D. Sobsey, Characterisation of the biosand filter for E. coli reductions from household drinking
water under controlled laboratory and field use conditions, Water Sci. Technol.
54 (2006) 1.
[16] M.A. Elliott, C.E. Stauber, F. Koksal, F.A. DiGiano, M.D. Sobsey, Reductions of E. coli,
echovirus type 12 and bacteriophages in an intermittently operated householdscale slow sand filter, Water Res. 42 (2008) 2662–2670.
[17] M. Wegelin, S. Canonica, K. Mechsner, T. Fleischmann, F. Pesaro, A. Metzler, Solar
water disinfection: scope of the process and analysis of radiation experiments, J.
Water Supply Res. Technol. AQUA 43 (1994) 154–169.
[18] R.M. Conroy, M. Elmore-Meegan, T. Joyce, K.G. McGuigan, J. Barnes, Solar disinfection of drinking water and diarrhoea in Maasai children: a controlled field trial,
Lancet 348 (1996) 1695–1697.
[19] B.T. Burkholder, M.J. Toole, Evolution of complex disasters, Lancet 346 (1995)
1012–1015.
[20] J.O. Nriagu, Global metal pollutions: poisoning the biosphere? Environment 32
(1990) 6–33.
[21] G.M. Grossman, A.B. Krueger, Economic Growth and the Environment, 1994.
[22] T. Cath, A. Childress, M. Elimelech, Forward osmosis: principles, applications, and
recent developments, J. Membr. Sci. 281 (2006) 70–87.
[23] R.L. McGinnis, M. Elimelech, Global challenges in energy and water supply: the
promise of engineered osmosis, Environ. Sci. Technol. 42 (2008) 8625–8629.
[24] J.G. Wijmans, R.W. Baker, The solution-diffusion model: a review, J. Membr. Sci.
107 (1995) 1–21.
[25] HydroWell Operating Instructions, 2012.
[26] Hydration Technology Innovations, HydroWell Brochure, 2010.
[27] J.R. McCutcheon, R.L. McGinnis, M. Elimelech, A novel ammonia—carbon dioxide
forward (direct) osmosis desalination process, Desalination 174 (2005) 1–11.
[28] S. Zhao, L. Zou, C.Y. Tang, D. Mulcahy, Recent developments in forward osmosis:
opportunities and challenges, J. Membr. Sci. 396 (2012) 1–21.
[29] T.A. Kurniawan, G.Y.S. Chan, W.-H. Lo, S. Babel, Physico-chemical treatment techniques for wastewater laden with heavy metals, Chem. Eng. J. 118 (2006) 83–98.
[30] H.K. Johnston, Reverse osmosis rejection of heavy metal cations, Desalination 16
(1975) 205–224.
[31] M.F.A. Goosen, S.S. Sablani, H. Al-Hinai, S. Al-Obeidani, R. Al-Belushi, D. Jackson,
Fouling of reverse osmosis and ultrafiltration membranes: a critical review, Sep.
Sci. Technol. 39 (2005) 2261–2297.
[32] E.M.V. Hoek, M. Elimelech, Cake-enhanced concentration polarization: a new
fouling mechanism for salt-rejecting membranes, Environ. Sci. Technol. 37
(2003) 5581–5588.
30
E. Butler et al. / Desalination 312 (2013) 23–30
[33] M. Herzberg, M. Elimelech, Biofouling of reverse osmosis membranes: role of
biofilm-enhanced osmotic pressure, J. Membr. Sci. 295 (2007) 11–20.
[34] J.E. Nett, K.M. Guite, A. Ringeisen, K.A. Holoyda, D.R. Andes, Reduced biocide susceptibility in Candida albicans biofilms, Antimicrob. Agents Chemother. 52 (2008)
3411–3413.
[35] T. Schmid, U. Panne, J. Adams, R. Niessner, Investigation of biocide efficacy by
photoacoustic biofilm monitoring, Water Res. 38 (2004) 1189–1196.
[36] J.-A.B. Maltais, T. Stern, A Superior Biocide for Disinfecting Reverse Osmosis
Systems, 2001.
[37] N.T. Hancock, T.Y. Cath, Solute coupled diffusion in osmotically driven membrane
processes, Environ. Sci. Technol. 43 (2009) 6769–6775.
[38] M. Bissen, F.H. Frimmel, Arsenic — a review. Part I: occurrence, toxicity, speciation, mobility, Acta Hydrochim. Hydrobiol. 31 (2003) 9–18.
[39] W.R. Cullen, K.J. Reimer, Arsenic speciation in the environment, Chem. Rev. 89
(1989) 713–764.
[40] G. Issabayeva, M.K. Aroua, N.M.N. Sulaiman, Removal of lead from aqueous solutions on palm shell activated carbon, Bioresour. Technol. 97 (2006) 2350–2355.
[41] R. Rakhunde, L. Deshpande, H.D. Juneja, Chemical speciation of chromium in
water: a review, Crit. Rev. Environ. Sci. Technol. 42 (2012) 776–810.
[42] R.N. Sylva, The environmental chemistry of copper (II) in aquatic systems, Water
Res. 10 (1976) 789–792.
[43] A.E. Childress, M. Elimelech, Effect of solution chemistry on the surface charge of
polymeric reverse osmosis and nanofiltration membranes, J. Membr. Sci. 119
(1996) 253–268.
[44] A. Alpatova, S. Verbych, M. Bryk, R. Nigmatullin, N. Hilal, Ultrafiltration of water
containing natural organic matter: heavy metal removing in the hybrid complexation–ultrafiltration process, Sep. Purif. Technol. 40 (2004) 155–162.
[45] S. Verbych, M. Bryk, A. Alpatova, G. Chornokur, Ground water treatment by enhanced ultrafiltration, Desalination 179 (2005) 237–244.
[46] H. Ozaki, K. Sharmab, W. Saktaywirf, Performance of an ultra-low-pressure
reverse osmosis membrane (ULPROM) for separating heavy metal: effects of interference parameters, Desalination 144 (2002) 287–294.
[47] A. Seidel, J.J. Waypa, M. Elimelech, Role of charge (Donnan) exclusion in removal
of arsenic from water by a negatively charged porous nanofiltration membrane,
Environ. Sci. Technol. 18 (2001) 105–113.
[48] E. Arkhangelsky, U. Goren, V. Gitis, Retention of organic matter by cellulose
acetate membranes cleaned with hypochlorite, Desalination 223 (2008) 97–105.
[49] T. Heinze, T. Liebert, 4.2. Chemical characteristics of cellulose acetate, Macromol.
Symp. 208 (2004) 167–238.
[50] D.R. Hokanson, Q. Zhang, J.R. Cowden, A.M. Troschinetz, J.R. Mihelcic, D.M.
Johnson, Challenges to implementing drinking water technologies in developing
world countries, Environ. Eng. Appl. Res. Pract. 1 (2007) 1–9.
[51] M.D. Sobsey, C.E. Stauber, L.M. Casanova, J.M. Brown, M.A. Elliott, Point of use
household drinking water filtration: a practical, effective solution for providing
sustained access to safe drinking water in the developing world, Environ. Sci.
Technol. 42 (2008) 4261–4267.

© Copyright 2026