
- McCutcheon Lab: Membrane Separations Laboratory
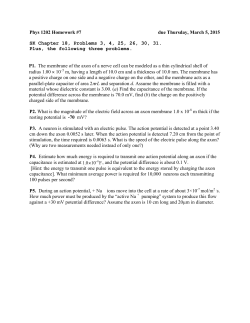
Journal of Membrane Science 318 (2008) 458–466 Contents lists available at ScienceDirect Journal of Membrane Science journal homepage: www.elsevier.com/locate/memsci Influence of membrane support layer hydrophobicity on water flux in osmotically driven membrane processes Jeffrey R. McCutcheon a,∗ , Menachem Elimelech b a b Department of Chemistry, Stony Brook University, Stony Brook, NY 11794-3400, USA Department of Chemical Engineering, Environmental Engineering Program, Yale University, P.O. Box 208286, New Haven, CT 06520-8286, USA a r t i c l e i n f o Article history: Received 21 November 2007 Received in revised form 5 March 2008 Accepted 7 March 2008 Available online 25 March 2008 Keywords: Forward osmosis Pressure-retarded osmosis Direct osmotic concentration Osmotically driven membrane processes Concentration polarization Internal concentration polarization a b s t r a c t Osmotically driven membrane processes, such as forward osmosis (FO) and pressure-retarded osmosis (PRO), rely on the utilization of large osmotic pressure differentials across semi-permeable membranes to generate water flux. Previous investigations on these two processes have demonstrated how asymmetric membrane structural characteristics, primarily of the support layers, impact water flux performance. In this investigation we demonstrate that support layer hydrophilicity or wetting plays a crucial role in water flux across asymmetric semi-permeable membranes. The results show that the polyester (PET) non-woven and polysulfone supports typically present in thin-film composite (TFC) reverse osmosis (RO) membranes do not wet fully when exposed to water, thereby resulting in a marked decrease in water flux. A cellulosic RO membrane exhibited modestly higher water fluxes due to its more hydrophilic support layer. Removal of the PET layers from the cellulosic and TFC RO membranes resulted in an increased water flux for the cellulosic membrane and very little change in flux for the TFC membrane. Pretreatment with hydraulic pressure (RO mode), feed solution degassing, and use of surfactants were used to further elucidate the wetting mechanisms of the different support layers within each membrane. The importance of considering membrane support layer chemistry in further development of membranes tailored specifically for osmotically driven membrane processes is discussed. © 2008 Elsevier B.V. All rights reserved. 1. Introduction Membrane technology has revolutionized the separations industry by providing a highly selective low-cost alternative to standard separations processes. Pressure-driven membrane processes, however, require the use of hydraulic pressure which uses electricity, a high quality and increasingly expensive form of energy. This has led to a growth in the field of osmotically driven membrane processes. These processes rely on transmembrane osmotic pressure which is created by a concentrated draw solution or osmotic agent. Various configurations of osmotically driven membrane processes may be used for separation, concentration/dewatering, and power generation [1]. There are two primary obstacles hindering further development of osmotically driven membrane processes. First, the selection of an appropriate draw solution, or the solute which generates the osmotic driving force, is critical for these processes to be economically viable. These solutions must be selected based on their physical and chemical properties as well as their intended end ∗ Corresponding author. Tel.: +1 203 500 2820. E-mail address: [email protected] (J.R. McCutcheon). 0376-7388/$ – see front matter © 2008 Elsevier B.V. All rights reserved. doi:10.1016/j.memsci.2008.03.021 use (either removed and recovered or consumed) [1]. Several draw solutions have been considered in previous publications [2–5], but the utility of each and the characterization of their performances is beyond the scope of this study. The second and most problematic impediment to further development of these technologies is the lack of a suitable membrane designed specifically for osmotically driven membrane processes. Previous membrane design has focused on creating highly selective and permeable membranes for use in pressure-driven membrane processes. These current generation membranes are designed with highly permeable “active” layers which have high selectivity for water. Though somewhat resistant to water flow, the active layer’s relative thinness (less than 1 m for desalination membranes) makes them highly permeable relative to dense symmetric membranes, but their fragility requires them to be supported by one or more porous supporting layers. These porous layers provide integrity to the membrane for highpressure applications while not increasing the overall hydraulic resistance. The presence of these porous layers has led to poor performance of osmotically driven membrane processes, most notably pressureretarded osmosis (PRO) and forward osmosis (FO) [1,6–8]. It was concluded that these layers cause internal concentration polariza- J.R. McCutcheon, M. Elimelech / Journal of Membrane Science 318 (2008) 458–466 tion which reduces the effective osmotic driving force [6,9]. Internal concentration polarization has been accurately modeled and found to be related to the structure of the support layer, most notably its thickness and porosity [9]. To date, however, no studies have discussed the importance of support layer chemical properties, such as hydrophobicity, on osmotic flux performance. Support layer hydrophobicity plays little role in pressure-driven membrane processes. Water permeates the active layer by a solution–diffusion mechanism and then simply percolates through the pores and cavities within the support layer. The support layer does not need to fully wet in order to ensure adequate permeate water flux. When these asymmetric membranes are used in osmotically driven membrane processes, however, the support layer must fully wet to ensure effective water transport. If the support layer does not wet, vapor or air trapped in the pores not only blocks the passage of water, but it may also exacerbate internal concentration polarization by reducing the continuity of the water within the layer, and thereby reducing the effective porosity. This paper elucidates the effects of membrane support layer wetting on water flux in osmotically driven membrane processes. Using various techniques, relative hydrophobicities of various support layer polymers are compared and correlated to water flux performance. It was found that support layer hydrophobicity hindered osmotic flux through asymmetric membranes designed for pressure-driven membrane processes. It was further demonstrated that improving the wetting of the membrane support layer results in a significant increase in water flux for osmotically driven membrane processes. 2. Materials and methods 2.1. Forward osmosis crossflow setup The forward osmosis crossflow setup has been described in our previous investigations [9]. A custom-built crossflow fil- 459 tration cell is used and the flux into the draw solution is measured gravimetrically with a scale. Additional modifications and various experimental protocols are described in further detail below. 2.2. Membrane selection Three commercially available membranes are considered in this investigation. The cross-sections of each membrane were imaged using SEM. The first, shown in Fig. 1(a), is a cellulosic brackish water reverse osmosis (RO) membrane from GE Osmonics (Fairfield, CT) (designated CE). The next, shown in Fig. 1(b), is a thin film composite RO membrane from Dow Filmtec (Midland, MI) used in seawater desalination (designated SW30 XLE). Finally, the membrane shown in (c) is a previously investigated membrane [5,7,9–11] from Hydration Technologies, Inc. (Albany, OR) (designated CA). This membrane is specifically tailored for forward osmosis (FO) water purification. In each SEM micrograph, the various layers of the membranes are indicated. These layers are discussed in greater detail below. 2.2.1. Removal of fabric backing layers The CE and SW30 XLE membranes are both fabricated using a polyester (PET) non-woven fabric support. This fabric is used as a substrate to cast the cellulosic CE membrane and the SW30 XLE polysulfone (PS) support layer by phase inversion. The fabric layers were carefully removed by peeling them away from the other layer (or layers) of each membrane. SEM micrographs in Fig. 2(a) and (b) show the cross-sections of the CE and SW30 XLE membrane, respectively, with their fabric layers removed. The membrane selective layers are facing up with the support layers facing down. Note that there is significant roughness on the support layer side on both membranes, which remains due to the strong binding between the two layers at the interfacial region between the polymer and the PET non-woven fabric. Even with the removal of the fabric layer, however, the structural integrity of both membranes seems fairly Fig. 1. Cross-sectional SEM images for the (a) Osmonics CE, (b) Filmtec SW30 XLE, and (c) Hydration Technologies CA membranes. The bar in each SEM image is 100 m. Fig. 2. Cross-sectional SEM images for the (a) Filmtec SW30 XLE and the (b) Osmonics CE membrane with the fabric layer removed. The bar in each SEM image is 100 m. 460 J.R. McCutcheon, M. Elimelech / Journal of Membrane Science 318 (2008) 458–466 well intact. The membrane integrity was verified by reverse osmosis tests which showed no decrease in salt rejection when compared to the intact membrane. 2.3. Contact angle measurement Water contact angle measurements were accomplished with the sessile drop method using a VCA video contact angle system from AST products (Billerica, MA). Water contact angles were taken of the membrane active layers, the polyester non-woven fabric layers, and the backing layers of the membrane after removal of the fabric. Water drop size was 1 L. Room temperature was maintained at 21–22 ◦ C during the measurements. Roughness of the surfaces was not taken into account. To account for significant variations between different measurements on the same substrate (caused by surface roughness and/or chemical heterogeneities), five locations on two independent samples were tested. A computer program was used (VCAOptimaXE) to determine the contact angle on both sides of a sessile drop and the results were averaged for all measurements. 2.4. Experimental protocols for flux measurement 2.4.1. Temperature and stability equilibration Water flux measurements were taken using a gravimetric method described in our earlier investigation [9]. The draw solution reservoir mass is constantly monitored on a scale which outputs to a computer. In this particular system configuration, the draw solution is run in closed loop. Therefore, trapped air in the system or vibrations will cause erroneous flux measurements. To circumvent this problem, deionized water was circulated on both sides of the membrane until the baseline “flux” was measured at zero. During this equilibration procedure, both deionized water reservoirs were also circulated through inline heat exchangers which sat in a constant temperature water bath. The solutions were circulated in a closed loop mode until they reached a stable temperature of 20 ◦ C. After the draw solution reservoir mass and the temperature had stabilized, an appropriate amount of 5 M NaCl stock solution was added to bring one of the solutions, in this case the draw solution, up to a concentration of 1.5 M. 2.4.2. Reverse osmosis pretreatment In some of the experiments, the membrane was “pretreated” in a reverse osmosis mode prior to running a flux test in the forward osmosis cell. This pretreatment under hydraulic pressure was used to purge air and/or vapor out of the support layers prior to forward osmosis. It was thought that moderately high hydraulic pressures might induce liquid water to displace air or vapor within the porous support layers, partially or perhaps fully wetting the membrane. An RO crossflow unit with identical channel dimensions to the FO crossflow unit was used for this pretreatment. Deionized feedwater was used at a hydraulic pressure of 450 psi (31.0 bar) with a temperature between 25 and 27 ◦ C. Tighter temperature control was difficult due to the heat generated by the high-pressure pump. The membrane active layer was facing deionized water feed solution as the support layers provided mechanical strength to the membrane while under pressure. Pressure and flux were maintained for 1 h. It was assumed that this amount of time would be suitable to achieve a steady state degree of wetting, and additional pretreatment times were not considered as part of this study. After this time, the membrane was removed, submerged quickly in water to avoid any degree of drying or drainage, and transferred to the forward osmosis cell. 2.4.3. Feed solution degassing Feed solution degassing was done to eliminate the possibility of air bubbles moving into the support layer from the feed during FO tests. Degassing can also improve the wetting of the support layer, as air or vapor trapped in the support layer might be induced to diffuse out into the degassed bulk solution. This treatment was only done with the feed solution when the membrane was oriented with the feed against the support layer or, as it is known, in the PRO mode. A hollow fiber membrane contactor, with polypropylene fibers, was used for the degassing (Celgard MiniModule® ). This contactor was placed inline with the recirculating feed solution. The hydrophobic polypropylene hollow fibers are typically used in membrane vacuum distillation processes for degassing and this particular module is used for degassing small scale deionized water systems. The feed solution (deionized water) flowed through the lumen of the fibers while a vacuum was drawn on the shell side. A vacuum of at least 29 in. Hg was drawn by a direct drive vacuum pump (Edwards, Murray Hill, NJ). The feed solution was run in closed loop and dissolved oxygen levels were measured with a dissolved oxygen probe (Fisher Scientific, Waltham, MA). After 1 h of degassing, dissolved oxygen levels were below 0.1 mg/L and steady state had been achieved. Using oxygen as a surrogate for all dissolved gases, we assumed that the other gases in solution had likewise been removed to a significant extent. Degassing was maintained throughout the duration of the experiment. 2.4.4. Surfactant additions to feed solution To observe how changes in wettability of the support layer of the various membranes affect water flux, sodium dodecyl sulfate (SDS) was added to the deionized feed solutions which were against the membrane support layers (PRO mode). The membranes tested in this fashion were the CE and the SW30 XLE membranes. The SDS was added to the feed solution after the equilibration procedures described earlier and after the addition of NaCl to the draw solution. Steady state flux data was taken for 50 min followed by addition of an appropriate amount of 100 mM SDS stock solution to bring the feed solution concentration to 1 mM SDS. 3. Results and discussion The effects of support layer hydrophobicity on water flux are described by considering contact angle analysis of the various membrane layers, membrane orientation, membrane pre-wetting, PET fabric removal, feed solution gas content, and the presence of surfactants. Flux data were taken in both the FO and PRO modes for the SW30 XLE and CE membranes. Comparisons to our previously published data using the CA membrane are made where appropriate. 3.1. Contact angle analysis A traditional method of determining a material’s hydrophobicity is through water contact angle analysis. Support layer hydrophobicity is the primary focus of this investigation and each support layer of the membranes was tested to determine their relative hydrophobicity. Contact angles of the membrane active layers were also measured for comparison. Results are summarized in Table 1. Included in this table are results from the CA membrane (active and backing layers), the SW30 XLE membrane (active, PET fabric, and PS support after the fabric had been removed), and CE membrane (active layer, PET fabric, and cellulosic support after the fabric had been removed). The measurements of these contact angles can help qualitatively assess each layer’s wettability, with higher angles indicating greater hydrophobicity. While no strict defini- J.R. McCutcheon, M. Elimelech / Journal of Membrane Science 318 (2008) 458–466 tion relating contact angle to subjective terms like hydrophobic and hydrophilic exists, generally contact angles near or above 90◦ indicate significant hydrophobicity while lower contact angles indicate increasing hydrophilicity. Multiple locations on two independent samples were tested in order to average out errors that occur due to roughness and/or chemical heterogeneity [12,13]. The first membrane listed in Table 1 is the CA membrane. This membrane, which has been studied in previous investigations on forward osmosis, shows a moderate degree of hydrophilicity (62.0◦ for active layer and 63.6◦ for backing layer). This is expected due to its cellulosic composition in which the cellulose polymer backbone contains hydrophilic hydroxyl groups. The similarity between the active and backing layer is not surprising, since the membrane is made through the phase inversion process and the polymer material is the same throughout the membrane. The standard deviation of the measurement is reasonably high given the macroscale roughness caused by the embedded polyester mesh. Roughness increases the variability in the contact angle measurement due to pinning and other surface effects which create metastability within the sessile droplet [12,14]. This also explains the increased standard deviation of the measurements on the backing layer, which has an increased roughness due to surface porosity. The SW30 XLE membrane is an RO thin film composite membrane with a polyamide active layer supported by a polysulfone (PS) support layer. This PS support is cast upon a PET fabric layer. Each of these layers will play a role in water transport across the membrane during osmotically driven membrane processes, so each needs to be characterized for hydrophobicity. The active layer is hydrophilic, which is expected since the water must diffuse through this part of the membrane and increased hydrophilicity decreases the active layer-fouling propensity. The support layers are more hydrophobic. The PET fabric is moderately hydrophilic (67.5◦ ) and the PS support is hydrophobic (95.2◦ ). The CE membrane is comprised of an asymmetric cellulosic layer which has an active layer and a supporting porous structure. This self-supported cellulosic layer is cast upon a PET fabric support. The active layer, or the dense portion of the cellulosic layer, has nearly the same hydrophilicity as the CA membrane (59.1◦ ). This is not surprising considering both membranes are cellulosic. The lower standard deviation is due to the smoothness of the CE active layer. The PET fabric layer has a moderate degree of hydrophilicity (61.8◦ ), similar to that of the SW30 XLE PET fabric layer. The cellulosic support of the CE membrane was measured as being very hydrophilic (19.4◦ ), though this is unexpected due to the fact that the material is the same as the active layer. This low contact angle measurement is likely due to the rough surface morphology, which is formed by contact with the fabric layer during membrane casting. When the cellulosic membranes are cast onto the PET fabric, Table 1 Measured contact angles of the various layers of the membranes used Membrane layer Contact angle (degrees) Standard deviation (degrees) CA active CA backing SW30 XLE active SW30 XLE fabric SW30 XLE polysulfone CE active CE fabric CE porous support 62.0 63.6 37.5 67.5 95.2 59.1 61.8 19.4 7.2 13.0 2.8 5.0 4.9 4.0 8.0 5.1 Active, backing, and fabric layer contact angles are included for the CA, the SW30 XLE, and the CE membranes. The SW30 XLE porous support is a polysulfone UF membrane. The CE porous support is an asymmetric cellulosic membrane. The fabric layers of the SW30 XLE and CE are polyester non-woven fabrics. The CA membrane has no fabric support, though it does have a self-supporting porous structure. Temperature during the measurements was 21–22 ◦ C. 461 Fig. 3. A top view of the PET fabric layer (right) and porous cellulosic support layer (left) of the CE membrane. Porous material in between is carbon tape. the fabric fibers will imprint on the surface, leaving a mold of the fibers in the polymer, as shown in Fig. 3. This roughness, which can also be seen in Fig. 2(b), allows for a drop of fixed volume to spread by capillary action into the crevices on the surface. The spreading is facilitated by the polymer’s hydrophilicity and improves the capillary movement of water not only into these crevices, but also into the pores within the membrane. Hence, this will give the appearance of a lower contact angle. A similar effect was not noticed on the SW30 XLE PS support layer because the material is intrinsically hydrophobic, so the presence of roughness would not necessarily facilitate capillary motion of water. In fact, on many rough, hydrophobic surfaces, water will not rest entirely on the solid surface, but will also be supported by air trapped within the crevices on the surface, possibly causing erroneous measurements [13]. The possibility of erroneous contact angle measurement in the case of the polysulfone layers was considered, but these tests were only used to compare – not quantify – relative hydrophobicity of the various membrane layers. 3.2. Water flux in FO mode For water flux measurements, the first membrane orientation that will be considered is the FO mode [8]. In this orientation, the membrane active layer is facing the feed solution and the support layer is facing the draw solution. This is the typical orientation for most membrane separation processes, such as reverse osmosis. However, in all our tests, flux is osmotically driven and no hydraulic pressure is used. 3.2.1. SW30 XLE membrane Our first tests were with the SW30 XLE membranes. This membrane is typically used for seawater desalination and therefore has a very high salt rejection and thick porous support layers intended to withstand the high hydraulic pressures of seawater RO (up to 1200 psi or 82.7 bars). Osmotically driven water flux was measured using a deionized water feed and a 1.5 M NaCl draw solution, corresponding to a transmembrane osmotic pressure of about 70 atm (1029 psi, 70.9 bar), after various pretreatments to the membrane. Conductivity of the deionized feedwater was monitored to measure salt transport from the draw solution to the feed. For all tests, salt transport from the draw solution was found to be small and did not appreciably impact the transmembrane osmotic pressure difference. Fig. 4 presents the averaged steady state water flux data. The water flux through this membrane is very low when operated in the FO mode: less than 0.5 gallons/(ft2 membrane area per day) 462 J.R. McCutcheon, M. Elimelech / Journal of Membrane Science 318 (2008) 458–466 Fig. 4. Steady state forward osmosis flux measurements for the SW30 XLE membrane averaged over at least 1 h. RO pretreatment conditions: deionized feedwater against the active layer, 450 psi (31.0 bar) pressure, 25 ± 2 ◦ C, run for at least 1 h. Forward osmosis experimental conditions: membranes oriented in the FO mode, with the feed (DI water) against the active layer and the draw solution (1.5 M NaCl) against the support layer. Crossflow rate and temperature of both feed and draw solutions are 21.3 cm/s and 20 ◦ C, respectively. Note that a water flux of 10 m/s corresponds to 21.2 gfd or 36.0 L m−2 h−1 . Fig. 5. Steady state forward osmosis flux measurements for the CE membrane averaged over at least 1 h. RO pretreatment conditions: deionized feedwater against the active layer, 450 psi (31.0 bar) pressure, 25 ± 2 ◦ C, run for at least 1 h. Forward osmosis experimental conditions: membranes oriented in the FO mode, with the feed (DI water) against the active layer and the draw solution (1.5 M NaCl) against the support layer. Crossflow rate and temperature of both feed and draw solutions are 21.3 cm/s and 20 ◦ C, respectively. Note that a water flux of 10 m/s corresponds to 21.2 gfd or 36.0 L m−2 h−1 . (gfd). Note that typical seawater RO systems operate between 9 and 11 gfd, and those are operated at lower transmembrane driving forces. The PET fabric layer of the membrane could be removed and flux slightly increased. This is likely due to a decreased internal concentration polarization effect due to the decreased overall thickness of the support layer. When the membrane undergoes reverse osmosis pretreatment, the flux increases for both the full membrane and the membrane with no fabric, though the effect is far more noticeable for the membrane with the fabric removed. Pretreating the membrane with hydraulic pressure (i.e., reverse osmosis mode), removes some of the air trapped in either the polyester or polysulfone support layer. This air is effectively impassible by water and its presence reduces the effective porosity of the support layer. By purging the air from the layer, a greater degree of water continuity can exist within the support layer, reducing the prevalence of internal CP by increasing the number of solute diffusion pathways while simultaneously increasing the available pathways for water transport. It is interesting to note that the RO pretreatment seems to have more impact on the polysulfone (PS) support layer. This may be attributed to the higher degree of hydrophobicity of this layer relative to the PET layer (a contact angle of 95.2◦ vs. 67.5◦ , respectively). This layer will likely have a higher percentage of its pores filled with air or vapor prior to RO pretreatment and therefore plays a more significant role in hindering water transport through the membrane. Also, since the relative porosity of the PS layer is low compared to the PET fabric, continuity of water in the PS support layer will also be more of an issue, [15] and lack of complete wetting will exacerbate this problem. Therefore, pre-wetting the membrane by purging the air/vapor from this layer will improve water flux. When the fabric layer is still attached to the membrane the effect of prewetting is countered by the additional internal CP effects caused by the increased overall support layer thickness. This water flux data suggests that the PET layer may play two roles in controlling osmotic flux across the membrane. First, by removing the PET support layer, internal CP is reduced due to the decreased support thickness, as occurred before with the SW30 XLE. However, the removal of the moderately hydrophilic PET support layer also exposes the more hydrophilic cellulosic portion of the membrane. The new interface is also highly indented which may improve the uptake of water into the support structure. This part of the membrane, shown in Fig. 2(b), is asymmetric, but hydrophilic, so water easily permeates the pores. However, wetting of the PET support layer may not be an issue since no improved flux was seen after the RO pretreatment. The slight decrease in flux after RO pretreatment may be due to compaction of the PET fabric or the cellulosic porous support, causing a decreased porosity which may increase the hydraulic resistance within these layers or increase the severity of internal CP. After noting the exceptional flux performance of the CE membrane when the fabric layer was removed, we expanded the data set to include a range of draw solution concentrations up to 1.5 M NaCl. The data are shown in Fig. 6 and are compared to the previously 3.2.2. CE membrane Similar experiments were carried out with the CE membrane in the FO mode. Again, salt transport from the draw solution was found to be very small for all tests. The water flux performance data are shown in Fig. 5. Flux was measured through the full membrane before and after RO pretreatment. RO pretreatment had little effect on flux performance and, in fact, caused a slightly reduced flux. When the PET fabric is removed, the flux shows a dramatic improvement. Fig. 6. Forward osmosis flux measurements for the CE membrane with the fabric layer removed compared to flux measurements for the CA membrane (taken from Ref. [9]) over a range of NaCl draw solution concentrations. The membranes are oriented in the FO mode, with the feed (DI water) against the active layer and the draw solution (NaCl) against the support layer. Experimental conditions: crossflow rate and temperature of both feed and draw solutions are 21.3 cm/s and 20 ◦ C, respectively. Note that a water flux of 10 m/s corresponds to 21.2 gfd or 36.0 L m−2 h−1 . J.R. McCutcheon, M. Elimelech / Journal of Membrane Science 318 (2008) 458–466 studied CA membrane in the same orientation [9]. The similarities between the flux data are notable considering that the modified CE membrane is a commercial RO membrane and the CA is a commercial FO membrane. While the membrane support layers differ in thickness (slightly), porosity, and tortuosity – support layer characteristics which play a role in determining the severity of internal CP [6,8,10] – as well as other structural characteristics (the embedded mesh support in the CA membrane), their materials are similar and both are cast through the phase inversion process. This is the first time a commercial RO membrane has been shown to compare favorably with commercial FO membranes after simple modification. The above data suggest that hydrophilicity of the support layer is important when considering the mechanisms of resistance to osmotic flux through asymmetric membranes in the FO mode. Removal of the non-woven support layers resulted in higher flux for both the SW30 XLE and CE membranes, with the effect being much more pronounced with the CE membranes once the relatively hydrophilic cellulosic membrane material was exposed to the draw solution. RO pretreatment was found to at least partially wet the PS structure of the SW30 XLE membrane, but its effect on the PET non-woven fabric was inconclusive for both membranes. Below, we clarify some of these issues by considering flux through these membranes when they are oriented in the PRO mode. 3.3. Water flux in the PRO mode When the draw solution is placed against the active layer and the feed solution is against the support layer, the membrane is oriented in the PRO mode. This mode is typically used for PRO applications where the draw solution is pressurized [16,17], and hence, requires the mechanical support of the porous layer on the feed side of the membrane. For typical PRO applications, salinity in the feedwater will create concentrative internal concentration polarization effects [9,11]. However, the flux tests described below were designed to solely test the impact of membrane hydrophobicity on water flux and therefore were conducted with deionized water feed solution. In this case, no internal CP effects will occur. Note, however, that salt may leak across the membrane active layer from the draw solution and enter in the support layer. If this occurs, diffusion out of this layer is hindered by the porous structure and internal CP would form. This form of internal CP is illustrated in Fig. 7. For most high Fig. 7. Diagram depicting the osmotic pressure profile across a membrane oriented in the PRO mode (draw solution on the active layer). The feed (the right side) is deionized water. A dilutive external concentration polarization layer exists on the permeate side of the membrane. No internal concentration polarization exists in the support layer since the feed is deionized water. Small amounts of internal concentration polarization may occur due to salt leakage from the draw solution (indicated by the circle), but the amount of leakage is expected to be small due to the high salt rejection characteristics of the membrane. 463 Fig. 8. Water flux data for the SW30 XLE membrane under three different conditions. Membrane is oriented in the PRO mode. RO pretreatment conditions: deionized feedwater against the active layer, 450 psi (31.0 bar) pressure, 25 ± 2 ◦ C, run for at least 1 h. Forward osmosis experimental conditions: membranes oriented in the PRO mode, with the feed (DI water) against the support layer and the draw solution (1.5 M NaCl) against the active layer. Crossflow rate and temperature of both feed and draw solutions are 21.3 cm/s and 20 ◦ C, respectively. Note that a water flux of 10 m/s corresponds to 21.2 gfd or 36.0 L m−2 h−1 . rejection RO membranes, however, it is reasonable to assume that very little salt traverses the membrane from the draw solution and any unexpected water flux behavior can be attributed to support layer chemistry rather than structure. This negligible salt transport was confirmed by conductivity measurements of the deionized feedwater during each test. 3.3.1. SW30 XLE membrane The first tests were with the SW30 XLE membrane. As above, a 1.5 M NaCl draw solution was used along with deionized water feed solution, but the membrane was oriented in the PRO mode. The first test was done with the intact membrane. As shown in Fig. 8, water flux over time was very low (less than 1 gfd). This was surprising considering the feed is deionized water and therefore no internal CP should be occurring. Previous investigations on water flux through commercial membranes (including the PA-300, NS-101, NS-200, BM-1-C and the Permasep B-10 hollow fiber) oriented in the PRO mode concluded that salt transport from the draw solution was the primary cause of low flux due to internal concentration polarization effects [6,18]. However, with high rejection desalination membranes, such as the SW30 XLE, salt leakage from the draw solution should be minimal, even for higher concentration salt solutions. Salt leakage should be further mitigated by the water flux itself, which is in the opposite direction of the salt flux. Therefore, we would expect to see far greater fluxes given the high transmembrane osmotic pressure (70 atm). Support layer hydrophobicity was therefore considered as a possible hindrance to osmotic flux across the membrane. If the membrane support does not wet passively when exposed to the deionized feedwater, then water transport is hindered through the support layer. Also, should any salt traverse the membrane from the draw solution, this salt would be less able to diffuse out of the support layer because of the lack of water continuity which reduces diffusion pathways. A series of experiments were conducted to verify this hypothesis. If support layer wetting was causing reduced flux, then it would be expected that wetting the membrane would improve flux. Using the same RO pretreatment as described above, deionized water was forced through the membrane in order to displace the air or water vapor present in the support layer. After this pretreatment, 464 J.R. McCutcheon, M. Elimelech / Journal of Membrane Science 318 (2008) 458–466 the membrane was placed in the FO cell in the PRO mode. As shown in Fig. 8, flux was initially higher, around 6 gfd, but fell slowly over time to around 2 gfd. There are several possible reasons for the transient flux behavior shown in Fig. 8. Convective flow of water may have transported air or vapor bubbles from the bulk solution into the support layer, slowly displacing water within the membrane causing a slowly decreasing water flux. To verify this, the feedwater was degassed before use. Degassing removes the dissolved gas and air bubbles from the bulk solution and has been shown to improve the wetting of hydrophobic materials by water [19,20]. Another flux test was run after the membrane was pretreated with RO and after the feedwater was degassed. Degassing also took place throughout the experimental run. The data in Fig. 8 indicates that degassing the feed solution does not improve flux, suggesting that air and vapor are not entering the support layer from the bulk feed solution and that some other mechanism is governing the degree of saturation in the support layer. It is likely that the wetting mechanism driven by RO and the drainage mechanism driven by FO are different, creating a ‘pseudo’ hysteresis of wetting behavior for this support layer [21]. This behavior is not a true hysteresis, which would require the drainage and imbibition to be accomplished in the same direction and by similar mechanisms, but we use the term here for explanation as it is commonly used to discuss wetting and drainage mechanisms in porous media. Osmotically induced drainage may be occurring at such a rate that the local pressure within the pores drops, causing the spontaneous formation of water vapor. To further elucidate the wetting mechanism, the PET fabric layer was removed. With both no treatment and RO pretreatment, the SW30 XLE membrane with the fabric layer removed was tested in the PRO mode and compared to the intact membrane (Fig. 9). The membrane performed similarly with and without the fabric support layer. However, after RO pretreatment, the flux was steady at nearly 5 gfd (about six times higher than before the pretreatment). What is interesting to note, though, is that the flux does not decrease with time as it did with both support layers present. This suggests that the wetting and drainage mechanisms are different for the PET and the PS support layers. It would appear that after partial wetting by RO, the PS support does not drain which would Fig. 9. Water flux data for the SW30 XLE with the fabric layer removed with and without RO pretreatment. The membrane is oriented in the PRO mode. Also shown is the membrane flux performance with the fabric layer (data from Fig. 8, open squares). RO pretreatment conditions: deionized feedwater against the active layer, 450 psi (31.0 bar) pressure, 25 ± 2 ◦ C, run for at least 1 h. Forward osmosis experimental conditions: membranes oriented in the PRO mode, with the feed (DI water) against the support layer and the draw solution (1.5 M NaCl) against the active layer. Crossflow rate and temperature of both feed and draw solutions are 21.3 cm/s and 20 ◦ C, respectively. Note that a water flux of 10 m/s corresponds to 21.2 gfd or 36.0 L m−2 h−1 . Fig. 10. Water flux data for the CE membrane under different conditions. The membrane is oriented in the PRO mode. The support fabric was removed for the indicated test. RO pretreatment conditions: deionized feedwater against the active layer, 450 psi (31.0 bar) pressure, 25 ± 2 ◦ C, run for at least 1 h. Forward osmosis experimental conditions: membranes oriented in the PRO mode, with the feed (DI water) against the support layer and the draw solution (1.5 M NaCl) against the active layer. Crossflow rate and temperature of both feed and draw solutions are 21.3 cm/s and 20 ◦ C, respectively. Note that a water flux of 10 m/s corresponds to 21.2 gfd or 36.0 L m−2 h−1 . cause a reduction in flux. However, when the PET fabric is attached, the overall wetting and drainage mechanisms of the entire support layer change. 3.3.2. CE membrane Identical tests were run with the CE membrane and the results are shown in Fig. 10. When testing the untreated membrane, water flux was initially high, around 6 gfd, but quickly dropped to about 2 gfd. When the membrane was pretreated with RO, the initial fluxes were higher (over 10 gfd), but a similar drop in flux occurred. Degassing the feed solution after RO pretreatment of the membrane resulted in no change in water flux behavior. These results were similar to the SW30 XLE membrane except for the fact that the initial flux of the untreated membrane was higher than the steady state flux. The steady state flux of the CE membrane also was higher than that of the SW30 XLE membrane. The reasoning behind the transient water flux, as described above, is likely due to differing drainage and imbibition mechanisms of the PET fabric layer. The PET fabric is initially wet to some degree which fully wets the cellulosic membrane. Upon osmosis, water is drawn out of the cellulosic portion of the membrane which consequently drains the PET fabric. If water continuity is broken (i.e., drying) before water can enter the fabric, then the fabric may have difficulty rehydrating. If this is the case, the drainage mechanism by osmosis is faster than the wetting mechanism by water cohesiveness and capillarity. The same “hysteresis” apparently occurs in the SW30 XLE membrane as well and can now be attributed to the PET fabric layer. By observing this behavior in the CE membrane, we have found that this imbibition/drainage hysteresis likely occurs in the PET fabric layer for both the CE and SW30 XLE membranes. The differences between the initial and steady state flux of the CE and SW30 XLE membranes in the PRO mode after RO pretreatment still must be explained. For the SW30 XLE membrane, water must transport through the PET fabric followed by the PS support layer and then the polyamide active layer. In the CE membrane, water must pass through the PET fabric followed by the porous portion of the cellulosic layer until reaching the dense portion of this layer. As seen above, the hydrophobicity of both PET fabric layers is similar. The porous portion of the cellulosic membrane, however, is very J.R. McCutcheon, M. Elimelech / Journal of Membrane Science 318 (2008) 458–466 Fig. 11. Forward osmosis flux measurements for the CE membrane with the fabric layer removed compared to flux measurements for the CA membrane (taken from Ref. [9]) over a range of NaCl draw solution concentrations. The membranes are oriented in the PRO mode, with the feed (DI water) against the support layer and the draw solution (NaCl) against the active layer. Experimental conditions: crossflow rate and temperature of both feed and draw solutions are 21.3 cm/s and 20 ◦ C, respectively. Note that a water flux of 10 m/s corresponds to 21.2 gfd or 36.0 L m−2 h−1 . hydrophilic and absorbent and therefore will spontaneously wet even when in contact with a partially hydrated PET layer regardless of RO pretreatment. This explains the higher steady state flux of the CE membrane when compared to the SW30 XLE membrane. In the CE membrane, a slightly higher initial water flux after RO pretreatment is likely due to a marginal increase in saturation of the PET layer, which improves water continuity for a short time at the beginning of a test (initial fluxes of over 10 gfd vs. 8 gfd without pretreatment). In the SW30 XLE membrane, however, the RO pretreatment will improve wetting of both layers. During a test, however, the PET layer drains while the PS layer does not (as indicated in Fig. 9). Therefore, in the SW30 XLE membrane, the overall wettability of the intact support layer is limited by the PS support at first which is very likely less saturated than the more hydrophilic PET. As the PET fabric drains, that layer limits flux. Therefore, in the CE membrane, the limiting factor to water flux is the wettability of the fabric layer while in the SW30 XLE membrane, the limiting factor is the wettability of the PS support at first and then the PET fabric after it dries. In other words, the drier layer will control the overall wettability of the composite support layer, not necessarily the more hydrophobic layer. As with the FO mode, upon removal of the polyester fabric from the CE membrane, the flux increases dramatically. Once the fabric layer is removed, the feed solution fully wets the self-supported cellulosic membrane and hence easily transports through the support layer structure. The slight decrease in flux over the course of the experiment is due to the dilution of the draw solution which occurred due to the high volume flux. As indicated above with the FO mode, since we saw excellent water flux performance with the CE membrane once its fabric layer had been removed, we expanded the data set to include lower concentrations of draw solution and compared the results to the performance of the CA membrane from a previous investigation [8]. The results are shown in Fig. 11. Again, the fluxes of the modified CE membrane were nearly equal to the commercial CA membrane for tests in the PRO mode. 3.3.3. SDS addition to the feed solution The above data shows differing evidence of the impact of wettability of the polyester and polysulfone supports on water flux. With the SW30 XLE membrane, the wettability of the polysulfone has been shown to play a significant role in water flux for both 465 Fig. 12. Forward osmosis flux measurements for the CE and SW30 XLE membrane. Also included is data for the SW30 XLE membrane with no fabric. The membranes are oriented in the PRO mode. SDS stock solution was added to the deionized feedwater (final SDS concentration after addition was 1 mM) at time equal to 50 min. Experimental conditions: deionized water feed solution, 1.5 M NaCl draw solution, crossflow rate and temperature of both feed and draw solutions are 21.3 cm/s and 20 ◦ C, respectively. Note that a water flux of 10 m/s corresponds to 21.2 gfd or 36.0 L m−2 h−1 . the PRO and FO mode, but the PET fabric has little effect until the membrane is pretreated with RO. Conversely, the PET fabric in the CE membrane impacts flux far more dramatically in both cases. These previous tests only utilized RO to purge air and/or vapor from these various porous layers, but other experiments exist to further elucidate the effects of wetting on support layer water transport. Sodium dodecyl sulfate (SDS), an anionic surfactant, can be added to the feedwater to improve the wetting of the support layer during PRO oriented tests. This was done for the membranes which experienced poor flux behavior (the SW30 XLE with and without PET fabric, and the CE membrane with PET fabric). The flux tests involved a brief equilibration time (50 min) to obtain a baseline flux. After 50 min, SDS was added to the feed solution, raising its concentration to 1 mM. This concentration was chosen because it is high enough to significantly reduce the surface tension of water (from 70.9 to 53.9 mN/m as determined by using a Wilhelmy plate tensiometer), yet low enough not to create foam or bubbles. At the critical micelle concentration (about 8 mM), the solution will get somewhat cloudy and suds begin to form in the feed tank, and this was not desired. The flux performance data are shown in Fig. 12. Note that for the SW30 XLE membrane, there is a sharp increase in flux upon the addition of SDS to the feed solution. This is due to an immediate wetting of the support layer which subsequently improves the continuity of water in this layer, facilitating water flow. However, we do not know how each various layer of the support layer behaves in the presence of SDS. In order to differentiate the effect of SDS on the PET fabric and the PS support, we can look at the data with the CE membrane. When SDS is added to the feed solution during the tests with the CE membrane, the flux does not change. This either suggests that the wettability of the PET fabric plays no role in water transport (unlikely based on the results above) or that the SDS does not adequately wet this fabric more than it already is. If we assume that the PET layers of the CE and SW30 XLE are similar, then we hypothesize that the SDS is improving the wetting of the PS support layer, not the PET fabric. The data also shows that after the increase in flux caused by SDS for the SW30 XLE membrane, there is a subsequent flux decline. This decrease is due to the accumulation of SDS molecules within the porous support layer. SDS is rejected by the active layer of the membrane and thus will be retained within the support layer. The SDS amasses near the active layer and effectively fouls its pores. 466 J.R. McCutcheon, M. Elimelech / Journal of Membrane Science 318 (2008) 458–466 The increase in concentration of the SDS within the support layer – caused by internal CP – may also have another effect. SDS concentration likely increases to beyond that of the CMC, causing micelles to form within the support layer. These larger SDS aggregates would likely cause even more severe fouling, further decreasing water flux. 4. Concluding remarks Membrane support layer hydrophobicity significantly hinders water flux in osmotically driven membrane processes. Lack of sufficient support layer wetting not only exacerbates internal concentration polarization phenomena, but also disrupts water continuity within the membrane, thereby reducing the pathways for water transport. Improved wetting of the support layer has been shown to increase water flux, especially for pressure-retarded osmosis applications with dilute feed solutions. This improved wetting was achieved by purging the air and vapor out of the support layer with RO pretreatment prior to testing, or with the use of a surfactant to improve wetting within the layer. It was shown, though, that these treatments impacted the various layers of each membrane differently depending on the structure and hydrophobicity of the layers. It was also demonstrated that the most unsaturated layer, not the most hydrophobic layer, controlled water continuity and hence overall support layer wetting within the composite support layer. These results have shown that improving membrane design for osmotically driven membrane processes should not only focus on the structural characteristics of the support layer but on the chemistry as well. Hydrophilic membrane support layers will be critical to improving flux performance in future process technologies that rely on osmotic transport across polymeric asymmetric membranes. Acknowledgements The authors acknowledge the Office of Naval Research, Award no. N00014-03-1-1004, for financial support. We also acknowledge Professor David Lavan for the use of the contact angle goniometer and Hydration Technologies, Inc., GE Osmonics, and Dow Filmtec for providing membranes. References [1] T.Y. Cath, A.E. Childress, M. Elimelech, Forward osmosis: principles, applications, and recent developments, J. Membr. Sci. 281 (2006) 70–87. [2] R.E. Kravath, J.A. Davis, Desalination of sea-water by direct osmosis, Desalination 16 (1975) 151–155. [3] C.D. Moody, J.O. Kessler, Forward osmosis extractors, Desalination 18 (1976) 283–295. [4] J.O. Kessler, C.D. Moody, Drinking-water from sea-water by forward osmosis, Desalination 18 (1976) 297–306. [5] J.R. McCutcheon, M. Elimelech, Desalination by ammonia–carbon dioxide forward osmosis: influence of draw and feed solution concentrations on process performance, J. Membr. Sci. 278 (2006) 114–123. [6] K.L. Lee, R.W. Baker, H.K. Lonsdale, Membranes for power-generation by pressure-retarded osmosis, J. Membr. Sci. 8 (1981) 141–171. [7] J.R. McCutcheon, R.L. McGinnis, M. Elimelech, A novel ammonia–carbon dioxide forward (direct) osmosis desalination process, Desalination 174 (2005) 1–11. [8] W.L. Tang, H.Y. Ng, Concentration of brine by forward osmosis: performance and influence of membrane structure, Desalination 224 (2008) 143–153. [9] J.R. McCutcheon, M. Elimelech, Influence of concentrative and dilutive internal concentration polarization on flux behavior in forward osmosis, J. Membr. Sci. 284 (2006) 237–247. [10] T.Y. Cath, S. Gormly, E.G. Beaudry, M.T. Flynn, V.D. Adams, A.E. Childress, Membrane contactor processes for wastewater reclamation in space. Part I. Direct osmotic concentration as pretreatment for reverse osmosis, J. Membr. Sci. 257 (2005) 85–98. [11] G.T. Gray, J.R. McCutcheon, M. Elimelech, Internal concentration polarization in forward osmosis: role of membrane orientation, Desalination 197 (2006) 1–8. [12] A. Marmur, Soft contact: measurement and interpretation of contact angles, Soft Matter 2 (2006) 12–17. [13] G. Wolansky, A. Marmur, Apparent contact angles on rough surfaces: the Wenzel equation revisited, Colloids Surf. A-Physicochem. Eng. Aspects 156 (1999) 381–388. [14] A. Marmur, Contact angles in constrained wetting, Langmuir 12 (1996) 5704–5708. [15] C. Knudby, J. Carrera, On the use of apparent hydraulic diffusivity as an indicator of connectivity, J. Hydrol. 329 (2006) 377–389. [16] S. Loeb, Energy production at the Dead Sea by pressure-retarded osmosis: challenge or chimera? Desalination 120 (1998) 247–262. [17] S. Loeb, One hundred and thirty benign and renewable megawatts from Great Salt Lake? The possibilities of hydroelectric power by pressure-retarded osmosis with spiral module membranes, Desalination 141 (2001) 85–91. [18] G.D. Mehta, S. Loeb, Internal polarization in the porous substructure of a semipermeable membrane under pressure-retarded osmosis, J. Membr. Sci. 4 (1978) 261–265. [19] R.M. Pashley, Effect of degassing on the formation and stability of surfactantfree emulsions and fine Teflon dispersions, J. Phys. Chem. B 107 (2003) 1714–1720. [20] R.M. Pashley, M. Rzechowicz, L.R. Pashley, M.J. Francis, De-gassed water is a better cleaning agent, J. Phys. Chem. B 109 (2005) 1231–1238. [21] J. Bear, Dynamics of Fluids in Porous Media, Dover, New York, 1988.


© Copyright 2026