
G S , S M
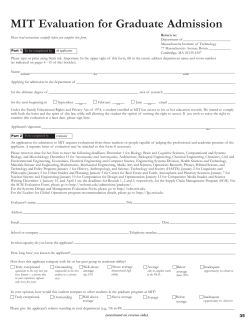
From Singing to Speaking in Aphasic Patients
315
F ROM S INGING TO S PEAKING : W HY S INGING M AY L EAD TO R ECOVERY
OF E XPRESSIVE L ANGUAGE F UNCTION IN PATIENTS WITH B ROCA’ S A PHASIA
G OTTFRIED S CHLAUG , S ARAH M ARCHINA ,
& A NDREA N ORTON
Beth Israel Deaconess Medical Center and
Harvard Medical School, Boston, Massachusetts
IT HAS BEEN REPORTED THAT PATIENTS WITH SEVERELY
nonfluent aphasia are better at singing lyrics than
speaking the same words. This observation inspired the
development of Melodic Intonation Therapy (MIT), a
treatment whose effects have been shown, but whose
efficacy is unproven and neural correlates remain
unidentified. Because of its potential to engage/unmask
language-capable regions in the unaffected right hemisphere, MIT is particularly well suited for patients with
large left-hemisphere lesions. Using two patients with
similar impairments and stroke size/location, we show
the effects of MIT and a control intervention. Both interventions’ post-treatment outcomes revealed significant
improvement in propositional speech that generalized
to unpracticed words and phrases; however, the MITtreated patient’s gains surpassed those of the controltreated patient. Treatment-associated imaging changes
indicate that MIT’s unique engagement of the right
hemisphere, both through singing and tapping with the
left hand to prime the sensorimotor and premotor cortices for articulation, accounts for its effect over nonintoned speech therapy.
Received September 12, 2007, accepted January 5, 2008.
Key words: Melodic Intonation Therapy, aphasia,
language recovery, brain plasticity, music therapy
F THE ESTIMATED 600,000-750,000 NEW STROKES
O
occurring in the US each year (according to
data presented by the American Heart Association and the National Institutes of Health), approximately 20% result in some form of aphasia (http://www.
wrongdiagnosis.com/artic/ninds_aphasia_information_
page_ninds.htm). Aphasia is a condition characterized by
either partial or total loss of the ability to communicate
verbally. A person with aphasia may have difficulty
speaking, reading, writing, recognizing the names of
Music Perception
VOLUME
25,
ISSUE
4,
PP.
315–323,
ISSN
0730-7829, ELECTRONIC
objects, and/or understanding what other people have
said. Aphasia, a disorder caused by a brain injury (e.g.,
stroke, tumor, or trauma), can be subdivided into fluent
and nonfluent categories. Nonfluent aphasia (as in the
patients to be discussed here) generally results from
lesions in the frontal lobe including the portion of the
left frontal lobe known as Broca’s region. Named for
Paul Broca (1864), who first associated this area of the
brain with nonfluent aphasia, this region is thought to
consist of the posterior inferior frontal gyrus (IFG)
encompassing Brodmann’s areas 44 and 45. However,
subsequent reports have shown that a wider array of
lesions in the frontal lobes and in subcortical brain
structures can also present a clinical picture of a Broca’s
aphasia (see Kertesz, Lesk, & McCabe, 1977).
Surprisingly, there are no universally accepted methods for the treatment of nonfluent aphasia against which
new or existing interventions can be tested, nor have any
criteria been established for determining treatment efficacy. Most interventions in the subacute phase are conducted by speech therapists who evaluate patients’
individual needs, then use a combination of techniques to
help recover language/facilitate communication. Despite
the lack of specific criterion for success, most therapists
would agree that treatment efficacy would be defined by
patients’ ability to show improvement in speech output
that generalizes to untrained language structures and/or
contexts (Thompson & Shapiro, 2007).
Because the neural processes that underlie poststroke language recovery remain largely unknown, it
has not been possible to effectively target them using
specific therapies. To date, functional imaging (mostly
positron emission tomography) of language recovery
has largely focused on spontaneous recovery, and patients
have been imaged only after natural recovery has run its
course (Warburton, Price, Swinburn, & Price, 1999;
Weiller et al., 1995). Some studies emphasize the role of
preserved language function in the left hemisphere
(Cappa & Vallar, 1992; Heiss, Kessler, Thiel, Ghaemi, &
Karbe, 1999), while others propose that language function is restored when right-hemisphere regions compensate for the loss (Basso, 1989; Blasi, Young, Tansy,
Petersen, Snyder, & Corbetta, 2002; Cappa & Vallar, 1992;
Cappa et al., 1997; Kinsbourne, 1998; Moore, 1989;
ISSN
1533-8312 © 2008
BY THE REGENTS OF THE UNIVERSITY OF CALIFORNIA . ALL
RIGHTS RESERVED. PLEASE DIRECT ALL REQUESTS FOR PERMISSION TO PHOTOCOPY OR REPRODUCE ARTICLE CONTENT THROUGH THE UNIVERSITY OF CALIFORNIA PRESS ’ S
RIGHTS AND PERMISSIONS WEBSITE , HTTP :// WWW. UCPRESSJOURNALS . COM / REPRINTINFO. ASP.
DOI:10.1525/MP.2008.25.4.315
316
Gottfried Schlaug, Sarah Marchina, & Andrea Norton
I
love
you
A
cup
of
cof
- fee,
please
FIGURE 1. Spoken phrases (prosodic patterns) transposed into melodic intonation patterns. Pitches are determined by the natural prosody of speech—
accented syllables are presented on the higher of the two pitches.
Selnes, 1999; Weiller et al., 1995). Still other studies
report evidence for bihemispheric language processing
(Heiss & Thiel, 2006; Mimura, Kato, Sano, Kojima,
Naeser, & Kashima, 1998; Rosen et al., 2000; Saur et al.,
2006; Winhuisen et al., 2005). Interestingly, only a few
studies have examined the neural correlates of an aphasia treatment by contrasting pre- and post-therapy
assessments (Cornelissen, Laine, Tarkiainen, Järvensivu,
Martin, & Salmelin, 2003; Musso, Weiller, Kiebel, Muller,
Bulau, & Rijntjes, 1999; Saur et al., 2006; Small, Flores, &
Noll, 1998; Thompson & Shapiro, 2005). The general
consensus is that there are two routes to recovery. In
patients with small lesions, there tends to be more activation of left hemisphere peri-lesional cortex and variable
right hemisphere activation during the recovery process
or after recovery. In patients with large left-hemisphere
lesions that involve language regions in the frontotemporal lobes, there tends to be more activation of
the homologous language-capable regions in the right
hemisphere.
Assuming that potential facilitators of language recovery may be either undamaged portions of the lefthemisphere language network, language-capable regions
in the right hemisphere, or both, it is necessary to explore
treatments that can better engage these regions and ultimately, change the course of natural recovery through
neural reorganization. One therapy capable of engaging
regions in both hemispheres is Melodic Intonation Therapy (MIT; Albert, Sparks, & Helm, 1973; Sparks, Helm, &
Albert, 1974), a method developed in response to the
observation that severely aphasic patients can often produce well articulated, linguistically accurate words while
singing, but not during speech (Gerstman, 1964;
Geschwind, 1971; Hebert, Racette, Gagnon, & Peretz,
2003; Keith & Aronson, 1975; Kinsella, Prior, & Murray,
1988). MIT is a hierarchically structured treatment that
uses intoned (sung) patterns to exaggerate the normal
melodic content of speech at three levels of difficulty. The
intonation works by translating prosodic speech patterns
(sung phrases) using just two pitches. The higher
pitches represent the syllables that would naturally be
stressed (accented) during speech (see Figure 1). At the
simplest level, patients learn to intone (sing) a series of
2-syllable words/phrases (e.g., “Water,” “Ice cream,”
“Bathroom”) or simple, 2- or 3-syllable social phrases
(e.g., “Thank you,” “I love you”). As each level is mastered, patients move to the next, and phrases gradually
increase in length (e.g., “I am thirsty,” “A cup of coffee,
please”). Beyond the increased phrase length, the primary change from level to level of MIT lies in the way
the treatment is administered and the degree of support
that is provided by the therapist.
MIT contains two unique elements that set it apart
from other, non-intonation-based therapies: (1) the
melodic intonation (singing) with its inherent continuous voicing, and (2) the rhythmic tapping of each syllable
(using the patient’s left hand) while phrases are intoned
and repeated. Since the initial account of its successful
use in three chronic, nonfluent (Broca’s) aphasic patients
(Albert, Sparks, & Helm, 1973), reports have outlined a
comprehensive program of MIT (Helm-Estabrooks &
Albert, 1991; Sparks & Holland, 1976) including strict
patient selection criteria (Helm-Estabrooks, Nicholas,
& Morgan, 1989), and data that showed significant
improvement on the Boston Diagnostic Aphasia Examination (BDAE; Goodglass & Kaplan, 1983) after treatment (Bonakdarpour, Eftekharzadeh, & Ashayeri, 2000;
Sparks, Helm, & Albert, 1974). In a case study comparing MIT to a non-melodic control therapy, Wilson, Parsons, and Reutens (2006) found that MIT had a general
facilitating effect on articulation, and a longer-term
effect on phrase production that they attributed specifically to its melodic component. However, the outcomes of that study were measured by the patient’s
ability to produce practiced phrases prompted by the
therapist, rather than by the transfer of language skills
to untrained structures and/or contexts.
Another important characteristic of MIT is that, unlike
many therapies administered in the chronic phase that
involve one to two short sessions per week, MIT engages
From Singing to Speaking in Aphasic Patients
patients in intensive treatment totaling 1.5 hrs/day, five
days/week until the patient has mastered all three levels
of MIT. In addition to its unique elements, there are several
other components that play an important role in MIT, but
are also used by other therapies, among them are the slow
rate of vocalization (one syllable/s) and an administration
protocol that includes one-on-one sessions with a therapist who introduces and practices words/phrases using
picture cues while giving continuous feedback. These
shared features were carefully considered as we designed a
control intervention for MIT that included the elements
common to other therapies while specifically excluding the
melodic intonation/continuous voicing and rhythmic tapping that may likely be the key factors in its effectiveness.
The original interpretation of MIT’s path to successful recovery was that it engaged expressive language
areas in the right hemisphere (Albert et al., 1973; Sparks
et al., 1974), although to date, this has not yet been
proven. Alternatively MIT may exert its effect by either
unmasking existing music/language connections in
both hemispheres, or by engaging preserved languagecapable regions in either or both hemispheres. Since
MIT incorporates both melodic and rhythmic aspects
of music (Albert et al., 1973; Boucher, Garcia, Fleurant,
& Paradis, 2001; Cohen & Masse, 1993; Helm-Estabrooks
& Albert, 1991; Sparks & Holland, 1976), it may be
unique in its potential ability to engage both hemispheres. Belin et al. (1996) suggested that MIT-facilitated recovery was associated with the reactivation of
left-hemisphere regions, most notably the left prefrontal cortex, just anterior to Broca’s region. Although,
this publication was the first to examine patients treated
with an MIT-like intervention using functional neuroimaging, their findings were both surprising and
somewhat contrary to the hypotheses proposed by the
developers of MIT (Albert et al., 1973; Sparks et al.,
1974). Furthermore, to help interpret Belin and colleagues’ findings it is important to consider the following: First, only two of their seven patients had Broca’s
aphasia; the rest were diagnosed with global aphasia.
Second, they conducted only one imaging session,
which took place after therapy (no pre-/ post- comparison).
And finally, their analysis was done in predefined
regions of interest rather than across the entire brain
space. It is interesting to note that although Belin and
colleagues’ primary finding was an activation of left
prefrontal regions when participants were asked to
repeat intoned words, there is an important aspect of
their study that is not often reported. In their analysis
comparing the repetition of spoken words with the
hearing of those words, they found blood flow changes
that occurred predominantly in the right hemisphere
317
(including the right temporal lobe and the right central
operculum), which concurs with some of our findings
detailed below.
The aim of our study is to describe and discuss the
unique and shared elements of MIT and to contrast the
behavioral and neural treatment effects of MIT with a
control intervention, Speech Repetition Therapy (SRT),
in two prototypical patients.
Materials and Methods
Participants
We present two of the patients we have treated to date in
our ongoing study of MIT’s effects. Both were diagnosed with severe nonfluent aphasia (restricted verbal
output, impaired naming and repetition, relatively
unimpaired comprehension) as the result of a lefthemisphere ischemic stroke involving mainly the superior division of the middle cerebral artery, and classified
as having Broca’s aphasia. Despite the fact that the
patients had already received more than one year of traditional speech therapy prior to enrollment in our
study, they presented with significantly impaired verbal
output and remained unable to speak fluently. Both
patients were tested twice prior to therapy to establish a
stable baseline. In addition, we assessed their ability to
speak/sing the lyrics of familiar songs by analyzing the
number of Correct Information Units (CIUs; correct,
meaningful words) that each patient produced while
singing and speaking compared to the total number of
words for at least two familiar songs. Patient #1 (male;
age 47; right-handed; native language English; 12+
years of schooling; 2-3 years of instrumental practice as
a child; no active singing in a choir; moderate to severe
right hemiparesis; independent in activities of daily living, ADL; Barthel-index of 95 out of 100) underwent an
intensive course of MIT and was assessed on behavioral
and neural measures at a series of regular intervals that
included assessments after 40 and 75 sessions of MIT.
Patient #2, (male; age 58; right-handed; native language
English; 12+ years of schooling; 1-2 years of instrumental practice as a child and some singing in choirs in high
school and college; moderate to severe right hemiparesis; independent in activities of daily living, ADL;
Barthel-Index of 95 out of 100), matched to Patient #1
with regard to lesion size/location and baseline speech
production abilities, underwent an equally intensive
alternative intervention, SRT, designed to control for
the elements of MIT that are common to other speech
therapies, and exclude its distinct features, the melodic
intonation and rhythmic tapping with the left hand.
318
Gottfried Schlaug, Sarah Marchina, & Andrea Norton
After undergoing 40 sessions of SRT and the same series
of behavioral and neural assessments administered to
Patient #1, Patient #2 underwent treatment with MIT
and was assessed after 40 and 75 therapy sessions. Thus,
both patients had behavioral and brain imaging assessments before and after therapy. The proportion of spoken CIUs/total words possible was significantly lower
than the proportion of sung CIUs/total words in both
patients. Although both patients actually received 75 sessions of MIT, the comparison between the two interventions reported here was made after each patient had
received 40 sessions of their originally assigned treatment (MIT and SRT respectively).
Language Assessments
Based on their Boston Diagnostic Aphasia Examination
(BDAE; Goodglass & Kaplan, 1983) scores, both patients
were classified as having Broca’s aphasia. Patients underwent a series of language assessments (see below) at baseline, and again, four weeks later. This was done in order to
establish a stable baseline and record any fluctuations in
performance. The same set of tests was administered to
both patients after 40 treatment sessions (post40). Further assessments were done after 75 sessions (post75). The
test battery consisted of the following speech production
measures designed to quantitatively assess spontaneous
speech: (1) Conversational interview: regarding patients’
biographical data, medical history, post-stroke treatment,
daily activities, etc.; and (2) Descriptions of complex pictures: using patients’ responses on these measures, we calculated the average number of CIUs/min and the average
number of syllables/phrase. All meaningless utterances,
inappropriate exclamations, incorrect responses (inaccurate information), and/or perseverations were excluded
prior to scoring. Participants were also given confrontational picture naming tasks, including the Boston Naming
Test (BNT; Kaplan, Goodglass, & Weintraub, 2001) and a
matched subset (30 images) of the Snodgrass-Vanderwart
color pictures (1980). All behavioral assessments were
videotaped for analysis. Videotapes were transcribed and
patients’ speech output was checked for intelligibility,
then scored by an independent researcher who was not
associated with the patients during therapy.
Experimental Stimuli and fMRI Paradigm
A list of 16 bisyllabic words/phrases that both patients
were capable of saying at baseline were used for stimuli
in the fMRI experimental task at all imaging time
points, and the rate of speaking/singing (one syllable/s)
remained constant throughout the study. The functional
task consisted of five conditions: two experimental (spoken or sung bisyllabic words/phrases) and three control
(humming, phonation, and silence). In the experimental
conditions, participants heard an investigator saying/
singing two-syllable words or phrases (presented at the
rate of one syllable/s), then repeated exactly what they
had heard after an auditory cue. In the silence condition,
participants were asked to wait for the cue, then take a
breath as if to respond as they had in the other conditions (for more details on the fMRI tasks see Ozdemir,
Norton, & Schlaug, 2006). Functional magnetic resonance imaging (fMRI) and sparse temporal sampling
was done as previously reported in detail (see Gaab,
Gaser, Zaehle, Chen, & Schlaug, 2003, and Ozdemir,
Norton, & Schlaug, 2006). Participants’ responses were
recorded for offline analysis. Both of the patients
reported here had 100% correct response rates.
Treatments
The two patients in this study were randomly assigned
to treatment type (either MIT or SRT). Both patients
worked one-on-one with the same therapist for 1.5
hours/day, five days/week, and were given a set of materials for daily home practice. Both interventions were
identical with regard to the length of phrases, the use of
picture stimuli, and the level of support provided by the
therapist at each stage of advancement. SRT differed
only in that the phrases were spoken rather than intoned
(sung), syllables were not sustained, and there was no
hand tapping associated with the production of speech.
Results
Behavioral and Imaging Effects of the MIT Intervention
Patient #1, who was 13 months post onset of a lefthemispheric stroke (see Figure 2 for lesion location/
size), was assigned to treatment with MIT. He underwent two pre-treatment assessments separated by 4 weeks
(pre1 and pre2), a mid-treatment assessment after 40
therapy sessions (post40), and a post-treatment assessment after 75 sessions of MIT (post75). At baseline, his
spontaneous speech assessments yielded results consistent with his diagnosis. Repeat assessments conducted
prior to MIT showed no significant changes. After only
40 sessions of MIT, he showed significant improvement
on measures of speech output and confrontational
naming, and after 75 sessions of MIT, those improvements were even more pronounced (for all behavioral
results, see Table 1).
From Singing to Speaking in Aphasic Patients
319
contrast); however, the post40 scan also showed more
prominent right-hemispheric activation involving the
right posterior middle premotor cortex and right inferior frontal gyrus, as well as a slightly smaller increase in
activation of the posterior superior temporal gyrus.
Behavioral and Imaging Effects of the SRT Intervention
FIGURE 2. High-resolution, T1-weighted images show the chronic,
left-hemisphere lesion location and extent of Patients #1 and #2,
encompassing both Broca’s region and the anterior part of the superior
temporal lobe.
Patient #1’s baseline and post40 fMRI studies (see
Figure 3 in color plate section) showed posterior perisylvian activation on the left, and both superior temporal
and inferior precentral gyrus activation on the right
during the speaking condition (speaking vs. silence
Patient #2, who was 12 months post onset of a lefthemispheric stroke (see Figure 2 for lesion location/
size), was assigned to treatment with SRT. His dissociation between speaking and singing and baseline speech
production rate were similar to that of Patient #1. There
were no significant changes on repeat baseline assessments. After 40 SRT sessions, Patient #2’s speech production scores improved, his picture-naming score
increased (Table 1), and his fMRI studies (Figure 3 in
color plate section) that had at baseline shown activation of the posterior superior temporal gyrus (STG),
superior temporal sulcus (STS), and middle to inferior
precentral gyrus on the right, with a very small area of
activation on the left during the speaking condition
(Overt Speaking vs. Silence control condition), showed
more prominent left-hemispheric activation involving
the inferior part of the pre- and post-central gyrus, as
well as the middle and posterior portions of the
STG/STS, left more than right. Patient #2 also shows the
Overt Speaking vs. Silence (control condition) contrast
after an additional 40 sessions of MIT that followed the
SRT sessions. Slight differences can be seen in the
regional magnitude of activation, with a greater emphasis on the right premotor/motor and temporal lobes
TABLE 1. Summary of Language Outcomes.
ID
Treatment
Measure
Baseline
Post40
% Change
Post75
% Change
Patient 1
MIT
CIUs/min.
Syllables/phrase
Picture naming
(% correct)
4.40
1.80
60.00
10.10
4.10
80.00
229.50
227.80
133.30
13.90
4.70
95.00
315.90
261.10
158.30
Patient 2
SRT
CIUs/min.
Syllables/phrase
Picture naming
(% correct)
3.60
2.40
59.00
6.80
4.00
72.00
188.90
166.70
122.00
Patient 2
MIT
(after SRT)
CIUs/min.
6.80
16.70
245.60
20.50
301.50
4.00
72.00
8.90
90.00
222.50
125.00
10.10
89.00
252.50
123.60
Syllables/phrase
Picture naming
(% correct)
Note: MIT = Melodic Intonation Therapy; SRT = Speech Repetition Therapy; CIU/min = Correct Information Units/min; Picture naming = percent of correctly named pictures out of 60 (Boston Naming Test); Post40 refers to assessment after 40 treatment sessions; Post75 = after 75 treatment sessions.
320
Gottfried Schlaug, Sarah Marchina, & Andrea Norton
(yellow level of activation) and the slightly lower magnitude of activation in the left posterior perisylvian region
(more red than yellow) comparing the images after
MIT with the images after SRT treatment for Patient #2.
The between-treatments comparison (Patient #1
MIT vs. Patient #2 SRT) made after 40 sessions (see also
Table 1) showed that the MIT-treated patient had
greater improvement on all outcomes than the SRTtreated patient. fMRI studies revealed that Patient #1
showed significant fMRI changes in a right-hemisphere
network involving the premotor, inferior frontal, and
temporal lobes, while Patient #2 had changes in a lefthemisphere network consisting of the inferior pre- and
post-central gyrus and the superior temporal gyrus.
Following his post40-SRT assessment, Patient #2 was
enrolled in the MIT treatment, and the post40 scores
became the new baseline from which the effects of MIT
would be measured. After 40 sessions of MIT, Patient #2
showed a further increase in speech output and picturenaming, and his post75-MIT assessments revealed further gains in speech output while the picture-naming
score remained stable (see Table1).
Discussion
The traditional explanation for the dissociation
between speaking and singing in aphasic patients is the
presence of two routes for word articulation: one for
spoken words through the brain’s left hemisphere, and a
separate route for sung words that uses either the right
or both hemispheres. The small amount of empirical
data available supports a bihemispheric role in the execution and sensorimotor control of vocal production
for both speaking and singing (Bohland & Guenther,
2006; Brown, Martinez, Hodges, Fox, & Parsons, 2004;
Guenther, Hampson, & Johnson, 1998; Jeffries, Fritz, &
Braun, 2003; Ozdemir et al., 2006), with a tendency for
greater left-lateralization for speaking under normal
physiological conditions (i.e., faster rates of production
during speaking than singing). The representation of
sensory elements of music and language might be either
separate, or in different locations with smaller degrees
of overlap (for more details on this see also Koelsch,
Fritz, Schulze, Alsop, & Schlaug, 2005; Koelsch, Gunter,
von Cramon, Zysset, Lohmann, & Friederici, 2002;
Patel, 2003; Peretz, 2003). Nevertheless, if there is a
bihemispheric representation for speech production,
then the question of why an intervention that uses
singing or a form of singing such as MIT has the potential
to facilitate syllable and word production, still remains.
In theory, there are four possible mechanisms by which
MIT’s facilitating effect may be achieved: (1) Reduction
of speed: in singing, words can be articulated at a slower
rate than in speaking, thereby reducing dependence on
the left-hemisphere; (2) Syllable lengthening: provides
the opportunity to distinguish the individual phonemes
that together form words and phrases. Such connected
segmentation, coupled with the reduction of speed in
singing, can help nonfluent aphasic patients become
more fluent, and may receive greater support from righthemisphere structures; (3) Syllable “chunking”: prosodic
features such as intonation, change in pitch, and syllabic
stress may help patients group syllables into words and
words into phrases, and this “chunking” (Chase & Simon,
1973; de Groot, 1965) may also enlist more right-hemisphere support; and 4) Hand tapping: it is likely that MIT
engages a right-hemispheric, sensorimotor network
through the tapping of the patient’s left hand as each syllable is sung (one tap/syllable, one syllable/s), which may
in turn provide an impulse for verbal production in much
the same way that a metronome has been shown to serve
as a “pacemaker”in other motor activities (rhythmic anticipation, rhythmic entrainment; Thaut, Kenyon, Schauer,
& McIntosh,1999). In addition, there may be a set of
shared neural correlates that control both hand movements and articulatory movements (Gentilucci, Benuzzi,
Bertolani, Daprati, & Gangittano, 2000; Meister, Boroojerdi, Foltys, Sparing, Huber, & Topper, 2003; Tokimura,
Tokimura, Oliviero, Asakura, & Rothwell, 1996; Uozumi,
Tamagawa, Hashimoto, & Tsuji, 2004), and further, the
sound produced by the tapping may encourage auditorymotor coupling (Lahav, Saltzman, & Schlaug, 2007).
The two unique elements of MIT most likely to make
the strongest contribution to the therapy’s beneficial
effects are the melodic intonation with its inherent sustained vocalization, and tapping with the left hand.
How might melodic intonation influence recovery?
Functional imaging tasks targeting the perception of
musical components that require a more global than
local processing strategy (e.g., melodic contour, musical
phrasing, and/or meter) tend to elicit greater activity in
right-hemispheric brain regions than in left-hemispheric
regions. It has been shown that tasks that emphasize
spectral information over temporal information have
shown more right- than left-hemispheric activation
(Zatorre & Belin, 2001). Similarly, patients with righthemisphere lesions have greater difficulty with global
processing (e.g., melody and contour processing) than
those with left-hemisphere lesions (Peretz, 1990;
Schuppert, Munte, Wieringa, & Altenmueller, 2000). It is
most likely that the two unique elements of MIT, the
melodic intonation with its inherent sustained vocalization and the rhythmic tapping of the left hand, make
the strongest contribution to the therapy’s beneficial effect.
From Singing to Speaking in Aphasic Patients
The effects of the left hand tapping should be considered in the same context. Once the right temporal lobe
is specifically engaged by the melodic intonation and
melodic contour, it is conceivable that the role of the left
hand tapping could be the activation and priming of a
right-hemispheric sensorimotor network for articulation. Since concurrent speech and hand use occurs in
daily life, and gestures are frequently used during
speech, hand movements, possibly in synchrony with
articulatory movements, may have a facilitating effect
on speech production, but the precise role of this facilitation is unknown. We hypothesize that tapping the left
hand may engage a right-hemispheric sensorimotor
network that coordinates not only hand movements
but orofacial and articulatory movements as well. There
is some evidence in the literature that such superordinate centers exist in the premotor cortex and share neural substrates for hand and orofacial movements
(Meister et al., 2003; Tokimura et al., 1996; Uozumi et
al., 2004). Furthermore, behavioral (Gentilucci et al.,
2000), neurophysiological (Meister et al., 2003;
Tokimura et al., 1996) and fMRI studies (Aziz-Zadeh,
Wilson, Rizzolatti, & Iacoboni, 2006) have shown that
motor and linguistic cortical representations of objects
are closely linked, and that the premotor cortex may
belong to an integrative network coordinating motor
and linguistic expression. An additional or alternative
explanation is that the left hand tapping may serve the
same function as a pacemaker or metronome has in
rehabilitation of other motor activities, and in so doing,
may facilitate speech production through rhythmic
anticipation, rhythmic entrainment, or auditory-motor
321
coupling (see also Lahav et al., 2007, and Thaut et al.,
1999).
In summary, the melodic intonation and left hand tapping are the critical, unique elements of MIT that may
likely be responsible for its therapeutic effect and might
explain the predominant right hemispheric activation
pattern seen in our prototypical patient. Elements of
MIT that are shared with other, non-intonation-based
therapies (e.g., the intensity of the intervention, direct
therapist/patient interaction, unison and antiphonal
repetition of words and phrases) also have therapeutic
effects, as can be seen in our patient treated with SRT.
Although caution should be exercised when making
generalizations from results in two prototypical patients,
we hope that our findings will serve as a source for further discussion on the efficacy of MIT, the neural correlates of MIT, and the choice of appropriate control
interventions for MIT.
Author Note
This work was supported in part by grants from the
National Institute of Neurological Disease and Stroke
(NS045049, DC008796), the Doris Duke Charitable
Foundation, the Grammy Foundation, and The Mattina R. Proctor Foundation.
Correspondence concerning this article should be
addressed to Gottfried Schlaug, Department of Neurology,
Beth Israel Deaconess Medical Center, 330 Brookline
Avenue, Boston, MA 02215. E-MAIL: gschlaug@bidmc.
harvard.edu
References
A LBERT, M. L., S PARKS , R. W., & H ELM , N. A. (1973). Melodic
intonation therapy for aphasia. Archives of Neurology, 29,
130-131.
A ZIZ -Z ADEH , L., W ILSON , S. M., R IZZOLATTI , G., &
I ACOBONI , M. (2006). Congruent embodied representations
for visually presented actions and linguistic phrases
describing actions. Current Biology, 16, 1818-1823.
B ASSO, A., G ARDELLI , M., G RASSI , M. P., & M AIROTTI , M.
(1989). The role of the right hemisphere in recovery from
aphasia. Two case studies. Cortex 25, 555-566.
B ELIN , P., VAN E ECKHOUT, P., Z ILBOVICIUS , M., R EMY, P.,
F RANÇOIS , C., G UILLAUME , S., ET AL . (1996). Recovery from
nonfluent aphasia after melodic intonation therapy: A PET
study. Neurology, 47, 1504-1511.
B LASI , V., YOUNG , A. C., TANSY, A. P., P ETERSEN , S. E.,
S NYDER , A. Z., & C ORBETTA , M. (2002). Word retrieval
learning modulates right frontal cortex in patients with left
frontal damage. Neuron, 36, 159-170.
B OHLAND, J. W., & G UENTHER , F. H. (2006). An fMRI
investigation of syllable sequence production. Neuroimage,
32, 821-841.
B ONAKDARPOUR , B., E FTEKHARZADEH , A., & A SHAYERI , H.
(2000). Preliminary report on the effects of melodic
intonation therapy in the rehabilitation of Persian aphasic
patients. Iranian Journal of Medical Sciences, 25, 156-160.
B OUCHER , V., G ARCIA , L. J., F LEURANT, J., & PARADIS , J.
(2001). Variable efficacy of rhythm and tone in melody-based
interventions: implications for the assumption of a
322
Gottfried Schlaug, Sarah Marchina, & Andrea Norton
right-hemisphere facilitation in nonfluent aphasia.
Aphasiology, 15, 131-149.
B ROCA , P. (1864) Deux cas d’aphemie tramatique, produite par
des lesions de la troisieme circonvolution frontale gauche.
Bulletin de la Societe de Chirurgie de Paris, V, 51-54.
B ROWN , S., M ARTINEZ , M. J., H ODGES , D. A., F OX , P. T., &
PARSONS , L. M. (2004). The song system of the human
brain. Brain Research Cognitive Brain Research, 20, 363-75.
C APPA , S. F., P ERANI , D., G RASSI , F., B RESSI , S., A LBERONI ,
M., F RANCESCHI , M., ET AL . (1997). A PET follow-up study
of recovery after stroke in acute aphasics. Brain and Language,
56, 55-67.
C APPA , S., & VALLAR , G. (1992). The role of left and right
hemispheres in recovery from aphasia. Aphasiology, 6, 356-372.
C HASE , W. G., & S IMON , H. A. (1973). The mind’s eye in
chess. In W. G. Chase (Ed.), Visual information processing
(pp. 215-281). New York: Academic.
C OHEN , N. S., & M ASSE , R. (1993). The application of singing
and rhythmic instruction as a therapeutic intervention for
persons with neurogenic communication disorders. Journal
of Music Therapy, 30, 81-99.
C ORNELISSEN , K., L AINE , M., TARKIAINEN , A., J ÄRVENSIVU,
T., M ARTIN , N., & S ALMELIN , R. (2003). Adult brain
plasticity elicited by anomia treatment. Journal of Cognitive
Neuroscience, 15, 444-461.
DE G ROOT, A. D. (1965). Thought and choice in chess. The
Hague, The Netherlands: Mouton & Co.
G AAB , N., G ASER , C., Z AEHLE , T., C HEN , Y., & S CHLAUG , G.
(2003). Functional anatomy of pitch memory—A fMRI study
with sparse temporal sampling. Neuroimage, 19, 1417-1426.
G ENTILUCCI , M., B ENUZZI , F., B ERTOLANI , L., DAPRATI , E., &
G ANGITANO, M. (2000). Language and motor control.
Experimental Brain Research, 133, 468-490.
G ERSTMAN , H. L. (1964). A case of aphasia. Journal of Speech &
Hearing Disorders, 29, 89-91.
G ESCHWIND, N. (1971). Current concepts: Aphasia. New
England Journal of Medicine, 284, 654-656.
G OODGLASS , H., & K APLAN , E. (1983). Boston Diagnostic
Aphasia Examination (2nd ed.). Philadelphia: Lea & Febiger.
G UENTHER , F. H., H AMPSON , M., & J OHNSON , D. (1998). A
theoretical investigation of reference frames for the planning
of speech movements. Psychological Review 105, 611-633.
H EBERT, S., R ACETTE , A., G AGNON , L., & P ERETZ , I. (2003).
Revisiting the dissociation between singing and speaking in
expressive aphasia. Brain, 126, 1-13.
HEISS, W. D., KESSLER , J., THIEL , A., GHAEMI, M., & KARBE , H.
(1999). Differential capacity of left and right hemispheric
areas for compensation of poststroke aphasia. Annals of
Neurology,45, 430-438.
H EISS , W. D., & T HIEL , A. (2006). A proposed regional
hierarchy in recovery of post-stroke aphasia. Brain and
Language, 98, 118-123.
H ELM -E STABROOKS , N., & A LBERT, M. L. (1991). Manual of
aphasia therapy. Austin: Pro-Ed.
H ELM -E STABROOKS , N., N ICHOLAS , M., & M ORGAN , A.
(1989). Melodic intonation therapy. Austin: Pro-Ed.
J EFFRIES , K. J., F RITZ , J. B., & B RAUN , A. R. (2003). Words in
melody: An H215O PET study of brain activation during
singing and speaking. Neuroreport, 14, 749-745.
K APLAN , E., G OODGLASS , H., & W EINTRAUB , S. (2001). Boston
Naming Test (2nd ed.). Baltimore and Philadelphia:
Lippincott, Williams & Wilkins.
K EITH , R. L., & A RONSON , A. E. (1975). Singing as therapy for
apraxia of speech and aphasia: Report of a case. Brain and
Language, 2, 483-488.
K ERTESZ , A., L ESK , D., & M C C ABE , P. (1977). Isotope
localization of infarcts in aphasia. Archives of Neurology, 100, 1-18.
K INSBOURNE , M. (1998). The right hemisphere and recovery
from aphasia. In B. Stemmer & H. A. Whitaker (Eds.),
Handbook of neurolinguistics (pp. 386-393). New York:
Academic Press.
K INSELLA , G., P RIOR , M. R., & M URRAY, G. (1988). Singing
ability after right and left sided brain damage. A research
note. Cortex, 24, 165-169.
KOELSCH , S., G UNTER , T. C., VON C RAMON , D. Y., Z YSSET, S.,
LOHMANN , G., & F RIEDERICI , A. D. (2002). Bach speaks: A
cortical “language-network” serves the processing of music.
Neuroimage, 17, 956-966.
KOELSCH, S., FRITZ, T., SCHULZE , K., ALSOP, D., & SCHLAUG, G.
(2005). Adults and children processing music: An fMRI study.
Neuroimage, 25, 1068-1076.
L AHAV, A., S ALTZMAN , E., & S CHLAUG , G. (2007). Action
representation of sound: Audiomotor recognition network
while listening to newly-acquired actions. Journal of
Neuroscience, 27, 308-314.
M EISTER , I. G., B OROOJERDI , B., F OLTYS , H., S PARING , R.,
H UBER , W., & TOPPER , R. (2003). Motor cortex hand area
and speech: Implications for the development of language.
Neuropsychologia, 41, 401-406.
M IMURA , M., K ATO, M., S ANO, Y., KOJIMA , T., NAESER , M.,
& K ASHIMA , H. (1998). Prospective and retrospective
studies or recovery in aphasia—Changes in cerebral
blood flow and language functions. Brain, 121,
2083-2094.
M OORE , W. H. (1989). Language recovery in aphasia: A right
hemisphere perspective. Aphasiology, 3, 101-110.
M USSO, M., W EILLER , C., K IEBEL , S., M ULLER , S. P., B ULAU,
P., & R IJNTJES , M. (1999). Training-induced brain plasticity
in aphasia. Brain, 122, 1781-1790.
O ZDEMIR , E., N ORTON , A., & S CHLAUG , G. (2006). Shared
and distinct neural correlates of singing and speaking.
Neuroimage, 33, 628-635.
PATEL , A. D. (2003). Language, music, syntax and the brain.
Nature Neuroscience, 6, 674-681.
From Singing to Speaking in Aphasic Patients
P ERETZ , I. (1990). Processing of local and global musical
information by unilateral brain-damaged patients. Brain, 113,
1185-205.
R OSEN , H. J., P ETERSEN , S. E., L INENWEBER , M. R., S NYDER ,
A. Z., W HITE , D. A., C HAPMAN , L., ET AL . (2000). Neural
correlates of recovery from aphasia after damage to left
inferior frontal cortex. Neurology, 55, 1883-1894.
S AUR , D., L ANGE , R., B AUMGAERTNER , A., S CHRAKNEPPER , V.,
W ILLMES , K., R IJNTJES , M., & W EILLER , C. (2006). Dynamics
of language reorganization after stroke. Brain, 129, 1371-1384.
S CHUPPERT, M., M UNTE , T. F., W IERINGA , B. M., &
A LTENMULLER , E. (2000). Receptive amusia: Evidence for
cross-hemispheric neural networks underlying music
processing strategies. Brain, 123, 546-559.
S ELNES , O. A. (1999). Recovery from aphasia: Activating the
“right” hemisphere. Annals of Neurology, 45, 419-420.
S MALL , S. L., F LORES , D. K., & N OLL , D. C. (1998). Different
neural circuits subserve reading before and after therapy for
acquired dyslexia. Brain and Language, 62, 298-308.
S NODGRASS , J. G., & VANDERWART, M. (1980). A standardized
set of 260 pictures: norms for name agreement, image agreement,
familiarity, and visual complexity. Journal of Experimental
Psychology: Human Learning and Memory, 6, 174-215.
S PARKS , R., H ELM , N., & A LBERT, M. (1974). Aphasia
rehabilitation resulting from melodic intonation therapy.
Cortex, 10, 303-316.
S PARKS , R., & H OLLAND, A. (1976). Method: Melodic
intonation therapy for aphasia. Journal of Speech and Hearing
Disorders 41, 287-297.
T HAUT, M. H., K ENYON , G. P., S CHAUER , M. L., &
M C I NTOSH , G. C. (1999). Rhythmicity and brain function:
Implications for therapy of movement disorders. IEEE
Engineering in Medicine and Biology Magazine, 18, 101-108.
323
T HOMPSON , C. K., & S HAPIRO, L. P. (2005). Treating
agrammatic aphasia within a linguistic framework: Treatment
of Underlying Forms. Aphasiology 19, 10-11.
T HOMPSON , C. K., & S HAPIRO, L. P. (2007). Complexity in
treatment of syntactic deficits. American Journal of Speech and
Language Pathology, 16, 30-42.
TOKIMURA , H., TOKIMURA , Y., O LIVIERO, A., A SAKURA ,
T., & ROTHWELL, J. C. (1996). Speech-induced changes in
corticospinal excitability. Annals of Neurology, 40,
628-634.
U OZUMI , T., TAMAGAWA , A., H ASHIMOTO, T., & T SUJI , S.
(2004). Motor hand representation in cortical area 44.
Neurology, 62, 757-761.
WARBURTON , E., P RICE , C. J., S WINBURN , K., & W ISE , R. J.
(1999). Mechanisms of recovery from aphasia: evidence from
positron emission tomography studies. Journal of Neurology,
Neurosurgery and Psychiatry, 66, 155-161.
W EILLER , C., I SENSEE , C., R IJNTJES , M., H UBER , W., M ÜLLER ,
S., B IER , D., ET AL . (1995). Recovery from Wernicke’s
aphasia: A positron emission tomographic study. Annals of
Neurology, 37, 723-732.
W ILSON , S. J., PARSONS , K., & R EUTENS , D. C. (2006).
Preserved singing in aphasia: A case study of the efficacy of
the Melodic Intonation Therapy. Music Perception, 24, 23-36.
W INHUISEN , L., T HIEL , A., S CHUMACHER , B., K ESSLER , J.,
RUDOLF, J., H AUPT, W. F., & H EISS , W. D. (2005). Role of
the contralateral inferior frontal gyrus in recovery of
language function in poststroke aphasia: A combined
repetitive transcranial magnetic stimulation and positron
emission tomography study. Stroke, 36, 1759-1763.
Z ATORRE , R. J., & B ELIN , P. (2001). Spectral and temporal
processing in human auditory cortex. Cerebral Cortex, 11,
946-953.
05:48 PM
fMRI activation maps (superimposed onto the surface projections of a spatially standardized normal brain) of the contrast “Overt Speaking vs. Silence (control condition)” (p < 0.05 FWE) for
Patients #1 and #2 at baseline and after 40 therapy sessions. The color coding reflects different magnitudes of activation: the color yellow reflects a stronger activation than the color red. Patient
#2 also shows the “Overt Speaking vs. Silence (control condition)” contrast after an additional 40 sessions of MIT that followed the SRT sessions. Slight differences can be seen in the regional
magnitude of activation with a greater magnitude of activation in the right premotor/motor and temporal lobes (yellow level of activation) and the slightly lower magnitude of activation in the
left posterior perisylvian region (more red than yellow) comparing the images after MIT with the images after SRT treatment for Patient #2.
3/7/08
GOTTFRIED SCHLAUG, SARAH MARCHINA, AND ANDREA NORTON, FIGURE 3.
Music2504_Color_Plate
Page 386


© Copyright 2026