
Acrobat PDF - OSA Publishing
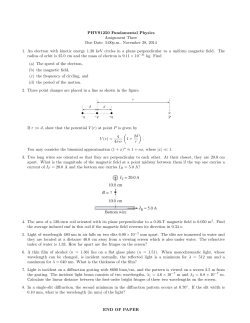
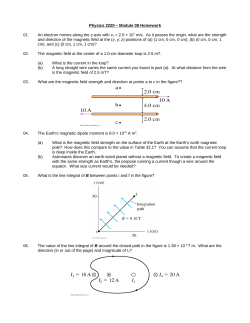
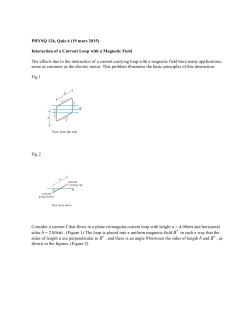
Magnetic interaction in all silicon waveguide
spherical coupler device
Lei Shi1,2,* and Francisco Meseguer1,2
1
Centro de Tecnologías Físicas, Unidad Asociada ICMM/CSIC-UPV, Universidad Politécnica de Valencia, Av. Los
Naranjos s/n, Valencia, 46022, Spain
2
Instituto de Ciencia de Materiales de Madrid CSIC, Sor Juana Ines de la Cruz sn, Cantoblanco, Madrid, Spain
*
[email protected]
Abstract: The magnetic field component of light in dielectric materials
generally plays a negligible role at optical frequency values. However, it is a
key component of metal based metamaterials. Here we report on the
dominant role of the magnetic interaction in a dielectric spherical silicon
nanocavity coupled to a silicon waveguide. The analytical method, as well
as the finite difference time domain (FDTD) simulation, show a three
dimensional (3D) magnetic trap effect when the magnetic like Mie
resonances of the nanocavity are excited.
©2012 Optical Society of America
OCIS codes: (160.3918) Metamaterials; (350.4855) Optical tweezers or optical manipulation;
(290.4020) Mie theory.
References and links
1.
2.
3.
4.
5.
6.
7.
8.
9.
10.
11.
12.
13.
14.
15.
16.
17.
18.
19.
20.
21.
A. Ashkin, “Acceleration and trapping of particles by radiation pressure,” Phys. Rev. Lett. 24(4), 156–159
(1970).
A. Ashkin and J. M. Dziedzic, “Observation of resonances in the radiation pressure on dielectric spheres,” Phys.
Rev. Lett. 38(23), 1351–1354 (1977).
S. Chu, “Noble lecture: the manipulation of neutral particles,” Rev. Mod. Phys. 70(3), 685–706 (1998).
D. G. Grier, “A revolution in optical manipulation,” Nature 424(6950), 21–27 (2006).
M. L. Juan, M. Righini, and R. Quidant, “Plasmon nano-optical tweezers,” Nat. Photonics 5(6), 349–356 (2011).
A. Ashkin, “Optical trapping and manipulation of neutral particles using lasers,” Proc. Natl. Acad. Sci. U.S.A.
94(10), 4853–4860 (1997).
F. M. Fazal and S. M. Block, “Optical tweezers study life under tension,” Nat. Photonics 5(6), 318–321 (2011).
S. Chu, “Laser manipulation of atoms and particles,” Science 253(5022), 861–866 (1991).
W. Ketterle, “Nobel lecture: when atoms behave as waves: Bose-Einstein condensation and the atom laser,” Rev.
Mod. Phys. 74(4), 1131–1151 (2002).
I. Bloch, “Ultracold quantum gases in optical lattices,” Nat. Phys. 1(1), 23–30 (2005).
L. D. Landau and E. M. Lifshitz, Electrodynamics of Continuous Media (Wiley, 1984)
J. D. Jackson, Classical Electrodynamics (John Wiley & Sons, Inc, 1962).
D. R. Smith, J. B. Pendry, and M. C. K. Wiltshire, “Metamaterials and negative refractive index,” Science
305(5685), 788–792 (2004).
C. M. Soukoulis and M. Wegener, “Past achievements and future challenges in the development of threedimensional photonic metamaterials,” Nat. Photonics 5, 523–530 (2011).
R. Merlin, “Metamaterials and the Landau-Lifshitz permeability argument: large permittivity begets highfrequency magnetism,” Proc. Natl. Acad. Sci. U.S.A. 106(6), 1693–1698 (2009).
M. Burresi, D. van Oosten, T. Kampfrath, H. Schoenmaker, R. Heideman, A. Leinse, and L. Kuipers, “Probing
the magnetic field of light at optical frequencies,” Science 326(5952), 550–553 (2009).
S. Vignolini, F. Intonti, F. Riboli, L. Balet, L. H. Li, M. Francardi, A. Gerardino, A. Fiore, D. S. Wiersma, and
M. Gurioli, “Magnetic imaging in photonic crystal microcavities,” Phys. Rev. Lett. 105(12), 123902 (2010).
M. Burresi, T. Kampfrath, D. van Oosten, J. C. Prangsma, B. S. Song, S. Noda, and L. Kuipers, “Magnetic lightmatter interactions in a photonic crystal nanocavity,” Phys. Rev. Lett. 105(12), 123901 (2010).
C. Enkrich, M. Wegener, S. Linden, S. Burger, L. Zschiedrich, F. Schmidt, J. F. Zhou, Th. Koschny, and C. M.
Soukoulis, “Magnetic metamaterials at telecommunication and visible frequencies,” Phys. Rev. Lett. 95(20),
203901 (2005).
A. N. Grigorenko, A. K. Geim, H. F. Gleeson, Y. Zhang, A. A. Firsov, I. Y. Khrushchev, and J. Petrovic,
“Nanofabricated media with negative permeability at visible frequencies,” Nature 438(7066), 335–338 (2005).
R. Zhao, P. Tassin, T. Koschny, and C. M. Soukoulis, “Optical forces in nanowire pairs and metamaterials,” Opt.
Express 18(25), 25665–25676 (2010).
#165997 - $15.00 USD
(C) 2012 OSA
Received 3 Apr 2012; revised 18 Jun 2012; accepted 29 Jun 2012; published 19 Sep 2012
24 September 2012 / Vol. 20, No. 20 / OPTICS EXPRESS 22616
22. M. Lapine, I. V. Shadrivov, D. A. Powell, and Y. S. Kivshar, “Magnetoelastic metamaterials,” Nat. Mater. 11(1),
30–33 (2011).
23. Y. Liu and X. Zhang, “Metamaterials: a new frontier of science and technology,” Chem. Soc. Rev. 40(5), 2494–
2507 (2011).
24. V. Garcés-Chávez, R. Quidant, P. J. Reece, G. Badenes, L. Torner, and K. Dholakia, “Extended organization of
colloidal microparticles by surface plasmon polariton excitation,” Phys. Rev. B 73(8), 085417 (2006).
25. S. O'Brien and J. B. Pendry, “Photonic band-gap effects and magnetic activity in dielectric composites,” J. Phys.
Condens. Matter 14(15), 4035–4044 (2002).
26. B. I. Popa and S. A. Cummer, “Compact dielectric particles as a building block for low-loss magnetic
metamaterials,” Phys. Rev. Lett. 100(20), 207401 (2008).
27. J. A. Schuller, R. Zia, T. Taubner, and M. L. Brongersma, “Dielectric metamaterials based on electric and
magnetic resonances of silicon carbide particles,” Phys. Rev. Lett. 99(10), 107401 (2007).
28. M. Nieto-Vesperinas, R. Gomez-Medina, and J. J. Saenz, “Angle-suppressed scattering and optical forces on
submicronmeter dielectric particles,” J. Opt. Soc. Am. A 28(1), 54–60 (2011).
29. J. T. Harris, J. L. Hueso, and B. A. Korgel, “Hydrogenated Amorphous Silicon (a-Si:H) Colloids,” Chem. Mater.
22(23), 6378–6383 (2010).
30. R. Fenollosa, F. Meseguer, and M. Tymczenko, “Silicon colloids: from microcavities to photonic sponges,” Adv.
Mater. (Deerfield Beach Fla.) 20(1), 95–98 (2008).
31. E. Xifré-Pérez, R. Fenollosa, and F. Meseguer, “Low order modes in microcavities based on silicon colloids,”
Opt. Express 19(4), 3455–3463 (2011).
32. E. Xifré-Pérez, J. D. Domenech, R. Fenollosa, P. Muñoz, J. Capmany, and F. Meseguer, “All silicon waveguide
spherical microcavity coupler device,” Opt. Express 19(4), 3185–3192 (2011).
33. P. C. Chaumet and A. Rahmani, “Electromagnetic force and torque on magnetic and negative-index scatterers,”
Opt. Express 17(4), 2224–2234 (2009).
34. M. Nieto-Vesperinas, J. J. Sáenz, R. Gómez-Medina, and L. Chantada, “Optical forces on small
magnetodielectric particles,” Opt. Express 18(11), 11428–11443 (2010).
35. R. Gómez-Medina, M. Nieto-Vesperinas, and J. J. Saenz, “Nonconservative electric and magnetic optical forces
on submicron dielectric particles,” Phys. Rev. A 83(3), 033825 (2011).
36. L. Shi, E. Xifré-Pérez, F. J. García de Abajo, and F. Meseguer, “Looking through the mirror: optical microcavitymirror image photonic interaction,” Opt. Express 20(10), 11247–11255 (2012).
37. D. Erickson, X. Serey, Y. F. Chen, and S. Mandal, “Nanomanipulation using near field photonics,” Lab Chip
11(6), 995–1009 (2011).
38. S. Lin, E. Schonbrun, and K. Crozier, “Optical manipulation with planar silicon microring resonators,” Nano
Lett. 10(7), 2408–2411 (2010).
39. S. Mandal, X. Serey, and D. Erickson, “Nanomanipulation using silicon photonic crystal resonators,” Nano Lett.
10(1), 99–104 (2010).
40. M. Righini, A. S. Zelenina, C. Girard, and R. Quidant, “Parallel and selective trapping in a patterned plasmonic
landscape,” Nat. Photonics 3, 477–480 (2007).
41. M. Greiner and S. Fölling, “Condensed-matter physics: optical lattices,” Nature 453(7196), 736–738 (2008).
42. P. W. Barber and S. C. Hill, Light Scattering by Particles: Computational Methods (World Scientific, 1990).
43. J. A. Stratton, Electromagnetic Theory (The Maple Press Company, 1941)
44. S. Albaladejo, M. I. Marqués, M. Laroche, and J. J. Sáenz, “Scattering forces from the curl of the spin angular
momentum of a light field,” Phys. Rev. Lett. 102(11), 113602 (2009).
45. T. Iida and H. Ishihara, “Theoretical study of the optical manipulation of semiconductor nanoparticles under an
excitonic resonance condition,” Phys. Rev. Lett. 90(5), 057403 (2003).
46. X. Yang, Y. Liu, R. F. Oulton, X. Yin, and X. Zhang, “Optical forces in hybrid plasmonic waveguides,” Nano
Lett. 11(2), 321–328 (2011).
47. W. Cai and V. Shalaev, Optical Metamaterials: Fundamentals and Applications (Springer, 2010).
48. E. D. Palik, ed., Handbook of Optical Constants of Solids (Academic, 1985).
1. Introduction
Optical trapping forces discovered by Ashkin in the 1970s [1, 2] have raised great interest in
the last 15 years [3–5]. They have allowed providing revolutionary techniques as optical
tweezers [6, 7], laser cooling [3, 8], as well as new tools for hot field areas like Bose-Einstein
condensation [9, 10]. Optical tweezers allow controlling small objects such as colloids [5–7]
and even atoms [3, 8]. It is agreed the optical response of matter is dominated mainly by the
electrical component, rather than the magnetic component [11, 12]. However, with the
discovery of metamaterials [13–15], both magnetic and electric component of the
electromagnetic (EM) field play a pivotal role. The development of metamaterials with strong
magnetism at optical frequencies involves complex designs [16–18] as well as sophisticated
fabrication techniques [19, 20]. Even direct evidence of the resulting magnetic field has been
reported using an artificial metamaterial building block fabricated on a probing tip [16–18].
#165997 - $15.00 USD
(C) 2012 OSA
Received 3 Apr 2012; revised 18 Jun 2012; accepted 29 Jun 2012; published 19 Sep 2012
24 September 2012 / Vol. 20, No. 20 / OPTICS EXPRESS 22617
Therefore, the magnetic field should also play a pivotal role for optical forces in
metamaterials [21, 22]. There are two main obstacles for studying optical forces on
metamaterials. Firstly, most metamaterials developed so far are substrate supported type
structures [23] and they are of difficult use for measuring photonic forces. Secondly, the
optical absorption of metallic metamaterials would induce strong thermophoretic forces [24]
thus hindering photonic force experiments.
In last few years, several groups have suggested that high refractive index dielectric
structures supporting well defined electric and magnetic modes can be a new type of
metamaterials [25–27]. From the theoretical side, several groups have shown high refractive
index particles are good metamaterial candidates. Nieto-Vesperinas et al. [28] have modeled a
large magnetic response of high refractive index spheres. From the fabrication side, Korgel et
al. [29], and Fenollosa et al. [30], have reported on the synthesis of silicon colloids with
spherical shape and very smooth surface. Very recently, Meseguer et al. [31], have shown
silicon colloids show well defined low order optical Mie resonance modes. Importantly,
because of both, the low absorption of silicon in the infrared (IR) region and the simplicity for
handling silicon colloids [32], they are ideal candidates for studying optical forces in
metamaterials. Several papers about electric and magnetic contributions to optical forces on
high refractive index particles have been reported [33–36].
Most papers concern that optical forces between particles and photonic waveguides [37,
38], optical resonators [39], and plasmonics structures [40] only consider the electric
component of light, the magnetic contribution being negligible. However, when high
refractive index particles enter into scene, the magnetic contribution should also carefully be
considered. In this paper, we systematically discuss the optical forces acting on a silicon
spherical nanocavity near a linear waveguide, in which the standing wave is generated by two
coherent counterpart guided light. The resonating modes of the silicon nanocavity are tuned to
the fundamental magnetic Mie modes. As the maxima for the electric and magnetic field of
the standing wave are located at different spatial regions, the particle will be trapped in
different spatial regions of waveguide when the wavelength of guided light is changed. Two
independent methods, an analytical calculation and the FDTD simulation show that the silicon
sphere can be trapped in the high magnetic and low electric field region due to the strong
magnetic response of silicon sphere. This magnetic like trap effect is completely different
from the electric one that usually appears in optical lattice experiments [41]. Our findings may
open a new road to manipulate the small object using the magnetic field of light.
2. Analytic approach and numerical method to solve the interaction between silicon
sphere and photonic waveguide
2.1. Mie theory of a silicon spherical nanocavity
Firstly, we will consider a silicon sphere of radius r (215 nm in this paper), with a refractive
index value of 3.5. The scattering of light by silicon sphere can be well described by the Mie
theory [42]. The scattering cross section (σ) can be expressed as a function of the electric and
magnetic Mie coefficients an and bn as
σ=
6π
2
2
( an + bn ),
2
k0
(1)
where k0 is the wavevector of incident light. The electric (ߙe) and the magnetic (ߙm)
polarizabilities can be defined as,
P = α e E, M = α m H .
#165997 - $15.00 USD
(C) 2012 OSA
(2)
Received 3 Apr 2012; revised 18 Jun 2012; accepted 29 Jun 2012; published 19 Sep 2012
24 September 2012 / Vol. 20, No. 20 / OPTICS EXPRESS 22618
As we are restricted to wavelength values resonating with the lowest order modes, we only
take into account the contribution of the first electric and magnetic mode. Then, ߙe and ߙm can
be rewritten as [28],
α e = i(
6π
6π
)ε 0 a1 , α m = i ( 3 )b1 .
3
k0
k0
(3)
2.2. Optical force and optical potential on a single small silicon sphere in an arbitrary EM
field
The force acting on a particle embedded in an arbitrary EM field can be calculated from the
Maxwell stress tensor T [43] as,
* 1 * 1
1
1
F = ∫ T ⋅ ndS = ( ) Re( ∫ ε 0 ( E ⋅ n) E + ( B ⋅ n) B − ( ){ε 0 E 2 + [ ]B 2 }n),
S
S
µ0
µ0
2
2
(4)
where n is the normal direction of a closed surface surrounding the silicon sphere. For a very
small particle whose size is much smaller than the wavelength of incident light, the optical
force can be simplified as [33],
F = Fe + Fm + Fem .
(5)
The two first terms on the right side of the above equation come from the electric and
magnetic dipole components respectively, and the third one is the interaction between them.
The electric dipole component of the force can be expressed as [35]
2
e
e
Fe = (1 / 4) Re(α e )∇ E + (1 / 2)σ ext
Re((1 / c) S ) + cσ ext
∇ × Lspe .
(6)
The electric like component of the force in Eq. (6) has three terms. The first one is the
gradient force. The second one corresponds to the scattering force, where
e
σ ext
= (k0 / ε 0 ) Im(α e ) is the extinction cross section contribution from the electric dipole, c is
*
the speed of light, and S = E × H is the Poynting vector of incident light. Finally, the third
*
term is the electric spin force component [42], Lspe = ε 0 / (4iω )( E × E ) being the electric spin
density of the incident light [44].
In a similar manner, the magnetic dipole component of the force can be expressed as [35],
2
m
m
Re((1/ c) S ) + cσ ext
Fm = ( µ0 / 4) Re(α m )∇ H + (1/ 2)σ ext
∇ × Lspm ,
(7)
m
also with three components, where σ ext
= k0 Im(α m ) is the extinction cross section
*
contribution from the magnetic dipole and Lspm = µ0 / (4iω )( H × H ) is the magnetic spin
density of the incident light [35].
The magnetic contribution to the optical force is related to ߙm. For nanocavities with low
refractive index values, like silica or polystyrene, ߙm present very small values and, therefore,
the magnetic component of the photonic force is far less than the electric one. However, for a
silicon sphere with large magnetic response, the magnetic component should be considered
carefully. Furthermore, ߙm can take positive and negative values, and silicon nanocavity may
behave as a paramagnetic or diamagnetic metamaterial depending on the wavelength of the
light. Similar effect can also be observed in electric gradient force case [45]. Finally, the force
induced from the interaction between electric dipole and magnetic dipole can be written as
[35],
#165997 - $15.00 USD
(C) 2012 OSA
Received 3 Apr 2012; revised 18 Jun 2012; accepted 29 Jun 2012; published 19 Sep 2012
24 September 2012 / Vol. 20, No. 20 / OPTICS EXPRESS 22619
Fem = −[k04 / (12π )] µ0 / ε 0 Re( P × M * ).
(8)
The optical potential can be calculated by integrating the force of Eq. (6) over the space as,
U = − ∫ F ⋅ dr.
(9)
2.3. The evanescent field of standing waves in a photonic waveguide
The waveguide discussed in the paper is a rectangular silicon waveguide on a silica substrate,
which can easily be fabricated from a silicon on insulator (SOI) wafer. We consider the lowest
order guided mode, the polarization direction of the electric field parallel and the magnetic
field perpendicular to the substrate surface, respectively (see Fig. 1). In order to obtain a
standing wave pattern, two coherent monochromatic beams are coupled at both sides of the
waveguide. It is well known, in the standing wave the peaks and nodes of the electric and
magnetic fields are shifted each other, the electric field maxima corresponds to minima of the
magnetic field component and vice versa. In this paper a small silicon sphere located near the
top surface of waveguide can feel the evanescent fields of the standing wave.
Analytic method is very complicated to describe well the optical modes of a dielectric
rectangular waveguide. Therefore, in the analytic approach, for simplified the problem, a slab
waveguide is assumed. This approximation is acceptable because we only consider the lowest
order guided mode. Later, by comparing to a full FDTD simulation, we will prove the analytic
approximation is a reasonable approximation as it keeps the most important points of photonic
force results.
Fig. 1. Schematic view of a spherical silicon nanocavity located above the top side of a silicon
waveguide (dark red). The gap between silicon nanocavity and waveguide is 20 nm. Two
counter-propagative guided light beams (yellow arrows) interfere themselves forming a
standing wave. The waveguide cross section and the field distribution of Ex in the waveguide is
shown in the inset of the Fig. 1. The diameter of the silicon sphere is 430 nm. The height and
the width of waveguide are 220 nm and 500 nm respectively. The lowest order guided mode is
used. The white dotted line is along the symmetry line of the top surface of waveguide in y
direction.
The evanescent field distribution of the electric component outside the waveguide along
the y direction (shown in Fig. 1) can be written as,
Ex = Ae − rz [ei β y + e − i β y ] = 2 Ae − rz cos( β y ),
(10)
where A is the amplitude of electric field, β = neff k0 is the propagation constant along the y
direction and r 2 = β 2 − k02 is the decay rate of field in the z direction, neff being the effective
refractive index of the waveguide for the guided light. From Eq. (10), the magnetic Hy and Hz
evanescent field distribution can easily be derived,
H y = 2i / (ωµ0 ) Are − rz cos( β y ),
#165997 - $15.00 USD
(C) 2012 OSA
(11)
Received 3 Apr 2012; revised 18 Jun 2012; accepted 29 Jun 2012; published 19 Sep 2012
24 September 2012 / Vol. 20, No. 20 / OPTICS EXPRESS 22620
H z = 2 β / (iωµ0 ) Ae − rz sin( β y ).
(12)
From the evanescent field expressions Eq. (10-12), the optical force along the y direction
acting on the silicon sphere can be written as,
Fe = − Re(α e ) β A2 e −2 rz sin(2β y ),
(13)
Fm = Re(α m ) β A2 e −2 rz sin(2β y )k02 / (ω 2 µ0 ),
Fem = [k03 / (6π )][Im(α m ) Re(α e ) − Im(α e ) Re(α m )][ A2 e −2 rz β sin(2β y )].
(14)
(15)
2.4. FDTD simulation of the force acting on the silicon sphere located near the top surface of
the photonic waveguide
To verify the analytical method described above, we also have calculated the photonic forces
through FDTD simulation (FDTD Solutions, Lumerical Corp.). The structure simulated is
shown in Fig. 1. The refractive index of both, the silicon sphere and the silicon waveguide, is
assumed as a constant value of 3.5. The radius of silicon sphere is 215 nm. The width and
height of silicon rectangular waveguide is 500 nm and 220 nm respectively. The optical force
is modeled by the integrating Maxwell stress tensor [21, 46]. We consider there is a 20 nm
gap between the silicon sphere and the waveguide. The laser intensity in the waveguide is 9
mW. The Ex field distribution of the guided light shown in Fig. 1, corresponds to the lowest
order mode of the waveguide. The scattering cross section has been calculated by integrating
of all the light scattered by a single silicon sphere when a plane wave impinges on it. For
comparison purposes, we also have calculated for polystyrene (PS) sphere (refractive index
1.6) with the same diameter value.
3. Results and discussion
Figure 2 shows the scattering efficiency values and their wavelength dependence for a silicon
and a PS nanospheres with the same size. The analytic method, as well as the FDTD
simulation gives very similar results. Due to the small refractive index values of PS, the
scattering efficiency shows small values without resonance features. On the contrary, silicon
nanocavity presents three clear resonances with huge values of the scattering cross section. At
certain wavelength values (for instance at 1570 nm), the scattering cross section of silicon
nanocavity are 10 times bigger than the projected surface value of the particle. Also, resonant
wavelength value is around 4 times larger than the diameter of sphere. It indicates silicon
nanocavities can be a good metamaterial candidate, as we later will show. In order to
understand the origin of the three resonance peaks, we have plotted separately the electric
(blue line) and magnetic (red line) contribution to the scattering efficiency. It is clear that the
peak at 1570 nm corresponds to the magnetic dipole mode and the peak at 1200 nm
corresponds to electric dipole mode. Also, in a broad wavelength range (from 1447 nm to
1721 nm in this paper), the scattering cross section is dominated by the magnetic dipole
resonance. The strong scattering peak around 1100 nm is induced by the magnetic quadrupole
mode [36].
#165997 - $15.00 USD
(C) 2012 OSA
Received 3 Apr 2012; revised 18 Jun 2012; accepted 29 Jun 2012; published 19 Sep 2012
24 September 2012 / Vol. 20, No. 20 / OPTICS EXPRESS 22621
Fig. 2. (a) Light scattering efficiency of a single silicon spherical nanocavity, 430 nm large,
immersed in air as a function of the wavelength. The results of the Mie analytical method (solid
line) and the FDTD method (dash line) are shown. The black line corresponds to the total
scattering efficiency. The red and blue lines correspond to the magnetic and electric
contributions to the total scattering efficiency. (b) The same as (a) for the same size PS sphere.
(c) The magnetic (red) and electric (blue) polarizabilities as a function of wavelength of light.
The solid and dash lines correspond to the real and the imaginary parts of polarizabilities. (d)
The same as (c) but for a PS nanocavity.
In order to better understand the electric and the magnetic contribution to the scattering
cross section, Fig. 2(c) shows the magnetic and electric polarizabilities ߙm and ߙe calculated
from Eq. (3). Both ߙm and ߙe dramatically change as a function of wavelength. The negative
value of ߙm means that the induced oscillating magnetic dipole has a ߨ phase shift with
respect the magnetic field component of the incident light. Then, the silicon nanoparticle
looks like a diamagnetic material in this region. The positive value of ߙm means that the
induced magnetic dipole is in-phase with the incident light and the silicon sphere looks like a
paramagnetic material. The behavior of ߙm as a function of wavelength shows a strong
Lorentz-shaped resonance [47]. These results have close similarities to those reported for
metamaterials, this leading to infer silicon nanosphere may be an excellent dielectric, light
absorption free, metamaterial in infrared region [48].
#165997 - $15.00 USD
(C) 2012 OSA
Received 3 Apr 2012; revised 18 Jun 2012; accepted 29 Jun 2012; published 19 Sep 2012
24 September 2012 / Vol. 20, No. 20 / OPTICS EXPRESS 22622
Fig. 3. The upper panel shows the analytical results of the evanescent electric (blue line) and
magnetic (red line) fields along the y direction. The middle panel shows the optical force on a
silicon 430 nm large nanocavity located above the top surface of the planar waveguide. The
gap between the nanocavity and the waveguide is 20 nm. The black line corresponds to the
total optical force acting on the silicon sphere, and the red, blue and yellow dashed lines
correspond to the magnetic, electric, and the interaction between the electric and the magnetic
dipoles optical forces appearing in the expression shown in Eq. (5). The lower panel shows the
optical potential along the y direction. Left and right panels correspond to light wavelength
values of 1.6 ߤm (a), and 1.5 ߤm (b), respectively.
Before calculating the optical force with the analytic model, we need determining the
evanescent electric and the magnetic field components of the standing wave along the y
direction. Figure 3(a), 3(b) shows the evanescent fields distribution with the wavelength value
of 1.6 ߤm (a) and 1.5 ߤm (b) on the top surface of the photonic waveguide (as the white dot
line shown in Fig. 1) calculated from Eqs. (10)–(12). Maxima of the magnetic field
component correspond to minima of the electric field component and vice versa. The middle
panels of Figs. 3(a), 3(b) show the optical force obtained from Eqs. (13)–(15). The electric,
magnetic and electric-magnetic interaction components of the optical force are shown with
blue, red, and orange dashed lines respectively. The center of the silicon sphere is located 235
nm above the top of the waveguide (i.e: the gap between the sphere and the waveguide is 20
nm), where the local guided light intensity along y direction is assumed to be 1.38 mW/ߤm2
(equivalent to the intensity at the same place above the waveguide in FDTD simulation for 1.6
ߤm wavelength guided light). In the case of low refractive index nanocavities (PS case), the
magnitude of all three components are much smaller and only the electric force component
dominates over the other two components (see Eqs. (13)–(15)) and Fig. 2(d)). In the case of
high refractive index nanocavities, for wavelength values at the magnetic resonance (λ = 1.6
ߤm), silicon nanospheres are trapped at the points of the waveguide where magnetic field
show maxima, which are different from the locations with maxima electric field. On the
contrary, when the wavelength value is shifted to 1.5 ߤm, silicon nanocavities are trapped at
different waveguide positions which correspond to the electric field maxima. Based on
Eqs. (14), (15), the anomalous magnetic trap effect is originated from the positive magnetic
dipole polarizabilities ߙm. Around λ = 1.6 ߤm (see Fig. 2(c)) the real part of ߙm has a
significant positive value. In this case the silicon sphere looks like a paramagnetic material in
which the magnetic dipole orientated parallel to the magnetic field direction of the guided
light. Therefore, the particle is trapped at the waveguide locations where the magnetic field
show maxima values. On the contrary, at wavelength values of 1.5 ߤm, the real part of ߙm
changes to large negative values and the nanocavity looks like a diamagnetic material in
#165997 - $15.00 USD
(C) 2012 OSA
Received 3 Apr 2012; revised 18 Jun 2012; accepted 29 Jun 2012; published 19 Sep 2012
24 September 2012 / Vol. 20, No. 20 / OPTICS EXPRESS 22623
which the magnetic dipole oriented antiparallel to the magnetic field direction of the guided
light. Therefore, the particle is pushed out the magnetic field maxima and is addressed to the
waveguide locations with maxima values of the electric field. Both cases can be clearly seen
by calculating the optical potential (Eq. (9)) of the silicon sphere at the top surface of photonic
waveguide along y direction (see bottom panel of Fig. 3(a), 3(b)). It can clearly be seen that
the lowest optical potential corresponds to the highest magnetic field for λ = 1.6 ߤm, while the
lowest optical potential corresponds to the highest electric field position in the case of λ =
1.5 ߤm.
Fig. 4. The upper panel of (a, b) shows the FDTD results of the evanescent electric (blue line)
and magnetic (red line) fields along the y direction above the top surface of the waveguide. The
bottom panel of (a, b) shows the optical force (black line) and the optical potential (purple line)
acting on the silicon sphere 430 nm large separated 20 nm from the top surface of the
waveguide in y direction (see white dashed line shown in Fig. 1). The wavelength of guided
light is 1.6 ߤm (a), and 1.5 ߤm (b). The electric (c), and the magnetic (d) fields distributions on
the equatorial xy plane of the nanocavity are shown. The field plot at (e) shows the magnetic
field distribution in the xz plane cross section of the system. In all (c), (d) and (e) field plot
cases, the nanocavity is located at the high magnetic field region along y direction, the
wavelength of guided light being 1.6 ߤm.
Figure 4 shows the FDTD results of a silicon nanocavity located above a rectangular
shaped dielectric waveguide. In order to better understand the photonic forces, we plot the
field distributions along the symmetry line in the y direction (white dashed line in the Fig. 1).
The left and right hand panels correspond to wavelength values of λ = 1.6 ߤm and λ = 1.5 ߤm
respectively. The bottom panel of Fig. 4(a), 4(b), shows the optical forces (black line) and the
optical potential (purple line) of the silicon nanocavity separated 20 nm from the symmetry
line at the top surface of waveguide along y direction. For λ = 1.6 ߤm (left panel), guided light
traps the sphere at the high magnetic field region. On the contrary, for a wavelength value of λ
= 1.5 ߤm (right panel), guided light traps the sphere at the high electric region. FDTD
simulation on a realistic rectangular dielectric waveguide is qualitatively consistent to those
#165997 - $15.00 USD
(C) 2012 OSA
Received 3 Apr 2012; revised 18 Jun 2012; accepted 29 Jun 2012; published 19 Sep 2012
24 September 2012 / Vol. 20, No. 20 / OPTICS EXPRESS 22624
obtained by using the analytic model in the planar waveguide case. With the help of the
FDTD simulation we have plotted in Fig. 4(c), 4(d) the fields distribution in the equatorial
plane of the silicon nanosphere at the magnetic resonance (λ = 1.6 ߤm). The field map plot
shows a typical pure magnetic dipole profile. Figure 4(e) shows the magnetic field distribution
of the cross section of the sphere and the waveguide.
Fig. 5. The upper panel shows the FDTD results of the evanescent electric (blue line) and the
magnetic (red line) field distribution at the highest magnetic field region along x direction. The
lower panel shows the optical force (black line) and the optical potential (purple line) on a
silicon sphere 430 nm large 20 nm above the top surface of waveguide along x direction. The
sphere is located at the high magnetic field region along y direction, and the wavelength of the
guided light is 1.6 ߤm.
Figure 5 shows FDTD results on the optical force on the nanocavity along x direction, at a
wavelength value of λ = 1.6 ߤm. Here, the sphere is located at high magnetic field region
along the y direction and it can freely move in x direction. In the upper panel of Fig. 5, the
evanescent electric (blue) and magnetic (red) field distribution at the top surface of waveguide
along x direction is shown. The magnetic field has a maximum at the waveguide center and it
decays to 0 at the waveguide side. On the contrary, the electric field is 0 at the center and has
a peak at both waveguide sides. These two peaks of electric field are caused by the boundary
conditions. The optical force and optical potential along x direction is shown in the bottom
panel of Fig. 5. The results show the particle is trapped at the center of waveguide.
Furthermore, the strong field gradient along the z direction would also trap the nanoparticle,
finally resulting in a full 3D optical trap for silicon nanocavity. Here it is worth considering
other competing forces as van der Waals (vdW) forces that would much stronger than
photonic forces when the particles are immersed in air. However we have not considered
them, since this result may be extrapolated to the case where both the waveguide and the
silicon particle are immersed in a liquid medium. In this case vdW forces could be much
smaller than the photonic forces at reasonable realistic light intensity values [36].
#165997 - $15.00 USD
(C) 2012 OSA
Received 3 Apr 2012; revised 18 Jun 2012; accepted 29 Jun 2012; published 19 Sep 2012
24 September 2012 / Vol. 20, No. 20 / OPTICS EXPRESS 22625
Fig. 6. The potential difference between the high magnetic field region and high electric field
region at the waveguide as a function of wavelength for both the analytical model (blue line)
and FDTD simulation (red line). For comparison purposes, we have also plotted the PS sphere
as a blue dash line. The diameter of silicon and PS spheres are 430 nm, and the intensity of
guided light in waveguide is 0.9 mW.
Finally, in order to know the wavelength dependence of the electric and magnetic traps,
Fig. 6 shows the potential difference between the high magnetic field region and high electric
field region at the waveguide in KT units. The results from both, the analytic model (blue
curve), and the FDTD simulation (red curve) are shown. When the difference is positive, the
electric trap dominates over the magnetic one and the silicon sphere is pushed towards the
high electric field region. On the contrary, when the difference is negative, the silicon sphere
is trapped in the high magnetic field region. The two methods have qualitative agreement with
each other, while the FDTD approach gives stronger photonic trapping values. The difference
is manly resulted by two approximate assumptions used in the analytic method: one is
assuming the silicon sphere size to be far less than the wavelength of the guided light; the
other is using a thin film as the waveguide instead of a rectangular shape. From the values of
Fig. 6 the photonic trapping effect show quite realistic values since at moderate laser intensity
values (as low as 0.9 mW), the magnetic trap is about 30 times stronger (FDTD results) than
the thermal energy. However, weak photonic electric traps effects appear in the case of PS
nanocavities at all the wavelength values.
4. Conclusion
In this paper, we have reported on the interaction between a standing wave confined in a
waveguide and the fundamental modes of a silicon nanocavity. The spatial separation between
electric like and magnetic like standing waves allows us studying separately the electrical and
magnetic interaction between the sphere and the waveguide. Because of the strong magnetic
response of the silicon sphere, the magnetic component of the optical force acting on a silicon
nanocavity can be dominant over the electric component, pushing the sphere towards the
magnetic trap region of the optical waveguide. Therefore we show silicon nanosphere can be
used as a probe for mapping magnetic field distribution in photonic structures. These results
have important implications for optical tweezers and metamaterials research.
Acknowledgments
The authors acknowledge financial support from the following projects FIS2009-07812,
Consolider 2007-0046 Nanolight, and the PROMETEO/2010/043. L. Shi thanks the financial
support from the MICINN (Estancias de profesores e investigadores extranjeros en centros
españoles) fellowship program. The authors thank to Dr. E. Xifre-Perez for useful discussions.
#165997 - $15.00 USD
(C) 2012 OSA
Received 3 Apr 2012; revised 18 Jun 2012; accepted 29 Jun 2012; published 19 Sep 2012
24 September 2012 / Vol. 20, No. 20 / OPTICS EXPRESS 22626


© Copyright 2026