
A Look at Science, Technology, Engineering, and Math (STEM
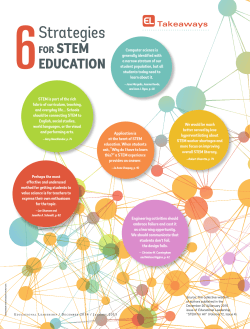
A Look at Science, Technology, Engineering, and Math (STEM) Talent in Michigan March 2015 Prepared by: State of Michigan Department of Technology, Management, and Budget Bureau of Labor Market Information and Strategic Initiatives About the Cover: In order to create the most unique section of this study, the quantitative content analysis of STEM job advertisements, the LMISI team read and coded over 900 job postings for STEM positions. The cover of this report contains the actual text from these job ads, with the most frequent of the 321,000 words appearing as the largest text on the page. While many of these words should be commonplace in job advertisements – words like “responsibilities” and “project” – some of the words shine through as important to STEM occupations and important to Michigan – words like “data,” “research,” “automotive,” and “Detroit.” To make this eye-catching data visualization, the text of STEM job ads was parsed and rendered by the ‘TM’ and ‘WordCloud’ packages of the R program for statistical computing. A Look at Science, Technology, Engineering, and Math (STEM) Talent in Michigan March 2015 Dear Colleagues: As Michigan’s economy and labor market continue to show signs of recovery, we find ourselves looking at a great need for a skilled workforce. The loss of jobs, citizens, and skills, on top of an aging population, tells us that we need to understand the pipeline of talent now and in the upcoming years. “A Look at Science, Technology, Engineering, and Math (STEM) Talent in Michigan” brings attention to a topic we have talked about for years, yet still find ourselves lacking. The number of graduates needed to fill the many opportunities currently available in the State has a shortfall. Once again the need to highlight what STEM is and the career pathways into these opportunities has to be a focus for our talent system. For me, the place to start is understanding the landscape with which we have to work and making sure we are putting strategies and activities in place that will build the skills base we need and that will educate Michiganders about the opportunities we have to offer our future workers. This report provides a much-needed data on STEM and the Michigan labor market. The information in this report should be used by workforce developers, educators, parents, and students, to learn more about current and future demand, helping to drive educated decisions and drive Michigan’s future. I hope you find this information and data useful. I want to thank DTMB, Bureau of Labor Market Information and Strategic Initiatives for their work on this report that will assist us in planning and strategizing. Respectfully, Christine Quinn, Director Workforce Development Agency DTMB, Bureau of Labor Market Information and Strategic Initiatives A Look at Science, Technology, Engineering, and Math (STEM) Talent in Michigan State of Michigan Department of Technology, Management & Budget Bureau of Labor Market Information and Strategic Initiatives Jason S. Palmer Director James Astalos Economic Manager By: Kevin Doyle, Economic Analyst Luke Bunge, Economic Analyst Myles Fowler-Quick, Research Assistant Acknowledgements: This report was made possible through support from the State of Michigan Workforce Development Agency (WDA). The authors would like to thank Ryan Gimarc and Abbey Babb, formerly of the Bureau of Labor Market Information and Strategic Initiatives, for their assistance in reading and coding hundreds of job ads. We would also like to thank the staff of our Bureau for the many helpful comments on drafts of this report, especially Bruce Weaver, Wayne Rourke, and Aneesa Rashid. A Look at Science, Technology, Engineering, and Math (STEM) Talent in Michigan Table of Contents Highlights ................................................................................................................................................................ 1 Introduction ............................................................................................................................................................ 2 Methodology........................................................................................................................................................... 2 Employment and Earnings ...................................................................................................................................... 4 Program Completers ............................................................................................................................................... 7 Occupational Demand Projections ......................................................................................................................... 8 Real-Time Demand.................................................................................................................................................. 9 Content Analysis ................................................................................................................................................... 10 Overview & General Findings ............................................................................................................................ 10 Long Running Ads .............................................................................................................................................. 11 Education........................................................................................................................................................... 11 Specific Findings ................................................................................................................................................ 12 Conclusion ............................................................................................................................................................. 14 Table of Figures Box 1: Science, Technology, Engineering, and Math (STEM) Overview ................................................................ 1 Box 2: STEM Employment, 2010-2013 ................................................................................................................... 2 Box 3: STEM Employment Concentration, 2013 .................................................................................................... 3 Box 4: Men, Women, and STEM Education and Employment .............................................................................. 4 Box 5: Overview of Healthcare in STEM ................................................................................................................ 5 Box 6: Completers in STEM programs ................................................................................................................... 6 Box 7: Most Completed Programs in STEM ............................................................................................................ 7 Box 8: Soft Skills ...................................................................................................................................................... 8 Box 9: Advertised Salary and Occupational Wages ............................................................................................... 9 Box 10: Highly-Demanded Hard Skills ................................................................................................................... 10 Box 11: Highly-Demanded Software Knowledge .................................................................................................. 11 Box 12: Next Steps ................................................................................................................................................ 12 DTMB, Bureau of Labor Market Information and Strategic Initiatives A Look at Science, Technology, Engineering, and Math (STEM) Talent in Michigan Box 1: Science, Technology, Engineering, and Math (STEM) Overview Highlights In 2013, occupational employment in Michigan totaled 3,979,600 with jobs in STEM occupations measuring 286,200 or 7.2 percent of total employment. Total 3,979,600 Since 2010, gains in STEM employment (+12.8 percent) STEM 286,200 have outpaced the 2.1 percent growth seen in in overall STEM Share of Total, % occupational employment. Occupational Employment (2013) 7.2 Growth, 2010-2013 Short-term occupational projections estimate that % Growth, Total 2.1 % Growth, STEM 12.8 STEM occupations in Michigan will expand by 4.3 percent through 2015 compared to 2.1 percent for all Occupational Outlook (2013-2015) occupations. Over the long term, STEM job opportunities are % Change, Total 2.1 expected to grow by 11.8 percent through 2020, % Change, STEM 4.3 compared to 8.5 percent for all occupations. Occupational Outlook (2010-2020) Regarding the potential labor supply, Michigan recorded 25,170 completers in STEM degree programs. % Change, Total 8.5 % Change, STEM 11.8 This represents 16.7 percent of all degree completers, slightly higher than the national share of 14.2 percent. Program Completers (2013) Among the STEM programs with the most completers Program Completers, Total 150,700 were General Biology / Biological Sciences, Mechanical Program Completers, STEM 25,170 Engineering, and Electrical and Electronics Engineering. STEM Share of Total, % 16.7 The top three STEM occupations in terms of total % Change (Year), Total -1.0 % Change (Year), STEM -0.1 employment in the state are Mechanical engineers (32,640), Industrial engineers (24,430), and Computer Real-Time Online Advertised Job Ads, January 2015 user support specialists (19,630). Online Vacancies, Total 141,100 Online data series, there were 28,000 ads for STEM Online Vacancies, STEM 28,000 occupations in January 2015, representing 19.8 percent STEM Share of Total, % 19.8 of all job advertisements. Over 1 in 4 of all advertised % Change (Year), Total -3.2 % Change (Year), STEM 20.5 According to the Conference Board’s Help Wanted STEM occupations were for Industrial or Mechanical engineers, reflecting the rebound in Manufacturing and related industries. 1 DTMB, Bureau of Labor Market Information and Strategic Initiatives A Look at Science, Technology, Engineering, and Math (STEM) Talent in Michigan Introduction By 2020, 4 in 10 new employment opportunities in the state will require some education beyond high school. This statistic has been a major factor in generating much research around so-called middle-skill jobs, as well as jobs that require advanced education, including bachelor’s, master’s, and even doctoral and professional degrees. In a labor market where not all degrees lead to similar employment outcomes, more and more attention has been devoted to identifying which job titles are and will be in demand by employers. This analysis places significant emphasis on science, technology, engineering, and mathematics (STEM) occupations. In fact, by 2020, approximately 1 in 5 new job opportunities in the state requiring education beyond high school will be in STEM job titles. As such, this study takes a close look at STEM opportunities in Michigan drawing on existing labor market information and a content analysis of 900 online advertised postings for STEM job titles. Methodology The first part of this report relies on traditional information on employment, wage, and occupational projections data from the Bureau of Labor Market Information and Strategic Initiatives, data on degrees completed from the National Center for Education Statistics (NCES), and real-time labor market information from the Conference Board Help Wanted Online® (HWOL) data series. The second part of this study contains findings from a content analysis of a combined 900 online advertised job vacancies. Traditional Labor Market Information – This report uses existing labor market information to highlight the current state of occupational employment and earnings in the 120 detailed STEM job titles (as defined by the Standard Occupational Classification Policy Committee), compared with trends for all of Michigan’s detailed occupations. In addition, both short-term and long-term occupational projections are used to analyze the demand for STEM occupations in the near future (2015) and the not-too-distant future (2020). Information on Degree Completers – This report uses information from the NCES on completers, particularly in the 420 programs defined as STEM by the U.S. Immigration and Customs Enforcement (ICE) to understand the dynamics in the potential labor supply. Real-Time Labor Market Information – This report uses real-time online advertised job vacancy data from the HWOL data series. Real-time labor market information is an important supplement to traditional labor market data used to show the total number of job advertisements currently posted through online job boards. The Conference Board sources its HWOL data from over 16,000 online job sites both large and small, including Michigan’s Talent Connect. This data seeks to measure current demand in the state’s labor market. Content Analysis of Real-Time Demand for STEM Employment – Perhaps the most unique findings in this report come from a quantitative content analysis of a sample of 600 STEM job advertisements and an additional sample of 300 long-running (ads posted for 90 or more days) STEM vacancies. Ads were coded for soft skills, hard skills, DTMB, Bureau of Labor Market Information and Strategic Initiatives 2 A Look at Science, Technology, Engineering, and Math (STEM) Talent in Michigan software, education, certifications, salary, benefits, and experience. Ads were also coded for their part-time/fulltime/temporary status and were flagged if an ad was recruiting for more than one position. Through the statistical methods used in this analysis, estimates for the frequency of terms in the total population of STEM job ads can be made from this relatively small sample. Traditional Labor Market Information Content Analysis of Real-Time Demand A Look at Science, Technology, Engerineering, and Math (STEM) Talent in Michigan Information on Degree Completers Real-Time Labor Market Information To ensure comparability with other reports on the subject, this study uses existing definitions of Science, Technology, Engineering, and Math for its analysis of occupations and degree programs. STEM Occupations – In 2012, the Standard Occupational Classification Policy Committee (SOCPC), on the request from the Office of Management and Budget (OMB), identified a list of occupations considered to fall within the STEM category. (Although the definition used in this report is based on the 2012 SOPC definition, most Healthcare occupations have been excluded from this report’s main analysis. However, information on STEM Healthcare occupations can be found in Box 5.) This study uses these occupations to define STEM. This definition can be found on the Bureau of Labor Statistics’ website at www.bls.gov/soc/#crosswalks. STEM Degree Completers – The U.S. Immigration and Customs Enforcement (ICE) agency of the Department of Homeland Security defines STEM designated-degree programs to identify qualified graduates on student visas for an optional practical training (OPT) extension in an effort to retain international talent. This study uses these degree programs to define STEM programs. 3 DTMB, Bureau of Labor Market Information and Strategic Initiatives A Look at Science, Technology, Engineering, and Math (STEM) Talent in Michigan Employment and Earnings This section uses information from the Occupational Employment Statistics (OES) program to highlight the current state of occupational employment and earnings across Michigan’s over 800 detailed occupations, including the 120 detailed STEM job titles defined by the SOCPC. In 2013, occupational employment in Michigan totaled 3,979,600 with employment in STEM occupations measuring 286,200 or 7.2 percent of the total. (Box 2) From 2010 to 2013, employment in STEM occupations grew by 12.8 percent, outpacing the all-occupational growth of 2.1 percent. Nationally, STEM employment has grown by 7.4 percent over the same period, 5.4 percentage points lower than in Michigan. A large source of Michigan STEM employment is derived from the state’s Manufacturing industry. While the industry was heavily impacted by the 2008 recession, it was also one of the strongest rebounding industries, evidenced by the strong growth in STEM employment over this period. Among all states, Michigan ranks 10th in total STEM occupational employment, but ranks 7th in terms of STEM employment concentration, or the number employed in STEM jobs as a share of total employment. Michigan can partially attribute its high concentration in STEM employment to the large number of STEM jobs in Manufacturing. (Box 3) Among individual occupations, the top three Michigan STEM occupations in terms of total employment are Mechanical engineers (32,640), Industrial engineers (24,430), and Computer user support specialists (19,630). Together, these three occupations are responsible for over a quarter of all STEM employment in the state. Box 2: STEM Employment, 2010-2013 Total STEM Jobs (Left) Percent STEM Jobs (Right) 300,000 200,000 6.8% 6.9% Box 3: STEM Employment Concentration, 2013 7.1% Total STEM Jobs (Left) Percent of STEM Jobs (Right) 8.0% 1,200,000 12.0% 7.0% 800,000 7.2% 8.0% 400,000 286,240 4.0% 7.2% 100,000 6.0% 0 5.0% 0 2010 2011 2012 0.0% 2013 Source: DTMB, Bureau of Labor Market Information and Strategic Initiatives Source: DTMB, Bureau of Labor Market Information and Strategic Initiatives DTMB, Bureau of Labor Market Information and Strategic Initiatives 4 A Look at Science, Technology, Engineering, and Math (STEM) Talent in Michigan Men account for a disproportionate share of those employed in STEM jobs, and those enrolled in STEM training programs. However, there are a few STEM Box 4: Men, Women, and STEM Education and Employment Nationally, over three quarters (76.0 percent) of STEM employment goes to men, and unpublished data from the occupations and programs where majorities are held by Current Population Survey (CPS) confirms that Michigan is on women. (Box 4) par with these trends. Nevertheless, there are several STEM STEM job-holders earn more on average than other job titles that boast a significant number of women. Michigan workers. In 2013, the average wage among all Women-Dominated STEM Occupations occupations in Michigan was $21.40 per hour, Occupation Employment % Women U.S. U.S. compared to $34.40 per hour for STEM occupations. This results in a $13.00 per hour wage premium for a Psychologists STEM occupation. From 2010 through 2013, the average hourly pay for STEM occupations in Michigan has remained essentially flat. In contrast, the average hourly wage for all 137,270 73.8 Medical scientists 75,460 52.4 Operations research analysts 66,560 52.0 Biological Scientists 59,020 52.7 Miscellaneous social scientists and 30,040 52.7 related workers occupations in Michigan has ticked higher over the same time, lowering the STEM hourly wage premium from $13.90 in 2010 to its current level of $13.00. Those employed in STEM occupations in Michigan earn $1.33 per hour less than their national counterparts. Likewise, education programs preparing their students for careers in STEM jobs are also male-dominated. In the latest academic year, over two thirds (67.1 percent) of STEM program completers were men. (This is in stark contrast to Among the top ten states in terms of percentage of the overall trend of women out earning men 6 to 4 in overall workforce employed in STEM occupations, Michigan degree programs). ranks last in average hourly wage for a STEM programs with many women graduates. occupation. Michigan and Arizona are the only two There are, however, several STEM Women-Dominated STEM Programs states in this group in which STEM occupations, on Program average, earn less than the national average. Among larger STEM occupations, the highest paying job Biology/Biological Sciences titles include Architectural and engineering managers ($56.45), Computer and information systems managers ($51.21), and Software developers, systems software Completers % Women Michigan Michigan 1,270 56.3 Experimental Psychology 470 76.7 Neuroscience 170 56.5 Psychobiology 160 56.5 Zoology 120 74.7 ($43.02). A handful of smaller, emerging STEM occupations pay signficant wages, including Engineering Managers ($56.45) and Medical scientists, except epidemiologists ($47.45). 5 Source: National Center of Education Statistics (NCES) / DTMB, Bureau of Labor Market Information and Strategic Initiatives DTMB, Bureau of Labor Market Information and Strategic Initiatives A Look at Science, Technology, Engineering, and Math (STEM) Talent in Michigan Box 5: Overview of Healthcare in STEM While the SOPC definition of STEM occupations includes a Healthcare category, there is no wide-spread consensus on whether or not Healthcare occupations should be included in the definition of STEM. Since the size of employment in STEM Healthcare occupations is approximately equal to employment in all other STEM job categories, including STEM Healthcare occupations has a large influence on overall trends. In an effort to more thoroughly analyze skills unique to non-Healthcare STEM occupations, this study has excluded STEM Healthcare occupations from its definition of STEM occupations. However, rather than to exclude this category of occupations completely, this box will provide key labor market information on the STEM Healthcare in Michigan. In 2013, Michigan’s employment in STEM Healthcare occupations totaled 281,650, comprising 7.1 percent of the total Michigan employment. Those employed in STEM Healthcare occupations earned a weighted average of $34.05 an hour. These occupations have fared well in the past three years, growing 8.1 percent from 2010 to 2013. STEM Healthcare occupations are also expected to Michigan Employment in STEM Healthcare Occupations Total Health Care Jobs (Left) expand in the near future. Between the 3rd Quarter of Percent Health Care Jobs (Right) 350,000 8.0% 262,500 6.8% 7.0% STEM Healthcare occupations in Michigan is expected to grow by 1.3 percent. However, this is slightly lower than 7.1% 7.0% 6.5% 2013 and the 3rd Quarter of 2015, the overall number of the expected 2.1 percent growth for total occupational employment. 175,000 6.0% 87,500 While the short-term growth prospects in STEM Healthcare occupations are relatively modest, the long- - 5.0% 2010 2011 2012 2013 term outlook is much more favorable. By 2020, there are expected to be 14.7 percent more jobs in the Healthcare industry than 2010, for an annualized rate of 1.5 percent. During the 2013 academic year, Michigan conferred more than 30,000 Healthcare degrees, well over the 25,170 STEM degrees awarded the Employment and Average Hourly Wages for Key same year. However, Healthcare degrees awarded have fallen over the STEM Healthcare Occupations last four academic years, contributing a faster growth rate for STEM Registered Nurses degrees awarded than those in the Healthcare category over the same period. 91,840 Employed Pharmacy Technicians 12,360 Employed Michigan’s top five Healthcare degrees awarded combined to over 45 percent of all degrees conferred in the category. Registered Nursing degrees led all other Healthcare related degrees totaling 5,800 completions, 1,600 more than the next leading conferred degree in Healthcare, Medical/Clinical Assistant. $31.64 / hour $13.67 / hour Medical and Health Services Managers 11,770 Employed $45.52 / hour Physicians and Surgeons, All Other 11,260 Employed $79.48 / hour Physical Therapists 7,830 Employed $38.86 / hour Source: DTMB, Bureau of Labor Market Information & Strategic Initiatives DTMB, Bureau of Labor Market Information and Strategic Initiatives 6 A Look at Science, Technology, Engineering, and Math (STEM) Talent in Michigan Program Completers This section uses information from the National Center for Education Statistics (NCES) to analyze recent graduates from the state’s STEM programs. This information provides critical information regarding the potential labor supply, including those completing one of the nearly 420 programs identified by the Department of Homeland Security (DHS) on the STEMDesignated Degree Program List. During the 2013 academic year, training providers in Michigan awarded STEM degrees to 25,170 program completers, representing 16.7 percent of all degree completions. This is above the national rate of 14.2 percent, continuing a decade-long trend of the state outpacing the nation in share of STEM degrees awarded. Both Michigan’s 2013 totals for STEM completions and the share of total degrees awarded were the second-highest totals recorded over the last 8 academic years. (Box 6) Michigan remains a national leader in both the number of completions in STEM programs (8th) and in the share of total completions that are in STEM programs (9th). Michigan’s top three most conferred STEM degrees were General biology/biological sciences (2,250), Mechanical engineering (1,530), and Electrical and electronics engineering (1,140), combining for nearly 1 in 5 of all STEM degrees awarded in the 2013 academic year. (Box 7) A potential sign of talent diversification, the top five STEM degrees conferred have gradually declined in total share, dropping almost 3 percentage points over the last 5 academic years. Over the same period, Digital communication and media/multimedia (+386), Network and system administration (+150), Systems engineering (+124), and Materials engineering (+105) have emerged as some of the fastest growing in STEM degrees awarded. Box 6: Completers in STEM Programs MI STEM Box 7: Most Completed Programs in STEM %Share General Biology / Biological Sciences 30,000 20% 25,000 18% 20,000 16% 15,000 10,000 5,000 - 2,250 Completers Mechanical Engineering 1,530 Completers 12% 6% of STEM Electrical and Electronics Engineering 1,140 Completers 14% 9% of STEM 5% of STEM Computer Systems Networking and Telecomm. 820 Completers 3% of STEM General Mathematics 10% 780 Completers 3% of STEM General Computer and Information Sciences 720 Completers Source: National Center of Education Statistics (NCES) / DTMB, Bureau of Labor Market Information and Strategic Initiatives 7 3% of STEM Source: National Center of Education Statistics (NCES) / DTMB, Bureau of Labor Market Information and Strategic Initiatives DTMB, Bureau of Labor Market Information and Strategic Initiatives A Look at Science, Technology, Engineering, and Math (STEM) Talent in Michigan Occupational Demand Projections This section uses data from the Employment Projections program to analyze the job prospects for the growing number of those completing STEM programs. Both short-term and long-term occupational forecasts are used to analyze the anticipated demand in STEM and other job titles. Long-term forecasts are best used for identifying ongoing career trends, while the short-term projections are designed to capture likely job change in the current point of the business cycle. According to short-term forecasts (from the 3rd Quarter of 2013 to the 3rd Quarter of 2015), total employment in STEM occupations in Michigan is expected to expand to 313,900, a growth of 4.3 percent. In comparison, all occupations in Michigan are expected to grow by 2.1 percent over the same time period. Over the same time frame, there are expected to be 12,600 job openings in STEM occupations, with nearly half of openings coming from growth and the other half due to replacement of retiring workers or employees changing occupations. For all job titles in Michigan, it is expected that annual openings due to growth will account for just 1 in 3 openings. Through 2015, the STEM occupations adding the most jobs in Michigan will be Mechanical engineers (+1,880), Industrial engineers (+1,390), and Software developers-applications (+920). In terms of percent growth, the fastest growing STEM occupations will be Statisticians (10.4 percent), Mining and geological engineers (10.0 percent), and Biomedical engineers (9.0 percent). STEM employment will see sustained growth through 2020. According to long-term forecasts, the number of opportunities in STEM job titles are expected to grow by 11.8 percent from 2010 to 2020, outpacing job growth among all occupations, projected to grow at 8.5 percent. Each year from 2010 through 2020 there is expected to be an average of nearly 8,200 openings in STEM occupations with 34 percent of those openings due to growth. Among all occupations in Michigan, this figure is projected to be only 27 percent. By 2020 Biomedical engineers (54.0 percent growth), Software developers-systems software (36.9 percent), and Medical scientists (30.5 percent) are projected to be the three fastest growing STEM occupations. Numerically, the top three STEM occupations will be Mechanical engineers (+3,020 jobs), Computer systems analysts (+2,500 jobs) and Software developers-systems software (+2,420 jobs). New opportunities in STEM are projected to require a slightly different set of key skills and knowledge than other occupations. For example, reading comprehension, complex problem solving, and systems analysis skills are all more frequently included in the top five skills necessary for a STEM occupation than among all occupations. Similarly, top knowledge areas for STEM employment will include engineering and technology, mathematics, and computer and electronics. DTMB, Bureau of Labor Market Information and Strategic Initiatives 8 A Look at Science, Technology, Engineering, and Math (STEM) Talent in Michigan Box 8: Soft Skills Real-Time Demand This section uses real-time labor market information, an important supplement to traditional labor market data, to illustrate trends in job advertisements currently posted Soft skills are the mixture of habits, attitudes, and character traits that influence our interactions and relationships with other people. Soft skills are often emphasized as key skill traits by employers, making them vital for on-the-job through online job boards. This data seeks to measure success. Content analysis of online advertised job vacancies current demand in the state’s labor market. using The Conference Board’s Help Wanted Online® allowed for an in-depth investigation into which specific soft skill According to the Conference Board’s Help Wanted Online® data series, there were a total of 141,100 ads across all occupations in January 2015. Over the same openings. time period, there were 28,000 ads for STEM As expected, frequent mentions of soft skill requirements occupations, or nearly 20 percent of all job ads. emerged in the majority of job ads. Over 60 percent of job The most heavily advertised STEM occupations over ads list soft skills they require from applicants. After the data this time period were Industrial engineers (4,100 ads), Mechanical engineers (3,100), and Computer systems analysts (2,200). traits were most demanded by employers hiring for STEM was analyzed, a handful of recognizable soft skills emerged as the most requested by employers. Some of these leading soft skills were communication, teamwork, leadership, and independence. When utilized, skills like these can promote Demand for STEM occupations in Michigan is increased efficiency within the workplace as well as stronger dominated by auto manufacturers’ demand for team cohesion. Engineering occupations. Ford Motor Company posted the most STEM ads in January, followed by General Motors and Chrysler. Hard-to-fill job vacancies, or jobs that have been Frequency of Most Cited Soft Skills in Job Advertisements Team 535 posted for longer than 60, comprise 41 percent of all STEM job ads, slightly above the current all-occupation 504 Customer average of 37 percent. Communication Over the past year, the total number of job advertisements has decreased by 3.2 percent in Leadership Independent 393 164 128 Michigan. Over the same period of time, job ads for STEM occupations have grown, up 20.5 percent since 2014. Although the proportion of STEM job ads tumbled during the recent recession, the share has For example, requirements related to an applicant’s communication skills were discussed in 535 unique ads in the sample examined for this study. remained stable near 20 percent since 2011. Source: The Conference Board, Help Wanted Online / DTMB, Bureau of Labor Market Information and Strategic Initiatives 9 DTMB, Bureau of Labor Market Information and Strategic Initiatives A Look at Science, Technology, Engineering, and Math (STEM) Talent in Michigan Content Analysis This section presents the findings from a quantitative content analysis of STEM job advertisements. For this analysis, a sample of 600 STEM job advertisements and an additional 300 long-running STEM ads was pulled, read through, and analyzed. Ads were coded for soft skills, hard skills, software, education, certifications, salary, benefits, and experience. Ads were also coded for their part-time/full-time/temporary status and were flagged if an ad was recruiting for more than one position. The set of STEM job ads used in this study were retrieved in December 2013 and examined and coded for the next several months. The overall makeup of job advertisements has changed little over the 14 months from the time the STEM Content Analysis data was retrieved to the date of publishing this report. Therefore, some statistics may vary from the studied sample and the current population of job advertisements, but these findings are nonetheless valuable. By using these statistical methods to analyze STEM job advertisements, estimates for the frequency of terms in the total population of STEM job ads can be made. Overview & General Findings Unsurprisingly, the vast majority of STEM job ads (80 percent) list specific hard skills desired of job applicants, such as certain programming, engineering, or analytical skills. A hard skill, more generally, is a skill that can be quantified and measured, unlike a soft skill, which is often intangible. Trailing close behind were mentions of required education, listed in 67 percent of STEM ads. (Box 10) Requisite experience, either in the form of time in a related job or experience with a specific skill or tool, was an oftsighted sign of a well-written job advertisement. Just over 60 percent of advertised vacancies in STEM job titles listed some experience required of the applicant. Benefits that a potential employee would receive as part of their compensation was mentioned in 16 percent of STEM job advertisements. However, details given on benefit packages varied widely between job ads. While many mentioned specific benefits, such as 401(k) matching or health and dental insurance, other employers simply said they offered a “competitive” benefits package or “full benefits.” A somewhat surprising finding was the infrequency of salary or wage information. Only 15 percent of ads listed the pay rate for the job vacancy, including those that only listed wages as commensurate with experience. (Box 9) Very few employers indicated in job ads if they were hiring for more than one position; only 2 percent of STEM job ads indicated the employer is looking to fill multiple vacancies. Flexible work schedules or work locations were mentioned in only 1 percent of job advertisements. These schedules, such as flex time or compressed work weeks, are important to many as a tool for balancing personal and work responsibilities in an economy where family responsibilities often require both partners to be employed. DTMB, Bureau of Labor Market Information and Strategic Initiatives 10 A Look at Science, Technology, Engineering, and Math (STEM) Talent in Michigan Full-time/part-time status was indicated in 18 percent of STEM job advertisements. Within this set of ads, 63 Box 9: Advertised Salary and Occupational Wages Based on the results of a content analysis of 600 online percent listed a posting for a full-time employee, 6 advertised job vacancies for STEM job titles, only 15 percent percent were for a part-time position, and 34 percent of those advertisements gave information on wages. indicated hiring for a temporary position. Of these advertisements with information on wages, about Long Running Ads 40 percent mentioned wages in a non-monetary context, i.e. While most variables were relatively equal between the statements such as “salary commensurate with experience.” long-running ads and the sample from the universe of STEM Of the remaining 60 percent in which a numeric figure was given for wages, few (6 percent) were below a market rate, ads, there were some notable differences. Education requirements are listed more often in longrunning job ads. While education requirements were Occupational Employment Statistics (OES) data. running ads mentioned education requirements 77 compared to published OES data on wages for the ads’ respective occupation in Michigan. Although sample size is Salary information was provided less often in long- too small for meaningful statistical analysis, a roughly normal distribution of offered wages emerged. appeared in 15 percent of average STEM ads, it was Advertised Wages by Percentile in Michigan Occupational Employment only listed in 9 percent of long-running STEM ads. difference, regular (61 percent) and long-running STEM (67 percent) ads mentioned soft skills at a roughly equal rate when considering their margins of error. 50% 38.2% Percent of Total Required soft skills may be indicated more often in long-running job ads. While there appears to be a 23.5% 25% 20.6% 14.7% 2.9% 0% 10th 25th Education percentile wage in published The remaining job ads, which listed a numeric salary, were running advertised vacancies. While salary information th indicated in 67 percent of all STEM job ads, long- percent of the time. as defined by the 10 50th 75th 90th Wage Percentile 7 of 10 job ads sampled for this study listed education requirements. Of the ads with education requirements, The graph shows, for example, that 38.2 percent of ads in th this small subset offered a wage above the 25 and below 85 percent requested a bachelor’s degree. Nearly 12 the 50 percentile. This is an expected wage offering for a percent of ads required an associate’s degree or less, newly-hired employee. th while just 3 percent stated the vacant position required more than a bachelor’s degree. Source: DTMB, Bureau of Labor Market Information & Strategic Initiatives 11 DTMB, Bureau of Labor Market Information and Strategic Initiatives A Look at Science, Technology, Engineering, and Math (STEM) Talent in Michigan Three in four job ads that list education requirements for open STEM positions match the national requirement published by the Bureau of Labor Statistics (BLS) for the corresponding occupation. Nearly 14 percent of ads in the sample listed lower education requirements than the BLS, while about 11 percent listed higher education requirements than the published national requirements. Specific Findings The top 20 specific skills, software, and experience requirements were examined in the next step of the content analysis. An approach was used that would facilitate comparisons in requirements between the main stratified sample and the supplemental sample of long-running job advertisements. However, after evaluating margins of error for each of the terms, it was found that there were no statistically significant differences that existed between the two samples (i.e. differences in term frequency were always inside of the margins of error). Therefore, all specific skills mentioned in this section will cite only the statistics from the main sample of job advertisements. Communication, a key soft skill, is listed as a requirement in 54 percent of all job advertisements for STEM job ads. This is often listed as both internal communication (as with one’s team and other units within the business) and external communication (as with customers). This point further highlights the fact that even in occupations where science or engineering is the main function, soft skills are a top priority in many firms. (Box 8) Working in teams, another often-cited soft skill, appeared in nearly 6 in every 10 job ads (57 percent). These requirements were often listed as an ability to work within teams (in addition to the ability to work independently) or the ability to work closely with another team in another department within the company (e.g. asking that engineers can communicate with programmers or plant managers as well as they can with other engineers). Box 10: Highly-Demanded Hard Skills Box 11: Highly-Demanded Software Knowledge Management Microsoft Excel 63.3% of all ads 3.8% 36.0% of all ads 3.8% Design Microsoft Word 48.1% of all ads 4.0% 16.7% of all ads 3.0% Engineering Structured Query Language (SQL) 44.6% of all ads 4.0% 10.6% of all ads 2.5% Analytical Skills Oracle 35.9% of all ads 3.8% 6.4% of all ads 2.0% Manufacturing Experience Systems Applications Products (SAP) 28.1% of all ads 3.6% 5.1% of all ads 1.8% Source: The Conference Board, Help Wanted Online / DTMB, Bureau of Labor Market Information and Strategic Initiatives Source: The Conference Board, Help Wanted Online / DTMB, Bureau of Labor Market Information and Strategic Initiatives DTMB, Bureau of Labor Market Information and Strategic Initiatives 12 A Look at Science, Technology, Engineering, and Math (STEM) Talent in Michigan Customer service is an important part of STEM occupations, as it is with most professional positions. Past experience or future requirements in customer contact were listed in 4 in 10 job ads. Among all STEM occupations, there are certain IT-related keywords which quickly emerged as common. Skills in using SQL or in Oracle or SAP products were quick stand-outs in the data. Computer Aided Design (CAD), a common software program in engineering, is listed as a requirement in 3.8 percent of job ads. (Box 11) In addition to specialized software, the Microsoft Office suite that is ubiquitous in office environments was among the top-requested skills from job-seekers. Whether it was Microsoft Word, Access, Outlook, or lesser-known applications such as Microsoft Project, employers said some Microsoft Office program was desired knowledge in 48 percent of STEM job ads. (Box 11) Root cause analysis was a key skill mentioned in 6 percent of all STEM job advertisements. When viewing only engineering advertisements, that same figure jumps to 11.5 percent (however, the margin of error increases from 1.9 to 4.5 percent when examining such a small portion of the sample). In addition to typical education, about one in eight employers were on the lookout for candidates with additional qualifications in the form of certifications. Six Sigma certification was a popular request among employers, with 5.3 percent of all STEM job ads listing a Green Belt, Black Belt, or (more generally) Six Sigma training among required applicant traits. Box 12: Next Steps This report has used a combination of traditional and real-time labor market information sources to take a look at STEM in Michigan. One of the highlights of this report was a content analysis of 900 currently advertised online job postings to better understand the nature of employer demand for STEM vacancies. While this analysis provided interesting findings, it has also raised several areas for improvement: Sometimes job advertisements are not well written and may not convey the employer’s needs very well. Job ads may also ask for higher requirements than employers actually need or are willing to accept. This phenomenon could be examined more closely by talking to employers about their habits in writing job ads, potentially leading to training on writing ads. If it is determined that long-running STEM advertisements are a matter of particular concern, a full sample of longrunning ads could be analyzed rather than the smaller, supplemental sample. This may lead to more robust findings and help identify just why some ads are going unfilled. Postings for certain occupations may be placed into incorrect Standard Occupational Classification (SOC) codes by coding software. An investigation for this occurrence could lead to improved statistics from job ad data. Additional occupational categories could be sampled and compared to STEM occupations to identify ways in which employer demand is different among the categories. One area ripe for such study is middle skill jobs or skilled trades jobs. 13 DTMB, Bureau of Labor Market Information and Strategic Initiatives A Look at Science, Technology, Engineering, and Math (STEM) Talent in Michigan Conclusion STEM occupations are important drivers of the Michigan economy, contributing innovation, technological advancement, and valuable skills to our workforce. These occupations are expected to grow in the short term as well as the long term. Additionally, real-time demand for these occupations is growing at a higher rate than for all occupations. Those employed in STEM occupations are undoubtedly an important asset to Michigan’s economy and are key to its future success and growth. STEM employment in Michigan stood at 286,200 in 2013, up 12.8 percent from 2010. Michigan ranks 7th among all states in share of total STEM employment. Much of this employment comes from Architecture and engineering and Computer and mathematical occupations. During the 2013 academic year, there were 25,170 STEM degrees awarded in Michigan, a 16.7 percent share of all degrees awarded in the state. Michigan ranks 9th in STEM share of total degree completions. STEM occupations are projected to grow faster than average over the short term as well as the long term. From 3rd quarter 2013 through 3rd quarter 2015, employment in STEM occupations is expected to grow by 4.3 percent while total employment is projected to expand by 2.1 percent over the same period. From 2010 through 2020, Michigan STEM employment is expected to grow by 11.8 percent, outpacing the average growth rate of 8.5 percent. In January 2015, there were 28,000 job advertisements posted for STEM occupations, according to the Conference Board’s Help Wanted Online® data series. This means about one in every five job ads posted on the web are for STEM jobs, a share that has remained relatively stable over the past four years. A content analysis was conducted for 600 job advertisements, with an additional sample of 300 long-running job ads. Through this analysis, the importance of hard and soft skills in recruiting for open STEM vacancies was immediately apparent. However, some valuable information on STEM job vacancies, such as benefits and pay, was often not included in these ads. DTMB, Bureau of Labor Market Information and Strategic Initiatives 14 A Look at Science, Technology, Engineering, and Math (STEM) Talent in Michigan DTMB, Bureau of Labor Market Information and Strategic Initiatives A Look at Science, Technology, Engineering, and Math (STEM) Talent in Michigan What’s New from LMISI? This report is just one of many publications by the Bureau of Labor Market Information and Strategic Initiatives. Serving a diverse group of customers, our products range from workforce data to customized products and publications. Highlighted below are some of our more recent products. These and more can be found on our website at: www.michigan.gov/lmi. Economic Indicators and Insights, Winter 2015 This biannual report tracks Michigan labor market and economic trends on a series of indicators related to the workforce, knowledge-based jobs, innovation, education, and the economy. Written for an executive audience, this report provides a concise analysis of recent trends in these indicators as well as national and regional comparisons. 2014 Cluster Workforce Updates The 2014 Cluster Workforce Updates are intended to revise the key occupation tables found in the Cluster Workforce Analysis publications released in January 2013. With an emphasis on occupations, this report provides an analysis of important indicators, including employment, earnings, education and training requirements, and real-time and projected demand. Career Outlook 2020 Brochures Published for Michigan's 18 Economic Forecast Regions (EFRs), these Career Outlook Brochures use our long-term occupational forecasts to list the top 15 to 20 occupations in the region based on a variety of factors. The lists provided for each region are based on education, annual openings, and real-time demand using the data series from The Conference Board Help Wanted Online® (HWOL). West Michigan Talent Assessment and Outlook This innovative and visual presentation provides analysis and insight about the current state of the West Michigan labor market, and is the result of a collaboration between the Department of Technology, Management and Budget and Talent 2025 along with its network of West Michigan industry, education, and economic and workforce development leaders. DTMB, Bureau of Labor Market Information and Strategic Initiatives


© Copyright 2026