
Labor Market News - Michigan Labor Market Information, Mi Fast
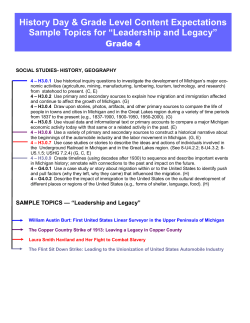
Michigan’s unemployment rate (not seasonally adjusted) moved up by 1.1 percentage points during the month of May, bringing the state’s jobless rate to 5.9 percent. The state’s civilian labor force jumped seasonally by 120,000 to 4,797,000, employment advanced by 62,000 to 4,515,000, while the number of unemployed increased by 58,000 to 282,000. The increase in Michigan’s May unemployment rate was mainly the result of a strong surge in the state’s labor force, as many individuals, including high school and college students joined the workforce looking for seasonal employment. Many jobseekers found jobs in seasonal industries such as leisure and hospitality services and construction, however others did not, causing the state’s jobless rate to rise. The nation’s unemployment rate (unadjusted) also moved up during May, increasing by two-tenths of a percentage point to 5.3 percent. Compared to a year ago, May’s labor force expanded by 26,000, employment surged by 103,000 and the number of unemployed fell by 77,000. This resulted in an over-the-year decline of -1.6 percentage points in the state’s jobless rate. Michigan & United States Unemployment Rates, Unadjusted 2014-2015 7 5 Vol. 71, Issue No. 5 Percent 9 Michigan May Payroll Jobs Advance Seasonally July 2015 Michigan’s Labor Market News Michigan’s Unemployment Rate Increases Seasonally During May Michigan’s nonfarm employment moved up seasonally during May, as industry jobs expanded to 4,312,000. Payroll jobs increased by 81,000 with gains recorded in the goods producing and service-providing sectors of the economy. Goods producing jobs climbed by 23,900 during the month, mainly due to seasonal gains in the construction industry (up by 14,900), mostly among specialty trade contractors (+9,100). Manufacturing jobs also advanced in May, up by 8,700 following recalls in 3 May Jun Jul Aug Sep Oct Nov Dec Michigan HOURS AND EARNINGS, MICHIGAN May & April 2015 Manufacturing Durables Transport Equip Nondurables Average Hourly Earnings Average Weekly Hours 2015 MAY APR 2015 MAY APR 20.77 21.68 25.11 17.32 44.8 46.0 50.7 40.9 20.78 21.60 24.97 17.70 44.1 45.2 49.6 40.5 Jan Feb Mar Apr May U.S. transportation equipment manufacturing up by 3,800, and machinery manufacturing (+800). Service-providing jobs expanded by 57,100 during May due to seasonal hikes in several sectors. Among them were leisure and hospitality services, up by 31,100 (mostly in accommodation and food services, and arts entertainment and recreation services); professional and business services (+11,700), primarily in administrative and support services; and retail trade (+11,100), mainly food and beverage stores. One sector showing seasonal job contractions was government, down by -9,300, following a temporary drop in state government (-11,700), as higher educational facilities began releasing staff for summer vacation. In May, average weekly hours in Michigan’s manufacturing sector rose to 44.8 hours, while average hourly earnings edged downwards by one cent to $20.77. As a result, average weekly earnings in manufacturing advanced to $930.50, a gain of $14.10 over the previous month’s total. Michigan’s Medical Care Price Index Declines During 2014 Labor Market News Medical care is one of the major item groups within the Consumer Price Index (CPI). This group consists of medical care commodities and medical care services. Medical care services is organized into three expenditure categories, professional services, hospital and related services and health insurance. Medical care commodities are comprised of prescription and nonprescription drugs and medical supplies. The CPI measures inflation at the retail level, and reflects the average price change over time for a constant quality and constant quantity market basket of goods and services. In most cases it approximates what households spend out-of-pocket on goods and services used for dayto-day living. Therefore, medical care indexes are limited to items with an out-of-pocket expenditure, although in the case of medical care the term out-of-pocket includes any health insurance premium amounts that are deducted from employee paychecks. The rate of medical care inflation in the Detroit CMSA (Consolidated Metropolitan Statistical Area, including the Detroit-Warren-Dearborn, Ann Arbor and Flint MSAs) was 2.3 percent during 2014, a noticeable decline from the previous year’s gain of 4.5 percent. This was the first time in four years that Michigan’s medical care price inflation decreased when compared to the previous year, reversing a trend that started in 2011. In 2014, the nation’s medical care price rise of 2.4 percent was slightly lower than the previous year’s increase of 2.5 percent and slightly higher than the Detroit CMSA rate of 2.3 percent. During the year, the nation’s price of medical care commodities expanded by 2.5 percent, while medical care services advanced by 2.4 percent. Source: U.S. Department of Labor, Bureau of Labor Statistics, March 2015. Annual Percent Changes In The Consumer Price Index For All Urban Consumers (CPI-U) MEDICAL CARE, For The Detroit CMSA And The US, 2010 - 2014 6 3.6 3.4 4 3.1 2.8 2.1 4.5 2.5 2.3 2.4 2 1.0 0 2010 Page 2 2011 2012 2013 Detroit CMSA U.S. 2014 Michigan (Data In Thousands) May 2015 Apr May 2015 2014 4,797 4,515 282 5.9 4,677 4,771 4,453 4,412 224 359 4.8 7.5 4,312 4,231 4,210 Place of Residence Labor Force Employment Unemployment Rate (Percent) Industry Jobs (Place of Work) Total Nonfarm Goods - Producing Mining & Logging Construction Manufacturing Durable Goods Fabricated Metals Machinery Manufact. Transportation Equip. Nondurable Goods 763 8 159 739 8 144 723 8 144 596 457 80 73 189 138 587 451 81 72 186 136 571 433 80 70 172 138 Service - Providing 3,549 Trade, Transport & Util. 768 Wholesale Trade 170 Retail Trade 467 Motor Vehicle Dealers 62 Food & Beverage Stores 77 General Merchandise 108 Transp, Warehousing & Util 132 Information 3,491 3,487 752 758 168 169 456 461 60 59 75 77 108 109 129 129 57 57 57 Financial Activities Finance & Insurance Real Estate & Rental 210 157 53 206 155 51 206 155 51 Prof & Business Services Prof, Scientific & Technical Management Of Companies Administrative Support 649 276 58 315 638 278 57 302 629 267 59 304 Education & Health Services Educational Services Health Care & Social Asst 660 81 579 657 83 574 646 76 570 Leisure & Hospitality Arts, Entertainment & Rec Accommodation & Food 432 59 373 401 47 355 420 55 365 Other Services 172 172 172 Government Federal State Local 600 51 178 371 609 52 189 368 599 51 174 374 Civilian Labor Force and Nonfarm Jobs Estimates Ann Arbor May 2015 Apr 2015 Battle Creek Bay City May 2014 May 2015 Apr 2015 May 2014 May 2015 Apr 2015 May 2014 190,800 188,500 189,300 182,700 182,500 179,300 8,000 6,000 10,000 4.2 3.2 5.3 66,000 62,400 3,600 5.4 64,500 61,600 2,900 4.5 65,100 60,900 4,200 6.5 53,800 50,500 3,300 6.1 52,800 50,000 2,800 5.4 53,800 49,800 4,000 7.4 Total Nonfarm Jobs 212,700 212,000 210,800 Mining Logging & Construction 3,900 3,600 3,800 Manufacturing 14,100 14,000 14,200 Trade, Transport & Utilities 25,300 25,300 24,700 Wholesale Trade 5,100 5,000 5,100 Retail Trade 16,800 16,900 16,400 Information 5,100 5,100 4,900 Financial Activities 7,800 7,600 7,800 Professional & Business Serv 27,400 27,100 27,200 Educational & Health Serv 26,800 26,700 26,600 Leisure & Hospitality 16,700 15,200 16,900 Other Services 6,700 6,700 6,700 Government 78,900 80,700 78,000 60,000 1,800 11,600 9,100 * 5,700 * 1,200 6,700 11,000 5,000 2,200 10,900 58,900 1,500 11,500 9,100 * 5,600 * 1,200 6,600 11,000 4,700 2,200 10,700 59,000 1,800 11,300 9,500 * 5,600 * 1,200 6,200 10,600 4,900 2,200 10,700 37,300 1,200 3,500 8,300 * 5,300 500 1,300 3,800 6,900 5,000 1,500 5,300 37,000 1,100 3,500 7,900 * 5,200 500 1,300 3,700 6,900 4,900 1,500 5,700 37,400 1,200 4,000 8,000 * 5,300 500 1,300 3,500 6,800 4,900 1,600 5,600 Place of Residence Labor Force Employment Unemployment Rate (Percent) Place of Work Detroit-Warren-Dearborn (Data in Thousands) May Apr May 2015 2015 2014 Flint May 2015 Apr 2015 Grand Rapids-Wyoming May 2014 May 2015 Apr 2015 May 2014 Place of Residence Labor Force Employment Unemployment Rate (Percent) 2,003 1,871 132 6.6 1,952 2,014 1,853 1,841 99 172 5.1 8.6 187,700 184,400 186,600 175,800 174,400 171,600 12,000 9,900 15,000 6.4 5.4 8.0 566,800 551,300 547,500 543,300 532,900 518,600 23,600 18,400 28,800 4.2 3.3 5.3 1,958 72 250 361 86 210 28 109 379 306 191 78 185 1,924 1,907 66 62 246 235 355 354 85 85 206 205 28 28 107 105 373 370 303 300 183 189 77 77 187 187 142,900 141,600 140,600 4,500 4,200 4,300 12,700 12,600 12,400 31,000 30,800 30,200 6,100 6,000 6,000 20,700 20,600 20,200 4,100 4,100 4,100 6,400 6,300 6,500 15,300 15,200 14,900 28,200 28,200 28,000 15,700 15,200 15,300 5,800 5,600 5,600 19,200 19,400 19,300 538,000 526,700 516,800 22,900 20,700 20,300 107,300 105,400 102,300 91,100 90,000 89,700 29,200 28,900 28,900 47,700 47,200 47,100 5,300 5,300 5,400 25,800 25,200 24,600 82,900 80,800 79,000 86,500 86,100 82,300 48,500 44,600 45,700 21,600 21,500 21,500 46,100 47,100 46,000 Place of Work Total Nonfarm Jobs Mining Logging & Construction Manufacturing Trade, Transport & Utilities Wholesale Trade Retail Trade Information Financial Activities Professional & Business Serv Educational & Health Serv Leisure & Hospitality Other Services Government * Data Not Available Page 3 Civilian Labor Force and Nonfarm Jobs Estimates Jackson Kalamazoo-Portage May 2015 Apr 2015 May 2014 Lansing-East Lansing May 2015 Apr 2015 May 2014 May 2015 Apr 2015 May 2014 74,000 69,800 4,200 5.7 72,400 68,900 3,400 4.8 74,000 68,900 5,100 6.9 165,800 163,800 163,900 157,200 157,000 153,400 8,600 6,900 10,400 5.2 4.2 6.4 246,000 242,600 245,300 234,100 233,100 229,600 11,900 9,500 15,700 4.8 3.9 6.4 56,700 1,700 10,100 12,800 * 6,900 400 1,900 3,800 10,200 5,200 2,600 8,000 55,600 1,600 9,800 12,700 * 6,800 400 1,900 3,800 10,100 4,900 2,600 7,800 56,500 1,800 9,700 12,400 * 6,800 400 1,900 3,900 10,200 5,300 2,600 8,300 141,800 142,100 139,600 5,400 5,300 4,800 20,800 20,500 20,100 24,400 24,100 24,900 6,900 6,800 6,700 14,200 14,100 14,800 900 900 1,000 8,100 8,000 8,000 16,800 16,800 16,400 22,900 22,900 22,400 16,200 15,500 15,800 5,700 5,600 5,700 20,600 22,500 20,500 227,700 226,500 224,900 7,200 6,800 6,900 20,100 20,200 18,300 35,100 34,500 34,000 5,800 5,700 5,700 20,700 20,300 20,500 2,800 2,800 2,900 15,500 15,300 15,200 21,400 21,600 22,400 31,200 31,200 31,300 19,800 18,500 19,500 10,500 10,400 10,500 64,100 65,200 63,900 Place of Residence Labor Force Employment Unemployment Rate (Percent) Place of Work Total Nonfarm Jobs Mining Logging & Construction Manufacturing Trade, Transport & Utilities Wholesale Trade Retail Trade Information Financial Activities Professional & Business Serv Educational & Health Serv Leisure & Hospitality Other Services Government Midland Monroe Muskegon May 2015 Apr 2015 May 2014 May 2015 Apr 2015 May 2014 May 2015 Apr 2015 May 2014 42,500 40,300 2,200 5.2 41,600 39,800 1,800 4.4 42,100 39,500 2,600 6.2 77,500 73,700 3,800 4.9 75,900 72,800 3,100 4.1 76,700 71,800 4,900 6.4 78,800 73,900 4,800 6.1 77,100 73,200 3,900 5.1 77,500 71,600 5,900 7.6 Total Nonfarm Jobs 38,600 Mining Logging & Construction * Manufacturing * Trade, Transport & Utilities * Wholesale Trade * Retail Trade * Information * Financial Activities * Professional & Business Serv * Educational & Health Serv * Leisure & Hospitality * Other Services * Government 3,200 38,000 * * * * * * * * * * * 3,100 38,300 * * * * * * * * * * * 3,300 42,700 2,500 5,900 11,000 1,800 5,700 * 1,100 4,500 5,600 5,200 1,600 5,100 41,900 2,300 5,800 10,800 1,800 5,600 * 1,100 4,500 5,600 4,800 1,600 5,200 41,800 2,700 5,300 11,000 1,800 5,700 * 1,100 4,300 5,400 5,000 1,600 5,200 64,300 1,900 13,200 13,700 * 11,000 800 1,800 3,600 12,000 7,700 2,300 7,300 63,700 1,900 13,200 13,800 * 10,800 800 1,800 3,500 11,900 7,100 2,300 7,400 62,800 1,900 12,700 13,500 * 10,800 800 1,800 3,600 11,500 7,200 2,400 7,400 Place of Residence Labor Force Employment Unemployment Rate (Percent) Place of Work * Data Not Available Page 4 Civilian Labor Force and Nonfarm Jobs Estimates Niles-Benton Harbor Saginaw May 2015 Apr 2015 May 2014 May 2015 Apr 2015 May 2014 75,000 70,800 4,200 5.6 73,100 69,700 3,400 4.6 74,900 69,600 5,200 7.0 89,800 84,300 5,500 6.1 88,300 83,800 4,600 5.2 89,500 82,600 6,900 7.7 62,300 1,900 12,900 10,600 * 6,600 500 2,200 5,700 8,800 8,300 2,400 9,000 61,200 1,800 13,200 10,700 * 6,500 500 2,200 5,600 8,900 7,100 2,300 8,900 61,800 1,800 12,800 10,700 * 6,700 500 2,200 5,700 9,200 7,600 2,400 8,900 88,000 2,900 12,100 16,300 2,400 11,700 1,300 3,700 11,400 16,200 10,000 3,600 10,500 87,300 2,500 12,000 16,000 2,400 11,400 1,300 3,700 11,400 16,200 9,300 3,600 11,300 86,800 2,800 11,700 16,400 2,500 11,800 1,300 3,700 11,400 15,900 9,300 3,600 10,700 Place of Residence Labor Force Employment Unemployment Rate (Percent) Place of Work Total Nonfarm Jobs Mining Logging & Construction Manufacturing Trade, Transport & Utilities Wholesale Trade Retail Trade Information Financial Activities Professional & Business Serv Educational & Health Serv Leisure & Hospitality Other Services Government * Data Not Available Upper Peninsula May 2015 Apr 2015 Northeast Michigan May 2014 May 2015 Apr 2015 May 2014 142,700 140,800 142,800 132,700 131,400 130,600 10,000 9,400 12,200 7.0 6.7 8.5 84,900 78,600 6,300 7.4 79,700 73,600 6,100 7.6 84,400 76,500 8,000 9.4 Northwest Michigan May 2015 Apr 2015 May 2014 Place of Residence Labor Force Employment Unemployment Rate (Percent) SERVICE PROVIDING INDUSTRIES PERCENT DISTRIBUTION OF JOBS IN THE JACKSON MSA, ANNUAL AVERAGES 2014 Other Service s 5.9% Leisure And Hospitality 11.3% Government 18.4% Educational & Health Services 22.9% Trade Transport & Utilities 28.6% Financial Acti vities 4 .3% Professional & Business Services 8.6% 151,200 142,600 149,600 141,900 133,900 138,000 9,300 8,600 11,600 6.2 6.1 7.7 REGIONAL FOCUS PERCENT DISTRIBUTION OF JOBS IN THE SERVICE-PROVIDING SECTOR, JACKSON MSA, ANNUAL AVERAGES 2014 The 2014 annual average of nonfarm employment in the Jackson MSA stood at 55,700. Close to 80 percent of the jobs in the area (44,400) were in the serviceproviding sector, while the remaining 20 percent (11,300) were in the goods producing sector. The largest share of jobs within the service sector was in trade, transportation & utilities, accounting for 28.6 percent of the total (12,600 jobs), followed by educational and health services (10,100 jobs) and government (8,100 jobs), with 22.9 and 18.4 percent, respectively. Page 5 May Unemployment Rates Move Up In Most Of Michigan’s Regional Labor Market Areas Major Labor Market Areas May seasonally unadjusted jobless rates rose in 16 of Michigan’s 17 major labor market areas. The jobless rate increases were the result of large numbers of workers entering the labor market looking for seasonal employment opportunities. Although many individuals found jobs, others were unsuccessful, causing the unemployment rates in many areas to rise. From April to May, the unemployment rate increases in the 16 regions ranged from 0.1 to 1.5 percentage points, with a median hike of 0.9 of a percentage point. The highest over -the-month rate increase was recorded in the DetroitWarren-Dearborn Metropolitan Statistical Areas (MSA). The Northeast Lower Michigan region was the only area to post a rate drop during May, contracting by -0.2 of a percentage point. The largest May employment advances were observed in the Northeast and Northwest Lower Michigan regions, up by 6.8 and 6.0 percent, respectively From May 2014 to May 2015 unemployment rates moved down in all the state’s 17 regional labor market areas. Rate declines ranged from -1.0 to -2.0 percentage points with a median rate drop of -1.5 percentage points. The largest jobless rate reductions (-2.0 percentage points) were displayed in the Northeast Lower Michigan region and the Detroit-Warren-Dearborn MSA. During this period, total employment advanced in all 17 regions with gains ranging from 1.3 percent to 4.8 percent, and a median increase of 2.3 percent. Among Michigan's major labor markets, the Ann Arbor and Grand Rapids-Wyoming MSAs had the lowest unemployment rate for May at 4.2 percent. The highest jobless rates for the month were recorded in the Upper Peninsula and the Northeast Lower Michigan region with 7.0 and 7.4 percent, respectively. All But One Of Michigan’s Metropolitan Areas Reported Seasonal Job Gains In May Total nonfarm employment increased in 13 of Michigan’s 14 MSAs as seasonal factors expanded the number of jobs during May. In general, the metropolitan areas reported seasonal job gains in construction (specialty trade contractors), leisure and hospitality services (accommodation and food services, and arts, entertainment and recreation), retail trade, and professional and business services. The sector reporting job reductions in most areas was government, as various higher educational facilities began releasing staff for summer vacation. This was most evident in the Kalamazoo and Ann Arbor MSAs. Among the areas experiencing job gains during May, the Grand Rapids-Wyoming and Jackson MSAs posted the highest percentage growth at 2.2 and 2.0 percent, respectively. The only area showing job losses during May was the Kalamazoo MSA, down by -0.2 percent. Employment hikes in the service-providing industries were reported in most metropolitan areas primarily due to seasonal factors, with the largest percentage gains observed in leisure and hospitality services. All the areas had job additions in this sector, led by the Niles-Benton Harbor and Ann Arbor MSAs up by 16.9 and 9.9 percent, respectively. Other major sectors with increased jobs included retail trade (led by the Saginaw MSA at +2.6 percent); and professional and business services, with the Muskegon and Grand Rapids MSAs among the areas reporting the highest percentage increases at 2.9 and 2.6 percent, respectively. In the goods producing sector, seasonal employment advances were observed largely in construction. All the metro areas but one (the Muskegon MSA posted no change) Page 6 as hiring accelerated for the summer tourism season. had noticeable advances in construction jobs ranging from +5.6 percent (the Niles-Benton Harbor MSA) to +20.0 percent (the Battle Creek MSA). Manufacturing jobs moved up in nine areas, with the Jackson MSA experiencing the largest percentage increase at 3.1 percent, followed by the Grand Rapids MSA (+1.8 percent) and the Detroit and Kalamazoo MSAs (both up by 1.5 percent). Of the remaining five areas, the Niles-Benton Harbor and Lansing MSAs posted reductions while the Bay City, Midland and Muskegon MSAs reported no manufacturing job changes for the month. Average weekly earnings in Michigan’s construction industry increased by +$9.69 during May, following seasonal gains in average weekly hours worked in several sectors within the industry. Building finishing contractors posted the largest weekly wage hike at +$38.78. In the manufacturing sector, average weekly wages increased by +$14.10, mainly as a result of a rise in overtime hours worked in durable goods. Transportation equipment manufacturing reported a gain of +$34.57, bringing the sector’s total weekly earnings to $1,273.08. Nondurable goods weekly wages dropped in May, falling by -$8.46 due to a minor loss in average hourly earnings. The service-providing sector reported a mixed picture in weekly earnings during May, with professional and business services, leisure and hospitality services and retail trade experiencing advances of +$5.67, +$5.23 and +$3.55, respectively. The remaining sectors, financial activities (-$4.01) and health care and social assistance ($1.39) posted minor reductions. HOURS AND EARNINGS For Selected Industries In Michigan May and April 2015 Labor Market News Average Weekly Hours Average Hourly Earnings Area May April May Construction Manufacturing Durable Goods Transportation Equipment Nondurable Goods Retail Trade Financial Activities Professional & Business Services Health Care & Social Assistance Leisure & Hospitality 39.3 44.8 46.0 50.7 40.9 30.0 36.5 35.6 31.8 22.8 38.7 44.1 45.2 49.6 40.5 29.7 36.5 35.3 31.5 22.4 24.54 20.77 21.68 25.11 17.32 13.81 22.97 22.41 19.52 10.84 Average Weekly Earnings April May 24.67 20.78 21.60 24.97 17.70 13.83 23.08 22.44 19.75 10.80 April 964.42 930.50 997.28 1,273.08 708.39 414.30 838.41 797.80 620.74 247.15 954.73 916.40 976.32 1,238.51 716.85 410.75 842.42 792.13 622.13 241.92 Employment Change By Major Industry Sector In The U.S. From 2012 To Projected 2022 The Bureau of Labor Statistics of the U.S. Department of Labor reports that between 2012 and 2022 total employment is projected to advance by 10.8 percent or 15.6 million. Most of this growth is forecast to be among the service-providing industries (up by over 14.1 million). Following are some of the findings reported in this article: The healthcare and social assistance sector is projected to add the most new jobs between 2012 and 2022. This sector is expected to grow at an annual rate of 2.6 percent, adding close to five million jobs in this period. This accounts for nearly one-third of the total forecasted job gains. The growth reflects, in part, the demand for healthcare workers to address the needs of an aging population. Among the service-providing industries, three sectors are projected to have a drop in employment: federal government (-408,000), information (-65,000) and utilities (-56,000). Projected industry employment is distributed among occupations based on how industries are expected to use those occupations. For example, of the 30 occupations Projected Employment Change By Major Serviceprojected to have the largest Providing Industry Sector In The U.S., percentage job increase be2012 And Projected 2022 (Data In Thousands) tween 2012 and 2022, 14 are related to healthcare. Utilities -56 Three of the four major occuWholesale Trade 470 pational groups that are foreRetail Trade 1,091 cast to grow by more than 20 Transportation & Warehousing 327 percent (nearly double overall Information -65 growth) from 2012 to 2022 Financial Activities 751 are: healthcare support occuProfessional & Business Serv. 3,483 pations (28.1 percent), healthcare practitioners and Educational Services 675 technical occupations (21.5 Health Care & Social Assist. 4,994 percent) and personal care Leisure & Hospitality 1,289 and service occupations (20.9 Other Services 649 percent). Federal Government -408 Source: U.S. Department of Labor, Bureau of Labor Statistics; January 2014. State & Local Government -2,000 929 0 2,000 4,000 6,000 Page 7 PRESORTED FIRST CLASS MAIL U.S. POSTAGE PAID LANSING MI PERMIT NO. 1200 Michigan Department of Technology, Management & Budget Bureau of Labor Market Information & Strategic Initiatives Cadillac Place 3032 W. Grand Boulevard, Suite 9-100 Detroit, Michigan 48202 Official Business Penalty For Private Use $300 ADDRESS CHANGE: Remove From Mailing List___ Change As Shown___ Please send this form and attached label to DTMB; Labor Market Analysis Section; Bureau of Labor Market Information & Strategic Initiatives; Cadillac Place, 3032 W. Grand Boulevard, Suite 9-100; Detroit, Michigan 48202. For more information please contact: Labor Market Analysis Section, (313) 456-3090. The Michigan Department of Technology, Management & Budget is an equal opportunity employer/program. Auxiliary aids, services, and other reasonable accommodations are available upon request to individuals with disabilities. Required By: Wagner-Peyser Act, Quantity: 160; Cost: $268.02; Unit Cost: $1.68 Visit our website at www.michigan.gov/lmi Labor News MarketNews LaborMarket EMPLOYMENT IN MICHIGAN’S DURABLE GOODS SECTOR, 2004-2014 Michigan’s manufacturing industry is divided into the durable goods sector and the non-durable goods sector. In 2014, Michigan’s manufacturing industry generated 575,900 jobs, including 437,400 jobs in the durable goods sector. In Michigan, many of the detailed industries in both sectors are part of, or closely associated with, the transportation equipment industry. In the durable goods sector, the majority of the detailed industries are tied to the automotive sector. The recovery of Michigan’s durable goods industries began in 2010, when the state’s total employment in this sector moved up to 351,200, a gain of 8,900 jobs over 2009, reflecting recalls of workers following the recessionary job lows experienced in the previous year. This was the first time since 2000 that Michigan’s durable goods industry posted job gains, reversing a trend that lasted for over a decade. The recovery of durable goods employment continued in the following years, with employers in this sector recalling many of the workers that were laid off during the last recession. Between the years 2009 and 2014, total employment in this sector expanded from 342,300 to 437,400, a gain of 95,100 jobs, or 27.8 percent. Employment estimates are generated monthly for over 10 detailed industries in the durable goods sector. In Michigan, the largest detailed industries in this sector during 2014 were: transportation equipment manufacturing (175,900 jobs) and fabricated metal product manufacturing (79,700 jobs). Source: Michigan Department of Technology, Management & Budget (DTMB), Bureau of Labor Market Information & Strategic Initiatives, June 2015. Employment In Michigan's Durable Goods Sector 2004-2014 (Data in Thousands) 600.0 551.4 476.7 500.0 351.2 400.0 405.4 437.4 2012 2014 342.3 300.0 2004 2006 2008 2010


© Copyright 2026