
E U (UV) R
EVALUATION OF ULTRAVIOLET (UV) RADIATION DISINFECTION TECHNOLOGIES FOR WASTEWATER TREATMENT PLANT EFFLUENT FINAL REPORT 04 -07 DECEMBER 2004 NEW YORK STATE ENERGY RESEARCH AND DEVELOPMENT AUTHORITY The New York State Energy Research and Development Authority (NYSERDA) is a public benefit corporation created in 1975 by the New York State Legislature. NYSERDA’s responsibilities include: • Conducting a multifaceted energy and environmental research and development program to meet New York State’s diverse economic needs. • Administering the New York Energy $martSM program, a Statewide public benefit R&D, energy efficiency, and environmental protection program. • Making energy more affordable for residential and low-income households. • Helping industries, schools, hospitals, municipalities, not-for-profits, and the residential sector, including low-income residents, implement energy-efficiency measures. • Providing objective, credible, and useful energy analysis and planning to guide decisions made by major energy stakeholders in the private and public sectors. • Managing the Western New York Nuclear Service Center at West Valley, including: (1) overseeing the State’s interests and share of costs at the West Valley Demonstration Project, a federal/State radioac tive waste clean-up effort, and (2) managing wastes and maintaining facilities at the shut-down StateLicensed Disposal Area. • Coordinating the State’s activities on energy emergencies and nuclear regulatory matters, and monitoring low-level radioactive waste generation and management in the State. • Financing energy-related projects, reducing costs for ratepayers. NYSERDA administers the New York Energy $martSM program, which is designed to support certain public benefit programs during the transition to a more competitive electricity market. Some 2,700 projects in 40 programs are funded by a charge on the electricity transmitted and distributed by the State’s investor-owned utilities. The New York Energy $martSM program provides energy efficiency services, including those directed at the low-income sector, research and development, and environmental protec tion activities. NYSERDA derives its basic research revenues from an assessment on the intrastate sales of New York State’s investor-owned electric and gas utilities, and voluntary annual contributions by the New York Power Authority and the Long Island Power Authority. Additional research dollars come from limited corporate funds. Some 400 NYSERDA research projects help the State’s businesses and municipalities with their energy and environmental problems. Since 1990, NYSERDA has successfully developed and brought into use more than 150 innovative, energy-efficient, and environmentally beneficial products, processes, and services. These contributions to the State’s economic growth and environmental protection are made at a cost of about $.70 per New York resident per year. Federally funded, the Energy Efficiency Services program is working with more than 540 businesses, schools, and municipalities to identify existing technologies and equipment to reduce their energy costs. For more information, contact the Communications unit, NYSERDA, 17 Columbia Circle, Albany, New York 12203-6399; toll-free 1-866-NYSERDA, locally (518) 862-1090, ext. 3250; or on the web at www.nyserda.org STATE OF NEW YORK George E. Pataki Governor ENERGY RESEARCH AND DEVELOPMENT AUTHORITY Vincent A. DeIorio, Esq., Chairman Peter R. Smith, President EVALUATION OF ULTRAVIOLET (UV) RADIATION DISINFECTION TECHNOLOGIES FOR WASTEWATER TREATMENT PLANT EFFLUENT FINAL REPORT Prepared for the NEW YORK STATE ENERGY RESEARCH AND DEVELOPMENT AUTHORITY Albany, NY www.nyserda.org Kathleen O’Connor Project Manager NATIONAL GRID CORPORATION Syracuse, NY and ERIE COUNTY DEPARTMENT OF ENVIRONMENT AND PLANNING SOUTHTOWNS SEWAGE AGENCY Buffalo, NY Prepared by URS CORPORATION Buffalo, NY Christopher P. Martin, P.E., Project Manager with STAN TEC, INC Guelph, ON Keith Holtz and UNIVERSITY AT BUFFALO James N. Jensen, PH.D. Associate Professor NYSERDA Report 04-07 NYSERDA 4818 December 2004 NOTICE This report was prepared by URS Corporation (URS), the University at Buffalo (UB) and StanTec, Inc. (STANTEC) in the course of performing work contracted for and sponsored by the New York State Energy Research and Development Authority, National Grid Corporation and the Erie County Department of Environment and Planning, New York (hereafter the “Sponsors”). The opinions expressed in this report do not necessarily reflect those of the Sponsors or the State of New York, and reference to any specific product, service, process, or method does not constitute an implied or expressed recommendation or endorsement of it. Further, the Sponsors and the State of New York make no warranties or representations, expressed or implied, as to the fitness for particular purpose or implied, as to the fitness for particular purpose or merchantability of any product, apparatus, or service, or the usefulness, completeness, or accuracy of any processes, methods, or other information contained, described, disclosed, or referred to in this report. The Sponsors, the State of New York, and the contractors make no representation that the use of any product, apparatus, process, method, or other information will not infringe privately owned rights and will assume no liability for any loss, injury, or damage resulting from, or occurring in connection with, the use of information contained, described, disclosed, or referred to in this report. ABSTRACT To evaluate the costs and benefits of using UV instead of chlorine for disinfection of wastewater treatment plant (WWTP) effluent, the New York State Energy Research and Development Authority, National Grid and the Erie County Department of Environment and Planning sponsored a pilot-scale demonstration at the Erie County Southtowns WWTP. The demonstration included three pilot-scale units for the evaluation of three different UV lamp types: low-pressure/low-intensity (lp-li), low-pressure/high-intensity (lp-hi), and medium-pressure/high intensity (mp-hi). The demonstration was performed jointly by URS Corporation, the State University of New York at Buffalo and StanTec, Inc. Four aspects of UV disinfection were evaluated with the three pilot units: operational requirements, disinfection efficiency for fecal coliforms, water quality assessment of the influent, and toxicity tests with rainbow trout and Daphnia magna on chlorinated and UV-treated wastewaters. The primary conclusions of the study are as follows. First, the primary operation and maintenance requirement in UV disinfection is lamp cleaning. In this study, lamp cleaning was successful in restoring the measured UV intensity. Second, total iron and TSS appeared to be correlated (perhaps because the plant influent TSS appeared to have a constant iron content or because dosing of ferric salts for phosphate control may be tied to TSS in the plant influent). Third, all three systems exhibited tailing at log kills greater than about 2. Higher log kills (2.7 – 2.9) are required to achieve an effluent of 200 MPN/100 mL. The recommended doses to achieve 2.7 – 2.9 log kills are 3, 4.5, and 8 mW-s/cm2 for the lp-li, lp-hi, and mp-hi units, respectively. Fourth, no acute toxicity to Daphnia magna was seen in any of the UV treated streams during the same period. For rainbow trout tests, all UV treated effluents had at least one toxic event during the sampling period. Two samples from the low pressure/high intensity treated stream were toxic to rainbow trout. When compared to chlorine treatment, UV treatment significantly reduces whole effluent toxicity to rainbow trout and Daphnia. ACKNOWLEDGEMENTS We dedicate this report to the memory of Martin O’Reilly, who was essential in completing the effluent toxicity testing for this project. We wish to acknowledge the contributions of the following people who were instrumental and greatly appreciated in the completion of this project: ECDEP: Gerald L. Devlin, P.E. Glenn Absolom Mark Fitzgerald James Keller Southtowns WWTP Employees URS: Lori Lehnen, P.E. Rebecca Wightman UB: Bethany Madge, Ph.D. StanTec: Martin O’Reilly This project could not have been completed without the patience and persistence of all people involved. TABLE OF CONTENTS Section Page NOTICE ABSTRACT ....................................................................................................................................... iii ACKNOWLEDGEMENTS................................................................................................................ iv SUMMARY ....................................................................................................................................... S-1 1 I NTRODUCTION ............................................................................................................... 1-1 2 BACKGROUND ............................................................................................................... 2-1 CHLORINE AND UV DISINFECTION............................................................................. Chlorine Disinfection Issues ................................................................................................ Ultraviolet (UV) Radiation Disinfection .............................................................................. 2-1 2-1 2-1 ALTERNATIVE UV DISINFECTION TECHNOLOGIES................................................ 2-3 FACTORS THAT IMPACT UV DISINFECTION ............................................................. Disinfection Efficacy ........................................................................................................... UV Transmittance, Suspended Solids and Particle Shading ................................................ UV Reactor Hydraulics and Configuration .......................................................................... Lamp Fouling ................................................................................................................. Environmental Factors ......................................................................................................... Photoreactivation and Nucleotide Excision Repair .............................................................. Safety Concerns with Using UV .......................................................................................... 2-4 2-4 2-6 2-8 2-9 2-11 2-11 2-13 3 PROJECT OBJECTIVES .................................................................................................... 3-1 4 EXISTING SOUTHTOWNS WWTP FACILITIES AND EFFLUENT WATER QUALITY 4-1 5 PILOT PLANT DESIGN ................................................................................................... 5-1 6 DATA COLLECTION METHODS .................................................................................... 6-1 SAMPLE COLLECTION ................................................................................................... 6-1 MICROBIAL ANALYSIS METHODS .............................................................................. 6-1 OTHER WATER QUALITY ANALYSIS METHODS...................................................... 6-2 EXPERIMENTAL APPROACHES FOR DISINFECTION EFFICACY ........................... 6-3 OPERATIONAL MEASUREMENTS ................................................................................ Intensity ............................................................................................................................... Dose ..................................................................................................................................... 6-4 6-4 6-4 WHOLE EFFLUENT TOXICITY TEST EXPERIMENTAL AND ANALYSIS MEHODS Sampling Program................................................................................................................ Dilution Water...................................................................................................................... Toxicity Bioassays ............................................................................................................... Test Organisms .................................................................................................................... 6-4 6-5 6-5 6-5 6-6 TABLE OF CONTENTS (Continued) Section 7 8 Page Rainbow Trout Bioassays ................................................................................................... Daphnia magna Bioassays ................................................................................................... Data Analysis ....................................................................................................................... 6-6 6-7 6-7 DATA COLLECTION RESULTS AND DISCUSSION .................................................... 7-1 TRACER STUDY RESULTS ............................................................................................. 7-1 SYSTEM OPERATION RESULTS .................................................................................... Flow ..................................................................................................................................... Lamp Cleaning Results ........................................................................................................ Operating Intensity............................................................................................................... 7-2 7-2 7-2 7-3 WATER QUALITY RESULTS........................................................................................... Water Quality Data .............................................................................................................. Comparison of Water Quality to Disinfection Requirements............................................... Impact of TSS on %T........................................................................................................... Influence of Iron on %T and TSS ........................................................................................ Fecal Coliform Data............................................................................................................. 7-3 7-3 7-5 7-5 7-6 7-6 DISINFECTION RESULTS ................................................................................................ Raw Disinfection Results ..................................................................................................... Effect of Dose and Water Quality on Disinfection............................................................... 7-7 7-7 7-7 PHOTOREACTIVATION................................................................................................... 7-8 EFFECTS OF LAMP FOULING ........................................................................................ 7-9 TOXICITY TESTING RESULTS ....................................................................................... Toxicity to Rainbow Trout................................................................................................... Toxicity to Daphnia magna ................................................................................................. 7-9 7-9 7-11 SUMMARY OF RESULTS................................................................................................. Operation.............................................................................................................................. Water Quality ....................................................................................................................... Effluent Toxicity .................................................................................................................. Disinfection and Operating UV Doses................................................................................. 7-12 7-12 7-12 7-12 7-13 UV FACILITY IMPLEMENTATION AND COST ANALYSIS....................................... 8-1 SOUTHTOWNS WWTP DISINFECTION ALTERNATIVES .......................................... Alternative 1 - Chlorination/Dechlorination ........................................................................ Alternative 2 – Low Pressure-Low Intensity UV System .................................................... Alternative 3 – Low Pressure-High Intensity UV System ................................................... Alternative 4 – Medium Pressure-High Intensity UV System ............................................. 8-1 8-1 8-2 8-3 8-4 COST ANALYSIS OF SOUTHTOWNS UV DISINFECTION ALTERNATIVES........... Construction Costs ............................................................................................................... Personnel (Operations) Requirements.................................................................................. Power Use and Cost ............................................................................................................. Lamp Replacement Costs..................................................................................................... Quartz Sleeve Cleaning........................................................................................................ Sodium Hypochlorite and Sodium Bisulfite Costs............................................................... 8-5 8-6 8-7 8-7 8-8 8-8 8-9 TABLE OF CONTENTS (Continued) Section 9 Page Miscellaneous O&M Costs .................................................................................................. Life Cycle Cost Comparison ................................................................................................ 8-9 8-9 UV EQUIPMENT AND O&M COSTS FOR VARIOUS WWTP SIZES .......................... 8-10 CONCLUSIONS AND RECOMMENDATIONS ...................................................................... 9-1 CONCLUSIONS ................................................................................................................. 9-1 RECOMMENDATIONS ..................................................................................................... 9-4 REFERENCES LIST OF TABLES 2-1 2-2 2-3 4-1 6-1 6-2 6-3 7-1 7-2 7-3 7-4 7-5 7-6 7-7 7-8 7-9 7-10 7-11 7-12 7-13 7-14 8-1 8-2 8-3 8-4 8-5 UV Dose to Achieve 3-Log Inactivation of Various Microorganisms................................. Inorganic Composition of Lamp Fouling Material............................................................... Photoreactivation in Wastewater Organisms........................................................................ Filtered and Unfiltered Effluent Wastewater Quality at the Southtowns WWTP ................ Standard Methods................................................................................................................. Disinfection Efficiency Sampling ........................................................................................ Photoreactivation Studies..................................................................................................... Tracer Study Conditions....................................................................................................... Tracer Study Results ............................................................................................................ Average Flow (in gpm) in the UV Systems ......................................................................... Average Lamp Cleaning Frequency (in days/cleaning) ....................................................... Summary of Water Quality Data (average, with range in parentheses) ............................... Summary of Statistics for Correlations Between Measures of %T and TSS........................ Summary of Statistics for Influent Fecal Coliforms............................................................. Summary Statistics for Disinfection Performance ............................................................... Results of Photoreactivation and Dark Reactivation Studies ............................................... Toxicity to Rainbow Trout................................................................................................... Toxicity to Daphnia magna ................................................................................................. Toxic Events in Wastewater Streams at the Southtowns WWTP During the Operation of the Pilot UV Treatment Systems ....................................................................... Summary of Delivered UV Doses........................................................................................ Summary of Operating UV Doses........................................................................................ Life Cycle Cost (2004 Dollars) Analysis for UV Disinfection Alternatives ........................ Comparison of Estimated Equipment Costs......................................................................... Comparison of Estimated Annual Costs ($/year) ................................................................. Comparison of Estimated Present Worth ............................................................................. Comparison of Estimated Normalized Equipment and O&M Costs ($/1,000 gal) .............. Page 2-5 2-9 2-12 4-2 6-2 6-3 6-4 7-1 7-1 7-2 7-3 7-4 7-5 7-6 7-7 7-9 7-10 7-11 7-12 7-13 7-14 8-6 8-11 8-11 8-12 8-12 LIST OF FIGURES Following Page No. 2-1 2-2 2-3 2-4 2-5 2-6 4-1 4-2 5-1 5-2 5-3 5-4 6-1 6-2 7-1 7-2 7-3 7-4 7-5 7-6 7-7 7-8 7-9 7-10 7-11 7-12 7-13 7-14 7-15 7-16 7-17 7-18 7-19 7-20 7-21 7-22 7-23 7-24 7-25 7-26 7-27 7-28 7-29 7-30 8-1 Electromagnetic Light Spectrum.......................................................................................... Formation of Thymine-Thymine Dimer from Adjacent Thymine Residues ........................ Impact of Particles on UV Disinfection ............................................................................... Impact of Tailing on UV Disinfection ................................................................................. Various UV System Configurations..................................................................................... Common UV Lamp Orientations ......................................................................................... Current Southtowns WWTP Treatment Process Schematic................................................. Southtowns WWTP Site Plan .............................................................................................. UV Pilot Plant Schematic ................................................................................................... Interior of Lp-Li UV Pilot Unit............................................................................................ Low Pressure Pilot Units ................................................................................................... Mp-Hi Pilot Unit Lamps ................................................................................................... Photograph of Rainbow Trout Toxicity Test........................................................................ Photograph of Daphnia magna Toxicity Test ...................................................................... Tracer Study Results for the Lp-Li System.......................................................................... Tracer Study Results for the Lp-Hi System ......................................................................... Tracer Study Results for the Mp-Hi System ........................................................................ Flow Through the Lp-Li System.......................................................................................... Flow Through the Lp-Hi System ......................................................................................... Flow Through the Mp-Hi System ........................................................................................ Lamp Cleaning in the Lp-Li System .................................................................................... Lamp Cleaning in the Lp-Hi System.................................................................................... Lamp Cleaning in the Lp-Li System – Expanded Scale....................................................... Lamp Cleaning in the Mp-Hi System................................................................................... Operating Intensity of the Mp-Hi System ............................................................................ Influent Hardness ................................................................................................................. Influent Total Iron Concentration......................................................................................... Influent Unfiltered Percent Transmittance ........................................................................... Influent Lab-Filtered Percent Transmittance........................................................................ Influent Total Suspended Solids .......................................................................................... Relationship Between the %T or Delta %T and TSS for the Low Pressure Systems........... Relationship Between the %T or Delta %T and TSS for the Mp-Hi System ....................... Relationship Between the %T or Delta %T and Total Iron for the Low Pressure Systems . Relationship Between the %T or Delta %T and Total Iron for the Mp-Hi System.............. Relationship Between Total Iron and TSS ........................................................................... Influent Fecal Coliform Concentrations............................................................................... Effluent Fecal Coliform Concentrations .............................................................................. Fecal Coliform Log Kill ................................................................................................... Log Kill Plot for the Lp-Li System ...................................................................................... Log Kill Plot for the Lp-Hi System...................................................................................... Influence of %T on the Log Kill Plot for the Lp-Hi System ................................................ Log Kill Plot for the Mp-Hi System..................................................................................... Log Kill as a Function of TSS for the Mp-hi System........................................................... Log Kill as a Function of the UV Intensity Display Reading for the Lp-Li System ............ Schematic Layout of UV Disinfection Facilities.................................................................. 2-1 2-2 2-7 2-7 2-8 2-9 4-1 4-2 5-2 5-2 5-2 5-2 6-6 6-7 7-1 7-1 7-1 7-2 7-2 7-2 7-2 7-2 7-2 7-2 7-3 7-3 7-3 7-3 7-3 7-3 7-5 7-5 7-6 7-6 7-6 7-6 7-7 7-7 7-7 7-7 7-8 7-8 7-8 7-9 8-2 APPENDICES APPENDIX A – SUMMARY OF RECENT DISINFECTION STUDIES APPENDIX B – MANUFACTURERS INFORMATION OF UV PILOT UNITS AND UV MANUFACTURER CUT SHEETS APPENDIX C – SOUTHTOWNS WWTP UV DEMONSTRATION RAW DATA SUMMARY SUMMARY A project to determine the long-term benefits and costs associated with three different ultraviolet radiation (UV) disinfection alternatives with respect to chlorination/dechlorination was performed at the Erie County Department of Environment and Planning’s (ECDEP’s) Southtowns Wastewater Treatment Plant (WWTP), located in Hamburg, New York. The three UV disinfection technologies evaluated used the following lamp types: 1) low pressure-low intensity (lp-li), 2) low pressure-high intensity (lp-hi) and 3) medium pressurehigh intensity (mp-hi). Chlorination has been the preferred disinfection method used for treating WWTP effluent, but concerns about worker and public safety and the potential for chlorinated effluent to be toxic to aquatic life have called its use into question. As a result, regulatory agencies are adopting stringent chlorine residual effluent limitations, and require risk management plans for bulk storage of chlorine gas or stringent storage and handling requirements for sodium hypochlorite. More stringent chlorine residual discharge limits will require implementation of dechlorination or an alternative disinfection technology. Although chlorine, sometimes followed by dechlorination, continues to be used at most municipal WWTPs, use of other means, such as UV disinfection, is increasing. UV is a technology capable of providing effective WWTP effluent disinfection while reducing safety and environmental toxicity issues. Oftentimes, UV disinfection equipment are readily retrofit into existing WWTP chlorine contact chambers, which helps reduce capital costs. However, a host of other issues must be carefully considered to verify that UV facilities are safe, reliable and economical. These issues include the cost of power and lamp replacement, lamp fouling, ability of the water to allow transmission of UV radiation, tailing, photoreactivation and regrowth of disinfected microorganisms, and dose selection. Wastewater treatment professionals understandably are cautious regarding implementation of new processes and require independently obtained treatability data before process changes will be considered. Data to evaluate the three UV disinfection technologies was collected using a pilot plant at the Southtowns WWTP. The pilot plant was operated under a variety of conditions, including UV dose and effluent type (filter vs. bioclarifier). A summary of the key findings and conclusions are as follows: S-1 PILOT PLANT HYDRAULICS x Tracer studies were performed on the three UV pilot units (lp-li, lp-hi, and mp-hi) to determine if the actual hydraulic residence time (HRT) was similar to the nominal HRT (volume/average flow), and determine how close to plug flow the reactors are operating. Accurate HRT measurement is critical because it is used in calculating UV dose. x The tracer tests showed that the UV pilot-units nominal HRT appears to be a reasonable estimate of system HRT. x The reactors used in this study show an intermediate amount of dispersion, which is reasonably close to plug flow conditions. DISINFECTION RESULTS AND OPERATING DOSE x Fecal coliform log kills of 2.7 – 2.9 were required to achieve an effluent of 200 most probable number per 100 milliliters (MPN/100 mL) based on average influent fecal coliform concentrations in the UV reactors. x UV was shown to effectively disinfect Southtowns WWTP filtered water and bioclarifier effluent to meet a fecal coliform discharge limit of 200 MPN/100 mL. The estimated UV operating dose to achieve the required log kill for the lp-li, lp-hi and mp-hi systems were 26 mW-s/cm2, 30 mW s/cm2, and 32 mW-s/cm2, respectively. x The difference in required doses between the three test systems was not unexpected. The required doses are expected to be related to intensities in the germicidal range. The lp-li lamps emit the greatest percentage of UV light in the germicidal range, while the mp-hi lamps emit the lowest percentage. IMPACT OF WATER QUALITY AND TAILING ON UV PERFORMANCE x Tailing is a phenomenon in which significant increases of UV dose result in little additional inactivation of microorganisms. x All three UV systems exhibited tailing at log kills of fecal coliform greater than about 2 (99%). However, data showed log kills of 2.7 – 2.9 are required to achieve an effluent of 200 MPN/100 mL in Southtowns WWTP effluent. Therefore, tailing would reduce the efficiency of UV S-2 disinfection. Five factors were investigated for their effects on tailing: dose, system influent (bioclarifier vs. filter effluent), total suspended solids (TSS), iron and percent transmittance (%T). x The bioclarifier effluent and filter effluent had similar TSS values, which was unexpected. One possible reason for this occurrence is the age of the filter media at the Southtowns WWTP (20 years). Subsequent to the demonstration, the ECDEP commenced implementation of modifications to improve filtration improvements and capacity. x The influent for all three systems exhibited %T values of less than 65% for every sample regardless of source (bioclarifier or filter effluent). Thus, the water quality was poor (as indicated by %T) with regard to the potential for UV disinfection. No discernable difference in UV performance due to type of influent was observed during this study. It is noteworthy that laboratory filtration raised the %T to above 65% in all but four samples for the three UV systems. x The filter effluent had slightly better water quality on average in terms of %T and lab-filtered %T. The effects of filtration appear to show more strongly as removal of UV-absorbing substances (increasing %T) rather than removal of solids only. This suggests that the planned filter media replacement would further improve %T, thus better UV disinfection performance would be expected using filter effluent. These conclusions are tentative because the water quality of bioclarifier effluent and filter effluent were not measured at the same time. x The surprising water quality result in this study was the correlation between total iron and TSS. This correlation may be explained in two ways. First, the plant influent TSS may have a constant iron content of between 6% and 7%. Second, dosing of ferric salts in the plant for phosphate control may be tied to TSS in the plant influent. Due to the correlation between iron and TSS, it is difficult to separate the effects of TSS and iron on system performance and maintenance. x In general, dose was a better predictor of disinfection performance and tailing than system influent (bioclarifier effluent vs. filter effluent), TSS (data with TSS greater than 20 mg/L vs. data with TSS less than 20 mg/L), iron (data with iron greater than 2.0 mg/L vs. data with iron less than 2.0 mg/L), or %T (data with %T greater than 55% mg/L vs. data with %T less than 55%). EFFLUENT TOXICITY x Effluent toxicity samples were collected from the lp-li, lp-hi and mp-hi pilot units and compared to the toxicity of chlorinated WWTP effluent. Samples were collected over a 14-month period and S-3 bioassays of rainbow trout and Daphnia magna performed based on standardized tests developed by the United States Environmental Protection Agency and Environment Canada. x During all sampling events, the chlorine treated wastewater was toxic to rainbow trout and Daphnia magna. No acute toxicity of Daphnia magna was seen in any of the UV treated effluents. Three out of 35 samples of UV treated effluent showed toxicity to rainbow trout; however, causes other than UV disinfection may have resulted in the toxic events. x The data suggests that, when compared to chlorine treatment of the Southtowns WWTP effluent, UV treatment significantly reduces whole effluent toxicity to rainbow trout and daphnia. This suggests that there are real ecotoxicological advantages to using UV in place of chlorination for the disinfection of municipal wastewater. PHOTOREACTIVATION x Secondary growth studies were conducted to determine whether apparently inactive coliforms actually were viable. These studied consisted of photoreactivation, dark repair and regrowth experiments. x The demonstration showed that neither photoreactivation, dark repair nor regrowth was significant during this project. OPERATION x The primary O&M requirement in UV disinfection for this demonstration was lamp cleaning. Increased fouling of the lamps resulted in reduced intensity transmitted to the microorganisms, thus reducing log kills. In this study, lamp cleaning was successful in restoring measured UV intensity. The mp-hi system required frequent lamp cleaning, likely because of its higher operating temperature. The use of automatic cleaning equipment would greatly facilitate lamp maintenance. COST ANALYSIS x Of the three UV alternatives evaluated for the Southtowns WWTP, the lp-hi system had the lowest annual cost ($396,000), total present worth ($4,760,000) and normalized cost ($0.060/1,000 gal). The lp-hi and mp-hi had similar estimated construction costs, but the lp-hi system had almost a S-4 45% lower estimated O&M cost than the mp-hi system; power costs for the mp-hi system were estimated to be about four times higher than the lp-hi alternative. x The lp-li system is not considered cost effective at the large flow rates experienced at the Southtowns WWTP because of the number of lamps required. The lp-li alternatives would require approximately 2,160 lamps, while the lp-hi system would need 360 lamps (6 times less) and the mp-hi alternative would need 176 lamps (12 times less). x The chlorination/dechlorination alternative had the lowest overall estimated annual cost ($309,000), total present worth ($3,900,000) and normalized ($0.047/1,000 gal) for the Southtowns WWTP. This is followed by the lp-hi alternative. The primary reason why chlorination/dechlorination had the lowest cost was because of its significantly lower estimated capital cost ($1,150,000 for chlorination/dechlorination and $3,350,000 for the lp-li system). The difference in capital cost offset the estimated 40% O&M cost savings that would be realized using the lp-hi system (chlorination/dechlorination = $174,000 per year, lp-hi system = $104,000 per year). x The Southtowns WWTP does not have an existing chlorine contact chamber; the outfall pipe is of sufficient length to currently meet chlorine contact time requirements. About half of the $3,350,000 estimated construction cost for the lp-hi system was associated with modifying a significant portion of the plant’s outfall to accommodate a UV disinfection chamber. One of the key advantages for UV disinfection is its ability to be retrofitted into existing chlorine contact tanks; this advantage cannot be realized at the Southtowns WWTP. If the plant had an existing chlorine contact chamber, the capital cost for the lp-hi system could be reduced by up to $1,600,000. This reduction likely would have made the lp-hi system competitive, if not lower in cost, than the chlorination/dechlorination alternative. Based on this perspective, it appears that UV disinfection is a cost competitive alternative to chlorination/dechlorination at WWTPs with existing chlorine contact chambers. RECOMMENDATIONS Based on the results of this demonstration, the following are recommended: x Wastewater utilities should consider implementing UV disinfection for WWTP effluent in lieu of chlorine, particularly where a treatment plant must implement dechlorination and uses an existing chlorine contact chamber. UV was shown to effectively disinfect Southtowns WWTP filtered water and bioclarifier effluent while mitigating the effluent toxicity concerns associated with residual chlorine. S-5 x Because of the variable nature of wastewater composition between communities, the required UV doses must be determined on a site-specific basis. Key parameters that must be accounted for include TSS, percent transmittance, iron and hardness. x Selection of the most appropriate UV disinfection technology depends on several factors, including flow, existing WWTP configuration, discharge limitations, unit power cost and required UV dose. x Additional study is needed to better define the separate effects of TSS and iron on UV system performance and maintenance, particularly in WWTP that use ferrous compounds for phosphorus removal. x As the filter media ages, the effluent quality can deteriorate, especially TSS and % transmittance. Additional study is needed to determine the impact of aging filter media on UV disinfection performance. S-6 Section 1 INTRODUCTION Effluent from municipal wastewater treatment plants (WWTPs) using the activated sludge process is typically disinfected to protect water supplies, beaches, and aquatic organisms. Chlorine has been the preferred disinfectant used, but concerns about worker and public safety and the potential for chlorinated WWTP effluent to be toxic to aquatic life have called its use into question. As a result, regulatory agencies are adopting stringent chlorine residual effluent limitations and require risk management plans for bulk storage of chlorine gas, as well as stringent storage and handling requirements for sodium hypochlorite. The New York State Department of Environmental Conservation (NYSDEC) has, and is expected to continue reducing chlorine residual limits in WWTP discharges, which will require implementation of dechlorination or an alternative disinfection technology. Although chlorine, which sometimes is followed by dechlorination, continues to be used at most municipal WWTPs, use of other disinfection means is increasing. Maintaining high quality WWTP effluent discharges while minimizing energy usage and costs requires the use of innovative technologies, one such technology being ultraviolet radiation (UV). This technology is capable of providing effective disinfection of WWTP effluent while reducing safety and environmental toxicity issues. The design and operation of disinfection systems requires great care to ensure that the facilities are safe, reliable and economical. Municipal wastewaters in New York State vary significantly depending upon the type of community served and the type of treatment employed. Although there are many potential benefits of using UV for WWTP effluent disinfection, there are also potential disadvantages associated with cost, lamp fouling and photoreactivation of target microorganisms. Therefore, wastewater treatment professionals are understandably careful regarding the implementation of new processes and require independently obtained treatability data and pilot-scale evaluations before changes in treatment processes will be considered. These professionals require information on the benefits, efficacy, capital and operating costs, energy use and potential impacts to water quality on a long-term basis. To evaluate the costs and benefits of using UV instead of chlorine for disinfection of WWTP effluent, the New York State Energy Research and Development Authority (NYSERDA), National Grid and the Erie County Department of Environment and Planning (ECDEP) sponsored a pilot-scale demonstration at the Erie County Southtowns WWTP. The demonstration included the pilot-scale evaluation of three different UV lamp types: low pressure-low intensity (lp-li), low pressure-high intensity (lp-hi), and medium 1-1 pressure-high intensity (mp-hi). URS Corporation (URS), the University at Buffalo (UB) and StanTec, Inc. (StanTec), performed the demonstration jointly. This report summarizes the results of the pilot-scale demonstration and evaluation of the benefits and costs associated with the three different UV lamp types. Included are a comparison of long-term performance, benefits, energy use, costs and environmental impacts associated with three lamp types with respect to chlorination/dechlorination. A comparison of UV disinfection performance on treating filtered and unfiltered (secondary clarifier effluent) wastewater also is presented. In addition, the report includes a summary of equipment and operating and maintenance costs using UV disinfection at various sized municipal WWTPs. 1-2 Section 2 BACKGROUND CHLORINE AND UV DISINFECTION Chlorine Disinfection Issues As noted in the introduction, chlorine disinfection is the most common form of wastewater disinfection today. Chlorination is a well established technology and an effective disinfectant. However, the use of chlorine for disinfection is being reevaluated because of several key concerns. First, chlorine poses a risk to the health and safety of WWTP personnel and the surrounding community. Accidental release of chlorine can occur through volatilization from chlorine contact facilities or through leaks in the storage cylinders or feed lines. Inhalation of chlorine damages the upper and lower respiratory tracts and causes severe skin irritation upon physical contact, and can be lethal to humans. Because of this danger, larger water and wastewater facilities are required to maintain risk management plans that address chlorine use and storage. Second, chlorine can adversely impact receiving streams and can adversely impact biota. The residual chlorine and chloramines from the disinfection process are toxic to many aquatic organisms, including fish, oysters and copepods (Johnson and Jensen, 1986). Residual concentrations as low as 0.002 milligrams per liter (mg/L) have reportedly induced toxic effects in aquatic organisms (TFWD, 1986). Vegetation also can be affected by residual chlorine. Third, chlorine reacts with organic material in the environment to form disinfection byproducts (DBPs) that have potentially adverse impacts to human health. The key DBPs of concern are the formation of trihalomethanes (THMs), such as chloroform and haloacetic acids (HAAs). Ultraviolet (UV) Radiation Disinfection UV light was discovered as part of the electromagnetic spectrum by John Ritter in 1801 (Fleishman, 1996). UV light refers to radiation with wavelengths between 30 and 400 nanometers (nm), which are shorter than visible light. UV light commonly is referred to as black light because it cannot be seen by the human eye. The UV spectrum is divided into three parts: UV-A (315 – 400 nm), UV-B (280 – 315 nm) and UV-C (30 – 280) (Thampi, 1988). UV light produced by the sun causes the human skin to tan or burn. However, the more harmful effects of the sun (e.g., skin cancer and eye cataracts) are specifically from the UV-C part (Fleishman, 1996). Figure 2-1 presents a schematic of the UV light spectrum. 2-1 AG18457-11169710-031904-SH ELECTROMAGNETIC LIGHT SPECTRUM FIGURE 2-1 UV disinfection is a physical form of disinfection, as opposed to the chemical form of chlorine. Some molecules, when subjected to UV light, will absorb its energy. Once absorbed, the electronic energy is sufficient to break bonds and promote the formation of new bonds within the molecule, leaving it damaged. For this reason, UV-C light is called phototoxic (toxic light) (Larson and Berenbaum, 1988). The most important molecules of living cells, deoxyribonucleic acid (DNA) and ribonucleic acid (RNA), are very sensitive to phototoxicity (Larson and Berenbaum, 1988). The most common effect of UV-C is the formation of a cyclobutyl ring between two adjacent thymine nucleic acids located on the same strand of DNA/RNA, as shown on Figure 2-2 (Voet and Voet, 1995). The resulting structure, called a thymine dimer, locally distorts the helical structure of the DNA/RNA molecule preventing the proper attachment of transcriptional and replicating enzyme complexes. This damage most commonly results in inhibition of the transcription and replication of the genetic molecules within the affected cell, which results in death of that single cell (Larson and Berenbaum, 1988). Bacteria, protozoa and viruses are also susceptible to UV-C radiation. Sufficient UV exposure to these single-celled organisms ensures death, particularly at a UV wavelength of 253.7 nm. Once this was discovered, scientists used the germicidal effects of UV light to their advantage. Lamps were invented that emit artificial UV light. These lamps were, and still are, used for sterilization of food packaging, as well as the food they contain, and equipment used in the medical field (Fleishman, 1996). The sterilization of water using UV radiation began in 1909 (White, 1992). Nevertheless, it was only within the last twenty years, with awareness of the health and environmental consequences of using chlorine and the significant improvements in UV reactor design and lamp efficiency, that the first full scale UV disinfection unit was constructed for use in the wastewater treatment industry (Fahey, 1990). Since then, UV systems are becoming increasingly more popular, and the trend is expected to continue through this century (Fahey, 1990). UV disinfection of wastewater has become an accepted alternative to chemical methods of disinfection for secondary and tertiary quality wastewater. As an example, over 1,000 UV systems manufactured by Trojan Technologies, Inc. are reportedly in operation throughout North America, Europe and Asia. The continued increase in interest and use of UV as a disinfectant is because of its many advantages over chlorination. The major advantages of UV over chlorination as a disinfectant can include: x An environmentally safe, non-chemical, physical process that produces no toxic side effects and byproducts x A safe and simple system for operators to use x Ability to achieve the required disinfection level in a few seconds while chlorine requires a minimum of 15 minutes x Installed in flow-through channels without the need for contact tanks 2-2 AG18512-11169710-040104-SH FORMATION OF THYMINE - THYMINE DIMER FROM ADJACENT THYMINE RESIDUES (bond angles exaggerated for clarity, R = double helix backbone) FIGURE 2-2 x Constructed on a minimum amount of land and without requiring buildings x More effective than chlorination on a wide range of organisms, including some viruses that are resistant to chlorine ALTERNATIVE UV DISINFECTION TECHNOLOGIES The most important element of UV systems is the light source or lamp. DNA and RNA molecules exhibit a maximum absorbance of UV-C light between 250 and 260 nm (Thampi, 1990). To maximize the efficiency of the system, the light source must emit at this wavelength range. Three types of UV lamps are readily commercially available: low pressure-low intensity (lp-li), low pressure-high intensity (lp-hi), and medium pressure-high intensity (mp-hi). The term pressure refers to the pressure of gasses inside the lamp. Intensity refers to the energy output. The distinction between the technologies is primarily the germicidal intensity given off by each lamp type, which correlates to the number of lamps required and overall UV system size. The lamp type selected would be determined on a site-specific basis. The oldest and most energy efficient lamps used for UV disinfection are the lp-li lamps. These lamps contain mercury vapor and argon gas that emits nearly monochromatic radiation at 253.7 nm and operate between temperatures of 40 oC and 60 oC when excited with electronic energy (Hanzon and Vigilia, 1999). Of the total emissions from the low-pressure/low-intensity lamps, approximately 85% are at the 253.7 nm wavelength, which is near the peak for germicidal effectiveness. The actual lamp looks very similar in appearance to a fluorescent tube light bulb. Fluorescent tubes have a phosphor coating to convert the UV energy emitted by the mercury vapor to visible light. UV lamps are made of quartz glass because of quartz’ ability to transmit UV light. The power draw of the lp-li lamp is around 88 Watts and the germicidal output is approximately 20 to 25% of the lamp rating (Muller, 1999 and Thampi, 1990). These lamps emit approximately 0.2 germicidal watts per centimeter arc length (W/cm) of radiation energy (Hanzon and Vigilia, 1999). The intensity of the lamp is very unstable for the first 100 hours; for this reason, 100% intensity is usually measured after the first 100 hours of use. The 100% intensity value is supplied by the lamp manufacturer. The intensity of the UV lamp is affected by time and temperature. After 100 hours, the lamp will decline gradually in intensity with age (Darby et al., 1993). The estimated lifetime of the lamp is approximately 13,000 hours, or about 1-½ years (Muller, 1999). Over this lifetime the intensity of the lamp will drop to about 75% of it’s original intensity at 100 hours (Braunstein et al., 1996). The optimum operating temperature is 40o C. Temperatures higher or lower than the optimum will reduce the lamp’s intensity by 1% to 3% per degree (Thampi, 1990). The typical cost for a lp-li lamp is about $45 (Muller, 1999). 2-3 The other two commercially available UV technologies, the lp-hi lamp and the mp-hi lamp, are modifications of the original lp-li lamps. Both of the high intensity lamps emit a broader, polychromatic radiation. Their higher intensities allow for a significant reduction in the total number of lamps required for adequate disinfection (Hunter et al., 1998). However, because the lamps use a substantial amount of their total energy producing light outside the germicidal range they are not considered as efficient as the lp li lamps. The high intensity lamps allow for a significant reduction in the total number of lamps required for adequate disinfection. However, they also use a significant amount of energy to emit radiation outside the germicidal range and are thus, less efficient than lp-li lamps. The high intensity lamps can allow higher capacity WWTPs to cost-effectively implement UV disinfection. Larger WWTPs, which previously would have required thousands of lp-li lamps, require only hundreds of high intensity lamps. The lp-hi lamp operates at pressure similar to its low intensity counterpart. However, the operating temperature range is 180 – 200 oC, which is significantly higher than the lp-li lamp (Hanzon and Vigilia, 1999). The power draw of the lp-hi lamp is about 250 W and the germicidal output is approximately 13 W/cm. The lp-hi lamps have an average lifetime of about 8,000 hours (0.9 years), with gradually falling lamp intensities. The low pressure-high intensity lamps cost approximately $185. The polychromatic medium pressure-high intensity lamp operates at temperatures between 600 and 800 oC. The lamps contain mercury vapor and argon gas that produce polychromatic radiation, although concentrated at select peaks throughout the germicidal wavelength region. The power draw required by this lamp is approximately 2,800 W. The germicidal output of mp-hi lamps is about 16 W/cm, which is about 80 times higher than lp-li lamps. The lamps have an average lifetime of about 8,000 hours (0.9 years) with intensity gradually declining over time. The lamp cost is approximately $225. FACTORS THAT IMPACT UV DISINFECTION Disinfection Efficacy Many studies have been published that illustrate the effectiveness of UV disinfection. A number of recent studies are summarized in Appendix A. In general, the disinfection efficiency of UV, as reported in Appendix A, was quite good. Of the studies presented, Nieuwstad et al. (1991) reported the worst water quality; total suspended solids (TSS) concentrations were as high as 60 milligrams per liter (mg/L). Not surprisingly, the disinfection effectiveness achieved in the poor quality water was correspondingly low. The water quality for the remainder of the studies was below or at the recommended 20 mg/L limit with the 2-4 exception of a test by Job et al. (1996), which also resulted in poor disinfection when compared with the other runs in their study. Most of the experiments yielded fairly consistent results. Also apparent from the summary in Appendix A is the lack of information on lamp types other than lp-li. In only two cases mp-hi lamps were investigated and compared to lp-li lamps (Havelaar et al., 1990 and Nieuwstad et al., 1991). In both instances the mp-hi lamps were reported to be less efficient. In the Nieuwstad et al. study the influent water quality for the mp-hi unit was appreciably lower than that for the other units. Since water quality is known to significantly affect the disinfection efficiency of UV systems, comparisons between units that are fed differing water quality may not be valid. Both of these studies were conducted when the mp-hi lamp technology was relatively new. Since 1990, the popularity of mp-hi systems has grown as these systems have been improved. The effectiveness of UV disinfection is directly related to the dose absorbed by the target microorganisms. The UV dose delivered within a reactor is defined as the product of the average UV intensity within the reactor multiplied by the contact time of the liquid passing through the reactor. Dose units are often given as milliwatt-seconds per square centimeter (mW-s/cm2). The range of UV dose required to achieve a five to six log reduction (99.999% to 99.9999%) in the number of dispersed non-particle associated coliform organisms typically ranges from 10 to 40 mW-s/cm2. Unfortunately, in municipal wastewater treatment, many of the coliform organisms are either clumped or particle associated, which necessitates increasing UV dosage. The required UV dosage for any specific treatment plant will vary depending upon the treatment process, quality of water being disinfected and the targeted microorganisms. Table 2-1 summarizes the estimated amount of UV dosage required to achieve 3-log (99.9%) inactivation of several common types of microorganisms. Table 2-1: UV Dose to Achieve 3-Log Inactivation of Various Microorganisms Microorganism Microorganism Dose 2 (mW-s/cm2) (mW-s/cm ) Bacteria Dose Viruses Bacillus anthracis 8.7 Bacteriophage 6.6 Bacillus subtillis, spores 58 Hepatitis virus 8.0 Bacillus subtillis, vegetative 11 Influenza virus 6.6 Clostridium tetani 22 Polio virus 21 Corynebacterium diphtheriae 6.5 Rota virus 24 7 Protozoa Escherichia coli Legionella pnuemophila 3.8 Nematode eggs 92 Sarcina lutea 26 Paramecium 200 2-5 Microorganism Microorganism Dose 2 (mW-s/cm2) (mW-s/cm ) Mycibacterium tuberculosis 10 Dose Yeast Pseudomonas aeruginosa 10.5 Baker’s yeast 8.8 Salmonella enteritidis 7.6 Saccharomyces 17.6 Salmonella typhosa 6 Shigella dysenteriae 4.2 Shigella flexneri (paradysenteriae) 3.4 Staphlococcus aureus Vibrio cholerae (V. comma) 7 6.5 Several models have been developed to evaluate disinfection efficacy. These models include the following x Chick-Watson Model x Continuous Flow Stirred Tank Reactors in Series x Two Dimensional Continuum Model x Probabilistic Particle-Centered Model UV Transmittance, Suspended Solids and Particle Shading The amount of UV energy required to inactivate microorganisms is dependent on the UV transmittance of the liquid and suspended solids concentration. Many of the constituents found in wastewater absorb UV light, which results in a lower UV intensity. UV transmittance represents the percentage of UV energy in the water that reaches the microorganisms. The lower the transmittance, the lower the amount of UV light that reaches the microorganism. UV transmission is dependent on the spacing of lamps and the water quality of the liquid. The water quality characteristics that affect transmittance include iron, hardness, suspended solids, humic materials and organic dyes. Iron is considered to be very significant with respect to UV absorbance (Jacangelo et al., 1995). Dissolved iron can absorb UV light and precipitate on the UV system quartz tubes. Hardness affects the solubility of metals that absorb UV light and can precipitate carbonates on quartz tubes. Organic humic acids and dyes also absorb UV light. Particles can scatter UV light or shade microorganisms from the radiation. Bacteria and viruses in wastewater, are often bonded together as a floc, or associated with particulate matter. It has been estimated that about 1% of all microorganisms in wastewater are associated with particles (Parker and Darby, 1995). This means that in a typical wastewater that contains approximately 1x10⁵ fecal coliform per 100 milliliters 2-6 (mL), one thousand of those fecal coliform will be particle associated. These organisms are more difficult to disinfect than their free-floating counterparts. Particles may shade the microorganisms by blocking the light, as shown in Figure 2-3. Particles also can reflect or absorb the UV light, thus protecting any organisms behind it. Some organisms can become embedded within, or absorbed upon the particles themselves (Darby et al., 1993). These microorganisms are effectively shielded from the damaging effects of UV light if light penetration is incomplete. The combination of these effects of particles is thought to be the dominant reason for the observed tailing in the dose-response curve (Loge et al., 1996). As shown on Figure 2-4, the presence of particles creates a tailing region in which significant increases of UV dose result in little additional inactivation of microorganisms. This curve shows that the number and distribution of particles is critical to effective disinfection. Figure 2-4 also shows the effect of UV intensity (Tchobanoglous et al., 1999). Increasing the UV intensity tenfold has little effect on the particle associated coliforms. The reason for the minor improvements is that wastewater particles adsorb UV light up to 10,000 times or more than the liquid. The significance of suspended solids was revealed by Darby et al. (1993) when they tested the difference in UV disinfection efficiency between unfiltered and filtered secondary effluent. They discovered UV disinfection performance was improved when the wastewater was filtered prior to disinfection. Originally, an increase in UV transmittance of the wastewater due to filtration was thought to be the cause of the improved disinfection efficiency; however, UV transmittance was not found to be significantly different (average increase of 2%). Therefore, they attributed the improvement to removal of large particles and, hence, the reduction in particle shading and shielding effects (Darby et al., 1993). Parker and Darby (1995) specifically examined the effects of particles on UV disinfection. Bacterial densities after extraction were anywhere from 1.8 to 340 times greater than their initial concentrations, proving that many coliforms were able to escape UV disinfection because of their particle association. Research conducted by Ho et al., (1998) on indigenous male-specific coliphage has shown that viruses may not associate as strongly with particulate matter as bacteria. No correlation between total suspended solids (TSS) and the level of virus inactivation was found and good disinfection results were obtained even when TSS concentrations were high. However, because of the demonstrated negative effects of particles on bacteria, TSS concentrations greater than 20 mg/L should be avoided (White, 1992). Because of the significant impact of particles, UV disinfection is typically not considered for overflow retention facility effluent, which only undergoes primary treatment and has TSS concentrations well over 20 mg/L. One of the biggest problems in UV disinfection is the difficulty measuring UV reactor intensity. There are no instruments that directly measure average UV light intensity within a reactor (Qualls et al., 1989). UV radiometers are probes that are used to detect UV light intensity at a given wavelength (usually 253.7 nm). 2-7 AG18510-11169710-040104-SH UV LAMP FIGURE 2-3 SOURCE: Jacangelo et. al., 1995 INCOMPLETE PENETRATION COMPLETE PENETRATION IMPACT OF PARTICLES ON UV DISINFECTION PARTICLE SHADING AG18525-11169710-040504-SH IMPACT OF TAILING OR UV DISINFECTION FIGURE 2-4 SOURCE: Tchobanoglous et. al.,1999 TAILING REGION However, this value is specific to the point in the reactor at which the measurement was taken and to the water quality in the reactor at that point in time. Therefore, using a radiometer to estimate the average intensity within a reactor at any given time is a difficult task. Three types of indirect approaches to estimating average UV intensity have been developed, mathematical methods, biological assays, and chemical actinometry (Braunstein et al., 1996). Of the three types of approaches, two mathematical models, the point source summation (PSS) method and the single point source summation (SPSS) method, as well as biological assays are most commonly applied, yet no one method has gained a dominant position. UV intensity will decrease with distance due to dissipation and absorption. Therefore, some manufacturers equip UV reactors with on-line UV radiometers at the surface of a quartz sleeve (Infilco Degremont, Inc., 1996). These on-line probes measure the decrease in lamp intensity as a percentage of initial intensity. This factor can then be incorporated into the average intensity for a more accurate calculation of dose. If the reactor is not equipped with an on-line UV radiometer, the manufacturer may supply an intensity versus age curve for the lamps and the decrease from initial lamp output intensity must be estimated from this curve (Darby et al., 1993). This more approximate method may or may not include an additional correction factor that estimates the effects of lamp fouling (Oppenheimer et al., 1997 and Darby et al., 1993). UV Reactor Hydraulics and Configuration The hydraulic characteristics of a reactor can strongly influence disinfection effectiveness. The optimum hydraulic scenario for UV disinfection involves turbulent flow with mixing while minimizing head loss. To maximize effectiveness, UV reactors are preferred to operate at a Reynold’s Number of greater than 5,000. Reactor design, including inlet and outlet flow distribution, controls how close to plug flow the unit operates. Inlet conditions are designed to distribute the flow and equalize velocities. UV system outlets are designed to control the water level at a constant level with little fluctuation within the UV disinfection reactor. Tracer studies are often used to evaluate UV reactor hydraulics. UV disinfection systems employ a variety of physical configurations. Figure 2-5 is a compilation of many of the UV configurations. The darker shaded areas in Figure 2-5 represent water and the lighter circles containing the letter “L” represent lamps. Although all of these designs were built and tested, most never made it out of the pilot scale. An open channel style of Unit 5 has been tested most extensively and appears to have become the configuration of choice in recently published works. UV lamps are generally arranged in linear configuration to avoid UV emission losses because of self absorption, reflection or refraction that can occur if a UV lamp were twisted into loops or spirals to increase intensity along the linear axis. 2-8 AG18511-11169710-040104-SH L L (5) L L (1) L L (2) L L REFLECTORS L VARIOUS UV SYSTEM CONFIGURATIONS (4) L L L L L (6) L OUTLET INLET WATER STREAM (TYP.) FIGURE 2-5 SOURCE: Nieuwsta and Van Olphen, 1991 SOURCE: and Qualls et. al., 1989 L L (3) L L LAMP (TYP.) The configuration in Unit 5 has been modified into two main geometric models for UV disinfection systems. These two popular systems are shown in Figure 2-6. In System A, the lamps are fixed vertically in the reactor, perpendicular to the flow, and in system [B], the lamps are situated horizontally in the reactor, parallel to the flow. Ho et al. (1998) completed a study that compared one horizontal unit and two vertical units. They found that hydraulic conditions within each reactor improved with increasing velocity. However, the horizontal unit was far superior to both the vertical units. Disinfection trials demonstrated that the horizontal unit in this study was more efficient than the vertical units and the authors surmised that the differences in disinfection efficiency were due chiefly to the poor hydraulics of the vertical units (Ho et al., 1998). Still some manufacturing companies of UV disinfection units claim that vertical arrays are less likely to pass water that has not received an adequate UV dose, especially in the case of lamp failure (Infilco Degremont, Inc., 1996), and can provide quick access to each individual lamp for significantly easier maintenance. Most of the UV systems currently produced for wastewater treatment have the flow lines running parallel to the lamp axes. Lamp Fouling The warm temperatures produced by UV lamps promote the precipitation of an inorganic, amorphous film on the surface of the quartz sleeves when the lamps are placed directly within the wastewater stream (Blatchley et al., 1996). The film results predominately from a build up of metal precipitates called scale and, therefore, wastewater with a high hardness is particularly prone to lamp fouling. Blatchley et al. (1996) analyzed the film for its inorganic composition. They found iron to be the most abundant metal and reported the concentrations of the other constituents as relative normalities to iron. Table 2-2 summarizes their results (Blatchley et al., 1996). Table 2-2: Inorganic Composition of Lamp Fouling Material Metal Relative Normality to Iron Metal Relative Normality to Iron Iron 1.0 Silicon < 0.1 Calcium 0.55 Potassium < 0.1 Aluminum 0.35 Barium < 0.1 Sodium 0.1 Manganese < 0.1 Magnesium 0.1 Zinc < 0.1 2-9 AG18513-11169710-040104-SH COMMON UV LAMP ORIENTATIONS HORIZONTAL LAMP ORIENTATION VERTICAL LAMP ORIENTATION FIGURE 2-6 SOURCE: Blatchley et. al., 1996 In addition to the accumulation of mineral salts, lamp fouling is also caused by oil, grease, suspended solids deposits, and biofilms (Mann and Cramer, 1992). If no tertiary treatment is provided, physical debris may contribute to fouling as well. Lamp fouling significantly reduces the effectiveness of UV disinfection by blocking the light rays. Most UV disinfection systems must be cleaned on a regular basis. Oppenheimer et al. (1997) demonstrated that the percentage of lamp fouling has an approximate linear relationship with the time elapsed after the lamps were last cleaned. Job et al. (1995) compared the effectiveness of a UV pilot scale unit at five different treatment plants with a wide variety of water quality characteristics. One of the five plants did not show any significant decrease in efficiency, while fouling at two of the plants decreased efficiency by approximately 4 logs, with the remaining two plants in between. Many effluent water quality parameters were measured, yet no obvious conclusions could be drawn as to why some plants exhibited less fouling than others. Therefore, the tendency of an effluent to promote lamp fouling is not easily predictable (Job et al., 1995). For this reason it was recommended that a percent inactivation by percent fouling curve be developed using a pilot scale unit to determine an appropriate cleaning frequency before full scale operation goes online (Oppenheimer et al., 1997). The cleaning frequency ranged in the literature from daily to once every other month. Lamps are often cleaned with the common industrial cleanser Lime-A-Way or a mild acidic solution, such as hypochloric, phosphoric, muriatic, or citric acid (Nieuwstad et al., 1991). WEM staff (1995) found a two percent muriatic acid solution to be the most effective and cost efficient. Two methods are used to clean lp-li lamp arrays, manual wiping or immersion. In smaller plants where the arrays are relatively small, wiping down each lamp by hand is generally more cost efficient. However, in larger plants manual cleaning becomes too labor intensive. Immersion cleaning can be accomplished either in-channel or in an external tank (Mann and Cramer, 1992). Air sparging units are typically used in both immersion systems and represent a low cost method of extending the cleaning frequency when installed properly (Blatchley et al., 1996). Air sparging is only effective where the bubbles actually “hit” the sleeves. In-channel cleaning poses several design difficulties, such as protecting the channels from the corrosiveness of the cleaning solution, installation of channel drains and isolation gates and valves on both the upstream and downstream ends of each channel, and ensuring that these isolation gates and valves remain leak free. An external cleaning tank must be accompanied by a hoist or overhead crane to move the lamps from the UV reactor to the cleaning tank. Although this method may considerably increase the capital cost of the system, it is generally the preferred method because it isolates the cleaning solution from the from the plant effluent. Ease of cleaning is one of the biggest advantages of the mp-hi and lp-hi lamps. Their increased diameter allows the lamps to be fitted with an automated wiper system (Trojan Technologies, Inc., 1998). One 2-10 system combines the mechanical wiping of two flexible rubber collars with a chemical cleaning solution contained within. A hydraulic arm situated in-between two lamps pushes both wipers down the length of the lamp and back. The process can be completed in-situ and, because the wipers only occupy a small section of the lamp at any one time, cleaning can progress without any interruption to the operation of the disinfection unit (Trojan Technologies, Inc., 1998). Automation of the cleaning cycle is programmable and may be set to run as often as once every hour. Another process, used for an lp-hi lamp system, uses a pneumatically driven stainless steel or Teflon wiper ring to clean the quartz sleeves. The quartz sleeves are harder than stainless steel and thus are not scratched. Because of the ease of automatic cleaning, lamp fouling is not as significant a problem in mp-hi and lp-hi systems. Environmental Factors Temperature and pH are generally the environmental factors that play a role in wastewater disinfection. One of the most heralded advantages of UV disinfection is that, unlike chlorine, it is independent of pH (Thampi, 1990). However, because UV disinfection is a kinetic process, it is affected by temperature. Abu-ghararah (1994) investigated the efficiency of UV disinfection of fecal coliform over a temperature range of 10 – 45 oC. For temperatures below 20 oC, a lower inactivation rate constant was observed. Between 20 and 40 oC the effect of temperature was negligible. Temperature is also an issue for the UV lamps since they have an optimum operating temperature. However, Darby et al. (1993) noted that the air within the fused quartz tube casing, used for UV lamps, created an insulating effect such that typical ranges in wastewater temperature made little difference in disinfection performance. As mentioned earlier, the actual dose received by microorganisms in the wastewater is dependent on the UV transmission of the wastewater itself. Photoreactivation and Nucleotide Excision Repair The fact that UV disinfection leaves behind no residual often is thought of as an advantage to using UV. However, having no residual can potentially have repercussions. It has been well documented that cells have evolved the ability to repair damage by UV light once the source has been removed. Three mechanisms of repair have been established, photoreactivation, nucleotide excision repair (NER), and recombination repair. All three mechanisms are performed by enzymes and, therefore, are affected by temperature, pH, and ionic strength (Chan and Killick, 1995). Photoreactivation is known to occur in most cells, except for certain kinds of bacteria and the connective tissues of placental mammals (Larson and Berenbaum, 1988). The reasons for these exceptions are not yet 2-11 understood. Table 2-3 presents a list of some organisms common to wastewater and their tendency to photoreactivate. Table 2-3: Photoreactivation in Wastewater Organisms (taken from Lindenauer and Darby, 1994) Positive Response No Observable Response Escherichia coli Fecal Streptococci Streptococcus feacalis Bacteriophage Strptomyces somatic coliphages Saccharomyces P. Aeruginosa Aerobacter Clostridium perfringens Micrococcus Haemophilus influenzae Erwinia Diplococcus pnuemoniae Proteus Bacillus subtilis Penicillium Micrococcus radiodurans Nuerospora Photoreactivation occurs in two steps. First, a photoreactivating enzyme, or DNA/RNA photolyase, attaches to a pyrimidine dimer on the damaged molecule (Voet and Voet, 1995). This step does not require light. Second, light energy is captured by the complex, the DNA/ RNA is repaired, and the enzyme is released. This step is called photolysis, because it requires the energy in light to drive the reaction (Lindenauer and Darby, 1994). The light required for the photolysis step is generally in the wavelength range of 310 - 490 nm, but differs between organisms. This corresponds to UV-A and the violet-blue colors, from the visible light range. Lindenauer and Darby (1994) analyzed correlations between percent photoreactivation and UV transmittance, suspended solids, turbidity, and initial and surviving organisms. The strongest correlation was with the number of surviving organisms. This may be an indication that at least a portion of what these authors are considering photoreactivation is really nothing more than reproduction of the surviving organisms in the high nutrient, low competition environment of the UV disinfected wastewater. NER is also called dark repair because, unlike photoreactivation, NER does not require light. In this repair process, enzymes called UvrABC endonucleases selectively cleave out the damaged portion of DNA in an ATP-dependant reaction, and then reconstruct the proper molecule using the complementary strand (Voet and Voet, 1994). NER does not apply to RNA, because RNA is single stranded. The importance of NER 2-12 in the repair of UV damage in humans is apparent due to two rare but severe diseases, Xeroderma Pigmentosum and Cockayne Syndrome. Both diseases are characterized by hypersensitivity to UV radiation and are caused by an inherited defective NER process. However, experiments conducted by Chan and Killick (1995) indicates that dark repair may not play as important of a role in microorganisms. Recombination repair is a post-replication repair mechanism that occurs in the event that damaged DNA molecules managed to undergo replication despite the pyrimidine dimer (Voet and Voet, 1995). When this occurs the replication complex must detach from the DNA at the damaged site and reattach at some point downstream completing the replication of the remainder of the DNA strand. The unaffected, complementary DNA strand simultaneously undergoes normal replication. At the end of replication, one daughter DNA molecule will contain a gap opposite the pyrimidine dimer, while the second daughter molecule forms a normal DNA duplex. In recombination repair, the gap on the damaged molecule is filled by exchanging the missing segment of genetic information from the normal sister DNA molecule. This results in a gap on the normal molecule, which can be filled in readily by reading the complementary strand. The damaged molecule now has an accurate complementary strand and can be repaired through photoreactivation or NER. Research on the role of recombination repair in wastewater treatment has not been published to date. However, since it essentially relies on either of the other two repair mechanisms, its effects will be included in their measurement. Safety Concerns with Using UV Of all the disinfection technologies currently available, UV irradiation is the safest in terms of occupational hazards (Stover et al., 1986). No reactive chemicals are involved requiring transport or storage issues (Stover et al., 1986). The high voltage power supplies required may pose some issue, especially with submerged lamp designs, but compliance with normal electrical safety codes should mitigate hazardous conditions (TFWD, 1986). Exposure to dry lamps can produce deleterious health effects. The National Institute of Occupational Safety and Health (NIOSH) has set limits to occupational exposure to UV light at a wavelength of 254 nm (Mann and Cramer, 1992). Total exposure doses to UV light during the normal eight-hour work day is limited to 6 mW-s/cm2. This dose is 10 to 20 times lower than the doses received by the wastewater flora and requires less than one-sixth of a second of exposure to a dry lp-li lamp to be exceeded (Mann and Cramer, 1992). Submerging a lamp in water, even if it is just a few inches below the surface, will greatly reduce the intensity. Thus, UV reactors should be designed to ensure constant water levels to minimize the risk of exposure. 2-13 Moderate exposure of unprotected skin will cause sunburn or erythema, but continued exposure will cause the skin to blister and bleed (Mann and Cramer, 1992). Prolonged UV exposure to the eyes may cause kerato-conjunctivitis. This effect has many common names, such as “welder’s flash,” “arc eye,” and “snow blindness” and is characterized by an inflammation of the eye (Mann and Cramer, 1992). Although painful, the damage is not permanent (TFWD, 1986). Besides kerato-conjunctivitis, over-exposure to the eyes may also cause retinal lesions, cataract formation and a chronic yellowing of the lens (Mann and Cramer, 1992). Because of the susceptibility of the eyes, protective goggles or face shields should be used when working with UV systems. 2-14 Section 3 PROJECT OBJECTIVES The overall goal of the project was to compare the long-term benefits and costs associated with three different UV disinfection technologies at the Southtowns WWTP with respect to chlorination/ dechlorination using pilot-scale treatability testing. Specific objectives included: x Design, construct and operate a pilot facility consisting of three parallel UV disinfection units to acquire UV performance data. x Evaluate the long-term (minimum 12-month) performance of the three different UV lamp types at the Southtowns WWTP with respect to disinfection efficacy, energy use, operating cost and lifecycle cost. The three lamp types compared in side-by-side testing were low pressure-low intensity, low pressure-high intensity and medium pressure-high intensity. UV costs were compared to installing new chlorination/dechlorination facilities. x Evaluate how UV disinfection performance, associated control requirements, energy use and operating costs vary for the three lamp types when treating filtered and unfiltered (secondary clarifier effluent) wastewater from the Southtowns WWTP. x Compare the environmental impacts of UV technologies and chlorination for WWTP effluent disinfection. x Develop conceptual design, and associated installation and operating and maintenance costs for retrofitting a UV disinfection system into the Southtowns WWTP. x Transfer the project results and approaches to other WWTPs in New York State. 3-1 Section 4 EXISTING SOUTHTOWNS WWTP FACILITIES AND EFFLUENT WATER QUALITY The Erie County Southtowns WWTP currently has a treatment rating of 16 million gallons per day (mgd). The facility treats wastewater using mechanical screens, influent pumping, a Unox system (pure oxygen activated sludge), bioclarifiers, phosphorus stripping using ferric chloride, sand filters, disinfection and effluent pumping. The Southtowns WWTP currently is divided into four treatment modules (4-mgd capacity), each consisting of one Unox reactor, one bioclarifier and three sand filter units. Each treatment module operates as a discrete system; therefore, the WWTP essentially operates as four sub-treatment plants. Significant wet weather flows are bypassed to an overflow retention facility (ORF). Solids handling is accomplished by thickening, polymer conditioning, dewatering (recessed plate filter press), incineration and landfilling. A process schematic and site plan of the existing WWTP are presented on Figures 4-1 and 4-2, respectively. Raw water passes through mechanical screens as it enters the Southtowns WWTP. Flows in excess of the WWTP hydraulic capacity are bypassed to an on-site overflow retention facility (ORF) for primary settling and disinfection prior to discharge of overflows to Lake Erie. The screened wastewater flows into the influent wet well where it is pumped into four Unox reactors using three Archimedes-type screw pumps. Unox is an activated sludge process using pure oxygen. The treated water flows to four bioclarifiers where the mixed liqueur settles. Clarified water is polished using 12 sand filters. WWTP effluent water is disinfected and pumped to Lake Erie via an outfall and diffuser. Disinfectant also is applied upstream and downstream of the ORF. Over the past 20 years, average influent flows have been approaching the Southtowns WWTP’s treatment capacity, and the need for upgrading the facility has become clear. The ECDEP is currently designing an upgrade that will increase the plant’s treatment and hydraulic capacity to 18 mgd and 42 mgd, respectively. This will allow the WWTP to meet its treatment requirements for the next 20 years. The plant upgrade is anticipated to be completed within 5 years. After the upgrade is complete, the Southtowns WWTP will be capable of handling an influent biochemical oxygen demand (BOD), suspended solids and phosphorus loadings of 37,200 pounds per day (lb/d), 34,200 lb/day and 780 lb/day, respectively. The plant upgrade will include conversion of gas chlorination to sodium hypochlorite; the hypochlorite system will have the capability of applying a chlorination dose of 6 mg/L to a flow of 42 mgd (2,100 lb/d). A separate system will be capable of delivering 3,750 lb/d of sodium hypochlorite to disinfect ORF effluent. A summary of typical current filtered and unfiltered 4-1 AG18458-11169710-031904-SH CURRENT SOUTHTOWNS WWTP TREATMENT PROCESS SCHEMATIC FIGURE 4-1 effluent wastewater quality is summarized on Table 4-1. It is noteworthy that plant personnel use ferric chloride for phosphorus removal. Residual iron from this treatment process may negatively impact UV disinfection by absorbing UV light. Data collected for iron, hardness, TSS and other constituents that may impact UV disinfection are presented in Section 6. Table 4-1: Filtered and Unfiltered Effluent Wastewater Quality at the Southtowns WWTP Monthly Average Monthly Average Monthly Average BOD TSS Effluent Fecal Coliform (mg/L) (mg/L) (MPN/100 mL) Average 13 16 13 Range 9 – 20 9 – 28 6 – 26 Average 19 22 - Range 12 – 41 13 – 37 Filtered Unfiltered 4-2 - Section 5 PILOT PLANT DESIGN A pilot plant was constructed at the Southtowns WWTP to evaluate the three different lamp technologies with respect to chlorine disinfection. The pilot plant was constructed in the WWTP Auxiliary Pump Room with the wastewater feed pumps located in the Filter Tunnel. The pilot plant included three UV disinfection units representing the lp-li, lp-hi, and mp-hi lamps. The UV pilot units used for this project were identified using a pre-selection process. Equipment proposals were obtained from the following manufacturers: x Atlantic Ultraviolet Corp., Hauppague, New York – Declined to Submit x Trojan Technologies, Inc., London, Ontario – Submitted Proposal x UV Purification, Inc., Orchard Park, New York – Declined to Submit x Infilco Degremont, Inc., Richmond, Virginia – Submitted Proposal x Calgon Corporation, Pittsburgh, Pennsylvania – Submitted Proposal x Suntech Environmental, Toronto, Ontario –Submitted Proposal x Aquionics, Eringer, Kentucky – Declined to Submit x Ecometrics, Silverdale, Pennsylvania – Declined to Submit x Wedeco/Ideal Horizons, Poultney, Vermont – Submitted Proposal x Ultratech Systems, Inc., Stony Point, New York – Submitted Proposal Selection of the pilot units was based on the proposal that best met the interests of the project according to the following criteria: equipment and services included in the proposed fee, availability of pilot units, cost (rental vs. purchase), lamp configuration, controls and alarms, flow range, cleaning procedures and maintenance requirements. The selected UV systems are described as follows. Selection of these units was based solely on satisfying the specific project criteria and should not be construed as an endorsement of any product. No comparative evaluation of UV manufacturers and their equipment was performed during this project, and no conclusions regarding performance of the UV equipment considered were developed or assumed. Low Pressure-Low Intensity System: The Wedeco/Ideal Horizons Model ICH 2X2L was purchased. This unit contained four lp-li lamps placed in a stainless steel channel. The unit had a capacity of 70 gpm, and the flow stream was parallel to the lamps. The quartz sleeves required manual cleaning. 5-1 Low Pressure-High Intensity System: The Wedeco/Ideal Horizons Model TAK 55 2-1/143 was purchased. This unit contained four lp-hi lamps placed in a stainless steel channel. The unit had a capacity of 200 gpm, and the flow stream was parallel to the lamps. The unit was equipped with a pneumatic quartz sleeve wiper system. Medium Pressure-High Intensity System: Suntech Environmental donated an experimental unit for the duration of pilot testing program. This unit contained four mp-hi lamps placed in a stainless steel channel. The lamp output could be adjusted to change UV dose. The unit had an estimated capacity of about 200 gpm, and the flow stream was parallel to the lamps. The quartz sleeves required manual cleaning. Manufacturer’s information on the UV disinfection systems is included in Appendix B. Once the suppliers for the UV units were selected, plans and specifications for installing the pilot plant into the Southtowns WWTP were prepared. Three construction contractors were invited to submit a bid for installing the pilot system and one was selected based on cost. Southtowns WWTP personnel were instrumental in preparing the area where the pilot plant was installed and in assisting with pilot plant construction. The schematic design for the pilot plant is shown on Figure 5-1. Photographs of the three UV pilot units are shown on Figures 5-2 through 5-4. Wastewater could be pumped from either the filter or bioclarifier (unfiltered) effluent streams to the UV pilot units for disinfection. Valves were used to determine the flow source and to assist with controlling the flow rate to each pilot unit. Variable frequency drives were used on each pump as the primary means of controlling flow. A magnetic flow meter was used to monitor flow to the mp-hi unit, while rotary-type flow meters were used for the two low pressure units. The mp-hi system dose could be controlled by adjusting lamp output intensity or influent flow rate. UV dose for the two low pressure systems was controlled by adjusting flow rate. After the wastewater was disinfected, it was returned to a point upstream of the existing WWTP chlorine disinfection process. Sample ports were located upstream and downstream of the UV units. 5-2 AG18459-11169710-031904-SH UV PILOT PLANT SCHEMATIC FIGURE 5-1 AG18460-11169710-031904-SH INTERIOR OF Lp-Li UV PILOT UNIT FIGURE 5-2 AG18461-11169710-031904-SH LOW PRESSURE PILOT UNITS FIGURE 5-3 NOTE: Lp-Hi Unit In Foreground, Lp-Hi Unit In Background AG18462-11169710-031904-SH Mp-Hi PILOT UNIT LAMPS FIGURE 5-4 Section 6 DATA COLLECTION METHODS The data collection program focused on evaluating the effectiveness of UV disinfection through microbial analysis and photoreactivation testing, as well as the water quality and operational impacts on UV disinfection. Another component of the work involved assessing the potential environmental impacts of chlorinated and UV treated wastewater using whole effluent toxicity tests. This section summarizes the sample collection and analytical methods used during the data collection program, including a description of the experimental methods. SAMPLE COLLECTION Grab samples for chemical analysis and microbial enumeration were collected from the sampling ports in the pilot units. Sample bottles were sterilized prior to use and made of opaque plastic material to inhibit photoreactivation. Samples were stored on ice or in a refrigerator prior to analysis. Southtowns WWTP personnel greatly facilitated project performance by providing laboratory space for bacterial enumeration and wet chemistry. Southtowns WWTP staff also provided invaluable assistance with solving operational problems and performing equipment repairs. MICROBIAL ANALYSIS METHODS Fecal coliforms were used as the indicator organisms in this work because fecal coliforms appear most commonly in WWTP discharge permits. Enumeration was carried out primarily with the one step, A-1 broth multiple tube fermentation technique (Standard Methods section 9221E; all Standard Methods are from APHA et al., 2000). In an effort to narrow the wide confidence intervals of the most probable number (MPN) method, ten inoculation tubes were used per dilution (instead of the standard five tubes per dilution) for the majority of the data collected. Three dilutions were used in all cases. For an example of the increased accuracy from using 10 tubes per dilution, a combination of positive tubes that yields approximately 80 MPN/100 mL in both the ten and five tube method (10-6-0 and 5-3-0, respectively), will have a 95% confidence interval of 34 - 184 MPN/100 mL for the ten tube method and 30 - 250 MPN/100 mL for the five tube method. The actual effect of increasing the number of inoculation tubes varies depending on the combination of positive tubes. As the number of positive tubes increase, the difference between the 95% confidence intervals of the ten and five tube methods becomes greater. MPN quantification was facilitated by a flexible spreadsheet method described by Briones and Reichardt (1999). 6-1 Given the dilution ranges tested and occasional sample dilution, typical detection limits ranged from 9 - 12 MPN/100 mL. Occasionally, during the methods development phase of the research and for quality control purposes during the data collection phase, spent 20 micrometer (µm) and 5 µm MAGNA nylon filters (Micron Separations, Inc.) were plated on mFC agar and enumerated using the membrane filtration (MF) technique according to Standard Methods section 9222D. A grid pattern was drawn on one side of the nylon filters using a fine point, black Millennium felt tip pen (Zig Memory Systems). This pen was made for scrapbooking purposes. The ink is acid-free, waterproof, and non-bleeding and therefore was believed to be non-harmful to the bacteria and appropriate for the wet conditions experienced during the MF technique. After being grid, the nylon filters were sterilized before use. In all cases, undiluted wastewater was applied to the filters and, thus the density of colony forming units (cfu) on the filters did not lie within the acceptable range of the MF technique. Estimations of the coliform cfu were made by randomly picking three grid squares, averaging the count per square, and multiplying by the total number of grid squares in the used portion of the filter. A great effort was made to complete biological measurements within the recommended six-hour holding time. Although this was not always achieved, biological samples were generally finished within seven or eight hours of sample collection. Wastewater samples were refrigerated after being transported to the laboratory in an ice packed cooler. OTHER WATER QUALITY ANALYSIS METHODS Standard water quality measurements that relate to the efficiency of UV disinfection were measured with each wastewater sample. Methods for the parameters that were measured according to Standard Methods are summarized in Table 6-1. Table 6-1: Standard Methods Water Quality Parameter Standard Method Total Suspended Solids 2540 D. Gravimetry Total Iron 3500-Fe B. o-Phenanthroline Hardness 2340 C. EDTA Titrimetry In addition to the parameters listed in Table 6-1, turbidity and UV transmittance were measured. Turbidity was measured using a turbidimeter (Hach, Model 2100A). UV transmittance was measured with a spectrophotometer (Hewlett Packard Diode Array Spectrophotometer, Model 8452A) over the entire UV wavelength range (190 - 400 nm) using a standard 1 centimeter (cm) quartz cuvette. UV transmittance was 6-2 measured on both filtered (0.45 µm) and unfiltered wastewater. Unless otherwise noted, references to percent transmittance throughout this document pertain to unfiltered measurements at 254 nm, the standard wavelength emitted by a lp-li lamp. All five abiotic water quality parameters were measured in triplicate and the arithmetic mean is reported. EXPERIMENTAL APPROACHES FOR DISINFECTION EFFICACY Three types of experiments were conducted in this work. First, tracer studies were conducted to determine the hydraulic residence times of the reactors. Tracer studies were conducted on February 13, 2001, June 14, 2001 and February 14, 2002. Tracer studies were conducted by injecting 60 milliliters (mL) of a 10 gram per liter (g/L) solution of methylene blue dye into the head of each reactor. Effluent samples were collected and the methylene blue concentration determined by spectrophotometry. Second, the disinfection efficiency of the three test units was evaluated by measuring fecal coliforms in the reactor influent and effluent. Studies were conducted with two types of influent: bioclarifier effluent and filtered wastewater. The number and dates of the sampling events are listed in Table 6-2. The determination of disinfection efficiency constituted the bulk of the experimental work. Note that the time required to switch from bioclarifier effluent to filter effluent was much longer than anticipated; this reduced the time available to test the filtered water. Table 6-2: Disinfection Efficiency Sampling Treatment Unit Influent Number of Sampling Events Sampling Dates Lp-li Bioclarifier Effluent 34 4/3/01 - 10/23/01 Filtered Wastewater 8 4/15/02 - 4/23/02 Bioclarifier Effluent 23 4/3/01 - 10/23/01 Filtered Wastewater 8 4/15/02 - 4/23/02 Bioclarifier Effluent 30 5/10/01 - 10/26/01 Filtered Wastewater 18 4/27/02 - 5/1/02 Lp-hi Mp-hi Total 121 Third, photoreactivation studies were conducted to determine whether apparently inactive coliforms actually were viable. In some UV disinfection systems, organisms will not grow in the enumeration medium immediately after disinfection. However, growth is observed if the organisms are allowed to sit undisturbed for a period of hours. This secondary growth is attributable to three mechanisms: photoreactivation (i.e., visible light-induced repair of UV damage to DNA), dark repair (i.e., repair of UV damage to DNA that does not require visible light), and regrowth (i.e., growth of organisms that are too small in number to be counted immediately after disinfection). The photoreactivation studies were 6-3 designed to measure the effects of all three mechanisms. Fecal coliforms were measured in the reactor influent and effluent. Reactor effluent samples were split and stored for 24 hours in the dark or in laboratory light. In addition, an influent sample was diluted to the same microbial concentration as the effluent sample. The diluted influent samples also were stored in the dark for 24 hours. The dates of the photoreactivation studies are shown in Table 6-3. All photoreactivation studies were conducted with filtered wastewater as the treatment unit influent. Table 6-3: Photoreactivation Studies Date Reactor Type 3/22/2002 Lp-li, Lp-hi 4/1/2002 Lp-li, Lp-hi 4/15/2002 Mp-hi 4/23/2002 Lp-li, Lp-hi, Mp-hi OPERATIONAL MEASUREMENTS Intensity UV intensity was monitored by built-in radiometers for the lp-li and lp-hi systems and a manually operated radiometer probe for the mp-hi system. The radiometer system employed an International Light, Inc. Model IL1400A radiometer and a SEL240/T2G detector. This detection measures all wavelengths of light between 220 and 320 nm and weights each wavelength to the IES Luckiesh and DIN standard germicidal action spectrum (relative response to 254 nm on the Luckiesh curve is 86%). For the mp-hi lamps, only a portion of the intensity is at 254 nm. Dose In the pilot plant, UV doses were determined in units of mW-s/cm2. These doses were calculated by multiplying the radiometer readings of intensity (in mW/cm2) by the hydraulic residence time (in s). The hydraulic residence time was calculated as the volume irradiated by the lamps divided by the measured average flow. WHOLE EFFLUENT TOXICITY TEST EXPERIMENTAL AND ANALYSIS METHODS The environmental impacts of chlorinated and UV treated wastewaters were evaluated through toxicity tests at ESG’s Ecotoxicity Laboratory in Guelph, Ontario. Toxicity tests were based on standardized conditions of the USEPA and Environment Canada (EC) biological test methods: 6-4 x x Rainbow trout (EPS 1/RM/13), (EPA/600/4-90/027F) Daphnia magna (EPS 1/RM/14), (EPA/600/4-90/027F) Sampling Program Effluent samples were collected over a 14-month period (April 2001 to June 2002) from the lp-li, lp-hi, and mp-hi pilot treatment units. Additionally, at the same times, chlorinated effluent was collected from the wastewater effluent sampling stream located in the WWTP laboratory. Grab samples were collected and sealed in 22 liter (L) polyethylene pails using food grade polyethylene liners. Samples were transported on the day of collection to ESG’s Ecotoxicity Laboratory in Guelph, Ontario, where they were stored according to the protocols (i.e., either overnight at the test temperature or at 4 to 8ºC) until tests were initiated. An initial set of 20L screening samples were collected for determining the presence or absence of toxicity based on testing the effluent at full strength (i.e., single concentration test). The single concentration test is used to screen samples for toxicity by exposing the organisms to 100% effluent only. USEPA median lethal concentration (LC50) tests were conducted on the next set of samples. Thereafter EC LC50 tests were conducted on all following samples. The primary difference between the USEPA and EC test methods is temperature, whereas the USEPA methods are conducted at 12ºC, while the EC methods are conducted at 15ºC. A total of 53 samples were collected during the pilot evaluation. During certain sampling events, the mp hi pilot system was not operating and could not be sampled. Therefore, additional sampling events were added to provide more data points for the other pilot streams. Dilution Water Water quality necessary for the survival of the test organisms was continuously monitored and documented. Dilution water for organism culturing and testing was continuously and vigorously aerated groundwater from an aquifer in Aberfoyle, Ontario, Canada. Rainbow trout tests were conducted using dilution water with an average pH of 8.35 and water hardness of 300 mg/L as calcium carbonate (CaCO3), while Daphnia tests were conducted at an average pH of 8.40 and water hardness of 200 mg/L as CaCO3. Laboratory dilution water was analyzed regularly for metals, organics, and inorganic chemicals. Toxicity Bioassays Each bioassay included at least one group of control organisms in 100% dilution water, but otherwise was exposed to the same conditions as the test specimens. Groundwater was used as a source of laboratory dilution water in all toxicity tests. Laboratory water quality is monitored semi-annually, and prior to use in 6-5 accordance with ESG’s quality assurance guidelines and standard operating procedures. In trout tests, a continuous supply of oil-free compressed air was provided to ensure concentration of dissolved oxygen and other gases into equilibrium with air. The concentration of dissolved oxygen in the water was maintained at greater than 80% of the air saturation value. Water used for the culture or holding of the test animals was identical to that used for testing purposes. Test Organisms The test organisms were rainbow trout (Oncorhynchus mykiss) and Daphnia magna. Unless otherwise noted, all cultures were maintained according to the Environment Canada test methods. Rainbow trout eyed eggs were obtained from a licensed fish hatchery in Ontario (Rainbow Springs Trout Farm, Thamesford, Ontario). Eggs were incubated at 12 r 1oC in Heath incubation trays. After hatching, they were transferred to square culture tanks provided with a continuous supply of aerated water at 15 r 1oC. Tests with rainbow trout were conducted using similarly aged fish of uniform size (0.3 to 1.0 grams in weight). Tests with Daphnia magna were conducted using organisms obtained from in-house (ESG) laboratory cultures. The initial (verified) daphnid brood stock was obtained from the Ontario Ministry of the Environment (Aquatic Biology Unit, Rexdale, Ontario). Rainbow Trout Bioassays Tests with trout were conducted in accordance with the USEPA and Environment Canada protocols. A photograph of a typical rainbow trout toxicity test is presented on Figure 6-1. Single concentration tests (Environment Canada) involved a determination of median lethal time (LT50), which is defined as the median time estimated to be lethal to 50% of the test organisms in 100% effluent. All other tests involved a determination of the median lethal concentration (LC50), which is defined as the concentration of material in water that is estimated to be lethal to 50% of the test organisms within a defined exposure period. All tests were conducted in 22 L polyethylene buckets (lined with a polyethylene bag) containing 20 L of test solution. USEPA tests consisted of two test chambers per concentration. Each test chamber contained 10 organisms for a total of 20 organisms per concentration. Environment Canada tests consisted of one test chamber per concentration with a minimum of five exposure concentrations and 10 fish per concentration. All tests were conducted under static conditions with no renewal of the test solution in temperaturecontrolled water baths. USEPA trout tests were conducted at 12 r 1oC and Environment Canada tests were conducted at 15 r 1oC. Testing temperatures and photoperiod were similar to those of culture or holding conditions and kept constant between all tests. Test results were based on survival over a 96-hour period. Observations for immobility or mortality were made and recorded after 24, 48, 72 and 96 hours. A fish was considered dead if there was no evidence of 6-6 AG18463-11169710-031904-SH PHOTOGRAPH OF RAINBOW TROUT TOXICITY TEST FIGURE 6-1 opercular (gill) or other activity and showed no response to gentle prodding. Records were made of all other signs of stress during, and at completion of the bioassay. At the end of the bioassay all control fish were weighed and measured (fork length). A test was considered to be invalid if more than 10% of the control fish exhibited atypical/stressed behavior or mortality. Daphnia magna Bioassays Tests with Daphnia magna were conducted in accordance with the USEPA or Environment Canada protocol. A photograph of a typical Daphnia magna toxicity test is shown on Figure 6-2. All tests involved a determination of the median lethal concentration (LC50), which is defined as the concentration of material in water that is estimated to be lethal to 50% of the test organisms within a defined period of exposure. USEPA tests consisted of two glass test chambers per concentration. Each test chamber contained 10 organisms for a total of 20 organisms per concentration. Environment Canada tests consisted of four 55 mL glass test tubes per concentration. Each test tube contained three organisms, for a total of 12 organisms per concentration. All tests were conducted in temperature-controlled rooms at 20 r 1oC. Tests were conducted under static conditions with no renewal of the test solution. For all tests, temperature and photoperiod were identical to the culture or holding conditions and kept constant between all tests. Observations for immobility or mortality were recorded after 24 and 48 hours. A daphnid was considered to be dead if there was no visible heart beat upon microscopic examination. A test was considered to be invalid if more than 10% of the control animals exhibited atypical/stressed behavior and/or mortality. Data Analysis For each toxicity test, data analysis and validation were performed under the supervision of the project manager and laboratory supervisor. The laboratory supervisor and project manager were responsible for assessing data quality and advising of any data rated as invalid, unacceptable or unreliable. Detailed records of the chemicals, test organisms, culture maintenance, test conditions, equipment and test results were maintained by the laboratory supervisor. The LC50 endpoints and 95% confidence limits for tests with rainbow trout and Daphnia magna were calculated using the program STEP (Stephan, 1977). The LC50 is defined as the concentration of effluent sample that is estimated to be lethal to 50% of the animals exposed to that concentration within a prescribed time interval. The LT50 is defined as the exposure time that is estimated to be lethal to 50% of the test organisms in undiluted effluent. The EC50 is defined as the concentration of the test material in water that is estimated to cause an effect (i.e. immobilization) to 50% of the test animals within a defined period of exposure. An EC50 was calculated if immobile organisms were observed in the rainbow trout or Daphnia magna bioassay. 6-7 AG18464-11169710-031904-SH PHOTOGRAPH OF DAPHNIA MAGNA TOXICITY TEST FIGURE 6-2 Section 7 DATA COLLECTION RESULTS AND DISCUSSION TRACER STUDY RESULTS The tracer study conditions are shown in Table 7-1. Tracer study results are presented in Figures 7-1 through 7-3 for the lp-li, lp-hi, and mp-hi systems, respectively. Table 7-1: Tracer Study Conditions Test System Average Test Flow Volume of Test Section (gal) Test Date (gpm) Lp-li 66.7 17.5 2/14/2001 Lp-hi 196.5 41.7 2/14/2001 Mp-hi 129.0 113.9 6/14/2001 The theoretical response of the UV test systems would be a pulse at the hydraulic residence times. Dispersion would result in a normal distribution at the effluent. Tracer data also can be used to estimate the hydraulic residence time (HRT) and dead volume by calculating the first moment of the dye in the effluent. Therefore, the mean HRT for each system was estimated in three ways: as the nominal HRT (volume/average flow), from the first moment of the tracer curve, and from fitting a normal distribution model to the data. The fitted normal distribution curves are shown as solid lines in Figures 7-1 through 7.3. Tracer study results are summarized in Table 7-2. Table 7-2: Tracer Study Results Test System Hydraulic Residence Time (sec) st Fitted Std Dye Est. Dead Dev. (sec) Recovery Space Nominal 1 Moment Fitted Lp-li 15.7 13.4 12.7 4.0 86% 15% Lp-hi 12.7 14.4 14.3 2.4 92% <0% Mp-hi 53.0 36.9 42.6 8.8 189% 30% The lp-li and lp-hi systems showed good dye recovery and nominal HRTs similar to the HRT values estimated from the tracer studies. Thus, the nominal HRT appears to be a reasonable estimate of the system HRT. The tracer study data are suspect for the mp-hi system because the dye recovery was much 7-1 AG18466-11169710-031904-SH Dy eC onc ent rat ion ( mg/L) 0 5 10 15 0 60 Tim e (se )c 40 80 100 TRACER STUDY RESULTS FOR THE Lp-Li SYSTEM 20 o Nrm al Distrib u t ion Trac e r Data FIGURE 7-1 AG18467-11169710-031904-SH Dye Co ncenta r t io n ( mg/L ) 0 2 4 6 8 10 0 60 T im e (sec) 40 80 100 TRACER STUDY RESULTS FOR THE Lp-Hi SYSTEM 20 o rN m al Distrib u t io n T racerData FIGURE 7-2 AG18469-11169710-031904-SH Dye D ye C Concentration oncent rat ion ((mg/L) mg/L) 0 1 2 3 4 5 0 Tim e (sec) 100 150 TRACER STUDY RESULTS FOR THE Mp-Hi SYSTEM 50 Norm al Distribution Tracer Data FIGURE 7-3 greater than 100% and the estimated dead space was high. Therefore, the nominal HRT also was used to estimate the HRT in the mp-hi system. The nature of the flow regime can be estimated by the dispersion number. The dispersion number can be calculated from the fitted standard deviation values and fitted HRT values. The dispersion numbers were 0.05, 0.01, and 0.02 for the lp-li, lp-hi, and mp-hi systems, respectively. Ideal plug flow means a dispersion number of zero. A dispersion number of 0.025 indicates an intermediate amount of dispersion. Thus, the reactors used in this study show an intermediate amount of dispersion. SYSTEM OPERATION RESULTS Flow The wastewater flow through the three UV systems is shown in Figures 7-4, 7-5, and 7-6 for the lp-li, lp-hi, and mp-hi systems, respectively. The average flow conditions are summarized in Table 7-3. Raw data are provided in Appendix C. Table 7-3: Average Flow (in gpm) in the UV Systems System Bioclarifier – High Flow Bioclarifer – Low Flow Filtered Wastewater Lp-li 70.8 35.4 57.9 Lp-hi 151.8 83.7 147.4 Mp-hi 148.5 91.3 122.2 Lamp Cleaning Results Lamps were cleaned periodically when the radiometer readings dropped significantly. The cleaning events over time are shown in Figures 7-7 and 7-8 for the lp-li and lp-hi systems, respectively. The value of 100% percent for the lp-li system corresponds to the intensity immediately after the 100-hour burn-in period. In Figure 7-9, several cleaning events are shown in an expanded scale for the lp-li unit to indicate the rate at which fouling occurs. Note that fouling requires days to weeks to build up. The mp-hi system was not equipped with a built-in radiometer. Figure 7-10 shows the radiometer probe readings and cleaning events over time. Note that cleaning generally resulted in an increase in the display or probe radiometer readings for all three systems. The average time between cleanings is summarized in Table 7-4. Note that the medium pressure system was cleaned more frequently than the low pressure systems. Typically, about one hour was required to 7-2 0 2/28/01 20 40 60 80 AG18470-11169710-032204-SH Flow ( gpm) 4/19/01 6/8/01 11/5/01 12/25/01 2/13/02 Sam pling Date 9/16/01 FLOW THROUGH THE Lp-Li SYSTEM 7/28/01 5/24/02 FIGURE 7-4 NOTE: Bio = BIOCLARIFIER EFFLUENT 4/4/02 Filtered Bio Low Bio High 0 2/28/01 0 5 100 15 0 200 25 0 AG18471-11169710-032204-SH F lo w(gpm) 4/19/01 6/8/01 Sam pling Date 9/16/01 11/5 /01 12/25 /01 2/13 /02 FLOW THROUGH THE Lp-Hi SYSTEM 7/28/01 4/4/02 FIGURE 7-5 NOTE: Bio = BIOCLARIFIER EFFLUENT /524/02 iFltere d iB oL o w iB oiH gh 0 4/19/01 50 100 150 200 AG18472-11169710-032204-SH F low ( gpm) 6/8/01 7/28/01 11/5/01 12/25/01 2/13/02 FLOW THROUGH THE Mp-Hi SYSTEM Sam pling Date 9/16/01 5/24/02 FIGURE 7-6 NOTE: Bio = BIOCLARIFIER EFFLUENT 4/4/02 iFltered iB o Low iB o High AG18520-11169710-040504-SH UVn I t enist y Dis playR eading ( %) 0% 1/9/01 20% 40% 60% 80% 100% 120% 11/5/01 Sam pling Date 7/28/01 2/13/02 LAMP CLEANING IN THE Lp-Li SYSTEM 4/19/01 5/24/02 FIGURE 7-7 C leaning e vEnt Display AG18522-11169710-040504-SH UV Int ensit y Display Reading (mW/cm 2) 0 1/9/01 10 20 30 40 50 60 11/5/01 Sam pling Date 7/28/01 2/13/02 LAMP CLEANING IN THE Lp-Hi SYSTEM 4/19/01 5/24/02 FIGURE 7-8 Cleaning Event Display AG18521-11169710-040504-SH UV Int ensit y Display Reading ( %) 120% 100% 80% 60% 40% 20% 0% 7/28/01 8/17/01 Sam pling Date 8/27/01 9/6/01 9/16/01 LAMP CLEANING IN THE Lp-Li SYSTEM - EXPANDED SCALE 8/7/01 9/26/01 FIGURE 7-9 Cleaning Event Display 0 4/19/01 2 4 6 8 10 AG18474-11169710-032204-SH Measured Int ensity (mW/cm 2) 6/8/01 7/28/01 11/5/01 12/25/01 2/13/02 4/4/02 LAMP CLEANING IN THE Mp-Hi SYSTEM Sam pling Date 9/16/01 5/24/02 FIGURE 7-10 Cleaning Event Measured clean four lamps. Note that Table 7-5 shows that TSS and Total Iron concentrations were similar for the filtered and unfiltered water. In addition, the filtered wastewater had higher hardness than the bioclarifier effluent. This could explain why the filtered effluent didn’t have longer run times than the unfiltered wastewater. Table 7-4: Average Lamp Cleaning Frequency (in days/cleaning) System Bioclarifier Filtered Lp-li 25.4 19.5 Lp-hi 50.8 19.5 Mp-hi 10.6 17.2 Operating Intensity The lp-li system was operated nominally at constant lamp output. In July 2001, it was discovered that the bottom two lamps of the lp-hi system were not lit due to a faulty ballast. From disinfection data, it was estimated that the lp-hi system had been operating with only the top two lamps for the period of May 9, 2001 through July 10, 2001. The operating intensity of the mp-hi system was changed in August 2001 to increase the UV dose. The operating intensity over time is shown in Figure 7-11. WATER QUALITY RESULTS Water Quality Data Physiochemical water quality parameters measured in the system influents included hardness, total iron and percent transmittance (%T) on the unfiltered samples, and %T on laboratory-filtered samples. The lp-li and lp-hi systems received the same influent and had the same influent water quality. The hardness, total iron, unfiltered %T, filtered %T and TSS data are shown in Figures 7-12 through 7-16, respectively. In the figures, “low P” means the common lp-li and lp-hi system influent. Data are summarized in Table 7-5 and raw data are included in Appendix C. 7-3 AG18475-11169710-032204-SH O perat ing n I t enist y(%) 0% 4/19/01 20% 40% 60% 80% 100% 120% 6/8/01 9/16/01 Sam pling Date 11/5/01 12/25/01 2/13/02 OPERATING INTENSITY OF THE Mp-Hi SYSTEM 7/28/01 4/4/02 FIGURE 7-11 5/24/02 AG18476-11169710-032204-SH Hardnes s as Hardnes s(mg/L (mg/L asC aC O ) C aC O 3) 3 6/8/01 4/4/02 5/24/02 Mp-Hi Low P FIGURE 7-12 NOTE: Low P = Low pressure UV units NOTE: Mp-Hi = Medium pressure NOTE: Mp-hi = High intensity UV unit 11/5/01 12/25/01 2/13/02 Sam pling Date 7/28/01 9/16/01 INFLUENT HARDNESS (wastewater source: bioclarifier effluent before 11/1/01; filter effluent after 11/1/01) 350 300 250 200 150 100 50 0 2/28/01 4/19/01 AG18477-11169710-032204-SH Tot al rI on ( mg/L ) 4/19/01 6/8/01 7/28/01 4/4/02 5/24/02 Mp-Hi Low P FIGURE 7-13 NOTE: Low P = Low pressure UV units NOTE: Mp-Hi = Medium pressure NOTE: Mp-hi = High intensity UV unit 11/5/01 12/25/01 2/13/02 Sam pling Date 9/16/01 INFLUENT TOTAL IRON CONCENTRATION (wastewater source: bioclarifier effluent before 11/1/01; filter effluent after 11/1/01) 0 2/28/01 1 2 3 4 AG18478-11169710-032204-SH Unf ilt ered %T ( %) 6/8/01 Sam pling Date 4/4/02 5/24/02 Mp-Hi Low P FIGURE 7-14 NOTE: Low P = Low pressure UV units NOTE: Mp-Hi = Medium pressure NOTE: Mp-hi = High intensity UV unit 7/28/01 9/16/01 11/5/01 12/25/01 2/13/02 INFLUENT UNFILTERED PERCENT TRANSMITTANCE (wastewater source: bioclarifier effluent before 11/1/01; filter effluent after 11/1/01) 70 60 50 40 30 20 10 0 2/28/01 4/19/01 AG18479-11169710-032204-SH Lab-filt ered %T (%) 6/8/01 7/28/01 9/16/01 11/5/01 12/25/01 2/13/02 4/4/02 5/24/02 FIGURE 7-15 NOTE: Low P = Low pressure UV units NOTE: Mp-Hi = Medium pressure NOTE: Mp-hi = High intensity UV unit INFLUENT LAB-FILTERED PERCENT TRANSMITTANCE (wastewater source: bioclarifier effluent before 11/1/01; filter effluent after 11/1/01) 0 2/28/01 4/19/01 Sam pling Date Mp-Hi 40 20 Low P 60 80 100 AG18491-11169710-033004-SH TSS ( mg/L) 6/8/01 Sam pling Date 4/4/02 5/24/02 Mp-Hi Low P FIGURE 7-16 NOTE: Low P = Low pressure UV units NOTE: Mp-Hi = Medium pressure NOTE: Mp-Hi = High intensity UV unit 7/28/01 9/16/01 11/5/01 12/25/01 2/13/02 INFLUENT TOTAL SUSPENDED SOLIDS (wastewater source: bioclarifier effluent before 11/1/01; filter effluent after 11/1/01) 60 50 40 30 20 10 0 2/28/01 4/19/01 Table 7-5: Summary of Water Quality Data (average, with range in parentheses) Parameter Low Pressure Systems Mp-hi System 240 (188 - 292) 245 (196 - 295) 1.5 (0.6 - 3.3) 1.5 (0.7 - 3.7) Unfiltered %T 51.6 (39.8 - 64.2) 51.7 (39.6 - 63.0) Lab-filtered %T 73.5 (52.1 - 81.2) 74.7 (59.9 - 82.1) TSS (mg/L) 21.9 (9.3 - 39.8) 24.2 (14.0 - 57.3) 231.3 231.6 Total iron (mg/L) 1.5 1.5 Unfiltered %T 50.9 51.0 Lab-filtered %T 72.2 73.1 TSS (mg/L) 21.9 24.2 278.4 266.8 Total iron (mg/L) 1.4 1.6 Unfiltered %T 54.2 52.9 Lab-filtered %T 78.9 77.3 TSS (mg/L) 22.0 24.4 Total Project Period Hardness (mg/L as CaCO3) Total iron (mg/L) Bioclarifier Influent Only Hardness (mg/L as CaCO3) Filter Effluent Only Hardness (mg/L as CaCO3) The water quality was very similar for all three systems. Hardness, total iron, and TSS varied from about 0.5 to about 1.5 of their average values. The %T measurements were less variable. The bioclarifier influent and filter effluent had remarkably similar TSS values. One possible reason for this phenomenon is the age of the filter media at the Southtowns WWTP (20 years). Subsequent to the pilot plant demonstration, the ECDEP commenced implementation of filter modifications to improve filtration performance and capacity. The filter effluent had slightly better water quality on average in terms of %T and lab-filtered %T. The effects of filtration appear to show up more strongly as removal of UV-absorbing 7-4 substances (and thus increased %T) rather than removal of solids only. This conclusion is tentative, because the water quality of the bioclarifier effluent and filter effluent were not measured at the same time. Comparison of Water Quality to Disinfection Requirements The typical rules-of-thumb for UV disinfection are that adequate disinfection will be achieved if the TSS is less than 30 mg/L and the unfiltered %T is greater than 65%. For the lp-li and lp-hi influent, the TSS exceeded 30 mg/L only once, while the influent for the mp-hi system exceeded 30 mg/L on seven occasions. However, the influent to all three systems exhibited %T values less than 65% for every sample. Thus, the water quality was poor (as indicated by %T) with regard to the potential for UV disinfection. Laboratory filtration raised the %T to above 65% in all but two samples for the lp-li and lp-hi influent and in all but two samples for the mp-hi influent. Impact of TSS on %T It was hypothesized that suspended solids may account for a significant portion of the unfiltered %T and also accounted for the difference between the %T and lab-filtered %T values. The difference between the %T and lab-filtered %T values will be called delta %T. To test this idea, %T and delta %T were plotted against TSS (see Figures 7-17 and 7-18). The measures of %T appear to be poorly correlated with TSS for the low pressure systems. Linear regression, listed in Table 7-6, support this conclusion. It is interesting to note that the increase in %T upon lab filtration (i.e., delta %T) is not correlated with TSS. Correlations with TSS were stronger, but still poor, for the mp-hi system. For the mp-hi system, it appeared that %T and delta %T leveled off at higher TSS values (above 35 mg/L). This suggests that even extremely good filtration (similar to that achievable in a lab setting) would not improve the %T more at higher TSS values. Table 7-6: Summary Statistics for Correlations Between Measures of %T and TSS System Lp-li and lp-hi Mp (all data) Mp (TSS < 35 mg/L) r2 Correlation Slope Standard Error (%-L/mg) on Slope %T vs TSS 0.022 -0.12 0.12 Delta %T vs TSS 0.044 0.18 0.14 %T vs TSS 0.267 -0.35 0.08 Delta %T vs TSS 0.320 0.38 0.08 %T vs TSS 0.091 -0.39 0.19 Delta %T vs TSS 0.224 0.63 0.18 7-5 AG18492-11169710-033004-SH Measure of %T ( %) 0 10 20 30 40 50 60 RELATIONSHIP BETWEEN THE %T OR DELTA %T AND TSS FOR THE LOW PRESSURE SYSTEMS 0 10 TSS (m g/L) FIGURE 7-17 Delta %T 30 20 Unfiltered %T 40 50 60 70 AG18493-11169710-033004-SH Measure of %T ( %) 0 10 20 30 40 50 60 RELATIONSHIP BETWEEN THE %T OR DELTA %T AND TSS FOR THE Mp-Hi SYSTEM 0 10 TSS (m g/L) FIGURE 7-18 Delta %T 30 20 Unfiltered %T 40 50 60 70 Influence of Iron on %T and TSS The correlation between %T and TSS was weaker than expected. Since the iron concentrations were relatively high, the influence of iron on %T was evaluated. Results are shown in Figures 7-19 and 7-20 for the low pressure and medium pressure systems, respectively. There appears to be a stronger correlation between total iron and %T or delta %T than between TSS and %T or delta %T. In fact, the total iron and TSS concentrations appear to be correlated (see Figure 7-21), with total iron about 6.7% (low pressure) and 6.1% (medium pressure) of the TSS. Fecal Coliform Data The influent fecal coliforms also were quantified for each system. Results are shown in Figure 7-22 and summarized in Table 7-7. The influent fecal coliforms were different during the time when bioclarifier influent was used as the system feed and the time when filter effluent was used as the system feed. It is not possible to know whether these differences reflect the effects of filtration or seasonal effects. Table 7-7: Summary Statistics for Influent Fecal Coliforms (MPN/100 mL) System Average Range Geometric Mean Lp-li 110,000 23,000 - 500,000 84,000 Lp-hi 120,000 17,000 - 300,000 92,000 Mp-hi 170,000 22,000 - 1,600,000 100,000 Lp-li 120,000 23,000 - 500,000 87,000 Lp-hi 130,000 30,000 - 300,000 110,000 Mp-hi 120,000 22,000 - 500,000 85,000 Lp-li 73,000 33,000 - 110,000 67,000 Lp-hi 72,000 17,000 - 130,000 61,000 Mp-hi 250,000 23,000 - 1,600,000 140,000 All Data Bioclarifier Influent Filter Effluent 7-6 AG18494-11169710-033004-SH 0 1 2 3 4 0 10 Total Iron (m g/L) FIGURE 7-19 Delta %T 30 20 Unfiltered %T 40 50 60 70 RELATIONSHIP BETWEEN THE %T OR DELTA %T AND TOTAL IRON FOR THE LOW PRESSURE SYSTEMS Measure of %T ( %) AG18495-11169710-033004-SH Measure of %T ( %) 0 1 2 3 4 0 10 RELATIONSHIP BETWEEN THE %T OR DELTA %T AND TOTAL IRON FOR THE Mp-Hi SYSTEM Total Iron (m g/L) FIGURE 7-20 Delta %T 30 20 Unfiltered %T 40 50 60 70 AG18496-11169710-033004-SH Tot al Iron ( mg/L) 0 1 2 3 4 0 TSS (m g/L) 40 80 FIGURE 7-21 NOTE: Low P = Low pressure UV units NOTE: Mp-Hi = Medium pressure NOTE: Mp-Hi = High intensity UV unit 60 RELATIONSHIP BETWEEN TOTAL IRON AND TSS 20 Mp-Hi Low P AG18498-11169710-033004-SH Fecal Coliforms (MPN/100mL) 2/28/01 10000 100000 1000000 10000000 6/8/01 7/28/01 Sampling Date 4/4/02 5/24/02 FIGURE 7-22 NOTE: Lp-Li = LOW PRESSURE - LOW INTENSITY UNIT NOTE: Lp-Hi = LOW PRESSURE - HIGH INTENSITY UNIT NOTE: Mp-Hi = HIGH PRESSURE - HIGH INTENSITY UNIT 9/16/01 11/5/01 12/25/01 2/13/02 INFLUENT FECAL COLIFORM CONCENTRATIONS 4/19/01 Mp-Hi Lp-Hi Lp-Li DISINFECTION RESULTS Raw Disinfection Results Effluent fecal coliform counts and log kill values for the three UV systems are shown in Figures 7-23 and 7-24, respectively. Disinfection performance data are summarized in Table 7-8 with raw data provided in Appendix C. Also shown in Table 7-8 is the percentage of samples for which the effluent fecal coliforms were less than 200 MPN/100 mL, a common disinfection benchmark. Note that, as operated, the pilot systems exceeded the 200 MPN/100 mL limit frequently. Table 7-8: Summary Statistics for Disinfection Performance System Effluent Fecal Coliforms (MPN/100 mL) Log kill Percent of samples > 200 MPN/mL Lp-li 1,600 (20 - 30,000) 2.3 (0.2 - 3.7) 71% Lp-hi 2,900 (20 - 50,000) 2.6 (0.5 - 4.1) 42% Mp-hi 9,800 (20 - 160,000) 1.9 (-0.5 - 3.6) 82% Effect of Dose and Water Quality on Disinfection Disinfection performance is expected to be affected by both the UV dose and water quality. Based on the tracer studies, the theoretical hydraulic residence time was deemed to be a reasonable estimate of the actual residence time. Therefore, UV doses were calculated as: dose = (flow)*(UV intensity)/(reactor volume). The log kill versus UV dose plot for the lp-li system is shown in Figure 7-25. The curving off of the log kill at higher doses is called tailing. Five factors were investigated for their effects on tailing: dose, system influent (bioclarifier vs filter), TSS (data with TSS greater than 20 mg/L vs data with TSS less than 20 mg/L), iron (data with iron greater than 2.0 mg/L vs data with iron less than 2.0 mg/L), and %T (data with %T greater than 55% mg/L vs data with %T less than 55%). The only factor correlated with tailing was dose. Tailing was observed when the dose was greater than about 2.5 mW-s/cm2. Since the average influent fecal coliforms for the lp-li system was 109,000 MPN/100 mL, a log kill of 2.7 was required to meet an effluent standard of 200 MPN/100 mL. This level of performance would require a dose of about 3 mW-s/cm2. The log kill versus UV dose plot for the lp-hi system is shown in Figure 7-26. For the time period where the bottom two lamps were suspected to be unlit, doses were calculated by dividing the radiometer reading 7-7 AG18499-11169710-033004-SH Fecal Colif orms ( MPN/100mL) 10 1/9/01 100 1000 10000 100000 1000000 11/5/01 Sam pling Date 7/28/01 5/24/02 FIGURE 7-23 NOTE: Lp-Li = LOW PRESSURE - LOW INTENSITY UNIT NOTE: Lp-Hi = LOW PRESSURE - HIGH INTENSITY UNIT NOTE: Mp-Hi = HIGH PRESSURE - HIGH INTENSITY UNIT 2/13/02 EFFLUENT FECAL COLIFORM CONCENTRATIONS 4/19/01 Mp-Hi Lp-Hi Lp-Li AG18500-11169710-033004-SH Log Kill 0 2/28/01 4/19/01 1 2 3 4 5 6/8/01 FECAL COLIFORM LOG KILL 4/4/02 5/24/02 FIGURE 7-24 NOTE: Lp-Li = LOW PRESSURE - LOW INTENSITY UNIT NOTE: Lp-Hi = LOW PRESSURE - HIGH INTENSITY UNIT NOTE: Mp-Hi = HIGH PRESSURE - HIGH INTENSITY UNIT 11/5/01 12/25/01 2/13/02 Sam pling Date 7/28/01 9/16/01 Mp-Hi Lp-Hi Lp-Li AG18501-11169710-033004-SH Log Kill 0 0.5 1 1.5 2 2.5 3 3.5 4 0 1 3 4 LOG KILL PLOT FOR THE Lp-Li SYSTEM 2 Dose (mW-s/cm2) 5 Filter Effluent FIGURE 7-25 Bioclarifier Effluent 6 AG18503-11169710-033004-SH Log Kill 5 4 3 2 1 0 0 1 3 4 5 LOG KILL PLOT FOR THE Lp-Hi SYSTEM 2 Dose (mW-s/cm2) 6 Filter Effluent FIGURE 7-26 Bioclarifier Effluent 7 by two. This was necessary because radiometer readings were taken at the surface of the reactor and not influenced significantly by the bottom lamps. The five factors (dose, system influent, TSS, iron, and %T) were investigated for their effects on tailing. Tailing was observed when the dose was greater than about 4 mW-s/cm2. The only factor correlated with tailing other than dose was %T (see Figure 7-27). It appears that more tailing and poorer performance was observed at higher %T values. This observation is counterintuitive and deserves further study. A log kill of 2.8 was required to meet an effluent standard of 200 MPN/100 mL with the lp-hi system, based on the average influent fecal coliforms of 116,000 MPN/100 mL. This level of performance would require a dose of approximately 4.5 mW-s/cm2. The log kill versus UV dose plot for the mp-hi system is shown in Figure 7-28. The five factors (dose, system influent, TSS, iron, and %T) were investigated for their effects on tailing. Tailing was observed when the dose was greater than about 6 mW-s/cm2. The only factor correlated with tailing other than dose was system influent. As seen in Figure 7-28, tailing was more prominent in the runs treating filter effluent. A log kill of 2.9 was required to meet an effluent standard of 200 MPN/100 mL with the mp-hi system, based on the average influent fecal coliforms of 171,000 MPN/100 mL. To achieve this level of performance consistently would require a dose of about 8 mW-s/cm2. Note from Figure 7-29 that the required dose would be reduced to about 5 mW-s/cm2 if influent solids were less than 20 mg/L. PHOTOREACTIVATION The results of the photoreactivation and dark reactivation studies are shown in Table 7-9. Several conclusions can be drawn regarding the importance of reactivation and regrowth in the wastewaters employed in these studies. First, neither reactivation nor regrowth appeared significant during this study. With one exception, no more than 4.2% of the organisms appeared to recover or regrow in the samples tested, which is within the reproducibility of the enumeration method. Second, reactivation typically was larger (although still small) with the lp-li system. Third, photoreactivation typically was larger than dark repair. This conclusion can be drawn by comparing the % increase values in Table 7-9 for irradiated samples in the light and dark. Fourth, light and dark repair usually were only marginally larger than simple regrowth. This conclusion can be drawn by comparing the % increase values in Table 7-9 for irradiated samples and diluted samples. 7-8 AG18504-11169710-033004-SH Log Kill 3 4 5 6 5 4 FIGURE 7-27 %T > 55% 7 3 INFLUENCE OF %T ON THE LOG KILL PLOT FOR THE Lp-Hi SYSTEM (BIOCLARIFIER DATA ONLY) 2 %T < 55% 1 2 1 0 0 Dose (mW-s/cm2) AG18505-11169710-033104-SH Log Kill 4 3 2 1 0 -1 0 15 LOG KILL PLOT FOR THE Mp-Hi SYSTEM 5 Dose (mW-s/cm2) 10 FIGURE 7-28 Filter Effluent Bioclarifier Effluent 20 AG18703-11169710-091404-GCM 4 3 2 1 0 -1 0 5 Dose (mW-s/cm2) 10 15 20 TSS > 20 mg/L TSS < 20 mg/L LOG KILL AS A FUNCTION OF TSS FOR THE Mp-hi SYSTEM (INCLUDES BIOCLARIFIER EFFLUENT AND FILTERED WASTEWATER SAMPLES) Log Kill FIGURE 7-29 Table 7-9: Results of Photoreactivation and Dark Reactivation Studies (tabulated values are bacterial counts after 24 hrs as a percent of initial counts) Irradiated Diluted Date Reactor Light Dark Light Dark 3/22/02 Lp-li 4.2% 4.2% 0.4% 0.3% Lp-hi 1.2% 0.2% lp-li 0.7% 0.7% 0.8% 0.8% lp-hi 0.2% 0 4/15/02 mp-hi 3.0% 0.3% 1.4% <0 4/23/02 lp-li 2.4% 0.1% 2.3% 12.0% lp-hi <0.1% <0 mp-hi 0.6% 0.1% 4/1/02 EFFECTS OF LAMP FOULING Every time the lamps were cleaned, microbiological samples were taken immediately before and immediately after cleaning. Microbiological samples also were collected on days when the lamps were not cleaned. For example, 42 microbilogical samples were collected with the Lp-Li unit: 10 immediately before cleaning, 9 immediately after cleaning (no sample taken after the first cleaning event), and 23 on days when the lamps were not cleaned. Based on the manufacturer’s information, the display on the lp-li unit (indicating percent intensity relative to the intensity after 100 hours of operation) is designed to be an indicator of fouling. As shown in Figure 7-30, there was a large variation in the log kill obtained with a display reading of near 100%. However, lower display readings generally correlated with poorer disinfection. Thus, disinfection performance will suffer significantly if lamps are not maintained. TOXICITY TESTING RESULTS Toxicity to Rainbow Trout LC50 data expressed as percentage effluent by volume (%, v/v) and LT50 data expressed in hours are presented below in Table 7-10. 7-9 AG18509-11169710-033104-SH Log Kill 0 0.5 1 1.5 2 2.5 3 3.5 4 0% 40% 60% 80% LOG KILL AS A FUNCTION OF THE UV INTENSITY DISPLAY READING FOR THE Lp-Li SYSTEM 20% UV Intensity Display Reading 100% 120% FIGURE 7-30 Table 7-10: Toxicity to Rainbow Trout (Oncorhychus mykiss) LC50 is Expressed as % v/v Effluent. LT50 is Expressed in Hours. Effluent Stream LC50 (%) Date Chlorinated Lp-Li Lp-Hi Mp-Hi April 03, 2001 0.52 (LT50) >96 hr (LT50) >96 hr (LT50) ND May 29, 2001 35.4 >100 >100 ND July 10, 2001 33.8 >100 >100 >100 August 27, 2001 10.9 >100 >100 ND October 11, 2001 29.3 >100 >100 ND March 08, 2002 8.8 >100 >100 ND March 14, 2002 8.8 >100 >100 ND March 22, 2002 8.83 >100 >100 ND April 04, 2002 <13 >100 >100 >100 April 11, 2002 18.0 40.5 58.6 42.7 1 91.6 >1002 April 18, 2002 18.0 >100 May 21, 2002 31.3 >100 >100 >100 May 23, 2002 35.4 >100 >100 >100 June 04, 2002 18.0 >100 >100 ND June 06, 2002 18.0 >100 >100 >100 1. 50% mortality in 100% effluent 2. 30% mortality in 100% effluent ND = No Data During the sampling period all of the chlorine treated effluent samples were toxic to rainbow trout below the 50% dilution level. The LC50 for the chlorinated wastewater stream ranged from 8.8% to 35.4% v/v effluent with a mean LC50 of 21.1%. An LC50 could not be generated for the toxicity test conducted on April 04, 2002 (i.e., reported LC50 <13%) and, therefore, was not included in the calculation for the mean. At two sampling times, April 11 and 18, 2002, both UV treated and chlorinated effluents were toxic to rainbow trout. LC50s for samples taken on April 11, 2002 ranged from 40.5% to 58.6% v/v for the UV treated wastewater. There was no significant difference between LC50’s for the UV streams when comparing the coefficient of variance (CV) for the LC50’s. Similarly, on April 11th, mortality was noted (LC50 > 100%) in the lp-li and mp-hi UV effluents and an LC50 of 91.6% was generated for the lp-hi UV effluent stream. The LC50 for the chlorinated wastewater (18% v/v) during both the above mentioned sampling periods was significantly lower (when comparing CV’s) than the UV treated effluent. 7-10 Toxicity to Daphnia magna LC50 data expressed as percentage effluent by volume (%, v/v) and LT50 data expressed in hours are presented below in Table 7-11. Table 7-11: Toxicity to Daphnia magna LC50 is Expressed as % v/v Effluent. LT50 is Expressed in Hours. Effluent Stream LC50 (%) Date Chlorinated Lp-Li Lp-Hi Mp-Hi April 03, 2001 0.52 (LT50) >96 hr (LT50) >96 hr (LT50) ND May 29, 2001 8.8 >100 >100 ND July 10, 2001 23.9 >100 >100 >100 August 27, 2001 <6 >100 >100 ND October 11, 2001 18.0 >100 >100 ND March 08, 2002 4.24 >100 >100 ND March 14, 2002 <6 >100 >100 ND March 22, 2002 3.4 >100 >100 ND April 04, 2002 3.2 >100 >100 >100 April 11, 2002 10.5 >100 >100 >100 April 18, 2002 7.8 >100 >100 >100 May 21, 2002 8.8 >100 >100 >100 May 23, 2002 <6 >100 >100 >100 June 04, 2002 17.0 >100 >100 ND June 06, 2002 4.7 >100 >100 >100 Single concentration tests indicated that only the chlorine treated effluent was toxic to Daphnia, with an LT50 of 0.53 hours. Similar to the trout tests, all chlorinated wastewater samples were toxic to Daphnia with LC50’s below the 50% dilution level. Over the sampling period (April 2001 to June 2002) LC50s for chlorine treated effluents ranged from 3.2% to 23.9% with an average LC50 of 10.2%. LC50s could not be generated for three of the toxicity tests (i.e., reported LC50 <6%) and therefore were not included in the calculation for the mean. No toxicity to Daphnia was observed in effluent samples from the UV pilot systems. 7-11 SUMMARY OF RESULTS Operation The primary O&M requirement in UV disinfection is lamp cleaning. In this study, lamp cleaning was successful in restoring the measured UV intensity. The mp-hi system required frequent lamp cleaning and troubleshooting. This may be because the mp-hi unit operates at a significantly higher lamp temperature than the two low pressure units, which facilitates scale formation. The relatively high hardness and iron content of the wastewater may have contributed to the lamp cleaning frequency. In addition, the troubleshooting needs may have been because the mp-hi system used was an experimental unit. The use of automatic cleaning equipment would greatly facilitate lamp maintenance. Water Quality The surprising water quality result in this study was the correlation between total iron and TSS. This correlation may be explained in two ways. First, the plant influent TSS may have a constant iron content of about 6 - 7%. Second, dosing of ferric salts in the plant for phosphate control may be tied to TSS in the plant influent. Due to the correlation between iron and TSS, it is difficult to separate the effects of TSS and iron on system performance and maintenance. Effluent Toxicity A total of 49 samples were collected over a 14-month period and tested for their acute toxicity to rainbow trout and Daphnia magna. Table 7-12 summarizes the number of toxic events (i.e., LC50 < 100% v/v) for each species tested, in each wastewater treatment stream. Table 7-12: Toxic Events in Wastewater Streams at the Southtowns WWTP During the Operation of the Pilot UV Treatment Systems Toxic Events Toxic Events Rainbow Trout Daphnia magna 14/14 14/14 Medium Pressure-High Intensity UV Treatment 1/7 0/7 Low Pressure-High Intensity UV Treatment 2/14 0/14 Low Pressure-Low Intensity UV Treatment 1/14 0/14 Wastewater Disinfectant Chlorination During all sampling events (n=14) the chlorine treated wastewater was toxic (i.e., LC50 < 100% v/v) to rainbow trout and Daphnia magna. No acute toxicity to Daphnia magna was seen in any of the UV treated 7-12 streams during the same period. For rainbow trout tests, all UV treated effluents had at least one toxic event during the sampling period. Two samples from the lp-hi treated stream were toxic to rainbow trout. The data suggests that, when compared to chlorine treatment of the Southtowns WWTP effluent, UV treatment significantly reduces whole effluent toxicity to rainbow trout and daphnia magna. The toxicity noted in some of the UV treated samples tested using rainbow trout could not be attributed to any specific cause, and may be a result of elevated ammonia levels in the effluent during the sampling times. Overall, the results suggest that there are real ecotoxicological advantages to using UV in place of chlorination for the disinfection of municipal wastewater, unless dechlorination is practiced to mitigate residual chlorine in treatment plant effluent. Disinfection and Operating UV Doses All three systems exhibited tailing at log kills of fecal coliform greater than about 2 (99%). This is unfortunate, because higher log kills (2.7 - 2.9) are required to achieve an effluent of 200 MPN/100 mL based on fecal coliform concentrations in the UV reactor influent. Delivered UV doses for each lamp technology are summarized in Table 7-13. The delivered doses are based on the average influent fecal coliform concentration for each unit. Since the average influent fecal coliform concentrations were larger for the mp-hi system, this analysis may seem to unfairly penalize the mp-hi system. However, the penalty is small, since the log kill requirements are similar and the scatter in Figures 7-25 through 7-28 is large. Table 7-13: Summary of Delivered UV Doses System Log Kill Required Recommended Dose 2 (in mW-s/cm ) Tailing dose Lp-li 2.7 3 Lp-hi 2.8 4.5 Mp-hi Factors Affecting dose, %T * 2.9 8 (5) dose, system influent 2 * UV dose is 5 mW-s/cm when TSS is less than 20 mg/L In general, dose was a better predictor of disinfection performance and tailing than system influent (bioclarifier vs. filter effluent), TSS (data with TSS greater than 20 mg/L vs. data with TSS less than 20 mg/L), iron (data with iron greater than 2.0 mg/L vs. data with iron less than 2.0 mg/L), or %T (data with %T greater than 55% mg/L vs. data with %T less than 55%). 7-13 The differences in required doses between the three test systems were not unexpected. Recall from Section 2 that the lamps produce different intensities in the germicidal range. The required doses are expected to be related to intensities in the germicidal range. Intensities were measured using a radiometer sensitive to the germicidal range. Thus, the required doses between the three test systems are expected to be different. As noted previously, delivered UV doses were calculated based on the UV radiometer readings, which were taken at the surface of the reactor. To calculate the recommended operating UV dose, the delivered UV dose was adjusted to incorporate the transmittance of the fluid, intensity at the end of a lamp’s life and lamp fouling. The %T for the low pressure systems and the mp-hi system was about 50%. Lamps are often considered to be at the end of their useful life when lamp intensity is reduced to about 70% of original strength. During this study, lamp cleaning was generally required every 10 – 25 days. Typically, lp-li lamps require manual cleaning while the lp-hi and mp-hi lamps will be equipped with automatic cleaning system. For the purpose of this study, the lp-li system would be cleaned when lamp capacity is reduced to 70% and, because of the automatic cleaning, the lp-hi and mp-hi systems would be cleaned when lamp capacity is reduced to 90%. In addition, a safety factor of 2 was applied to account for lamp/ballast failure and to allow for variations in treated wastewater quality. The estimated operating UV dose required at the Southtowns WWTP for each lamp technology is summarized in Table 7-14. Note that the mp-hi system is based on a delivered dose of 5 mW-s/cm2. The filters are currently being replaced at the Southtowns WWTP; therefore, the influent solids are anticipated to be less than 20 mg/L. Table 7-14: Summary of Estimated Operating UV Doses System Log Kill Required Estimated Dose (in mW-s/cm2) Lp-li 2.7 26 Lp-hi 2.8 30 Mp-hi 2.9 32 7-14 Section 8 UV FACILITY IMPLEMENTATION AND COST ANALYSIS One of the project objectives was to perform a life cycle cost analysis for using UV irradiation in lieu of chlorine for disinfection of Southtowns WWTP effluent. Conceptual installation and operating and maintenance (O&M) costs were estimated for the following four alternatives: x Alternative 1 - Chlorination/dechlorination x Alternative 2 - UV disinfection using lp-li technology x Alternative 3 - UV disinfection using lp-hi technology x Alternative 4 - UV disinfection using mp-hi technology The evaluation was based on the anticipated upgrade of the Southtowns WWTP to an 18 mgd average flow and 42 mgd peak flow. Disinfection should be sufficient to maintain a fecal coliform discharge limit of 200 MPN/100 mL. This WWTP upgrade is anticipated to require replacement of the existing chlorination facilities and installation of a dechlorination system. Only WWTP effluent flow was considered for this evaluation. Flow from the overflow retention facility undergoes only primary treatment and likely would not be conducive to UV irradiation because of the low transmittance and large amount of particles in the wastewater stream. SOUTHTOWNS WWTP DISINFECTION ALTERNATIVES Alternative 1 - Chlorination/Dechlorination The ECDEP previously developed the cost for implementing new chlorination/dechlorination facilities during the preliminary design for the Southtowns WWTP upgrade (Stearns & Wheler, 2003). The chlorination/dechlorination alternative presented herein is based on the recommendations of the preliminary design for the Southtowns WWTP upgrade. Under this alternative, the existing chlorine gas feed system would be replaced by sodium hypochlorite facilities for disinfection and a sodium bisulfite feed system for dechlorination. Sodium hypochlorite was considered because it does not pose the same health and safety risks as chlorine gas. A typical sodium hypochlorite or sodium bisulfite system consists of storage tanks, metering pumps and feed system controls. The existing chlorine storage area and chlorinator room (see Figure 4-2 for location) would be reconfigured to install the sodium hypochlorite and sodium bisulfite facilities. Therefore, a new building 8-1 would not be required. However, structural modifications would be required to handle increased building loads. Electrical, heating and ventilation work would be required to upgrade the facilities. In addition, a chemical transfer station would need to be constructed in accordance with chemical bulk storage regulations. The projected future average chlorine use at the Southtowns WWTP is expected to be 183,000 pounds per year or, based on a 12% solution, 183,000 gallons per year of sodium hypochlorite. Three 5,300-gallon fiberglass reinforced plastic tanks would be used to provide a 30-day storage capacity; secondary containment would be provided to contain tank spills. Peristaltic pumps would be used to feed sodium hypochlorite to the filtered water, the plant service water system and to the ORF influent and effluent. Two 2,100 gallons per day (gpd) pumps would be used for disinfecting WWTP effluent and one 1,000 gpd pump would be used for the plant service water. It was anticipated that a chlorine residual of 2 mg/L in the WWTP effluent would need to be neutralized using 3.2 mg/L of sodium bisulfite. Dechlorination of the ORF effluent would not be expected. Based on an average flow of 18 mgd, approximately 50,400 gallons per year of sodium bisulfite (160,000 pounds/year active ingredient) would be required. Two, 2,300-gallon tanks would be used to provide a 30 day storage capacity. Two 350 gpd peristaltic pumps would be used to pump the sodium bisulfite. Alternative 2 - Low Pressure-Low Intensity UV System Chlorine contact time at the Southtowns WWTP is provided within the existing outfall to Lake Erie. Therefore, unlike many WWTPs, the plant does not have a chlorine contact tank. To allow UV disinfection at the Southtowns WWTP, a portion of the existing outfall pipe would need to be removed and replaced with a UV disinfection chamber as shown on Figure 8-1. The outfall pipe between Chamber No 4 and the UV disinfection chamber would be removed and a new pipe installed at greater depth. The UV disinfection chamber would have an effluent weir so that the lamps are submerged regardless of flow rate. The weir would be sized to minimize headloss between the chamber and the effluent pumps and minimize fluctuations in water surface elevation as flow increases and decreases. Based on a cursory review of existing hydraulic calculations for the WWTP outfall, this approach appears potentially feasible. A detailed hydraulics analysis would be required to confirm weir height and width, head loss through the UV system and outfall capacity. The UV disinfection chamber would measure approximately 40 ft. wide x 30 ft. long x 9 ft. feet and contain four channels, and would be constructed of reinforced concrete. Baffles would be provided as required to maintain plug flow conditions. The chamber also would be furnished with removable grating, handrails, an acid resistant cleaning basin and a crane. Electrical switchgear and instrumentation and 8-2 controls would be contained in a new brick and block control building; the control building would be located adjacent to the UV disinfection chamber. Some site work would be required to modify the entrance area to the WWTP. Based on the data presented in Section 7, an lp-li system at the Southtowns WWTP would require a minimum dose of 26 mWs/cm2 at a peak design flow of 42 mgd. The minimum UV transmittance would be 60% and maximum TSS would be 20 mg/L. The UV disinfection system would have a total of about 2,160 lamps. Lamp output would be controlled by turning lamps on and off based on dose requirement and flow. Instrumentation for the unit would consist of four flow meters, two UV transmittance samplers, four UV intensity meters and a control panel. The control panel would provide remote monitoring of the UV system. A programmable logic controller (PLC) would be included in the controls to convert flow and UV transmittance data to lamp output requirement. Controls would be incorporated into the Southtowns WWTP status control and data acquisition (SCADA) system. The UV lamps would be manually cleaned by removing each module with a crane and soaking the modules in a cleaning basin filled with a dilute acid solution. Based on pilot study results, this procedure would be performed monthly for each module. Lamp replacement would also be performed manually by removing the modules with a crane and replacing each lamp. Alternative 3 - Low Pressure-High Intensity UV System As with the lp-li system, installation of an lp-hi system would require a portion of the existing outfall pipe would need to be removed and replaced with a UV disinfection chamber as shown on Figure 8-1. However, the channel size would be significantly smaller because fewer lamps would be required. The outfall pipe between Chamber No 4 and the UV disinfection chamber would be removed and a new pipe installed at greater depth. The UV disinfection chamber would have an effluent weir so that the lamps are submerged regardless of flow rate. The weir would be sized to minimize headloss between the chamber and the effluent pumps and minimize fluctuations in water surface elevation as flow increases and decreases. A detailed hydraulics analysis would be required to confirm weir height and width, head loss through the UV system and outfall capacity. The UV disinfection chamber would measure approximately 20 ft. wide x 30 ft. long x 9 ft. deep, contain 2 channels, and would be constructed of reinforced concrete. Baffles would be provided as required to maintain plug flow conditions. The chamber also would be furnished with removable grating, handrails, sluice gates, stairs and a crane. Electrical switchgear and instrumentation and controls would be contained in a new brick and block control building; the control building would be located adjacent to the UV disinfection chamber. Some site work would be required to modify the entrance area to the WWTP. 8-3 Based on the data presented in Section 7, an lp-li system at the Southtowns WWTP would require a minimum dose of 30 mWs/cm2 at a peak design flow of 42 mgd. The minimum UV transmittance would be 60% (after filter upgrades) and maximum TSS would be 20 mg/L. The UV disinfection system would have a total of 20 modules divided equally between the two channels. Each module would contain 18 lamps; therefore, the lp-hi system would have 360 lamps. The lamps would be placed inside quartz sleeves. The lp-hi system would be equipped with an automatic mechanical cleaning system to remove scale and debris buildup on the quartz sleeves. UV modules would be removed by a crane to facilitate lamp replacement. Lamp output would be controlled by electronic ballasts to permit lamp output to be varied based on flow and disinfection need to optimize UV output, which would minimize power use. Power (480 volt) would be conveyed to the lamps via power distribution centers. Instrumentation for the unit would consist of two flow meters, water level sensors, two level controllers, a UV transmittance sampler, UV intensity meters and a control panel. The control panel would provide remote monitoring of the UV system. A programmable logic controller (PLC) would be included in the controls to convert flow and UV transmittance data to lamp output requirement. Controls would be incorporated into the Southtowns WWTP status control and data acquisition (SCADA) system. Alternative 4 - Medium Pressure-High Intensity UV System Similar to the other two UV systems, installation of an mp-hi system at the Southtowns WWTP would involve removal of part of the existing outfall pipe and replacement with a UV disinfection chamber. In addition, the outfall pipe between Chamber No 4 and the UV disinfection chamber would be removed and a new pipe installed at greater depth. The UV disinfection chamber would have an effluent weir so that the lamps are submerged regardless of flow rate. The weir would be sized to minimize headloss between the chamber and the effluent pumps and minimize fluctuations in water surface elevation as flow increases and decreases. A detailed hydraulics analysis would be required to confirm weir height and width, head loss through the UV system and outfall capacity. The mp-hi UV disinfection chamber would measure approximately 6 ft. wide x 38 ft. long x 17 ft. deep, contain a single channel, and would be constructed of reinforced concrete. Baffles would be provided as required to maintain plug flow conditions. The chamber also would be furnished with removable grating, handrails, sluice gates and stairs. Electrical switchgear and instrumentation and controls would be contained in a new brick and block control building; the control building would be located adjacent to the UV disinfection chamber. Some site work would be required to modify the entrance area to the WWTP. 8-4 Based on the data presented in Section 7, an mp-li system at the Southtowns WWTP would require a minimum dose of 32 mWs/cm2 at a peak design flow of 42 mgd. The minimum UV transmittance would be 60% and maximum TSS would be 20 mg/L. The UV disinfection system would have a total of two banks divided into four modules per bank. Each module would contain 22 lamps placed in quartz sleeves; therefore, the mp-hi system would have 176 lamps, which about half the number required in an lp-hi system. The mp-hi system would be equipped with an automatic mechanical/chemical cleaning system to remove scale and debris buildup on the quartz sleeves. UV modules would be removed by a lifting device to facilitate lamp replacement. Lamp output would be controlled by electronic ballasts to permit lamp output to be varied based on flow and disinfection need to optimize UV output and minimize energy use. Power (480 volt) would be conveyed to the lamps through two power distribution centers. Instrumentation for the unit would consist of a flow meter, level controller, an UV transmittance sampler, a UV intensity meter and a control panel. The control panel would provide remote monitoring of the UV system. A PLC would be included in the controls to convert flow and UV transmittance data to lamp output requirement. Controls would be incorporated into the Southtowns WWTP status control and data acquisition (SCADA) system. COST ANALYSIS OF SOUTHTOWNS DISINFECTION ALTERNATIVES Several criteria were considered for the life cycle cost analysis: x Capital construction costs x Power cost x Lamp replacement x Quartz sleeve cleaning x Other O&M Costs x Personnel requirements x Chlorine and sodium bisulfite use Estimated capital costs are based on providing facilities capable of handling WWTP peak flow of 42 mgd. O&M costs are based on the projected future Southtowns WWTP average flow of 18 mgd. A summary of the cost analysis is presented in Table 8-1 and described as follows. Calculations used for the cost analysis are presented in Appendix D. 8-5 Table 8-1: Life Cycle Cost (2004 Dollars) Analysis for UV Disinfection Alternatives at a WWTP Production Rate of 18 MGD Cost Component Personnel (Operations) Power Cost (1) Alternative 1 Alternative 2 Alternative 3 Alternative 4 ($/year) ($/year) ($/year) ($/year) $37,000 $56,000 $37,000 $37,000 $4,000 $41,000 $31,000 $127,000 Lamp Replacement Cost - $30,000 $27,000 $17,000 UV Quartz Sleeve Cleaning Cost - $35,000 $3,000 $1,000 Sodium Hypochlorite and Sodium $123,000 Bisulfite Cost - - - Miscellaneous O&M $10,000 $13,000 $6,000 $4,000 Total O&M Cost $174,000 $175,000 $104,000 $186,000 $4,280,000 $3,350,000 $3,380,000 $373,000 $292,000 $295,000 $6,670,000 $4,760,000 $5,910,000 $309,000 (3) $548,000 $396,000 $481,000 $0.047 $0.084 $0.060 $0.073 Construction Cost (6) $1,150,000 Annualized Construction Cost Total Present Worth (4) (5) $3,900,000 Total Annual Cost (4) Normalized Cost ($/1000 gal) $135,000 (3) (2) (3) (1) Electricity costs include power consumption and monthly demand charges (2) Based on an average flow rate of 18 mgd (3) Includes the present worth of replacing chemical storage tanks, pumps and valves after 10 years (4) Based on 6% interest over a 20-year period (5) Based on 4% inflation over 20-year period (6) Lump sum, not annual Construction Costs The materials, installation and construction costs were developed from a variety of sources, including: x Manufacturer’s cost data x 2004 Means Construction Cost Data x Experience from similar projects Estimated capital costs include an allowance for engineering and administrative fees (15%) and planning level contingencies (35%). 8-6 At $1,150,000, the chlorination/dechlorination alternative had a significantly lower order-of-magnitude construction cost than the three UV alternatives. However, it is important to note that the Southtowns WWTP does not have an existing chlorine contact chamber. About half of the estimated construction cost for the lp-hi and mp-hi systems was associated with modifying the existing outfall pipe and installation of a UV disinfection chamber. UV systems are typically compact enough to fit within existing chlorine contact chambers, which reduces installation costs. Therefore, the capital costs for a UV system at the Southtowns WWTP would have been substantially reduced if a chlorine contact chamber were present. A comparison of the three UV systems shows that the lp-hi and mp-hi systems have similar estimated construction costs, while the lp-li system has a significantly greater estimated construction cost ($4,280,000). The primarily reason for this is that the lp-li system requires almost 6 times and 12 times the lamps as needed for the lp-hi and mp-hi systems, respectively, as well as the much larger disinfection chamber and electrical installation needs. Personnel (Operations) Requirements The personnel requirements were evaluated based on two separate components: operations and maintenance. The operations component includes labor hours to operate and calibrate the UV and chlorine systems. The maintenance component is included with the individual maintenance items (e.g., lamp replacement, miscellaneous O&M). For the chlorination/dechlorination, lp-hi and mp-hi options, it is anticipated that an average of 16 labor hours per week would be required for system operation, which is approximately $37,000 per year. Because of the size of the lp-li system, about 50% more labor effort, or $56,000/year, would be anticipated for system operation. Power Use and Cost Based on discussions with plant personnel, the Southtowns WWTP pays about $0.060 per kilowatt-hour (kWh) for electricity in addition to a demand charge of approximately $12.70 per kW. The power requirements for the existing chlorine system is minimal, and, therefore, not monitored at the WWTP. The new sodium hypochlorite and sodium bisulfite systems are also expected to have comparatively small energy use requirements. An estimated value of 6 KW is used for the chlorination/dechlorination alternative power requirements. Using the current rates, the annual electrical cost for the chlorine system is approximately $4,000 per year. Based on information provided by UV disinfection equipment manufacturers, of the three UV systems, the lp-hi technology would have the lowest cost and the mp-hi system would have the highest cost. At an average flow of 18 mgd, the power draw for the lp-li, lp-hi and mp-hi systems would 60 kW, 45 kW and 8-7 190 kW, respectively. This translates into annual cost of approximately $41,000, $31,000, and $127,000 for the lp-li, lp-hi and mp-hi systems, respectively. The significantly higher power cost for the mp-hi system results from the lamps emitting polychromatic light, whereas the two low pressure systems emit monochromatic light at the germicidal wavelength for microorganisms. Based on manufacturer’s information, the lp-li lamps are slightly less efficient than the lp-hi lamps, and are not equipped with electronic ballast that would allow optimization of UV output. In terms of percentage of estimated annual O&M costs, power use for the lp-li system represents about 24% of total O&M cost. Power use for the lp-hi and mp-hi systems are about 30% and 68%, respectively of the total O&M cost. Lamp Replacement Costs The largest maintenance cost for the UV alternatives is expected to be lamp replacement. Lamp replacement is performed when lamp output decreases by a manufacturer-determined percentage (typically 65% to 75% of full output). Lamp replacement typically involves removing a module of lamps and replacing all the lamps within the module. Based on UV systems at other WWTPs and pilot study results, lamp replacement typically requires one-half hour per lamp, regardless of lamp type (labor cost included in personnel costs). It was estimated that approximately 70 mp-hi lamps would require replacement annually, while the lp-li and lp-hi systems would, respectively need about 530 and 130 lamps replaced annually. Including labor, lamp replacement for the lp-li, lp-hi and mp-hi systems would cost approximately $30,000, $27,000, and $17,000 per year, respectively. Quartz Sleeve Cleaning The cleaning effort for the lp-hi and mp-hi systems have been greatly facilitated by use of automatic cleaning systems. These two systems require cleaning solution and periodic wiper ring replacement. It is estimated that the total lamps cleaning cost for the lp-hi and mp-hi systems are about $3,000 per year and $1,000 per year, respectively. The quartz sleeves for the lp-li system must be cleaned manually. A module of lp-li lamps are removed from the channel and placed in a tank containing a dilute acid solution. The labor required for this task is approximately 4 hours per module per month. The estimated quartz sleeve cleaning cost for the lp-li system is approximately $35,000 per year. 8-8 Sodium Hypochlorite and Sodium Bisulfite Costs The Southtowns WWTP is estimated to use approximately 183,000 and 50,400 gallons/year of sodium hypochlorite and sodium bisulfite under Alternative 1, respectively. A Western New York chemical supplier quoted a unit cost of $0.45/gallon for sodium hypochlorite and $0.73/gallon for sodium bisulfite. This results in total annual chemical use cost of about $123,000 for the chlorination/dechlorination alternative to disinfect Southtowns WWTP effluent. Miscellaneous O&M Costs In addition to cost for lamp replacement, quartz sleeve cleaning and chemical use, there are other costs for the routine maintenance of UV and chlorination/dechlorination systems. These costs include changing ballasts and quartz sleeves, labor to fill chemical storage tanks, and replacement of minor parts (e.g., valves, pump tubing, etc.). In terms of overall operations, these costs are estimated to account for about 5% of the total O&M cost. Life Cycle Cost Comparison The life cycle cost analysis for the four alternatives presented in Table 8-1 involved comparison of annualized costs, total present worth and normalized costs. Annualized capital costs were based on a 6% interest rate and a 20-year return period. The total present work was based on a 4% inflation rate over 20 years. Normalized costs are the total annual costs converted to treatment costs in dollars per thousand gallons disinfected, based on an average WWTP flow of 18.0 mgd. Of the three UV alternatives evaluated for the Southtowns WWTP, the lp-hi system had the lowest estimated annual cost ($396,000), total present worth ($4,760,000) and normalized cost ($0.060/1,000 gal). The lp-hi and mp-hi had similar estimated construction costs, but the lp-hi system had almost a 45% lower estimated O&M cost than the mp-hi system. The difference in O&M costs was because the mp-hi system has significantly higher power costs than the lp-hi system ($127,000 per year versus $31,000 per year). Based on the cost analysis, the lp-li system is not considered cost effective at large flow rates because of the large number of lamps required. The chlorination/dechlorination alternative has the lowest overall estimated annual cost ($309,000), total present worth ($3,900,000) and normalized ($0.047/1,000 gal) for the Southtowns WWTP. This is followed by the lp-hi alternative. The primary reason why chlorination/dechlorination had the lowest cost was because of its significantly lower estimated capital cost ($1,150,000 for chlorination/dechlorination and $3,350,000). The difference in capital cost offset the estimated 40% O&M cost savings that would be 8-9 realized using the lp-hi system (chlorination/dechlorination = $174,000 per year, lp-hi system = $104,000 per year). As noted previously, the Southtowns WWTP does not have an existing chlorine contact chamber; the outfall pipe is of sufficient length to currently meet chlorine contact time requirements. About half of the $3,350,000 estimated construction cost for the lp-hi system (next lowest cost alternative) was associated with modifying a significant portion of the plant’s 66-inch diameter outfall to accommodate a UV disinfection chamber. One of the key advantages for UV disinfection is its ability to be retrofitted into existing chlorine contact tanks; this advantage cannot be realized at the Southtowns WWTP. If the plant had an existing chlorine contact chamber, the capital cost for the lp-hi system could be reduced by up to $1,600,000. This reduction likely would have made the lp-hi system competitive, if not lower in cost, than the chlorination/dechlorination alternative. Based on this perspective, it appears that UV disinfection is a cost competitive alternative to chlorination/dechlorination at WWTPs with existing chlorine contact chambers. UV EQUIPMENT AND O&M COSTS FOR VARIOUS WWTP SIZES As part of the evaluation, order of magnitude costs associated with purchasing and operating UV equipment were determined for various WWTP capacities. The WWTP capacities evaluated are as follows: x Average Flow = 0.5 mgd, Peak Flow = 1.25 mgd x Average Flow = 2.5 mgd, Peak Flow = 6.25 mgd x Average Flow = 7.5 mgd, Peak Flow = 19 mgd x Average Flow = 20 mgd, Peak Flow = 50 mgd x Average Flow = 50 mgd, Peak Flow = 125 mgd The results of the costs analysis are based on doses of 26, 30 and 32 mWs/cm2 for the lp-li, lp-hi and mp-hi systems, respectively. The minimum UV transmittance would be 60% and maximum TSS would be 20 mg/L. Wastewater quality and performance will vary and costs should be verified on a site-specific basis. A comparison of the estimated order-of-magnitude equipment cost for the three UV alternatives are presented in Table 8-2. UV systems manufacturers were used as the basis for estimating order-of magnitude UV equipment and O&M costs. Equipment costs are based on peak flow rates. The equipment includes lamps, ballasts, instrumentation and controls, cleaning system and quartz sleeves. The presented costs do not include construction costs (e.g., installation, modifications to existing facilities, electrical service, etc.), as these are site specific. 8-10 Table 8-2: Comparison of Estimated Equipment Costs WWTP Average Flow (mgd) Alternative 0.5 2.5 UV disinfection using lp-li technology $45,000 $140,000 UV disinfection using lp-hi technology $60,000 $220,000 UV disinfection using mp-hi technology - - 7.5 20 50 $500,000 $1,090,000 $2,500,000 $530,000 $1,020,000 $2,160,000 Table 8-3 presents a comparison of estimated annual costs for the three lamp technologies. The O&M costs include electrical power, personnel, lamp replacement, and quartz sleeve cleaning. O&M costs are based on average flow conditions. Estimated annual equipment costs are based on a 6% interest rate and a 20-year return period. Table 8-4 shows a comparison of the estimated total present worth of each UV technology based on 4% inflation over a 20-year return period. In addition, the total annual costs were normalized in terms of $/1,000 gallons of wastewater treated during average WWTP flow conditions. Estimated normalized costs are summarized in Table 8-5. Note that lp-li systems are not typically provided for flows greater than 2-3 mgd because of the number of lamps required. Table 8-3: Comparison of Estimated Annual Costs ($/year) WWTP Average Flow (mgd) Alternative 0.5 2.5 7.5 20 50 - - - UV disinfection using lp-li technology Estimated Annual Equipment Cost $4,000 $13,000 Estimated O&M Cost $7,300 $25,000 Total Estimated Annual Cost $11,300 $37,000 Estimated Annual Equipment Cost $5,200 $19,000 $44,000 $95,000 $220,000 Estimated O&M Cost $4,400 $15,000 $44,000 $116,000 $289,000 Total Estimated Annual Cost $9,600 $34,000 $88,000 $211,000 $509,000 $46,000 $89,000 $188,000 $78,000 $207,000 $517,000 $124,000 $296,000 $705,000 UV disinfection using lp-hi technology UV disinfection using mp-hi technology Estimated Annual Equipment Cost Estimated O&M Cost - Total Estimated Annual Cost 8-11 - Table 8-4: Comparison of Estimated Present Worth WWTP Average Flow (mgd) Alternative 0.5 2.5 7.5 20 50 - - - UV disinfection using lp-li technology Estimated Equipment Cost $45,000 $140,000 Estimated O&M Present Worth $99,000 $340,000 Total Estimated Present Worth $144,000 $480,000 Estimated Equipment Cost $60,000 $220,000 $500,000 $1,090,000 $2,500,000 Estimated O&M Present Worth $60,000 $204,000 $598,000 $1,577,000 $3,928,000 Total Estimated Present Worth $120,000 $424,000 $1,098,000 $2,667,000 $6,448,000 $530,000 $1,020,000 $2,160,000 $1,060,000 $2,813,000 $7,026,000 $1,590,000 $3,833,000 $9,186,000 UV disinfection using lp-hi technology UV disinfection using mp-hi technology Estimated Equipment Cost Estimated O&M Present Worth - - Total Estimated Present Worth Table 8-5: Comparison of Estimated Normalized Equipment and O&M Costs ($/1,000 gal) WWTP Average Flow (mgd) Alternative 0.5 2.5 7.5 20 50 Estimated Annual Equipment Cost $0.022 $0.014 Estimated O&M Cost $0.040 $0.027 - - - Total Estimated Annual Cost $0.062 $0.041 Estimated Annual Equipment Cost $0.028 $0.021 $0.016 $0.013 $0.012 Estimated O&M Cost $0.024 $0.016 $0.016 $0.016 $0.016 Total Estimated Annual Cost $0.052 $0.037 $0.032 $0.029 $0.028 $0.017 $0.012 $0.010 $0.028 $0.028 $0.028 $0.045 $0.041 $0.039 UV disinfection using lp-li technology UV disinfection using lp-hi technology UV disinfection using mp-hi technology Estimated Annual Equipment Cost Estimated O&M Cost - - Total Estimated Annual Cost 8-12 Section 9 CONCLUSIONS AND RECOMMENDATIONS CONCLUSIONS The goal of this demonstration was to compare the long-term benefits and costs associated with three different UV disinfection technologies at the Southtowns WWTP with respect to chlorination/ dechlorination using pilot-scale treatability testing. The three UV systems evaluated used: 1) low pressurelow intensity lamps, 2) low pressure-high intensity lamps, and 3) medium pressure-high intensity lamps. Based on the evaluation results, findings and conclusions include the following: PILOT PLANT HYDRAULICS x The tracer tests showed that the UV pilot-units nominal HRT appears to be a reasonable estimate of system HRT. x The reactors used in this study show an intermediate amount of dispersion, which is reasonably close to plug flow conditions. DISINFECTION RESULTS AND OPERATING DOSE x Fecal coliform log kills of 2.7 – 2.9 were required to achieve an effluent of 200 most probable number per 100 milliliters (MPN/100 mL) based on average influent fecal coliform concentrations in the UV reactors. x UV was shown to effectively disinfect Southtowns WWTP filtered water and bioclarifier effluent to meet a fecal coliform discharge limit of 200 MPN/100 mL. The estimated UV operating dose to achieve the required log kill for the lp-li, lp-hi and mp-hi systems were 26 mW-s/cm2, 30 mW s/cm2, and 32 mW-s/cm2, respectively. x The difference in required doses between the three test systems was not unexpected. The required doses are expected to be related to intensities in the germicidal range. The lp-li lamps emit the greatest percentage of UV light in the germicidal range, while the mp-hi lamps emit the lowest percentage. 9-1 IMPACT OF WATER QUALITY AND TAILING ON UV PERFORMANCE x Tailing is a phenomenon in which significant increases of UV dose result in little additional inactivation of microorganisms. x All three UV systems exhibited tailing at log kills of fecal coliform greater than about 2 (99%). However, data showed log kills of 2.7 – 2.9 are required to achieve an effluent of 200 MPN/100 mL in Southtowns WWTP effluent. Therefore, tailing would reduce the efficiency of UV disinfection. Five factors were investigated for their effects on tailing: dose, system influent (bioclarifier vs. filter effluent), total suspended solids (TSS), iron and percent transmittance (%T). x The bioclarifier effluent and filter effluent had similar TSS values, which was unexpected. One possible reason for this occurrence is the age of the filter media at the Southtowns WWTP (20 years). Subsequent to the demonstration, the ECDEP commenced implementation of modifications to improve filtration improvements and capacity. x The influent for all three systems exhibited %T values of less than 65% for every sample regardless of source (bioclarifier or filter effluent). Thus, the water quality was poor (as indicated by %T) with regard to the potential for UV disinfection. No discernable difference in UV performance due to type of influent was observed during this study. It is noteworthy that laboratory filtration raised the %T to above 65% in all but four samples for the three UV systems. x The filter effluent had slightly better water quality on average in terms of %T and lab-filtered %T. The effects of filtration appear to show more strongly as removal of UV-absorbing substances (increasing %T) rather than removal of solids only. This suggests that the planned filter media replacement would improve %T, thus better UV disinfection performance would be expected using filter effluent. These conclusions are tentative because the water quality of bioclarifier effluent and filter effluent were not measured at the same time. x The surprising water quality result in this study was the correlation between total iron and TSS. This correlation may be explained in two ways. First, the plant influent TSS may have a constant iron content of between 6% and 7%. Second, dosing of ferric salts in the plant for phosphate control may be tied to TSS in the plant influent. Due to the correlation between iron and TSS, it is difficult to separate the effects of TSS and iron on system performance and maintenance. x In general, dose was a better predictor of disinfection performance and tailing than system influent (bioclarifier effluent vs. filter effluent), TSS (data with TSS greater than 20 mg/L vs. data with 9-2 TSS less than 20 mg/L), iron (data with iron greater than 2.0 mg/L vs. data with iron less than 2.0 mg/L), or %T (data with %T greater than 55% mg/L vs. data with %T less than 55%). EFFLUENT TOXICITY x During all sampling events, the chlorine treated wastewater was toxic to rainbow trout and Daphnia magna. No acute toxicity of Daphnia magna was seen in any of the UV treated effluents. Three out of 35 samples of UV treated effluent showed toxicity to rainbow trout; however, causes other than UV disinfection may have resulted in the toxic events. x The data suggests that, when compared to chlorine treatment of the Southtowns WWTP effluent, UV treatment significantly reduces whole effluent toxicity to rainbow trout and daphnia. This suggests that there are real ecotoxicological advantages to using UV in place of chlorination for the disinfection of municipal wastewater. PHOTOREACTIVATION x Secondary growth studies were conducted to determine whether apparently inactive coliforms actually were viable. The demonstration showed that neither photoreactivation, dark repair nor regrowth was significant during this project. OPERATION x The primary O&M requirement in UV disinfection for this demonstration was lamp cleaning. Increased fouling of the lamps resulted in reduced intensity transmitted to the microorganisms, thus reducing log kills. In this study, lamp cleaning was successful in restoring measured UV intensity. The mp-hi system required frequent lamp cleaning, likely because of its higher operating temperature. The use of automatic cleaning equipment would greatly facilitate lamp maintenance. COST ANALYSIS x Of the three UV alternatives evaluated for the Southtowns WWTP, the lp-hi system had the lowest annual cost ($396,000), total present worth ($4,760,000) and normalized cost ($0.060/1,000 gal). The lp-hi and mp-hi had similar estimated construction costs, but the lp-hi system had almost a 45% lower estimated O&M cost than the mp-hi system; power costs for the mp-hi system were estimated to be about four times higher than the lp-hi alternative. 9-3 x The lp-li system is not considered cost effective at the large flow rates experienced at the Southtowns WWTP because of the number of lamps required. The lp-li alternatives would require approximately 2,160 lamps, while the lp-hi system would need 360 lamps (6 times less) and the mp-hi alternative would need 176 lamps (12 times less). x The chlorination/dechlorination alternative had the lowest overall estimated annual cost ($309,000), total present worth ($3,900,000) and normalized ($0.047/1,000 gal) for the Southtowns WWTP. This is followed by the lp-hi alternative. The primary reason why chlorination/dechlorination had the lowest cost was because of its significantly lower estimated capital cost ($1,150,000 for chlorination/dechlorination and $3,350,000). The difference in capital cost offset the estimated 40% O&M cost savings that would be realized using the lp-hi system (chlorination/dechlorination = $174,000 per year, lp-hi system = $104,000 per year). x The Southtowns WWTP does not have an existing chlorine contact chamber; the outfall pipe is of sufficient length to currently meet chlorine contact time requirements. About half of the $3,350,000 estimated construction cost for the lp-hi system was associated with modifying a significant portion of the plant’s outfall to accommodate a UV disinfection chamber. One of the key advantages for UV disinfection is its ability to be retrofitted into existing chlorine contact tanks; this advantage cannot be realized at the Southtowns WWTP. If the plant had an existing chlorine contact chamber, the capital cost for the lp-hi system could be reduced by up to $1,600,000. This reduction likely would have made the lp-hi system competitive, if not lower in cost, than the chlorination/dechlorination alternative. Based on this perspective, it appears that UV disinfection is a cost competitive alternative to chlorination/dechlorination at WWTPs with existing chlorine contact chambers. RECOMMENDATIONS Based on the results of this demonstration, the following are recommended: x Wastewater utilities should consider implementing UV disinfection for WWTP effluent in lieu of chlorine, particularly where a treatment plant must implement dechlorination and uses an existing chlorine contact chamber. UV was shown to effectively disinfect Southtowns WWTP filtered water and bioclarifier effluent while mitigating the effluent toxicity concerns associated with residual chlorine. x Because of the variable nature of wastewater composition between communities, the required UV doses must be determined on a site-specific basis. Key parameters that must be accounted for include TSS, percent transmittance, iron and hardness. 9-4 x Selection of the most appropriate UV disinfection technology depends on several factors, including flow, existing WWTP configuration, discharge limitations, unit power cost and required UV dose. x Additional study is needed to better define the separate effects of TSS and iron on UV system performance and maintenance, particularly in WWTP that use ferrous compounds for phosphorus removal. x As the filter media ages, the effluent quality can deteriorate, especially TSS and % transmittance. Additional study is needed to determine the impact of aging filter media on UV disinfection performance. 9-5 REFERENCES Abu-ghararah, Ziad H. (1994). “Effect of Temperature on Kinetics of Wastewater Disinfection Using Ultraviolet Radiation.” Journal of Environmental Science and Health, 29, 585-603. Bitton, Gabriel. (1994). Wastewater Microbiology. Wiley-Liss, Inc., New York, NY. Blatchley III, Ernest R., Bastian, K. Chad, Duggirala, Ravi K., Alleman, James E., Moore, Mark, Schuerch, Peter. (1996). “Ultraviolet irradiation and chlorination/dechlorination for municipal wastewater disinfection: Assessment of performance limitations.” Water Environment Research, 68, 194-204. Braunstein, Jeffery L., Loge, Frank J., Tchobanoglous, George, Darby, Jeannie L. (1996). “Ultraviolet disinfection of filtered activated sludge effluent for reuse applications.” Water Environment Research, 68, 152-161. Chan, Y. Y. and Killick, E. G. (1995). “The effect of salinity, light and temperature in a disposal environment on the recovery of E. coli following exposure to ultraviolet radiation.” Water Research, 29 (5), 1373-1377. Chiu, K., Lyn, D. A., Savoye, P., and Blatchley III, E. R. (1999). “Integrated UV disinfection model based on particle tracking.” Journal of Environmental Engineering, 125 (1), 7-16. Darby, Jeannie L., Snider, Kile E., Tchobanoglous, George. (1993). “Ultraviolet disinfection for waste water reclamation and reuse subject to restrictive standards.” Water Environment Research, 65, 169-180. Environment Canada. 1990a. Biological test method: reference method for determining acute lethality of effluents to rainbow trout. Environmental Protection, Conservation and Protection, Environment Canada. Ottawa, Ontario, Reference Method EPS 1/RM/13. Environment Canada. 1990b. Biological test method: reference method for determining acute lethality of effluents to Daphnia magna. Environmental Protection, Conservation and Protection, Environment Canada. Ottawa, Ontario, Reference Method EPS 1/RM/14. Fahey, Richard J. (1990). “The UV Effect on Wastewater.” WATER/Engineering &Management, 137, 15-18. Fleishman, Stephen. (1996). “Ultraviolet Light.” The 1996 Grolier Multimedia Encyclopedia, Ver. 8.0. Grolier Electronic Publishing, Inc. Gulley, D.D., A.M. Boelter, and H.L. Bergman. 1989. Toxstat Release 3.2. University of Wyoming, Laramie, WY. Hanzon, B.D and Vigilia, R. “Two Experts Offer Practical Guidance in Designing and Operating Ultraviolet Disinfection Systems,” Water Environment and Technology, November 1999, pp. 35-42. Havelaar, A. H., Meulemans, C. C. E., Pot-Hogeboom, W. M., and Koster, J. (1990). “Inactivation of bateriophage MS2 in wastewater effluent with monochromatic and polychromatic ultraviolet light.” Water Research, 24 (11), 1387-1393. Ho, Chu-Fei H., Pitt, Paul, Mamais, Daniel, Chiu, Carolyn, and Jolisw, Domenéc. (1998). “Evaluation of UV disinfection systems for large-scale secondary effluent.” Water Environment Research, 70 (6), 1142 1150. Hunter, G. L., O’Brien, W. J., Hulsey, R. A., Carns, K. E., and Ehrhard, R. (1998). “Medium-pressure ultraviolet lamps and other systems are considered for wastewater application.” Water Environment & Technology, 6, 40-44. Infilco Degremont Inc. (1996). Aquaray® 40 VLS Ultraviolet Disinfection. Infilco Degremont Inc., Richmond, Virginia. Iranpour, Reza, and Magallanes, Alfredo. (1997). “Of: Ultraviolet disinfection of secondary wastewater effluents: Prediction of performance and design.” Water Environment Research, 69(1), 123-124. Iranpour, R., Garnas, G., Moghaddam, O., and Taebi, A. (1999). “Hydraulic effects on ultraviolet disinfection: Modification of reactor design.” Water Environment Research, 71(1), 114-118. Jacangelo, J., Darby, J., Loge, F., Tchobanoglous, G., Heath, M., Swaim, P. (1995). “Comparison of UV Irradiation to Chlorination: Guidance for Achieving Optimal UV Performance” Water Environment Research Foundation, 91-WWD-1. Job, G. D., Trinova, R., and Really, G. J. (1995). “Trials using a mobile ultraviolet disinfection system in south west water.” Journal of the Institute of Water and Environmental Management, 9 (June), 257-263. Johnson, J.D., and Jensen, J.N. (1986). “ THM and TOX formation: routes, rates and precursors.” J. AWWA, 78(4), 156-162. Larson, Richard A., and Berenbaum, May R. (1988). “Environmental phototoxicity: Solar ultraviolet radiation affects the toxicity of natural and man-made chemicals.” Environmental Science and Technology, 22, 354-360. Loge, Frank J., Emerick, Robert W., Heath, Mark, Jacangelo, Joseph, Tchobanoglous, George, Darby, Jeannie L. (1996). “Ultraviolet disinfection of secondary wastewater effluents: prediction of the performance and design.” Water Environment Research, 68, 900-916. Lin, Sheng H., and Yeh, Kuo L. (1993). “Looking to Treat Wastewater? Try Ozone: Ozone offers pluses in wastewater treatment.” Chemical Engineering, 100, 112-116. Lindenauer, Karl G., and Darby, Jeannie L. (1994). “Ultraviolet Disinfection of Wastewater: Effect of Dose on Subsequent Photoreactivation.” Water Research, 28, 805-817. Lyn, D. A., Chiu, K., and Blatchley III, E. R. (1999). “Numerical modeling of flow and disinfection in UV disinfection channels.” Journal of Environmental Engineering, 125 (1), 17-26. Mann, Melanie A., and Cramer, James A. (1992). “Disinfecting with ultraviolet radiation: retrofitting three North Carolina treatment plants.” Water Environment and Technology, 12, 40-45. Muller, Jennifer, Regional Sales Manager for Trojan Technologies, Inc. (July 14, 1999). Personal communication. Nieuwstad, Th. J., Havelaar A. H. , van Olphen, M. (1991). “Hydraulic and Microbiological Characterization of Reactors for Ultraviolet Disinfection of Secondary Wastewater Effluent.” Water Research, 25, 775-783. Oppenheimer, Joan A., Jacangelo, Joseph G., Laîné, Jean-Michel, Hoagland, John E. (1997). “Testing the equivalency of ultraviolet light and chlorine for disinfection of wastewater to reclamation standards.” Water Environment Research, 69, 14-24. Parker, Jason A., and Darby, Jeannie L. (1995). “Particle-associated coliform in secondary effluents: shielding from ultraviolet light disinfection.” Water Environment Research, 67, 1065-1075. Poe, Lissa B. (1995). “Chlorine Safety in Water and Wastewater Treatment.” Professional Safety, 40, 28 30. Qualls, Robert G., Dorfman, Mark H., and Johnson, J. Donald. (1989). “ Evaluation of the Efficiency of Ultraviolet Disinfection Systems.” Water Research, 23, 317-325. Sakamoto, Gail (1999). “Overview of Wastewater Disinfection.” Trojan Technologies, Inc. Stearns & Wheler, LLC, “Technical Memorandum – Erie County Department of Environment and Planning, Disinfection and Dechlorination Alternatives for Southtowns AWTF and Lackawanna STP,” August 1, 2003, S&W No. 20059. Stephan, C.E. 1977. Methods for calculating an LC50. p. 65-84 In: P.L. Mayer and J.L. Hamelink (eds.), Aquatic Toxicology and Hazard Evaluation. Amer. Soc. Testing and Materials, Philadelphia PA. ASTM STP 634. Stover, E.L., Haas, C.N., Rakness, K.L., and Scheible, O.K. (1986). EPA Design Manual: Municipal Wastewater Disinfection, EPA/625/1-86/021. vol. Oct., Cincinnati, Ohio. Task Force on Wastewater Disinfection (TFWD) (1986). Wastewater Disinfection: Manual of Practice No. FD-10. Water Pollution Control Federation. Tchobanoglous, George et al. (1999). “Recent Developments in Ultraviolet (UV) Disinfection.” USEPA 6th National Drinking Water and Wastewater Treatment Technology Transfer Workshop, Kansas City, Mo, August 2-4, 1999. Thampi, Mohan V. (1990). “Basic Guidelines for Specifying the Design of Ultraviolet Disinfection Systems.” Pollution Engineering, XXII, 65-69. Tosa, K., and Hirata, T. (1999). “Photoreactivation of enterohemorrhagic Escherichia coli following UV disinfection.” Water Research, 33 (2), 361-366. Trojan Technologies, Inc. (Bill Cairns) (1998). “Trojan’s patented cleaning mechanism makes a clean sweep.” UV Wavelength, 10 (2), 3. Trojan Technologies, Inc. (Gail Sakamoto) (1999). “Overview of Wastewater Disinfection.” United States Environmental Protection Agency. 1993. Methods for Measuring the Acute Toxicity of Effluents and Receiving Waters to Freshwater Organisms. Fourth Edition. Office of Research and Development. Washington, DC. EPA/600/4-90/027F. Voet, Donald, and Voet, Judith G. (1995). Biochemistry; 2nd ed. John Wiley & Sons, Inc., NY, NY. WEM staff. (1995). “Installing advanced disinfection hardware achieves plant upgrade.” Water/Engineering and Management, March, 24-25. White, G.C. (1992). Handbook of Chlorination and Alternative Disinfectants; 3rd ed. Van Nostrand Reinhold, New York, NY. For information on other NYSERDA reports, contact: New York State Energy Research and Development Authority 17 Columbia Circle Albany, New York 12203-6399 toll free: 1 (866) NYSERDA local: (518) 862-1090 fax: (518) 862-1091 [email protected] www.nyserda.org EVALUATION OF ULTRVIOLET (UV) RADIATION DISINFECTION TECHNOLOGIES FOR WASTEWATER TREATMENT PLANT EFFLUENT FINAL REPORT 04-07 STATE OF NEW YORK GEORGE E. PATAKI, GOVERNOR NEW YORK STATE ENERGY RESEARCH AND DEVELOPMENT AUTHORITY VINCENT A. DEIORIO, ESQ., CHAIRMAN PETER R. SMITH, PRESIDENT
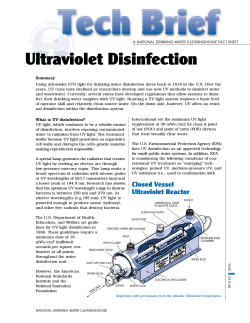


© Copyright 2026