
NJ FREE/MSEIA`s slide deck on RETA
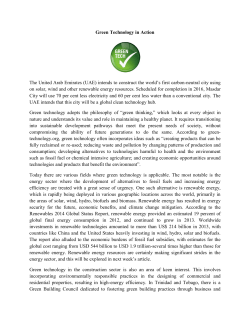
NEW JERSEY LEADERSHIP: THE RENEWABLE ENERGY TRANSITION ACT UU Legislative Ministry Montclair, NJ April 18, 2015 Lyle Rawlings, P.E. President, MSEIA Table of Contents Topic Slides 1. 2. 3. 4. 5. 6. 7. 3-4 5-7 8-14 15-16 17-24 25-26 27-31 Introduction Who is NJ FREE, and what is RETA? Why New Jersey, and why now? Renewable energy vs. other choices The example of Germany The role of solar power in community resiliency Summation COULD THIS BE AN AGE OF SOLVING COMPLEX GLOBAL PROBLEMS? Incidence of extreme poverty worldwide: Down from 40% to 14% since 1981 (source: Think Progress*) Children dying of hunger each day: Down by 70% since mid-70’s (source: The Hunger Project) (decline in other causes of death shown below: ThinkProgress*) * "5 Reasons Why 2013 Was The Best Year In Human History“, Zack Beauchamp 12/11/13 COULD THIS BE AN AGE OF SOLVING COMPLEX GLOBAL PROBLEMS? (cont.) Incidence of war worldwide: Becoming rarer and less deadly (source: Think Progress*) Incidence of murder worldwide: Declined 48% from 2001 to 2008 (source: Think Progress*) * "5 Reasons Why 2013 Was The Best Year In Human History“, Zack Beauchamp 12/11/13 NJ FREE NEW JERSEY FOR RENEWABLE ENERGY and EFFICIENCY Industry Professional Kyocera Corporation Mid-Atlantic Solar Energy Industries Association (MSEIA) Mid-Atlantic Renewable Energy Coalition (MAREC) Mitsubishi Electric U.S.A. New Jersey Grid Supply Association American Council on Renewable Energy (ACORE) Greener by Design Potter & Dixon U.S. Green Building Council – New Jersey Environmental Clean Water Action – New Jersey Climate Mama Climate Action New Jersey Delaware Riverkeeper Network Environment New Jersey Food and Water Watch Grandmothers, Mothers, and More for Energy Safety (GRAMMES) Mr. Sustainable Mom’s Clean Air Force New Jersey Environmental Lobby New Jersey Highlands Coalition Sierra Club – New Jersey Civic League of Women Voters New Jersey PACE New Jersey Green Party Faith-Based Unitarian Universalist Legislative Ministry, NJ Greenfaith Waterspirit The Proposed “Renewable Energy Transition Act” 1. Require 80% Renewable Electricity by 2050. 2. Require 5-year milestones to be met between now and 2050. 3. Require 30% reduction in electric use by 2050 compared to 2012 usage, also with 5-year milestones. Additional measures hoped for (from original draft bill): 4. Restructure the incentive system for solar to accomplish societal goals while reducing the cost of solar to ratepayers. 5. Enable wind power development and other renewables. 6. Require development of demand-side management assets. 7. Address infrastructure changes needed, especially regarding control and management of the grid. 8. Address continuing role for utility companies. 80% Renewable Electricity by 2050: Not as hard as it sounds… What would it take? Added solar power = approx. 425 MW per year = 15 GW cumulative Added wind power (primarily offshore) = approx. 4.5 GW The solar and wind power additions seem readily achievable* *463 MW of solar power was installed in NJ in EY 2012; Federal BOEM leases for offshore wind off NJ coast total around 6 GW out of a total technical resource of 99 GW Why New Jersey? Why Now? 1. Existing NJ law requires 80% reduction in greenhouse gas emissions by 2050. Electric power production is the largest source. Thus, compliance with existing law requires transition of electric power to renewables. 2. The cost of solar power has plummeted. Studies of the value delivered by solar in the northeast show that value already exceeds cost – so incentives are not a subsidy, they are payment for value delivered. 3. Superstorm Sandy drives the perception of the importance of distributed sources of emergency power. Technology advancements in storage intersect with revenue potential from grid support services. 4. Superstorm Sandy also drives the perception of the near-term cost of global warming, while new studies quantify it. 5. New Jersey has a good solar industry infrastructure already in place, and unique market structures that will drive PV+storage. 6. It’s not just a concept – other leading countries are already doing it. Implications for the Future of PV from Superstorm Sandy: • The fragility of the electric grid was highlighted. • The cost of global warming is being felt now, not in the future. • The many advantages of distributed generation can be re-examined. “Eric Pooley, senior vice president of the Environmental Defense Fund (and former deputy editor of Bloomberg Businessweek), offers a baseball analogy: “We can’t say that steroids caused any one home run by Barry Bonds, but steroids sure helped him hit more and hit them farther. Now we have weather on steroids.” Roughly at the same time that Sandy struck the Northeast, Harvard University released a report assessing the costs of global warming on a 10-year time scale. “The authors sought to consider what one could expect in the period of the next decade… The authors conclude that the early ramifications of climate extremes resulting from climate change are already upon us and will likely continue to be felt over the next decade – affecting human security and impacting U.S. national security interests.” A Choice is Upon Us Regarding Our Energy Future • With the EPA’s new CSAP and NESHAP rules, coal power is in trouble. PJM, the nation’s largest grid operator, estimates that 20 GW of coal plants are at high risk of retirement in its territory (New Jersey’s statewide maximum load is 20 GW). • New nuclear power is more expensive than solar on a KWH basis, more costly and more risky as an investment, and far more dangerous. e.g., Oyster Creek retires in 2019. • Additional gas to fill this gap must come from unconventional drilling (fracking). New research suggests that unconventional gas has a bigger climate change impact than coal (Howarth et al., etc.). Economic Research on the Value of Solar in New Jersey: The Value of Distributed Solar Electric Generation to New Jersey and Pennsylvania Dr. Thomas Hoff, Dr. Richard Perez, Dr. Benjamin Norris Clean Power Research Commissioned by MSEIA Figure ES- 2. Levelized attribute value ($/MWh), by location (South-30). $300 Total premium value delivered (typ. of 7 locations studied) $250 Security Enhancement Value $200 Long Term Societal Value Fuel Price Hedge Value T&D Capacity Value $100 Market Price Reduction Value Environmental Value $50 Economic Development Value $0 (Solar Penetration Cost) ($50) Atlantic City Newark Jamesburg Philadelphia Scranton Harrisburg Pittsburgh Levelized Value ($/MWh) $150 Range of costs for SRECs New Jersey pays a premium for solar energy through attribute credits called “SRECs”. The Clean Power Research study commissioned by MSEIA shows that the value of those attributes (the tops of the value bars - $0.17 to $0.22/KWH) exceed the costs (the range represented by the yellow lines - $0.06 to $0.12/KWH). Therefore, the incentives paid for those solar attributes are no longer a subsidy - they are a value transfer mechanism; a payment for value delivered. RENEWABLES’ MAIN RIVAL: NATURAL GAS “Natural has half the carbon footprint of coal.” TRUE. AND FALSE! The statement above saturates the media and fossil fuel industry ads. It is deceptive. Natural gas has half the CO2 footprint of coal, it’s true. But CO2 is only part of natural gas’s Global Warming footprint – perhaps less than half of its total footprint. Fugitive methane emission from extraction (e.g., fracking), processing, transmission, and distribution is a concentrated source of global warming. Methane GWP = 34 to 105 (AR5 100-year value vs. latest 25-year value) Methane leakage = 2% to 9% (industry studies vs. US Gov’t studies) Result: Natural gas has 79% to 415% of the global warming footprint of coal September, 2011 - Peter Loscher, CEO of Siemens (announcing their exit from nuclear business): “Germany’s shift towards renewable energies is the project of the century”. April, 2013 - Michael Liebreich, chief executive of Bloomberg New Energy Finance: “we are beyond the tipping point for a cleaner energy future”. August, 2013 - Jon Wellinghof, Chairman of FERC: “Solar is growing so fast it is going to take over everything” High-Penetration Renewable Energy in Europe – It’s Already Happening. • The Nordic countries – Denmark, Sweden, Norway, Finland, and Iceland – as a group exceeded 63% renewable power in 2012. • Germany’s “Renewable Energy Transformation” requires 85% renewable electricity by 2050. It is ahead of schedule, surpassing 26% in the first half of 2012. The RE Transformation has produced over 370,000 jobs; the German economic research institutes say it has been a net benefit to the economy, and the country’s economy is by far the strongest in Europe (world’s 4th largest economy overall, and the 2nd largest exporter). • Most European Union countries have ambitious, binding RE targets. GERMANY: Sample day in Germany – country total load on April 5, 2012 Shows how PV drives down the cost of power during peak periods to below the cost of nighttime power. Shows that PV handles the peak load during the day; wind is greater at night; and conventional power is relatively steady. Die Photovoltaik wird wesentliche Säule im Energiemix 70 > Mittagsspitze in Deutschland am PV ersetzt im wesentlichen Spitzenleistung sonnigen Samstag zu 43% aus PV Wind Photovoltaik 60 Konventionelle Erzeugungseinheiten > 100 MW > PV-Leistung ist gut prognostizierbar 40 21.9 GW 30 2.4 GW > Zuverlässige, regional aufgelöste Folgetags-Prognosen für die Kraftwerkseinsatzplanung 70 Phelix 60 26.9 GW 20 Day Base 50 10 Day Peak 40 Daten-Quelle: EEX €/MWh Leistung in GW 50 30 20 0 0h 2h 4h 6h 8h 10h 12h 14h 16h 18h 20h 22h 10 Samstag, 26.05.2012 Daten-Quelle: EEX-Transparenzplattform 0 0h 4h 8h 12h 16h 20h How does Germany handle massive amounts of intermittent renewables without power problems or large amounts of storage? Solar sensors around the country provide hour-ahead prediction Solar resource is forecast a day ahead based on satellite data Data on installed solar systems is combined with resource data and models to calculate expected performance Regional and local PV power predictions are constructed. Fossilfueled power is adjusted accordingly System Reliability with Intermittent Renewables • In 2011, Germany achieved a new record low SAIDI* Germany 2011 SAIDI = 15 • For the same year, SAIDI for other European countries was much higher Other European countries 2011 SAIDI = >30 • For the same year, the U.S. SAIDI was even higher U.S. 2011 SAIDI = 244 * SAIDI is “System Average Interruption Duration Index”, a measure of the total duration of service interruptions. Lower numbers are better. Bloomberg.com: “German Power Tumbles to Record Low as Solar Damps Demand” AUGUST 2013 NATIONAL SURVEY German people’s attitudes toward the Energiewende (“Energy Turnaround”): 82% say that the policy is either “completely right” (43%) or “mostly right” (39%) Electric Energy Storage: Rapid progress in new technologies, commercial products, and new business models lead to a new value proposition for PV. In this hybrid PV/battery storage project in Denville/Hackettstown, NJ, state-of-the-art lithium ion batteries work with a commercial PV system, simultaneously generating PV power, providing frequency regulation for PJM, and providing emergency power capability. The revenue from the frequency regulation services not only paid for the additional cost of the batteries, but paid for the inverter, too, actually reducing the cost of the solar energy. Synergy Between Solar and Batteries: If storage can be paid for by grid stabilization services, demand charge reduction, etc., then we can have emergency power at supermarkets, restaurants, food distribution centers, gas stations, police stations, hotels, YMCAs, etc. in every town… for little or no added cost. It’s real (already being done by many of the World’s strongest economies) 70 Photovoltaik 60 Wind Leistung in GW 50 40 21.9 GW 30 2.4 GW 26.9 GW 20 10 0 0h 2h 4h 6h 8h 10h 12h 14h 16h 18h 20h 22h Samstag, 26.05.2012 It’s more urgent than ever (post-Sandy reality, urgency of climate change more apparent, retiring coal plants and nukes in PJM, Fukushima) 70 Photovoltaik 60 Wind Leistung in GW 50 40 21.9 GW 30 2.4 GW 26.9 GW 20 10 0 0h 2h 4h 6h 8h 10h 12h 14h 16h 18h 20h 22h Samstag, 26.05.2012 70 Photovoltaik 60 Wind Leistung in GW 50 40 21.9 GW 30 2.4 GW 26.9 GW 20 10 0 0h 2h 4h 6h 8h 10h 12h 14h 16h 18h 20h 22h Samstag, 26.05.2012 New technologies (e.g., storage), new income streams (e.g., frequency reg.), and new business models allow PV to deliver greater value than just KWHs 70 Photovoltaik 60 Leistung in GW 50 40 21.9 GW 30 2.4 GW 26.9 GW 20 10 0 0h 2h 4h 6h 8h 10h 12h 14h 16h 18h 20h 22h Samstag, 26.05.2012 Figure ES- 2. Levelized attribute value ($/MWh), by location (South-30). $300 $250 Security Enhancement Value $200 Long Term Societal Value Fuel Price Hedge Value T&D Capacity Value $100 Market Price Reduction Value Environmental Value $50 Economic Development Value $0 (Solar Penetration Cost) ($50) Atlantic City Newark Jamesburg Philadelphia Scranton Harrisburg Pittsburgh Levelized Value ($/MWh) $150 Range of values for SRECs It’s more justifiable than ever (added value already exceeds added cost, today) We Can Create a sustainable future


© Copyright 2026