
34-2014 Li Phomopsis Inoculation Final Report
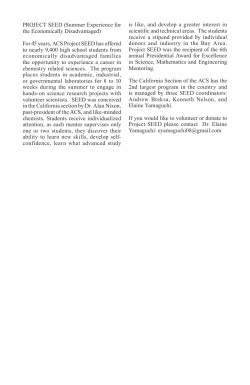
MISSISSIPPI SOYBEAN PROMOTION BOARD
PROJECT NO. 34-2014 (YEAR 2)
2014 FINAL REPORT
Title of project: Development of a seedling inoculation technique to evaluate
soybean for resistance to Phomopsis seed decay: proof of concept
Principal investigator: Shuxian Li, Research Plant Pathologist, USDA-ARS, Crop
Genetics Research Unit (CGRU), Stoneville, MS 38776. Phone: 662-686-3061. Email:
[email protected].
EXECUTIVE SUMMARY
Phomopsis seed decay (PSD) can severely affect soybean seed quality due to reduction in
seed viability and oil content, alteration of seed composition, and increased frequencies
of moldy and/or split beans. PSD has resulted in significant economic losses in the
southern United States.
Finding new sources of resistance to PSD requires reliable disease evaluation techniques.
Development of a fast inoculation and seedling assay under controlled conditions will
facilitate identification of genotypes with resistance to PSD without waiting the whole
growing season and without the concern of the environment effects.
The objectives of this research are to: (1) develop a seedling inoculation technique under
controlled conditions to evaluate soybean for resistance to Phomopsis seed decay; (2)
apply the seedling inoculation technique to test selected soybean varieties from our
previous field trails at Stoneville (MSPB funded project #30-2013); (3) analyze the
correlation between seed assays from whole-season field trails and the seedling assays;
and (4) provide information about soybean varieties with Phomopsis seed decay (PSD)
resistance and high seed quality that are identified by both seed and cut-stem assays to
members of the soybean industry.
The correlations between seedling and field assay data are very encouraging. The
seedling cut-stem inoculation method is easy and fast, and will facilitate identification of
genotypes with resistance to PSD without waiting the whole growing season, and without
the concern of possible environment effects that occur in the field that may or may not
result in PSD infection in a natural setting.
BACKGROUND AND OBJECTIVES
Phomopsis seed decay (PSD) can severely affect soybean seed quality due to reduction in
seed viability and oil content, alteration of seed composition, and increased frequencies
of moldy and/or split beans. Hot and humid environmental conditions, especially during
the period from pod fill through harvest stages, favor pathogen growth and disease
development. PSD has resulted in significant economic losses. In 2009, due to the
prevalence of hot and humid environmental conditions during the pod fill to harvest
WWW.MSSOY.ORG
June 2015
1
period in the southern United States, PSD caused over 12 million bushels of yield loss in
16 states, including 2.2 million bushels of yield loss in Mississippi.
There are few management strategies for this disease, and these strategies have not
completely protected soybean against PSD. Resistant varieties can provide some
protection at no additional cost to the grower above the price of the planting seed.
Soybean varieties may vary for resistance or tolerance to PSD. The disease development
is very sensitive to environment, and the severity varies by years and location.
Finding new sources of resistance to PSD requires reliable disease evaluation techniques.
Development of a fast inoculation and seedling assay under controlled conditions will
facilitate identification of genotypes with resistance to PSD without waiting the whole
growing season and without the concern of the environment effects.
PSD is primarily caused by Phomopsis longicola. This fungal pathogen has been reported
to infect all parts of soybean tissues. Therefore, we hypothesize that results from
inoculation of soybean seedlings under controlled conditions and the measurement of
stem lesion after inoculation would be comparable to the seed assay from the whole
season of the field tests. We propose to develop a fast seedling inoculation technique at
seedling (V2-V4) stage in a growth chamber to evaluate soybean for resistance to
Phomopsis seed decay. The seedling cut-stem inoculation approach was used to compare
the aggressiveness of P. longicolla isolates from different geographic origins (Li, et al.,
2010).
The objectives of this research are to: (1) develop a seedling inoculation technique under
controlled conditions to evaluate soybean for resistance to Phomopsis seed decay; (2)
apply the seedling inoculation technique to test selected soybean varieties from our
previous field trails at Stoneville (MSPB funded project #30-2013); (3) analyze the
correlation between seed assays from whole-season field trails and the seedling assays;
and (4) provide information about soybean varieties with Phomopsis seed decay (PSD)
resistance and high seed quality that are identified by both seed and cut-stem assays to
soybean growers and the seed industry persons interested in disease resistance and seed
quality.
REPORT OF PROGRESS/ACTIVITY
To develop a seedling inoculation technique under controlled conditions to evaluate
soybean for resistance to Phomopsis seed decay (PSD), a pilot study was conducted to
test a well-documented PSD-susceptible cultivar Williams 82. We analyzed the effect of
plant ages (2, 3, 4, and 5 weeks old) on the stem lesion after inoculation with the fungal
pathogen, Phomopsis longicolla, that causes PSD. Figure 1 shows the method we used, in
which the stem apex of each soybean plant was cut 25 mm above the unifoliolate node
with a sharp razor blade. The open end of a 200-μl pipette tip was pushed into the margin
of an actively growing P. longicolla culture growing on acidified potato dextrose agar,
and a circular disk of fungal mycelium agar plug was cut and removed. The pipette tip
containing the agar disk with P. longicolla mycelium was immediately placed over the
WWW.MSSOY.ORG
June 2015
2
cut stem and pushed down to embed the stem into the medium and to secure the tip onto
the stem.
Three replicated trials were finished and results are summarized in Table 1. Results show
that plants that were cut but not inoculated with the pathogen did not have stem lesions.
However, all inoculated plants showed lesions on the stem. There were differences in
different trials. It may due to the age of the pathogen and its viability. However, stem
lesions from plants that were inoculated at different ages within the same trial were not
significantly different. We selected 3-week old plants for the tests of six maturity group
(MG) IV and 10 MG V commercial soybean varieties for which we have Phomopsis seed
infection data from the field trials conducted in 2013. Stem lesion length was measured at
different times from 4 to 14 days after inoculation. Experiments were repeated three
times.
Differences in stem lesion length were found among varieties. The stem lesion lengths
ranged from 0.4 mm to 24.8 mm in MG IV varieties (Tables 2) and from 0.4 mm to 36.3
mm in MG V varieties (Table 3). Analyses of the Pearson correlation coefficient values
and significance for stem lesion length in the seedling assays in a growth chamber, and
percent Phomopsis infection of seeds from field trials at Stoneville, MS in 2013, indicate
that there were significant (P ≤ 0.05) correlations between stem lesion length measured at
7 days after inoculation in the MG IV seedling cut-stem inoculation assays and the
Phomopsis seed infection data of both inoculated (positively correlated) and noninoculated (negatively correlated) from the field trials in 2013 (Table 4). Moreover, the
stem lesion length measured at 9 days after inoculation in the seedling assay was also
significantly correlated with the field assay data from inoculated and delayed harvest trial
(Table 4).
In addition, we analyzed the correlation between seedling assay and field PSD data with the
data of the area under the disease progress curve (AUDPC) that was calculated using the
following formula:
where yi = the measure of stem lesion length (LL) at the ith observation, t = time (days), and n
= total number of observations. Σ is the sum of all of the individual trapezoids or areas from i
to n – 1, and i + 1 represent observations from 1 to n.
Results show that there were significant (P ≤ 0.05) correlations between AUDPC’s of
seedling cut-stem inoculation assays and the Phomopsis seed infection in the delayed
harvest with the inoculated treatment from the field trials in 2013 (Tables 4 and 5).
In addition, we added extra experiments to study how temperature and pathogen age
affect the development of the stem lesion length caused by the fungal pathogen P.
longicolla. Repeated experiments are in progress. A manuscript will be prepared and
submitted when those experiments are completed. Results of this research will also be
presented at the 2015 Southern Soybean Breeder’s Tour, and the 2016 American
WWW.MSSOY.ORG
June 2015
3
Phytopathological Society Annual meeting, or the Southern Soybean Disease Workers
Annual Meeting.
To summarize, our experiments in this project have been conducted to study:
1. Effect of plant age on the lesion length caused by the PSD-causing pathogen.
2. Effect of the pathogen age on the lesion length caused by the PSD-causing
pathogen.
3. Effect of temperature on the lesion length caused by the PSD-causing pathogen.
4. Reaction of 16 commercial varieties (MG IV and MG V) to the PSD-causing
pathogen after inoculation at different times.
5. Analysis of the correlation between seed assays from whole-season field trails and
the seedling inoculation assay.
CONCLUSION
The correlations between seedling and field assay data are very encouraging. The
seedling cut-stem inoculation method is easy and fast. It will facilitate identification of
genotypes with resistance to PSD without waiting the whole growing season and without
the concern of possible environment effects.
WWW.MSSOY.ORG
June 2015
4
Table1. Means of stem lesion length of soybean variety Williams 82 inoculated
with Phomopsis longicolla at different plant ages using a seedling cut-stem
inoculation technique in three replicated trials in a growth chamber at Stoneville,
MS.
Stem lesion Length (mm)
Plant age
Trial
(wk)
4 dai a
7 dai
9 dai
11 dai
14 dai
1
2
0.2
7.5
15.1
22.2
73.1
1
3
1.0
1.5
2.5
3.9
6.1
1
4
0.3
1.3
10.7
22.9
31.3
1
5
0.5
0.7
1.3
2.4
8.8
2
2
12.3
32.1
84.3
89.5
89.4
2
3
5.3
18.1
24.5
27.7
55.2
2
4
7.5
12.4
19.1
24.1
40.2
2
5
1.1
5.3
51.3
54.2
42.1
3
2
7.3
29.5
36.8
42.8
62.5
3
3
11.0
28.0
54.5
57.5
83.5
3
4
2.3
11.0
18.0
43.3
100.3
3
5
0.3
22.0
29.3
32.0
64.0
Mean
4.1
14.1
28.9
35.2
54.7
b
LSD (P ≤ 0.05)
8.2
21.6
47.8
49
58.8
a
Days after inoculation.
b
Fisher’s protected least significant difference for means within the column.
Table 2. Means of stem lesion length of six maturity group IV soybean varieties
inoculated with Phomopsis longicolla in three replicated cut-seedling inoculation
tests in growth chamber at Stoneville, MS.
Stem lesion length (mm)
a
Variety
4 dai
7 dai
9 dai
Armor ARX 1482
1.3
7.6
22.5
Morsoy R2 491
0.4
8.3
17.3
Morsoy R2s 480
1.2
9.4
24.2
Pioneer 94Y90
1.2
6.6
17.1
SS93-6181
1.3
10.4
24.7
AP 350
1.4
11.3
23.8
Mean
1.1
8.9
21.6
b
LSD (P ≤ 0.05)
3.4
19.8
21.3
a
Days after inoculation.
b
Fisher’s protected least significant difference (LSD) test (P ≤ 0.05) for means
within the column.
WWW.MSSOY.ORG
June 2015
5
Table 3. Means of stem lesion length of 10 maturity group V soybean varieties
inoculated with Phomopsis longicolla in three replicated cut-seedling inoculation
tests in growth chamber at Stoneville, MS.
Stem lesion length (mm)
a
Variety
4 dai
7 dai
9 dai
11 dai
14 dai
Asgrow 5606
0.8
7.1
6.0
19.2
26.0
Asgrow 5831
0.6
8.4
8.1
21.0
27.6
Dyna-Gro 37RY52
0.4
7.7
3.9
22.7
29.3
Dyna-Gro 33C59
0.4
11.6
6.1
24.5
28.1
Progeny 4949
2.6
14.6
5.5
24.3
30.0
Progeny 5650
0.4
10.8
8.4
22.1
31.0
Progeny 5706
1.3
11.0
8.4
21.8
28.3
Terral 59R16
1.2
12.3
15.1
29.8
36.3
PI424324B
0.9
9.6
9.1
23.1
29.7
Osage
1.9
13.2
14.1
27.3
35.3
Mean
1.1
10.6
8.5
23.6
30.2
b
LSD (P ≤0.05)
2.7
18.1
23.4
41.3
52.7
a
Days after inoculation.
b
Fisher’s protected least significant difference (LSD) test (P ≤ 0.05) for means
within the column.
WWW.MSSOY.ORG
June 2015
6
Table 4. Pearson correlation coefficient values and significance for stem lesion length
of six maturity group IV soybean varieties inoculated with Phomopsis longicolla using a
cut-stem inoculation technique in three replicated growth chamber trials, and percent
Phomopsis infection of seeds harvested from field trials with inoculated and noninoculated treatments, and normal and delayed harvest times at Stoneville, MS in 2013.
Valuesa
LL4daib
LL7dai
LL9dai
AUDPC e
PSD/Inoc1e
PSD/Non2f
PSD/Inoc2g
LL4dai
1.000
0.267
0.502
0.199
0.036
0.229
0.191
(0.610)
(0.311)
(0.705)
(0.945)
(0.663)
(0.716)
1.000
0.944
0.643
0.580
-0.770
0.802
(0.005)
(0.169)
(0.228)
(0.073)
(0.055)
1.000
0.775
0.456
-0.633
0.789
(0.070)
1.000
(0.363)
0.522
(0.177)
0.717
(0.062)
0.799
0.288
0.109
(0.056)
1.000
0.287
0.635
(0.582)
(0.176)
1.000
0.406
LL7dai
LL9dai
AUDPC
PSD/Inoc1
PSD/Non2
(0.425)
1.000
PSD/Inoc2
a
Pearson correlation coefficients were calculated based on overall means of stem lesion
lengths from three trials of the cut-stem inoculation tests and percentage Phomopsisinfection of seeds harvested from field trials with inoculated and non-inoculated
treatments, and normal and delayed harvest times. Values in parentheses are
probabilities.
b
LL: stem lesion length; dai: days after inoculation using a seedling cut-stem inoculation
technique.
c
The area under the disease progress curve, calculated using the following formula:
where yi = the measure of stem lesion length (LL) at the ith observation, t = time (days), and
n = total number of observations. Σ is the sum of all of the individual trapezoids or areas
from i to n – 1, and i + 1 represent observations from 1 to n.
d
Percentage seed infected by Phomopsis longicolla in the field tests harvested at normal
time (R8 growth stage) without inoculated treatments in 2013.
e
Percentageage seed infected by P. longicolla in the field tests harvested at normal time
(R8 growth stage) with inoculated treatments in 2013.
f
Percentage seed infected by P. longicolla in the field tests harvested at delayed time
(R8 + 2 wk) without inoculated treatments in 2013.
g
Percentage seed infected by P. longicolla in the field tests harvested at delayed time
(R8 + 2 wk) with inoculated treatment in 2013.
WWW.MSSOY.ORG
June 2015
7
Table 5. Pearson correlation coefficient values and significance for stem lesion length of 10
maturity group V soybean varieties inoculated with Phomopsis longicolla using a seedling cutstem inoculation technique in three replicated growth chamber trials, and percent Phomopsisinfection of seeds from field trials with inoculated and non-inoculated treatments, and normal
and delayed harvest times at Stoneville, MS in 2013.
Valuesa
LL4dai
LL7dai
LL4daib
LL7dai
LL9dai
LL11dai
LL14dai
AUDPCc PSD/Non1d
1.000
0.745
(0.013)
1.000
0.271
(0.450)
0.425
(0.220)
1.000
0.396
(0.257)
0.695
(0.026)
0.731
(0.016
1.000
0.380
(0.278)
0.606
(0.063)
0.840
(0.002
0.908
(0.000
0.342
(0.334)
0.093
(0.797)
0.147
(0.686)
0.338
(0.339)
1.000
LL9dai
LL11dai
LL14dai
AUDPC
PSD/Inoc1e
PSD/Non2f
PSD/Inoc2g
0.564
(0.090)
0.618
(0.057)
0.206
(0.567)
0.519
(0.125)
-0.083
(0.819)
0.048
(0.895)
-0.114
(0.754)
0.066
(0.855)
0.194
(0.591)
0.019
(0.958)
-0.085
(0.816)
0.158
(0.664)
0.423
(0.223)
0.379
(0.281)
0.051
(0.888)
0.269
(0.453)
0.373
0.399
-0.217
0.257
0.152
(0.289)
1.000
(0.254)
0.416
(0.232)
(0.548)
0.089
(0.807)
(0.474)
0.485
(0.156)
(0.675)
0.745
(0.014)
1.000
0.559
0.468
0.754
(0.093)
(0.172)
(0.012)
1.000
0.020
(0.957)
1.000
0.548
(0.101)
0.328
(0.355)
1.000
PSD/Non1
PSD/Inoc1
PSD/Non2
PSD/Inoc2
a
Pearson correlation coefficients were calculated based on overall means of stem lesion
lengths from three trials of the cut-stem inoculation tests and percent Phomopsis-infection of seeds
harvested from field trials with inoculated and non-inoculated treatments, and normal and
delayed harvest times . Values in parentheses are probabilities.
b
LL: stem lesion length; dai: days after inoculation using a seedling cut-stem inoculation
technique.
c
The area under the disease progress curve, calculated using the following formula:
where yi = the measure of stem lesion length (LL) at the ith observation, t = time (days), and
n = total number of observations. Σ is the sum of all of the individual trapezoids or areas
from i to n – 1, and i + 1 represent observations from 1 to n.
d
Percenaget seed infected by Phomopsis longicolla in the field tests harvested at normal time
(R8 growth stage) without inoculated treatments in 2013.
e
Percentage seed infected by Phomopsis longicolla in the field tests harvested at normal time
(R8 growth stage) with inoculated treatments in 2013.
f
Percentage seed infected by P. longicolla in the field tests harvested at delayed time
(R8+2 wk) without inoculated treatments in 2013.
g
Percentage seed infected by P. longicolla in the field tests harvested at delayed time
(R8+2 wk) with inoculated treatment in 2013.
WWW.MSSOY.ORG
June 2015
8
(A)
(B)
Fig. 1. Development of a seedling inoculation technique to evaluate soybean for
resistance to Phomopsis seed decay. (A) The stem apex of each three week-old V2 stage
soybean plant was cut 25 mm above the unifoliolate node with a sharp razor blade. The
open end of a 200-μl pipette tip was pushed into the margin of an actively growing
Phomopsis longicolla culture growing on acidified potato dextrose agar, and a circular
disk of fungal mycelium agar plug was cut and removed. The pipette tip containing the
agar disk with P. longicolla mycelium was immediately placed over the cut stem
and pushed down to embed the stem into the medium and to secure the tip onto the stem.
(B) Lesion on stems. Picture was taken at 9 days after inoculation
WWW.MSSOY.ORG
June 2015
9


© Copyright 2026