
Document 151501
An Analysis of Mental Health and
Substance Abuse Disparities &
Access to Treatment Services in
the Appalachian Region
Final Report
August 2008
Presented to:
Appalachian Regional Commission
Presented by:
Zhiwei Zhang, Ph.D.
Alycia Infante, M.P.A.
Michael Meit, M.A., M.P.H.
Ned English, M.S.
National Opinion Research Center (NORC)
at the University of Chicago
&
Michael Dunn, Ph.D.
Kristine Harper Bowers
East Tennessee State University
You can view and download this report by visiting www.arc.gov or www.norc.org.
For more information about the report, please contact either Gregory Bischak, Ph.D. of the
Appalachian Regional Commission (202-884-7790, [email protected]) or Michael Meit, M.A.,
M.P.H. of NORC (301-634-9324, [email protected])
The authors wish to thank the Appalachian Regional Commission for providing the funding for the
report.
Appalachian Regional Commission
1666 Connecticut Avenue, NW, Suite 700
Washington, DC 20009-1068
The Appalachian Regional Commission’s mission is to be an advocate for and partner with the
people of Appalachia to create opportunities for self-sustaining economic development and
improved quality of life.
National Opinion Research Center
4250 East-West Highway, Suite 800
Bethesda, MD 20814
NORC’s mission is to conduct high quality social science research in the public interest. We
conduct research in health, economics, demographics, education and child development, substance
abuse, mental health, justice, and survey quality both in the U.S. and internationally. NORC
supports the research needs of governments in the U.S. and abroad, international donor agencies,
foundations, academic researchers, and private organizations. NORC has offices in Chicago, IL,
Bethesda, MD, and Berkeley, CA.
East Tennessee State University
© 2008 by the Appalachian Regional Commission and the National Opinion Research Center
Reproduction of this document is permitted and encouraged, with credit given to the Appalachian
Regional Commission and the National Opinion Research Center.
Acknowledgments
This report was funded and prepared for the Appalachian Regional Commission (ARC). It was
commissioned by the ARC to study the disparities in mental health status and substance abuse
prevalence and access to treatment services in the Appalachian Region.
The National Opinion Research Center (NORC) at the University of Chicago, in partnership with
East Tennessee State University (ETSU), conducted this study. Zhiwei Zhang, Ph.D. is the lead
author and Principal Investigator and Michael Meit, M.A., M.P.H. is the Project Manager.
Contributing authors to this report were Alycia Infante, M.P.A. and Ned English, M.S. from NORC,
and Michael Dunn, Ph.D. and Kristine Harper Bowers from East Tennessee State University
(ETSU).
The research, analysis, and report development were guided by Dr. Gregory Bischak, Senior
Economist with the ARC. We would like to acknowledge the important contributions of Randall
Jessee, Ph.D. and the members of the Center for Appalachian Substance Abuse Policy (CASAP) for
their initial project guidance and review of draft findings, and the members of the Appalachian
Health Policy Advisory Council (AHPAC) for their ongoing project guidance and support. We also
thank Bruce Behringer, M.P.H. at East Tennessee State University for his guidance and
contributions. We appreciate the assistance provided by Katherine Locke, M.P.H., Emily
Shortridge, Ph.D., Jacob Feldman, Ph.D., and Sam Schildhaus, Ph.D. from NORC. We thank Art
Hughes at the Office of Applied Studies (OAS) of the Substance Abuse and Mental Health Services
Administration (SAMHSA) and staff at Research Triangle Institute International Inc. for running
data on the National Survey on Drug Use and Health (NSDUH). We thank Deborah Trunzo at
OAS/SAMHSA and Leigh Henderson at the Synectics for Management Decisions, Inc for
providing the Treatment Episode Data Sets (TEDS) submitted by Appalachian states and
jurisdictions.
The data collection in the field for the case study part of this project was approved by the East
Tennessee State University’s Institutional Review Board. All the data collection, analysis, reporting,
and subsequent publications were approved by NORC’s Institutional Review Board.
The views expressed are those of the authors and not necessarily those of ARC, NORC, or the East
Tennessee State University.
TABLE OF CONTENTS
Executive Summary ............................................................................................................................ 1
CHAPTER 1: Introduction ................................................................................................................ 7
1.1
1.2
1.3
1.4
Substance Abuse and Mental Health Disorders in Appalachia .................................................. 7
Key Research Questions and Methodology ............................................................................... 8
Importance of the Current Study ................................................................................................ 9
Structure of the Report ............................................................................................................. 11
CHAPTER 2: Substance Use, Mental Disorders, and Access to Treatment Services in
Household Surveys, 2002 – 2005 ...................................................................................................... 19
2.1 Introduction ................................................................................................................................. 19
2.2 Data ............................................................................................................................................... 19
2.2.1 Overview ................................................................................................................................ 19
2.2.2 Limitations of the NSDUH .................................................................................................... 20
2.3 Methods ........................................................................................................................................ 21
2.3.1 Analytic Sample ..................................................................................................................... 21
2.3.2 Measures................................................................................................................................. 21
2.3.3 Statistical Methods ................................................................................................................. 23
2.4 Results ......................................................................................................................................... 24
2.4.1 Tables ..................................................................................................................................... 29
2.4.2 Maps ....................................................................................................................................... 54
2.5 Discussion ..................................................................................................................................... 75
CHAPTER 3: Patient Admissions to Treatment for Abuse of Alcohol and Drugs in
Appalachia, 2000 – 2004 ................................................................................................................... 78
3.1 Introduction ................................................................................................................................. 78
3.2 Data ............................................................................................................................................... 78
3.2.1 Overview ................................................................................................................................ 78
3.2.2 Uses of TEDS ......................................................................................................................... 80
3.2.3 TEDS Measures Used in this Study ....................................................................................... 80
3.2.4 Limitations of the TEDS Series ............................................................................................. 83
3.3 Methods ........................................................................................................................................ 83
3.3.1 Study Sample.......................................................................................................................... 83
3.3.2 Statistical Methods ................................................................................................................. 84
3.4 Results .......................................................................................................................................... 84
3.4.1 Tables ..................................................................................................................................... 85
3.4.2. Figures ................................................................................................................................. 104
3.4.3. Maps .................................................................................................................................... 110
3.5 Discussion ................................................................................................................................... 121
CHAPTER 4: Substance Use and Mental Health Disorder Discharges from Appalachian and
Other Community Hospitals in 2004 ............................................................................................. 124
4.1 Introduction .............................................................................................................................. 124
4.2 Data ............................................................................................................................................ 125
4.2.1 Overview .............................................................................................................................. 125
4.2.2 Sample Design...................................................................................................................... 125
4.2.3 Uses of the HCUP Nationwide Inpatient Sample ................................................................ 126
4.2.4 HCUP Measures Used in this Study .................................................................................... 126
4.2.5 Limitations of HCUP NIS Data ........................................................................................... 128
4.3 Methods ...................................................................................................................................... 129
4.3.1 Study Sample........................................................................................................................ 129
4.3.2 Statistical Methods ............................................................................................................... 129
4.4 Results ....................................................................................................................................... 130
4.4.1 Tables ................................................................................................................................... 130
4.5 Discussion ................................................................................................................................... 150
CHAPTER 5: Substance Abuse Treatment Services in the Appalachian Region, 2005 .......... 152
5.1 Introduction ............................................................................................................................... 152
5.2 Data ............................................................................................................................................. 152
5.2.1 Overview .............................................................................................................................. 152
5.2.2 Sample Design...................................................................................................................... 153
5.2.3 Uses of the N-SSATS ........................................................................................................... 154
5.2.4 N-SSATS Measures Used in this Study ............................................................................... 154
5.2.5 Limitations of the N-SSATS ................................................................................................ 155
5.3 Methods ...................................................................................................................................... 156
5.3.1 Study Sample........................................................................................................................ 156
5.3.2 Statistical Methods ............................................................................................................... 156
5.4 Results ........................................................................................................................................ 156
5.4.1 Tables ................................................................................................................................... 157
5.4.2 Figures .................................................................................................................................. 162
5.5 Discussion ................................................................................................................................... 166
CHAPTER 6: Substance Abuse and Mental Health – A Comparison of Appalachian Coal
Mining Areas to Other Areas within the Appalachian Region ................................................... 168
6.1 Introduction ............................................................................................................................... 168
6.2 Data and Analytic Samples...................................................................................................... 168
6.3 Results ........................................................................................................................................ 170
6.4 Conclusion .................................................................................................................................. 173
CHAPTER 7: Case Study Analysis of Disparities in Mental Health Status and Substance
Abuse Prevalence in the Appalachian Region and Access to Mental Health and Substance
Abuse Treatment Services .............................................................................................................. 181
7.1 Introduction .............................................................................................................................. 182
7.2 Case Study Process .................................................................................................................... 182
7.3 Phase 1: Identification of Potential Data Sets/Sources ........................................................ 183
7.4 Phase 2: Selection of Pairs of Counties for Case Study ....................................................... 184
Data Sources .................................................................................................................................. 184
Measuring the Similarities of County Pairs .................................................................................. 185
Composite Ranking Scale and Selection of Final Pairs ................................................................ 186
Site Descriptions ........................................................................................................................... 188
7.5 Phase 3: Onsite Focus Group and Key Informant Interviews ............................................ 193
7.6 Phase 4: Development of Community Resource Inventory ................................................... 198
7.7 Phase 5: Key Findings ............................................................................................................... 201
7.8 Discussion and Conclusions ...................................................................................................... 206
Case Study Appendix of Model Programs .................................................................................... 210
County Profiles .............................................................................................................................. 214
CHAPTER 8: Conclusions ............................................................................................................. 215
APPENDIX A: Data Sources ......................................................................................................... 223
APPENDIX B: Literature Review of the Prevalence of Substance Abuse and Mental Health
Disorders, Access to Treatment Services, and Disparities in Appalachia.................................. 225
APPENDIX C: Results from the 2005 National Survey on Drug Use and Health: National
Findings ............................................................................................................................................ 235
APPENDIX D: County-Level Data Profiles for Appalachian Case Studies ............................. 274
References ........................................................................................................................................ 287
TABLES
Table 1.1 Overview of the Data Sets: Data Coverage, Data Reliability, and Characteristics............ 12
Table 2.1 Sample Sizes of the Pooled National Surveys on Drug Use and Health, by Age Group,
Survey Year, and Appalachian Region Status ........................................................................... 21
Table 2.2 Demographic Characteristics and Health Insurance among Persons Aged 12 or Older, by
Age Group and Appalachian Region Status: Percentages, Annual Averages Based on 20022005 ............................................................................................................................................ 29
Table 2.3 Lifetime, Past Year, and Past Month Substance Use among Persons Aged 12 or Older, by
Substance, Age Group, and Appalachian Region Status: Percentages, Annual Averages Based
on 2002-2005.............................................................................................................................. 30
Table 2.4 Substance Dependence or Abuse, Mental Health Measures, and Receipt of Substance
Use Treatment in the Past Year among Persons Aged 12 or Older, by Age Group and
Appalachian Region Status: Percentages, Annual Averages Based on 2002-2005 ................... 31
Table 2.5 Demographic Characteristics and Health Insurance among Persons Aged 12 or Older
Residing in Appalachian Region, by Age Group and Appalachian Sub-Region: Percentages,
Annual Averages Based on 2002-2005 ...................................................................................... 32
Table 2.6 Lifetime, Past Year, and Past Month Substance Use among Persons Aged 12 or Older
Residing in Appalachian Region, by Substance, Age Group, and Appalachian Sub-Region:
Percentages, Annual Averages Based on 2002-2005 ................................................................. 33
Table 2.7 Substance Dependence or Abuse, Mental Health Measures, and Receipt of Substance
Use Treatment in the Past Year among Persons Aged 12 or Older Residing in Appalachian
Region, by Age Group and Appalachian Sub-Region: Percentages, Annual Averages Based on
2002-2005................................................................................................................................... 34
Table 2.8 Demographic Characteristics and Health Insurance among Persons Aged 12 or Older
Residing in Appalachian Region, by Age Group and Appalachian Socioeconomic Status:
Percentages, Annual Averages Based on 2002-2005 ................................................................. 36
Table 2.9 Lifetime, Past Year, and Past Month Substance Use among Persons Aged 12 or Older
Residing in Appalachian Region, by Substance, Age Group, and Appalachian Socioeconomic
Status: Percentages, 2002-2005.................................................................................................. 38
Table 2.10 Substance Dependence or Abuse, Mental Health Measures, and Receipt of Substance
Use Treatment in the Past Year among Persons Aged 12 or Older Residing in Appalachian
Region, by Age Group and Appalachian Socioeconomic Status: Percentages, Annual Averages
Based on 2002-2005 ................................................................................................................... 39
Table 2.11 Access to Alcohol Treatment among Persons Aged 12 or Older, by Age Group and
Appalachian Region Status: Percentages, Annual Averages Based on 2002-2005 ................... 44
Table 2.12 Access to Drug Treatment among Persons Aged 12 or Older, by Age Group and
Appalachian Region Status: Percentages, Annual Averages Based on 2002-2005 ................... 45
Table 2.13 Reasons for Not Receiving Substance Use Treatment and Locations of Treatment
among Persons Aged 12 or Older, by Age Group and Appalachian Region Status:
Percentages, Annual Averages Based on 2002-2005 ................................................................. 46
Table 2.14 Reasons for Not Receiving Mental Health Treatment among Persons Aged 12 or
Older, by Age Group and Appalachian Region Status: Percentages, Annual Averages Based on
2002-2005................................................................................................................................... 47
Table 2.15 Access to Alcohol Use Treatment among Persons Aged 12 or Older, by Age Group
and Appalachian Sub-Region: Percentages, Annual Averages Based on 2002-2005................ 48
Table 2.16 Access to Drug Use Treatment among Persons Aged 12 or Older, by Age Group and
Appalachian Sub-Region: Percentages, Annual Averages Based on 2002-2005 ...................... 49
Table 2.17 Reasons for Not Receiving Mental Health Treatment among Persons Aged 12 or
Older, by Age Group and Appalachian Sub-Region: Percentages, Annual Averages Based on
2002-2005................................................................................................................................... 50
Table 2.18 Access to Alcohol Use Treatment among Persons Aged 12 or Older, by Age Group
and Appalachian Socioeconomic Status: Percentages, Annual Averages Based on 2002-200551
Table 2.19 Access to Drug Treatment among Persons Aged 12 or Older, by Age Group and
Appalachian Socioeconomic Status: Percentages, Annual Averages Based on 2002-2005 ...... 52
Table 2.20 Reasons for Not Receiving Mental Health Treatment/Counseling among Persons Aged
12 or Older, by Age Group and Appalachian Socioeconomic Status: Percentages, Annual
Averages Based on 2002-2005 ................................................................................................... 53
Table 3.1: Sub-regional Differences of Admissions to Substance Abuse Treatment in the
Appalachian Region, By Demographics .................................................................................... 86
Table 3.2: Sub-regional Differences of Admissions to Substance Abuse Treatment in the
Appalachian Region, By Employment Status, Marital Status, and Pregnancy Status ............... 88
Table 3.3: Sub-regional Differences of Admissions to Substance Abuse Treatment in the
Appalachian Region, By Health Insurance and Source of Referral ........................................... 91
Table 3.4: Sub-regional Differences of Admissions to Substance Abuse Treatment in the
Appalachian Region, By Service Setting ................................................................................... 93
Table 3.5: Sub-regional Differences of Admissions to Substance Abuse Treatment in the
Appalachian Region, By Types of Services and Methadone Use As Part of Treatment ........... 95
Table 3.6: Sub-regional Differences of Admissions to Substance Abuse Treatment in the
Appalachian Region, By Prior Treatment Episodes and Expected Source of Payment............. 97
Table 3.7: Sub-regional Differences of Admissions to Substance Abuse Treatment in the
Appalachian Region, By Use as a Primary Reason for Admission ........................................... 99
Table 3.8: Sub-regional Differences of Admissions to Substance Abuse Treatment in the
Appalachian Region, By One Major Reason for Admission ................................................... 101
Table 3.9: Sub-regional Differences of Admissions to Substance Abuse Treatment in the
Appalachian Region, By Psychological Problem and Mood Disorder Upon Admission ........ 103
Table 4.1. AHRQ-developed Mental Health and Substance Abuse Clinical Classification Software
(CCS-MHSA) ........................................................................................................................... 129
Table 4.2a: Demographics of Community Hospital Discharges in the Appalachian Region
(Unweighted) ............................................................................................................................ 132
Table 4.2b: Demographics of Community Hospital Discharges in the Appalachian Region
(Unweighted) by County Economic Development Status, 2004 ............................................. 133
Table 4.3a: Admission Source, Type, and Expected Payment for Community Hospital Discharges in
Appalachia (Unweighted), 2004 .............................................................................................. 136
Table 4.3b: Admission Source, Type, and Expected Payment for Community Hospital Discharges in
Appalachia (Unweighted) by County Economic Development Status, 2004 .......................... 137
Table 4.4a: Hospital Stay Characteristics for Community Hospital Discharges in Appalachia
(Unweighted), 2004 .................................................................................................................. 138
Table 4.4b: Hospital Stay Characteristics for Community Hospital Discharges in Appalachia by
County Economic Development Status (Unweighted), 2004 .................................................. 139
Table 4.5a: Diagnoses and Principal Reason for Hospitalization for Community Hospital
Discharges in Appalachia (Unweighted), 2004........................................................................ 141
Table 4.5b: Diagnoses and Principal Reason for Hospitalization for Community Hospital
Discharges in Appalachia (Unweighted), by County Economic Development Status, 2004 .. 142
Table 4.6a: Differences Among All Principal and Secondary Mental Health or Substance Abuse
Diagnoses for Discharges from Community Hospitals, 2004 .................................................. 144
Table 4.6b: Differences Among All Principal and Secondary Mental Health or Substance Abuse
Diagnoses Discharged from Community Hospitals, by County Economic Development Status,
2004 .......................................................................................................................................... 145
Table 4.7a: Differences Among Community Hospital Discharges by Substance Abuse and Mental
Health Diagnoses as the Major Reason for Hospitalization, 2004 ........................................... 147
Table 4.7b: Differences Among Community Hospital Discharges by Substance Abuse and Mental
Health Diagnoses as the Major Reason for Hospitalization by County Economic Development
Status, 2004 .............................................................................................................................. 148
Table 4.8: Adult Patients Diagnosed with Mental Health Disorders in Community Hospitals, 2004
.................................................................................................................................................. 149
Table 5.1: Ownership and Other Characteristics of Substance Abuse Treatment Facilities, 2005.. 157
Table 5.2 Characteristics of Substance Abuse Treatment Facilities, 2005 ...................................... 158
Table 5.3: Inpatient, Outpatient, and Non-Hospital Residential Care Offered at Substance Abuse
Treatment Facilities, 2005 ........................................................................................................ 159
Table 5.4 Counseling and Pharacotherapies Available at Treatment Facilities, 2005 ..................... 160
Table 5.5 Services Available at Treatment Facilities, 2005 ............................................................. 161
Table 6.1: Trend of Heroin Use as Primary, Secondary, or Tertiary Reason for Treatment, by Coal
Mining Status of Patient Location ............................................................................................ 172
Table 6.2: Trend of Other Opiates or Synthetics Use as Primary, Secondary, or Tertiary Reason for
Treatment, by Coal Mining Status of Patient Location ............................................................ 173
Table 6.3: Characteristics of Hospital Stays in Community Hospitals in the Appalachian Region,
Adults Aged 18 or Older, by County Coal Mine Status........................................................... 175
Table 6.4: Characteristics of Admissions to Substance Abuse Specialty Treatment in the
Appalachian Region, by County Coal Mine Status, 2000-2004 .............................................. 176
Table 6.5: Treatment-Related Characteristics of Admissions to Substance Abuse Treatment in the
Appalachian Region, by County Coal Mine Status, 2000-2004 .............................................. 178
Table 6.6: Substance Abuse Characteristics of Admissions to Substance Abuse Treatment in the
Appalachian Region, by County Coal Mine Status, 2000-2004 .............................................. 180
Table 7.1. Selected Four Pairs of Counties Per State in the Appalachian Region Based on the
Composite Ranking Score ........................................................................................................ 187
Table 7.2. Model Programs (Best Practices) from Appalachian Twinned-County Focus Groups . 207
Table 7.3. Strengths and Treatment Gaps for Twinned Counties Study ......................................... 208
Table 7.4. Gaps In Available Data For Planning At the Local Level ............................................. 209
APPENDIX C TABLES
Table 2.1A
Demographic Characteristics and Health Insurance among Persons Aged 12 or
Older, by Age Group and Appalachian Region Status: Numbers in Thousands, Annual
Averages Based on 2002-2005 ................................................................................................. 235
Table 2.2A
Lifetime, Past Year, and Past Month Substance Use among Persons Aged 12 or
Older, by Substance, Age Group, and Appalachian Region Status: Numbers in Thousands,
Annual Averages Based on 2002-2005 .................................................................................... 236
Table 2.3A
Substance Dependence or Abuse, Mental Health Measures, and Receipt of Substance
Use Treatment in the Past Year among Persons Aged 12 or Older, by Age Group and
Appalachian Region Status ...................................................................................................... 237
Table 2.4A
Demographic Characteristics and Health Insurance among Persons Aged 12 or Older
Residing in Appalachian Region, by Age Group and Appalachian Sub-region ...................... 238
Table 2.5A Lifetime, Past Year, and Past Month Substance Use among Persons Aged 12 or Older
Residing in Appalachian Region, by Substance, Age Group, and Appalachian Sub-region ... 239
Table 2.6A Substance Dependence or Abuse, Mental Health Measures, and Receipt of Substance
Use Treatment in the Past Year among Persons Aged 12 or Older Residing in Appalachian
Region, by Age Group and Appalachian Sub-region ............................................................... 240
Table 2.7A Demographic Characteristics and Health Insurance among Persons Aged 12 or Older
Residing in Appalachian Region, by Age Group and Appalachian Socioeconomic Status .... 241
Table 2.8A Lifetime, Past Year, and Past Month Substance Use among Persons Aged 12 or Older
Residing in Appalachian Region, by Substance, Age Group, and Appalachian Socioeconomic
Status ........................................................................................................................................ 242
Table 2.9A
Substance Dependence or Abuse, Mental Health Measures, and Receipt of
Substance Use Treatment in the Past Year among Persons Aged 12 or Older Residing in
Appalachian Region, by Age Group and Appalachian Socioeconomic Status ........................ 243
Table 2.10A
Access to Alcohol Treatment among Persons Aged 12 or Older, by Age Group
and Appalachian Region Status: Numbers in Thousands ........................................................ 244
Table 2.11A
Access to Drug Treatment among Persons Aged 12 or Older, by Age Group and
Appalachian Region Status: Numbers in Thousands ............................................................... 245
Table 2.12A
Reasons for Not Receiving Substance Use Treatment and Locations of Treatment
by Age Group and Appalachian Region Status ........................................................................ 246
Table 2.13A
Reasons for Not Receiving Mental Health Treatment among Persons Aged 12 or
Older, by Age Group and Appalachian Region Status: Numbers in Thousands ..................... 247
Table 2.14A
Access to Alcohol Use Treatment among Persons Aged 12 or Older, by Age
Group and Appalachian Sub-Region: Numbers in Thousands ................................................ 248
Table 2.15A
Access to Drug Use Treatment among Persons Aged 12 or Older, by Age Group
and Appalachian Sub-Region: Numbers in Thousands............................................................ 249
Table 2.16A
Reasons for Not Receiving Mental Health Treatment among Persons Aged 12 or
Older, by Age Group and Appalachian Sub-Region: Numbers in Thousands......................... 250
Table 2.17A
Access to Alcohol Use Treatment among Persons Aged 12 or Older, by Age
Group and Appalachian Socioeconomic Status: Numbers in Thousands ................................ 251
Table 2.18A
Access to Drug Treatment among Persons Aged 12 or Older, by Age Group and
Appalachian Socioeconomic Status: Numbers in Thousands .................................................. 252
Table 2.19A
Reasons for Not Receiving Mental Health Treatment/Counseling among Persons
Aged 12 or Older, by Age Group and Appalachian Socioeconomic Status: Numbers in
Thousands, Annual Averages Based on 2002-2005................................................................. 253
Table 2.1B
Demographic Characteristics and Health Insurance among Persons Aged 12 or
Older, by Age Group and Appalachian Region Status: Standard Errors of Percentages, Annual
Averages Based on 2002-2005 ................................................................................................. 254
Table 2.2B
Lifetime, Past Year, and Past Month Substance Use among Persons Aged 12 or
Older, by Substance, Age Group, and Appalachian Region Status: Standard Errors of
Percentages, Annual Averages Based on 2002-2005 ............................................................... 255
Table 2.3B
Substance Dependence or Abuse, Mental Health Measures, and Receipt of Substance
Use Treatment in the Past Year among Persons Aged 12 or Older, by Age Group and
Appalachian Region Status ...................................................................................................... 256
Table 2.4B
Demographic Characteristics and Health Insurance among Persons Aged 12 or Older
Residing in Appalachian Region, by Age Group and Appalachian Subregion: Standard Errors
of Percentages, Annual Averages Based on 2002-2005 .......................................................... 257
Table 2.5B
Lifetime, Past Year, and Past Month Substance Use among Persons Aged 12 or
Older Residing in Appalachian Region, by Substance, Age Group, and Appalachian
Subregion… ............................................................................................................................. 258
Table 2.6B
Substance Dependence or Abuse, Mental Health Measures, and Receipt of Substance
Use Treatment in the Past Year among Persons Aged 12 or Older Residing in Appalachian
Region, by Age Group and Appalachian Subregion: Standard Errors of Percentages, Annual
Averages Based on 2002-2005 ................................................................................................. 259
Table 2.7B
Demographic Characteristics and Health Insurance among Persons Aged 12 or Older
Residing in Appalachian Region, by Age Group and Appalachian Socioeconomic Status:
Standard Errors of Percentages, Annual Averages Based on 2002-2005 ................................ 260
Table 2.8B
Lifetime, Past Year, and Past Month Substance Use among Persons Aged 12 or
Older Residing in Appalachian Region, by Substance, Age Group, and Appalachian
Socioeconomic Status, 2002 - 2005 ......................................................................................... 261
Table 2.9B
Substance Dependence or Abuse, Mental Health Measures, and Receipt of Substance
Use Treatment in the Past Year among Persons Aged 12 or Older Residing in Appalachian
Region, by Age Group and Appalachian Socioeconomic Status: Standard Errors of
Percentages, Annual Averages Based on 2002-2005 ............................................................... 263
Table 2.10B Access to Alcohol Treatment among Persons Aged 12 or Older, by Age Group and
Appalachian Region Status: Standard Errors of Percentages, Annual Averages Based on 20022005…… .................................................................................................................................. 264
Table 2.11B Access to Drug Treatment among Persons Aged 12 or Older, by Age Group and
Appalachian Region Status: Standard Errors of Percentages, Annual Averages Based on 20022005…… .................................................................................................................................. 265
Table 2.12B Reasons for Not Receiving Substance Use Treatment and Locations of Treatment
among Persons Aged 12 or Older, by Age Group and Appalachian Region Status: Standard
Errors of Percentages, Annual Averages Based on 2002-2005................................................ 266
Table 2.13B Reasons for Not Receiving Mental Health Treatment among Persons Aged 12 or
Older, by Age Group and Appalachian Region Status: Standard Errors of Percentages, Annual
Averages Based on 2002-2005 ................................................................................................. 267
Table 2.14B Access to Alcohol Use Treatment among Persons Aged 12 or Older, by Age Group
and Appalachian Sub-Region: Standard Errors of Percentages, Annual Averages Based on
2002-2005................................................................................................................................. 268
Table 2.15B Access to Drug Use Treatment among Persons Aged 12 or Older, by Age Group and
Appalachian Sub-Region: Standard Errors of Percentages, Annual Averages Based on 20022005…… .................................................................................................................................. 269
Table 2.16B Reasons for Not Receiving Mental Health Treatment among Persons Aged 12 or
Older, by Age Group and Appalachian Sub-Region: Standard Errors of Percentages, Annual
Averages Based on 2002-2005 ................................................................................................. 270
Table 2.17B Access to Alcohol Use Treatment among Persons Aged 12 or Older, by Age Group
and Appalachian Socioeconomic Status: Standard Errors of Percentages, Annual Averages
Based on 2002-2005 ................................................................................................................. 271
Table 2.18B Access to Drug Treatment among Persons Aged 12 or Older, by Age Group and
Appalachian Socioeconomic Status: Standard Errors of Percentages, Annual Averages Based
on 2002-2005............................................................................................................................ 272
Table 2.19B Reasons for Not Receiving Mental Health Treatment/Counseling for Persons with an
Unmet Need for Mental Health Treatment, by Age Group and Appalachian Socioeconomic
Status: Based on 2002-2005 ..................................................................................................... 273
FIGURES
Figure 2.1. Geographic Variation in Individuals’ Health Insurance: Adolescents and Adults ......... 40
Figure 2.2. Geographic Variation in Individuals’ Health Insurance: Adolescents and Adults ......... 41
Figure 2.3. Non-Medical Use of Prescription Drugs Among Adolescents Aged 12 to 17 ............... 42
Figure 2.4. Mental Disorders Among Adults Aged 18 and Older in Appalachian Sub-Regions ..... 43
Figure 3.1 Primary Substance of Abuse at Admission, Aged 12 and Older, in the U.S., TEDS
2000-2004................................................................................................................................. 106
Figure 3.2 Primary Substance of Abuse at Admission, Aged 12 and Older, in the Appalachian
Region, TEDS 2000-2004 ........................................................................................................ 106
Figure 3.3 Admissions Aged 12 and Over for Primary Alcohol Abuse, in the U.S. and Appalachia,
TEDS 2000 – 2004 ................................................................................................................... 107
Figure 3.4 Admissions Aged 12 and Over for Primary Marijuana/Hashish Abuse, in the U.S. and
Appalachia, TEDS 2000 – 2004 ............................................................................................... 107
Figure 3.5 Admissions Aged 12 and Over for Primary Cocaine Abuse, in the U.S. and Appalachia,
TEDS 2000 – 2004 ................................................................................................................... 108
Figure 3.6 Admissions Aged 12 and Over for Primary Heroin Abuse, in the U.S. and Appalachia,
TEDS 2000 – 2004 ................................................................................................................... 108
Figure 3.7 Admissions Aged 12 and Over for Primary Abuse of Other Opiates/Synthetics, in the
U.S. and Appalachia, TEDS 2000 – 2004 ................................................................................ 109
Figure 3.8 Admissions Aged 12 and Over for Primary Methamphetamine Abuse, in the U.S. and
Appalachia, TEDS 2000 – 2004 ............................................................................................... 109
Figure 4.1 Admission Source by Appalachian County Economic Development Status ................. 134
Figure 4.2 Primary Expected Payer By Appalachian County Economic Development Status ....... 135
Figure 5.1: Facilities Offering Inpatient Detoxification Services .................................................... 162
Figure 5.2: Primary Focus of Substance Abuse Facilities ............................................................... 162
Figure 5.3: Facilities Using a Sliding Fee Scale .............................................................................. 163
Figure 5.4: Facilities Offering Free or No Charge Treatment.......................................................... 163
Figure 5.5: Facilities that Accept Medicare ..................................................................................... 164
Figure 5.6: Facilities that Accept Medicaid ..................................................................................... 164
Figure 5.7: Facilities that Accept State Financed Health Insurance ................................................ 165
Figure 5.8: Facilities that Accept Private Health Insurance ............................................................. 165
Figure 6.1 Coal Mining Area in the Appalachian Region................................................................ 169
Figure 6.2 Coal Mining Appalachian Sub-Regions ......................................................................... 174
Figure 7.1 Map of Case Study Counties .......................................................................................... 189
MAPS
Map 2.1 Average Population 2002-2005, in the Appalachian Region by County ............................. 55
Map 2.2 Number of Sampled Adults Age 18 or older in NSDUH 2002-2005, in the Appalachian
Region by County....................................................................................................................... 56
Map 2.3 Number of Sampled Adolescents Age 12 – 17 in NSDUH 2002-2005, in the Appalachian
Region by County....................................................................................................................... 57
Map 2.4 Perception of Great Risk of Binge Drinking, by NSDUH Sub-Region ............................... 58
Map 2.5 Alcohol Use in Past Month, by NSDUH Sub-Region ......................................................... 59
Map 2.6 Binge Alcohol Use in Past Month, by NSDUH Sub-Region............................................... 60
Map 2.7 Alcohol Use in Past Month Among Persons Aged 12-20, by NSDUH Sub-Region ........... 61
Map 2.8 Binge Alcohol Use in Past Month, Persons Aged 12-20, by NSDUH Sub-Region ............ 62
Map 2.9 Alcohol Dependence in Past Year, by NSDUH Sub-Region .............................................. 63
Map 2.10 Needing But Not Receiving Treatment in Past Year for Alcohol Use, by NSDUH SubRegion ........................................................................................................................................ 64
Map 2.11 Perception of Great Risk of Smoking One or More Packs of Cigarettes Everyday, by
NSDUH Sub-Region .................................................................................................................. 65
Map 2.12 Cigarette Use in Past Month, by NSDUH Sub-Region ..................................................... 66
Map 2.13 Marijuana Use in Past Month, by NSDUH Sub-Region.................................................... 67
Map 2.14 Marijuana Use in Past Year, by NSDUH Sub-Region ...................................................... 68
Map 2.15 Cocaine Use in Past Year, by NSDUH Sub-Region .......................................................... 69
Map 2.16 Any Use of Illicit Drugs Other Than Marijuana, Past Month, by NSDUH Sub-Region ... 70
Map 2.17 Any Drug Dependence in Past Year, by NSDUH Sub-Region ......................................... 71
Map 2.18 Needing But Not Receiving Treatment for Drug Use in Past Year, by NSDUH SubRegion ........................................................................................................................................ 72
Map 2.19 Painkiller Use in Past Year, by NSDUH Sub-Region ....................................................... 73
Map 2.20 Serious Psychological Distress in Past Year, by NSDUH Sub-Region ............................. 74
Map 3.1. Percentage of Persons with Three or More Prior Treatment Episodes ............................ 110
Map 3.2. Percentage of Persons with No Prior Treatment Episodes .............................................. 111
Map 3.3. Percentage of Persons Who Had an Alcohol and Drug or Health Provider Referral ...... 112
Map 3.4. Percentage of Persons Who Had a Court or Criminal Justice Referral ........................... 113
Map 3.5. Percentage of Persons Who Had an Individual Referral (Including Self-Referral)......... 114
Map 3.6. Percentage of Persons Admitted to Treatment for Alcohol Use ...................................... 115
Map 3.7. Percentage of Persons Admitted to Treatment for Cocaine Use...................................... 116
Map 3.8. Percentage of Persons Admitted to Treatment for Heroin Use........................................ 117
Map 3.9. Percentage of Persons Admitted to Treatment for Methamphetamine Use ..................... 118
Map 3.10. Percentage of Persons Admitted to Treatment for Primary Methamphetamine Abuse .. 119
Map 3.11. Percentage of Persons Admitted to Treatment for Psychiatric Problems ...................... 120
Executive Summary
This report presents an analysis of disparities in mental health status and substance abuse
prevalence, as well as access to treatment services, in the 410 county Appalachian region
comprising all or parts of 13 states.
Aim and Objectives
The aim of this research is to assist regional policy makers and public health practitioners in
improving surveillance, research and health education, as well as to more effectively target
investments designed to improve the delivery of substance abuse and mental health treatment and
treatment outcomes. The specific objectives of this study are to:
Identify whether there are specific disparities in mental health and substance abuse
diagnoses within the region, and any apparent incidence clusters within the region;
Identify and analyze available data to measure the accessibility of mental health services and
substance abuse treatment services within the region and compare the region to other parts
of the nation; and
Develop a set of criteria and protocols to identify relevant case study communities within
the Appalachian region and conduct case study analyses accordingly.
Data and Analyses
This study utilizes state, sub-state, and county level data on diagnoses and treatment of mental
health and substance abuse conditions. These data are used to analyze potential disparities across
Appalachian sub-regions and economic development levels defined by the Appalachian Regional
Commission (ARC). The analyses draw on four major sources of public information on mental
health and substance abuse diagnoses and treatment:
National household survey of mental health and substance abuse (2002-2005);
Treatment episode data on admissions to substance abuse specialty treatment facilities
(2000-2004);
Community hospital discharge reports of diagnoses and treatment of mental health
conditions and substance abuse (2004); and
National survey of treatment services reported by participating substance abuse treatment
facilities regarding mental health and substance abuse services (2005).
To supplement quantitative data sources, a series of case studies were also conducted in partnership
with East Tennessee State University (ETSU). The purpose of these case studies was to gather
additional information on how data are used to target mental health and substance abuse prevention
and treatment resources, and to identify needed information to improve “on the ground” delivery of
services.
1
Findings
Mental Health
There appears to be a higher prevalence of mental health disorders in the Appalachian region as
compared to the rest of the nation, with proportionately more Appalachian adults reporting serious
psychological distress and major depressive disorder.
Mental health problems are not equally distributed across the region, with higher rates of serious
psychological stress and major depressive episodes in central, as compared to northern and
southern, Appalachia.
Notably, mental health diagnoses for serious psychological distress and major depressive disorder
are proportionately higher in Appalachia than in the rest of the nation, independent from substance
abuse. That is, Appalachian disparities in mental health status do not appear to arise as a result of
higher levels of co-occurrence with substance abuse. Community hospital discharge data, national
household survey data, and treatment episode data all indicate this regional mental health disparity,
independent of substance abuse. This disparity is particularly acute in more economically
distressed areas of Appalachia.
While this mental health disparity is an important finding, the case studies and discussions with
members of the Coalition on Appalachian Substance Abuse Policy (CASAP) provide additional
depth to our analyses that may help to explain the apparent lack of co-occurring disorders in the
region. These sources suggest that there could be biases in the medical care system within the
region that encourage under-reporting of comorbidity rates for mental health and substance abuse
diagnoses. For example, facilities may under-report comorbidities to ensure optimal
reimbursement. This study has not identified any evidence that suggests that under-reporting of
comorbidities happens more often in Appalachia than in other regions, however. Future work
should explore whether there is any systematic bias in the way mental health care payment and
coverage is managed within the Appalachian Region, and whether such a bias may lead to
underreporting of co-occurring substance abuse and mental health illnesses.
Substance Use Problems
Alcohol is the predominant substance of abuse upon admission to treatment, nationally and in
Appalachia. However, hospital discharge data show that Appalachian residents have a lower
proportion of diagnoses for substance abuse only, and for co-occurring substance abuse and mental
health problems, as compared to the rest of the nation.
Findings related to specific substances demonstrate the following:
This study does not support the belief that methamphetamine use is higher in Appalachia
than elsewhere in the nation. Rather, methamphetamine use and admission rates are lower
across Appalachia than in the rest of the nation. While regional trends show that
methamphetamine use is rising, the rate of increase is similar to that of the rest of the nation
so that rates in Appalachia remain lower. While there are likely to be “pockets of abuse”
within the region, rates are lower within the region as a whole.
2
Other opiates and synthetics1 admission rates for primary abuse are higher in Appalachia
than the rest of the nation, especially in coal-mining areas. The trend is rising across the
nation and in Appalachia, but at a faster pace in Appalachia. This is particularly the case in
Appalachian coal mining areas.
Cigarette use rates2 are higher in Appalachia than in the rest of the nation among both
adolescents and adults.
Marijuana use rates are lower in Appalachian than in the rest of the nation among adults.
Cocaine use rates are lower in Appalachia than in the rest of the nation among adults.
Heroin admission rates are lower in Appalachia than in the rest of the nation, but the trend is
rising, especially in coal-mining areas.
Proportionately fewer Appalachian adults than adults outside the region are classified as
having alcohol abuse or dependence, or both alcohol and illicit drug abuse or dependence
according to household survey responses.3
Proportionately more Appalachian adolescents report nonmedical use of psychotherapeutics4
than adolescents in the rest of nation.
Treatment of Substance Use and Mental Health Disorders
Overall, access to substance use and mental health treatment within the Appalachian region
compares favorably to the United States as a whole. Overall, proportionately more adults in the
Appalachian region with mental health problems received outpatient mental health treatment
counseling services and prescription medical services in the past year, as compared to adults outside
the Appalachian region. There is no significant difference between Appalachian adolescents and
adults and adolescents and adults outside of the region in terms of the proportion of persons who
need but do not receive treatment for an illicit drug problem.
Proportionately more patients entered community hospitals for substance abuse or mental health
treatment via the emergency room in the Appalachian region. This was particularly the case in
more economically distressed counties and in coal mining areas. This may be an indicator of fear or
stigma associated with mental health and substance use treatment, which is consistent with findings
from the national household survey.
In looking at treatment related to specific substances of abuse, findings related to other opiates or
synthetics and alcohol are noteworthy:
The percentage of people in the Appalachian region admitted to treatment for the primary
abuse of other opiates or synthetics is significantly higher than in other regions of the United
1
These drugs include codeine, hydrocodone, hydromorphone, meperidine, morphine, opium, oxycodone, pentazocine,
propoxyphene, tramadol, and any other drug with morphine-like effects except methadone.
2
The rates cover the lifetime, past year, and past month use respectively.
3
The illicit drug abuse or dependence rate is also lower among Appalachian adults than adults outside the region, but
the difference is not statistically significant.
4
Nonmedical use of prescription-type psychotherapeutics includes the nonmedical use of pain relievers, tranquilizers,
stimulants, or sedatives and does not include over-the-counter drugs.
3
States. Within the Appalachian region, rates are highest in the central part of the Region and
in coal mining areas.
Proportionately more Appalachian adults in need of alcohol treatment receive treatment, as
compared to adults in the rest of nation.
When looking at services offered in substance abuse treatment facilities, findings demonstrate that:
Outpatient rehabilitation is the most common setting for substance abuse treatment in
Appalachia.
Proportionately more Appalachian treatment facilities offer intensive outpatient care when
compared to facilities outside of Appalachia.
In Appalachia, proportionately fewer facilities offer outpatient detoxification when
compared to facilities outside of Appalachia.
Short-term non-hospital residential treatment is offered in proportionately fewer facilities in
Appalachia than outside of Appalachia.
Long-term non-hospital residential treatment is offered in proportionately fewer facilities in
Appalachia than outside of Appalachia.
Proportionately more treatment facilities in Appalachia offer services such as substance
abuse family counseling and mental health assessment when compared to facilities outside
of Appalachia.
In Appalachia, proportionately more treatment facilities accept Medicare, Medicaid, state
financed insurance, and private insurance as payment when compared to facilities outside of
Appalachia.
Case Study Findings
Case study findings in six Appalachian counties provide additional depth to quantitative findings
showing a lack of access to inpatient treatment for both substance abuse and mental illnesses. The
case studies revealed a number of specific barriers in to accessing treatment for substance abuse and
mental health illnesses, including:
Stigma;
Transportation;
Payment options;
Privacy issues;
Choice of facilities; and
Cultural or family barriers.
4
The case study counties reported difficulties in getting access to inpatient and residential treatment
facilities. No case study county had inpatient facilities for either substance abuse or mental health
and most reported difficulty placing those needing long term outpatient treatment.
Recognizing the challenges confronting their communities, focus group participants noted the
development of school-based prevention activities, after-school youth activities, anti-drug coalition
activities, mentoring programs, parenting classes, agricultural extension programs, wellness classes,
health camps, mentoring programs, sports, and recreational activities. Focus groups revealed a need
for additional school-based interventions and prevention programs.
Findings from the case studies also showed that community-level substance abuse and mental health
leaders do not generally use nationally-available data sets to make decisions about local response to
substance abuse and mental health issues, nor do they have uniformly available county and state
data from which to draw conclusions about the magnitude of substance abuse and mental health
issues within their communities. While they may use state data, especially when it supports
applications for grant funding for prevention programs, more often than not, anecdotal evidence is
used as the basis for informing local decision making. These findings do not suggest a disregard for
the data, but rather the lack of utility in how data are presented and a disconnect between the levels
of analysis (generally state or regional) and the level of service delivery (local).
Conclusions
Overall, the findings from this study suggest that disparities do exist in the Appalachian region for
specific substance use and mental health disorders. While some of these disparities exist across the
Appalachian region, even more can be learned by looking at a more granular level. Specifically,
findings demonstrate particular disparities related to Appalachian sub-region, county economic
distress level, and within coal-mining areas. These findings are consistent across data sets and,
when taken with region-wide findings, demonstrate the presence of place-based disparities. Key
region-wide findings are that:
Mental health is a major area for concern in Appalachia, independent from substance abuse;
Alcohol is the predominant substance of abuse upon admission to treatment, nationally and
in Appalachia;
Methamphetamine is not as large of a problem across Appalachia as is widely reported,
although regional trends show that methamphetamine use is rising. The rate of increase,
however, is similar to that of the rest of the nation so that rates in Appalachia remain lower
when compared to the United States as a whole;
Primary abuse of other opiates and synthetics is a key issue in Appalachia. Admission rates
for primary abuse of other opiates and synthetics are higher in Appalachia than the rest of
the nation, and rates are increasing within the region at a faster pace when compared to the
United States as a whole;
Outpatient rehabilitation is the most common setting for substance abuse treatment in
Appalachia;
5
Access to inpatient treatment, and short and long-term non-hospital residential treatment for
substance abuse or mental health illnesses, is less common within the Appalachian region;
and
Access to treatment is better in Appalachia when compared to the rest of the nation in terms
of accepted forms of payment, and the provision of services such as substance abuse family
counseling and mental health assessment.
Whereas region-wide findings suggest opportunities to target resources across the Appalachian
region, sub-regional findings suggest opportunities for states and communities to target resources to
address more localized disparities. This point is noteworthy given case study findings
demonstrating that community-level substance abuse and mental health leaders generally use
anecdotal information in determining program priorities and resource allocation, due to a lack of
uniformly available county and state data.
Key findings from the case studies revealed that:
There are regional difficulties in accessing inpatient facilities for substance abuse or mental
health;
There are regional difficulties in accessing long-term outpatient treatment;
There are barriers to treatment for substance abuse and mental illnesses such as
transportation, cultural factors, and stigma;
Communities in Appalachia are targeting resources to prevent substance abuse and mental
health illness; and
Additional school-based interventions and prevention programs are needed in Appalachian
communities.
The case study counties are currently using an array of prevention programs and activities – such as
The Beginning Alcohol and Addictions Basic Education Studies (BABES), Too Good For Drugs™
(K–8), and D.A.R.E. (Drug Abuse Resistance Education), LifeSkills4Kids, among others – to
educate children and adolescents about the personal and social consequences of substance abuse,
and to reduce risk factors and enhance protective factors related to alcohol, tobacco and other drug
use. Prevention programs are offered in a variety of settings such as schools, youth organizations,
and the workplace. Anti-drug coalitions are also present in the case study counties.
The wide array of community programs available in Appalachian communities shows an
appropriate recognition of, and focus on, the problems of substance abuse and mental illness.
Future work should further explore community best practices in the prevention of substance abuse
and mental health illness to address and prevent these problems in Appalachia.
6
CHAPTER 1: Introduction
NORC at the University of Chicago was commissioned by the Appalachian Regional Commission
(ARC) to analyze disparities in substance abuse, mental health status, and access to treatment
services in the Appalachian region.5 The Appalachian region is comprised of West Virginia and
parts of 12 states: Alabama; Georgia; Kentucky; Maryland; Mississippi; New York; North Carolina;
Ohio; Pennsylvania; South Carolina; Tennessee; and Virginia. Over four decades ago, the United
States Congress established the ARC to facilitate economic development efforts in the Appalachian
region in response to persistent issues of poverty, economic distress, joblessness, poor physical
infrastructure, and cultural isolation. While some Appalachian communities have experienced
economic and infrastructural improvements,1 research has shown that disparities in health status
exist between the Appalachian region and non-Appalachian U.S., with Appalachia experiencing
more adverse health outcomes.2 Through the current study we will determine the extent to which
these disparities also exist relative to substance abuse and mental health status, and access to
treatment services.
This is the first effort to study substance abuse and mental health issues and access to treatment
services within Appalachia, and between Appalachia and the rest of the United States. The study
draws upon data from a variety of government sources and information from local communities
with the goal of providing health care researchers, practitioners, and policy makers with a detailed
understanding of substance abuse and mental health issues and access to treatment services in
Appalachia, including patterns across Appalachian sub-regions, across levels of economic
development, and between Appalachia and the rest of the United States. The qualitative and
quantitative results from this study augment the scant body of literature on substance abuse
disorders and mental health status, and access to treatment services in Appalachia.
1.1 Substance Abuse and Mental Health Disorders in Appalachia
Research to date does not provide a comprehensive understanding of substance abuse prevalence
and mental health status, and access to treatment services in Appalachia. While a body of research
has explored the prevalence of substance abuse and mental health disorders in rural
communities,3,4,5,6,7,8 little research has explored these issues in Appalachian communities
specifically. Studies suggest that disparities in access to and utilization of treatment for substance
abuse and mental health disorders result from a complex interplay of socioeconomic, cultural, and
health system factors. Race and ethnicity may also play a role in driving disparities within certain
Appalachian sub-regions and communities.
Research has identified some mechanisms to reduce treatment disparities in Appalachia, including
cultural competency training for mental health and social service professionals9 and enhanced
surveillance systems.10 Studies have explored the potential for health care system changes to reduce
disparities in rural America, though not in Appalachia specifically. Such changes include mental
health staff in rural health centers;11 health care service delivery via telemedicine;12 and self help
groups.13 Additional research is necessary to explore disparities specific to the Appalachian Region
and inform cost-effective ways to combat disparities related to treatment access for mental health
5
The Appalachian region is home to more than 23 million people, extending from southern New York to northeast
Mississippi and covering over 200,000 square miles of 410 counties in 13 states.
7
and substance abuse disorders in the region. Further study is needed to inform policy makers in the
design of targeted interventions to reduce disparities in Appalachia. Specifically, it will be
necessary to have a better understanding of the prevalence and geographic distribution of substance
abuse and mental health disorders at the sub-regional level within Appalachian states – ideally at the
county level.
In order for policy makers to design targeted policy interventions to reduce disparities in
Appalachia, it will be necessary to have a better understanding of the prevalence and geographic
distribution of substance abuse and mental health disorders within the region.
1.2 Key Research Questions and Methodology
Recognizing the current gaps in the literature to date, this study strives to augment the body of
literature on substance abuse and mental health issues and access to treatment services in
Appalachia. Our study addresses four key research questions:
1. Are there disparities in mental health status and substance abuse prevalence, and access to
treatment services, in the Appalachian region as compared to the rest of the United States?
2. Does socio-economic status, as measured by county economic development status, matter
with respect to substance abuse and mental health issues and access to treatment services
within Appalachia, and between Appalachia and areas outside of Appalachia?
3. Are there notable patterns or trends across the northern, central or southern Appalachian
sub-regions for different mental health status and substance abuse indicators?
4. To the extent possible, can we identify county-level patterns in substance abuse prevalence
and mental health status, and access to treatment services?
To investigate our research questions, we utilized the largest and most up-to-date survey and
administrative record data available from several Federal government sources. We analyzed data
from the National Survey on Drug Use and Health (NSDUH), the Treatment Episode Data Set
(TEDS), the Healthcare Cost and Utilization Project (HCUP), and the National Survey of Substance
Abuse Treatment Services (N-SSATS). This study also incorporates a qualitative component to
augment our quantitative findings; we include case studies based on paired Appalachian counties
that are closely matched based on socioeconomic indicators yet demonstrate differences in mental
health and substance abuse status. The case studies were conducted as a pilot effort to develop and
test a methodology for gathering qualitative substance abuse and mental health status information
across Appalachian states.
Overall, our study incorporates the following data:
19,416,000 Appalachian household residents age 12 or older as represented by 22,000
Appalachian survey respondents (NSDUH);
500,000 Appalachian admissions to substance abuse treatment (TEDS);
8
8,000,000 community hospital inpatient discharges, including 168,000 Appalachian
discharge records (HCUP);
980 Appalachian substance abuse treatment facilities (N-SSATS); and
Six qualitative community case studies in three of the 13 Appalachian states.
1.3 Importance of the Current Study
This study is unique for three key reasons. First, we explore a variety of mental health and
substance abuse indicators, and other demographic and socio-economic variables, based on data
from four different federal sources. In addition, NORC partnered with East Tennessee State
University (ETSU) to conduct a complementary qualitative component of the study. Specifically, a
pilot set of focus groups were conducted in six Appalachian counties in three states with county
officials and stakeholders about mental health and substance abuse issues in their communities.
Second, as part of our process for conducting the study, we sought ongoing input and feedback from
practitioners in the field. Specifically, we met with the Coalition on Appalachian Substance Abuse
Policy (CASAP) – a leading group of mental health and substance abuse professionals in Central
Appalachia – regarding their insights into the data sets, analyses, and findings.6 The feedback that
was generated through discussions with CASAP is presented in each chapter in a section entitled
“reflections from practitioners.” It is important to note that the information presented in these
sections is based on the reflections, insights, and opinions of the CASAP members, based upon their
experiences in the field.
Third, wherever possible, analytic results are broken down by sub-region (northern, central,
southern) and county economic development level (distressed, at-risk, transitional, competitive, and
attainment) to identify patterns and trends across different geographic areas. Additionally, some
data sets also allow results to be presented graphically through a series of maps, demonstrating
differences across counties.
ARC divides the Appalachian region into three sub-regions – the northern, central, and southern
sub-regions. Each region has relatively homogenous characteristics.
Map 1.1 shows the Appalachian sub-regions as defined by ARC. The northern region includes
parts of New York, Pennsylvania, Ohio, Maryland, and West Virginia. The central region is
comprised of counties within Kentucky, Virginia, West Virginia, and Tennessee. The southern
region is comprised of parts of Tennessee, North Carolina, South Carolina, Georgia, Alabama, and
Mississippi. Our research explores substance abuse and mental health indicators at the sub-regional
level when possible to identify patterns and trends.
6
CASAP was established by the ARC via a Kentucky Flex-E-Grant.
9
Map 1.1. Appalachian Subregions
In order to better understand needs of the Appalachian counties, and decide on spending and project
activities for each fiscal year, the ARC determines the economic development status of each county.
The ARC uses a structured process to designate county economic status. In short, economic
indicators such as the three-year average unemployment rate, per capita market income, and poverty
rate are used to assign all U.S. counties into economic development quartiles. Status is then
assigned by comparing individual county performance to all other counties in the U.S. on these
indicators.14 More information on the process for determining county economic development
status can be found on the Appalachian Regional Commission’s website at www.arc.gov.
Map 1.2 below illustrates the economic development status for counties in Appalachia, based on
ARC’s index-based county economic classification system. In FY 2007, seventy-eight of the 410
Appalachian counties are categorized as “distressed.” These counties (in red) rank among the
lowest 10 percent of the nation’s counties on economic status indicators. Distressed counties have
high poverty and unemployment rates and low per capita income rates in comparison to other
counties. Another 78 counties are categorized as “at-risk.” At-risk counties (in orange) are at risk
of becoming distressed counties. Over half of the counties (221) are characterized as transitional
counties. These counties (in white) are areas transitioning between weak and strong economies.
Twenty-six counties are “competitive.” These counties (in light blue) are competitive with counties
nationally. Finally, a small number of counties are identified as “attainment counties.” Seven
counties (in dark blue) are attainment counties, and considered among the strongest counties in the
nation relative to economic development indicators.
10
Map 1.2 Appalachian County Economic Development Level
1.4 Structure of the Report
The remaining eight chapters of the report are structured to explore each of our research questions.
Chapters 2 through Chapter 5 detail four independent but related studies, focusing on a variety of
issues related to substance abuse, mental health status, and access to treatment services in the
Appalachian region. Specifically, Chapter 2 presents estimates of substance use, mental disorder,
and access to treatment services from household surveys conducted from 2001-2005. Chapter 3
provides findings on patient admissions to specialty treatment for abuse of alcohol and drugs in the
Appalachian region during the period from 2000-2004. Chapter 4 discusses findings on health care
access and service utilization for substance use and mental disorders by examining community
hospital discharges in both the Appalachian region and elsewhere in the United States. Chapter 5
presents key features of substance abuse treatment services in the Appalachian region, using the
most recent treatment facility survey data. In Chapter 6, we focus exclusively on the Appalachian
region with the objective of comparing coal mining areas and other areas with respect to substance
abuse and mental health status and access to the treatment services. In Chapter 7, we present a
complementary qualitative study comprised of six community case studies in three Appalachian
states. In Chapter 8, we offer conclusions resulting from this study. Appendix A at the end of the
report provides detailed information about the data sources. Appendix B is a literature review about
substance abuse and mental health issues, with a concentration on Appalachia and rural America.
Appendix C provides additional data tables based on the National Survey on Drug Use and Health.
Appendix D provides a series of county-level data profiles on key substance abuse and mental
health indicators that were used during the qualitative study. Immediately following this
introduction, we provide an overview of the data sources used to conduct this study, and short
abstracts of Chapters 2 through 7 to help the reader to navigate this report.
11
HCUP
N-SSATS
Overview of Data Sets
TEDS
NSDUH
Table 1.1 Overview of the Data Sets: Data Coverage, Data Reliability, and
Characteristics
Data Coverage
Coverage of mental health issues
Coverage of substance abuse issues
Survey addresses co-occurring MH/SA disorders
Survey excludes some populations
Survey excludes some SM or MH treatment facilities
Reporting to the survey is limited to facilities that are funded and
licensed by the state
State accreditation and certification requirements, and state systems of
licensure may contribute to exclusion of certain facilities
Survey excludes some Appalachian counties
Survey was not designed to provide regional estimates
Confidentiality concerns that prohibit the state from releasing data on
certain Appalachian counties
Private for-profit facilities, hospitals, and state correctional facilities may
be excluded from the survey
Data Reliability
Due to institutional budgetary and reimbursement issues, MH/SA
diagnoses may be under-coded or miscoded*
Data availability varies from state to state
Data Set Characteristics
Annual survey
Pooled data from multiple annual surveys
Survey is voluntary
Survey is self-report
This table provides a high-level overview of the characteristics of each data set that readers should be
aware of in three areas: data coverage; data reliability; and survey design. Each data set offers a
different set of strengths and limitations. We recognize the limitations to using the various available
data sets to explore our research questions, and acknowledge these limitations in each chapter, as
appropriate.
NOTE: Issues with an asterisk (*) were mentioned by the Coalition on Appalachian Substance Abuse Policy (CASAP) as a
data limitation.
12
Chapter Overview – The National Survey on Drug Use and Health (NSDUH)
Overview. Chapter 2 presents the comparative Appalachian regional analyses of substance abuse,
mental health and related treatment access among the general population. The National Survey on
Drug Use and Health (NSDUH) provides data on drug, alcohol, and tobacco use in the civilian, noninstitutionalized population aged 12 or older in the U.S. While substance use (both alcohol and
illicit drugs) and dependence are a key focus of the survey, NSDUH also provides self-reported
information leading to the identification of serious psychological disorders and major depressive
episodes as well as information about the receipt of specialty treatment for illicit drug or alcohol
use, and mental health treatment/counseling in various settings.
Key Research Questions. Chapter 2 explores the following key research questions: (1) What
proportions of people report substance use, abuse, or dependence in the Appalachian region as
compared to outside of Appalachia? (2) What proportions of people in need of addiction or mental
health treatment report having received treatment for substance abuse or mental health problems in
the Appalachian region as compared to outside of Appalachia? (3) Are there patterns with respect to
substance use or abuse and access to treatment across different sub-groups, depending on
demographics, socio-economic characteristics, or age of population (age 12 to 17 versus age 18 and
older)? (4) Are there patterns with respect to substance use or abuse and access to treatment across
Appalachian sub-regions and/or by Appalachian county economic development status?
Sample. The survey is based on a random sample of households in the nation. The sample design
includes the 50 states and the District of Columbia. The four most recent NSDUH surveys, 20022005, are pooled together to study substance abuse, mental disorders, and access to treatment by
persons in the general population in Appalachia, as compared to the rest of the U.S., and to provide
sufficient sample sizes for sub-regional analyses. A total of 271,978 respondents were included in
the data (91,145 adolescents aged 12-17 and 180,833 adults aged 18 or older).
Limitations. The primary limitation of NSDUH is that it has been designed to provide national,
and, more recently, state-level estimates on drug use. The survey was not designed to provide
special regional estimates, and thus estimated totals, and weighted percentages to a lesser degree,
for groupings of counties should be interpreted with caution. The NSDUH also only targets the
civilian, non-institutionalized population aged 12 or older, potentially excluding other populations
that may have different substance abuse patterns.
Findings. Non-medical use of psychotherapeutics was higher among adolescents than among adults
overall; adolescents in the Appalachian region had even higher prevalence rates than adolescents
outside of the Appalachian region. Both geographic variation and county economic status
differences are observed in adolescents’ non-medical use of prescription drugs – with the southern
part of Appalachia, “distressed and at-risk,” and “transitional” counties having higher rates. The
percentages of current or recent methamphetamine use for adults are similar between Appalachia
and elsewhere, but the lifetime use of methamphetamine rate is lower in Appalachian than outside
of Appalachia. For adolescents, the methamphetamine use prevalence rates are generally similar,
although the rates in Appalachia for lifetime use and past month use are slightly higher in
Appalachia than outside of Appalachia. Finally, those who receive substance abuse treatment in the
Appalachian region are less likely to utilize inpatient rehabilitation than people outside of the
Appalachian region.
13
Chapter Overview – Treatment Episode Data Set (TEDS)
Overview. We use the Treatment Episode Data Set (TEDS) to examine admissions to substance
abuse treatment. Cross-tabulations are used to examine differences in admissions to substance
abuse treatment within the Appalachian region. Analyses are conducted across subgroups based on
Appalachian geographic sub-regions (Northern, Central, and Southern) and the ARC-defined
economic development level of the counties where the admissions took place.
Research Questions. Key research questions explored include: (1) Are there regional and subregional differences in admissions to substance abuse treatment in Appalachia as compared to
admissions to treatment outside of Appalachia? (2) Are there regional and sub-regional patterns in
admissions to treatment across different socio-economic and demographic variables such as age,
education, type of health insurance, etc? and (3) Are there regional and sub-regional patterns in
admissions to treatment with respect to other variables, such as source of referral, number of prior
treatment episodes, and primary reason for admission?
Sample. Chapter 3 provides an overview of the pooled annual admissions to treatment facilities in
the Appalachian region, and in other regions nationally, during the 2000 – 2004 period. TEDS is
based on over two million admissions reported by over 10,000 facilities to the 50 States, District of
Columbia, and Puerto Rico, over a calendar year. Among the 410 Appalachian counties, 195
counties were in the pooled 2000-2004 TEDS data set, comprising 511,217 total admissions to
treatment for abuse of alcohol and drugs in facilities that report to individual State administrative
data systems. Twelve of the 13 Appalachian states were included in the data (excluding West
Virginia).
Limitations. There are several limitations in using TEDS to explore substance abuse treatment
issues in Appalachian counties as compared to other counties nationally. TEDS does not capture all
of the substance abuse treatment facilities in the U.S., and the scope of facilities included differs
from state to state. Second, states may vary in how they define an admission; thus, the absolute
number of admissions may not be a valid measure for comparing states. Finally, different criminal
justice practices at the state level may affect the way clients are referred to admission.
Findings. The central Appalachian region had the highest proportion of admissions with other
opiates or synthetics as the primary reason for admission among Appalachian sub-regions. In
addition, about two-thirds of admissions in Appalachia were associated with mood disorders – both
those that were substance-related and non-substance-related. Finally, the highest prevalence of
mood disorders occurs in “transitional” counties and in the northern Appalachian sub-region; the
central sub-region of Appalachia has the greatest density of admissions for psychiatric problems
(both substance-related and non-substance-related).
14
Chapter Overview – The Healthcare Cost and Utilization Project (HCUP)
Overview. Chapter 4 provides an overview of substance abuse and mental disorder discharges from
Appalachian and other community hospitals. Analyses of the encounter-level administrative data
for inpatient hospital stays are performed using the Healthcare Cost and Utilization Project (HCUP),
the largest collection of longitudinal hospital care data in the United States.
Research Questions. In Chapter 4 we investigate the following key research questions: (1) Are
there differences in substance abuse and mental disorder diagnoses among patients discharged from
community hospitals in Appalachia, as compared to discharges from community hospitals outside
of Appalachia? (2) Are there differences in discharges from community hospitals in Appalachia
versus outside of Appalachia when taking county economic status into account? and (3) Do subregional differences exist across socio-economic status, health diagnoses, and other dimensions of
hospital stays?
Sample. This study uses HCUP’s Nationwide Inpatient Sample (NIS) collected in 2004 to examine
substance abuse and mental disorder discharges from community hospitals. The NIS is a stratified
probability sample of non-rehabilitation, community hospitals in the United States. All U.S.
community hospitals in the American Hospital Association’s hospital file are included in the
hospital universe, except short-term rehabilitation hospitals. HCUP provides data that address both
substance abuse and mental health issues. Given the NIS’s large sample size – 8,004,571 hospital
discharges from 1,004 U.S. community hospitals – the NIS is ideal for exploring trends nationally
and in the Appalachian region. The NIS sampling frame is representative of all U.S hospitals and
includes data from 37 states, including ten of the 13 Appalachian states. Pennsylvania, Alabama,
and Mississippi are excluded.
Limitations. The HCUP data is limited to only 37 states. In 2004, HCUP NIS data were only
available in 10 of the 13 Appalachian states, excluding Pennsylvania, Mississippi, and Alabama.
Missing data is a clear limitation, given that it would be ideal to make comparisons between
Appalachian community hospitals and other community hospitals nationally based on data for all 13
Appalachian states and the rest of the nation. Also, the NIS includes general and specialty
hospitals (e.g., pediatric, obstetrics-gynecology, short-term rehabilitation, and oncology), but
excludes long-term care and psychiatric hospitals.
Findings. Findings include that patients in the Appalachian region are more likely to be admitted
through the emergency department than patients outside of the Appalachian region. This disparity
appears to be concentrated in “at-risk” and “transitional” counties as compared to other counties. In
addition, over 67 percent of adult hospital stays in Appalachia were billed to the government in
2004, with Medicare being billed for the majority of stays. Finally, the percentage of admissions in
Appalachia for patients with principal and/or secondary MH/SA diagnoses is higher than the
percentage outside of Appalachia. The vast majority of the hospital stays with MH/SA diagnoses
are mental health related, and the rate is higher in Appalachia than outside of Appalachia.
15
Chapter Overview – The National Survey of Substance Abuse Treatment Services (N-SSATS)
Overview. Chapter 5 examines the facility and services characteristics of the substance abuse
treatment programs inside and outside of Appalachia. We use the National Survey of Substance
Abuse Treatment Services (N-SSATS) collected in 2005 to obtain a snapshot of the character and
composition of the substance abuse treatment delivery system in the United States. N-SSATS
allows us to make comparisons across geographic areas and among different populations with
substance abuse issues.
Research Questions. This chapter explores the following key research questions for facilities in
Appalachia and facilities outside of Appalachia: (1) Do substance abuse facilities in Appalachia
offer inpatient detoxification services? (2) What are the ownership structures for the Appalachian
treatment facilities and how do they compare to those of other facilities? (3) What is the primary
focus of Appalachian substance abuse facilities (e.g., substance abuse services, mental health
services, general health care services, etc.)? (4) What types of health insurance do facilities accept
(e.g., Medicare, Medicaid, state financed insurance, private health insurance)?
Sample. The sample analyzed in this study includes 13,367 substance abuse treatment facilities
from which data were collected in 2005. Of all these facilities, 980 (7.3%) were from the
Appalachian region, and 12,391 (92.7%), were from the rest of the country.
Limitations. There are several limitations with respect to using N-SSATS to explore the
composition and characteristics of substance abuse treatment facilities in Appalachian counties as
compared to other counties nationally. One serious limitation is that N-SSATS does not capture
data from all of the substance abuse treatment facilities that may be relevant to this study. A second
limitation is that N-SSATS is a point-prevalence survey, and as such, only reflects treatment facility
composition and status at a single point in time. Additionally, there are limitations related to the
survey’s design and content that will be presented in more detail in the chapter. Finally, some
financial data originally collected through the survey have been omitted from the public use file for
confidentiality reasons. Despite these limitations, we view the N-SSATS as a limited, yet important
data source for this study of substance abuse and mental health issues, and access to treatment
services in Appalachia.
Findings. In Appalachia, proportionately more treatment facilities had a primary focus of
providing mental health services, a mix of mental health services, and general health care services
than treatment facilities outside of Appalachia. Non-hospital residential substance abuse care is
provided in proportionately fewer facilities in Appalachia than outside of Appalachian. Long-term
non-hospital residential treatment is offered in proportionately fewer facilities in Appalachia than
outside of Appalachia. Analyses also show a significantly greater acceptance of government
financed payment sources including Medicare, Medicaid, and state financed insurance. While
proportionately more facilities accept these payment sources, we do not know the breadth of
coverage within the region. Similarly, proportionately more Appalachian facilities accept private
health insurance, but the breadth of coverage is also unknown. Future studies analyzing cost and
insurance issues within the Appalachian region could provide more specificity in terms of facility
rationale, breadth of coverage, and service implications.
16
Chapter Overview – Special Analysis: Substance Abuse and Mental Health – A Comparison of
Appalachian Coal Mining Areas to Other Areas within the Appalachian Region
Overview. The coal mining industry has long been a vital part of the economy of Appalachia and
remains a major industry within the region. Popular media has cited an increase in drug use in coal
mining areas. This chapter is based on statistical analyses of data systematically collected by two
agencies within the U.S. Department of Health and Human Services – the Substance Abuse and
Mental Health Services Administration (SAMHSA) and the Agency for Healthcare Research and
Quality (AHRQ). We focus exclusively on the Appalachian region with the objective of comparing
coal mining areas and other areas with respect to substance abuse and mental health status and
access to the treatment services.
Research Question. The key research question in Chapter 6 is: Do coal mining areas within
Appalachia differ from other Appalachian areas in terms of the composition of patients admitted to
specialty treatment services or discharged from community hospitals?
Sample. We merged the coal mining area coverage data from the National Coal Resources Data
System (NCRDS) with the list of the Appalachian counties described by the Appalachian Region
Commission (ARC) as of 2006. Among the 410 Appalachian counties, 176 counties were identified
as being located in the coal mining area. The first analytic sample for this chapter includes all adult
discharges from community hospitals within the Appalachian Region from the Healthcare Cost and
Utilization Project (HCUP). There are a total of 167,957 admissions included in the analytic sample,
including 76,083 (45.3%) from 25 coal mining counties and 91,874 (54.7%) from 20 other counties
in the Appalachian region. The second analytic sample for this chapter includes all admissions to
substance abuse treatment services in the Appalachian Region from the Treatment Episode Data Set
(TEDS) from 2000-2004. Among the 195 counties covered by the Treatment Episode Dataset
(TEDS) in 2000-2004, 86 counties were located in the coal mining area. Overall there were 211,380
admissions from the coal mining area and 299,837 admissions from other areas in the Appalachian
region.
Limitations. Our coal mining area was defined as the area with the subsurface filled with coal
instead of the actual coal-producing counties. The results should also be interpreted with caution
because the units of analyses were admissions to treatment or hospital discharges made by people
living in this area rather than actual coal miners.
Findings. The study in this chapter demonstrates that coal mining areas within the Appalachian
region demonstrate higher rates of both heroin use and other opiates or synthetics use as the
primary, secondary or tertiary reason for treatment, as compared to other areas within the region.
Furthermore, while studies in previous chapters show that rates of both heroin and other opiates and
synthetics as primary reasons for coming to treatment increased over the 2000-2004 period, the pace
of these rate increases is even faster in coal mining areas than in other areas within the Appalachian
region. Other illicit drug use and non-medical use of prescription drugs are also cited more as the
primary, secondary or tertiary reasons for treatment in coal mining areas than in other areas.
17
Chapter Overview – Case Study of Disparities in Mental Health Status and Substance Abuse
Prevalence in the Appalachian Region and Access to Mental Health and Substance Abuse
Treatment Services
Overview. To supplement the quantitative findings presented in the previous chapters, NORC and
East Tennessee State University conducted case studies using a “Socioeconomic Twins”
methodology. The purpose of the study was to determine the extent of local assessments of the
mental health and substance abuse situation as well as the perceived validity of nationally available
quantitative data to serve as an index of the severity of local substance abuse prevalence, mental
health status and access to treatment services.
Research Questions. Research questions for Chapter 7 include: Do community perceptions of
mental health/substance abuse (MH/SA) issues match available data? What additional data sources
are used at the community level? What has been the community’s response to substance abuse and
mental health concerns? And, are there potential explanations for variance in community MH/SA
indicators?
Sample. Statistical procedures were performed and matrices developed to calculate sociodemographic similarity/dissimilarity and MH/SA similarity/dissimilarity for all possible pairs of
Appalachian counties within each state. Then, these “distance matrices” were transformed into
pairs which were subsequently ranked and sorted based on the distance values. The twinned county
sites were selected based upon the statistically twinned rankings produced by NORC and by
consensus among ETSU, CASAP, and NORC, and modified by local/regional knowledge of local
situations. Case studies were conducted with the six counties in Kentucky, Virginia, and West
Virginia respectively.
Limitations. This study employed a case study methodology, which has inherent limitations.
While we conducted discussions with a variety of stakeholders in each of the case study
communities, these findings are not meant to provide a comprehensive understanding of every
substance abuse and mental health issue and perception in every community
Findings. The case studies revealed that Appalachian communities have a sense of regional
awareness of mental health and substance abuse issues and express willingness to share facilities
and solutions. Local data sets are essential to understanding the depth of the substance use and
mental health issues faced by residents at the county level, though better coordinated data
collection, documentation and analysis are needed to access resources at state and federal levels.
Barriers to the use of treatment services include social stigma for those who seek care, lack of
transportation, non-recognition of the root causes of substance use behaviors, multi-generational
patterns of substance abuse behaviors, and erosion of the power of family and community networks
to assist in personal coping skills. Community leaders want better conditions for all citizens of their
counties regardless of social class. The well-being of youth is of paramount importance to rural
counties evidenced by the emphasis on prevention and awareness of substance abuse in schools and
youth-programs settings.
18
CHAPTER 2: Substance Use, Mental Disorders, and Access to
Treatment Services in Household Surveys, 2002 – 2005
2.1 Introduction
Drug misuse and abuse, and mental health disorders are major health and social issues in the United
States. In Chapter 2, we provide our findings related to substance abuse, mental health problems,
and access to treatment services among the general population in the Appalachian region, as
compared to other parts of the United States. Where possible, findings are also presented by
Appalachian sub-region and county economic development status. Data are from the National
Survey on Drug Use and Health (NSDUH), the largest nationwide survey of the U.S. civilian noninstitutionalized population. While substance use (both alcohol and illicit drugs) and dependence
are a key focus of the survey, NSDUH also explores the prevalence and treatment of serious
psychological disorders and major depressive episodes. NSDUH also provides data about health
and emotional problems associated with substance use. Finally, NSDUH provides information
about the receipt of specialty treatment for illicit drug or alcohol use, and mental health
treatment/counseling in various settings.
This chapter explores the following key research questions:
What proportions of people report substance use, abuse, or dependence in the Appalachian
region as compared to outside of Appalachia?
What proportions of people in need of addiction or mental health treatment report having
received treatment for substance abuse or mental health problems in the Appalachian region
as compared to outside of Appalachia?
Are there patterns with respect to substance use or abuse and access to treatment across
different sub-groups, depending on demographics, socio-economic characteristics, or age of
population (age 12 to 17 versus age 18 and older)?
Are there patterns with respect to substance use or abuse and access to treatment across
Appalachian sub-regions and/or by Appalachian county economic development status?
An overview of data sources is presented in Section 2.2, including a description of the targeted
population. General limitations and major data gaps specifically related to exploring substance use
and mental health problems in the Appalachian region are also included in this section. Section 2.3
discusses the methods, including the analytic sample, measurement, and statistical methods.
Section 2.4 contains the results of the analysis. Finally, Section 2.5 provides a discussion of key
findings.
2.2 Data
2.2.1 Overview
The data used for this chapter is from the National Survey on Drug Use and Health (NSDUH).
NSDUH is the largest nationwide survey of the U.S. civilian non-institutionalized population.
Excluded from the sample are individuals with no household address (e.g., homeless and/or
transient persons not in shelters), active duty military personnel, and residents of jails and
19
hospitals.7 Initiated in 1971 and authorized by the Public Health Service Act to collect data on
substance abuse trends and patterns, NSDUH is the Federal government’s primary source of
national data on substance abuse issues related to alcohol, tobacco, and other illicit substances.
NSDUH is funded and overseen by the Substance Abuse and Mental Health Services
Administration (SAMHSA) to collect data about the status of the nation’s drug usage.
The survey is based on a random sample of households in the nation. Households that have been
randomly selected are visited by a NSDUH field representative. The sample design includes the 50
states and the District of Columbia. States designated as large sample states had sample sizes that
ranged from 3,562 to 3,699 people.15 The large sample states – California, Florida, Illinois,
Michigan, New York, Ohio, Pennsylvania, and Texas – were large enough to support direct state
estimates (includes three Appalachian states). The other 42 states, including 10 of the 13
Appalachian states, were designated as small sample states; sample sizes for small sample states
ranged from 840 to 978 people. One or two residents aged 12 or older from each household may be
asked to complete an interview for the survey. Each individual selected to participate in the survey
represents about 3,000 other residents in the United States.16
To provide a sufficient sample for analysis, we used pooled data from the four most recent National
Surveys on Drug Use and Health (NSDUH), 2002-2005. In 2002-2005, NSDUH collected data
from approximately 272,000 respondents aged 12 or older. A stratified sample was used to obtain
sufficient representation from all 50 States and the District of Columbia. The survey was planned
and managed by SAMHSA's Office of Applied Studies (OAS). In each year during 2002-2005, the
nationwide surveys included close to 70,000 individuals.
2.2.2 Limitations of the NSDUH
The primary limitation of NSDUH is that it has been designed to provide national, and, more
recently, state-level estimates on drug use. The survey was not designed to provide special regional
estimates. As the Appalachian region is not part of the primary sampling unit or the sampling
segment, the weights used for the national and state estimates are not ideal for a study of the
Appalachian region. In addition, the NSDUH weighting process does not post-stratify at the county
level; post-stratification of results involves weighting the data after collection when certain stratum
may be over or under-represented. As a result, the estimated totals, and weighted percentages to a
lesser degree, for groupings of counties – such as the 410 counties in the Appalachia region –
should be interpreted with caution.
Another limitation of using the NSDUH survey for this study is that it only targets the civilian, noninstitutionalized population aged 12 or older, potentially excluding other populations that may have
different substance abuse patterns.17 For example, research shows that runaways have higher rates
of drug abuse than their peers that live at home.18,19 Also, the NSDUH survey does not include
people who are not in a homeless shelter on the survey date, potentially missing this population.
Additionally, NSDUH excludes active military personnel and persons in institutional group quarters
(e.g., prisons, long-term hospitals, residential drug treatment centers, etc.).
7
It is important to note that because this sample frame, persons who were residing in long-term psychiatric or other
institutions at the time of interview were excluded from the NSDUH sample.
20
Third, NSDUH relies on people self-reporting their behavior with respect to drug use. Thus, data
may be biased by interviewees either under-reporting or over-reporting their drug use. To mitigate
this problem, NSDUH’s estimates are determined by interviewees’ responses to multiple questions
about substance abuse. However, self-reporting may bias response tendencies, given that
inconsistent responses for drug use questions are common in the survey.20
Finally, although data from four consecutive annual surveys were pooled to conduct this study, no
county-level estimations are produced because of the small sample sizes and related confidentiality
concerns. This also remains a concern when conducting state level analyses, as noted in the
literature.21
2.3 Methods
2.3.1 Analytic Sample
The data used for this study are the pooled cross-sectional annual National Surveys on Drug Use
and Health (NSDUH) for the 2002-2005 period. As shown in Table 2.1, a total of 271,978
respondents were included in the pooled data, including 91,145 adolescents aged 12-17 and 180,833
adults aged 18 or older.
About 8.13% (n=22,109) of the total respondents were from the 410-county Appalachian region
when the surveys were conducted during the 2002-2005 period. Of the 22,109 respondents from the
Appalachian region, 7,336 were adolescents age 12 -17, and 14,833 were adults age 18 or older.
Table 2.1 Sample Sizes of the Pooled National Surveys on Drug Use and Health, by Age
Group, Survey Year, and Appalachian Region Status
Year of Data Collection
All
Age Group
12-17
18 or older
Total
2002
23,645
44,481
68,126
2003
22,665
45,119
67,784
2004
22,301
45,459
67,760
2005
22,534
45,774
68,308
2002-2005
91,145
180,833
271,978
Region of Data Collection
Appalachian
Non-Appalachian
Region*
Region
7,336
83,809
14,833
166,000
22,109
249,809
Note: The Appalachian Region is comprised of the 410 counties located in 13 states -- Alabama, Georgia,
Kentucky, Maryland, Mississippi, New York, North Carolina, Ohio, Pennsylvania, South Carolina,
Tennessee, Virginia, and West Virginia. The only state located fully within the Appalachian region is West
Virginia.
2.3.2 Measures
Tables and maps present population prevalence measures for the use of illicit drugs, alcohol, and
tobacco products, as well as measures that indicate mental health issues and access to treatment
services. Tables show estimates of drug use prevalence by lifetime (e.g., ever used), past year, and
past month use. Prevalence measures showing the number of substance users are included in tables
in Appendix C. Measures are analyzed across socio-demographic characteristics, including age,
race/ethnicity, education, employment status, and health insurance status.
21
Substance Use
Substances studied here include alcohol and illicit drugs, such as marijuana, cocaine, heroin,
methamphetamine, and non-medical use of prescription-type drugs. Respondents are classified as
dependent on or abusing specific substances based on criteria specified in the Diagnostic and
Statistical Manual of Mental Disorders, 4th edition (DSM-IV) (American Psychiatric Association,
1994). The questions on dependence ask about health and emotional problems associated with
substance use, unsuccessful attempts to reduce use, tolerance, withdrawal, and other symptoms
related to substance use. The questions on abuse ask about problems at work, home, and school;
problems with family and friends; physical danger; and trouble with the law due to substance use.
The survey also asks about treatment for substance use problems. Specialty treatment is defined as
treatment received at drug or alcohol rehabilitation facilities, hospitals (inpatient only), or mental
health centers.
Mental Disorders
Mental disorders studied here include the prevalence and treatment of serious psychological distress
(SPD) and major depressive episodes (MDE). Past year SPD is an overall indicator of nonspecific
psychological distress that is constructed from the K6 scale administered to adults aged 19 or older
in the NSDUH. The K6 scale consists of six questions that gather information on how frequently a
respondent experienced symptoms of psychological distress during the one month in the past year
when he or she was at his or her worst emotionally. Responses to these six questions are combined
to produce a score ranging from 0 to 24, where a score of 13 or greater is considered SPD.8 This
cutoff is based on research suggesting that scores above this threshold provides an indicator of
serious mental illness. MDE is defined as a period of at least two weeks when a person experienced
a depressed mood or loss of interest or pleasure in daily activities and had symptoms that met the
criteria for major depressive disorder as described in the 4th edition of the Diagnostic and Statistical
Manual of Mental Disorders (DSM-IV) (American Psychiatric Association, 1994)9. MDE, as
defined here, can be caused by mental illness, bereavement, or substance use disorders.
Access to Treatment
Access to treatment measures studied here are past year receipt of specialty treatment for illicit drug
or alcohol use, and mental health treatment/counseling in various settings. Received Treatment at a
Specialty Facility refers to treatment received at a hospital (inpatient), alcohol or drug rehabilitation
facility (inpatient or outpatient), or mental health center in order to reduce or stop alcohol or drug
8
The Serious Psychological Distress (SPD) measure reflects only 2004 and 2005 (unadjusted, Sample B) data, as 2002
and 2003 (long form) SPD measures are not comparable to 2005 (short form) SPD measures. This information is
footnoted in the tables. Similarly, the Major Depressive Episode measure reflects only 2004 and 2005 data, as this
measure was not available prior to 2004.
9
Although there is significant overlap between those meeting the criteria of SPD and MDE, there are important
distinctions between the two. Meeting the criteria for SPD indicates that the respondent exhibited a high level of distress
due to any type of mental problem, which may include general symptoms related to phobia, anxiety, or depression.
However, meeting the criteria for MDE indicates that the respondent had the specific physical and emotional symptom
profile indicative of major depression.
22
use, or for medical problems associated with alcohol use. It excludes treatment at an emergency
room, private doctor’s office, self-help groups, prison or jail, or hospital as an outpatient.
Respondents were classified as Needing Treatment for an Illicit Drug or Alcohol Problem if they
met at least one of three criteria during the past year: (1) dependent on illicit drugs or alcohol;
(2) abuse of illicit drugs or alcohol; or (3) received treatment for an illicit drug or alcohol problem
at a specialty facility (i.e., drug and alcohol rehabilitation facilities [inpatient or outpatient],
hospitals [inpatient only], and mental health centers). Illicit drugs include marijuana/hashish,
cocaine (including crack), heroin, hallucinogens, inhalants, or prescription-type psychotherapeutics
used nonmedically.
An individual defined as Needing But Not Receiving Treatment refers to respondents who are
classified as needing treatment, but not receiving treatment for a problem at a specialty facility (e.g.,
drug and alcohol rehabilitation facilities [inpatient or outpatient], hospitals [inpatient only], and
mental health centers).
An individual defined as Felt Need for Treatment includes persons who did not receive but felt they
needed treatment, as well as persons who received treatment at a location other than a specialty
facility but felt they needed additional treatment.
2.3.3 Statistical Methods
Two major types of analyses were conducted. First, analyses were conducted to identify disparities
on substance abuse and mental disorder measures: (a) between Appalachia and non-Appalachia; (b)
within Appalachian sub-regions (northern, central, and southern); and (c) across Appalachian
Regional Commission (ARC) defined economic development level domains in the Appalachian
region (distressed, at-risk, transitional, competitive, attainment). Second, analyses were conducted
to identify patterns of more detailed geographic variations across counties. For the first type of
analyses, we combine the 2002-2005 NSDUH data and estimate across the regional, sub-regional,
and economic development domain groups. Analytic results from these analyses are presented in a
series of analytic tables and bar charts, along with descriptions of the findings. For the second type
of analyses, we use the 2002-2004 combined data and present estimates of the prevalence of
substance use or mental health problems using regional maps.
Type 1 Analysis
Regional estimates, along with the associated variance components, were calculated by SAMHSA’s
survey contractor using the SUDAAN software based on a request from NORC to SAMHSA’s
Office of Applied Studies (OAS). SUDAAN was designed for the statistical analysis of data
collected using stratified, multistage cluster sampling designs, as well as other observational and
experimental studies involving repeated measures or studies subject to cluster correlation effects
(RTI International, 2004). Although weights are used in the analyses, it is important to note that
they were neither post-stratified at the county-level nor by Appalachian region. As such, drug use
estimates could be biased.
The standard NSDUH suppression rules have been applied to the analytic tables in this
chapter. Additionally, the NSDUH weighting process does not post-stratify at the county level; thus,
23
these estimated totals (and weighted percentages, to a lesser degree) should be interpreted with
caution.
An adaptive analytic approach was used in the type 1 analyses. Adaptive analysis, a term used here
that is similar to the concept of adaptive sampling technique in statistics, involves conducting
appropriate analyses based on the analytic results at the prior stage. In this study, first, the numbers
of respondents in each of the counties included in NSDUH were obtained and examined. Second, a
set of demographics and substance use and mental disorder measures are estimated. Finally,
selected measures on need for treatment and access to treatment are estimated. Note that in the first
step, our analysis of county-level sample sizes indicated that, even with the combined four year
data, response numbers are too small to produce useful county-level estimations of substance use
and mental disorder prevalence.
Type 2 Analysis
SAMHSA, in collaboration with State treatment representatives, developed substate areas for each
State in late 2005 and early 2006. The purpose of developing these substate areas was to provide
substate-level estimates showing the geographic distribution of substance use prevalence for areas
that States would find useful for treatment planning purposes.10 The final substate area boundaries
were based on the recommendations of each State's staff, assuming the NSDUH sample sizes
provided adequate precision. Most States defined areas in terms of counties or groups of counties.
We present estimated values for all selected substance use and serious psychological distress
measures using the NSDUH defined sub-state area as the unit of analysis. As such, all counties
within those NSDUH sub-state areas are applied the same estimate as generated by SAMHSA’s
Office of Applied Studies (OAS, 200622). These estimates are then mapped showing the full
NSDUH sub-state areas, the ARC boundary, and state and county boundaries within Appalachia, to
assist in pattern detection. Note that results from the type 2 analyses are only represented by maps
shown in this chapter. All tables and their descriptions come from type 1 analysis.
2.4 Results
Demographic Characteristics of the NSDUH Population
Adolescents
Non-Hispanic whites accounted for more than four-fifths of the adolescents in Appalachia
but less than two-thirds of the adolescents outside of Appalachia. Overall, adolescent
minorities in Appalachia accounted for a larger percentage of the adolescent population than
adult minorities accounted for in the adult population.
10
These areas were defined by officials from each state, typically based on the substance abuse treatment planning areas
specified by states in their applications for a SAPT Block Grant administered by SAMHSA. There is extensive variation
in treatment planning areas across states. In some, the planning areas are used more for administrative purposes rather
than for planning purposes. In a number of states, the designated planning areas changed frequently in recent years.
Because the estimation method required a minimum NSDUH sample size of 200 to provide adequate precision,
planning areas with insufficient sample size were collapsed with adjacent areas until the minimum was obtained.
24
Most of the adolescents had private insurance (68%) in both Appalachia and outside of
Appalachia. Proportionately, more adolescents in Appalachia had Medicaid/CHIP (26.8%)
than adolescents outside of Appalachia (23.5%).
Adults
On average, 88.4% of adults in the Appalachian region and 69% of adults outside the
Appalachian region are non-Hispanic/non-Latino whites. Non-Hispanic blacks account for
7.4% of the Appalachian population, and 11.5% of the population outside of Appalachia.
Non-Hispanic Asians, American Indians, and Pacific Islanders accounted for 2.3% of the
Appalachian population and 6.2 percent of the population outside the Appalachian region.
Overall, only 2% of Appalachian residents are of Hispanic origin, while 13.3% of the
residents outside of the Appalachian region are of Hispanic origin.
The educational backgrounds of adults were quite different between the Appalachian region
and outside of Appalachia. Most of the adult residents in the Appalachian region (58.8%)
had a high school education or less, while most of the residents outside the Appalachian
region (51.9%) had attended some college or were college graduates.
About 51% of adult residents in Appalachia and 56% of adult residents outside of
Appalachia had full-time jobs. Proportions of adults having private health insurance were
similar between Appalachian and non-Appalachian regions (71.6% and 71.4% respectively),
although more Appalachian adults received Medicare than other adults (21.6% vs. 17.6%).
Substance Use
Marijuana Use
The average of marijuana use was lower for adults in Appalachia than outside of Appalachia
regardless of length of use – lifetime use (38.2% vs. 43.2%); past year use (8.4% vs. 10.3%);
and past month use (4.9% vs. 6.8%).
The average of marijuana use among adolescents was only slightly lower in Appalachia than
outside of Appalachia (14.4% vs. 14.7% for past year use; 7.0% vs. 7.7% for past month
use).
Cocaine Use
Adult residents in Appalachia had lower rates of cocaine use as compared to adult residents
outside of Appalachia, regardless of length of use – 11.7% vs. 16.0% for lifetime use; 2.2%
vs. 2.5% for past year use; 0.8% vs. 1.0% for past month use.
The percentages of adolescents who had ever used cocaine in their lifetime were the same
(2.5%) inside of Appalachia and outside of Appalachia.
25
Methamphetamine Use
Proportionately, fewer adults used methamphetamine in Appalachia than outside of
Appalachia (lifetime: 4.0% vs. 5.4%; past year: 0.4% vs. 0.6%). The current use rates,
however, were the same (0.2%).
The percentages of having ever used methamphetamine by adolescents were 1.4% in
Appalachia and 1.3% outside of Appalachia.
For adults, the southern Appalachian sub-region had a higher current methamphetamine use
rate (0.3%) than both the northern and central sub-regions (0.1%).
For adolescents, both the central (0.4%) and southern (0.5%) sub-regions had higher current
methamphetamine use rates than northern sub-region (0.1%).
To assure an adequate sample size, results were compared across county economic
development status using merged categories: “distressed/at-risk;” “transitional;” and
“competitive/attainment.” For adults, the highest prevalence rate for current
methamphetamine use was in the “competitive/attainment” counties (0.3%); for adolescents,
the highest prevalence rate for current methamphetamine use was in the “distressed/at-risk”
counties (0.6%).
Alcohol Use
Proportionately fewer Appalachian adults used alcohol in the past year compared to adults
elsewhere (61.0% vs. 70.2%). Additionally, 20.6% of Appalachian adults were binge
alcohol users in the past year as compared to 24.5% of non-Appalachia adults. In addition,
6.8% of Appalachian adults were heavy alcohol users in the past year compared to 7.3% of
non-Appalachian adults.
The reporting of heavy alcohol use by adolescents was higher inside Appalachia (2.9%) than
outside of Appalachia (2.5%).
Cigarette Use
Proportionately more adults used cigarettes in Appalachia than outside of Appalachia
(lifetime use: 75.8% vs. 72.0%; past year use: 34.5% vs. 30.4%; past-month use: 30.9% vs.
26.5%).
Similarly, proportionately more adolescents used cigarettes in Appalachia than outside of
Appalachia (lifetime use: 36.8% vs. 29.5%; past year use: 23.8% vs. 18.3%; past-month use:
16.3% vs. 11.6%).
Non-Medical Use of Psychotherapeutics
Among adults, the prevalence of the non-medical use of psychotherapeutics was slightly
lower in the Appalachian region (5.6%) than outside of the Appalachian region (5.9%).
26
Among adolescents, however, the prevalence of the non-medical use of psychotherapeutics
was higher in the Appalachian region (10.6%) than outside of the Appalachian region
(8.7%).
Alcohol and Drug Dependence or Abuse
Proportionately, fewer adults in the Appalachian region had dependence or abuse problems
as compared to adults outside of the Appalachian region: illicit drug dependence or abuse
(2.5% vs. 2.7%), alcohol dependence or abuse (6.4% vs. 8.0%), both illicit drug and alcohol
dependence or abuse (1.0% vs. 1.3%), and illicit drug or alcohol dependence or abuse (7.9%
vs. 9.4%).
Access to Treatment
Access to Alcohol Treatment
During 2002-2005, the estimated percentage of persons age 18 or older needing but not
receiving alcohol treatment in the Appalachian region was 6.1 percent; the estimated
percentage of persons age 18 or older needing but not receiving alcohol treatment outside of
the Appalachian region was 7.6 percent.
During 2002-2005, the estimated percentage of persons age 12-17 needing but not receiving
alcohol treatment in the Appalachian region was 5.6 percent; the estimated percentage of
persons age 12-17 needing but not receiving alcohol treatment outside of the Appalachian
region was 5.5 percent.
Access to Drug Treatment
During 2002-2005, the estimated percentage of persons age 18 or older needing but not
receiving drug treatment in the Appalachian region was 2.2 percent; the estimated
percentage of persons age 18 or older needing but not receiving drug treatment outside of
the Appalachian region was 2.4 percent.
During 2002-2005, the estimated percentage of persons age 12-17 needing but not receiving
drug treatment in both the Appalachian region and outside of the Appalachian region was
4.8 percent.
Locations Where Substance Abuse Treatment Was Received
Among persons who received substance abuse treatment at a specialty facility, the most
frequently reported locations are outpatient rehabilitation facilities (68%) for both the
Appalachian region and outside of the region.
Among persons who received treatment at a specialty facility, the percentage being treated
at inpatient rehabilitation facilities was 37% in the Appalachian region and 45% outside of
the Appalachian region.
27
Mental Health
Mental Health Problems
Proportionately more adults in the Appalachian region (13.5%) encountered a serious
psychological distress problem than adults outside of Appalachia (11.6%).
Proportionately more adults in the Appalachian region (8.2%) had a major depressive
episode in the past year than adults outside of Appalachia (7.6%).
Access to Mental Health Treatment / Counseling
Receiving mental health treatment. In general, adults in the Appalachian region with mental
health problems reported a somewhat greater likelihood of having received outpatient
mental health treatment or counseling in the past year (13.6%) as compared to adults outside
the Appalachian region (12.9%). This was seen in both the receipt of outpatient counseling
services (7.3% vs. 7.1%) and prescription medication services (12.0% vs. 10.5%). The
percentage of adults with mental health problems having ever received inpatient mental
health treatment was the same in both the Appalachian region and outside of Appalachia.
Reasons for not receiving mental health treatment / counseling. Cost or insurance barriers
were the primary self-reported reason why people did not receive mental health treatment or
counseling. The percentage of persons reporting these barriers was slightly lower in the
Appalachian region (44%) than outside of the region (48%). The second most frequently
cited reason for not receiving mental health treatment or counseling was that people did not
feel that it was needed and, rather, believed that they could handle the problem without
treatment – proportionately more respondents in the Appalachian region (37%) than outside
of the Appalachian region (33%) stated this reason. The third mostly reported reason for not
receiving mental health treatment or counseling was stigma. The percentage of people
reporting stigma as a reason for not receiving treatment/counseling was 28% in the
Appalachian region, compared to 22% outside of the Appalachian region.
28
2.4.1 Tables
Table 2.2 Demographic Characteristics and Health Insurance among Persons Aged 12 or Older, by Age Group and
Appalachian Region Status: Percentages, Annual Averages Based on 2002-2005
Demographic Characteristic/
Health Insurance
AGE GROUP
12-17
Appalachian Region1
Outside Appalachia
18 or Older
Appalachian Region1
Outside Appalachia
HISPANIC ORIGIN AND
RACE
Not Hispanic or Latino
97.4
82.3
98.0
86.7
White
84.2
60.0
88.4
69.0
Black or African American
11.3
15.3
7.4
11.5
Other
1.8
7.0
2.3
6.2
Hispanic or Latino
2.6
17.7
2.0
13.3
< High School
N/A
N/A
20.4
16.9
High School Graduate
N/A
N/A
38.4
31.1
Some College
N/A
N/A
22.8
25.3
College Graduate
N/A
N/A
18.4
26.6
Full-Time
N/A
N/A
51.1
55.6
Part-Time
N/A
N/A
11.9
13.2
Unemployed
N/A
N/A
3.4
3.6
Other3
N/A
N/A
33.6
27.6
67.6
68.0
71.6
71.4
0.8
0.9
21.9
17.6
26.8
23.5
9.0
7.8
2
EDUCATION
CURRENT EMPLOYMENT
HEALTH INSURANCE
Private
Medicare
4
Medicaid/CHIP
*Low precision; no estimate reported. N/A: Not applicable. 1Appalachian region is defined as all areas covered by the 410 designated counties in 13 states.
2
Includes respondents reporting American Indian or Alaska Native, Native Hawaiian or Other Pacific Islander, Asian, and Two or More Races.
3
The Other Employment category includes retired persons, disabled persons, homemakers, students, or other persons not in the labor force.
4
CHIP is the Children's Health Insurance Program. Individuals aged 19 or younger are eligible for this plan.
Source: SAMHSA, Office of Applied Studies, National Survey on Drug Use and Health, 2002, 2003, 2004, and 2005.
29
Table 2.3 Lifetime, Past Year, and Past Month Substance Use among Persons Aged 12 or Older, by Substance, Age Group,
and Appalachian Region Status: Percentages, Annual Averages Based on 2002-2005
AGE GROUP
Substance
Appalachian Region1
MARIJUANA USE
Lifetime
Past Year
Past Month
COCAINE USE
Lifetime
Past Year
Past Month
METHAMPHETAMINE USE
Lifetime
Past Year
Past Month
ALCOHOL USE
Past Year
Binge Alcohol Use2
Heavy Alcohol Use2
CIGARETTE USE
Lifetime
Past Year
Past Month
PAST YEAR NONMEDICAL
USE OF
PSYCHOTHERAPEUTICS3
12-17
Outside Appalachia
18 or Older
Appalachian Region1
Outside Appalachia
19.0
14.4
7.0
19.1
14.7
7.7
38.2
8.4
4.9
43.2
10.3
6.0
2.5
1.9
0.6
2.5
1.8
0.6
11.7
2.2
0.8
16.0
2.5
1.0
1.4
0.7
0.3
1.3
0.7
0.2
4.0
0.4
0.2
5.4
0.6
0.2
33.8
10.5
2.9
34.0
10.6
2.5
61.0
20.6
6.8
70.2
24.5
7.3
36.8
23.8
16.3
10.6
29.5
18.3
11.6
8.7
75.8
34.5
30.9
5.6
72.0
30.4
26.5
5.9
*Low precision; no estimate reported.
Appalachian region is defined as all areas covered by the 410 designated counties in 13 states.
Binge Alcohol Use is defined as drinking five or more drinks on the same occasion (i.e., at the same time or within a couple of hours of each other) on at least 1 day in the past 30
days. Heavy Alcohol Use is defined as drinking five or more drinks on the same occasion on each of 5 or more days in the past 30 days; all heavy alcohol users are also binge
alcohol users.
3
Nonmedical use of prescription-type psychotherapeutics includes the nonmedical use of pain relievers, tranquilizers, stimulants, or sedatives and does not include over-thecounter drugs.
Source: SAMHSA, Office of Applied Studies, National Survey on Drug Use and Health, 2002, 2003, 2004, and 2005.
1
2
30
Table 2.4 Substance Dependence or Abuse, Mental Health Measures, and Receipt of Substance Use Treatment in the Past
Year among Persons Aged 12 or Older, by Age Group and Appalachian Region Status: Percentages, Annual Averages
Based on 2002-2005
AGE GROUP
Dependence or Abuse/Mental Health/Receipt of Treatment
12-17
Appalachian
Region1
Outside
Appalachia
18 or Older
Appalachian
Outside
Region1
Appalachia
DEPENDENCE OR ABUSE2
5.2
5.9
2.5
8.6
5.2
5.8
2.3
8.7
2.5
6.4
1.0
7.9
2.7
8.0
1.3
9.4
PAST YEAR SERIOUS PSYCHOLOGICAL DISTRESS4
N/A
N/A
13.5
11.6
PAST YEAR MAJOR DEPRESSIVE EPISODE5
8.8
8.9
8.2
7.6
PAST YEAR RECEIPT OF SPECIALTY TREATMENT FOR
ILLICIT DRUG OR ALCOHOL USE3,6
0.9
0.7
0.9
1.0
MENTAL HEALTH TREATMENT/COUNSELING7
N/A
N/A
13.6
12.9
Inpatient
N/A
N/A
0.9
0.9
Outpatient
N/A
N/A
7.3
7.1
Prescription Medication
N/A
N/A
12.0
10.5
Illicit Drugs3
Alcohol
Both Illicit Drugs and Alcohol3
Illicit Drugs or Alcohol3
*Low precision; no estimate reported.
N/A: Not applicable.
Appalachian region is defined as all areas covered by the 410 designated counties in 13 states.
2
Dependence or abuse is based on definitions found in the 4th edition of the Diagnostic and Statistical Manual of Mental Disorders (DSM-IV).
3
Illicit Drugs include marijuana/hashish, cocaine (including crack), heroin, hallucinogens, inhalants, or prescription-type psychotherapeutics used non-medically.
4
Serious Psychological Distress (SPD) is defined as having a score of 13 or higher on the K6 scale. Due to questionnaire changes, these combined 2004 and 2005 estimates are not
comparable with 2004 and earlier estimates published in prior NSDUH reports. See Section B.4.4 in Appendix C of the Results from the 2005 National Survey on Drug Use and Health:
National Findings. Estimates are based on combined 2004-2005 data.
5
Major Depressive Episode (MDE) is defined as a period of at least 2 weeks when a person experienced a depressed mood or loss of interest or pleasure in daily activities and had a majority
of the symptoms for depression as described in the 4th edition of the Diagnostic and Statistical Manual of Mental Disorders (DSM-IV). Estimates are based on combined 2004-2005 data.
6
Received Substance Use Treatment at a Specialty Facility refers to treatment received at a hospital (inpatient), rehabilitation facility (inpatient or outpatient), or mental health center in order
to reduce or stop illicit drug or alcohol use, or for medical problems associated with illicit drug or alcohol use. Estimates include persons who received treatment specifically for illicit drugs
or alcohol, as well as persons who received treatment but did not specify for what substance(s).
7
Mental Health Treatment/Counseling is defined as having received inpatient care or outpatient care or having used prescription medication for problems with emotions, nerves, or mental
health. Respondents were not to include treatment for drug or alcohol use. Respondents with unknown treatment/counseling information were excluded. Estimates were based only on
responses to items in the Adult Mental Health Service Utilization module.
1
Source: SAMHSA, Office of Applied Studies, National Survey on Drug Use and Health, 2002, 2003, 2004, and 2005.
31
Table 2.5 Demographic Characteristics and Health Insurance among Persons Aged 12 or Older Residing in Appalachian
Region, by Age Group and Appalachian Sub-Region: Percentages, Annual Averages Based on 2002-2005
Demographic
Characteristic/Health
Insurance
HISPANIC ORIGIN AND
RACE
Not Hispanic or Latino
White
Black or African American
Other1
Hispanic or Latino
EDUCATION
< High School
High School Graduate
Some College
College Graduate
CURRENT EMPLOYMENT
Full-Time
Part-Time
Unemployed
Other2
HEALTH INSURANCE
Private
Medicare
Medicaid/CHIP3
AGE GROUP
12-17
Central
Southern
Northern
18 or Older
Central
Southern
97.9
91.1
4.5
2.3
2.1
98.0
94.7
1.1
2.1
2.0
96.8
75.2
20.2
1.4
3.2
98.9
93.7
3.4
1.8
1.1
98.7
95.5
1.7
1.5
1.3
97.1
81.8
12.4
2.9
2.9
N/A
N/A
N/A
N/A
N/A
N/A
N/A
N/A
N/A
N/A
N/A
N/A
16.3
42.1
22.7
18.9
30.7
40.0
18.9
10.4
22.3
34.6
23.7
19.5
N/A
N/A
N/A
N/A
N/A
N/A
N/A
N/A
N/A
N/A
N/A
N/A
49.1
12.8
3.6
34.4
43.1
9.0
3.8
44.1
54.4
11.7
3.2
30.7
72.3
0.5
22.4
50.1
0.6
42.2
66.3
1.1
28.0
74.0
22.3
8.1
63.8
27.8
14.4
70.8
20.4
8.7
Northern
*Low precision; no estimate reported.
NOTE: Appalachian region is defined as all areas covered by the 410 designated counties in 13 states.
N/A: Not applicable.
1
Includes respondents reporting American Indian or Alaska Native, Native Hawaiian or Other Pacific Islander, Asian, and Two or More Races.
2
The Other Employment category includes retired persons, disabled persons, homemakers, students, or other persons not in the labor force.
3
CHIP is the Children's Health Insurance Program. Individuals aged 19 or younger are eligible for this plan.
Source: SAMHSA, Office of Applied Studies, National Survey on Drug Use and Health, 2002, 2003, 2004, and 2005.
32
Table 2.6 Lifetime, Past Year, and Past Month Substance Use among Persons Aged 12 or Older Residing in Appalachian
Region, by Substance, Age Group, and Appalachian Sub-Region: Percentages, Annual Averages Based on 2002-2005
AGE GROUP
Substance
Northern
MARIJUANA USE
Lifetime
12-17
Central
Southern
Northern
18 or Older
Central
Southern
19.2
17.5
18.9
38.9
33.0
38.6
Past Year
15.1
12.5
14.1
9.0
6.6
8.1
Past Month
7.5
4.3
7.0
5.5
3.7
4.5
Lifetime
2.2
2.3
2.9
11.8
7.7
12.4
Past Year
1.7
1.9
2.2
2.3
1.6
2.2
Past Month
0.6
0.5
0.5
0.8
0.4
0.8
Lifetime
1.2
1.7
1.5
4.0
2.1
4.4
Past Year
0.5
0.6
0.9
0.3
0.3
0.6
Past Month
0.1
0.4
0.5
0.1
0.1
0.3
Past Year
36.7
28.8
31.8
69.3
43.5
56.5
Binge Alcohol Use1
12.3
8.1
9.3
24.6
14.0
18.1
Heavy Alcohol Use1
3.3
2.4
2.5
8.2
4.1
5.9
Lifetime
35.6
42.0
36.9
76.9
75.3
74.9
Past Year
23.8
24.3
23.7
35.2
37.0
33.4
Past Month
16.5
17.2
15.9
31.5
33.2
29.8
9.1
10.4
12.1
5.0
6.4
6.2
COCAINE USE
METHAMPHETAMINE USE
ALCOHOL USE
CIGARETTE USE
PAST YEAR NONMEDICAL USE OF
PSYCHOTHERAPEUTICS2
*Low precision; no estimate reported. NOTE: Appalachian region is defined as all areas covered by the 410 designated counties in 13 states. 1Binge Alcohol Use is defined as drinking five or more drinks on the same occasion
(i.e., at the same time or within a couple of hours of each other) on at least 1 day in the past 30 days. Heavy Alcohol Use is defined as drinking five or more drinks on the same occasion on each of 5 or more days in the past 30
days; all heavy alcohol users are also binge alcohol users. 2 Nonmedical use of prescription-type psychotherapeutics includes the nonmedical use of pain relievers, tranquilizers, stimulants, or sedatives and does not include overthe-counter drugs. Source: SAMHSA, Office of Applied Studies, National Survey on Drug Use and Health, 2002, 2003, 2004, and 2005.
33
Table 2.7 Substance Dependence or Abuse, Mental Health Measures, and Receipt of Substance Use Treatment in the Past
Year among Persons Aged 12 or Older Residing in Appalachian Region, by Age Group and Appalachian Sub-Region:
Percentages, Annual Averages Based on 2002-2005
AGE GROUP
Dependence or Abuse/Mental
Health/Receipt of Treatment
12-17
Central
Southern
Northern
18 or Older
Central
Southern
5.3
3.1
5.5
2.4
3.1
2.4
6.5
4.3
5.6
7.2
4.8
6.0
2.8
1.7
2.3
1.1
1.2
1.0
9.0
5.7
8.8
8.5
6.7
7.5
PAST YEAR SERIOUS
PSYCHOLOGICAL DISTRESS3
N/A
N/A
N/A
13.8
16.1
12.7
PAST YEAR MAJOR
DEPRESSIVE EPISODE4
8.8
9.1
8.8
7.9
10.6
8.0
PAST YEAR RECEIPT OF
SPECIALTY TREATMENT FOR
ILLICIT DRUG OR ALCOHOL
USE2,5
0.8
0.7
1.0
1.0
0.5
0.8
MENTAL HEALTH
TREATMENT/COUNSELING6
N/A
N/A
N/A
13.7
15.4
13.1
Inpatient
N/A
N/A
N/A
0.7
1.0
1.0
Outpatient
N/A
N/A
N/A
7.0
7.4
7.5
Prescription Medication
N/A
N/A
N/A
11.9
14.4
11.7
Northern
1
DEPENDENCE OR ABUSE
Illicit Drugs2
Alcohol
2
Both Illicit Drugs and Alcohol
2
Illicit Drugs or Alcohol
Table is continued on the next page
34
Table 2.7 Substance Dependence or Abuse, Mental Health Measures, and Receipt of Substance Use Treatment in the Past
Year among Persons Aged 12 or Older Residing in Appalachian Region, by Age Group and Appalachian Sub-Region:
Percentages, Annual Averages Based on 2002-2005
NOTES:
*Low precision; no estimate reported.
NOTE: Appalachian region is defined as all areas covered by the 410 designated counties in 13 states.
N/A: Not applicable.
1
Dependence or abuse is based on definitions found in the 4th edition of the Diagnostic and Statistical Manual of Mental Disorders (DSM-IV).
Illicit Drugs include marijuana/hashish, cocaine (including crack), heroin, hallucinogens, inhalants, or prescription-type psychotherapeutics used non-medically.
3
Serious Psychological Distress (SPD) is defined as having a score of 13 or higher on the K6 scale. Due to questionnaire changes, these combined 2004 and 2005 estimates are not
comparable with 2004 and earlier estimates published in prior NSDUH reports. See Section B.4.4 in Appendix C of the Results from the 2005 National Survey on Drug Use and
Health: National Findings. Estimates are based on combined 2004-2005 data.
4
Major Depressive Episode (MDE) is defined as a period of at least 2 weeks when a person experienced a depressed mood or loss of interest or pleasure in daily activities and had
a majority of the symptoms for depression as described in the 4th edition of the Diagnostic and Statistical Manual of Mental Disorders (DSM-IV). Estimates are based on
combined 2004-2005 data.
5
Received Substance Use Treatment at a Specialty Facility refers to treatment received at a hospital (inpatient), rehabilitation facility (inpatient or outpatient), or mental health
center in order to reduce or stop illicit drug or alcohol use, or for medical problems associated with illicit drug or alcohol use. Estimates include persons who received treatment
specifically for illicit drugs or alcohol, as well as persons who received treatment but did not specify for what substance(s).
6
Mental Health Treatment/Counseling is defined as having received inpatient care or outpatient care or having used prescription medication for problems with emotions, nerves, or
mental health. Respondents were not to include treatment for drug or alcohol use. Respondents with unknown treatment/counseling information were excluded. Estimates were
based only on responses to items in the Adult Mental Health Service Utilization module.
2
Source: SAMHSA, Office of Applied Studies, National Survey on Drug Use and Health, 2002, 2003, 2004, and 2005.
35
Table 2.8 Demographic Characteristics and Health Insurance among Persons Aged 12 or Older Residing in Appalachian
Region, by Age Group and Appalachian Socioeconomic Status: Percentages, Annual Averages Based on 2002-2005
Demographic
Characteristic/Health Insurance
AGE GROUP
At-Risk or
Distressed
HISPANIC ORIGIN AND RACE
Not Hispanic or Latino
12-17
Transitional
Competitive
or
Attainment
At-Risk or
Distressed
18 or Older
Transitional
Competitive
or
Attainment
98.9
97.4
96.3
98.9
98.6
96.1
White
88.3
87.5
73.7
89.0
91.1
81.2
Black or African American
9.5
8.1
20.3
8.6
5.5
11.3
Other1
1.1
1.8
2.4
1.3
2.0
3.6
Hispanic or Latino
1.1
2.6
3.7
1.1
1.4
3.9
< High School
N/A
N/A
N/A
28.9
20.2
14.9
High School Graduate
N/A
N/A
N/A
41.8
39.5
33.4
Some College
N/A
N/A
N/A
18.4
23.7
23.7
College Graduate
N/A
N/A
N/A
10.9
16.7
28.0
Full-Time
N/A
N/A
N/A
43.8
51.3
55.5
Part-Time
N/A
N/A
N/A
9.7
12.3
12.7
Unemployed
N/A
N/A
N/A
4.5
3.3
3.1
Other2
N/A
N/A
N/A
42.0
33.1
28.8
EDUCATION
CURRENT EMPLOYMENT
*Low precision; no estimate reported.
NOTE: Appalachian region is defined as all areas covered by the 410 designated counties in 13 states.
N/A: Not applicable.
1
2
Includes respondents reporting American Indian or Alaska Native, Native Hawaiian or Other Pacific Islander, Asian, and Two or More Races.
The Other Employment category includes retired persons, disabled persons, homemakers, students, or other persons not in the labor force.
Source: SAMHSA, Office of Applied Studies, National Survey on Drug Use and Health, 2002, 2003, 2004, and 2005.
***Table is continued on the next page***
36
Table 2.8 Demographic Characteristics and Health Insurance among Persons Aged 12 or Older Residing in Appalachian
Region, by Age Group and Appalachian Socioeconomic Status: Percentages, Annual Averages Based on 2002-2005
HEALTH INSURANCE
Private
52.4
69.4
73.5
63.2
72.8
74.4
Medicare
1.0
0.6
1.0
25.4
22.2
18.8
Medicaid/CHIP3
40.4
25.4
20.8
14.1
8.6
6.3
*Low precision; no estimate reported.
NOTE: Appalachian region is defined as all areas covered by the 410 designated counties in 13 states.
N/A: Not applicable.
3
CHIP is the Children's Health Insurance Program. Individuals aged 19 or younger are eligible for this plan.
Source: SAMHSA, Office of Applied Studies, National Survey on Drug Use and Health, 2002, 2003, 2004, and 2005.
37
Table 2.9 Lifetime, Past Year, and Past Month Substance Use among Persons Aged 12 or Older Residing in Appalachian
Region, by Substance, Age Group, and Appalachian Socioeconomic Status: Percentages, 2002-2005
Substance
AGE GROUP
At-Risk or
Distressed
12-17
Transitional
Competitive or
Attainment
At-Risk or
Distressed
18 or Older
Transitional
Competitive or
Attainment
MARIJUANA USE
Lifetime
19.6
19.1
18.2
32.6
38.3
41.8
Past Year
13.8
14.8
14.0
5.9
8.9
8.7
Past Month
5.8
7.3
7.1
3.0
5.3
5.1
Lifetime
3.1
2.8
1.5
8.2
11.6
14.3
Past Year
2.2
2.2
1.2
1.3
2.4
2.1
Past Month
0.9
0.5
0.4
0.4
0.9
0.7
Lifetime
2.1
1.4
0.9
1.9
4.2
4.8
Past Year
0.9
0.7
0.4
0.4
0.5
0.3
Past Month
0.6
0.3
0.2
0.1
0.2
0.3
COCAINE USE
METHAMPHETAMINE USE
ALCOHOL USE
Past Year
31.4
34.8
33.0
43.6
62.1
70.6
Binge Alcohol Use1
10.1
11.4
8.8
15.3
21.9
21.1
Heavy Alcohol Use2
2.8
3.1
2.4
4.8
7.5
6.3
Lifetime
43.6
37.8
30.0
75.0
76.1
75.7
Past Year
25.7
24.7
20.3
37.4
35.3
30.5
Past Month
18.9
16.8
13.4
33.8
31.6
27.1
11.4
11.3
8.4
5.5
6.0
4.9
CIGARETTE USE
PAST YEAR NONMEDICAL USE OF
PSYCHOTHERAPEUTICS2
NOTES:
*Low precision; no estimate reported. Appalachian region is defined as all areas covered by the 410 designated counties in 13 states.
1
Binge Alcohol Use is defined as drinking five or more drinks on the same occasion (i.e., at the same time or within a couple of hours of each other) on at least 1 day in the past 30
days. Heavy Alcohol Use is defined as drinking five or more drinks on the same occasion on each of 5 or more days in the past 30 days; all heavy alcohol users are also binge
alcohol users.
2
Nonmedical use of prescription-type psychotherapeutics includes the nonmedical use of pain relievers, tranquilizers, stimulants, or sedatives and does not include over-thecounter drugs.
Source: SAMHSA, Office of Applied Studies, National Survey on Drug Use and Health, 2002, 2003, 2004, and 2005.
38
Table 2.10 Substance Dependence or Abuse, Mental Health Measures, and Receipt of Substance Use Treatment in the Past
Year among Persons Aged 12 or Older Residing in Appalachian Region, by Age Group and Appalachian Socioeconomic
Status: Percentages, Annual Averages Based on 2002-2005
AGE GROUP
Dependence or Abuse/Mental
Health/Receipt of Treatment
At-Risk or
Distressed
DEPENDENCE OR ABUSE1
Illicit Drugs2
12-17
Transitional
Competitive or
Attainment
At-Risk or
Distressed
18 or Older
Transitional
Competitive or
Attainment
5.1
5.6
4.3
2.5
2.6
2.1
Alcohol
5.3
6.6
4.7
4.7
6.8
6.9
Both Illicit Drugs and Alcohol2
2.0
3.0
1.7
0.9
1.2
0.9
Illicit Drugs or Alcohol2
8.4
9.2
7.4
6.3
8.2
8.1
N/A
N/A
N/A
17.4
11.8
15.3
9.9
8.3
9.5
10.5
6.9
9.7
1.1
1.0
0.6
0.6
1.0
0.8
N/A
N/A
N/A
16.0
13.1
12.9
1.1
0.8
1.0
PAST YEAR SERIOUS
PSYCHOLOGICAL DISTRESS3
PAST YEAR MAJOR DEPRESSIVE
EPISODE4
PAST YEAR RECEIPT OF
SPECIALTY TREATMENT FOR
ILLICIT DRUG OR ALCOHOL USE2,5
MENTAL HEALTH
TREATMENT/COUNSELING6
Inpatient
N/A
N/A
N/A
Outpatient
N/A
N/A
N/A
8.6
7.2
6.6
Prescription Medication
N/A
N/A
N/A
14.2
11.6
11.6
*Low precision; no estimate reported.
NOTE: Appalachian region is defined as all areas covered by the 410 designated counties in 13 states.
N/A: Not applicable.
1
Dependence or abuse is based on definitions found in the 4th edition of the Diagnostic and Statistical Manual of Mental Disorders (DSM-IV).
2
Illicit Drugs include marijuana/hashish, cocaine (including crack), heroin, hallucinogens, inhalants, or prescription-type psychotherapeutics used non-medically.
3
Serious Psychological Distress (SPD) is defined as having a score of 13 or higher on the K6 scale. Due to questionnaire changes, these combined 2004 and 2005 estimates are not comparable with
2004 and earlier estimates published in prior NSDUH reports. See Section B.4.4 in Appendix C of the Results from the 2005 National Survey on Drug Use and Health: National Findings. Estimates
are based on combined 2004-2005 data.
4
Major Depressive Episode (MDE) is defined as a period of at least 2 weeks when a person experienced a depressed mood or loss of interest or pleasure in daily activities and had a majority of the
symptoms for depression as described in the 4th edition of the Diagnostic and Statistical Manual of Mental Disorders (DSM-IV). Estimates are based on combined 2004-2005 data.
5
Received Substance Use Treatment at a Specialty Facility refers to treatment received at a hospital (inpatient), rehabilitation facility (inpatient or outpatient), or mental health center in order to reduce
or stop illicit drug or alcohol use, or for medical problems associated with illicit drug or alcohol use. Estimates include persons who received treatment specifically for illicit drugs or alcohol, as well as
persons who received treatment but did not specify for what substance(s).
6
Mental Health Treatment/Counseling is defined as having received inpatient care or outpatient care or having used prescription medication for problems with emotions, nerves, or mental health.
Respondents were not to include treatment for drug or alcohol use. Respondents with unknown treatment/counseling information were excluded. Estimates were based only on responses to items in the
Adult Mental Health Service Utilization module. Source: SAMHSA, Office of Applied Studies, National Survey on Drug Use and Health, 2002, 2003, 2004, and 2005.
39
Figure 2.1. Geographic Variation in Individuals’ Health Insurance: Adolescents and Adults
Geographic Variation in Individual's Health
Insurance in Appalachia,
Adolescents Aged 12 to 17
100
North
100
80
South
72.3
80
50.1
Percent
Percent
60
70
66.3
70
42.2
50
40
22.4
30
North
90
Central
90
Geographic Variation in Individual's Health
Insurance in Appalachia, Adults 18 and Older
74
Central
63.8 70.8
60
50
40
27.8
30
28
20
20
10
10
0
South
22.3
20.4
14.4
8.1
8.7
0
Private
Medicaid/ CHIP
Private
Medicare
Medicaid/ CHIP
Figure 2.1 shows geographic variation in health insurance status among adolescents aged 12 to 17 and adults aged 18 and older. For
private health insurance, the northern Appalachian sub-region has the highest rate of insurance for adolescents (72.3%) and adults (74%),
while the central Appalachian sub-region has the lowest rates of insurance for adolescents (50.1%) and adults (63.8%). For Medicaid/
CHIP, the northern sub-region has the lowest rates of insurance in adolescents (22.4%) and adults (8.1%). The central sub-region has the
largest proportion of adults with Medicare (27.8%) followed by the northern sub-region (22.3%).
40
Figure 2.2. Geographic Variation in Individuals’ Health Insurance: Adolescents and Adults
County Economic Development Level and
Individuals' Health Insurance in Appalachia,
Adolescents Aged 12 to 17
County Economic Development Level and
Individuals' Health Insurance in Appalachia,
Adults Aged 18 and Older
100
100
90
Distressed or
At-Risk
73.5
80
69.4
70
40.4
40
Percent
Percent
Competitive or
Attainment
52.4
50
25.4
30
Transitional
Competitive or
Attainment
60
50
40
20
20
10
10
0
0
25.4
22.2
18.8
14.1
Private
Medicaid/ CHIP
74.4
63.2
30
20.8
Private
72.8
80
Transitional
70
60
Distressed or At-Risk
90
Medicare
8.6
6.3
Medicaid/ CHIP
Figure 2.2 shows individual health insurance by county economic development level in Appalachia. There is a linear relationship
between economic development level and insurance, and the directions of these relationships are different for each type of insurance.
There is a positive relationship between economic development level and private insurance; distressed or at-risk counties have the lowest
rates of private insurance for adolescents (52.4%) and adults (63.2%), and competitive or attainment counties have the highest rates of
private insurance for adolescent (73.5%) and adults (74.4%). The trend for Medicaid/ CHIP is also linear, though the variables are
inversely related. At-risk or distressed counties have the highest rates of Medicaid/ CHIP for adolescents (40.4%) and adults (14.1%),
and Medicare for adults (25.4%). Conversely, rates for Medicaid/ CHIP and Medicare are lowest in competitive or attainment counties.
41
Figure 2.3. Non-Medical Use of Prescription Drugs Among Adolescents Aged 12 to 17
30
Past Year Nonmedical Use of Psychotherapeutics in
Appalachia, Adolescents Age 12 to 17
30
25
25
20
11.4
11.3
8.4
10
Percent
Percent
20
15
Past Year Nonmedical Use of Psychotherapeutics in
Appalachia, Adolescents Aged 12 to 17
12.1
15
9.1
10.4
10
5
5
0
At-Risk or
Distressed
Transitional
Competitive or
Attainment
0
North
County Economic Development Status
Central
South
Sub-Region
Figure 2.3 presents non-medical use of prescription drugs among adolescents age 12 to 17 by county economic development status and
Appalachian sub-region. Non-medical use of prescription drugs among adolescents is higher in the central (10.4%) and southern subregions (12.1%) of Appalachia, as compared to the northern sub-region (9.1%). Across economic development status, we see that
competitive or attainment counties have the lowest rate of non-medical use of prescription drugs among adolescents (8.4%), followed by
transitional counties (11.3%) and distressed or at-risk counties (11.4%).
42
Figure 2.4. Mental Disorders Among Adults Aged 18 and Older in Appalachian Sub-Regions
Mental Health Disorders Among Adults in
Appalachian Sub-Regions
18
16.1
16
14
North
13.8
Central
12.7
South
Percent
12
10.6
10
7.9
8
8
6
4
2
0
Past Year Serious
Pyschological Distress
Past Year Major Depressive
Episode
Figure 2.4 shows mental health disorders among adults aged 18 and older in Appalachia. The
prevalence rates for serious psychological distress in the past year and major depressive episode in
the past year are high across all sub-regions. The highest prevalence rates for both serious
psychological distress and major depressive episode are in the central sub-region (16.1% and
10.6%, respectively). For the variable, serious psychological distress in the past year, the northern
sub-region has a rate of 13.8%, and the southern sub-region has a rate of 12.7%. For the variable,
major depressive episode in the past year, the northern and southern sub-regions have a prevalence
rate of approximately 8%.
43
Table 2.11 Access to Alcohol Treatment among Persons Aged 12 or Older, by Age Group and Appalachian Region Status:
Percentages, Annual Averages Based on 2002-2005
Age 12-17
Appalachian
Region
Age 18 or Older
Outside Appalachia
Appalachian Region
Outside Appalachia
5.6
0.2
5.5
0.2
6.1
0.3
7.6
0.4
0.1
0.1
0.2
0.3
1,2
Access to Alcohol Treatment
Needed But Not Received Alcohol Treatment
Felt Need for Alcohol Treatment
Felt Need for Alcohol Treatment
and Made No Effort
*Low precision; no estimate reported.
NOTE: Received Alcohol Treatment at a Specialty Facility refers to treatment received at a hospital (inpatient), rehabilitation facility (inpatient or outpatient), or mental health
center in order to reduce or stop alcohol use, or for medical problems associated with alcohol use.
1
Needing But Not Receiving Treatment refers to respondents classified as needing treatment for alcohol, but have not received treatment for an alcohol problem at a specialty
facility (i.e., drug and alcohol rehabilitation facilities [inpatient or outpatient], hospitals [inpatient only], and mental health centers).
2
Felt Need for Treatment includes persons who did not receive but felt they needed treatment for an alcohol problem, as well as persons who received treatment at a location other
than a specialty facility but felt they needed additional treatment.
Source: SAMHSA, Office of Applied Studies, National Survey on Drug Use and Health, 2002, 2003, 2004, and 2005.
44
Table 2.12 Access to Drug Treatment among Persons Aged 12 or Older, by Age Group and Appalachian Region Status:
Percentages, Annual Averages Based on 2002-2005
Age 12-17
Appalachian Region
Age 18 or Older
Outside Appalachia
Appalachian Region
Outside Appalachia
4.8
4.8
2.2
2.4
0.3
0.3
0.3
0.4
0.2
0.2
0.2
0.2
1,2
Access to Drug Treatment
Needed But Not Received Treatment for an
Illicit Drug Problem
Felt Need for Treatment for an Illicit Drug
Problem
Felt Need for Treatment for an Illicit Drug
Problem and Made No Effort
*Low precision; no estimate reported.
NOTE: Illicit Drugs include marijuana/hashish, cocaine (including crack), heroin, hallucinogens, inhalants, or prescription-type pychotherapeutics used nonmedically.
NOTE: Received Illicit Drug Treatment at a Specialty Facility refers to treatment received at a hospital (inpatient), rehabilitation facility (inpatient or outpatient), or mental health
center in order to reduce or stop illicit drug use, or for medical problems associated with illicit drug use.
1
Needing But Not Receiving Treatment refers to respondents classified as needing treatment for illicit drugs, but have not received treatment for an illicit drug problem at a
specialty facility (i.e., drug and alcohol rehabilitation facilities [inpatient or outpatient], hospitals [inpatient only], and mental health centers.
2
Felt Need for Treatment includes persons who did not receive but felt they needed treatment for an illicit drug problem, as well as persons who received treatment at a location
other than a specialty facility but felt they needed additional treatment.
Source: SAMHSA, Office of Applied Studies, National Survey on Drug Use and Health, 2002, 2003, 2004, and 2005.
45
Table 2.13 Reasons for Not Receiving Substance Use Treatment and Locations of Treatment among Persons Aged 12 or Older, by
Age Group and Appalachian Region Status: Percentages, Annual Averages Based on 2002-2005
Appalachian
Region
Reasons for Not Receiving Drug or Alcohol Treatment among
Persons Who Needed But Did Not Receive Treatment at a
Specialty Facility1
Cost/Insurance Barriers2
Not Ready to Stop Using
Stigma3,7
Age 12-17
Outside Appalachia
Age 18 or Older
Appalachian Region
Outside Appalachia
*
*
*
*
16.3
34.5
26.5
12.4
*
*
*
*
36.5
39.8
22.4
12.7
Did Not Feel Need for Treatment/Could Handle the Problem
Without Treatment4,7
*
17.4
*
14.2
Did Not Have Time7
*
6.1
*
4.5
*
6.5
*
4.1
*
16.1
*
14.2
*
*
*
*
*
*
*
*
51.0
67.0
41.2
42.1
36.0
15.8
20.4
13.0
57.5
68.4
37.1
48.2
34.9
19.3
18.3
8.0
64.8
67.7
44.9
42.1
33.4
12.7
16.0
9.2
Did Not Know Where to Go for Treatment
7
Treatment Would Not Help
5
Other Access Barriers
Locations Where Past Year Substance Treatment was Received
among Persons Who Received Treatment at a Specialty Facility6
Self-Help Group
Outpatient Rehabilitation
Inpatient Rehabilitation
Mental Health Center
Hospital Inpatient
Private Doctor's Office
Emergency Room
Prison or Jail
NOTES:
*Low precision; no estimate reported.
Needing But Not Receiving Treatment refers to respondents classified as needing treatment for illicit drugs or alcohol, but have not received treatment for an illicit drug or alcohol problem at a specialty facility.
Felt Need for Treatment includes persons who did not receive but felt they needed treatment for an illicit drug or alcohol problem, as well as persons who received treatment at a location other than a specialty facility but felt they needed additional treatment.
1
Respondents could indicate multiple reasons; thus, these response categories are not mutually exclusive.
2
Includes reasons of "No health coverage and could not afford cost," "Had health coverage but did not cover treatment or did not cover cost," and other-specify responses of "Could not afford cost; health coverage not indicated."
3
Includes reasons of "Might cause neighbors/community to have negative opinion," "Might have negative effect on job," "Did not want others to find out," and other-specify responses of "Ashamed/embarrassed/afraid" and "Afraid would have trouble with the police/social
services."
4
Includes reasons of "Did not feel need for treatment," "Could handle the problem without treatment," and other-specify responses of "Could do it with support of family/friends/ others," and "Could do it through religion/spirituality."
5
Includes reasons of "No transportation/inconvenient," "No program having type of treatment," "No openings in a program," and other-specify responses of "No program had counselor/doctors with whom you were comfortable," "Services desired were unavailable or you
were currently ineligible," and "Attempted to get treatment but encountered delays."
6
Respondents could indicate multiple locations of treatment; thus, these response categories are not mutually exclusive.
7
Estimates are based only on combined 2003-2005 data.
Source: SAMHSA, Office of Applied Studies, National Survey on Drug Use and Health, 2002, 2003, 2004, and 2005.
46
Table 2.14 Reasons for Not Receiving Mental Health Treatment among Persons Aged 12 or Older, by Age Group and
Appalachian Region Status: Percentages, Annual Averages Based on 2002-2005
Age 12-17
Appalachian
Region
Outside Appalachia
Age 18 or Older
Appalachian Region Outside Appalachia
Reasons for Not Receiving Mental Health Treatment/Counseling among Persons with an Unmet Need for Mental Health Treatment1,2
N/A
N/A
44.1
47.6
Cost/Insurance Barriers2
Did Not Feel Need for Treatment/Could Handle
N/A
N/A
37.1
33.4
the Problem Without Treatment3,7
Stigma4,7
N/A
N/A
27.6
22.2
Did not Know Where to Go for Services
N/A
N/A
12.4
18.9
Did Not Have Time7
N/A
N/A
13.3
15.7
Treatment Would Not Help5,7
N/A
N/A
9.4
10.1
Fear of Being Committed/Have to Take Medicine
N/A
N/A
11.6
7.6
Other Access Barriers6,7
N/A
N/A
4.0
5.7
*Low precision; no estimate reported.
N/A: Not applicable.
NOTE: Unmet Need for Mental Health Treatment/Counseling is defined as a perceived need for treatment that was not received.
NOTE: Estimates represent reasons for not receiving mental health treatment/counseling for all persons aged 18 or older with an unmet need for treatment, including those with
unknown mental health treatment/counseling information.
NOTE: Mental Health Treatment/Counseling is defined as having received inpatient care or outpatient care or having used prescription medication for problems with emotions,
nerves, or mental health. Respondents were not to include treatment for drug or alcohol use. Respondents with unknown treatment/counseling information were excluded.
Estimates were based only on responses to items in the Adult Mental Health Service Utilization module.
1
Respondents could indicate multiple reasons; thus, these response categories are not mutually exclusive.
2
Includes reasons of "Could not afford," "Health insurance does not pay enough," "Health insurance does not cover mental health treatment," and other-specify responses of "No
health insurance."
3
Includes reasons of "Did not feel need for treatment," "Could handle problem without treatment," and other responses of "Work on problems with family/friends" and "Work on
problems through religion/spirituality."
4
Includes reasons of "Might cause neighbors/community to have negative opinion," "Might have negative effect on job," "Concerned about confidentiality," "Did not want others
to find out," and other-specify responses of "Ashamed/embarrassed/afraid," "Concerned how court system would treat me," and "Concerned how it would affect future
insurability."
5
Includes reasons of "Did not feel need for treatment," "Could handle problem without treatment," and other-specify responses of "Work on problems with family/friends" and
"Work on problems through religion/spirituality."
6
Includes reasons of "No transportation/inconvenient" and other-specify responses of "Too much red tape/hassle to get services," "No openings/long waiting lists/delays,"
"Services unavailable/limited in area," "Attempted to get treatment but unsuccessful in finding help," and "Could not find program/counselor comfortable with."
7
Estimates are based only on combined 2003-2005 data.
Source: SAMHSA, Office of Applied Studies, National Survey on Drug Use and Health, 2002, 2003, 2004, and 2005.
47
Table 2.15 Access to Alcohol Use Treatment among Persons Aged 12 or Older, by Age Group and Appalachian Sub-Region:
Percentages, Annual Averages Based on 2002-2005
Northern
Age 12-17
Central
Southern
Northern
Age 18 or Older
Central
Southern
1,2
Access to Alcohol Treatment
Needed But Not Received Alcohol Treatment
Felt Need for Alcohol Treatment
Felt Need for Alcohol Treatment and Made
No Effort
6.2
0.2
4.2
0.5
5.3
0.1
6.8
0.4
4.6
0.5
5.8
0.3
0.1
0.3
0.1
0.2
0.5
0.2
*Low precision; no estimate reported.
NOTE: Received Alcohol Treatment at a Specialty Facility refers to treatment received at a hospital (inpatient), rehabilitation facility (inpatient or outpatient), or mental health
center in order to reduce or stop alcohol use, or for medical problems associated with alcohol use.
1
Needing But Not Receiving Treatment refers to respondents classified as needing treatment for alcohol, but have not received treatment for an alcohol problem at a specialty
facility (i.e., drug and alcohol rehabilitation facilities [inpatient or outpatient], hospitals [inpatient only], and mental health centers).
2
Felt Need for Treatment includes persons who did not receive but felt they needed treatment for an alcohol problem, as well as persons who received treatment at a location other
than a specialty facility but felt they needed additional treatment.
Source: SAMHSA, Office of Applied Studies, National Survey on Drug Use and Health, 2002, 2003, 2004, and 2005.
48
Table 2.16 Access to Drug Use Treatment among Persons Aged 12 or Older, by Age Group and Appalachian Sub-Region:
Percentages, Annual Averages Based on 2002-2005
Northern
Age 12-17
Central
Southern
Age 18 or Older
Northern
Central
Southern
1,2
Access to Drug Treatment
Needed But Not Received Treatment for an
Illicit Drug Problem
Felt Need for Treatment for an Illicit Drug
Problem
Felt Need for Treatment for an Illicit Drug
Problem and Made No Effort
5.1
3.1
5.0
2.1
2.9
2.1
0.3
0.3
0.2
0.2
0.5
0.3
0.1
0.2
0.2
0.2
0.5
0.3
*Low precision; no estimate reported.
NOTE: Illicit Drugs include marijuana/hashish, cocaine (including crack), heroin, hallucinogens, inhalants, or prescription-type pychotherapeutics used nonmedically.
NOTE: Received Illicit Drug Treatment at a Specialty Facility refers to treatment received at a hospital (inpatient), rehabilitation facility (inpatient or outpatient), or mental health
center in order to reduce or stop illicit drug use, or for medical problems associated with illicit drug use.
1
Needing But Not Receiving Treatment refers to respondents classified as needing treatment for illicit drugs, but have not received treatment for an illicit drug problem at a
specialty facility (i.e., drug and alcohol rehabilitation facilities [inpatient or outpatient], hospitals [inpatient only], and mental health centers.
2
Felt Need for Treatment includes persons who did not receive but felt they needed treatment for an illicit drug problem, as well as persons who received treatment at a location
other than a specialty facility but felt they needed additional treatment.
Source: SAMHSA, Office of Applied Studies, National Survey on Drug Use and Health, 2002, 2003, 2004, and 2005.
49
Table 2.17 Reasons for Not Receiving Mental Health Treatment among Persons Aged 12 or Older, by Age Group and
Appalachian Sub-Region: Percentages, Annual Averages Based on 2002-2005
Age 12-17
Age 18 or Older
Northern
Central
Southern
Northern
Central
Reasons for Not Receiving Mental Health Treatment/Counseling among Persons with an Unmet Need for Mental Health Treatment1,2
N/A
N/A
N/A
41.4
*
Cost/Insurance Barriers2
Did Not Feel Need for Treatment/Could
Handle the Problem Without Treatment3,7
N/A
N/A
N/A
37.5
*
Stigma4,7
N/A
N/A
N/A
28.5
*
Did not Know Where to Go for Services
N/A
N/A
N/A
12.2
*
7
Did Not Have Time
N/A
N/A
N/A
12.3
*
5,7
Treatment Would Not Help
N/A
N/A
N/A
12.6
*
Fear of Being Committed/Have to Take
Medicine
N/A
N/A
N/A
9.9
8.2
6,7
Other Access Barriers
N/A
N/A
N/A
4.9
*
Southern
48.1
36.9
26.9
12.8
15.4
*
14.0
4.1
*Low precision; no estimate reported.
N/A: Not applicable.
NOTE: Unmet Need for Mental Health Treatment/Counseling is defined as a perceived need for treatment that was not received.
NOTE: Estimates represent reasons for not receiving mental health treatment/counseling for all persons aged 18 or older with an unmet need for treatment, including those with
unknown mental health treatment/counseling information.
NOTE: Mental Health Treatment/Counseling is defined as having received inpatient care or outpatient care or having used prescription medication for problems with emotions,
nerves, or mental health. Respondents were not to include treatment for drug or alcohol use. Respondents with unknown treatment/counseling information were excluded.
Estimates were based only on responses to items in the Adult Mental Health Service Utilization module.
1
Respondents could indicate multiple reasons; thus, these response categories are not mutually exclusive.
2
Includes reasons of "Could not afford," "Health insurance does not pay enough," "Health insurance does not cover mental health treatment," and other-specify responses of "No
health insurance."
3
Includes reasons of "Did not feel need for treatment," "Could handle problem without treatment," and other-specify responses of "Work on problems with family/friends" and
"Work on problems through religion/spirituality."
4
Includes reasons of "Might cause neighbors/community to have negative opinion," "Might have negative effect on job," "Concerned about confidentiality," "Did not want others
to find out," and other-specify responses of "Ashamed/embarrassed/afraid," "Concerned how court system would treat me," and "Concerned how it would affect future
insurability."
5
Includes reasons of "Did not feel need for treatment," "Could handle problem without treatment," and other-specify responses of "Work on problems with family/friends" and
"Work on problems through religion/spirituality."
6
Includes reasons of "No transportation/inconvenient" and other-specify responses of "Too much red tape/hassle to get services," "No openings/long waiting lists/delays,"
"Services unavailable/limited in area," "Attempted to get treatment but unsuccessful in finding help," and "Could not find program/counselor comfortable with."
7
Estimates are based only on combined 2003-2005 data.
Source: SAMHSA, Office of Applied Studies, National Survey on Drug Use and Health, 2002, 2003, 2004, and 2005.
50
Table 2.18 Access to Alcohol Use Treatment among Persons Aged 12 or Older, by Age Group and Appalachian
Socioeconomic Status: Percentages, Annual Averages Based on 2002-2005
Age 12-17
At-Risk or
Distressed
Access to Alcohol Treatment1,2
Needed But Not Received Alcohol Treatment
Felt Need for Alcohol Treatment
Felt Need for Alcohol Treatment and Made
No Effort
Age 18 or Older
Transitional
Competitive or
Attainment
At-Risk or
Distressed
Transitional
Competitive or
Attainment
4.9
0.6
6.3
0.1
4.5
0.1
4.5
0.4
6.4
0.3
6.6
0.4
0.3
0.1
0.0
0.3
0.2
0.2
*Low precision; no estimate reported.
NOTE: Received Alcohol Treatment at a Specialty Facility refers to treatment received at a hospital (inpatient), rehabilitation facility (inpatient or outpatient), or mental health
center in order to reduce or stop alcohol use, or for medical problems associated with alcohol use.
1
Needing But Not Receiving Treatment refers to respondents classified as needing treatment for alcohol, but have not received treatment for an alcohol problem at a specialty
facility (i.e., drug and alcohol rehabilitation facilities [inpatient or outpatient], hospitals [inpatient only], and mental health centers).
2
Felt Need for Treatment includes persons who did not receive but felt they needed treatment for an alcohol problem, as well as persons who received treatment at a location other
than a specialty facility but felt they needed additional treatment.
Source: SAMHSA, Office of Applied Studies, National Survey on Drug Use and Health, 2002, 2003, 2004, and 2005.
51
Table 2.19 Access to Drug Treatment among Persons Aged 12 or Older, by Age Group and Appalachian Socioeconomic
Status: Percentages, Annual Averages Based on 2002-2005
Age 12-17
At-Risk or
Distressed
Access to Drug Treatment1,2
Needed But Not Received Treatment for an
Illicit Drug Problem
Felt Need for Treatment for an Illicit Drug
Problem
Felt Need for Treatment for an Illicit Drug
Problem and Made No Effort
Age 18 or Older
Transitional
Competitive or
Attainment
At-Risk or
Distressed
Transitional
Competitive or
Attainment
4.7
5.3
4.0
2.3
2.3
1.8
0.5
0.2
0.3
0.3
0.3
0.3
0.3
0.1
0.2
0.3
0.2
0.3
*Low precision; no estimate reported.
NOTE: Illicit Drugs include marijuana/hashish, cocaine (including crack), heroin, hallucinogens, inhalants, or prescription-type pychotherapeutics used nonmedically.
NOTE: Received Illicit Drug Treatment at a Specialty Facility refers to treatment received at a hospital (inpatient), rehabilitation facility (inpatient or outpatient), or mental health
center in order to reduce or stop illicit drug use, or for medical problems associated with illicit drug use.
1
Needing But Not Receiving Treatment refers to respondents classified as needing treatment for illicit drugs, but have not received treatment for an illicit drug problem at a
specialty facility (i.e., drug and alcohol rehabilitation facilities [inpatient or outpatient], hospitals [inpatient only], and mental health centers.
2
Felt Need for Treatment includes persons who did not receive but felt they needed treatment for an illicit drug problem, as well as persons who received treatment at a location
other than a specialty facility but felt they needed additional treatment.
Source: SAMHSA, Office of Applied Studies, National Survey on Drug Use and Health, 2002, 2003, 2004, and 2005.
52
Table 2.20 Reasons for Not Receiving Mental Health Treatment/Counseling among Persons Aged 12 or Older, by Age Group
and Appalachian Socioeconomic Status: Percentages, Annual Averages Based on 2002-2005
Age 12-17
Age 18 or Older
At-Risk or
Competitive or
At-Risk or
Competitive or
Distressed
Transitional
Attainment
Distressed
Transitional
Attainment
1,2
Reasons for Not Receiving Mental Health Treatment/Counseling among Persons with an Unmet Need for Mental Health Treatment
N/A
N/A
N/A
37.0
49.1
37.6
Cost/Insurance Barriers2
Did Not Feel Need for Treatment /Could
Handle the Problem Without Treatment3,7
N/A
N/A
N/A
34.2
30.4
*
4,7
Stigma
N/A
N/A
N/A
30.6
27.0
*
Did not Know Where to Go for Services
N/A
N/A
N/A
10.3
14.1
9.9
Did Not Have Time7
N/A
N/A
N/A
11.5
13.8
14.0
Treatment Would Not Help5,7
N/A
N/A
N/A
5.6
8.7
*
Fear of Being Committed/Have to Take
Medicine
N/A
N/A
N/A
15.0
10.7
11.0
Other Access Barriers6,7
N/A
N/A
N/A
2.1
5.0
3.6
*Low precision; no estimate reported.
N/A: Not applicable.
NOTE: Unmet Need for Mental Health Treatment/Counseling is defined as a perceived need for treatment that was not received.
NOTE: Estimates represent reasons for not receiving mental health treatment/counseling for all persons aged 18 or older with an unmet need for treatment, including those with
unknown mental health treatment/counseling information.
NOTE: Mental Health Treatment/Counseling is defined as having received inpatient care or outpatient care or having used prescription medication for problems with emotions,
nerves, or mental health. Respondents were not to include treatment for drug or alcohol use. Respondents with unknown treatment/counseling information were excluded.
Estimates were based only on responses to items in the Adult Mental Health Service Utilization module.
1
Respondents could indicate multiple reasons; thus, these response categories are not mutually exclusive.
2
Includes reasons of "Could not afford," "Health insurance does not pay enough," "Health insurance does not cover mental health treatment," and other-specify responses of "No
health insurance."
3
Includes reasons of "Did not feel need for treatment," "Could handle problem without treatment," and other-specify responses of "Work on problems with family/friends" and
"Work on problems through religion/spirituality."
4
Includes reasons of "Might cause neighbors/community to have negative opinion," "Might have negative effect on job," "Concerned about confidentiality," "Did not want others
to find out," and other-specify responses of "Ashamed/embarrassed/afraid," "Concerned how court system would treat me," and "Concerned how it would affect future
insurability."
5
Includes reasons of "Did not feel need for treatment," "Could handle problem without treatment," and other-specify responses of "Work on problems with family/friends" and
"Work on problems through religion/spirituality."
6
Includes reasons of "No transportation/inconvenient" and other-specify responses of "Too much red tape/hassle to get services," "No openings/long waiting lists/delays,"
"Services unavailable/limited in area," "Attempted to get treatment but unsuccessful in finding help," and "Could not find program/counselor comfortable with."
7
Estimates are based only on combined 2003-2005 data.
Source: SAMHSA, Office of Applied Studies, National Survey on Drug Use and Health, 2002, 2003, 2004, and 2005.
53
2.4.2 Maps
The first maps in this section present information relative to the county-level population of the 410
Appalachian counties, and the NSDUH sample sizes for each county for both adults and
adolescents. Map 2.1 shows the average population for each of the 410 counties within the
Appalachian region for the years 2002 to 2005. Maps 2.2 and 2.3 show the number of individuals
sampled as part of the NSDUH survey for those same years; Map 2.2 shows the numbers of adults
age 18 and over by county, and Map 2.3 shows the number of adolescents sampled by county. As
would be expected, areas with higher populations are more likely to have residents included in the
NSDUH sample. Note that several counties (58 among adult sample; 10 among adolescent sample)
have zero respondents, and many others have between only 1 and 5 respondents (31 among adult
sample; 76 among adolescent sample). The small sample sizes make county-level analyses
impossible. To address this issue, and with the help of the SAMHSA Office of Applied Studies, we
were provided with aggregated data based on Appalachian sub-region (northern, central, and
southern) and ARC designated economic development status (distressed, at-risk, transitional,
competitive, and attainment), and analyses were conducted accordingly, as presented earlier in this
chapter. Also note that three Appalachian states, New York, Pennsylvania, and Ohio, are among
the NSDUH large sample states, so that county samples in these states are higher.
NORC was not provided with data for individual counties, however, so we are unable to map results
using ARC-defined categories. Rather, the remaining maps in this section present data according to
NSDUH-defined sub-regions (described earlier in the chapter), which do not perfectly correspond to
the ARC region. To accurately portray these maps, we present estimated values for all selected
substance use and serious psychological distress measures using the NSDUH defined region as the
unit of analysis. As such, all counties within those regions are applied the same estimate as
generated by SAMHSA’s Office of Applied Studies (OAS, 200623). These estimates are then
mapped showing the full NSDUH sub-state areas, the ARC boundary, and state and county
boundaries within Appalachia, to assist in pattern detection. Readers should be cautious in
generalizing regional estimates to the county level.
54
Population & Sample
Map 2.1 Average Population 2002-2005, in the Appalachian Region by County
55
Map 2.2 Number of Sampled Adults Age 18 or older in NSDUH 2002-2005, in the
Appalachian Region by County
56
Map 2.3 Number of Sampled Adolescents Age 12 – 17 in NSDUH 2002-2005, in the
Appalachian Region by County
57
Alcohol Use
Map 2.4 Perception of Great Risk of Binge Drinking, by NSDUH Sub-Region, 2002-2005
Map 2.4 shows the percentage distributions among persons age 12 or older who perceived the risk
of binge drinking as a ‘great risk.’ NSDUH respondents were asked how much they thought people
risk harming themselves by binge drinking (great risk, moderate risk, slight risk, no risk).
Perceived great risk of binge drinking is higher in the NSDUH sub-state areas corresponding to
central Appalachia, and highest in the NSDUH sub-state areas corresponding to southern
Appalachia. Perception of great risk of binge drinking appears to be lowest for NSDUH sub-state
areas that include northern Pennsylvania and the southern tier of New York State.
58
Map 2.5 Alcohol Use in Past Month, by NSDUH Sub-Region, 2002-2005
Map 2.5 shows the percentages of alcohol use in the past month among all persons age 12 or older,
which appears highest in the NSDUH sub-state areas that include the Appalachian portions of
Pennsylvania and New York.
59
Map 2.6 Binge Alcohol Use in Past Month, by NSDUH Sub-Region, 2002-2005
Map 2.6 shows binge drinking percentages among people age 12 or older in the past month. Rates
are highest in the NSDUH sub-state areas corresponding to northern Appalachia, with particularly
high rates in the southern tier of New York, northern Pennsylvania, and eastern Ohio. Notably,
rates appear highest in those areas where perception of risk was lowest (i.e., northern Appalachia),
and lowest in those areas where perception of risk as highest (i.e., southern Appalachia) (see Map
2.4).
60
Map 2.7 Alcohol Use in Past Month Among Persons Aged 12-20, by NSDUH Sub-Region,
2002-2005
Map 2.7 shows percentages of alcohol use in the past month among youth or young adults age 1220, which, as with those among all persons age 12 or older, appears highest in the NSDUH sub-state
areas that include the Appalachian portions of Pennsylvania and New York. Additionally, rates
appear higher among adolescents in NSDUH sub-state areas corresponding to central Appalachia as
compared to adults, and somewhat lower in NSDUH sub-state areas corresponding to southern
Appalachia as compared to adults.
61
Map 2.8 Binge Alcohol Use in Past Month, Persons Aged 12-20, by NSDUH Sub-Region, 20022005
Map 2.8 shows binge drinking in the past month, among adolescents or young adults age 12-20
however. As before, rates are highest in the NSDUH sub-state areas corresponding to northern
Appalachia, with particularly high rates in the southern tier of New York, northern Pennsylvania,
and eastern Ohio. As compared to adults, however, rates also appear higher in NSDUH sub-state
areas corresponding to central Appalachia. Also as before, rates appear highest in those areas where
perception of risk was lowest (i.e., northern Appalachia), and lowest in those areas where
perception of risk as highest (i.e., southern Appalachia) (see Map 2.4).
62
Map 2.9 Alcohol Dependence in Past Year, by NSDUH Sub-Region, 2002-2005
Map 2.9 shows alcohol dependence in the past year among persons age 12 or older. Rates fluctuate
across the region, but appear highest in the NSDUH sub-state areas corresponding to northeast
Pennsylvania, the Appalachian portions of Virginia and South Carolina, as well as areas within
Ohio and West Virginia, and Georgia.
63
Map 2.10 Needing But Not Receiving Treatment in Past Year for Alcohol Use, by NSDUH
Sub-Region, 2002-2005
Map 2.10 shows rates of individuals needing but not receiving treatment for alcohol in the past year
among adults. Rates are highest in NSDUH sub-state areas corresponding to northern Appalachia,
with particularly high rates in the northern portion of Pennsylvania, the southern tier of New York,
and portions of Ohio and West Virginia. Rates appear low in most NSDUH sub-state areas
corresponding to southern Appalachia, as well as eastern Kentucky.
64
Cigarette Use
Map 2.11 Perception of Great Risk of Smoking One or More Packs of Cigarettes Everyday, by
NSDUH Sub-Region, 2002-2005
Map 2.11 shows the percentages of persons age 12 or older who perceived ‘great risk’ of smoking
one more packs of cigarettes per day. NSDUH respondents were asked how much they thought
people risk harming themselves by smoking one or more packs of cigarettes per day (great risk,
moderate risk, slight risk, no risk). Perceived risk is highest in NSDUH sub-state areas
corresponding to the far southern portions of Appalachia, as well in the far northeastern portion of
Appalachia. Perceived risk is low in the NSDUH sub-state areas corresponding to the Appalachian
region of Ohio, eastern Kentucky, as well as in areas of Tennessee and North Carolina.
65
Map 2.12 Cigarette Use in Past Month, by NSDUH Sub-Region, 2002-2005
Map 2.12 presents actual cigarette use in the past month, which contrasts noticeably from the prior
map. For areas where Map 2.11 shows low perceived risk, rates appear to actually be highest. This
includes the Appalachian portions of Ohio, eastern Kentucky, eastern Tennessee, and western North
Carolina.
66
Marijuana Use
Map 2.13 Marijuana Use in Past Month, by NSDUH Sub-Region, 2002-2005
Map 2.13 shows past month marijuana use among persons age 12 or older, which appears highest in
NSDUH sub-state areas corresponding to northern and central Appalachia. Highest rates appear in
NSDUH sub-state areas corresponding to western North Carolina and the southern tier of New
York.
67
Map 2.14 Marijuana Use in Past Year, by NSDUH Sub-Region, 2002-2005
Map 2.14 shows past year marijuana use among persons age 12 or older. Patterns are similar to past
month use, with additional high rate pockets in NSDUH sub-state areas corresponding to
northwestern Georgia and northeastern Pennsylvania.
68
Cocaine Use
Map 2.15 Cocaine Use in Past Year, by NSDUH Sub-Region, 2002-2005
Map 2.15 shows past year cocaine use among persons age 12 or older. Rates appear highest in
NSDUH sub-state areas corresponding to northern and central Appalachia, with particularly high
rates in the southern tier of New York, northeastern Pennsylvania, northern West Virginia.
69
Illicit Drug Use Other Than Marijuana
Map 2.16 Any Use of Illicit Drugs Other Than Marijuana, Past Month, by NSDUH SubRegion, 2002-2005
Map 2.16 shows rates of any use of illicit drugs other than marijuana over the past month among
persons age 12 or older. Noticeably, the patterns change as compared to alcohol and marijuana use,
with the highest rates in NSDUH sub-state areas corresponding to central and southern Appalachia.
Rates are highest in NSDUH sub-state areas corresponding to eastern Kentucky, eastern Tennessee,
western North Carolina, southern West Virginia, the Appalachian portion of South Carolina, and
portions of Georgia and Alabama. Rates are lowest in the NSDUH sub-state areas corresponding to
western Pennsylvania.
70
Map 2.17 Any Drug Dependence in Past Year, by NSDUH Sub-Region, 2002-2005
Map 2.17 shows any reported drug dependence in the past year among persons age 12 or older.
Rates appear highest in NSDUH sub-state areas corresponding to central Appalachia, with
particularly high rates in eastern Kentucky and southern West Virginia. Rates are also high in
NSDUH sub-state areas corresponding to portions of Appalachian Ohio, North Carolina, along the
southern tier of New York, and in northern West Virginia.
71
Map 2.18 Needing But Not Receiving Treatment for Drug Use in Past Year, by NSDUH SubRegion, 2002-2005
Map 2.18 shows rates of individuals age 12 or older reporting needing but not receiving treatment
for drug abuse in the past year. Rates appear highest in the NSDUH sub-state areas corresponding
to eastern Kentucky, southern and northern West Virginia, eastern Tennessee, western North
Carolina, and along the southern tier of New York. Rates appear lowest in Pennsylvania and areas
corresponding to southern Appalachia, including portions of Mississippi, Alabama, and Georgia.
Non-Medical Use of Prescription Drugs
72
Map 2.19 Painkiller Use in Past Year, by NSDUH Sub-Region, 2002-2005
Map 2.19 shows the use of painkillers over the past year among persons age 12 or older. Rates are
noticeably higher in the NSDUH sub-state areas corresponding to central Appalachia, with
particularly high rates in eastern Kentucky and southern West Virginia. High rates are also seen in
the easternmost portion of Tennessee, northeastern Georgia, and northern West Virginia. Rates
appear lowest in NSDUH sub-state areas corresponding to southwestern and south central
Pennsylvania.
73
Mental Health
Map 2.20 Serious Psychological Distress in Past Year, by NSDUH Sub-Region, 2002-2005
Map 2.20 shows serious psychological distress in the past year among persons age 12 or older.
Rates are particularly high in the NSDUH sub-state areas corresponding to central Appalachia,
including eastern Kentucky and southern West Virginia. Rates are also high in NSDUH sub-state
areas adjacent to central Appalachia, including areas of Tennessee, West Virginia, and Ohio. Rates
appear lowest in NSDUH sub-state areas corresponding to southwest and northeast Pennsylvania.
74
2.5 Discussion
This is the first time that a large-scale national household survey has been used to specifically
address substance abuse and mental health problems at a regional level. The findings not only
provide an overall and much needed contemporary view of the status of substance abuse and mental
health within the Appalachian region, but they also highlight potential disparities when compared
nationally.
This chapter reveals several noteworthy findings. First, regardless of age or the length of use,
smoking is more prevalent in the Appalachian region than outside of Appalachia. Second, while the
prevalence of the non-medical use of psychotherapeutics was higher among adolescents than among
adults overall, adolescents in the Appalachian region had even higher prevalence rates than
adolescents outside of the Appalachian region. Both geographic variation and economic level
differences are observed in adolescents’ non-medical use of prescription drugs – with the southern
part of Appalachia, “distressed and at-risk,” and “transitional” counties having higher rates. In
addition, evidence suggests that adolescents in Appalachia tend to engage in heavy alcohol use
more than adolescents elsewhere.
This study also reveals that, proportionately, there are more severe mental health problems in the
Appalachian region than outside of Appalachia. Further, the central Appalachian sub-region is
found to have the highest prevalence rates of both serious psychological distress and major
depressive episode.
Methamphetamine use has been of particular interest among news media and policy makers. The
current study, however, does not support that methamphetamine use prevalence is higher in
Appalachia than outside of Appalachia overall. Among adults, the percentages of current (past
month) or recent (past year) methamphetamine use are similar between Appalachia and elsewhere,
but the lifetime use of methamphetamine rate is lower in Appalachia than outside of Appalachia.
For adolescents, the methamphetamine use prevalence rates are generally similar, although the rates
in Appalachia for lifetime use and past month use are slightly higher as compared to rates outside of
Appalachia. This finding should not minimize the issue of methamphetamine abuse within
Appalachia, however. Rather, this may be a reflection of the granularity of the available data,
which cannot be analyzed at the individual county level. We would expect, based on anecdotal
evidence, that there are particular “hotspots” within Appalachia that cannot be gleaned from the
NSDUH data set. Overall, however, the magnitude of methamphetamine use appears small across
the region as compared to other substance use issues such as the non-medical use of prescriptiontype psychotherapeutics.
Inasmuch as the findings appear to suggest greater problems among Appalachian adolescents than
among Appalachian adults, policy makers and community members should take notice.
Adolescents grow into adults, and communities will need to be prepared to address the fact that
smoking rates and extensive non-prescription drug use will be ongoing challenges. The
implementation of effective prevention measures is recommended within schools and communities
to mitigate these challenges in the future.
Although the findings also demonstrate that opportunities for outpatient mental health treatment and
counseling comparable, or even slightly higher, within Appalachia as compared to areas outside of
75
Appalachia, determining the quality of care provided and the overall effectiveness of the treatment
are beyond the scope of this project and are worthwhile areas to study further.
This study finds that outpatient rehabilitation is the most common setting for substance abuse
treatment both in and outside of Appalachia. In addition, this study finds that, of the people seeking
substance abuse treatment at a specialty facility, proportionately fewer people utilize inpatient
rehabilitation services in Appalachia than people outside of the Appalachian region. At the same
time, utilization rates of hospital inpatient services, the private doctor’s office, and emergency room
services are all higher in the Appalachian region than outside of the Appalachian region. The exact
reasons behind this pattern need further study, but two possible explanations are: (1) those clients
who could benefit more from inpatient rehabilitation do not get this treatment or substitute inpatient
with outpatient services; or (2) those who have severe substance abuse problems have not received
appropriate outpatient treatment or regular inpatient services, and as a result, use more expensive
emergency room services.
This study shows that the negative
perceptions about treatment appear to be
more pronounced within the
Appalachian region among those who
need mental health treatment but have
not received treatment. Education,
communications, and special
intervention methods and programs
should be considered as ways to modify
the perceptions of the people with
mental illness needing treatment.
Efforts should also be made in
Appalachian communities to reduce
stigma arising from concerns such as
“might cause neighborhood/community
to have negative opinion,” “might have
negative effect on job,” “someone may
find out,” “ashamed, embarrassed, or
afraid,” etc.
Regardless of substance abuse or mental
disorders, the top reason for people who needed treatment but did not receive treatment was due to
the absence of insurance or external payment methods. Followed by this extrinsic reason are two
intrinsic reasons – people did not think they needed treatment, or were obstructed by the stigma
attached, especially for the Appalachian patients accessing the mental health services. Assuming
that the boundary between perception of no need for treatment and the fear of stigma was blurred,
these intrinsic reasons would even surpass the insurance issue and become the number one hurdle
for why people who need treatment do not actually receive treatment. Behind these intrinsic
reasons, it is possible that mistrust of the treatment system would be another important issue, though
this would need future study and is beyond the scope of our current investigation.
76
It should be recognized that cost of treatment issues may be relatively more or less important
depending on the economic status of the county. Poor counties could likely have access to
governmental insurance (Medicaid, Medicare, CHIP), while well-off counties probably have higher
rates of private insurance. “Transitional” counties may fall through the cracks.
As noted previously, this study has limitations and as such, should be interpreted with caution. The
NSDUH was designed for national and state estimates and not for any specific user-defined region.
Neither the counties, nor the Appalachian region, were part of the primary sampling unit (PSU) or
stratification unit. Estimates across state boundaries are inefficient, involving highly variable
weights.24 In addition, the total weighted estimated numbers of persons for various measures may
not be precise. For reference purpose or getting approximate estimates of the numbers of persons
included, the weighted estimated totals using the existing weights are provided in Appendix C.
However, since the Appalachian region is comprised of 13 states, and the sub-regions we
investigated are also large domains, the biases caused by the innovative use of the NSDUH should
not be a major concern.
77
CHAPTER 3: Patient Admissions to Treatment for Abuse of Alcohol and
Drugs in Appalachia, 2000 – 2004
3.1 Introduction
Thousands of public and private treatment facilities are available across the United States to treat
people with substance abuse and mental health disorders. Exploring data at the treatment facility
level provides a unique opportunity to better understand populations with substance abuse and
mental health disorders and to explore trends across geographic areas.
One of the data sets used to explore admissions to and discharges from substance abuse treatment is
the Treatment Episode Data Set (TEDS), an annual national flow of information on the
demographic and characteristics of admissions to (and more recently discharges from) treatment.
TEDS provides highly specific data on treatment type and demographic data for patients, making
this dataset particularly important to understanding the trends of patient admissions for substance
abuse treatment. TEDS captures data on admissions that report use of the following substances:
marijuana; cocaine; other opiates or synthetics which includes codeine, Dilaudid, morphine,
Demerol, opium, oxycodone, and any other drug with morphine-like effects; heroin;
methamphetamine or other stimulants which includes non-amphetamine stimulants; tranquilizers;
other substances; sedatives; and inhalants. TEDS also includes data on admissions with
psychological problems or mood disorders, and captures whether admissions have a psychiatric
problem in addition to an alcohol or drug problem.
Chapter 3 provides an overview of the pooled annual admissions to treatment facilities in the
Appalachian region, and in other regions nationally, during the 2000 – 2004 period. All analyses in
this chapter are based on the TEDS series. Key research questions explored include:
Are there sub-regional differences of admissions to substance abuse treatment in Appalachia
as compared to admissions to treatment outside of Appalachia?
What do the sub-regional differences of admissions to treatment look like across different
socio-economic and demographic variables such as age, education, type of health insurance,
etc?
What do the sub-regional differences of admissions to treatment look like with respect to
other variables, such as source of referral, number of prior treatment episodes, and primary
reason for admission?
In Section 3.2, we provide an overview of the TEDS series, its uses, the measures relevant to this
study, and any limitations specifically related to exploring admissions to treatment of substance
abuse in the Appalachian region. In Section 3.3, we discuss our methods. Section 3.4 contains the
results of the analysis. Finally, Section 3.5 provides a discussion of key findings.
3.2 Data
3.2.1 Overview
78
The Treatment Episode Data Set (TEDS) is an administrative data system providing information on
the demographic and substance abuse characteristics of admissions to and discharges from
substance abuse treatment. The primary goal of this data set is to monitor and report treatment
episodes for substance abusers.25 While the TEDS Admissions Data Set has been operational for 15
years, the TEDS Discharge Data Set is new, reporting data for the first time in 2000. TEDS is
sponsored by the Substance Abuse and Mental Health Services Administration (SAMHSA)’s Office
of Applied Studies (OAS) at the U.S. Department of Health and Human Services. Collected since
1992, the TEDS series was designed to provide annual data on persons admitted to public and
private substance abuse treatment facilities that are licensed or certified by state substance abuse
agencies to provide treatment. Generally, the facilities reporting to state substance abuse agencies
are those that receive public funds.
TEDS is one component of the Drug and Alcohol Services Information System (DASIS).26 The
DASIS is the primary source of national data on substance abuse treatment and includes TEDS as
well as two other components, the National Survey of Substance Abuse Treatment Services (NSSATS) and the Inventory of Substance Abuse Treatment Services (I-SATS).27
TEDS data are collected by publicly financed substance abuse treatment programs from the 50
states, the District of Columbia, and Puerto Rico. State substance abuse agencies collect the
administrative records from substance abuse treatment programs from states and jurisdictions and
prepare the data in a standardized format. Data are then submitted to SAMHSA, which uses the
data to report aggregated information on substance abuse treatment. The unit of analysis for the
TEDS series is treatment admissions.28
States vary in terms of the latest year for which they have complete data and the type of data they
have submitted. Substance abuse treatment programs are required to report the Minimum Data Set
(MDS) to their respective state substance abuse agency, but are not required to report data for the
Supplemental Data Set (SuDS).
The MDS contains data on 19 items that include characteristics of clients admitted for substance
abuse treatment, as well as the characteristics of the treatment episodes. Specifically, the data
elements from the MDS include: transaction type; admission date; type of service at admission;
number of (previous) treatment episodes; client age; sex; race; ethnicity; education; employment
status; principal source of referral; substance problem; usual route of administration; frequency of
use; age of first use; and whether medication-assisted opioid therapy is part of the client’s treatment
plan. Additional variables, such as calculated age and census region, are added to the state data.
Substances abused include alcohol, marijuana and hashish, cocaine and crack, heroin,
hallucinogens, nonprescription methadone, other opiates and synthetics, phencyclidine (PCP),
methamphetamine, other amphetamines, other stimulants, benzodiazepines, other tranquilizers,
barbiturates, other sedatives or hypnotics, inhalants, over-the-counter medications, and other
substances.
SuDS data is optional for treatment programs to report. SuDS data include: whether the client is
pregnant at time of admission; veteran status; whether the patient has a psychiatric problem in
addition to alcohol or drug problem; the diagnosis of the substance abuse problem from the
American Psychiatric Association’s Diagnostic and Statistical Manual of Mental Disorders;
marital status; living arrangement; source of income support; health insurance; expected/ actual
79
primary source of payment; detailed information about those clients who are coded as "Not in labor
force" in the MDS; detailed information related to criminal justice referrals; number of days waiting
to enter treatment; and detailed drug code.
TEDS is based on over 2 million admissions reported by over 10,000 facilities to the 50 States,
District of Columbia, and Puerto Rico, over a calendar year.
3.2.2 Uses of TEDS
TEDS enables researchers to explore the demographic and substance abuse characteristics of
admissions to and discharges from substance abuse treatment. TEDS data has been used to explore
a number of research questions related to substance abuse issues. Recent studies have focused on
abuse of opioid analgesics and methamphetamine,29,30 heroin use, changes in use over time, and the
economic costs of heroin addiction,31,32,33 misuse of prescription drugs,34 substance abuse during
pregnancy,35 and trends in methamphetamine and amphetamine use.36 Researchers have also used
TEDS data to explore characteristics of primary heroin injection and inhalation admissions and
primary phencyclidine admissions.37,38
A large body of research has applied TEDS data to study treatment for marijuana use disorders and
methadone,39 substance abuse prevention and treatment activities at the state level,40 treatment
trends,41 and treatment policy, more generally.42
Given that TEDS data can be analyzed using geographic identifiers (e.g., metropolitan area, State,
Census Region, Census Division, one State to all others), researchers have analyzed trends in
treatment admissions in specific geographic areas.43,44 For example, recent studies have explored
treatment admissions in urban and rural areas involving the abuse of narcotic painkillers45 and
substance abuse in mid-size cities and rural areas.46
3.2.3 TEDS Measures Used in this Study
Next, we define the measures used from the TEDS dataset of pooled admissions from 2000 – 2004
period. We explore the following sets of variables: gender, race, education, and age; employment
status, marital status, and pregnancy status upon admission; health insurance and primary source of
referral; service setting; types of services and whether methadone was prescribed during treatment;
number of prior treatment episodes and expected source of payment; substances abused as primary
reason for admission; substances abused as one major reason for admission; and presence of
psychological problems and mood disorders. We briefly describe each variable below.
The gender of the client admitted for treatment in a drug or alcohol program is described as male or
female.
The race of the client is described as one of the following: Alaska Native (Aleut, Eskimo, Indian);
American Indian (people of North, Central and South America who maintain cultural identification
through tribal affiliation or community attachment); Asian or Pacific Islander (people of the Far
East, the Indian subcontinent, Southeast Asia, or the Pacific Islands); Black or African American
(any of the black racial groups of Africa); White (people of Europe, North Africa, or the Middle
East); and Other (a default category for use in instances in which the client is not classified above).
80
The education of the client specifies the highest grade of school completed by the client admitted
for treatment: less than high school; high school; and more than high school.
The age of the admission is specified as one of the following categories: 17 years old or younger;
18 to 24 years old; 25 to 34 years old; 35 to 44 years old; and 45 or older.
The employment status of the admission is specified as: full time (working 35 hours or more each
week - includes members of the uniformed services); part time (working fewer than 35 hours each
week); unemployed (looking for work during the past 30 days or a homemaker, student, disabled,
retired, or an inmate of an institution); not in the labor force; or unknown.
The marital status of the admission is recorded as one of the following: never married; now
married; separated; divorced/ widowed; and unknown.
The pregnancy status of the admission is recorded as yes or no at the time of admission.
The health insurance status of the admission is specified as one of the following: private health
insurance; Blue Cross Blue Shield; Medicare; Medicaid; coverage by a health maintenance
organization; other insurance; no insurance; or unknown.
The primary source of referral for the admission is recorded as: “individual,” which includes the
client, a family member, friend, self-referral due to DWI/DUI, or another individual not included in
other categories; “Alcohol or Drug Abuse (ADA) care provider,” which includes any program,
clinic, or other health care provider whose activities are related to alcohol or other drug abuse
prevention or treatment; “other health care provider,” which includes a physician, psychiatrist,
licensed health care professional, general hospital, psychiatric hospital, mental health program, or
nursing home; “school,” which includes a school principal, counselor, teacher, a student assistance
program, the school system, or educational agency; “employer/ employee assistance program
(EAP),” which includes a supervisor or employee counselor; “other community referral,” which
includes community and religious organizations, Federal, State, or local agencies that provides aid
in the areas of poverty relief, unemployment, shelter, or social welfare, self-help groups and defense
attorneys; and “court/ criminal justice,” which includes any police official, judge, prosecutor,
probation officer, or other person affiliated with a Federal, State, or county judicial system.
The service setting is specified as the type of treatment to which the client was admitted. “Hospital
inpatient detoxification” is a 24 hour per day acute care service in a hospital setting for
detoxification of persons with severe medical complications associated with withdrawal.
“Detoxification at a free-standing residential facility” is defined as a 24 hour per day service in nonhospital setting providing for safe withdrawal and transition to ongoing treatment. “Rehabilitation/
Residential at a hospital” is defined as 24 hour per day medical care in a hospital facility in
conjunction with treatment services for alcohol and other drug abuse and dependency. A “shortterm rehabilitation/ residential setting” is defined as typically 30 days or less of non-acute care in a
setting with treatment services for alcohol and other drug abuse and dependency. A “long-term
rehabilitation/ residential setting” is defined as typically more than 30 days of non-acute care in a
setting with treatment services for alcohol and other drug abuse and dependency (this may include
transitional living situations such as halfway houses). “Intensive outpatient ambulatory care” is
defined as, at minimum, the client must receive treatment lasting two or more hours per day for
three or more days per week. The “non-intensive outpatient ambulatory care setting” is defined as a
81
setting where ambulatory treatment services include individual, family, and/or group services (these
may include pharmacological therapies). Finally, the “ambulatory detoxification setting” is defined
as a setting where outpatient treatment services (pharmacological or non-pharmacological) are
delivered.
The types of services variable specifies the services that the admission will receive during
treatment including: ambulatory health care services; detoxification services; and
rehabilitation/residential services.
Methadone use (planned as part of treatment) is a variable that specifies whether methadone is
planned as part of the client’s treatment.
The number of prior treatment episodes indicates the number of previous treatment episodes the
client has received in any drug or alcohol program. Categories include: no prior treatment episodes;
1 – 2 treatment episodes; 3 or more treatment episodes; or unknown.
The expected source of payment for the treatment episode is specified as one of the following
(whether it is the expected or actual source of payment): other government payments; self-pay;
Medicaid; Blue Cross Blue Shield and other health insurance; no charge; Medicare/ Workman’s
Compensation; other; and unknown. For this variable, states operating under a split payment fee
arrangement between multiple payment sources must default to the payment source with the largest
percentage; if the payment percentages are equal, the state can choose either source. 47
The primary substance of abuse at the time of admission is defined as one of the following:
alcohol; marijuana; cocaine; heroin; other opiates or synthetics (which includes codeine, Dilaudid,
morphine, Demerol, opium, oxycodone, and any other drug with morphine-like effects);
methamphetamine or other stimulants (which includes non-amphetamine stimulants); other
substances; tranquilizers; sedatives; and inhalants.
The substance of abuse as one major reason for admission can be the following: alcohol;
marijuana; cocaine; heroin; other opiates or synthetics (which includes codeine, Dilaudid,
morphine, Demerol, opium, oxycodone, and any other drug with morphine-like effects);
methamphetamine or other stimulants (which includes non-amphetamine stimulants); other
substances; tranquilizers; sedatives; and inhalants. TEDS reports different types of substances as
the primary, secondary, or tertiary substance of abuse at the time of admission. If the substance was
mentioned as either the primary, secondary, or tertiary substance of abuse at the time of admission,
this substance was then regarded as one major reason for admission into substance abuse treatment.
The presence of psychological problems indicates whether there is a psychological problem
present in addition to an alcohol or drug problem upon admission.
The presence of mood disorders was derived from either the third edition revised or the fourth
edition of the American Psychiatric Association's Diagnostic and Statistical Manual of Mental
Disorders. This variable tells whether a mood disorder was present upon admission in addition to
an alcohol or drug problem. However, due to reporting issues related to different types of drug
abuse and dependence, the absence of a mood disorder in the data record upon admission may not
necessarily mean the actual absence of mood disorder.
82
3.2.4 Limitations of the TEDS Series
There are several limitations with respect to using TEDS to explore substance abuse treatment
issues in Appalachian counties as compared to other counties nationally. One critical limitation is
that TEDS does not capture all of the substance abuse treatment facilities in the U.S., and the scope
of facilities included differs from state to state. Facilities reporting into TEDS are generally those
that receive State substance abuse treatment funds, including Federal Block Grant funds. To be
included in TEDS, facilities must be licensed through the state substance abuse treatment agency.
As a result, private-for-profit facilities, hospitals, and state correctional facilities may be excluded
from TEDS. In addition, TEDS does not include data from facilities operated by Federal agencies.
Finally, states have different certification and accreditation requirements and different state systems
of licensure which may contribute to the exclusion of certain facilities.
The unit of measure in TEDS is the initial admission to treatment. Therefore, TEDS data may
reflect multiple admissions for the same client in the same state or treatment site. In addition, one
client could account for multiple admissions at multiple treatment sites in one state.48 Another
limitation is that states may vary in how they define an admission; thus, the absolute number of
admissions may not be a valid measure for comparing states.
Next, public funding is a key external factor that affects the client mix at substance abuse programs.
States that have more public funding may be able to accept more economically disadvantaged
populations than states with limited public funding. In addition, public funding may also cause
states to focus on a particular subset of the population, like pregnant women, for example.
Different criminal justice practices at the state level may affect the manner in which clients are
referred to admission.
Another limitation to note is that there is a delay in the availability of the entire national TEDS data
set for publication.49 Results for each calendar year may be incomplete, and states can revise or
replace historical data files. In addition, since states rely on substance abuse facilities to report the
data, completeness may vary on a state by state basis.50 Finally, direct identifiers have been
removed in the TEDS public use file and disclosure analysis has been applied to remove the
uniqueness of individual records within a file to prevent the identification of any individual.51 It is
not possible to link variables between the TEDS and National Survey of Substance Abuse
Treatment Services (N-SSATS) public-use files.
3.3 Methods
3.3.1 Study Sample
The data used for this study were pooled data for 2000-2004 provided under a data use agreement
with the Office of Applied Study (OAS) of the Substance Abuse and Mental Health Services
Administration (SAMHSA). The data were provided by SAMHSA contractor, Synectics for
Management Decisions, Inc. Only admissions in the 410 Appalachian counties were included in the
data. Data are entered based on county of admission rather than county of residence. Overall, 12 of
the 13 Appalachian states were included in the data. The only state which was missing was West
Virginia. Among the 410 Appalachian counties, 195 counties were in the pooled 2000-2004 TEDS
83
data set, comprising 511,217 total admissions to treatment for abuse of alcohol and drugs in
facilities that report to individual State administrative data systems.
3.3.2 Statistical Methods
We use cross-tabulations to examine differences of admissions to substance abuse treatment within
the Appalachian region. Various aspects of the admissions are analyzed including:
Demographic information;
Primary, secondary, and tertiary substances;
Source of referral to treatment;
Number of prior treatment episodes; and
Service type, including planned use of methadone.
These are examined across admission subgroups based on Appalachian geographic sub-regions
(Northern, Central, and Southern) and the economic development level of the counties where the
admissions took place, as defined by the Appalachian Regional Commission (ARC).
ARC uses a county economic classification system to target counties in need of special economic
assistance. The system classifies counties into five economic status designations—distressed, atrisk, transitional, competitive, and attainment—based on a comparison of county and national
averages for three economic indicators: three-year average unemployment rate; per capita market
income; and poverty rate. The economic status designations change from year to year. Among the
511,217 admissions analyzed, 48,684 (9.5%) were from the “Distressed” counties; 30,356 (5.9%)
were from the “At-risk” counties; 6311,644 (61%) were from the “Transitional” counties; 67,383
(13.2%) were from the “Competitive” counties; and 53,150 (10.4%) were from the “Attainment”
counties. In terms of geographic locations, about half (N=254,675, 49.8%) were in the Northern
Appalachia, about two-fifths (N=195,289, 38.2%) were from the Southern Appalachia, and slightly
more than one-tenth (N=61,253, 12.0%) were from the Central Appalachia.
3.4 Results
In Section 3.4, we present comparisons in admissions to substance abuse treatment within subsets of
Appalachian counties defined by geographic sub-region (northern, central and southern) and
economic status (distressed, at-risk, transitional, competitive, and attainment).
Data are presented in a series of tables that show differences in admissions by demographic factors
such as gender, race, education, and age; employment status, marital status, and pregnancy status
upon admission; health insurance and primary source of referral; service setting; types of services
and whether methadone was prescribed during treatment; number of prior treatment episodes and
expected source of payment; substances abused as primary reason for admission; substances abused
as one major reason for admission; and presence of psychological problems and mood disorders.
After presenting the tables, we provide a series of figures that discuss trends in primary substance of
abuse at admission. Finally, we provide a number of maps which offer a visual representation of
our findings across sub-regions in Appalachia.
84
3.4.1 Tables
Table 3.1 below demonstrates differences in admissions by economic status and sub-region across
demographic variables. Approximately 69% of admissions in Appalachia are male, while only
about 31% are female. This finding is consistent across economic status levels and sub-regions.
Overall, about 83% of admissions were white, 15% were black, and 1.8% were defined as being of
a race other than white or black. The “other” category includes the following races: Alaskan
Native; American Indian; and Asian or Pacific Islander. The percentage of admissions that are white
is the highest in distressed counties and in the central sub-region of Appalachia, while it is the
lowest in attainment counties and the southern sub-region. In contrast, the percentage of admissions
that are black or of another race is the lowest in distressed counties and the highest in attainment
counties. Approximately 23% of admissions in the southern sub-region of Appalachia are black, a
stark contrast to the 3% of admissions that are black in the central sub-region.
In terms of educational attainment, overall, approximately 45% of clients admitted to treatment in
Appalachia have a high school education, 36% have less than a high school education, and 19%
have more than a high school education. Educational status tends to correspond with county
economic status. Admissions with more than a high school education are higher in attainment
counties versus distressed counties (22% versus 14%), while admissions with less than a high
school education are higher in distressed counties versus attainment counties (48% versus 35%).
Overall, 49% of admissions in the northern region have a high school education, followed by 41%
of admissions in the southern region, and 38% in the central region. Admissions with a high school
education comprise the greatest proportion of those receiving treatment in the northern and southern
regions (49% and 41%), while admissions with less than a high school education comprise the
greatest proportion of those receiving treatment in the central region (47%).
In terms of age, overall, about 29% of admitted clients are between 35 and 44 years of age, followed
by 28% in the 25 to 34 age bracket, 22% in the 18 to 24 age bracket, 16% age 45 and older, and 4%
age 17 and younger. By economic status, the majority of those admitted to treatment from
distressed and at-risk counties are between the ages of 25 to 34, whereas the majority of those
admitted in transitional, competitive, or attainment counties are between the ages of 35 to 44.
Approximately 29% of admissions in the northern sub-region and 31% of admissions in the
southern sub-region are between 35 and 44 years of age; the majority of admissions in the central
region are between the ages of 25 and 34.
85
Table 3.1: Sub-regional Differences of Admissions to Substance Abuse Treatment in the Appalachian Region, By Demographics
All
Economic Level
Distressed
At-Risk
Sub-Region
Transitional
Competitive
Attainment
Northern
Central
Southern
N
%
N
%
N
%
N
%
N
%
N
%
N
%
N
%
N
%
Male
300,926
69.26
20,916
68.33
17,327
70.90
190,213
69.43
41,974
69.23
30,496
68.01
163,159
70.18
27,141
69.60
110,626
67.88
Female
133,555
30.74
9,693
31.67
7,113
29.10
83,742
30.57
18,660
30.77
14,347
31.99
69,342
29.82
11,856
30.40
52,357
32.12
All
434,481
100.00
30,609
100.00
24,440
100.00
273,955
100.00
60,634
100.00
44,843
100.00
232,501
100.00
38,997
100.00
162,983
100.00
White
360,881
83.06
29,533
96.48
22,126
90.53
230,175
84.02
49,454
81.56
29,593
65.99
199,792
85.93
37,669
96.59
123,420
75.73
Black
65,794
15.14
877
2.87
2,171
8.88
38,792
14.16
10,033
16.55
13,921
31.04
27,823
11.97
1,041
2.67
36,930
22.66
Other
7,806
1.80
199
0.65
143
0.59
4,988
1.82
1,147
1.89
1,329
2.96
4,886
2.10
287
0.74
2,633
1.62
434,481
100.00
30,609
100.00
24,440
100.00
273,955
100.00
60,634
100.00
44,843
100.00
232,501
100.00
38,997
100.00
162,983
100.00
Less than High
School
156,520
36.02
14,578
47.63
10,233
41.87
93,403
34.09
22,777
37.56
15,529
34.63
72,349
31.12
18,461
47.34
65,710
40.32
High School
197,059
45.36
11,606
37.92
10,009
40.95
129,374
47.22
26,624
43.91
19,446
43.36
114,968
49.45
14,839
38.05
67,252
41.26
More than High
School
80,902
18.62
4,425
14.46
4,198
17.18
51,178
18.68
11,233
18.53
9,868
22.01
45,184
19.43
5,697
14.61
30,021
18.42
All
434,481
100.00
30,609
100.00
24,440
100.00
273,955
100.00
60,634
100.00
44,843
100.00
232,501
100.00
38,997
100.00
162,983
100.00
17 or younger
18,641
4.29
1,328
4.34
1,922
7.86
12,387
4.52
1,394
2.30
1,610
3.59
11,093
4.77
1,407
3.61
6,141
3.77
18-24
95,942
22.08
6,690
21.86
5,771
23.61
64,437
23.52
11,430
18.85
7,614
16.98
56,450
24.28
8,455
21.68
31,037
19.04
25-34
121,637
28.00
9,088
29.69
6,790
27.78
76,637
27.97
16,495
27.20
12,627
28.16
61,951
26.65
11,963
30.68
47,723
29.28
35-44
127,511
29.35
8,521
27.84
6,375
26.08
78,200
28.54
19,756
32.58
14,659
32.69
67,043
28.84
10,731
27.52
49,737
30.52
45 or older
70,750
16.28
4,982
16.28
3,582
14.66
42,294
15.44
11,559
19.06
8,333
18.58
35,964
15.47
6,441
16.52
28,345
17.39
All
434,481
100.00
30,609
100.00
24,440
100.00
273,955
100.00
60,634
100.00
44,843
100.00
232,501
100.00
38,997
100.00
162,983
100.00
Gender
Race
All
Education
Age
Source: Treatment Episode Data Set (TEDS) 2000-2004. Office of Applied Studies, Substance Abuse and Mental Health Services Administration.
86
Table 3.2 below demonstrates differences in admissions by economic status and sub-region for
employment status, marital status, and pregnancy status upon admission. Overall, approximately
33% of admissions are unemployed, meaning that they have been looking for work during the past
30 days or a homemaker, student, disabled, retired, or an inmate of an institution. About 28% are
not in the labor force, 24% work full time (35 hours or more each week), and 6% work part time
(fewer than 35 hours each week).
Approximately 19% of admissions in distressed counties work full time as compared to more than
25% of admissions in attainment counties. In the northern and southern sub-regions, about 25% of
admissions are full time workers, as compared to slightly less than 20% in the central sub-region.
About 36% of admissions in at-risk counties and 35% in transitional counties are unemployed.
Surprisingly, approximately 36% of admissions in attainment counties are unemployed. In the
northern sub-region, about 40% of admissions are unemployed, while only about 25% of
admissions are unemployed in the central and southern sub-regions. About 40% of admissions in
distressed counties are not in the labor force while only 16% of admissions in attainment counties
are not in the labor force.
In terms of marital status, overall, 49% of admissions have never been married, 20% are divorced or
widowed, 18% are now married, 8% are separated, and 5% are unknown. The majority of
admissions in transitional (51%) and attainment counties (54%) have never been married. Across
the sub-regions, 56% of admissions in the northern region have never been married, followed by
43% of admissions in the southern region, and 29% of admissions in the central region. In
distressed counties, 22% of admissions are divorced/widowed, slightly more than the 21% in
competitive counties and 20% in attainment counties.
Overall, less than 1% of clients were pregnant at the time of admission. Slightly more than 1% of
admissions were pregnant in distressed, competitive, and attainment counties. Only 0.66% of
admissions were pregnant in at-risk counties. Across the Appalachian region, 1.25% of admissions
were pregnant in the southern sub-region, followed by 0.79% in the central sub-region and 0.74% in
the northern sub-region.
87
Table 3.2: Sub-regional Differences of Admissions to Substance Abuse Treatment in the Appalachian Region, By Employment Status,
Marital Status, and Pregnancy Status
All
Economic Level
Distressed
At-Risk
Sub-Region
Transitional
Competitive
Attainment
Northern
Central
Southern
N
%
N
%
N
%
N
%
N
%
N
%
N
%
N
%
N
%
106,250
24.45
5,884
19.22
5,689
23.28
68,213
24.90
14,761
24.34
11,703
26.10
58,529
25.17
7,710
19.77
40,011
24.55
Part-time
25,303
5.82
1,936
6.32
1,600
6.55
16,143
5.89
3,061
5.05
2,563
5.72
14,777
6.36
2,315
5.94
8,211
5.04
Unemployedc
141,577
32.59
8,282
27.06
8,695
35.58
94,701
34.57
13,704
22.60
16,195
36.11
90,502
38.93
9,855
25.27
41,220
25.29
Not in labor force
122,112
28.11
12,407
40.53
7,963
32.58
77,203
28.18
17,532
28.91
7,007
15.63
66,231
28.49
16,437
42.15
39,444
24.20
Unknown
39,239
9.03
2,100
6.86
493
2.02
17,695
6.46
11,576
19.09
7,375
16.45
2,462
1.06
2,680
6.87
34,097
20.92
All
434,481
100.00
30,609
100.00
24,440
100.00
273,955
100.00
60,634
100.00
44,843
100.00
232,501
100.00
38,997
100.00
162,983
100.00
Never married
211,320
48.64
11,208
36.62
9,426
38.57
140,348
51.23
26,296
43.37
24,042
53.61
130,304
56.04
11,318
29.02
69,698
42.76
Now married
78,710
18.12
7,538
24.63
3,993
16.34
48,734
17.79
10,853
17.90
7,592
16.93
37,467
16.11
8,023
20.57
33,220
20.38
Separated
35,042
8.07
2,494
8.15
1,193
4.88
22,966
8.38
4,398
7.25
3,991
8.90
15,880
6.83
2,535
6.50
16,627
10.20
Divorced/widowed
85,752
19.74
6,778
22.14
4,005
16.39
53,021
19.35
12,804
21.12
9,144
20.39
39,755
17.10
7,926
20.32
38,071
23.36
Unknown
23,657
5.44
2,591
8.46
5,823
23.83
8,886
3.24
6,283
10.36
74
0.17
9,095
3.91
9,195
23.58
5,367
3.29
All
434,481
100.00
30,609
100.00
24,440
100.00
273,955
100.00
60,634
100.00
44,843
100.00
232,501
100.00
38,997
100.00
162,983
100.00
Yes
4,054
0.93
336
1.10
162
0.66
2,390
0.87
704
1.16
462
1.03
1,709
0.74
310
0.79
2,035
1.25
No
125,745
28.94
8,993
29.38
5,665
23.18
80,486
29.38
16,719
27.57
13,882
30.96
66,074
28.42
9,812
25.16
49,859
30.59
Not applicable
300,929
69.26
20,916
68.33
17,327
70.90
190,214
69.43
41,975
69.23
30,497
68.01
163,159
70.18
27,141
69.60
110,629
67.88
3,753
0.86
364
1.19
1,286
5.26
865
0.32
1,236
2.04
2
0.00
1,559
0.67
1,734
4.45
460
0.28
434,481
100.00
30,609
100.00
24,440
100.00
273,955
100.00
60,634
100.00
44,843
100.00
232,501
100.00
38,997
100.00
162,983
100.00
Employment Status
Full-timea
b
Marital Status
Pregnant At Admission
Unknown
All
a Working 35 hours or more each week; includes members of the uniformed services.
b Working fewer than 35 hours each week.
c Looking for work during the past 30 days or a homemaker, student, disabled, retired, or an inmate of an institution.
Source: Treatment Episode Data Set (TEDS) 2000-2004. Office of Applied Studies, Substance Abuse and Mental Health Services Administration.
88
In Table 3.3, we provide differences in health insurance for admissions across economic status
levels and sub-regions in Appalachia. The variable, health insurance, specifies the type of insurance
a client possesses, if any. However, the insurance may or may not cover the alcohol or drug
treatment. Overall, approximately 8% of admissions have Medicaid, 5% have private insurance
(other than Blue Cross/ Blue Shield insurance or a health maintenance organization (HMO)), 3%
have Blue Cross/ Blue Shield insurance, 2% are covered by an HMO, and less than 1% have
Medicare. About 10.75% of admissions have some other type of insurance. Almost a quarter of
admissions were uninsured and insurance status was unknown for 47% of admissions.
While only 3% of admissions in distressed counties were uninsured, 39% of admissions were
uninsured in attainment counties. Private insurance was most common for admissions in distressed
counties (13%) and least common in attainment counties (3%). Medicaid was most common for
admissions in transitional counties (8%). Medicare was most common among admissions in
competitive (0.92%) and attainment counties (0.96%), as compared to distressed, at-risk, and
transitional counties.
Looking across the Appalachian region, more than a quarter of admissions in the northern and
southern sub-regions had no insurance. In the central sub-region, 45% admissions had some other
type of health insurance, followed by 15% of admissions with private insurance. About 2% of
admissions in the central sub-region reported Medicare as their insurer, as compared to less than 1%
of admissions in the northern and southern sub-regions. About 10% of admissions in the northern
sub-region were on Medicaid, followed by 7% of admissions in the central sub-region and 5% in the
southern sub-region.
Next, we explore the primary source of referral – the person or agency referring the client to the
alcohol or drug abuse treatment program. Overall, 37% of admissions were referred by the court or
criminal justice system. This includes referrals from those affiliated with a Federal, State, or county
judicial system, and referrals from DWI/DUI court. Clients referred in lieu of or for deferred
prosecution, during pretrial release, or prior to or following official adjudication are also included.
Finally, this figure also includes admissions on pre-parole, pre-release, work or home furlough, or
in Treatment Alternatives for Safe Communities (TASC) programs. Next, about 23% of admissions
were referred from an individual, which includes the client, a family member, friend, self-referral
due to DWI/DUI, or other.
About 16% of admissions were from an alcohol/drug abuse (ADA) care provider, which includes
any program, clinic, or other health care provider whose activities are related to alcohol or other
drug abuse prevention, or treatment. About 10% of admissions were described as being referred by
“other community referral,” which includes community and religious organizations or any Federal,
State, or local agency that provides assistance in the areas of poverty relief, unemployment, shelter,
or social welfare. This 10% also includes self-help groups such as Alcoholics Anonymous (AA),
Al-Anon, and Narcotics Anonymous (NA), and defense attorneys. Another 10% of admissions
were described as being referred by “other health care provider,” including a physician, psychiatrist,
other licensed health care professional, general hospital, psychiatric hospital, mental health
program, or nursing home. Slightly more than 1% were referred by someone at school, such as a
school principal, counselor, teacher or from a student assistance program (SAP), the school system,
or educational agency. Finally, slightly less than 1% of people were referred by an employer or
employee counselor.
89
The court/criminal justice system was the common primary source of referral across all counties,
regardless of economic status. Slightly less than 50% of admissions in distressed counties and
slightly more than 50% of admissions in at-risk counties were referred by court/criminal justice
systems. Referrals by court/criminal justice systems were lower in transitional (36%), competitive
(32%), and attainment counties (27%).
Across sub-regions, the court/criminal justice system is the most common primary source of referral
with the employer/ employee assistance program (EAP) being the least common. Around 31% of
admissions in both the central and sub-regions were referred by an individual.
90
Table 3.3: Sub-regional Differences of Admissions to Substance Abuse Treatment in the Appalachian Region, By Health Insurance and
Source of Referral
All
Economic Level
Distressed
At-Risk
Sub-Region
Transitional
Competitive
Attainment
N
%
N
%
N
%
N
%
N
%
N
%
N
Northern
%
N
Central
%
N
Southern
%
Private
20,987
4.83
3,901
12.74
1,152
4.71
12,131
4.43
2,438
4.02
1,365
3.04
10,223
4.40
5,982
15.34
4,782
2.93
BC/BS
13,059
3.01
238
0.78
75
0.31
10,483
3.83
904
1.49
1,359
3.03
10,363
4.46
9
0.02
2,687
1.65
Medicare/ Other
3,314
0.76
773
2.53
80
0.33
1,474
0.54
557
0.92
430
0.96
1,228
0.53
918
2.35
1,168
0.72
Medicaid
33,551
7.72
2,152
7.03
755
3.09
24,108
8.80
3,313
5.46
3,223
7.19
22,979
9.88
2,659
6.82
7,913
4.86
HMO
6,896
1.59
.
.
951
3.89
3,314
1.21
1,297
2.14
1,334
2.97
5,970
2.57
.
.
926
0.57
Other
46,758
10.76
13,322
43.52
832
3.40
26,717
9.75
1,699
2.80
4,188
9.34
25,662
11.04
17,699
45.39
3,397
2.08
None
104,132
23.97
1,000
3.27
2,566
10.50
63,920
23.33
19,179
31.63
17,467
38.95
61,124
26.29
.
.
43,008
26.39
Unknown
205,784
47.36
9,223
30.13
18,029
73.77
131,808
48.11
31,247
51.53
15,477
34.51
94,952
40.84
11,730
30.08
99,102
60.81
All
434,481
100.00
30,609
100.00
24,440
100.00
273,955
100.00
60,634
100.00
44,843
100.00
232,501
100.00
38,997
100.00
162,983
100.00
103,634
23.85
8,471
27.67
4,733
19.37
56,684
20.69
16,957
27.97
16,789
37.44
40,646
17.48
12,332
31.62
50,656
31.08
ADA care
b
provider
70,727
16.28
512
1.67
2,772
11.34
57,141
20.86
7,084
11.68
3,218
7.18
62,904
27.06
1,070
2.74
6,753
4.14
Other health care
c
provider
42,165
9.70
3,042
9.94
2,176
8.90
21,741
7.94
8,503
14.02
6,703
14.95
12,560
5.40
4,075
10.45
25,530
15.66
d
4,585
1.06
479
1.56
468
1.91
3,017
1.10
322
0.53
299
0.67
2,434
1.05
525
1.35
1,626
1.00
3,650
0.84
186
0.61
145
0.59
2,663
0.97
451
0.74
205
0.46
2,277
0.98
185
0.47
1,188
0.73
Other community
f
referral
43,194
9.94
2,786
9.10
1,473
6.03
28,721
10.48
6,223
10.26
3,991
8.90
26,689
11.48
3,430
8.80
13,075
8.02
Court/criminal
g
justice
158,826
36.56
14,710
48.06
12,533
51.28
99,410
36.29
19,646
32.40
12,527
27.94
83,859
36.07
16,351
41.93
58,616
35.96
7,700
1.77
423
1.38
140
0.57
4,578
1.67
1,448
2.39
1,111
2.48
1,132
0.49
1,029
2.64
5,539
3.40
434,481
100.00
30,609
100.00
24,440
100.00
273,955
100.00
60,634
100.00
44,843
100.00
232,501
100.00
38,997
100.00
162,983
100.00
Health Insurance
Primary Source of Referral
Individual
School
a
Employer/EAP
Unknown
All
e
a
b
Includes the client, a family member, friend, self-referral due to DWU/DUI, or another individual not included in other categories; Any program, clinic, or other health care provider whose activities are related to alcohol or other drug abuse
prevention, or treatment; c A physician, psychiatrist, licensed health care professional, general hospital, psychiatric hospital, mental health program, or nursing home; d A school principal, counselor, or teacher; or a student assistance program, the
school system, or educational agency; e A supervisor or employee counselor; f Community and religious organizations or any Federal, State, or local agency that provides aid in the areas of poverty relief, unemployment, shelter, or social welfare.
Self-help groups and defense attorneys are included; g Any police official, judge, prosecutor, probation officer, or other person affiliated with a Federal, State, or county judicial system.
Source: Treatment Episode Data Set (TEDS) 2000-2004. Office of Applied Studies, Substance Abuse and Mental Health Services Administration.
91
In Table 3.4, we provide sub-regional differences to substance abuse treatment in the Appalachian
region by service setting. First, we explore the type of treatment into which the client was admitted.
Overall, approximately 13% of admissions were for detoxification services in a 24-hour per day,
non-hospital setting that provides safe withdrawal and transition to ongoing treatment. Only about
2% of admissions were into 24-hour per day acute care services in a hospital setting for
detoxification of persons with severe medical complications associated with withdrawal.
About 0.2% of admissions were for 24-hour per day medical care (but not detoxification services)
in a hospital facility in conjunction with treatment services for alcohol and other drug abuse and
dependency. About 10% of admissions were into a short-term (typically for 30 days or less) nonacute care setting with treatment services for alcohol and other drug abuse and dependency.
Slightly less than 5% of admissions were for long-term non-acute care (more than 30 days) in a
setting with treatment services for alcohol, drug abuse and dependency (this figure may also include
transitional living situations such as halfway houses, etc.).
In the ambulatory care setting, about 15% of admissions were into an intensive outpatient setting
where at a minimum the client must receive treatment for two or more hours per day for three or
more days per week. About 57% of admissions were into the non-intensive outpatient ambulatory
care setting; such admissions were for services including individual, family and/or group services
and pharmacological therapies. Only about 0.10% of admissions were for outpatient treatment
services providing detoxification in the ambulatory care setting (both pharmacological and nonpharmacological).
Admissions for inpatient detoxification tend to be in the competitive (2.92%) and attainment
counties (2.15%) rather than the at-risk (0.01%) and transitional counties (0.71%). About 24% of
admissions to free-standing residential facilities were in competitive counties and 16% in attainment
counties. Admissions for short-term detoxification in a rehabilitation/residential setting were
highest in at-risk (11%) and transitional counties (13%). Admissions to a long-term non-acute care
setting were highest in competitive and attainment counties (approximately 5% for both). 91% of
admissions to non-intensive outpatient ambulatory care were in distressed counties.
Across the sub-regions, the majority of admissions in the northern (61%) and central sub-regions
(80%) were to non-intensive outpatient care settings. Admissions to a short-term or long-term
rehabilitation/ residential care setting were much higher in the northern region (15%) than in the
central and southern sub-regions (3% for both). Admissions to a free-standing residential setting
were highest in the southern sub-region (16%), followed by the central (15%) and northern subregions (10%), respectively.
92
Table 3.4: Sub-regional Differences of Admissions to Substance Abuse Treatment in the Appalachian Region, By Service Setting
All
Economic Level
Distressed
N
%
N
At-Risk
Sub-Region
Transitional
Competitive
Attainment
Northern
Central
Southern
%
N
%
N
%
N
%
N
%
N
%
N
%
N
%
Service Setting
Detoxification
Hospital
Inpatient a
4,672
1.08
.
.
3
0.01
1,932
0.71
1,771
2.92
966
2.15
3,916
1.68
.
.
756
0.46
55,267
12.72
616
2.01
3,210
13.13
29,533
10.78
14,712
24.26
7,196
16.05
23,830
10.25
5,687
14.58
25,750
15.80
663
0.15
.
.
.
.
651
0.24
3
0.00
9
0.02
252
0.11
.
.
411
0.25
Short d
42,296
9.73
401
1.31
2,621
10.72
34,564
12.62
2,693
4.44
2,017
4.50
35,783
15.39
1,246
3.20
5,267
3.23
Long e
19,059
4.39
754
2.46
441
1.80
12,694
4.63
2,849
4.70
2,321
5.18
15,455
6.65
231
0.59
3,373
2.07
65,593
15.10
756
2.47
7,129
29.17
46,820
17.09
5,897
9.73
4,991
11.13
11,102
4.78
731
1.87
53,760
32.99
246,517
56.74
28,082
91.74
11,028
45.12
147,492
53.84
32,679
53.90
27,236
60.74
142,019
61.08
31,102
79.75
73,396
45.03
414
0.10
.
.
8
0.03
269
0.10
30
0.05
107
0.24
144
0.06
.
.
270
0.17
434,481
100.00
30,609
100.0
24,440
100.00
273,955
100.00
60,634
100.00
44,843
100.00
232,501
100.00
38,997
100.00
162,983
100.00
Free-standing
Residential b
Rehabilitation/ Residential
Hospital c
Ambulatory
Intensive
outpatient f
Non-intensive
Outpatient g
Detoxification h
All
NOTES
a
24 hour per day acute care services in a hospital setting for detoxification of persons with severe medical complications associated with withdrawal.
b
24 hour per day services in non-hospital setting providing for safe withdrawal and transition to ongoing treatment.
c
24 hour per day medical care in a hospital facility in conjunction with treatment services for alcohol and other drug abuse and dependency.
d
Typically 30 days or less of non-acute care in a setting with treatment services for alcohol and other drug abuse and dependency.
e
Typically more than 30 days of non-acute care in a setting with treatment services for alcohol and other drug abuse and dependency; this may include transitional living such as halfway houses.
f
At minimum, the client must receive treatment lasting two or more hours per day for three or more days per week.
g
Ambulatory treatment services including individual, family, and/or group services; these may include pharmacological therapies.
h
Outpatient treatment services providing for safe withdrawal in an ambulatory setting (pharmacological or non-pharmacological).
Source: Treatment Episode Data Set (TEDS) 2000-2004. Office of Applied Studies, Substance Abuse and Mental Health Services Administration.
93
In Table 3.5, we provide sub-regional differences to substance abuse treatment in the Appalachian
region by types of service and methadone use. Overall, approximately 72% of admissions received
ambulatory care services, 14% received rehabilitational services, and 14% received detoxification
services. 94% of admissions in distressed counties received ambulatory care services. The majority of
at-risk, transitional, competitive, and attainment counties also received ambulatory care services. This
finding was consistent across sub-regions as well. Admissions for detoxification services were most
common in competitive counties (27%) and least common in distressed counties (2%). Rehabilitation
and residential services were most common for admissions in at-risk (13%) and transitional counties
(17%); these services were also five times more common in the northern region than in the central
region, and four times more common in the northern region than in the southern region.
Next, we look at methadone use. Overall, methadone was specified as part of treatment for
approximately 1.2% of admissions. For competitive and attainment counties, the percentages are
larger, at 3% and 5% of admissions, respectively. Distressed counties are fairly consistent with the
average across all Appalachian counties, at 1.44% of admissions. Methadone was specified as part of
the treatment plan for less than 1% of admissions in at-risk counties and less than half a percent of
admissions in transitional counties. Across Appalachia, methadone use was specified as part of the
treatment plan for between 1 and 1.5% of admissions, with the smallest percentage of admissions in
the northern sub-region and the greatest percentage of admissions in the southern sub-region.
94
Table 3.5: Sub-regional Differences of Admissions to Substance Abuse Treatment in the Appalachian Region, By Types of Services
and Methadone Use As Part of Treatment
All
Economic Level
Distressed
At-Risk
Sub-Region
Transitional
Competitive
Attainment
Northern
Central
Southern
N
%
N
%
N
%
N
%
N
%
N
%
N
%
N
%
N
%
Ambulatory
312,524
71.93
28,838
94.21
18,165
74.32
194,581
71.03
38,606
63.67
32,334
72.10
153,265
65.92
31,833
81.63
127,426
78.18
Detoxification
59,939
13.80
616
2.01
3,213
13.15
31,465
11.49
16,483
27.18
8,162
18.20
27,746
11.93
5,687
14.58
26,506
16.26
Rehabilitation/
Residential
62,018
14.27
1,155
3.77
3,062
12.53
47,909
17.49
5,545
9.15
4,347
9.69
51,490
22.15
1,477
3.79
9,051
5.55
All
434,481
100.00
30,609
100.00
24,440
100.00
273,955
100.00
60,634
100.00
44,843
100.00
232,501
100.00
38,997
100.00
162,983
100.00
Yes
5,308
1.22
444
1.45
176
0.72
619
0.23
1,845
3.04
2,224
4.96
2,413
1.04
430
1.10
2,465
1.51
No
400,729
92.23
26,889
87.85
18,386
75.23
257,678
94.06
57,690
95.14
40,086
89.39
230,063
98.95
31,984
82.02
138,682
85.09
Unknown
28,444
6.55
3,276
10.70
5,878
24.05
15,658
5.72
1,099
1.81
2,533
5.65
25
0.01
6,583
16.88
21,836
13.40
All
434,481
100.00
30,609
100.00
24,440
100.00
273,955
100.00
60,634
100.00
44,843
100.00
232,501
100.00
38,997
100.00
162,983
100.00
Types of Services
Methadone Use
Source: Treatment Episode Data Set (TEDS) 2000-2004. Office of Applied Studies, Substance Abuse and Mental Health Services Administration.
95
Table 3.6 focuses on sub-regional differences in the number of previous treatment episodes that admissions
received in any drug or alcohol program as well as the primary source of expected/ actual payment for this
treatment episode. Overall, in Appalachia, approximately 37% of admissions had no prior treatment
episodes in a drug or alcohol program, 30% had 1 or 2 prior treatments, and 18% had 3 or more prior
treatments. The previous treatment for about 15% of admissions was unknown. This distribution is
consistent across Appalachia regardless of county economic status with the exception of distressed counties.
In distressed counties, we see that the majority of admissions had no prior treatment episodes and only 8% of
admissions had three or more treatment episodes.
Looking across geographic sub-regions, we see that 67% of admissions in the central sub-region had no prior
treatment episodes, followed by the northern (37%) and southern sub-regions (30%), respectively. About
26% of admissions with three or more treatment episodes are into programs in the northern sub-region, as
opposed to the southern (9%) and central (7%) sub-regions.
Next, we review our findings for the primary source of payment (expected/actual) for the treatment episode.
Note that for this variable, states operating under a split payment fee arrangement between multiple payment
sources must default to the payment source with the largest percentage; if the payment percentages are equal,
the state can choose either source.52 In Table 3.6, we see that overall, the primary source of payment is
unknown for almost 30% of admissions. Other government payments are the primary source of payment for
about 22% of admissions, followed by self-pay (20%), Medicaid (10%), other (8%), Blue Cross Blue Shield
and other health insurance (7%), no charge (3%), and Medicare/ Workman’s Compensation (1%).
The primary payer in distressed counties is other government payments for about 35% of admissions, while
in attainment counties approximately 40% of admissions are self-pay. No charge admissions are more
common in distressed (5%) and at-risk counties (6%) than in competitive (0.19%) and attainment counties
(0.36%). Across the sub-regions, we see that 40% of admissions are self-pay in the southern sub-region as
opposed to 16% of admissions in the northern and 6% in the central sub-regions. The primary source of
payment for about 11% of admissions in the northern sub-region is Blue Cross Blue Shield and other types
of health insurance, compared to slightly more than 2% of admissions in the southern sub-region and 0.17%
of admissions in the central sub-region.
96
Table 3.6: Sub-regional Differences of Admissions to Substance Abuse Treatment in the Appalachian Region, By Prior Treatment
Episodes and Expected Source of Payment
All
Economic Level
Distressed
N
%
At-Risk
Sub-Region
Transitional
Competitive
Attainment
Northern
Central
Southern
N
%
N
%
N
%
N
%
N
%
N
%
N
%
N
%
Number of Prior Treatment Episodes
No prior
treatment
161,910
37.27
19,139
62.53
8,473
34.67
99,789
36.43
18,550
30.59
15,959
35.59
86,631
37.26
25,934
66.50
49,345
30.28
1-2 prior
treatments
129,057
29.70
7,781
25.42
7,856
32.14
86,226
31.47
15,803
26.06
11,391
25.40
78,866
33.92
8,871
22.75
41,320
25.35
3 or more
treatments
77,473
17.83
2,446
7.99
3,860
15.79
56,369
20.58
8,989
14.83
5,809
12.95
59,647
25.65
2,659
6.82
15,167
9.31
Unknown
66,041
15.20
1,243
4.06
4,251
17.39
31,571
11.52
17,292
28.52
11,684
26.06
7,357
3.16
1,533
3.93
57,151
35.07
All
434,481
100.00
30,609
100.00
24,440
100.00
273,955
100.00
60,634
100.00
44,843
100.00
232,501
100.00
38,997
100.00
162,983
100.00
Expected Source of Payment
Self pay
84,876
19.54
3,463
11.31
6,222
25.46
40,154
14.66
17,003
28.04
18,034
40.22
14,266
6.14
6,105
15.66
64,505
39.58
BC/BS/
Other
health
insurance
30,423
7.00
720
2.35
519
2.12
25,374
9.26
1,882
3.10
1,928
4.30
26,618
11.45
67
0.17
3,738
2.29
Medicare/
Workman’s
Comp
3,280
0.75
929
3.04
109
0.45
1,593
0.58
409
0.67
240
0.54
1,250
0.54
968
2.48
1,062
0.65
Medicaid
43,738
10.07
4,854
15.86
1,753
7.17
29,734
10.85
2,895
4.77
4,502
10.04
31,215
13.43
2,946
7.55
9,577
5.88
Other
government
payments1
92,343
21.25
10,795
35.27
2,474
10.12
68,489
25.00
6,737
11.11
3,848
8.58
53,040
22.81
12,261
31.44
27,042
16.59
No charge
12,992
2.99
1,556
5.08
1,558
6.37
9,604
3.51
114
0.19
160
0.36
12,255
5.27
6
0.02
731
0.45
Other
32,814
7.55
5,601
18.30
927
3.79
20,920
7.64
1,641
2.71
3,725
8.31
21,949
9.44
5,857
15.02
5,008
3.07
Unknown
134,015
30.84
2,691
879
10,878
44.51
78,087
28.50
29,953
49.40
12,406
27.67
71,908
30.93
10,787
27.66
51,320
31.49
All
434,481
100.00
30,609
100.00
24,440
100.00
273,955
100.00
60,634
100.00
44,843
100.00
232,501
100.00
38,997
100.00
162,983
100.00
1
Progams other than Medicare and Medicaid.
Source: Treatment Episode Data Set (TEDS) 2000-2004. Office of Applied Studies, Substance Abuse and Mental Health Services Administration.
97
Table 3.7 shows the primary substance of abuse at the time of admission across sub-regions. We
see that alcohol was the primary substance of abuse at the time of admission for 52% of admissions,
followed by: marijuana (14%); cocaine (13%); heroin (7%); other opiates or synthetics (6%) which
includes codeine, Dilaudid, morphine, Demerol, opium, oxycodone, and any other drug with
morphine-like effects; methamphetamine or other stimulants (3%) which includes nonamphetamine stimulants; other substances (1.50%); tranquilizers (1%); sedatives (0.35%); and
inhalants (0.12%).
For 50% or more of admissions, the primary substance of abuse at the time of admission was
alcohol for all Appalachian counties, across all economic status levels.
The second most common primary substance of abuse was marijuana for distressed (14%), at-risk
(16%), and transitional counties (14%), and cocaine for competitive (15%) and attainment counties
(18%). Across the Appalachian sub-regions, alcohol is the most common primary substance of
abuse at the time of admission, followed by cocaine in the southern sub-region (16%), other opiates
and synthetics in the central sub-region (14%), and marijuana in the northern sub-region (13%).
98
Table 3.7: Sub-regional Differences of Admissions to Substance Abuse Treatment in the Appalachian Region, By Use as a Primary
Reason for Admission
All
Economic Level
Distressed
N
%
At-Risk
Sub-Region
Transitional
Competitive
Attainment
Northern
Central
Southern
N
%
N
%
N
%
N
%
N
%
N
%
N
%
N
%
Use as Primary Reason for Admission
Alcohol
225,032
51.79
15,221
49.73
12,160
49.75
141,656
51.71
32,864
54.20
23,131
51.58
126,994
54.62
17,931
45.98
80,107
49.15
Cocaine/ Crack
56,447
12.99
1,481
4.84
1,826
7.47
36,083
13.17
9,200
15.17
7,857
17.52
27,903
12.00
1,702
4.36
26,842
16.47
Marijuana/
Hashish
62,649
14.42
4,785
15.63
4,081
16.70
39,593
14.45
7,913
13.05
6,277
14.00
31,372
13.49
5,525
14.17
25,752
15.80
Heroin
31,770
7.31
597
1.95
522
2.14
23,723
8.66
3,197
5.27
3,731
8.32
29,439
12.66
477
1.22
1,854
1.14
Other Opiates or
1
Synthetics
25,211
5.80
3,068
10.02
2,903
11.88
15,329
5.60
2,319
3.82
1,592
3.55
9,680
4.16
5,652
14.49
9,879
6.06
Methamphetamine/
2
Other stimulants
11,496
2.65
352
1.15
1,128
4.62
6,452
2.36
2,839
4.68
725
1.62
1,384
0.60
671
1.72
9,441
5.79
4,139
0.95
984
3.21
400
1.64
2,037
0.74
485
0.80
233
0.52
892
0.38
1,373
3.52
1,874
1.15
4
1,505
0.35
194
0.63
82
0.34
979
0.36
134
0.22
116
0.26
576
0.25
302
0.77
627
0.38
5
509
0.12
45
0.15
36
0.15
322
0.12
79
0.13
27
0.06
280
0.12
62
0.16
167
0.1
6,519
1.50
464
1.52
82
0.34
3,435
1.25
1,451
2.39
1,087
2.42
879
0.38
538
1.38
5,102
3.13
Tranquilizers
Sedatives
Inhalants
6
Other
3
1
Includes codeine, Dilaudid, morphine, Demerol, opium, oxycodone, and any other drug with morphine-like effects.
Includes amphetamines, MDMA, phenmetrazine, and other unspecified amines and related drugs.
3
Includes meprobamate and other non-benzodiazepine tranquilizers.
4
Includes chloral hydrate, ethchlorvynol, glutethimide, methaqualone, and other non-barbiturate sedative or hyphotics.
5
Includes chloroform, ether, gasoline, glue, nitrous oxide, paint thinner, etc.
6
Includes diphenylhydantoin/phenytoin, GHB/GBL, ketamine, etc.
2
Source: Treatment Episode Data Set (TEDS) 2000-2004. Office of Applied Studies, Substance Abuse and Mental Health Services Administration.
99
Table 3.8 presents data on “one major reason for admission to substance abuse programs” for
Appalachia by economic level and sub-region. TEDS reports different types of substances as the
primary, secondary, or tertiary substance of abuse at the time of admission. If the substance was
mentioned as either the primary, secondary, or tertiary substance of abuse at the time of admission,
this substance was then regarded as one major reason for admission into substance abuse treatment.
We see that, overall, the substances included as one major reason for admission are alcohol (68%),
followed by: marijuana (36%); cocaine (26%); other opiates or synthetics (10%) which includes
codeine, Dilaudid, morphine, Demerol, opium, oxycodone, and any other drug with morphine-like
effects; heroin (9%); methamphetamine or other stimulants (5%) which includes non-amphetamine
stimulants; tranquilizers (4%); other substances (3%); sedatives (1%); and inhalants (1%).
Alcohol was most commonly one major reason for admission to substance abuse programs in
Appalachia, regardless of county economic status. The second substance most commonly cited as
one major reason for admission was marijuana for all counties, with the exception of attainment
counties where cocaine was second to alcohol as one major reason for admission. Similarly,
looking across sub-regions, alcohol was one major reason for admission for almost three-quarters of
admissions in the northern sub-region, followed by 64% of admissions in the southern sub-region,
and 59% of admissions in the central sub-region.
100
Table 3.8: Sub-regional Differences of Admissions to Substance Abuse Treatment in the Appalachian Region, By One Major
Reason for Admission
All
Economic Level
Distressed
N
%
At-Risk
Sub-Region
Transitional
Competitive
Attainment
Northern
Central
Southern
N
%
N
%
N
%
N
%
N
%
N
%
N
%
N
%
Use as One Major Reason for Admission
Alcohol
296,266
68.19
19,298
63.05
16,192
66.25
188,032
68.64
42,734
70.48
30,010
66.92
168,726
72.57
23,186
59.46
104,354
64.03
Cocaine/ Crack
112,250
25.84
3,501
11.44
3,947
16.15
72,474
26.45
17,668
29.14
14,660
32.69
63,504
27.31
4,354
11.16
44,392
27.24
Marijuana/
Hashish
155,934
35.89
10,516
34.36
9,316
38.12
102,069
37.26
20,492
33.80
13,541
30.20
88,790
38.19
12,776
32.76
54,368
33.36
Heroin
39,309
9.05
862
2.82
729
2.98
28,921
10.56
4,144
6.83
4,653
10.38
35,740
15.37
760
1.95
2,809
1.72
Other Opiates or
1
Synthetics
43,412
9.99
4,923
16.08
4,478
18.32
27,359
9.99
3,994
6.59
2,658
5.93
19,192
8.25
8,853
22.70
15,367
9.43
Methamphetamine/
2
Other stimulants
20,631
4.75
791
2.58
1,830
7.49
12,426
4.54
4,131
6.81
1,453
3.24
4,335
1.86
1,458
3.74
14,838
9.10
18,186
4.19
3,327
10.87
2,366
9.68
9,445
3.45
1,975
3.26
1,073
2.39
5,032
2.16
5,694
14.60
7,460
4.58
4
4,801
1.1
448
1.46
293
1.2
3263
1.19
535
0.88
262
0.58
2,879
1.24
603
1.55
1,319
0.81
5
3,833
0.88
316
1.03
247
1.01
2617
0.96
481
0.79
172
0.38
2,584
1.11
389
1
860
0.53
11,250
2.59
848
2.77
201
0.82
6,500
2.37
2,421
3.99
1,280
2.85
2,976
1.28
881
2.26
7,393
4.54
Tranquilizers
Sedatives
Inhalants
6
Other
3
1
Includes codeine, Dilaudid, morphine, Demerol, opium, oxycodone, and any other drug with morphine-like effects.
Includes amphetamines, MDMA, phenmetrazine, and other unspecified amines and related drugs.
3
Includes meprobamate and other non-benzodiazepine tranquilizers.
4
Includes chloral hydrate, ethchlorvynol, glutethimide, methaqualone, and other non-barbiturate sedative or hyphotics.
5
Includes chloroform, ether, gasoline, glue, nitrous oxide, paint thinner, etc.
6
Includes diphenylhydantoin/phenytoin, GHB/GBL, ketamine, etc.
2
Source: Treatment Episode Data Set (TEDS) 2000-2004. Office of Applied Studies, Substance Abuse and Mental Health Services Administration.
101
Table 3.9 shows sub-regional differences for psychological problems or mood disorder upon
admission. First, we explore whether there is a psychological problem present in addition to an
alcohol or drug problem upon admission. Approximately 15% of admissions had a psychological
problem present upon admission. In distressed counties, we see that 36% of admissions had a
psychological problem, followed by 17% of admissions in attainment counties, 16% in at-risk
counties, 13% in competitive counties, and 12% in transitional counties. In the central sub-region
of Appalachia, more than 34% of admissions had a psychological problem, followed by northern
and southern sub-regions with approximately 13% of admissions.
The mood disorder variable was derived from either the third edition revised or the fourth edition of
the American Psychiatric Association's Diagnostic and Statistical Manual of Mental Disorders.
Our findings show whether a mood disorder was present upon admission in addition to an alcohol
or drug problem. However, due to mutually-exclusive reporting of different types of drug abuse
and dependence, the absence of mood disorder upon admission in the data record may not
necessarily mean the actual absence of mood disorder. Therefore, these should be seen as
conservative estimates. Overall, approximately 62% of admissions had a mood disorder (substancerelated or non-substance-related) present upon admission. More than 70% of admissions had a
mood disorder in transition counties, followed by 59% in competitive counties, 47% in attainment
counties, 53% in at-risk counties, and 35% in distressed counties. In the central sub-region of
Appalachia, almost 90% of admissions had a mood disorder.
102
Table 3.9: Sub-regional Differences of Admissions to Substance Abuse Treatment in the Appalachian Region, By Psychological
Problem and Mood Disorder Upon Admission
All
Economic Level
Distressed
N
At-Risk
Sub-Region
Transitional
Competitive
Attainment
Northern
Central
Southern
%
N
%
N
%
N
%
N
%
N
%
N
%
N
%
N
%
Psychological Problem
Yes
64,018
14.73
11,072
36.17
3,913
16.01
33,573
12.25
7,651
12.62
7,809
17.41
29,503
12.69
13,309
34.13
21,206
13.01
No
190,377
43.82
14,637
47.82
9,980
40.83
101,682
37.12
42,585
70.23
21,493
47.93
54,986
23.65
16,687
42.79
118,704
72.83
Unknown
180,086
41.45
4,900
16.01
10,547
43.15
138,700
50.63
10,398
17.15
15,541
34.66
148,012
63.66
9,001
23.08
23,073
14.16
All
434,481
100.00
30,609
100.00
24,440
100.00
273,955
100.00
60,634
100.00
44,843
100.00
232,501
100.00
38,997
100.00
162,983
100.00
Mood Disorder
Yes
273,061
62.85
10,998
35.93
13,046
53.38
192,236
70.17
35,715
58.90
21,066
46.98
208,662
89.75
14,517
37.23
49,882
30.61
No
161,420
37.15
19,611
64.07
11,394
46.62
81,719
29.83
24,919
41.10
23,777
53.02
23,839
10.25
24,480
62.77
113,101
69.39
All
434,481
100.00
30,609
100.00
24,440
100.00
273,955
100.00
60,634
100.00
44,843
100.00
232,501
100.00
38,997
100.00
162,983
100.00
Note: Mood disorders represented here are substance-related and non-substance-related.
Source: Treatment Episode Data Set (TEDS) 2000-2004. Office of Applied Studies, Substance Abuse and Mental Health Services Administration.
103
3.4.2. Figures
Trends in Primary Substance of Abuse in Appalachia and the United States
This section provides TEDS data on the primary substance of abuse at the time of admission to
treatment between 2000 and 2004, both in Appalachia and nationally. We provide results for all
TEDS treatment admissions aged 12 and older for 11 substances: alcohol; marijuana/hashish;
cocaine; heroin; other opiates/synthetics; phencyclidine (PCP); hallucinogens; amphetamines;
tranquilizers; sedatives; and inhalants. In Figure 3.1 and Figure 3.2 we illustrate the trends of
primary substance of abuse at the time of admission for the years 2000 through 2004 in the U.S. and
the Appalachian region, respectively. Figures 3.3 through 3.8 illustrate trends for the primary
abuse of alcohol, marijuana/hashish, cocaine, heroin, other opiates/synthetics, and
methamphetamine.11 Key findings include the following:.
Alcohol as a primary substance accounted for 45% of all TEDS admissions in the
Appalachian region in 2004, down from more than 56% in 2000. Between 2000 and 2004,
the percentage of total admissions with alcohol as the primary substance of abuse also
declined in United States as a whole, accounting for almost 26% of all TEDS admissions in
2000, declining to 22% of admissions in 2004. Figure 3.3 illustrates this trend.
The proportion of admissions for primary marijuana/hashish abuse as the primary
substance increased steadily from 14.2% of all TEDS admissions in the U.S. in 2000 to
15.5% of admissions in 2004. In Appalachia, admissions increased from 15.1% of all TEDS
admissions in 2000 to 16.28% of admissions in 2002, and then declined to 14.24% of
admissions in 2004. Figure 3.4 illustrates this trend.
Admissions for primary abuse of cocaine in the U.S. declined from 13.5% of all admissions
in 2000 to 12.9% in 2001 and 2002, and then increased to 13.8% by 2004. In Appalachia,
admissions for primary cocaine abuse followed a similar trend, declining from 12.95% in
2000 to 11.78% in 2001, and then increasing to 12.45% in 2002. Admissions for primary
cocaine abuse sharply increased between 2002 and 2004 to 13.66%. Figure 3.5 illustrates
this trend.
TEDS admissions for primary heroin abuse in the U.S. hovered around 15% of all
admissions between 2000 and 2002, with a slight decrease to 14.1% in 2004. In Appalachia,
admissions have increased steadily from 4.39% in 2000 to 10.19% in 2004. Figure 3.6
illustrates this trend.
Admissions for primary abuse of other opiates and synthetics12 more than doubled between
2000 and 2004 from 1.5% to 3.2% of all admissions in the U.S. In Appalachia, the
proportion of admissions for primary abuse of other opiates and synthetics is considerably
higher than in the U.S. between 2000 and 2004, and also more than doubled from 3.49% in
2000 to 7.54% in 2004. Figure 3.7 illustrates this trend.
11
Charts depicting the trends over the 2000 – 2004 period are not included below because admissions for primary abuse
of PCP, hallucinogens, tranquilizers, sedatives, and inhalants were relatively stable.
12
These drugs include codeine, hydrocodone, hydromorphone, meperidine, morphine, opium, oxycodone, pentazocine,
propoxyphene, tramadol, and any other drug with morphine-like effects. These drugs exclude methadone.
104
The proportion of admissions for primary abuse of methamphetamine increased in both the
U.S. and Appalachia between 2000 and 2004. In the U.S., primary methamphetamine abuse
accounted for 3.8% of all admissions in 2000, and then rose steadily to almost 7% of
admissions in 2004. In Appalachia, the proportion of admissions rose from 1.3% in 2000 to
4.25% in 2004. Figure 3.8 illustrates this trend.
Phencyclidine (PCP) as a primary substance of abuse accounted for 0.2% of all admissions
in the U.S. between 2000 and 2004. The proportion of admissions for PCP abuse in
Appalachia has also remained fairly stable over the 2000 to 2004 time period at 0.02 to
0.03%.
Admissions for primary abuse of hallucinogens remained fairly stable in the U.S. over this
time period, accounting for less than 0.2% of all TEDS admissions between 2000 and 2002,
and 0.1% in 2003 and 2004. In Appalachia, admissions were approximately 0.2% in 2000
and 2001, declined to 0.15% in 2002, and then rose slightly to 0.18% in 2004.
Admissions for primary abuse of tranquilizers remained fairly consistent over the time
period, accounting for 0.4% to 0.5% of all US admissions between 2000 and 2004. In
Appalachia, primary abuse of tranquilizers accounted for 0.95% of all admissions in 2004,
up from 0.88% of admissions in 2000.
TEDS admissions for primary abuse of sedatives remained at 0.2% between 2000 and 2004
in the U.S. In Appalachia, the proportion of admissions hovered around 0.39% in 2004, up
from 0.33% in 2000.
The proportion of TEDS admissions for primary abuse of inhalants was approximately
0.1% between 2000 and 2004 in the U.S., and the Appalachian region.
105
Figure 3.1 Primary Substance of Abuse at Admission, Aged 12 and Older, in the U.S., TEDS
2000-2004
Primary Substance of Abuse At Admission, Aged 12 and Older,in the US,
TEDS 2000-2004
30
Alcohol
Percentage of Total Admissions
25
Marijuana/Hashish
Cocaine
20
Heroin
Other Opiates
15
PCP
Hallucinogens
10
Methamphetamine
Tranquilizers
5
Sedatives
Inhalants
0
2000
2001
2002
2003
2004
SOURCE: "Treatment Episo de Data Set (TEDS) 1995 - 2005: Natio nal A dmissio ns to Substance A buse
Treatment Services." Office o f A pplied Studies, Substance A buse and M ental Health Services
A dministratio n.
Figure 3.2 Primary Substance of Abuse at Admission, Aged 12 and Older, in the Appalachian
Region, TEDS 2000-2004
Primary Substance of Abuse At Admission, Aged 12 and Older,
In the Appalachian Region, TEDS 2000-2004
60
Percentage of Total Admissions
Alcohol
50
Marijuana/Hashish
Cocaine
40
Heroin
Other Opiates
30
PCP
Hallucinogens
20
Methamphetamine
Tranquilizers
10
Sedatives
Inhalants
0
2000
2001
2002
2003
2004
SOURCE: "Treatment Episo de Data Set (TEDS) 1995 - 2005: Natio nal A dmissio ns to Substance A buse
Treatment Services." Office o f A pplied Studies, Substance A buse and M ental Health Services
A dministratio n.
106
Figure 3.3 Admissions Aged 12 and Over for Primary Alcohol Abuse, in the U.S. and
Appalachia, TEDS 2000 – 2004
Percentage of All TEDS Admissions
Admissions Aged 12 and Over for Primary Alcohol Abuse,
TEDS 2000 - 2004
60
50
40
30
20
10
0
2000
2001
2002
2003
US
2004
Appalachia
SOURCE: "Treatment Episo de Data Set (TEDS) 1995 - 2005: Natio nal A dmissio ns to Substance A buse
Treatment Services." Office o f A pplied Studies, Substance A buse and M ental Health Services
A dministratio n.
Figure 3.4 Admissions Aged 12 and Over for Primary Marijuana/Hashish Abuse, in the U.S.
and Appalachia, TEDS 2000 – 2004
Percentage of All TEDS Admissions
Admissions Aged 12 and Over for Primary Marijuana/Hashish Abuse,
TEDS 2000 - 2004
16.5
16
15.5
15
14.5
14
13.5
13
2000
2001
2002
US
2003
Appalachia
SOURCE: "Treatment Episo de Data Set (TEDS) 1995 - 2005: Natio nal A dmissio ns to Substance A buse
Treatment Services." Office o f A pplied Studies, Substance A buse and M ental Health Services
A dministratio n.
107
2004
Figure 3.5 Admissions Aged 12 and Over for Primary Cocaine Abuse, in the U.S. and
Appalachia, TEDS 2000 – 2004
Percentage of All TEDS Admissions
Admissions Aged 12 and Over for Primary Cocaine Abuse,
TEDS 2000 - 2004
14
13.5
13
12.5
12
11.5
11
10.5
2000
2001
2002
US
2003
2004
Appalachia
SOURCE: "Treatment Episo de Data Set (TEDS) 1995 - 2005: Natio nal A dmissio ns to Substance A buse
Treatment Services." Office o f A pplied Studies, Substance A buse and M ental Health Services
A dministratio n.
Figure 3.6 Admissions Aged 12 and Over for Primary Heroin Abuse, in the U.S. and
Appalachia, TEDS 2000 – 2004
Percentage of All TEDS Admissions
Admissions Aged 12 and Over for Primary Heroin Abuse,
TEDS 2000 - 2004
18
16
14
12
10
8
6
4
2
0
2000
2001
2002
US
2003
Appalachia
SOURCE: " Treatment Episo de Data Set (TEDS) 1995 - 2005: Natio nal A dmissio ns to Substance A buse
Treatment Services." Office o f A pplied Studies, Substance A buse and M ental Health Services
A dministratio n.
108
2004
Figure 3.7 Admissions Aged 12 and Over for Primary Abuse of Other Opiates/Synthetics, in
the U.S. and Appalachia, TEDS 2000 – 2004
Percentage of All TEDS Admissions
Admissions Aged 12 and Over for Primary Abuse of Other
Opiates/Synthetics, TEDS 2000 - 2004
8
7
6
5
4
3
2
1
0
2000
2001
2002
US
2003
2004
Appalachia
SOURCE: "Treatment Episo de Data Set (TEDS) 1995 - 2005: Natio nal A dmissio ns to Substance A buse
Treatment Services." Office o f A pplied Studies, Substance A buse and M ental Health Services
A dministratio n.
Figure 3.8 Admissions Aged 12 and Over for Primary Methamphetamine Abuse, in the U.S.
and Appalachia, TEDS 2000 – 2004
Percentage of All TEDS Admissions
Admissions Aged 12 and Over for Primary Methamphetamine Abuse,
TEDS 2000 - 2004
8
7
6
5
4
3
2
1
0
2000
2001
2002
US
2003
Appalachia
SOURCE: "Treatment Episo de Data Set (TEDS) 1995 - 2005: Natio nal A dmissio ns to Substance A buse
Treatment Services." Office o f A pplied Studies, Substance A buse and M ental Health Services
A dministratio n.
109
2004
3.4.3. Maps
Map 3.1, below, shows the geographical distribution of TEDS admissions with three or more prior
treatment episodes for substance abuse. Counties with higher proportions of admissions with three
or more treatments are concentrated in northern Appalachia, from the southern border of New York
to Maryland. High levels of three or more admissions are also seen in southern Appalachia,
particularly in South Carolina and Alabama. There are relatively few admissions with three or more
prior treatments in central Appalachia.
Map 3.1. Percentage of Persons with Three or More Prior Treatment Episodes
SOURCE: "Treatment Episode Data Set (TEDS) 2000 - 2004: National Admissions to Substance Abuse Treatment
Services." Office of Applied Studies, Substance Abuse and Mental Health Services Administration.
110
Map 3.2, below, presents the distribution of admissions to substance abuse treatment in the
Appalachian region with no prior treatment episodes. In contrast to Map 3.1, the highest
distribution of new admissions is in central Appalachia, with the greatest concentration of
admissions with no prior treatment in eastern Kentucky. Counties reporting TEDS data in western
North Carolina and in Mississippi also show high levels of admissions with no prior treatment,
while counties in Alabama and South Carolina show relatively lower levels of admissions with no
prior treatment.
Map 3.2. Percentage of Persons with No Prior Treatment Episodes
SOURCE: "Treatment Episode Data Set (TEDS) 2000 - 2004: National Admissions to Substance Abuse
Treatment Services." Office of Applied Studies, Substance Abuse and Mental Health Services
Administration.
111
Map 3.3, below, shows patterns of referrals to substance abuse treatment. Northern Appalachia has
the greatest concentration of referrals to treatment from health providers or substance abuse
specialists, especially along the southern New York border and in central Pennsylvania. There are
relatively fewer referrals from the central sub-region. Within the southern sub-region, there are
relatively high referral levels among counties reporting TEDS data in Georgia, North Carolina and
Mississippi.
Map 3.3. Percentage of Persons Who Had an Alcohol and Drug or Health Provider Referral
SOURCE: "Treatment Episode Data Set (TEDS) 2000 - 2004: National Admissions to Substance Abuse
Treatment Services." Office of Applied Studies, Substance Abuse and Mental Health Services
Administration.
112
Map 3.4, below, shows the geographical patterns of criminal justice referrals to substance abuse
treatment, and, for the most part, the distribution is not unlike the distribution presented in Map 3.3.
The majority of criminal justice referrals to treatment are in the northern sub-region, especially in
sections of Ohio and Pennsylvania. There is a small pocket of criminal justice referrals in the
central sub-region, especially in eastern Kentucky. Finally, northern and central Alabama counties
also show a number of counties with high levels of criminal justice referrals to treatment.
Map 3.4. Percentage of Persons Who Had a Court or Criminal Justice Referral
SOURCE: "Treatment Episode Data Set (TEDS) 2000 - 2004: National Admissions to Substance Abuse
Treatment Services." Office of Applied Studies, Substance Abuse and Mental Health Services
Administration.
113
Map 3.5, below, shows the distribution of individual and self-referrals to substance abuse treatment.
The greatest density of individual referrals within Appalachia is found in the central sub-region,
centering around eastern Kentucky and including counties in Tennessee. Counties reporting TEDS
data in the southern sub-region, especially in the Carolinas and Mississippi, also show high levels of
individual referrals. There is a lower concentration of individual referrals in the northern subregion.
Map 3.5. Percentage of Persons Who Had an Individual Referral (Including Self-Referral)
SOURCE: "Treatment Episode Data Set (TEDS) 2000 - 2004: National Admissions to Substance Abuse
Treatment Services." Office of Applied Studies, Substance Abuse and Mental Health Services
Administration.
114
Map 3.6, below, shows the geographical distribution of substance abuse admissions for alcohol use.
The greatest density of admissions for alcohol use is in the northern sub-region, especially along the
southern New York border and into northern Pennsylvania. There are small pockets in the central
sub-region.
Map 3.6. Percentage of Persons Admitted to Treatment for Alcohol Use
SOURCE: "Treatment Episode Data Set (TEDS) 2000 - 2004: National Admissions to Substance Abuse
Treatment Services." Office of Applied Studies, Substance Abuse and Mental Health Services
Administration.
115
Map 3.7, below, presents the geographical distribution of substance abuse treatment admissions for
cocaine use. Unlike Map 3.6, there are several pockets of high levels of admission for cocaine use
in the southern sub-region, especially in Mississippi, Alabama, and the Carolinas. There are very
few admissions for cocaine use in the central sub-region. In the northern sub-region, there are many
pockets of high levels of admissions for cocaine use, especially in western and central
Pennsylvania.
Map 3.7. Percentage of Persons Admitted to Treatment for Cocaine Use
SOURCE: "Treatment Episode Data Set (TEDS) 2000 - 2004: National Admissions to Substance Abuse
Treatment Services." Office of Applied Studies, Substance Abuse and Mental Health Services
Administration.
116
Map 3.8, below, depicts the geographical distribution of substance abuse admissions for heroin use.
There are large areas of admission for heroin use in the northern sub-region in western and eastern
Pennsylvania, as well as in the central region, in eastern Kentucky.
Map 3.8. Percentage of Persons Admitted to Treatment for Heroin Use
SOURCE: "Treatment Episode Data Set (TEDS) 2000 - 2004: National Admissions to Substance Abuse
Treatment Services." Office of Applied Studies, Substance Abuse and Mental Health Services
Administration.
117
Map 3.9, below, presents the geographical distribution of substance abuse admissions for
methamphetamine use. Most admissions for methamphetamine use are clustered in the southern
sub-region in Mississippi, Alabama, and Georgia. There are lower levels of admissions in the
central region, as well as in the northern region, especially in western Pennsylvania.
Map 3.9. Percentage of Persons Admitted to Treatment for Methamphetamine Use
SOURCE: "Treatment Episode Data Set (TEDS) 2000 - 2004: National Admissions to Substance Abuse
Treatment Services." Office of Applied Studies, Substance Abuse and Mental Health Services
Administration.
118
Map 3.10, below, shows the geographical distribution of substance abuse admissions by primary
methamphetamine abuse. This map is quite similar to Map 3.9, with the highest concentration of
admissions in the southern sub-region of Appalachia. Besides the concentration in Mississippi,
Alabama, and Georgia, the Carolinas present a greater concentration of admissions by primary
methamphetamine abuse.
Map 3.10. Percentage of Persons Admitted to Treatment for Primary Methamphetamine
Abuse
SOURCE: "Treatment Episode Data Set (TEDS) 2000 - 2004: National Admissions to Substance Abuse
Treatment Services." Office of Applied Studies, Substance Abuse and Mental Health Services
Administration.
119
Map 3.11, below, presents the geographical distribution of admission for psychiatric problems
(both substance-related and non-substance-related). The central sub-region has the greatest density
of admissions for psychiatric problems. Other pockets are seen in New York, Ohio and North
Carolina.
Map 3.11. Percentage of Persons Admitted to Treatment for Psychiatric Problems
SOURCE: "Treatment Episode Data Set (TEDS) 2000 - 2004: National Admissions to Substance Abuse
Treatment Services." Office of Applied Studies, Substance Abuse and Mental Health Services
Administration.
120
3.5 Discussion
Consistent with estimations at the national level and with prior research findings, alcohol use stands
as the most-cited primary reason for treatment in Appalachia at the time of admission to treatment.53
This is followed by marijuana use, cocaine use, heroin use, and the use of other opiates or
synthetics. This is not the case across counties when analyzing the data by economic development
status, however. For counties at lower economic development status levels (“distressed” and “at
risk”), other opiates or synthetics are the most-cited primary reason for admission after alcohol and
marijuana use. Despite relatively low overall prevalence, the proportions of admissions citing
tranquilizer and sedative use were also the highest in the “distressed” counties.
It is noteworthy that admissions to treatment for “other opiates or synthetics” include people using
OxyContin. This finding supports recent media reports and other anecdotal evidence that
OxyContin and non-medical use of prescription drugs have become serious problems in certain
rural areas and within the Appalachian region.54,55,56 Furthermore, according to the Coalition on
Appalachian Substance Abuse Policy (CASAP), TEDS data may actually understate the nonmedical use of prescription drugs in Appalachia. CASAP noted that methadone treatment for
prescription drug abuse is likely underreported in Appalachia because most methadone treatment is
provided by private facilities. However, private facilities do not submit TEDS data. In the case of
Kentucky, for example, CASAP indicated that there are nine facilities that offer methadone
treatment – two of which are publicly funded. However, only one of the two publicly funded
facilities submits TEDS data. As a result, TEDS data may not provide a comprehensive picture of
the prescription drug problem in Appalachia due to the facility’s funding stream and/or reporting
practices.
The TEDS data also show that the central Appalachian region had the highest proportion of
admissions with other opiates or synthetics as the primary reason for admission among Appalachian
sub-regions. This finding is also consistent with recent media reports.57 TEDS data also showed
that the proportion of adult admissions for primary abuse of other opiates and synthetics is
considerably higher than in the U.S. between 2000 and 2004, and also more than doubled from
3.49% to 7.54% during this time period.
About two-thirds of admissions in Appalachia were associated with mood disorders – both those
substance-related and non-substance-related – based on either the third edition revised or the fourth
edition of the American Psychiatric Association’s Diagnostic and Statistical Manual of Mental
Disorders (DSM-IIIR or DSM-IV). The highest prevalence of mood disorders occurs in
“transitional” counties and in the northern Appalachian sub-region. The reasons for this pattern of
comorbidity require further study. Furthermore, we also see that the central sub-region of
Appalachia has the greatest density of admissions for psychiatric problems (both substance-related
and non-substance-related). Other pockets are seen in New York, Ohio and North Carolina.
Treatment referral by the criminal justice system or the courts was more common in the “distressed”
and “at-risk” counties than in the “transitional” and “competitive” counties, and least likely in
“attainment” counties. In contrast, the “attainment” counties had the highest proportion of
admissions referred by individual clients (e.g., self-referral). Additionally, the proportion of
admissions that were referred from health care providers was considerably lower in “distressed”
counties. Although different criminal justice practices at the state level may affect the ways in
which clients are referred to admission, it appears that the economic development status of the
121
counties where the facilities were located may also impact how substance abuse clients come to be
admitted to treatment.
The vast majority (94.21%) of the admissions in “distressed” counties were made into ambulatory
care settings. Interestingly, while 14% of admissions across the Appalachian region were to
rehabilitation or residential settings, only about 4% of admissions in “distressed” counties were to
such settings. Future research should evaluate the effect of treatment settings on treatment
outcomes by combining admissions and discharge data for the same clients.
R
REFLECTIONS FROM PRACTITIONERS
EFLECTIONS FROM PRACTITIONERS
From the Coalition on Appalachian Substance Abuse Policy
Challenges Associated with Using the Treatment Episode Data Set (TEDS) to
From
the Coalition
on and
Appalachian
Substance
Abuse Policy
Explore
Substance
Abuse
Mental Health
in Appalachia
Challenges Associated with Using the Treatment Episode Data Set (TEDS)
to Explore Substance Abuse and Mental Health in Appalachia
drug to the client’s treatment. The counselor selects the “primary” drug upon admission – • The drug indicated as the “primary reason for admission” may not be the most relevant not the client. This is an important distinction. If the counselor believes that heroin is the most important drug, he/she may designate heroin as the primary drug upon admission. • Criminal justice clients and clients with multiple prior treatment episodes tend to do as well if not better in terms of treatment outcomes than their counterparts. CASAP noted that criminal justice clients do well in treatment, if not better than clients who are not coming from the criminal justice system. In addition, CASAP noted that clients with multiple prior treatment episodes tend to have better outcomes in treatment, than clients with zero prior treatment episodes. Most clients have had a previous treatment episode. • TEDS may be missing important subgroups of the population. For a client to qualify as a TEDS admission, he/she must meet certain required criteria. If certain peak fields in TEDS are missing, the client is not a TEDS admission. For example, court referred people are not counted because they have a limited number of treatment visits, and do not receive a treatment plan. • Facility reporting practices are often affected by payment. Facilities may underreport or over‐report specific conditions to secure payment. In Virginia, if a client is admitted with a co‐
occurring disorder, the facility may choose to report that he/she has a mental health condition to secure payment, although the client is receiving treatment for substance abuse issues as well. According to CASAP, the federal government should recognize co‐occurring disorders to ameliorate payment concerns at treatment facilities. About one-third of the admissions in distressed counties were clients who had previously accessed
treatment at the facility. In contrast, about two-thirds of admissions across Appalachian counties
were clients who had previously sought treatment. Drug users who have been in and out of
treatment programs multiple times are of particular concern. Past research has suggested that
multiple prior treatment episodes might be indicative of less effective current treatment, everything
122
else being equal.58,59,60 Interestingly, CASAP suggested that clients with multiple prior treatment
episodes do well, if not better than clients with zero prior treatment episodes. Given the special
geographic and economic contexts of the Appalachian region, future studies may examine the
outcome of new treatments in economically distressed areas.
Item non-responses should be taken into consideration when interpreting admissions data. For
example, unknown status of health insurance is quite common in TEDS. Health insurance is
regarded as a key treatment access enabling factor and non-response to this item may affect overall
admissions.61 Overall, the health insurance status was unknown for almost half of the admissions
during the 2000-2004 period. Importantly, the distribution of this unknown status was uneven
across sub-regions – while nearly two-thirds of admissions had unknown health insurance status in
the southern Appalachian region, slightly less than one-third of admissions in the central
Appalachian region had unknown health insurance status. Future data collection efforts should
attempt to determine the reasons for the missing health insurance information and consistent
patterns that may influence data interpretation.
Finally, it is important to note that TEDS data do not provide a comprehensive understanding of all
of the facility-level factors that may affect access to and utilization of treatment services. Additional
data elements that would be useful to collect through TEDS in future years include staff turnover
rates at substance abuse and mental health treatment facilities, and staff shortages at the facilitylevel. Such information may reveal other important deficiencies and disparities in access to
treatment across Appalachia.
123
CHAPTER 4: Substance Use and Mental Health Disorder Discharges
from Appalachian and Other Community Hospitals in 2004
4.1 Introduction
In the United States, community hospitals provide treatment services for adolescents and adults
with mental health and/or substance abuse disorders. Community hospitals are non-Federal, acute
care hospitals that provide general and specialty care. Excluded from this definition are federal,
rehabilitation, and psychiatric hospitals as well as alcoholism/chemical dependency treatment
facilities. In 2004, adults diagnosed with mental health and/or substance abuse disorders accounted
for approximately 7.6 million stays – 1 out of every 4 – at community hospitals in the U.S.62
Given that community hospitals provide treatment for a large number of people with mental health
and/or substance abuse disorders in the U.S., discharge data are a rich data source. Exploring the
clinical and nonclinical data available at the community hospital-level provides an opportunity to
better understand the demographics of patients with mental health and substance abuse disorders as
well as other important characteristics such as their diagnoses, expected payment sources, and total
charges.
Chapter 4 provides an overview of substance abuse and mental disorder discharges from
Appalachian and other community hospitals in 2004. Analyses are based on data from the
Healthcare Cost and Utilization Project (HCUP)’s 2004 Nationwide Inpatient Sample (NIS). The
HCUP databases contain information on the vast majority of all hospital discharges in U.S.
community hospitals, making them a powerful tool for exploring substance abuse and mental health
issues in Appalachia and nationally. HCUP provides data that address both substance abuse and
mental health issues. Specifically, we explore the following data elements from HCUP: client
demographics; admission source and type; primary expected payer and secondary expected payer;
presence of mental health and/or substance abuse (MHSA) disorder; subtype of MHSA disorder;
comorbidity status; whether the diagnosis contains alcohol use disorder, drug use disorder, or
mental health disorder; whether the principal reason for hospitalization was alcohol use; and
whether the principal reason for hospitalization was drug use.
Chapter 4 will investigate the following key research questions:
Are there differences in discharges from community hospitals in Appalachia, as compared to
discharges from community hospitals outside of Appalachia?
Are there differences in discharges from community hospitals in Appalachia versus outside
of Appalachia when taking county economic status into account?
What do sub-regional differences look like across socio-economic status, health diagnoses,
and other variables?
In Section 4.2, we provide an overview of the HCUP NIS, including its objectives, sampling design,
uses, relevant measures, and limitations specifically related to exploring mental health and
substance abuse issues in the Appalachian region. In Section 4.3, we discuss our methods. Section
4.4 contains the results of the analysis. Finally, Section 4.5 provides a discussion of key findings.
124
4.2 Data
4.2.1 Overview
The Healthcare Cost and Utilization Project (HCUP) is the largest collection of longitudinal hospital
care data in the United States, providing encounter-level administrative data for inpatient hospital
stays. HCUP is comprised of a variety of databases, software tools, and products that provide data
on an array of clinical and non-clinical information from patient hospital discharge abstracts.
Sponsored by the Agency for Healthcare Research and Quality (AHRQ), and supported by a
number of partnerships at the federal, state, and industry levels, HCUP was designed to support
health care research and decision making in the U.S.
According to AHRQ, the objectives of HCUP are three-fold: 1) to obtain data from state-wide
information sources; 2) to design and develop multi-state health care databases for health services
research and health policy analysis; and 3) to make data available to a broad set of public and
private users.63
AHRQ works closely with state data organizations in participating states to obtain data for the
HCUP databases. A number of hospital associations and private organizations contribute to the
development of these databases. HCUP is comprised of five databases: the State Inpatient
Databases (SID); State Ambulatory Surgery Databases (SASD); State Emergency Department
Databases (SEDD); the Nationwide Inpatient Sample (NIS); and the Kids’ Inpatient Database
(KID). For all of these databases, the unit of analysis is the inpatient stay in a community hospital –
not an individual patient or medical procedure.64
This study uses HCUP’s Nationwide Inpatient Sample (NIS) to explore substance abuse and mental
disorder discharges from community hospitals. Given the NIS’s large sample size – 8,004,571
hospital discharges from 1,004 U.S. community hospitals – the NIS is ideal for exploring trends
nationally and in the Appalachian region. As the largest all-payer inpatient care database in the
U.S., the NIS affords researchers a unique opportunity to explore complex health policy issues such
as access to care, medical practice patterns, cost and quality issues, and health care outcomes.
4.2.2 Sample Design
The NIS is a stratified probability sample of non-rehabilitation, community hospitals in the United
States. All U.S. community hospitals in the American Hospital Association (AHA)’s hospital file
are included in the hospital universe, except short-term rehabilitation hospitals. The sampling frame
is constructed from the subset of universe hospitals that released data to AHRQ for the NIS. The
sampling frame includes all AHA community hospitals that could be matched to discharge data
provided to AHRQ. The objective of the NIS sampling design was to select a sample of hospitals
that accurately represent the universe of hospitals and are geographically dispersed.
The NIS uses five characteristics to create a sample from the AHA’s hospital files: 1) geographic
region (Northeast, Midwest, West, and South); 2) control of hospital (public, private, not-for-profit,
and proprietary); 3) location (urban or rural); 4) teaching status (teaching or non-teaching); and 5)
bed size (small, medium, large).65 Each year, no more than 20% of the total number of U.S.
hospitals within each of the five categories above are randomly selected.
125
The NIS sampling frame is representative of all U.S hospitals. Over 75% of all U.S. hospitals and
87.5% of the U.S. population are accounted for in the NIS sampling frame. In 2004, the sampling
frame contained data on 3,705 hospitals. The sample size for the 2004 survey was 1,004 hospitals –
approximately 20.5% of 4,906 hospitals included in the total universe of U.S. community
hospitals.66 The NIS includes data on 37 states; ten of the 13 Appalachian states are included in the
NIS. Pennsylvania, Alabama, and Mississippi are excluded.
4.2.3 Uses of the HCUP Nationwide Inpatient Sample
The NIS enables researchers to answer questions about the use and cost of hospital services,
medical practice variation, health care cost inflation, hospital financial distress, analyses at the State
and community levels, medical treatment effectiveness, quality of care, impact of health policy
changes, access to care, diffusion of medical technology, and utilization of health services by
special populations.67
HCUP’s databases have been used to explore research questions related to mental health and
substance abuse issues. In July 2006, HCUP’s NIS 2004 data was used as the basis for a fact book
on care of adults with mental health and substance abuse disorders.68 This fact book explored issues
such as: what are the common reasons for hospitalization by type and diagnoses; how do hospital
stays for this population vary by gender and age; how are patients admitted to the hospital; what is
the mean length of stay; what is the cost of hospital stays; who is billed for hospital stays; where do
patients go after they are discharged; and what percentage of hospital resource use is attributable to
mental health and substance abuse disorders? Researchers have also used HCUP data to study
psychiatric diagnoses,69 trends in substance abuse detoxification,70 and hospitalizations for alcohol
abuse disorders,71 among other issues.
In addition, a large body of research has applied HCUP data to study racial and ethnic disparities in
the inpatient setting,72,73,74 as well as hospitalization and treatment for health care problems.75,76,77,78
Finally, researchers have utilized HCUP hospital discharge data to study health care issues in
specific geographic areas.79,80
4.2.4 HCUP Measures Used in this Study
Next, we define the measures used from the 2004 HCUP NIS data set, and explore the potential
limitations with respect to using these measures for our purpose – to explore substance abuse and
mental health disorder discharges in Appalachian community hospitals and other community
hospitals nationally. We explore the following variables: expected primary payer; total and average
charges; length of stay; race; admission source; alcohol, drug, and mental health disorder status;
teaching hospital status; and death during hospitalization. We provide a brief discussion of each of
these variables.
Gender of the client discharged from a community hospital is described as male or female.
Age of the client discharged from a community hospital is specified as one of the following
categories: 18 to 44 years old; 45 to 64 years old; 65 to 79 years old; and 80 or older.
Median household income quartile for the client’s zip code is specified as one of the following
categories: $1 - $35,999; $36,000 - $44,999; $45,000 - $58,999; and $59,000 or more.
126
Patient location of discharges is described by a four category urban-rural designation for the
patient’s county of residence: (1) large metropolitan; (2) small metropolitan; (3) micropolitan; and
(4) non-core. The categorization is a simplified adaptation of the 2003 version of the Urban
Influence Codes (UIC). The 12 categories of the UIC are combined into four broader categories that
differentiate between large and small metropolitan, micropolitan, and a non-urban residual as
follows. A large metro area is defined as an area of 1 million residents or more. A small metro area
is defined as an area of less than 1 million residents. A micropolitan area is adjacent to a large
metro, small metro, or not adjacent to a metro area. A noncore area is defined as one of the
following: adjacent to a small metropolitan area with its own town; adjacent to a small metropolitan
area without its own town; adjacent to a micropolitan area with its own town; adjacent to
micropolitan area without its own town; not adjacent to a metropolitan or micropolitan area with its
own town; and not adjacent to a metropolitan or micropolitan area without its own town.
Admission source indicates the source of the hospital admission: the emergency department;
transfer from another hospital (includes transfers within the same hospital and transfers between
hospitals); from another health facility including long term care; court or law enforcement; and
routine, birth and other (includes referrals from physicians, clinics, and HMOs).
Admission type indicates the type of hospital admission. Admission types are described as
emergency or routine/ other (e.g., urgent, elective, newborn, trauma center, and other).
The variables, primary expected payer and secondary expected payer, identify who the hospital
expects will be the primary and secondary payer of the hospital bill for patients with substance
abuse and mental health disorders. While each hospitalization and related hospital bill is associated
with an expected primary payer, the expected primary payer may not be the ultimate payer. The
expected primary payer can be: Medicaid (includes fee-for-service and managed care Medicaid
patients); Medicare (includes fee-for-service and managed care Medicare patients); Private
Insurance (includes Blue Cross, commercial carriers, and private HMOs and PPOs); Other (includes
Workers' Compensation, TRICARE/VA, Title V, and other government programs); Self Pay
(uninsured); and No Charge (uninsured). A noteworthy limitation of this variable is that it does not
capture dual-eligible patients.
Presence of mental health and/or substance abuse (MHSA) disorder indicates whether the
discharge was diagnosed with at least one MHSA disorder or zero MHSA disorders.
Presence of any secondary mental health and/or substance abuse (MHSA) disorder indicates
whether or not the discharge was diagnosed with any secondary MHSA diagnosis.
Subtype of mental health and/or substance abuse (MHSA) disorder indicates the client’s
diagnosis. Categories for this variable include: principal MHSA diagnosis only; principal and
secondary MHSA diagnosis; secondary MHSA only; any principal MHSA diagnoses; and at least
one principal MHSA diagnosis.
Comorbidity status indicates whether the client has a non-substance abuse and mental health
diagnosis, a substance abuse diagnosis only, a mental health diagnosis only, or a comorbidity.
127
Diagnosis contains alcohol use disorder indicates that the client’s diagnosis contains an alcohol
use disorder.
Diagnosis contains drug use disorder indicates that the client’s diagnosis contains a drug use
disorder.
Diagnosis contains mental health disorder indicates that the client’s diagnosis contains a mental
health disorder.
Principal reason for hospitalization was alcohol use indicates that the principal reason for the
client’s hospitalization was alcohol use.
Principal reason for hospitalization was drug use indicates that the principal reason for the
client’s hospitalization was drug use.
4.2.5 Limitations of HCUP NIS Data
There are a few critical limitations that may affect the quality of the findings when using HCUP
NIS data to explore substance abuse and mental health issues in Appalachia and nationally.
One obvious limitation is that HCUP data is only available for 37 states. Ideally, data would be
available from every state in the U.S. Additionally, in 2004, HCUP NIS data were only available in
10 of the 13 Appalachian states, excluding Pennsylvania, Mississippi, and Alabama. Missing data
is one clear limitation, given that it would be ideal to make comparisons between Appalachian
community hospitals and other community hospitals nationally based on data for all 13 Appalachian
states and the rest of the nation.
A second limitation is that the NIS is designed as a nationwide representation of inpatient hospital
care. Most variables in the NIS are standardized to allow for national estimates. The NIS sampling
frame is not designed with “county” or “state” as a stratification variable and therefore state and/or
county-level analyses cannot be conducted.
It is also important to note that while the NIS includes general and specialty hosptials (e.g.,
pediatric, obstetrics-gynecology, short-term rehabilitation, and oncology), the survey excludes longterm care and psychiatric hospitals. Given that the NIS does not include data on patients in
psychiatric hospitals, the data should not be perceived as a comprehensive picture of mental health
issues associated with inpatient care in the U.S. Findings from this chapter likely provide an underestimation of mental health problems in the U.S. Further exacerbating this problem, it is likely that
MHSA diagnoses are under-coded at hospitals due to concerns regarding reimbursement and stigma
associated with mental health and substance abuse (MHSA) diagnoses.
Finally, due to confidentiality laws and other reasons, some states that contributed data to the NIS
imposed restrictions on the release of certain data elements or on the number and types of hospitals
that could be included in the database. 81 Other states prohibited the release of certain data
elements. In Virginia, data may not include more than 50% of hospitals. Georgia requested that
patient race be set to missing in the NIS. To further secure confidentiality, Georgia, Ohio, and
Tennessee did not report data on the teaching status of hospitals.82
128
4.3 Methods
4.3.1 Study Sample
This study uses the 2004 HCUP Nationwide Inpatient Sample (NIS) database to analyze substance
use and mental disorders in the Appalachian region. Because the NIS is limited to community
hospital data, disorders treated in outpatient or ambulatory care settings, long-term care facilities,
psychiatric hospitals, and substance abuse treatment facilities are not reflected in this report. Only
adults age 18 or older were included; newborns, children, and adolescents were excluded.
Due to confidentiality concerns and the manner in which state data are submitted to the central
distributor of HCUP National Inpatient Stay files, 11 states did not include county identifiers for the
hospitals where patient discharge information were provided. Among these 11 states, four are
associated with the Appalachian region – Ohio, South Carolina, Tennessee, and Georgia. These
four Appalachian states were excluded from the analysis because the Appalachian region portion of
these states could not be determined due to the absence of county identifiers.
4.3.2 Statistical Methods
Unit of Analysis
For this study, the unit of analysis is the inpatient stay in a community hospital rather than the
patient or the procedure. For example, a patient admitted three times to a hospital is included three
times in the NIS data. Thus, the same individual can account for more than one hospital stay.
Measure
Diagnoses are recorded within the NIS using the International Classification of Diseases, Ninth
Revision, Clinical Modification (ICD-9-CM). We apply the AHRQ-developed Mental Health and
Substance Abuse Clinical Classification Software (CCS-MHSA) to aggregate ICD-9_CD MHSA
diagnostic codes into a limited number of clinically meaningful categories. The CCS-MHSA,
derived primarily from the Diagnostic and Statistical Manual of Mental Disorders, Fourth Edition,
assigns mental and substance-use ICD-9-CM codes to 1 of the 14 categories.
Table 4.1. AHRQ-developed Mental Health and Substance Abuse Clinical Classification
Software (CCS-MHSA)
CCSMHSA
Code
650
651
652
653
654
655
Mental Health or Substance Abuse Disorders
Adjustment disorders
Anxiety disorders
Disruptive behavior disorders including conduct disorder, oppositional defiant disorder, attentiondeficit disorder and attention-deficit/hyperactivity disorder
Delirium, dementia, and amnestic and other cognitive disorders
Developmental disorders including communication disorders, developmental disabilities, intellectual
disabilities, learning disorders and motor skills disorders*
Disorders usually diagnosed in infancy, childhood, or adolescence such as elimination disorders,
129
CCSMHSA
Code
Mental Health or Substance Abuse Disorders
separation anxiety disorders, pervasive developmental disorders, and tic disorders
Impulse control disorders
Mood disorders including bipolar disorders and depressive disorders
Personality disorders
Schizophrenia and other psychotic disorders
Substance-related disorders including alcohol-related disorders and substance-related disorders (e.g.,
amphetamine-related disorders; cannabis-related disorders; cocaine-related disorders; hallucinogenrelated disorders; inhalant-related disorders; opioid-related disorders; phencyclidine-related disorders;
sedative-, hypnotic-, or anxiolytic-related disorders; poly-substance-related disorders)
Miscellaneous mental disorders including dissociative disorders, eating disorders, factitious disorders,
661
psychogenic disorders, sexual and gender identity disorders, sleep disorders, somatoform disorders,
mental disorders due to general medical conditions not elsewhere classified, and other miscellaneous
mental conditions
Suicide
and intentional self-inflicted injury*
662
Screening and history of mental health and substance-related conditions*
663
* Suicide and intentional self-inflicted injury, as defined in the CCS-MHSA, is examined as a co-occurring condition
with mental health and substance-related disorders.
* Both unweighted and weighted estimations are calculated. For draft report, only the unweighted estimates are
presented.
656
657
658
659
660
4.4 Results
In Section 4.4, we present subregional differences for community hospital discharges in Appalachia
and outside of Appalachia in 2004. In Section 4.4.1, we show a series of tables and charts that
explore the following variables: the client’s gender and age; median household income quartile for
the client’s zip code; patient location; admission source; admission type; primary expected payer
and secondary expected payer; presence of mental health and/or substance abuse (MHSA) disorder;
presence of any MHSA abuse disorder; subtype of MHSA abuse disorder; comorbidity status;
whether the diagnosis contains alcohol use disorder, drug use disorder, or mental health disorder;
whether the principal reason for hospitalization was alcohol use; and whether the principal reason
for hospitalization was drug use. We also present a table of mental health diagnoses.
4.4.1 Tables
Tables 4.2a and 4.2b, below, present subregional differences in hospital discharges for community
hospitals in the Appalachian region and outside of Appalachia for demographic variables among
patients over 18 years of age. Table 4.2a shows the differences in discharges from community
hospitals in Appalachian counties and outside of Appalachia, overall. Table 4.2b depicts
differences in discharges from community hospitals by county economic development status. In
Appalachia, about 60% of women are discharged from community hospitals in both the
Appalachian region and outside of the Appalachian region (61.1%) as compared to about 40% of
men in Appalachia and 39% of men outside of Appalachia. This result is consistent across county
economic development status with the exception of attainment counties, where 50.0% of discharges
from community hospitals are male.
130
Overall, patients discharged from community hospitals outside of Appalachia are slightly younger
than patients discharged in the Appalachian region. Outside the Appalachian region, 32.7% of
patients are between the ages of 18 and 44, compared to 26.4% within the Appalachian region.
These results are consistent across levels of economic development, although the distribution shifts
slightly. For example, overall 28.2% of patients in the Appalachian region are 45 to 64 years of
age, while in attainment counties, 37.6% of patients are in this age range.
Overall, more patients discharged from community hospitals in the Appalachian region are in the
lowest income category when compared to patients discharged from community hospitals outside of
Appalachia (64.1% versus 26.5%). Furthermore, less than 10% of patients discharged from
community hospitals in the Appalachian region have a median income over $45,000, compared with
46% in the rest of the country. These results are even more pronounced in distressed and at-risk
Appalachian counties. In distressed counties, nearly 90% of patients are in the lowest income
quartile, while in at-risk counties, 83.7% of patients are in the lowest income bracket. By contrast,
in attainment counties, only 36.6% of patients are in the lowest income bracket.
Less than 1% of patients discharged from hospitals in the Appalachian region are from large
metropolitan areas as compared to patients outside of Appalachia (57.5%). Instead, 34.5% of
patients are from small metropolitan areas in Appalachia (compared to 25.9% outside of
Appalachia), 29.2% are from micropolitan areas (compared to 9.7% outside of Appalachia), and
31% of patients are from non-core areas (as compared to 6.5% outside of Appalachia). These
results are consistent across counties, regardless of economic status.
131
Table 4.2a: Demographics of Community Hospital Discharges in the Appalachian Region
(Unweighted)
All
Appalachian Region
Outside of Appalachia
N
%
N
%
Male
67,258
40.04
2,133,917
38.73
Female
100,696
59.95
3,364,470
61.07
18-44
44,338
26.4
1,804,197
32.75
45-64
47,290
28.16
1,456,348
26.43
65-79
45,564
27.13
1,327,258
24.09
80 or older
30,765
18.32
921,743
16.73
Gender
Age
Median Household Income Quartile for Patient's Zip Code
$1-$35,999
107,695
64.12
1,461,759
26.53
$36,000- $44,999
36,641
21.82
1,400,755
25.42
$45,000-$58,999
13,548
8.07
1,208,375
21.93
$59,000 or more
2,001
1.19
1,322,096
24
Large metropolitan
1,322
0.79
3,167,482
57.49
Small metropolitan
58,014
34.54
1,425,579
25.87
Micropolitan
49,113
29.24
534,492
9.7
Non-core
59,000
35.13
358,486
6.51
Patient Location
132
Table 4.2b: Demographics of Community Hospital Discharges in the Appalachian Region (Unweighted) by County Economic
Development Status, 2004
Distressed
Appalachian
Outside of
Region
Appalachia
N
%
N
%
Gender
Male
12,958
40.3
63,210
Female
19,216
59.7
93,408
7,416
23.1
9,775
9,054
County Economic Development Status
Adults Age 18 or Older
At-Risk
Transitional
Competitive
Appalachian
Outside of
Appalachian
Outside of
Appalachian
Outside of
Region
Appalachia
Region
Appalachia
Region
Appalachia
Attainment
Appalachian
Outside of
Region
Appalachia
N
%
N
%
N
%
N
%
N
%
N
%
N
%
N
%
40.4
9,834
37.8
17,089
37.2
26,192
36.6
644,486
40.7
3,066
39.1
185,050
38.8
15,208
50
481,186
40
59.6
16,151
62.2
28,809
62.8
45,365
63.4
939,653
59.3
4,778
60.9
292,107
61.2
15,186
50
722,178
60
54,932
35.1
6,940
26.7
13,896
30.3
20,374
28.5
471,843
29.8
1,792
22.9
153,013
32.1
7,816
25.7
384,524
32
30.4
46,438
29.7
6,626
25.5
10,973
23.9
17,663
24.7
423,146
26.7
1,786
22.8
122,098
25.6
11,440
37.6
331,132
27.5
28.1
33,531
21.4
7,086
27.3
11,803
25.7
18,967
26.5
406,659
25.7
2,358
30.1
118,369
24.8
8,099
26.7
284,902
23.7
5,930 18.4 21,720 13.9 5,333 20.5
Median Household Income Quartile for Patient's Zip Code
9,226
20.1
14,554
20.3
282,508
17.8
1,908
24.3
83,679
17.5
3,040
10
202,820
16.9
$1-$35,999
Age
18-44
45-64
65-79
80 or older
28,823
89.6
102,659
65.6
21,753
83.7
35,822
78.1
43,500
60.8
497,929
31.4
2,487
31.7
88,079
18.5
11,132
36.6
136,178
11.3
$36,000$44,999
479
1.49
39,706
25.4
1,668
6.42
7,605
16.6
19,626
27.4
506,152
32
4,107
52.4
162,643
34.1
10,761
35.4
199,912
16.6
$45,000$58,999
116
0.36
7,110
4.54
856
3.29
1,135
2.47
5,698
7.96
317,716
20.1
518
6.6
141,613
29.7
6,360
20.9
292,874
24.3
$59,000 or
38
more
Patient Location
Large
101
metroplitan
Small
997
metropolitan
0.12
6,268
4
50
0.19
187
0.41
491
0.69
229,717
14.5
59
0.75
73,909
15.5
1,363
4.48
554,603
46.1
0.31
134,446
85.8
119
0.46
623
1.36
528
0.74
787,722
49.7
73
0.93
226,573
47.5
501
1.65
917,412
76.2
3.1
4,133
2.64
876
3.37
3,128
6.82
30,621
42.8
445,733
28.1
6,893
87.9
149,744
31.4
18,627
61.3
208,647
17.3
6,516
20.3
8,964
5.72
9,999
38.5
28,988
63.2
23,174
32.4
205,718
13
459
5.85
67,263
14.1
8,965
29.5
45,014
3.74
24,190
75.2
8,806
5.62
14,954
58
13,129
28.6
17,136
24
138,420
8.74
419
5.34
30,759
6.45
2,301
7.57
28,174
2.34
Micropolitan
Non-core
SOURCE: Healthcare Cost and Utilization Project (HCUP) Nationwide Inpatient Sample (NIS), 2004.
133
Tables 4.3a and 4.3b, below, present differences in community hospital discharges by admission
source, admission type, and expected payment for admissions over 18 years of age. In Table 4.3a,
we provide findings overall for community hospitals in Appalachia and outside of Appalachia.
Table 4.4b shows findings by economic county development status. The percentage of discharges
from community hospitals that entered into hospitals via the emergency department was higher in
the Appalachian region (53.7%) than in hospitals outside of Appalachia (48.8%). Results vary,
however, based on economic development level. Figure 4.1 visually shows these trends in
Appalachia only. As the figure demonstrates, the emergency room is the most common source of
admission to the hospital for patients in distressed counties in Appalachia, followed by at-risk,
transitional, competitive, and attainment counties.
Figure 4.1 Admission Source by Appalachian County Economic Development Status
Adm ission Source by Appalachian
County Econom ic Developm ent Status
70
Emergency Room
60
Routine/Other
50
40
30
20
10
0
Dist ressed
At - Risk
Transit ional
Compet it ive
At t ainment
C ount y E c onomi c D e v e l opme nt St a t us
SOURCE: Healthcare Cost and Utilization Project (HCUP) Nationwide Inpatient Sample (NIS), 2004.
Overall, more patients in economically distressed counties enter the hospital through the emergency
department, with 73.3% of patients in non-Appalachian counties entering the hospital in this manner
and 62.1% of patients from the Appalachian region entering the hospital in this manner. In at-risk
counties, 58.2% of patients in the Appalachian region enter the hospital through the emergency
department, while 50.5% of patients in non-Appalachian counties enter in this way. There is little
difference between Appalachian and non-Appalachian admission types for transitional and
competitive counties, with approximately 50% of patients entering the hospital through the
emergency department. Finally, in attainment counties, 39.8% of patients from the Appalachian
region and 49.3% of non-Appalachian patients entered the hospital through the emergency
department.
Medicare is the key primary expected payer in both Appalachian and non-Appalachian counties
(51.9% versus 43.3%), followed by private insurance (24.4% in Appalachia and 33.7% outside of
Appalachia), Medicaid (14.5% in Appalachia and 14.0% outside of Appalachia), self pay (5.1% in
Appalachia and 5.2% outside of Appalachia), other forms of primary payment (3.8% in Appalachia
and 3.2% outside of Appalachia), and, finally, no charge (0.03% in Appalachia and 0.5% outside of
Appalachia). When the economic development level is taken into account, the profile changes
slightly. Figure 4.2 below highlights these trends.
134
Figure 4.2 Primary Expected Payer By Appalachian County Economic Development Status
Primary Expected Payer by Appalachian County
Economic Development Status
70
Medicare
60
Medicaid
50
Private including HMO
Percent
40
Self-pay
30
20
10
0
Distressed
At-Risk
Transitional
Competitive
Attainment
County Economic Development Status
SOURCE: Healthcare Cost and Utilization Project (HCUP) Nationwide Inpatient Sample (NIS), 2004.
Medicare continues to be the dominant primary expected form of payment in the Appalachian
region, hovering around 50% of expected payments in the less economically developed counties
(distressed, at-risk, and transitional), increasing to 61.1% of expected payments in competitive
counties, and falling to 46.5% of expected payments in attainment counties. Less economically
developed counties in Appalachia report a greater percentage of Medicaid expected payers than
more economically developed counties. In distressed counties, 21.7% of expected payers utilized
Medicaid, while 15.2% report utilizing Medicaid in at-risk counties. Around 12.5% of payers in
transitional and competitive counties expect to use Medicaid, and 11.7% of payers in attainment
counties expect to use Medicaid. In contrast, 35.8% of patients from economically distressed
counties outside of Appalachia use Medicaid, while counties with higher levels of economic
development report similar rates of coverage to their Appalachian counterparts.
The Appalachian region reports lower levels of private insurance coverage than their nonAppalachian counterparts at all levels of economic development, except in at-risk and transitional
counties. Appalachian distressed counties report 11.9% private insurance coverage compared with
19.3% for non-Appalachian distressed counties. Appalachian competitive counties report 17.8%
private insurance coverage, while non-Appalachian competitive counties report coverage rates of
33.9%. Finally, Appalachian attainment counties report private insurance coverage of 32.7%, while
non-Appalachian attainment counties report coverage rates of 39.7%.
135
Table 4.3a: Admission Source, Type, and Expected Payment for Community Hospital
Discharges in Appalachia (Unweighted), 2004
Adults Age 18 or Older
Appalachian Region
Outside of Appalachia
N
%
N
%
Emergency Room
90,158
53.68
2,688,219
48.79
Routine/Other
77,402
46.08
2,805,904
50.93
Emergency Room
85,906
51.19
2,383,357
48.92
Routine/Other
81,925
48.81
2,488,366
51.08
Admission Source
Admission Type
Primary Expected Payer (uniform)
Medicare
87,260
51.95
2,386,065
43.31
Medicaid
24,406
14.53
770,870
13.99
Private including
HMO
41,042
24.44
1,856,881
33.7
Self-pay
8,644
5.15
287,340
5.22
48
0.03
29,195
0.53
6,373
3.79
173,969
3.16
No charge
Other
Secondary Expected Payer (uniform)
Medicare
25,197
29.47
336,954
16.17
Medicaid
16,351
19.12
395,946
19
Private including
HMO
25,581
29.92
857,683
4.11
Self-pay
11,601
13.57
405,953
19.48
46
0.05
7,373
0.35
6,776
7.92
80,360
3.85
No charge
Other
SOURCE: Healthcare Cost and Utilization Project (HCUP) Nationwide Inpatient Sample (NIS), 2004.
136
Table 4.3b: Admission Source, Type, and Expected Payment for Community Hospital Discharges in Appalachia (Unweighted) by
County Economic Development Status, 2004
County Economic Development Status Adults Age 18 or Older
Distressed
Appalachian
Region
N
%
At-Risk
Outside of
Appalachia
N
%
Appalachian
Region
N
%
Transitional
Outside of
Appalachia
N
%
Appalachian
Region
N
%
Competitive
Outside of
Appalachia
N
%
Appalachian
Region
N
%
Attainment
Outside of
Appalachia
N
%
Appalachian
Region
N
%
Outside of
Appalachia
N
%
Admission Source
Emergency
Room
19,988
62.12
114,818
73.31
15,118
58.18
23,202
50.55
39,087
54.62
805,370
50.84
3,855
49.15
241,069
50.52
12,110
39.84
592,997
49.28
Routine/Other
12,169
37.82
41,748
26.66
10,865
41.81
22,689
49.43
32,094
44.85
774,422
48.89
3,989
50.85
235,955
49.45
18,285
60.16
605,297
50.3
17,035
52.99
116,763
74.6
15,822
60.89
22,625
49.47
36,870
51.55
784,108
49.58
2,116
27.01
201,416
42.7
14,063
46.34
613,815
51.06
15,111
47.01
39,747
25.4
10,162
39.11
23,106
50.53
34,649
48.45
797,496
50.42
5,717
72.99
270,310
57.3
16,286
53.66
588,330
48.94
Admission Type
Emergency
Room
Routine/Other
Primary Expected Payer (uniform)
Medicare
Medicaid
Private
including
HMO
Self-pay
No charge
Other
17,045
52.98
56,476
36.06
13,452
51.77
24,385
53.13
37,827
52.86
731,421
46.17
4,796
61.14
217,745
45.63
14,140
46.52
508,546
42.26
6,990
21.72
56,033
35.78
3,945
15.18
8,133
17.72
8,915
12.46
222,512
14.05
1,010
12.88
50,585
10.6
3,546
11.67
125,753
10.45
3,818
11.87
30,249
19.31
6,469
24.9
7,551
16.45
19,420
27.14
480,661
30.34
1,400
17.85
161,855
33.92
9,935
32.69
477,995
39.72
1,893
5.88
12,839
8.2
1,229
4.73
2,754
6
2,840
3.97
80,338
5.07
468
5.97
20,570
4.31
2,214
7.28
53,351
4.43
6
0.02
54
0.03
.
.
77
0.17
42
0.06
16,320
1.03
.
.
6,076
1.27
.
.
3,596
0.3
2,382
7.4
968
0.62
872
3.36
2,997
6.53
2,389
3.34
52,201
3.3
170
2.17
19,610
4.11
560
1.84
34,007
2.83
Secondary Expected Payer (uniform)
Medicare
Medicaid
Private
including
HMO
Self-pay
No charge
Other
974
12.51
30,258
27.85
4,634
35.36
2,209
9.89
6,184
15.22
108,043
14.69
105
1.54
20,307
18.09
13,300
79.7
119,412
20.7
3,726
47.85
37,289
34.32
4,195
32.01
6,088
27.25
6,474
15.94
141,152
19.2
803
11.77
19,113
17.03
1,153
6.91
90,445
15.68
2,183
28.04
8,669
7.98
4,275
32.62
10,346
46.32
14,373
35.39
286,765
39
2,775
40.69
58,247
51.89
1,975
11.83
237,165
41.11
1
0
30,985
28.52
2
0.01
374
1.67
11,598
28.56
164,666
22.39
.
.
10,225
9.11
.
.
108,502
18.81
.
.
5
0
.
.
0
.
46
0.11
3,566
0.48
.
.
150
0.13
.
.
2,505
0.43
902
11.58
1,446
1.33
498
3.8
3,694
16.54
1,979
4.87
31,101
4.23
3,137
46
4,200
3.74
260
1.56
18,909
3.28
SOURCE: Healthcare Cost and Utilization Project (HCUP) Nationwide Inpatient Sample (NIS), 2004.
137
Tables 4.4a and 4.4b, below, presents differences in community hospital discharges based on
hospital stay characteristics for community hospital discharges in Appalachia and outside of
Appalachia. Table 4.4a presents the findings overall, and Table 4.4b presents findings by county
economic development status. Overall, 27.1% of inpatient hospital stays in the Appalachian region
report mental health or substance abuse diagnoses, compared with 23.6% of inpatient hospital stays
outside of Appalachia. The differences are most pronounced in distressed counties, where 26.6% of
hospital stays in the Appalachian region report mental health or substance abuse diagnoses
compared with 30.5% outside of Appalachia, and in competitive counties where 36.7% of hospital
stays in the Appalachian region report mental health and substance abuse diagnoses compared with
22.3% of hospital stays outside of Appalachia.
Overall, among inpatient hospital stays with a substance abuse or mental health diagnosis, the
majority had a mental health diagnosis only (77.96% in the Appalachian region; 69.23% outside of
Appalachia).
Table 4.4a: Hospital Stay Characteristics for Community Hospital Discharges in Appalachia
(Unweighted), 2004
Adults Age 18 or Older
Appalachian Region
N
%
Outside of Appalachia
N
Presence of MHSA
No MHSA diagnosis
122,401
72.88
4,211,090
At least one MHSA
diagnosis
45,556
27.12
1,298,456
Subtype of MHSA Stays
Principal MHSA only
2,476
5.44
98,803
Principal and secondary
MHSA
6,357
13.95
224,415
Secondary MHSA only
36,723
80.61
975,238
At Least One Principal MHSA
Yes
8,833
5.26
323,218
No
159,124
94.74
5,186,328
Any Secondary MHSA`
Yes
43,080
25.65
1,199,653
No
124,877
74.35
4,309,893
Coborbidity Status
SA Diagnosis Only
5,113
189,006
11.22
MH Diagnosis Only
35,515
898,948
77.96
Comorbidity
4,928
210,502
10.82
SOURCE: Healthcare Cost and Utilization Project (HCUP) Nationwide Inpatient Sample (NIS)
138
%
76.43
23.57
7.61
17.28
75.11%
5.87
94.13
21.77
78.23
14.56
69.23
16.21
Table 4.4b: Hospital Stay Characteristics for Community Hospital Discharges in Appalachia by County Economic Development
Status (Unweighted), 2004
County Economic Development Status
Adults Age 18 or Older
Distressed
Appalachian
Region
N
Presence of MHSA
No MHSA
diagnosis
23,605
At least one
8,570
MHSA
diagnosis
At-Risk
Outside of
Appalachia
Appalachian
Region
Transitional
Outside of
Appalachia
Appalachian
Region
Competitive
Attainment
Outside of
Appalachia
Appalachian
Region
Outside of
Appalachia
Appalachian
Region
Outside of
Appalachia
%
N
%
N
%
N
%
N
%
N
%
N
%
N
%
N
%
N
%
73.36
108,879
69.52
19,312
74.32
33,505
73
51,388
71.81
1,191,445
75.21
4,964
63.28
370,658
77.68
23,132
76.1
907,434
75.41
26.64
47,742
30.48
6,673
25.68
12,393
27
20,170
28.19
392,711
24.79
2,880
36.72
106,501
22.32
7,263
23.9
295,944
24.59
Subtype of MHSA Stays
Principal
MHSA only
377
4.6
Principal
and
828
10.11
secondary
MHSA
Secondary
MHSA only
7,365
89.89
At Least One Principal MHSA
6,139
12.86
623
9.34
723
5.83
906
4.7
33,667
8.57
137
4.76
6792
6.81
433
6.34
22,196
7.5
10,974
22.99
1,205
18.06
2,221
17.92
2,902
15.06
74,780
19.04
848
29.44
17,102
17.15
574
8.4
56,360
19.04
30,629
64.16
4,845
72.61
9,449
76.24
16,362
84.94
284,264
72.39
1,895
65.7986
82,607
82.85
6,256
91.6
217,388
73.46
Yes
3.75
17,113
10.93
1,828
7.03
2,944
6.41
3,808
5.32
108,447
6.85
985
12.56
23,894
5.01
1,007
3.31
78,556
6.53
No
30,970
Any Secondary MHSA
96.25
139,508
89.07
24,157
92.97
42,954
93.59
67,750
94.68
1,475,709
93.15
6,859
87.44
453,265
94.99
29,388
96.69
1,124,822
93.47
Yes
8,193
25.46
41,603
26.56
6,050
23.28
11,670
25.43
19,264
26.92
359,044
22.66
2,743
34.97
99,709
20.9
6,830
22.47
273,748
22.75
No
23,982
Coborbidity Status
SA
988
Diagnosis
Only
MH
6,943
Diagnosis
74.54
115,018
73.44
19,935
76.72
34,228
74.57
52,294
73.08
1,225,112
77.34
5,101
65.03
377,450
79.1
23,565
77.53
929,630
77.25
11.53
10,215
21.4
916
13.73
1,480
11.94
1,983
9.83
57,384
14.61
254
8.82
14,434
13.55
972
13.38
41,349
13.97
81.02
25,661
53.75
4,926
73.82
8,993
72.57
15,889
78.78
269,795
68.7
2,061
71.56
76,431
71.77
5,696
78.42
202,110
68.29
7.46
11,866
24.85
831
12.45
1,920
15.49
2,298
11.39
65,532
16.69
565
19.62
15,636
14.68
595
8.19
52,485
17.73
1,205
Only
Comorbidity
639
SOURCE: Healthcare Cost and Utilization Project (HCUP) Nationwide Inpatient Sample (NIS)
139
Tables 4.5a and 4.5b below show findings for diagnoses and principal reason for hospitalization
for community hospital discharges in Appalachia and outside of Appalachia. Table 4.5a provides
findings overall, while Table 4.5b shows findings by county economic development status.
Approximately 4% of hospital discharges in Appalachian counties and outside of Appalachia
involve an alcohol use disorder diagnosis. Non-Appalachian distressed counties report 8.9% of
diagnoses containing an alcohol use disorder, compared with 3.0% in Appalachian distressed
counties. For competitive counties, conversely, 6.3% of diagnoses in the Appalachian region
involve an alcohol use disorder compared with 4.1% outside of Appalachia.
Approximately 3% of hospital discharges in Appalachia and 4% of discharges outside of
Appalachia involve a drug use disorder diagnosis. These findings are consistent across economic
development levels, with the exception of distressed counties. Non-Appalachian distressed counties
report that 9.9% of discharges involve a drug use disorder, compared with 2.4% of discharges in
Appalachian distressed counties.
Overall, 23.7% of discharges in the Appalachian region involve diagnoses of a mental health
disorder, compared with 19.5% of discharges outside of Appalachia. For most economic
development levels, both Appalachian and non-Appalachian counties report about 20% of
diagnoses as having mental health disorders. However, Appalachian competitive counties report
33.2% of discharges as having a mental health disorder diagnosis, compared with 18.9% outside of
Appalachia.
Overall, alcohol and drug use are reported minimally as principal causes of hospitalization. In the
Appalachian region, 0.7% of hospitalizations are principally due to alcohol or drug use, compared
to 0.8% outside the Appalachian region. Differences in hospitalizations principally due to alcohol
use are most apparent in distressed and attainment counties, where rates of 2.0% and 0.9%,
respectively are seen outside of Appalachia, compared with Appalachian rates of 0.4% and 0.2%.
In competitive counties, on the other hand, the Appalachian region reports slightly higher
percentages of alcohol-related hospitalizations at 0.8% compared to 0.6%. The greatest gap for
drug-related hospitalizations is in distressed counties, where 2.8% of hospitalizations outside of
Appalachia are principally due to drug use, compared with 0.5% within Appalachia.
140
Table 4.5a: Diagnoses and Principal Reason for Hospitalization for Community Hospital
Discharges in Appalachia (Unweighted), 2004
Adults Age 18 or Older
Appalachian Region
N
Outside of Appalachia
%
N
%
Diagnoses Contain Alcohol Use Disorder
Yes
6,358
3.79
247,550
4.49
No
6,495
3.87
226,276
4.11
Diagnoses Contain Drug Use Disorder
Yes
5,159
3.07
224,855
4.08
No
6,471
3.85
221,578
4.02
Diagnoses Contain Mental Health Disorder
Yes
39,784
23.69
1,075,012
19.51
No
1,749
1.04
64,130
1.16
Principal Reason for Hospitalization was Alcohol Use
Yes
1,227
0.73
41,684
0.76
No
166,730
99.27
5,467,862
99.24
Principal Reason for Hospitalization was Drug Use
Yes
1,176
0.7
45,888
0.83
No
166,781
99.3
5,463,658
99.17
SOURCE: Healthcare Cost and Utilization Project (HCUP) Nationwide Inpatient Sample (NIS), 2004.
141
Table 4.5b: Diagnoses and Principal Reason for Hospitalization for Community Hospital Discharges in Appalachia
(Unweighted), by County Economic Development Status, 2004
Distressed
Appalachian
Region
N
%
At-Risk
Outside of
Appalachia
N
%
Appalachian
Region
N
%
County Economic Development Status
Adults Age 18 or Older
Transitional
Outside of
Appalachia
N
%
Appalachian
Region
N
%
Outside of
Appalachia
N
%
Competitive
Appalachian
Region
N
%
Attainment
Outside of
Appalachia
N
%
Appalachian
Region
N
%
Outside of
Appalachia
N
%
Diagnoses Contain Alcohol Use Disorder
978
3.76
2,147
4.68
2,963
4.14
75,250
4.75
492
6.27
19,686
4.13
969
3.19
60,127
5
1,281
4.93
1,801
3.92
2,606
3.64
74,577
4.71
738
9.41
17,017
3.57
892
2.93
52,317
4.35
1,016
3.91
1,951
4.25
2,129
2.98
71,589
4.52
455
5.8
15,191
3.18
779
2.56
52,367
4.35
950
2.95
8,514
5.44 1,104
No
Diagnoses Contain Mental Health Disorder
4.25
1,719
3.75
2,796
3.91
71,002
4.48
729
9.29
17,896
3.75
892
2.93
52,617
4.37
21.7
10,625
23.2
17,866
25
323,434
20.4
2,602
33.2
90,279
18.9
6,165
20.3
246,436
20.5
716
1.56
687
0.96
25,100
1.58
61
0.78
3,329
0.7
147
0.48
15,302
1.27
681
1.48
644
0.9
15,490
0.98
66
0.84
3,101
0.65
76
0.25
10,357
0.86
45,217
98.5
70,914
99.1
1,568,666
99
7,778
99.2
474,058
99.4
30,319
99.8
1,193,021
99.1
Yes
956
2.97
13,883
8.86
978
3.04
9,218
5.89
No
Diagnoses Contain Drug Use Disorder
Yes
Yes
780
7,517
2.42
23.4
15,443
32,908
9.86
21
5,634
266
0.83
6,470
4.13
588
2.26
No
Principal Reason for Hospitalization was Alcohol Use
Yes
140
0.44
3,212
2.05
301
1.16
32,035 99.6 153,409
98
25,684 98.8
No
Principal Reason for Hospitalization was Drug Use
Yes
176
0.55
4,402
2.81
510
1.96
705
1.54
356
0.5
19,293
1.22
47
0.6
2,033
0.43
87
0.29
12,031
1
No
31,999
99.5
152,219
97.2
25,475
98
45,193
98.5
71,202
99.5
1,564,863
98.8
7,797
99.4
475,126
99.6
30,308
99.7
1,191,347
99
SOURCE: Healthcare Cost and Utilization Project (HCUP) Nationwide Inpatient Sample (NIS), 2004.
142
Tables 4.6a and 4.6b below present differences in community hospital discharges for all principal
and secondary mental health or substance abuse diagnoses. Results are for adults age 18 and older.
Table 4.6a provides findings overall, while Table 4.6b provides specific findings by county
economic development status. Diagnoses cover all principal and secondary mental health or
substance abuse diagnoses. Overall, 10.6% of discharges in the Appalachian region and 13.7% of
discharges outside of Appalachia were screened for mental health problems. Screening for mental
health problems constitutes the majority of discharge diagnoses outside of Appalachia. The gap
between Appalachia and areas outside of Appalachia is largest in the two most economically
developed categories, with approximately 8% of discharges in competitive and attainment counties
in Appalachia being attributed to screening, compared to 14.5% in non-Appalachian counties.
Overall, 5.6% of discharges in the Appalachian region are attributed to anxiety disorders, compared
with 3.5% outside of Appalachia. No distinct pattern emerges based on the economic development
status, with the largest gaps between Appalachian and non-Appalachian counties occurring in
distressed counties (7.4% of discharges in the Appalachian region compared with 2.1% outside of
Appalachia), and competitive counties (7.7% of discharges in the Appalachian region compared
with 3.7% outside of Appalachia).
Overall, 5.9% of discharges in the Appalachian region are due to delirium, dementia, and amnestic
and other cognitive disorders, compared with 5.2% outside of Appalachia. In less economically
developed counties, there is little regional difference in rates of these diagnoses. In competitive
counties, however, 7.2% of discharges in the Appalachian region are due to this type of diagnosis,
compared with 4.9% outside of Appalachia. In attainment counties, conversely, 3.0% of diagnoses
in the Appalachian region are due to delirium and other cognitive disorders, compared with 5.2%
outside of Appalachia.
Overall, 12.3% of diagnoses in the Appalachian region and 10.1% of diagnoses outside of
Appalachia are due to mood disorders. Mood disorders constitute the majority of diagnoses,
overall, in Appalachia. The most striking regional difference occurs in competitive counties, where
20.1% of mental health and substance abuse diagnoses in the Appalachian region are due to mood
disorders, compared to 10% outside of Appalachia.
Overall, 6.0% of discharges in the Appalachian region, and 7.2% of discharges outside of
Appalachia are due to substance-related disorders. Strikingly, in non-Appalachian distressed
counties, substance-related disorders constitute the predominant mental health diagnosis,
comprising 14.1% of diagnoses. In contrast, only 5.1% of diagnoses in distressed Appalachian
counties are attributed to substance-related disorders.
143
Table 4.6a: Differences Among All Principal and Secondary Mental Health or Substance
Abuse Diagnoses for Discharges from Community Hospitals, 2004
Adults Age 18 or Older
Appalachian Region
Outside of Appalachia
N
%
N
%
384
0.23
21,318
0.39
9,369
5.58
191,077
3.47
291
0.17
8,837
0.16
Delirium, dementia, and amnestic and other
cognitive disorders
9,962
5.93
287,877
5.23
Developmental disorders
1,386
0.83
31,533
0.57
Disorders usually diagnosed in infancy,
childhood, adolescence
54
0.03
1,927
0.03
Impulse control disorders, NEC
247
0.15
4,023
0.07
Mood disorders
20,718
12.34
556,748
10.11
Personality disorders
1,572
0.94
42,250
0.77
Schizophrenia, other psychotic disorders
3,480
2.07
143,039
2.6
Substance-related disorders
10,041
5.98
399,508
7.25
Miscellaneous mental disorders
1,612
0.96
56,812
1.03
Screening and history of mental health and
substance abuse codes
17,742
10.56
755,481
13.71
Adjustment disorders
Anxiety disorders
Attention-deficit, conduct, and disruptive
behavior disorders
SOURCE: Healthcare Cost and Utilization Project (HCUP) Nationwide Inpatient Sample (NIS), 2004.
144
Table 4.6b: Differences Among All Principal and Secondary Mental Health or Substance Abuse Diagnoses Discharged from
Community Hospitals, by County Economic Development Status, 2004
County Economic Development Status Adults Age 18 or Older
Distressed
Appalachian
Region
At-Risk
Outside of
Appalachia
Appalachian
Region
Transitional
Outside of
Appalachia
Appalachian
Region
Competitive
Outside of
Appalachia
Appalachian
Region
Attainment
Outside of
Appalachia
Appalachian
Region
Outside of
Appalachia
N
%
N
%
N
%
N
%
N
%
N
%
N
%
N
%
N
%
N
%
57
0.18
868
0.55
54
0.21
92
0.2
177
0.25
7,561
0.48
19
0.24
2,107
0.4
77
0.25
4,808
0.4
2,394
7.44
3,269
2.09
1,159
4.46
2,242
4.88
3,860
5.39
58,425
3.69
604
7.7
17,517
3.7
1,352
4.45
45,557
3.8
24
0.07
78
0.05
24
0.09
71
0.15
136
0.19
2,677
0.17
36
0.46
769
0.2
71
0.23
2,334
0.2
2,030
6.31
9,802
6.26
1,522
5.86
2,928
6.38
4,939
6.9
83,306
5.26
568
7.24
23,263
4.9
903
2.97
62,263
5.2
248
0.77
1,092
0.7
198
0.76
380
0.83
698
0.98
9,550
0.6
27
0.34
2,531
0.5
215
0.71
7,082
0.6
3
0.01
61
0.04
6
0.02
8
0.02
24
0.03
549
0.03
4
0.05
164
0
17
0.06
511
0
Impulse control
disorders, NEC
25
0.08
201
0.13
60
0.23
61
0.13
138
0.19
1,362
0.09
15
0.19
469
0.1
9
0.03
865
0.1
Mood disorders
3,074
9.55
12,903
8.24
2,858
11
5,481
11.94
9,324
13.03
164,347
10.37
1,576
20.1
47,578
10
3,886
12.78
135,478
11
Personality disorders
27
0.08
841
0.54
150
0.58
453
0.99
703
0.98
13,437
0.85
596
7.6
4,789
1
96
0.32
9,983
0.8
Schizophrenia, other
psychotic disorders
762
2.37
9,084
5.8
519
2
1,046
2.28
1,463
2.04
45,583
2.88
273
3.48
9,070
1.9
463
1.52
29,100
2.4
1,627
5.06
22,081
14.1
1,747
6.72
3,400
7.41
4,281
5.98
122,916
7.76
819
10.4
30,070
6.3
1,567
5.16
93,834
7.8
239
0.74
694
0.44
192
0.74
278
0.61
941
1.32
16,994
1.07
102
1.3
6,417
1.3
138
0.45
11,791
1
3,184
9.9
12,299
7.85
2,234
8.6
6,031
13.14
9,650
13.49
199,570
12.6
694
8.85
69,182
15
1,980
6.51
174,767
15
Adjustment disorders
Anxiety disorders
Attention-deficit,
conduct, and disruptive
behavior disorders
Delirium, dementia, and
amnestic and other
cognitive disorders
Developmental
disorders
Disorders usually
diagnosed in infancy,
childhood, adolescence
Substance-related
disorders
Miscellaneous mental
disorders
Screening and history of
mental health and
substance abuse codes
SOURCE: Healthcare Cost and Utilization Project (HCUP) Nationwide Inpatient Sample (NIS), 2004.
145
Tables 4.7a and 4.7b, below, show sub-regional differences among community hospital discharges
by substance abuse and mental health diagnoses as the major reason for hospitalization for adults
over age 18. Table 4.7a provides findings overall for admissions from Appalachian community
hospitals versus non-Appalachian community hospitals. Table 4.7b provides findings by county
economic development status. Overall, 5.4% of all hospitalizations in the Appalachian region, and
6.1% of hospitalizations outside of Appalachia are attributed to mental health or substance abuse
diagnoses. In Appalachia and outside of Appalachia, 0.2% of hospitalizations are attributed to
screening for mental health disorders. There is little variation based on the level of economic
development in the region.
Overall, 0.5% of diagnoses in the Appalachian region and 0.4% of diagnoses outside of Appalachia
are due to delirium, dementia, and amnestic and other cognitive disorders. Appalachian transitional
and competitive counties report around 0.7% of hospitalizations due to delirium and other cognitive
disorders, compared with about 0.4% outside of Appalachia. Conversely, in attainment counties,
only about 0.2% of diagnoses in the Appalachian region are related to cognitive disorders,
compared with 0.4% outside of Appalachia.
Overall, 2.1% of hospitalizations in Appalachia and outside of Appalachia are due to mood
disorders. Mood disorders, overall, are the leading mental health or substance abuse diagnosis
associated with hospitalizations in Appalachia and outside of Appalachia. In Appalachian
distressed counties, 1.1% of hospitalizations are due to mood disorders, compared with 2.0% in
non-Appalachian distressed counties. Mood disorders are the leading mental health or substance
abuse diagnosis associated with hospitalizations among distressed counties in Appalachia. Mood
disorders are also the leading mental health or substance abuse diagnosis associated with
hospitalization in transitional counties in Appalachia and outside of Appalachia (2.1% and 2.3% of
hospitalizations, respectively). In competitive counties in the Appalachian region, 7.6% of
hospitalizations are due to mood disorders, compared with 2.1% in competitive counties outside of
Appalachia. Despite this gap, mood disorders constitute the main mental health or substance abuse
diagnosis linked to hospitalizations in competitive counties both in Appalachian and outside of
Appalachia. Mood disorders are also the main diagnosis associated with hospitalizations for
attainment counties in Appalachia and outside of Appalachia.
Overall, 0.8% of hospitalizations in the Appalachian region and 1.3% of hospitalizations outside of
Appalachia are associated with a diagnosis of schizophrenia and other psychotic disorders. There
are no discernable patterns associated with level of economic development around this diagnosis.
In distressed counties, 0.9% of diagnoses in the Appalachian region and 3.3% of hospitalizations
outside of Appalachia are linked to this diagnosis. In competitive counties, on the other hand, these
values are switched.
Overall, about 1.5% of hospitalizations in Appalachia and outside of Appalachia are due to
substance-related disorders. In distressed counties, 1.0% of Appalachian and 4.9% of nonAppalachian hospitalizations are due to substance-related disorders. Outside of Appalachia, this
constitutes the largest source of mental health or substance abuse diagnoses. Substance-related
disorders also constitute the most frequent diagnosis associated with hospitalizations among mental
health or substance abuse diagnoses in at-risk counties within Appalachia and outside of Appalachia
(3.1% and 3.0% of hospitalizations, respectively).
146
Table 4.7a: Differences Among Community Hospital Discharges by Substance Abuse and
Mental Health Diagnoses as the Major Reason for Hospitalization, 2004
Adults Age 18 or Older
Appalachian Region
Adjustment disorders
Anxiety Disorders
Outside of Appalachia
N
%
N
%
92
0.05
6,637
0.12
248
0.15
6,664
0.12
Attention-deficit, conduct, and
disruptive behavior disorders
Delirium, dementia, and amnestic and
other cognitive disorders
3
0
186
0
915
0.54
22,526
0.41
Developmental disorders
12
0.01
267
0
Disorders usually diagnosed in infancy,
childhood, adolescence
4
0
133
0
Impulse control disorders, NEC
38
0.02
1,268
0.02
3,519
2.1
117,444
2.13
17
0.01
790
0.01
Schizophrenia and other psychotic
disorders
1,319
0.79
72,713
1.32
Substance-related disorders
2,403
1.43
87,572
1.59
275
0.16
7,285
0.13
306
0.18
12,789
0.23
Mood disorders
Personality disorders
Miscellaneous mental disorders
Screening and history of mental health
and substance abuse codes
SOURCE: Healthcare Cost and Utilization Project (HCUP) Nationwide Inpatient Sample (NIS), 2004.
147
Table 4.7b: Differences Among Community Hospital Discharges by Substance Abuse and Mental Health Diagnoses as the Major
Reason for Hospitalization by County Economic Development Status, 2004
County Economic Development Status
Adults Age 18 or Older
Distressed
Appalachian
Region
At-Risk
Outside of
Appalachia
Appalachian
Region
Transitional
Outside of
Appalachia
Appalachian
Region
Competitive
Outside of
Appalachia
Appalachian
Region
Attainment
Outside of
Appalachia
Appalachian
Region
Outside of
Appalachia
N
%
N
%
N
%
N
%
N
%
N
%
N
%
N
%
N
%
N
%
Adjustment disorders
13
0.04
349
0.22
21
0.08
48
0.1
43
0.06
2,752
0.17
1
0.01
580
0.12
14
0.05
1,536
0.13
Anxiety Disorders
34
0.11
108
0.07
70
0.27
83
0.2
97
0.14
2,135
0.13
18
0.23
830
0.17
29
0.1
1,648
0.14
Attention-deficit,
conduct, and
disruptive behavior
disorders
.
.
7
0
2
0.01
1
0
.
.
75
0
.
.
19
0
1
0
45
0
139
0.43
482
0.31
105
0.4
147
0.3
560
0.78
6,563
0.41
50
0.64
1,698
0.36
61
0.2
5,348
0.44
Developmental
disorders
1
0
19
0.01
.
.
1
0
7
0.01
99
0.01
1
0.01
32
0.01
3
0.01
49
0
Disorders usually
diagnosed in infancy,
childhood,
adolescence
1
0
5
0
.
.
1
0
1
0
40
0
1
0.01
11
0
1
0
46
0
Impulse control
disorders, NEC
6
0.02
94
0.06
22
0.08
18
0
7
0.01
440
0.03
1
0.01
184
0.04
2
0.01
257
0.02
Mood disorders
345
1.07
3,161
2.02
513
1.97
815
1.8
1,510
2.11
36,314
2.29
595
7.59
10,134
2.12
556
1.83
30,572
2.54
.
.
27
0.02
1
0
1
0
10
0.01
252
0.02
4
0.05
74
0.02
2
0.01
217
0.02
Schizophrenia and
other psychotic
disorders
296
0.92
5,143
3.28
237
0.91
382
0.8
465
0.65
22,914
1.45
176
2.24
4,459
0.93
145
0.48
14,870
1.24
Substance-related
disorders
316
0.98
7,614
4.86
811
3.12
1,386
3
1,000
1.4
34,783
2.2
113
1.44
5,134
1.08
163
0.54
22,388
1.86
Miscellaneous mental
disorders
55
0.17
123
0.08
46
0.18
62
0.1
115
0.16
2,179
0.14
26
0.33
771
0.16
33
0.11
1,629
0.14
Screening and history
of mental health and
substance abuse codes
49
0.15
361
0.23
34
0.13
87
0.2
129
0.18
3,399
0.21
26
0.33
1,027
0.22
68
0.22
2,688
0.22
Delirium, dementia,
and amnestic and other
cognitive disorders
Personality disorders
SOURCE: Healthcare Cost and Utilization Project (HCUP) Nationwide Inpatient Sample (NIS), 2004.
148
Table 4.8: Adult Patients Diagnosed with Mental Health Disorders in Community Hospitals,
2004
Age 18 and older
Appalachian Region
Outside of Appalachia
N=794,546
N=31,930,000
Count (Percent)
Count (Percent)
Adjustment disorders
1,862 (0.23%)***
121,197 (0.39%)***
Anxiety disorders
43,996 (5.54%)***
1,108,665 (3.56%)***
1,320 (0.17%)
50,105 (0.16%)
Delirium, dementia, and amnestic and other
cognitive disorders
47,016 (5.92%)***
1,643,622 (5.28%)***
Developmental disorders
6,523 (0.82%)***
181,070 (0.58%)***
247 (0.03%)
10,786 (0.03%)
Impulse control disorders
1,196 (0.15%)***
24,056 (0.08%)***
Personality disorders
7,145 (0.90%)***
246,001 (0.79%)***
Schizophrenia and other psychotic disorders
16,368 (2.06%)***
804,620 (2.58%)***
Substance-related disorders
47,251 (5.95%)***
2,205,822 (7.08%)***
Miscellaneous mental disorders
7,887 (0.99%)***
326,184 (1.05%)***
83,813 (10.55%)***
4,368,709 (14.03%)***
Attention-deficit, conduct, and disruptive
behavior disorders
Disorders usually diagnosed in infancy,
childhood, or adolescence
Screening and history of mental health and
substance abuse codes
SOURCE: Healthcare Cost and Utilization Project (HCUP) Nationwide Inpatient Sample (NIS), 2004.
Notes:
1
Appalachian region is defined as all areas covered by the 410 designated counties in 13 states.
2
Analysis is limited to hospital discharges with patients age 18-59; Weighted length and charge estimates are presented.
3
***The individual coefficient is statistically significant at the 1% level using a two-sided test.
4
**The individual coefficient is statistically significant at the 5% level using a two-sided test.
5
*The individual coefficient is statistically significant at the 10% level using a two-sided test.
Table 4.8 above provides data on adult patients diagnosed with mental health disorders in
community hospitals in Appalachia and outside of Appalachia. More adults in Appalachian
community hospitals were diagnosed with the following disorders than their non-Appalachian
counterparts: anxiety disorders; delirium, dementia, and amnestic and other cognitive disorders;
developmental disorders (includes communication disorders, developmental disabilities, intellectual
disabilities, learning disorders, and motor skill disorders); impulse control disorders; and personality
disorders. Results are statistically significant (p<0.01).
149
4.5 Discussion
The Nationwide Inpatient Sample (NIS) data of the Healthcare Cost and Utilization Project (HCUP)
provide important and unique information to understand the extent of substance use and mental
disorders among patients discharged from the community hospitals. Findings described in this
chapter point to several disparities between Appalachian and non-Appalachian community hospital
discharges, as well as discharges across Appalachian sub-regions and county economic
development levels. In addition, findings from this chapter emphasize that mental health problems
are paramount in the Appalachian region.
Path to admission
Patients in the Appalachian region are more likely to be admitted through the emergency
department (ED) than patients outside of the Appalachian region. This disparity appears to
concentrate in “At-Risk” and “Transitional” counties as compared to other counties. Economic
disadvantage is a likely factor in limiting people’s tendency to seek preventive care or get low cost,
non-emergency health care.
Payment for services
In Appalachia, over 67 percent of adult hospital stays were billed to the government in 2004;
Medicaid was billed for 15% of all stays and Medicare was billed for 52% of all stays. In
comparison, 57 percent of adult hospital stays outside of Appalachia were billed to the government;
Medicaid was billed for 14% of all stays and Medicare was billed for 43% of all stays. The
percentages of inpatient hospital stays billed to Medicaid overall are almost the same between
Appalachia and non-Appalachia counties. As expected, less economically developed counties in
Appalachia report a greater percentage of Medicaid expected payers than more economically
developed counties. However, fewer stays in Appalachian community hospitals in “Distressed,”
“At-Risk,” and “Transitional” counties were billed to Medicaid than in non-Appalachian counties of
similar economic development status. It appears that the delivery or utilization of government
support across communities with differing economic development levels is uneven. It is notable that
individuals in the most disadvantaged communities are actually less likely to benefit from
government support.
Substance abuse and/or mental disorder diagnoses
Community hospitals play an important role in identifying and treating individuals with MHSA
disorders, even when MHSA disorders are not the primary reason for an individual’s hospital visit.
Overall, the percentage of admissions in Appalachia for patients with principal and/or secondary
MHSA diagnoses is higher than the percentage outside of Appalachia.
This study also reveals that the vast majority of hospital stays with MHSA diagnoses are mental
health related; and the rate is higher in Appalachia than outside of Appalachia. The rate of cooccurrence of substance abuse and mental disorders, however, is lower in Appalachia than outside
of Appalachia, especially in economically-distressed areas. The high presence of admissions with
mental health disorders in Appalachia is a likely challenge to Appalachian community hospitals as
these facilities, by definition, are not mental health hospitals.
150
REFLECTIONS FROM PRACTITIONERS
From the Coalition on Appalachian Substance Abuse Policy
Challenges Associated with Using the Health Care Cost and Utilization
Project (HCUP) National Inpatient Survey to Explore Substance Abuse and
Mental Health in Appalachia
• HCUP provides an underestimation of the mental health problems in Appalachia and nationally because mental health hospitals are not included in the data set. • Facility reporting practices are often affected by payment. CASAP noted that hospitals participating in HCUP are likely to underreport substance abuse issues for admissions. Hospitals are not paid if the primary reason for admission is related to a substance abuse problem. According to CASAP, hospitals may code the client’s reason for admission as a physical or mental health problem, if possible, to secure payment. As a result, the HCUP data may significantly understate substance abuse problems. • CASAP noted that the findings from the HCUP data set were more consistent with their experiences than findings from TEDS, N‐SSATS, and NSDUH. 151
CHAPTER 5: Substance Abuse Treatment Services in the Appalachian
Region, 2005
5.1 Introduction
The National Survey of Substance Abuse Treatment Services (N-SSATS) enables researchers to
view an annual snapshot of the character and composition of the substance abuse treatment delivery
system in the United States. N-SSATS allows us to make comparisons across geographic areas and
among different populations with substance abuse issues. Chapter 5 provides an overview of
substance abuse treatment services in and outside of Appalachia on the reference date of March 31,
2005. The sample analyzed in this study includes 13,367 substance abuse treatment facilities from
which data were collected in 2005. Of all these facilities, 980 (7.3%) were from the Appalachian
region,13 and 12,391 (92.7%), were from the rest of the country.14 All analyses in this chapter are
based on N-SSATS data.
We explore the following key research questions for facilities in Appalachia and facilities outside of
Appalachia:
Do substance abuse facilities in Appalachia offer inpatient detoxification services?
What are the ownership structures for the Appalachian treatment facilities and how do they
compare to those of other facilities?
What is the primary focus of Appalachian substance abuse facilities (e.g., substance abuse
services, mental health services, general health care services, etc.)?
What types of health insurance do facilities accept (e.g., Medicare, Medicaid, state financed
insurance, private health insurance)?
In Section 5.2, we provide an overview of the N-SSATS series, its uses, the measures relevant to
this study, and any limitations specifically related to exploring admissions to substance abuse
treatment in the Appalachian region. In Section 5.3, we discuss our methods. Section 5.4 contains
the results of the analysis. Finally, Section 5.5 provides a discussion of key findings.
5.2 Data
5.2.1 Overview
The National Survey of Substance Abuse Treatment Services (N-SSATS) collects data from public
and private substance abuse treatment facilities in the United States. The term “facility” represents
program-level, clinic-level, or multi-site respondents.83 N-SSATS provides information such as
substance abuse treatment facility characteristics and key characteristics of clients receiving
substance abuse treatment or services.84
13
The Appalachian region is defined as the 410 designated counties in all of West Virginia and parts of 12 other states:
Alabama; Georgia; Kentucky; Maryland; Mississippi; New York; North Carolina; Ohio; Pennsylvania; South Carolina;
Tennessee; and Virginia
14
The data description from the user’s guide showed 13,367 in-scope cases and our total analytic sample has 13,371
cases.
152
The objective of N-SSATS is to collect data that can be used by the Substance Abuse and Mental
Health Services Administration (SAMHSA) and state and local governments to: (1) assist
SAMHSA in assessing the nature and extent of services provided and in forecasting treatment
resource requirements; (2) update SAMHSA's Inventory of Substance Abuse Treatment Services (ISATS); (3) analyze general treatment services trends; and (4) generate the National Directory of
Drug and Alcohol Abuse Treatment Programs and its online Abuse Treatment Facility Locator
equivalent, the Substance Abuse Treatment Facility Locator.85
Planned and directed by SAMHSA, N-SSATS was originally launched in the 1970s to collect
information on the characteristics of treatment facilities, including their location and utilization of
treatment facilities and services. N-SSATS collects data from the 50 states, the District of
Columbia, and other U.S. jurisdictions (including the territories of American Samoa and Guam, the
Federated States of Micronesia, the Republic of Palau, the Commonwealth of Puerto Rico, and the
Virgin Islands of the United States). Data are collected on the following topics:
ownership/operation; primary focus (substance abuse, mental health, both, general health, other);
organizational setting; services offered; languages spoken other than English; programs or groups
for special populations; type of treatment provided; types of payment accepted; managed care
agreements; sources and amounts of revenue; number of clients under age 18; number of clients by
age, sex, race and ethnicity; client substance abuse problem treated; and licensure/ certification of
facility and staff.
The 2005 N-SSATS was conducted between March and October 2005. In 2005, a total of 13,371
substance abuse treatment facilities responded to N-SSATS.86
5.2.2 Sample Design
N-SSATS is a point-prevalence survey, meaning that it provides information about the substance
abuse treatment facilities on a particular reference date. For the 2005 N-SSATS, the reference date
was March 31, 2005. The N-SSATS provides a snapshot of the substance abuse delivery system on
this reference date.
The Inventory of Substance Abuse Treatment Services (I-SATS) provides the sampling frame for
N-SSATS. The survey universe contains treatment facilities listed on the I-SATS six weeks prior to
the reference data and those added by state substance abuse agencies or discovered during the first
three weeks of the survey. The treatment facilities included are licensed, certified, or approved by
the state substance abuse agency and facilities that state substance abuse agencies do not license or
certify (e.g., private, for-profit, small group practices, or hospital-based programs).
Several features of N-SSATS are important to note. First, the total number of patients treated does
not represent the annual total number of clients at these facilities. This is because N-SSATS
provides a snapshot of treatment facilities on a single day. As a result, we do not have information
about the annual number of clients treated, nor can we assume that facilities were treating clients at
their full capacity. Second, N-SSATS collects data about substance abuse treatment facilities,
rather than individual clients. Third, N-SSATS does not include treatment programs in jails or
prisons. Finally, client data are aggregated for each facility that reports to N-SSATS.87
Data for N-SSATS are collected by Mathematica Policy Research, Inc. For 2005, N-SSATS
questionnaires were distributed via mail to 16,418 facilities.88 The facilities that received the mail
153
questionnaire were believed to offer substance abuse treatment services. Approximately 10 percent
of these facilities had closed or were not providing substance abuse treatment on the reference date,
and were therefore deemed ineligible to participate. Of the remaining 14,747 facilities, 95.3%
completed the survey.89 Of these, an additional 680 facilities were considered out of scope or had
no facility information. The final sample size was 13,367 (90.6 percent of the survey universe).
The response rate was 44.5 percent for the mail survey.90 The same survey was offered in telephone
and Web-based formats. The response rate for the telephone survey was 22.1 percent, slightly
lower than the 33.4 percent response rate for the Web-based questionnaire.91 Upon completion of
data collection, Synectics for Management Decisions, Inc., prepares the file for release.
5.2.3 Uses of the N-SSATS
N-SSATS enables researchers to explore the demographic and substance abuse characteristics of
admissions to and discharges from substance abuse treatment. SAMSHA releases an annual report
based on the N-SSATS data as well as a national profile.92,93 The annual report explores trends in
facility characteristics, client characteristics, and facility services. The national profile provides a
high level overview of the N-SSATS data. N-SSATS data were also used to develop The National
Directory of Drug and Alcohol Abuse Treatment Programs 2005, a searchable directory of 10,000
drug and alcohol treatment programs across the country.94
N-SSATS data have been used to explore a number of research questions related to substance abuse
treatment. A recent study used N-SSATS data to examine the relationships between state
authorization type (certification/accreditation versus licensure with and without deemed status) and
outpatient treatment program practices, for example.95
N-SSATS has also been used to explore the distribution of specialized programs or groups in
substance abuse treatment facilities across the United States. Studies have examined services and
programs available for adolescents, criminal justice clients, and pregnant or postpartum
women.96,97,98,99 Research has also focused on the availability of the treatment services (including
clinical, social, and health services) for clients with co-occurring mental health and substance abuse
disorders at these facilities.100
Other studies that have applied N-SSATS data have explored profit status and the effects on the
provision of drug treatment services,101 opioid treatment programs,102 and the role of state policies
in the adoption of naltrexone for substance abuse treatment.103
The Office of Applied Studies (OAS) at SAMHSA also releases the Drug and Alcohol Services
Information System (DASIS) Series report annually on drug and alcohol services. The DASIS is
the primary source of national data on substance abuse treatment, developed from N-SSATS, the
Treatment Episode Data Set (TEDS), and the Inventory of Substance Abuse Treatment Services (ISATS).
5.2.4 N-SSATS Measures Used in this Study
Next, we define the measures used from the 2005 N-SSATS, and explore the potential limitations
with respect to using these measures for our purpose – exploring the characteristics of and services
provided by substance abuse treatment facilities in the Appalachian region and other regions
154
nationally. We explore a number of variables related to services offered, groups treated, and
payment/ insurance options.
We explored measures indicating which substance abuse treatment facilities offer inpatient
detoxification and looked at the primary focus of facilities – specifically, whether they offered
substance abuse services, mental health services, a mix of mental health and substance abuse
services, or general health care services. Next, we looked at which facilities accept adolescents for
treatment. In terms of payment, we examined which facilities use a sliding fee scale and which
facilities offer free or no charge treatment. Finally, we provide N-SSATS data on facilities that
accept Medicare, Medicaid, state financed health insurance, and private insurance.
5.2.5 Limitations of the N-SSATS
There are several limitations with respect to using N-SSATS to explore the composition and
characteristics of substance abuse treatment facilities in Appalachian counties as compared to other
counties nationally.
One serious limitation is that N-SSATS does not capture data from all of the substance abuse
treatment facilities that may be relevant to this study. Several types of facilities were excluded from
the 2005 N-SSATS analyses, including: halfway houses that do not provide substance abuse
treatment; jails, prisons, or other organizations that treat incarcerated patients only; individual
practitioners that were not recommended by the State substance abuse agency for inclusion; and
other facilities whose client counts were included within the counts of other facilities.104 In addition
to excluding certain facilities, state licensure and certification policies also may affect which
facilities are in the N-SSATS survey universe.15 Finally, N-SSATS is a voluntary survey, and thus,
does not reflect all substance abuse treatment facilities in the United States. The response rate is
very high overall (about 95%), however. In this study, no adjustments have been made for facility
non-response (approximately 5%) so non-response bias may affect results.105
For these reasons, it is important to note that the N-SSATS does not capture data from all of the
facilities that may be relevant to this study. This limitation is particularly problematic for this study
because we are making comparisons between the Appalachian counties and all other counties
nationally. If facilities in states in the Appalachian region submit data less often than other states,
then our findings may be skewed.
A second limitation is that N-SSATS is a point-prevalence survey. Thus, the data do not reflect the
annual total number of clients receiving treatment at substance abuse facilities, but rather they
provide a snapshot based on a single reference date.
There are several limitations related to the survey’s design and content. For certain variables (e.g.,
services provided and specialized programs), facilities can enter multiple responses. However, the
data only reflect the total number of treatment facilities that entered each response. In addition, NSSATS only reports that a service, such as inpatient detoxification, is offered. The data do not in
15
According to project staff at the Office of Applied Studies, which funded and governed the data collection, the state
licensure policies are not an important data concern. While the state is charged with helping to identify substance
abuse treatment facilities, encouraging facilities to respond to the survey, and determining eligibility for inclusion in the
published directory, they do not determine which agencies are actually surveyed.
155
any way reflect the quality of the service delivered, or whether the service has been received by the
patient. Thus, our findings cannot speak to the quality of care received in Appalachian treatment
facilities versus other facilities nationwide. One last limitation to note is that some financial data
originally collected through the survey have been omitted from the public use file for confidentiality
reasons.
5.3 Methods
5.3.1 Study Sample
The sample analyzed in this study includes 13,371 substance abuse treatment facilities from which
data were collected in 2005. Of all these facilities, 891 (7.3%) were from the 318 counties in the
Appalachian region,16 and 12,391 (92.7%), were from the rest of the country.17
5.3.2 Statistical Methods
Appalachian Regional Status. A key purpose of analyzing the N-SSATS is to obtain an overview of
the characteristics of the substance abuse treatment facilities in the Appalachian region, as
compared to substance abuse treatment facilities located outside of the Appalachian region. Our
first step of the analysis is to match the census county FIPS codes in the 2005 N-SSATS with the
FIPS codes of the 410 Appalachian counties as defined by the Appalachian Regional Commission.
This creates a regional status flag variable to group all substance abuse treatment facilities into one
of two groups – facilities located in the Appalachian region and facilities outside of the Appalachian
region.
Research Variables. Research variables for the analysis covered the following characteristics of the
substance abuse treatment facilities: availability of inpatient detoxification services; primary
substance abuse treatment facility focus areas; provision of services for adolescents; availability of a
sliding fee scale; availability of no-cost treatment; acceptance of Medicare; acceptance of Medicaid;
acceptance of state financed health insurance; and acceptance of private health insurance.
Analysis. Data were analyzed using descriptive statistics. Cross-tabulations were examined to assess
the distribution of aggregated frequencies and proportions of various facility characteristics between
facilities in the Appalachian region and those outside of the Appalachian region. Chi-square tests
were performed for tabulations to test for statistical significance of the differences. Data were
compiled and analyzed with SPSS statistical software version 14.0 (SPSS Inc., Chicago, IL).
5.4 Results
Next, we present our results for substance abuse treatment facilities in Appalachia and outside of
Appalachia. We present other findings in Section 5.4.1 about the ownership of substance abuse
treatment facilities, characteristics of these facilities; a comparison of services offered in the
16
The Appalachian region is defined as the 410 designated counties in all of West Virginia and parts of 12 other states:
Alabama; Georgia; Kentucky; Maryland; Mississippi; New York; North Carolina; Ohio; Pennsylvania; South Carolina;
Tennessee; and Virginia
17
The data description from the user’s guide showed 13,367 in-scope cases and our total analytic sample has 13,371
cases.
156
inpatient, outpatient, and non-hospital residential care settings; pharmacotherapies provided; and
types of services offered at facilities, generally. In Section 5.4.2, we describe a series of figures that
illustrate comparisons between Appalachian treatment facilities and non-Appalachian treatment
facilities. We provide figures showing our findings related to inpatient detoxification services, the
primary focus of facilities; and health insurance and payment options available at the treatment
facilities (e.g., free or no charge, Medicare, Medicaid, state financed health insurance, and private
health insurance).
5.4.1 Tables
Table 5.1: Ownership and Other Characteristics of Substance Abuse Treatment Facilities,
2005
Region
Appalachia
Non-Appalachia
N=891
N=12,480
p-value
N
%
N
%
Private for-profit organization
204
22.90
3,367
26.98
Private non-profit organization
557
62.51
7,355
58.93
State government
40
4.49
413
3.31
Local, county, or community government
65
7.30
882
7.07
Tribal government
3
0.34
167
1.34
Federal government
22
2.47
296
2.37
Receives public funds1
868
70.05
12,480
65.32
0.0046
Arrangements/contracts with managed care
organizations2
842
58.08
11,869
49.10
<0.0001
Ownership
<0.0001
Other Characteristics
NOTES:
1
Public funds include federal, state, county, or local government funds for substance abuse treatment programs.
2
Managed care organizations have agreements with certain health care providers who provide services to plan members (e.g.,
managed behavioral health care organizations, health maintenance organizations, and preferred provider organizations).
SOURCE: U.S. Dept. of Health and Human Services, Substance Abuse and Mental Health Services Administration, Office of
Applied Studies. National Survey of Substance Abuse Treatment Services (N-SSATS), 2005.
Table 5.1 describes the ownership and other characteristics of substance abuse treatment facilities
in the Appalachian region and in the non-Appalachian region in 2005. The majority of substance
abuse treatment facilities in Appalachia (62.51%) and outside of Appalachia (58.93%) are owned by
private non-profit organizations. Proportionately, more Appalachian facilities are owned by the
federal government (2.47%) than facilities outside of the Appalachian region (2.37%).
Proportionately more Appalachian facilities are owned by a state government (4.49%) or a local,
county or community government (7.30%) than treatment facilities outside of Appalachia (3.31%
and 7.07%, respectively). Fewer Appalachian facilities than non-Appalachian facilities are owned
by a private-for-profit organization (22.90% vs. 26.98%) or tribal government (0.34% vs. 1.34%).
Results are statistically significant at the 99% confidence level.
157
Proportionately more treatment facilities in Appalachia than outside of Appalachia receive public
funds for their treatment programs, though more Appalachian facilities than non-Appalachian
facilities receive these funds; results are statistically significant at the 95% confidence level.
Proportionately more facilities in Appalachia have contracts or arrangements with managed care
organizations (58.08%) than facilities outside of Appalachia (49.10%); results are statistically
significant (p<0.0001).
Table 5.2 Characteristics of Substance Abuse Treatment Facilities, 2005
Region
Appalachia
Non-Appalachia
p-value
N
%
N
%
Accredited by the Joint Commission on the
Accreditation of Healthcare Organizations (JCAHO) 1
891
27.38
12,480
22.92
0.0023
Accredited by Commission on Accreditation of
Rehabilitation Facilities (CARF) 2
891
13.69
12,480
16.51
0.0277
Licensed/certified by public health department
891
44.78
12,480
38.65
0.0003
Licensed/certified by state mental health department
891
44.00
12,480
29.78
<0.0001
Licensed/certified by state substance abuse agency
891
69.14
12,480
81.35
<0.0001
NOTES:
1
JCAHO sets standards for healthcare organizations and issues accreditation to organizations that meet those standards.
2
CARF is an independent, non-profit organization that reviews and grants accreditation services nationally and internationally per
the request of facilities or programs.
SOURCE: U.S. Dept. of Health and Human Services, Substance Abuse and Mental Health Services Administration, Office of
Applied Studies. National Survey of Substance Abuse Treatment Services (N-SSATS), 2005.
Table 5.2 describes the characteristics of substance abuse treatment facilities in the Appalachian
region and outside of Appalachia in 2005. Proportionately more Appalachian than nonAppalachian treatment facilities are accredited by the Joint Commission on the Accreditation of
Healthcare Organizations (JCAHO) (27.38% vs. 22.92%) (p<0.05). Proportionately less
Appalachian facilities (13.6%) than non-Appalachian facilities (16.51%) are accredited by the
Commission on Accreditation of Rehabilitation Facilities (CARF) (p<0.05). Approximately 45% of
Appalachian treatment facilities are licensed or certified by a public health department as compared
to 38.65% of facilities outside of Appalachia (p<0.001). Forty-four percent of Appalachian
facilities are licensed or certified by the state mental health department, as opposed to 29.78% of
non-Appalachian facilities (p<0.0001). Proportionately fewer Appalachian facilities (69.14%) are
licensed or certified by the state substance abuse agency than non-Appalachian facilities (81.35%);
results are statistically significant (p<0.0001).
158
Table 5.3: Inpatient, Outpatient, and Non-Hospital Residential Care Offered at Substance
Abuse Treatment Facilities, 2005
Region
Appalachia
Non-Appalachia
p-value
N
%
N
%
Inpatient care located in or operated by a hospital
890
14.16
12,456
13.18
0.407
Inpatient substance abuse care offered
891
8.53
12,480
7.29
0.172
Inpatient detoxification care offered
891
7.74
12,480
6.13
0.0542
Any outpatient substance abuse care offered currently
891
83.28
12,479
80.66
0.0548
Outpatient detoxification offered
891
7.41
12,478
11.13
0.0006
Regular outpatient care offered
891
72.36
12,479
72.49
0.93
Intensive outpatient care offered
891
38.95
12,479
42.88
0.0217
Non-hospital residential substance abuse care
891
21.66
12,480
27.92
<0.0001
Non-hospital residential short-term treatment
891
8.19
12,480
12.07
0.0005
Non-hospital residential long-term treatment
891
16.05
12,480
23.17
<0.0001
Hospital Inpatient Care
Outpatient Care
Non-Hospital Residential Care
SOURCE: U.S. Dept. of Health and Human Services, Substance Abuse and Mental Health Services Administration, Office of
Applied Studies. National Survey of Substance Abuse Treatment Services (N-SSATS), 2005.
Table 5.3 describes the inpatient, outpatient, and non-hospital residential care services offered by
substance abuse treatment facilities in the Appalachian region and outside of Appalachia in 2005.
In Appalachia, proportionately fewer facilities offer outpatient detoxification (7.41%) as opposed to
facilities outside of Appalachia (11.13%). Approximately 38.95% of treatment facilities in
Appalachia and 42.88% of facilities outside of Appalachia offer intensive outpatient care. Results
are statistically significant (p<0.05). Non-hospital residential substance abuse care is provided in
proportionately fewer facilities in Appalachia (21.66%) than outside of Appalachian (27.92%).
About 8% of facilities in Appalachia offer non-hospital short-term residential treatment, less than
the 12% of facilities that offer this service outside of Appalachia. Long-term treatment is also
offered in proportionately fewer facilities in Appalachia (16.05%) than outside of Appalachia
(23.17%). Results are statistically significant (p<0.001).
159
Table 5.4 Counseling and Pharacotherapies Available at Treatment Facilities, 2005
Region
Appalachia
Non-Appalachia
p-value
N
%
N
%
Antabase
876
18.49
12,293
15.88
0.0417
Naltrexone
874
16.59
12,233
12.07
<0.0001
Campral
874
13.73
12,185
7.96
<0.0001
Methadone
874
8.24
12,270
9.94
0.103
Buprenorphine-Suboxone
871
8.15
12,190
7.85
0.75
Buprenorphine-Subutex
863
5.10
12,160
5.25
0.85
Pharmacotherapies Provided by Facility
SOURCE: U.S. Dept. of Health and Human Services, Substance Abuse and Mental Health Services Administration, Office of
Applied Studies. National Survey of Substance Abuse Treatment Services (N-SSATS), 2005.
Table 5.4 describes the pharmacotherapies provided by substance abuse treatment facilities in the
Appalachian region and outside of Appalachia in 2005. Naltrexone is provided at 16.59% in
Appalachian and 12.07% of facilities outside of Appalachia (p<0.0001). Almost 14% of
Appalachian treatment facilities provide Campral, compared to just under 8% of facilities outside of
Appalachia (p<0.0001).
160
Table 5.5 Services Available at Treatment Facilities, 2005
Region
Appalachia
Non-Appalachia
p-value
N
%
N
%
Substance abuse treatment
891
98.3
12480
98.2
0.719
Intake/ assessment/ referral
891
94.28
12,478
93.56
0.397
Assessment of mental health
847
51.59
11,918
44.66
<0.0001
Comprehensive substance abuse assessment
890
93.3
12434
93.0
0.793
After care counseling
875
80.3
12311
78.5
0.191
Substance abuse relapse prevention therapy
875
78.9
12325
81.4
0.062
Substance abuse individual therapy
888
95.6
12436
94.8
0.291
Substance abuse family counseling
886
83.07
12,309
76.19
<0.0001
Substance abuse group therapy
887
90.5
12403
90.3
0.842
SOURCE: U.S. Dept. of Health and Human Services, Substance Abuse and Mental Health Services Administration, Office of
Applied Studies. National Survey of Substance Abuse Treatment Services (N-SSATS), 2005.
As depicted in Table 5.5, there were statistically significant differences between Appalachian and
non-Appalachian facilities in terms of whether they offered assessment of mental health and
substance abuse family counseling (p<0.0001).
161
5.4.2 Figures
Facilities Offering Intpatient Detoxification
Services in Appalachia and Nationally
Figure 5.1: Facilities Offering
Inpatient Detoxification Services
100
90
Figure 5.1 shows that 19% of the 891
substance abuse treatment facilities in
Appalachian counties offered inpatient
detoxification services, as compared to
21.4% of the 12,480 substance abuse
treatment facilities in all other counties
nationally.
Percentage of Facilities
80
70
60
50
40
30
20
19
21.4
Appalachian Counties
Other Counties Nationally
The 2.4% difference between
Appalachian facilities and nonAppalachian facilities is not statistically
significant (p<0.085).
10
0
SOURCE: National Survey of Substance Abuse Treatment Services, 2005.
Figure 5.2: Primary Focus of Substance Abuse Facilities
In Appalachia, proportionately more
treatment facilities had a primary focus of
providing mental health services, a mix of
mental health services, and general health
care services than treatment facilities
outside of Appalachia. Fewer facilities in
Appalachia had a primary focus of
providing substance abuse treatment
services than outside of Appalachia.
Primary Focus of Facility in Appalachia and Nationally
100.0
Appalachian Counties
Other Counties
90.0
Percentage of Facilities
Figure 5.2 shows the primary focus of
substance abuse treatment facilities in
Appalachian counties versus all other
counties in the U.S. Treatment facilities
were asked: “What is the primary focus of
this facility?”
80.0
70.0
55.3% 62.6%
60.0
50.0
40.0
31.8% 26.3%
30.0
20.0
10.0% 7.8%
10.0
2.4% 1.8%
0.0
Substance
Abuse Treatment
Services
Mental Health
Services
Mix of Mental
Health and
Substance
Abuse Services
General Health
Care Services
SOURCE: National Survey of Substance Abuse Treatment Services, 2005.
About 2% of facilities in Appalachia and other counties nationally reported general health care
services as their primary focus. Results are statistically significant (p<0.0001).
162
Figure 5.3: Facilities Using a Sliding Fee Scale
Figure 5.3 shows that proportionately
fewer Appalachian substance abuse
treatment facilities (59.6%) offered a
sliding fee scale to clients than facilities
outside of Appalachia (64%).
Facilities Using a Sliding Fee Scale
in Appalachia and Nationally
100.0
90.0
Percentage of Facilities
80.0
70.0
The total number of Appalachian
facilities for this variable was 979. The
total number for facilities outside of
Appalachia was 12,343.
64.0%
59.6%
60.0
50.0
40.0
The difference between Appalachian
facilities and non-Appalachian facilities
is statistically significant (p<0.05).
30.0
20.0
10.0
0.0
Appalachian Counties
Other Counties Nationally
SOURCE: National Survey of Substance Abuse Treatment Services, 2005.
Figure 5.4: Facilities Offering Free or No Charge Treatment
Figure 5.4 indicates that proportionately
more substance abuse treatment facilities
in Appalachian counties offered free or no
charge treatment to clients who cannot
afford to pay, in comparison to facilities
in counties outside of Appalachia.
Slightly more than half of the facilities
(56.5% in Appalachia and 53.9% in other
counties nationally) offered free or no
charge treatment. Results were not
statistically significant at the 95%
confidence level.
Facilities Offering Free or No Charge Treatment in
Appalachia and Nationally
100.0
Percentage of Facilities
90.0
80.0
70.0
60.0
56.5%
53.9%
Appalachian Counties
Other Counties Nationally
50.0
40.0
30.0
20.0
10.0
0.0
SOURCE: National Survey of Substance Abuse Treatment Services, 2005.
163
Figure 5.5: Facilities that Accept
Medicare
Facilities that Accept Medicare in
Appalachia and Nationally
Figure 5.5 indicates that proportionately
more treatment facilities in Appalachian
counties accepted Medicare as payment
than facilities in other counties
nationally.
100.0
90.0
Percentage of Facilities
80.0
Of the 848 Appalachian facilities
responding to this item, approximately
47% reported accepting Medicare for
payment. About 35% of the 11,818
facilities in all other counties nationally
accepted Medicare.
70.0
60.0
50.0
46.7%
34.8%
40.0
30.0
20.0
10.0
The difference is statistically significant
at the 99% confidence level.
0.0
Appalachian Counties
Other Counties Nationally
SOURCE: National Survey of Substance Abuse Treatment Services, 2005.
Figure 5.6: Facilities that Accept Medicaid
Figure 5.7 shows that proportionately
more substance abuse treatment
facilities in Appalachian counties
accepted Medicaid than treatment
facilities in other counties nationally.
Facilities that Accept Medicaid
in Appalachia and Nationally
100.0
Percentage of Facilities
90.0
80.0
Of the 861 Appalachian facilities
responding to this item, approximately
70% reported accepting Medicaid for
payment. About 54% of the 12,027
facilities in all other counties
nationally accepted Medicaid.
69.6%
70.0
53.8%
60.0
50.0
40.0
30.0
20.0
The difference is statistically
significant at the 99% confidence
level.
10.0
0.0
Appalachian Counties
Other Counties Nationally
SOURCE: National Survey of Substance Abuse Treatment Services, 2005.
164
Figure 5.7: Facilities that Accept State Financed Health Insurance
Of the 809 Appalachian facilities
responding to this item, approximately
57% reported accepting state financed
health insurance for payment. About
39% of the 11,278 facilities in all other
counties nationally accepted state
financed health insurance. The
difference is statistically significant
(p<0.01).
Facilities that Accept State Financed Health
Insurance in Appalachia and Nationally
100.0
90.0
80.0
Percen tag e o f F acilities
Figure 5.7 demonstrates that
proportionately more substance abuse
treatment facilities in Appalachian
counties accepted state financed health
insurance than facilities in other counties
nationally. For this variable, a state
financed health insurance plan does not
include Medicaid. Examples of state
financed plans are the State Children's
Health Insurance Program and other
state financed high risk insurance pools.
70.0
60.0
50.0
38.87%
40.0
30.0
20.0
10.0
0.0
Appalachian Counties
Figure 5.8: Facilities that Accept
Private Health Insurance
Figure 5.8 shows that more substance
abuse treatment facilities in
Appalachian counties accepted private
health insurance than facilities in other
counties nationally.
100.0
90.0
79.08%
Percentage of Facilities
Other Counties Nationally
SOURCE: National Survey of Substance Abuse Treatment Services, 2005.
Facilities that Accept Private Health Insurance in
Appalachia and Nationally
80.0
67.5%
70.0
56.98%
60.0
Of the 870 Appalachian facilities
responding to this item, approximately
79.08% reported accepting private
health insurance for payment. About
67.5% of the 12,123 facilities in all
other counties nationally accepted
private health insurance. The difference
is statistically significant (p<0.01).
50.0
40.0
30.0
20.0
10.0
0.0
Appalachian Counties
Other Counties Nationally
SOURCE: National Survey of Substance Abuse Treatment Services, 2005.
165
5.5 Discussion
In presenting our discussion of the findings for this chapter, we again want to recognize that the NSSATS has limitations as a data source for this study. Due to the voluntary nature of the survey and
differences in reporting practices within states, it is difficult to ascertain the reliability of the data.
Despite the limitations of the survey, the N-SSATS is the only survey that explores substance abuse
treatment services and practices at the facility level. Thus, we view the N-SSATS as a limited, yet
important data source for this study of substance abuse and mental health issues, and access to
treatment in Appalachia.
Our study found that the primary focus area of the majority of substance abuse treatment facilities
was providing substance abuse treatment services only, rather than a mix of services. Even so, this
was less likely to be the case among Appalachian facilities, with 55% listing substance abuse
treatment only as their primary focus area, compared to approximately 63% for facilities nationally.
In contrast, Appalachian substance abuse treatment facilities were more likely to list mental health
treatment and a mix of substance abuse treatment and mental health treatment as the primary focus.
Unique barriers to accessing treatment in the Appalachian region, such as distance and lack of
public transportation, may provide the impetus for facilities to offer a broader array of co-located
services.
A consistent finding from this chapter is that Appalachian facilities are significantly less likely than
non-Appalachian facilities to use a sliding fee scale (p<0.01). However, analyses also show a
significantly greater acceptance of government financed payment sources including Medicare,
Medicaid, and state financed insurance (p<0.01). While proportionately more facilities accept these
payment sources, we do not know the breadth of coverage within the region. Similarly,
proportionately more Appalachian facilities accept private health insurance (p<0.05), but the
breadth of coverage is also unknown. Future studies analyzing cost and insurance issues within the
Appalachian region could provide more specificity in terms of facility rationale, breadth of
coverage, and service implications.
In terms of facility ownership, we found that the majority of substance abuse treatment facilities in
Appalachia and outside of Appalachia are owned by private non-profit organizations.
Proportionately, more Appalachian facilities are owned by the local, county or community
government, state government, or federal government than facilities outside of Appalachia.
Of our findings related to the characteristics of services provided at treatment facilities, we found
that more Appalachian treatment facilities are licensed or certified by a public health department
than non-Appalachian treatment facilities (p<0.001), and more Appalachian facilities receive public
funds than non-Appalachian facilities (p<0.01).
More than 98% of Appalachian facilities offered substance abuse treatment. More Appalachian
facilities offered assessment of mental health and substance abuse family counseling than nonAppalachian facilities, and the differences are statistically significant (p<0.01).
166
Future studies on substance abuse
and mental health issues in
Appalachia would benefit from
better data at the substance abuse
treatment facility level. The NSSATS does provide important
information about the types of
services offered in facilities – for
example, that Appalachian facilities
are more likely to accept payment
from Medicare, Medicaid, state
financed health insurance, and
private insurance. However, the NSSATS does not provide data on
other potentially useful topics such
as wait-listing practices at different
types of substance abuse facilities
(residential, inpatient, and
outpatient), cost of different services,
and expected source of payment.
Upon review of our findings for this
chapter, the Coalition on Appalachian Substance Abuse Policy (CASAP) suggested a brief
consumer-oriented telephone survey of facilities within Appalachia in order to gather some of these
data elements. While the suggested survey activity is outside the scope of this study, such an effort
would be beneficial to future studies of substance abuse at the facility level. Furthermore, efforts to
augment the data available at the substance abuse treatment facility level would provide new
opportunities to explore trends within the Appalachian region, and across the nation.
Contrary to feedback from CASAP, according to staff at the Office of Applied Studies (OAS)
(Alderks, 2008: through personal communication), the completeness of coverage of N-SSATS
should have very little to do with state registration policies. Each year OAS and its data contractor
perform augmentation activities using various directories such as the American Business Index and
the American Hospital Association survey files in an effort to locate any unknown substance abuse
treatment facilities. All identified and known facilities are then sent a survey at the location level.
For example, a network of 15 facilities would receive 15 questionnaires, one for each facility
location. In some cases, client count numbers may be combined for a few facilities, but it is known
which facilities are included in those combined numbers. This would affect only information
determining size of facility, not characteristics about services provided by the facility.
167
CHAPTER 6: Substance Abuse and Mental Health – A Comparison of Appalachian Coal
Mining Areas to Other Areas within the Appalachian Region
6.1 Introduction
A key geographic and economic feature of the Appalachian region is that a large proportion of the
region is coal producing. The coal mining industry has long been a vital part of the economy of
Appalachia and remains a major industry within the region. Many residents of the Appalachian region
are employed in the coal mining industry or are employed in other industries that depend upon coal
mining for their business.106 It has been reported in major news media that, with per-ton prices
doubling in the past six years, mining is currently more profitable than any other time in the past
generation. This has led to a coal boom, which has provided economic opportunity for many workers
within the region, but has also been clouded by an increase in drug use, as reported by the media. The
media’s poignant stories about drug use in coal mining areas have cited abuse of painkillers,
methadone overdoses, and addiction OxyContin107 as major problems. Standard national estimates
comparing major occupational groups indicate that people in occupations involving heavy physical
labor tend to use substances more,108,109 yet workers in the coal mining industry have been reported as
having only average prevalence of past month illicit drug use among major occupational groups.110 In
addition to these seemingly contradictory results in media reporting and available research, questions
also remain as to whether mining-concentrated areas feature differently in terms of treatment services
access and health care utilization. This is an area in need of further study.
“The abuse and misuse of painkillers is the worst I have seen in the 16 years I have worked
narcotics in this area,” said Lt. Richard Stallard of the Big Stone Gap police department, director
of the Southwest Virginia Drug Task Force.111
Experts say that whatever ground was gained against the illegal use of OxyContin is being lost,
engulfed in a widening cycle of abuse that extends to pain-killers, antidepressants and other
prescription drugs.
Washington Post, January 13, 2008
In this chapter, we conduct statistical analyses of data systematically collected by two agencies within
the U.S. Department of Health and Human Services – the Substance Abuse and Mental Health
Services Administration (SAMHSA) and the Agency for Healthcare Research and Quality (AHRQ).
We focus exclusively on the Appalachian region with the objective of comparing coal mining areas
and other areas with respect to substance abuse and mental health status and access to the treatment
services. The key research question for this chapter is: Do coal mining areas within Appalachia differ
from other Appalachian areas in terms of the composition of patients admitted to specialty treatment
services or discharged from community hospitals?
6.2 Data and Analytic Samples
Data sources utilized in this chapter are the current National Coal Resources Data System (NCRDS)
from the U.S. Geological Survey, the Health Care Utilization Project’s (HCUP) National Inpatient Stay
(NIS) data set from AHRQ, and the Treatment Episode Data Set (TEDS).
Coal Mining Counties
We first identified the coal mining counties within the Appalachian Region by merging the coal
mining area coverage data from the NCRDS with the list of the Appalachian counties described by the
Appalachian Region Commission (ARC) as of 2006. Among the 410 Appalachian counties, 176
counties were identified as being located in the coal mining area (see Figure 6.1).
Figure 6.1 Coal Mining Area in the Appalachian Region
Source: National Coal Resources Data System, U.S. Geological Survey.
Community Hospital Discharges
The first analytic sample for this chapter includes all adult discharges from community hospitals within
the Appalachian Region. There are a total of 167,957 admissions included in the analytic sample,
including 76,083 (45.3%) from 25 coal mining counties and 91,874 (54.7%) from 20 other counties in
the Appalachian region.18
Admissions to Substance Abuse Treatment Services
The second analytic sample for this chapter includes all admissions to substance abuse treatment
services in Appalachian Region from 2000-2004. Among the 195 counties covered by the Treatment
Episode Dataset (TEDS) in 2000-2004, 86 counties were located in the coal mining area. Overall there
were 211,380 admissions from the coal mining area and 299,837 admissions from other areas in the
Appalachian region.
18
Hospitals in five states with unknown county locations are excluded.
169
6.3 Results
A series of univariate and bivariate analyses were performed. Chi-square statistics were used to assess
the statistical significance of the associations. Major findings from the HCUP NIS community hospital
discharge sample are listed below (see Table 6.3):
Proportionately, there were more females among admissions in the coal mining area of
Appalachia (62.4%) than in other areas of Appalachia (57.9%).
Patients admitted to coal mining area hospitals were older that patients elsewhere.
More than four-fifths of the admissions in the coal mining areas were among patients whose
household incomes were less than $35,000, while only slightly more than half of the
admissions in other areas were from this income group.
While less than 10 percent of admissions (7.34%) from non-coal-mining areas were in
distressed or at-risk counties, more than two-thirds (67.59%) of admissions from the coalmining areas were in distressed or at-risk counties. None of the coal-mining area in Appalachia
included competitive or attainment counties.
Proportionately more admissions in coal mining areas (56.82%) than admissions in other areas
(51.35%) came through the Emergency Room (ER).
In 2004, 26.84 percent of hospital stays for adults in Appalachian coal mining area community
hospitals and 27.36 percent in community hospitals located in other Appalachian areas were
related to MH/SA disorders.
The rate of substance abuse-related disorders among all diagnoses was lower in community
hospitals in coal mining areas (5.80%) than in other areas (6.13%).
The most common MH/SA disorders seen among hospital stays in coal mining area community
hospitals were mood disorders (11.15%), delirium/dementia (6.28%), substance-related
disorders (5.80%), anxiety disorders (5.72%), and schizophrenia (1.89%). The most common
MH/SA disorders seen in hospital stays in non-coal mining area community hospitals were
mood disorders (13.32%), substance-related disorders (6.13%), delirium/dementia (5.64%),
anxiety disorders (5.46%), and schizophrenia (2.23%).
Among the MH/SA diagnoses, about 10 percent were co-occurring SA and MH diagnoses,
accounting for 9.46% of diagnoses in coal mining areas and 13.32% of diagnoses in non-coal
mining areas.
Major findings from the Substance Abuse Treatment Services Sample from TEDS are listed
below:
Demographic Characteristics (see Table 6.4)
170
Females made up 32.48 percent of admissions in coal mining areas and 29.94 percent of
admissions in other areas.
Overall, people less than 24 years of age accounted for more admissions in coal mining areas
(32.89%) than other areas (29.59%).
Proportionately, fewer admissions were made by full-time employed workers in coal mining
areas (19.67%) than other areas (29.21%). Conversely, more admissions were made by
unemployed persons in coal mining areas (39.28%) than other areas (29.98%).
The majority of admissions were in transitional counties (59.1% in coal mining areas; 62.27%
in other areas). Coal mining areas had proportionately more admissions (29.42%) in distressed
or at-risk counties than other areas (5.62%), and fewer admissions (11.48%) in competitive or
attainment counties than other areas (32.1%).
Treatment Service Related Characteristics (see Table 6.5)
There were no significant differences between coal mining area admissions and admissions in
other areas related to most types of insurance coverage; rates of private health insurance, Blue
Cross/Blue Shield, Medicare, Medicaid, and Health Maintenance Organization (HMO)
coverage were all similar. However, while 30.47 percent of admissions in the coal mining area
were made by people without any health insurance, more than half (52.36%) of the admissions
were made by people without any health insurance in other areas of Appalachia.
Proportionately, more admissions were paid by “other” insurances in coal mining areas
(33.01%) than other areas (12.01%).
The most prevalent service setting for substance abuse treatment was non-intensive outpatient
ambulatory services in both the coal mining areas (57.53%) and other areas (60.01%).
Proportionately, fewer admissions were self-referrals in coal mining areas (22.12%) than other
areas (26.41%); proportionately more admissions were referred by court/criminal justice
systems in coal mining areas (39.73%) than other areas (35.07%).
Less than 15% of coal mining area admissions were paid by individuals themselves, while fourfifths of the admissions in other areas were paid by individuals themselves; proportionately
more admissions in coal mining areas were made by government payments other than Medicaid
and Medicare (36.40%) than admissions in other areas (22.46%).
Primary, Secondary, and Tertiary Reasons for Substance Abuse Treatment Services (see Table 6.6)
The primary reason for seeking substance abuse treatment in Appalachia was alcohol use,
although less so in coal mining areas (45.58%) than other areas within Appalachia (53.01%).
Heroin use as a primary, secondary, or tertiary reason for treatment accounted for
proportionately more admissions in coal mining areas (10.34%) than for other areas within
Appalachia (7.04%).
171
Trends of Heroin Use and Other Opiates or Synthetics Use in Appalachian Coal Mining Areas and
Other Areas within the Region
In 2000, admissions for heroin use represent 5.84 percent of TEDS admissions in the coal
mining area in Appalachia and 5.71 percent of TEDS admissions in other Appalachian areas.
While admissions rates increased steadily over the 2000-2004 period for both the coal mining
and non-coal mining areas, admissions rates in coal mining areas increased to a proportionately
higher level. By 2004, heroin admissions accounted for 14.59 percent of the TEDS admissions
in coal mining areas and 9.25 percent in other areas (see Table 6.1).
Table 6.1: Trend of Heroin Use as Primary, Secondary, or Tertiary Reason for Treatment, by Coal
Mining Status of Patient Location
2000
2001
2002
2003
2004
p-value
Coal Mining Area
5.84
7.16
9.43
12.95
14.59
<.0001
Other Area
5.71
6.07
6.66
7.76
9.25
<.0001
16
14
12
10
Coal Mining Area
8
Other Area
6
4
2
0
2000
2001
2002
2003
2004
Source: Office of Applied Studies, Substance Abuse and Mental Health Services Administration, Treatment Episode Data
Set (TEDS), 2000 – 2004.
In 2000, admissions for other opiates or synthetics use represented 8.41 percent of TEDS
admissions in the coal mining area of Appalachia and 4.50 percent of TEDS admissions in
other Appalachian areas. These percentages increased steadily over the 2000-2004 period for
both coal mining and non-coal mining areas. By 2004, admissions for other opiates or
synthetics accounted for 15.67 percent of the TEDS admissions in coal mining areas and 9.94
percent in the other areas (see Table 6.2).
172
Table 6.2: Trend of Other Opiates or Synthetics Use as Primary, Secondary, or Tertiary Reason for
Treatment, by Coal Mining Status of Patient Location
2000
2001
2002
2003
2004
p-value
Coal Mining Area
8.41
11.64
12.37
15.23
15.67
<.0001
Other Area
4.50
6.28
7.21
8.63
9.94
<.0001
18
16
14
12
10
Coal Mining Area
Other Area
8
6
4
2
0
2000
2001
2002
2003
2004
Source: Office of Applied Studies, Substance Abuse and Mental Health Services Administration, Treatment Episode Data
Set (TEDS), 2000 – 2004.
6.4 Conclusion
Our studies in previous chapters find that the percentage of admissions with heroin use and other
opiates or synthetics use as the primary, secondary or tertiary reason for treatment is significantly
higher in the Appalachian region, as compared to the rest of the nation. The study in this chapter adds
granularity to these findings by demonstrating that coal mining areas within the Appalachian region
demonstrate higher rates of both heroin use and other opiates or synthetics use as the primary,
secondary or tertiary reason for treatment, as compared to other areas within the region. Furthermore,
while studies in previous chapters show that rates of both heroin and other opiates and synthetics as
primary reasons of coming to treatment increased over the 2000-2004 period, the pace of these rate
increases is even faster in coal mining areas than in other areas within the Appalachian region.
Other illicit drug use and non-medical use of prescription drugs are also cited more as the primary,
secondary or tertiary reasons for treatment in coal mining areas than in other areas. As coal mining
areas have been found also to have a higher proportion of admissions paid for by government sources
instead of self-payment, substance abuse problems have likely required more government resource
investment in these areas as compared to elsewhere within the Appalachian region.
173
Our coal mining area was defined as the area with subsurface filled with coal instead of the actual coalproducing counties. The 176 coal mining counties retrieved thus covered not only the 118 coalproducing counties defined by the Appalachian Regional Commission in 2001 but also some closelyadjacent lands with coal mines as located by the National Coal Resource Data System.112 The results
should also be interpreted with caution because the units of analyses were admissions to treatment or
hospital discharges made by people living in this area rather than actual coal miners.
In this study, we compared the coal mining area with other areas in Appalachia overall. Future studies
could explore the coal mining area further by studying patterns across groups of similar counties. For
example, analyses could focus on patterns in the northern, central and southern regions of Appalachia.
These geographic sub-regions, used by the Appalachian Regional Commission, were employed in the
previous analytic chapters to investigate patterns in Appalachia. Analyses based on the Appalachian
sub-regions may be of special benefit to analysis of coal mining areas since the northern, central, and
southern regions of Appalachia had, notably, different levels of production for different types of coal,
both in the past and, predictably, will in the future as well.113
Figure 6.2 Coal Mining Appalachian Sub-Regions
SOURCE: Berge, M. and Thompson, E. (2001).
A Study on the Current Economic Impacts of the
Appalachian Coal Industry and Its Future in the
Region. Washington, D.C.: Appalachian
Regional Commission.
174
Table 6.3: Characteristics of Hospital Stays in Community Hospitals in the Appalachian Region,
Adults Aged 18 or Older, by County Coal Mine Status
Characteristics of Hospital Stays (N=167,95719) in
Community Hospitals, Adults, Aged 18 or older
Appalachian Coal
Mining Counties
Other
Appalachian
Counties
p-value
Number of hospital stays
76,083
91,874
Female (%)
62.42
57.91
<0.0001
18 – 44
28.22
24.89
<0.0001
45 – 64
27.48
26.71
65 – 79
26.43
27.71
80 or older
17.87
18.69
$1 - $35,999
87.36
51.63
$36,000 - $44,999
9.01
33.86
$45,000 - $58,999
3.24
12.59
$59,000 or more
0.40
1.92
Distressed
38.47
3.17
At-Risk
29.12
4.17
Transitional
32.41
51.05
Competitive
0
8.54
Attainment
0
33.08
Large metropolitan
0.38
1.13
Small metropolitan
26.95
40.98
Micropolitan
21.25
35.99
Non-core
51.42
21.90
ER as Admission Source (%)
56.82
51.30
<0.0001
At least one MHSA Diagnosis (%)
26.84
27.36
0.0186
Substance-related disorders (%)
5.80
6.13
0.0045
5.72
5.46
0.02
Age (%)
Household Income (%)
<0.0001
Economic Development Level (%)
<0.0001
Patient Location (%)
<0.0001
20
Mental Health (%)
Anxiety disorders
19
The following five Appalachian states were not included due to the lack of the county identifiers in the data: Ohio,
Tennessee, Georgia, Kansas, South Carolina.
20
Only selected diagnoses are included. Multiple diagnoses can be marked for the same admission.
175
Characteristics of Hospital Stays (N=167,95719) in
Community Hospitals, Adults, Aged 18 or older
Appalachian Coal
Mining Counties
Other
Appalachian
Counties
p-value
6.28
5.64
<0.0001
Development disorders
0.72
0.92
<0.0001
Mood disorders
11.15
13.32
<0.0001
Personality disorders
0.23
1.52
Schizophrenia and other psychotic disorders
1.89
2.23
<0.0001
Screening and history of mental health and
11.01
10.20
<0.0001
9.46
11.89
<0.0001
Delirium, dementia, and amnestic and other
cognitive disorders
substance abuse disorders
Comorbidity among MHSA admissions
Table 6.4: Characteristics of Admissions to Substance Abuse Specialty Treatment in the
Appalachian Region, by County Coal Mine Status, 2000-2004
Appalachian Coal
Mining Counties
Characteristics of Admissions to Substance Abuse
Specialty Treatment (N=511,217)
Other
Appalachian
Counties
p-value
Number of Admissions
211,380
299,837
Female (%)
32.48
29.94
<0.0001
17 or younger
11.33
9.86
<0.0001
18 – 24
21.56
19.73
25 – 34
26.08
26.24
35 – 44
26.37
28.05
45 or older
14.66
161.2
Less than High School
39.95
40.50
High School
43.32
41.82
More than High School
16.72
17.68
Full-time
19.67
29.21
Part-time
6.23
6.26
Unemployed
39.28
28.98
Not in labor force
34.81
35.54
Age (%)
Education (%)
<0.0001
Employment Status
176
<0.0001
Appalachian Coal
Mining Counties
Characteristics of Admissions to Substance Abuse
Specialty Treatment (N=511,217)
Other
Appalachian
Counties
p-value
Race
White
84.27
83.43
Black
14.94
14.12
Other
0.79
2.45
Never married
55.68
52.83
Now married
17.34
19.14
Separated
7.88
8.07
Divorced/widowed
19.10
19.96
Northern
55.80
45.60
Central
22.82
4.34
Southern
21.38
50.06
Distressed
18.65
3.09
At-risk
10.77
2.53
Transitional
59.10
62.27
Competitive
2.27
20.87
Attainment
9.21
11.23
<0.0001
Marital Status
<0.0001
Sub-Region (%)
<0.0001
Economic Development (%)
<0.0001
Source: Office of Applied Studies, Substance Abuse and Mental Health Services Administration, Treatment Episode Data
Set (TEDS), 2000 – 2004.
177
Table 6.5: Treatment-Related Characteristics of Admissions to Substance Abuse Treatment in
the Appalachian Region, by County Coal Mine Status, 2000-2004
Appalachian
Coal Mining
Counties
Treatment-Related Characteristics of Admissions to
Substance Abuse Treatment
Other
Appalachian
Counties
p-value
<0.0001
Health Insurance21
Private
9.58
10.35
BC/BS
5.57
5.64
Medicare
2.03
1.38
Medicaid
16.15
15.51
HMO
3.19
2.76
Other
33.01
12.01
None
30.47
52.36
Detoxification: Hospital inpatient
0.79
1.75
Detoxification: Freestanding residential
6.98
14.83
Rehabilitation/residential: Hospital
0.27
0.05
Rehabilitation/residential: Short-term
9.24
9.04
Rehabilitation/residential: Long-term
5.36
3.96
Ambulatory: Intensive outpatient
19.76
10.26
Ambulatory: Non-intensive outpatient
57.53
60.01
Ambulatory Detoxification
0.08
0.10
Individual
22.12
26.41
ADA care provider
14.66
15.86
Other health care provider
8.29
11.28
School
1.75
1.81
Employer/EAP
0.67
0.93
Other community reference
12.77
8.64
Court/criminal justice
39.73
35.07
No prior treatment
44.21
48.76
1 -2 prior treatment
32.71
32.75
3 or more prior treatment
19.08
18.49
Service Setting
<0.0001
Primary Source of Referral
<0.0001
Number of Prior Treatment (%)
21
<0.0001
A total of 236,800 records in the Appalachian Region during the 2000-2000.274 did not have the insurance information.
178
Appalachian
Coal Mining
Counties
Treatment-Related Characteristics of Admissions to
Substance Abuse Treatment
Other
Appalachian
Counties
p-value
<0.0001
Primary Source of Payment (%)
Self pay
14.44
40.96
B/BS/Other health insurance
10.14
10.14
Medicare/Workmans Comp
1.53
1.06
Medicaid
17.72
13.22
Other government payments
36.40
22.46
No charge
4.10
4.12
Other
15.66
8.03
Source: Office of Applied Studies, Substance Abuse and Mental Health Services Administration, Treatment Episode Data
Set (TEDS), 2000 – 2004.
179
Table 6.6: Substance Abuse Characteristics of Admissions to Substance Abuse Treatment in the
Appalachian Region, by County Coal Mine Status, 2000-2004
Appalachian
Coal Mining
Counties
Substance Abuse Characteristics of Admissions to
Substance Abuse Treatment22
Other
Appalachian
Counties
p-value
195,409
291,553
Alcohol use
45.58
53.01
<0.0001
Marijuana use
17.78
16.49
<0.0001
Cocaine use
13.17
11.62
<0.0001
Heroin use
8.62
5.56
<0.0001
Other opiates or synthetic drug use
7.49
4.19
<0.0001
Methamphetamine/other stimulant use
2.08
3.19
<0.0001
Tranquilizers use
1.23
0.75
<0.0001
Sedatives use
0.44
0.32
<0.0001
Other hallucinogens use
0.26
0.16
<0.0001
Inhalants use
0.14
0.13
=0.403
Phencyclidine use
0.04
0.02
=.0004
Other
0.74
2.82
<.0001
Number of admissions
Primary Reason for Admission to Treatment (%)
Primary, Secondary, or Tertiary Reason for Admission to Treatment (%)
Alcohol use
63.98
67.87
<0.0001
Marijuana use
39.45
36.59
<0.0001
Cocaine use
25.47
23.26
<0.0001
Heroin use
10.34
7.04
<0.0001
Other opiates or synthetic drug use
12.92
7.25
<0.0001
Methamphetamine/other stimulant use
4.18
5.40
<0.0001
Tranquilizers use
5.47
3.16
<0.0001
Sedatives use
1.45
1.10
<0.0001
Other hallucinogens use
1.29
0.95
<0.0001
Inhalants use
1.17
0.93
<0.0001
Phencyclidine use
0.15
0.09
<0.0001
Other
1.82
3.93
<0.0001
Source: Office of Applied Studies, Substance Abuse and Mental Health Services Administration, Treatment Episode
Data Set (TEDS), 2000 – 2004.
22
Analyses in this table are based on 486,962 admissions because of the missing information on substance abuse for 24,255
cases.
180
CHAPTER 7: Case Study Analysis of Disparities in Mental Health Status
and Substance Abuse Prevalence in the Appalachian Region and Access
to Mental Health and Substance Abuse Treatment Services
Prepared By:
Michael S. Dunn, PhD
Department of Public Health
East Tennessee State University
&
Kristine Harper Bowers
Office of Rural and Community Health
and Community Partnerships
East Tennessee State University
181
7.1 Introduction
To supplement the quantitative findings presented in the previous chapters, NORC and East Tennessee
State University conducted case studies using a “Socioeconomic Twins” methodology. The studies
were purposively selected and bracketed with “twin” counties in Kentucky, Virginia, and West
Virginia. Two counties in each state were selected that were socioeconomically similar, yet varied on
measures of substance abuse and mental health. An in-depth discussion of the selection process is
provided below. The case study approach provides for a comprehensive understanding of a complex
instance or instances that is acquired by extensive description and analysis. Appropriate selection is
crucial to internal consistency and the plausible comparison of the evidence in context. One unique
feature of case studies is that data is concurrently collected and analyzed leading to “thick”
descriptions from multiple data sources, particularly first hand observations.
The goals of the case studies were to:
Determine if community perceptions of substance abuse/mental health (MH/SA) issues match
available data;
Identify additional data sources used at the community level;
Learn first hand about the community’s response to substance abuse and mental health
concerns including statistical presentations of local data; and
Identify potential explanations for variance in community MH/SA indicators.
The purpose of the study was to determine the extent of local assessments of the mental health and
substance abuse situation as well as the perceived validity of nationally available quantitative data to
serve as an index of the severity of local substance abuse prevalence, mental health status and access to
treatment services.
7.2 Case Study Process
ETSU and NORC developed and piloted a five phase process for the socioeconomic twins case study:
1. Identification of potential data sets/sources using a Dephi process.
2. Selection of the 6 paired Appalachian counties using a socio-economic twins methodology.
3. On-site focus group and key informant interviews with community leaders to:
o Respond to secondary data identified by NORC that led to the initial selection of the
county with respect to accuracy, reliability and validity of how the standard measures
reflected the nature of the community’s issues; and
o Assess overall impressions of substance abuse and mental health problems including
community issues, systems capacities, recent incidents and community reaction and
response to the research issues.
4. Development of a community resource inventory to identify available services for prevention
and treatment.
5. Development of key findings based on an analysis of the textural data derived from the
interviews and focus groups. Using an induction method the analysis focused on the
organization of broad conceptual categories and then more refined coding for underlying
themes. Finally, the textural data was triangulated with secondary data profiles, and county
descriptors with researcher’s field notes to produce an understanding of the incidence of and
182
explanation for disparities in mental health status, substance abuse prevalence and access to
treatment services in these Appalachian communities.
The following sections describe the identification of potential data sources, selection of the pairs of
counties for the case study, descriptions of each pair of case study sites, the community responses to
the county data profiles and focus group/key informant interview questions, and conclusions. The
tables include county model programs, strength and treatment gaps, and in-depth descriptions of the
model programs listed.
7.3 Phase 1: Identification of Potential Data Sets/Sources
A Delphi process with an expert panel was used to identify the data elements they considered to be
most useful as key indicators in differentiating levels of substance use/abuse in Appalachian
communities. The Delphi process created another tier of possible or ideal data sources.
In late spring of 2007, the following two questions were emailed to members of the Coalition on
Appalachian Substance Abuse Policy (CASAP), a regional coalition of substance abuse practitioners,
educators and researchers:
1. What do you believe are the most critical data elements (indicators) needed in determining
high/low substance use/abuse in a community (list as many as appropriate)?
2. How readily available and reliable are these data elements (indicators)?
CASAP members were given two weeks to reply to Round One of the Delphi process. Round Two
consisted of CASAP members ranking each data element received in Round One as: 1 = very
important; 2 = somewhat important; or 3 = not important. From the Delphi process, the following
substance use/abuse indicators were identified.
Socio-economic status
Poverty rates
Per capita incarceration rate for drug offense
Substance abuse related arrests per capita/1,000
Drunk & impaired driving arrests
Suicide rate
Overdose death rates
Child abuse and neglect reports
Drug related child protective services interventions/ social service investigations
Birth certificate data on maternal smoking and substance abuse
Prescription rates of abused drugs
Service utilization rates for substance abuse /mental health treatment
Mortality from alcohol or drug related causes
Accident rates from AOD related causes
Substance abuse screening tests conducted by schools and employers
Behavioral Risk Factor Survey
183
Once identified, data sets and elements were analyzed by the NORC team to assess sources available
across the Appalachian region that could be integrated into community profiles for use in case study
analyses.
7.4 Phase 2: Selection of Pairs of Counties for Case Study
This section describes the process used to select pairs of counties for inclusion in the qualitative
component of this study. Counties were ranked in terms of socio-demographic characteristics and
substance abuse and mental health characteristics. Databases of counties were developed accordingly.
The objective was to select pairs of counties that are similar in terms of socio-demographic
characteristics, but relatively dissimilar overall in terms of their mental illness and substance abuse
indicators, medical care, and mental health professional shortage area statuses, using existing or
derived measures. Selection involved a three step process:
1. Pertinent measures were identified and retrieved as the source variables;
2. Statistical procedures were performed and matrices developed to calculate socio-demographic
similarity/dissimilarity and MH/SA similarity/dissimilarity for all Appalachian counties within
each state. Then, these “distance matrices” were transformed into pairs which were
subsequently ranked and sorted based on the distance values; and
3. Selection criteria were set up to identify pairs that were socio-demographically similar, but
dissimilar on MH/SA indicators, and the final pairs were selected accordingly.
Data Sources
Measures utilized for the case study analyses were primarily from three major sources: the
Appalachian Regional Commission (ARC); the Area Resource File (ARF); and the National Survey on
Drug Use and Health (NSDUH).
1. County-level Socio-demographic Characteristics
The following county-level measures of socio-demographic characteristics are selected as the basis
upon which to compare the similarities among counties.
a.
b.
c.
d.
e.
f.
The 2003 population size estimates are from the 7/1/2003 County Population Estimates File
for Internet Display from the U.S. Bureau of the Census.
The 2000 population density per square mile estimates are from the 2000 Census.
The 2000 percentage of urban population is from the 2000 Census.
The 2003 Urban Influence Codes divide the counties, county equivalents, and the
independent cities in the U.S. into 12 groups based on population and commuting data from
the 2000 Census of the population, in the case of Metropolitan counties, and adjacency to
metro area in the case of non-metropolitan counties. 23
The 2000 median home value is from the 2000 census.
The 2004 economic development level codes are provided by the Appalachian Regional
Commission.
23
The codes were originally from the U.S. Department of Agriculture’s Economic Research Service (ERS) website at
http://www.ers.usda.gov/Data/UrbanInfluenceCodes/ .
184
2. County-level Substance Abuse, Mental Health, and Service Delivery Statuses
The selected measures24 and their original sources are listed in the following:
a. Alcohol abuse or dependence in past year is from the 2002-2004 pooled National Survey on
Drug Use and Health.
b. Abuse or dependence of any illicit drugs in past year is from the 2002-2004 pooled National
Survey on Drug Use and Health.
c. Non-prescription use of painkillers in past year is from the 2002-2004 pooled National Survey
on Drug Use and Health.
d. The percentage of persons having serious psychological distress problems in past year is from
the 2002-2004 pooled National Survey on Drug Use and Health.
e. The percentage of persons in correctional or juvenile institutions in past year is calculated
using measures from the Area Resource File
f. The percentage of persons in mental health hospitals or institutions is calculated using
measures from the Area Resource File
g. The suicide rate is calculated using the average numbers of suicides in the past three years and
population size from the Area Resource File.
h. An index on the Health Professional Shortage Area status is created based on two measures –
the 2003 codes for Health Professional Shortage Area (HPSA) for Primary Medical Care114 and
the 2003 codes for Health Professional Shortage Area (HPSA) for Mental Health.115 Both were
originally from the Bureau of Primary Health Care (BPHC) and are available in the Area
Resource File.
Measuring the Similarities of County Pairs
The similarities between counties in terms of various pertinent county-level characteristics are
measured quantitatively using the DISTANCE procedure in the Statistical Analysis System (SAS).
Distance matrices are constructed to list the degree of similarity among all possible pairs of counties
within each state116 based on source variables listed earlier. To address the potential issue that variables
with large variances tend to have more of an effect than those with small variances, input variables
with different measurement levels (interval, ordinal) have been taken into account through
standardization before the similarity measures are computed. In order to rank the pairs of counties, the
matrices are then transformed into a rectangular data structure in which all county-pairs are listed one
by one within each state. The distance matrices were obtained separately through socio-demographic
characteristics and through the substance abuse, mental health and service coverage measures. As a
result of this procedure, two ranking indexes were created, namely, soc_rank and samh_rank,
indicating the socio-demographic and substance abuse and mental health related similarities,
separately. The lower the value from the ranking index, the more similarities the pair of counties
shared.
24
More measures were considered, including: cigarettes use, binge drinking, past month marijuana use, perceptions of risks
of drinking and smoking from household surveys. After preliminary statistical analyses to identify patterns of variations
(i.e., via factor analysis), these variables were dropped from being used to construct the similarity matrices.
185
Composite Ranking Scale and Selection of Final Pairs
We calculated a composite ranking scale by subtracting soc_rank from samh_rank. The resulting value
was used to rank pairs of counties in such a way that the higher value would indicate greater
dissimilarity on substance abuse and mental health related measures and greater similarity on sociodemographic characteristics. Through the composite ranking scale, three or four pairs of counties from
each of the Appalachian states were selected as the candidates of case study sites (see Table 7.1).
After conferring among all NORC team partners, the top three pairs from Kentucky, Virginia, and
West Virginia, with each pair having the highest composite ranking scale score in the corresponding
state, were selected as the final sites for the case studies. Counties ultimately selected for inclusion in
the study were:
Monroe County and Hardy County from West Virginia;
Bland County and Bath County from Virginia; and
Wayne County and Morgan County from Kentucky.
186
The detailed county-pairs selected at the final stage from the 11 Appalachian States are listed in the
following. 25
Table 7.1. Selected Four Pairs of Counties Per State in the Appalachian Region
Based on the Composite Ranking Score
County Pairs
County 1
County 2
Distance
SocSAMH
demo
Index Rank
SocSAMH
demo
Composite
Rank
Alabama
Tallapoosa
Talladega
Lawrence
Georgia
Talladega
Marshall
Chilton
0.09399
0.10589
0.07074
0.63828
0.60212
0.53362
58
75
25
662
651
575
604
576
550
Stephens
Jackson
Jackson
Kentucky
Chattooga
Gilmer
Fannin
0.086763
0.061062
0.091484
0.60025
0.46431
0.52175
76
34
86
654
579
617
578
545
531
Wayne
Morgan
Morgan
Mississippi
Morgan
Monroe
Adair
0.041546
0.059565
0.037319
0.52521
0.50804
0.48774
23
42
19
1206
1172
1115
1183
1130
1096
Montgomery
Winston
Noxubee
Winston
New York
Chickasaw
Montgomery
Montgomery
Tippah
0.09058
0.08435
0.12209
0.12187
0.64941
0.49241
0.4788
0.46412
11
10
22
21
266
245
242
240
255
235
220
219
Chautauqua
Allegany
Tioga
Steuben
Cattaraugus
Allegany
Tioga
Cattaraugus
North Carolina
0.56845
0.19801
0.41395
0.17875
0.15715
0.60495
0.0828
0.53048
84
21
68
16
14
87
4
73
70
66
64
57
Surry
Yadkin
Davie
Surry
Ohio
Rutherford
Madison
Alexander
McDowell
0.04658
0.05974
0.06306
0.10259
0.65497
0.64618
0.62176
0.67956
10
14
16
48
386
377
366
395
376
363
350
347
Morgan
Noble
Washington
Ross
Pennsylvania
Meigs
Monroe
Hocking
Hocking
0.09381
0.09847
0.11086
0.11931
0.41246
0.41375
0.40282
0.41563
25
28
39
50
367
368
359
369
342
340
320
319
25
As there are only 3 Appalachian counties in Maryland and 6 Appalachian counties in South Carolina, the “distance”
values are not calculated and thus no county pairs are set up for these two states.
187
Table 7.1. Selected Four Pairs of Counties Per State in the Appalachian Region
Based on the Composite Ranking Score
County Pairs
County 1
County 2
Somerset
Snyder
Somerset
Huntingdon
Tennessee
Crawford
Juniata
Bradford
Crawford
Distance
SocSAMH
demo
0.024427
0.44986
0.045775
0.48158
0.01667
0.42379
0.016052
0.41279
Index Rank
Composite
Rank
SocSAMH
demo
14
1294
1280
39
1311
1272
6
1263
1257
5
1246
1241
Franklin
Overton
Scott
Roane
Virginia
Claiborne
Morgan
Grundy
Putnam
0.055416
0.066463
0.070694
0.070714
0.58012
0.58349
0.58661
0.58204
32
56
64
65
1123
1130
1136
1126
1091
1074
1072
1061
Bland
Highland
Highland
Floyd
West Virginia
Bath
Bland
Floyd
Bath
0.06587
0.08249
0.0928
0.07618
0.78649
0.72867
0.65025
0.61837
14
17
20
15
259
256
240
231
245
239
220
216
Monroe
Pendleton
Lewis
Wyoming
Hardy
Monroe
Barbour
Barbour
0.043199
0.054856
0.043253
0.045604
0.60952
0.61336
0.54555
0.53389
23
35
24
26
1472
1475
1416
1402
1449
1440
1392
1376
Site Descriptions
The twinned county sites were selected from the lists above by consensus among ETSU, CASAP and
NORC based upon the statistically twinned rankings produced by NORC and modified by
local/regional knowledge of local situations.
The following brief descriptions paint a picture of each selected county that accents its uniqueness
while illustrating the commonalities among the locations. Information about each county was procured
from the County Profiles prepared by NORC (See Appendix D) from Epodunk.com and from maps
and other county data available on-line. Figure 7.1 shows the geographic placement of the case study
counties in Appalachia.
188
Figure 7.1 Map of Case Study Counties
MORGAN and WAYNE COUNTIES, KENTUCKY
Of the three sets of county twins selected, the two Kentucky counties, Morgan and Wayne were
farthest apart geographically – one in the north central part of the state and one bordering Tennessee.
Despite the relative distance, both contain portions of the Daniel Boone National Forest, part of a
designated High Intensity Drug Trafficking Area by the Office of National Drug Control Policy. Both
counties are non-metropolitan counties, not adjacent to a metropolitan area. Both are classified as
economically distressed by the Appalachian Regional Commission. Morgan County is the location of
a state medium/minimum correctional facility with a population of 1690 males and staff of 377, with
another large facility in neighboring Elliott County.
Wayne County has a larger available labor force (8,767 vs. 5,043 persons) than Morgan County with
manufacturing as the largest employment sector and lower unemployment for 2006 (6.7 vs. 8.8). Both
Wayne County and Morgan County have a higher unemployment rate than the state rate of 5.7, with
higher personal income and almost two thirds as many households. The high school graduation rates
and median household income in Wayne County are nearly the same as in Morgan County. Both
counties have lower graduation rates (Wayne County at 57.8% and Morgan at 56.4%) than the 74.1%
state average in 2000. Both counties have experienced below average population growth (2.9% for
189
Wayne County and 2.6% for Morgan County) compared to the state of Kentucky. The percentage of
persons below the poverty level for 2004 was 27.0% for Morgan County, compared to 24.3 % for
Wayne County contrasting with 16.3 for the state.
Neither county is crossed by an interstate highway; transportation into and out of each county is
through a rural landscape primarily via state or federal roads. Each county is served by a branch
campus of state higher education and counts the local technical facility as a community center for
training and education. Monroe County’s facility, run by Morehead State University, also houses the
public library. Wayne County’s ASPIRE Center is a multipurpose community program center.
The state does not report crime on a county-by-county basis but Morgan County had almost twice as
many juvenile court referrals in 2005 (33 vs.15). Morgan County has fewer low birth weight babies
(7% vs. 10%). The 2004 Area Resource file data on the County Profile listed 11.93% of Morgan
County’s population in correctional or juvenile institutions vs. 0.1410% for Wayne County. In
addition 0.0208% of Morgan County’s population was reported to have used mental health hospitals or
institutions while Wayne County’s rate was 0.0251% contrasting with 0.0485% for the state. All of
Morgan County is designated as both a mental health professional shortage area and a primary care
health professional shortage area. Wayne County has no mental health professional shortage area
designation. Both counties have only outpatient mental health or substance abuse treatment facilities
within the county, and both have access to the same number of regional facilities.
Although Wayne County reported slightly more alcohol use or dependence (6.03% vs. 5.95%), both
reported rates lower than the state average of 6.47%. Morgan County had greater abuse or dependence
of any illicit drugs (3.37% vs. 2.74%), non-prescription use of painkillers (6.83% vs. 5.85%), serious
psychological distress problems (12.61% vs. 11.49%) and a higher suicide rate (0.0215 vs. 0.0153) as
compared to Wayne County. Morgan County also demonstrated higher rates of tobacco use and
cigarette smoking, alcohol use in the past month by 12-20 year olds, binge alcohol use, and illicit drug
use including marijuana and cocaine use. Both counties have active federally funded anti-drug
coalitions and local programs targeting youth in the schools and community, though impressions from
Wayne County indicated fewer extracurricular programs. Morgan County planned to host a rotating
regional drug court by the end of the 2007.
BLAND and BATH COUNTIES, VIRGINIA
Bath County is located along the northern portion of Virginia’s border with West Virginia. Bland
County occupies a similar position on the border about three hours south. In 2003, the USDA
classified Bath County as a non-metro, completely rural county with less than 2,500 urban population.
Neither county has more than 7,000 people according to 2006 U.S. Census estimates. The
Appalachian Regional Commission classifies Bland County as economically transitional and Bath
County as competitive. Bland is bisected by I-77 which brackets access to the county by tunnels. Bath
is served by one U.S. highway intersecting a state highway. Both counties contain portions of national
forests and much forested recreational land. The Appalachian Trail crosses Bland County.
Personal income appears higher in Bath County ($31,520 vs. $22,200) with a greater proportion of the
public with high school diplomas (74% v. 70.9%) and college degrees (11.1% vs. 9.2%) than Bland
County. Poverty levels were higher in Bland County (11.9% vs. 7.3%). Bath County reported a
population change of 4.6% in the 2000-2006 period while Bland had a slight change of 0.5%. Median
home values in 2000 in Bath County were $79,700 vs. $71,500 in Bland County. There were slightly
190
more households in Bland County (2,568 vs. 2,053) and the labor force was larger (3,211 vs. 2,935)
than in Bath County in 2006. USDA 2006 unemployment figures are similar at 3.6 for Bland County
and 3.2 for Bath County compared to 3.0 for Virginia. Employment is mostly in the light
manufacturing sector in Bland County and in the construction sector in Bath County, boosted by new
luxury homes building. A major employer in the county is a nationally known luxury resort that
provides high-end tourism activities.
The County Profile shows that Bland County has a greater percentage of its population in
correctional/juvenile institutions (8.59% vs. 0.12% for Bath County), but neither county records
anyone being treated in mental health institutions. Bland County is also the home of the Bland
Correctional Center, a level 2, male-only prison. Bland County is wholly designated as both a mental
health shortage area and a primary care health professional shortage area; Bath County has no
designated mental health professional shortage areas, though it is wholly designated as a primary care
health professional shortage area. There are over 100 substance abuse treatment facilities within a 100
mile radius of Bland County, but only 42 within 100 miles of Bath County. Bath County is served by
two substance abuse out-patient offices, while Bland County has four.
Alcohol abuse or dependence rates are similar at 7.82% for Bath County and 7.52% for Bland County
(7.67% is the average for Virginia). Rates are also similar for abuse or dependence of any illicit drugs
(3.06% for Bath County vs. 2.95% for Bland County) and for the nonprescription use of painkillers
(5.16% for Bath County vs. 4.94% for Bland County). Rates of serious psychological distress,
however, are higher for Bland County (9.22%) versus Bath County (8.59%). Bath County shows
slightly more people needing but not receiving treatment for alcohol use (7.36% vs. 7.05%) and
needing but not receiving treatment for drug use (2.61% vs. 2.57%) than Bland County. Bland County
residents used more past month tobacco (33.43% vs. 31.67%) and cigarettes (28.22% vs. 26.61%) as
reported in 2002-2004, but Bath County showed more alcohol use (50.48% vs. 42.15%) though Bland
was a little higher on past month binge drinking by 12-20 year olds at (23.61% vs. 23.22%). Bland
County had slightly more past month marijuana use (5.84% vs. 5.65%), past year use (10.06% vs.
9.58%), and first use (2.14% vs. 1.82%). Cocaine use was also slightly higher in Bland County (2.37%
vs. 2.31%). Bath County had a greater use of any illicit drug other than marijuana (3.92% vs. 3.79%).
Bath County reports some in-school drug prevention programs and the support of churches. The
county administration, schools, the National Guard and the community services board have taken the
lead in Bland County to provide in-school and after school programs. Bland County schools have an
assigned sheriff’s officer while Bath County schools are actively served by the sheriff’s department.
Bland County has a drug prevention coalition. Efforts to pull Bath County into the Rockbridge Area
Community Service Board’s Prevention Services have not been successful to date, especially since it is
administered from an office over an hour away. Neither county has inpatient mental health or
residential treatment facilities. Long term residential treatment is located 29 miles from Bland County
and over 53 miles away for Bath residents. Both counties are served by regional community services
offices which supply outpatient treatment and referrals.
MONROE and HARDY COUNTIES, WEST VIRGINIA
Hardy and Monroe Counties occupy comparable positions on the West Virginia border to the Virginia
counties, also within national forest land. Neither is served by a limited access interstate highway, but
Hardy County is well-linked about an hour each way to I-68 and I-81. Hardy County has a large
proportion of residents of German ancestry and occupies a broad fertile swath of agricultural land in
191
the valley of the South Branch of the Potomac River. Monroe County is located only a half hour south
from I-64 and the Greenbrier resort area.
While both counties have agricultural bases, Monroe County counts the public administration sector as
its chief employer. Hardy County has several retail and natural resource production and processing
plants, resulting in a larger labor force (7,271 persons vs. 5,962 persons) and a lower rate of
unemployment for 2006 (3.9 vs. 5.5) compared to Monroe County. Virginia’s unemployment rate is
4.9% by comparison. The poverty rate in Monroe County is higher at 14.3% vs. 12.5% for Hardy
County. The counties have nearly identical populations (13,420-13,510), and are classified as
economically transitional by the Appalachian Regional Commission.
Hardy County exhibits greater overall median home value ($74,700 vs. $64,700 for Monroe County)
and median household income ($35,361 vs. $31,069 for Monroe County). While Hardy County
experienced a 5.9% change in population, Monroe grew at 2.4%, both below the average for West
Virginia as a whole in the 2000-2006 period. Monroe County has a greater percentage of high school
graduates (73.7% vs. 70.3%), but Hardy County has a higher percentage of college graduates (9.4% vs.
8.2%). Representatives from Hardy County reported a growing influx of retirees and second home
builders on its eastern border which is within two hours of Washington, D.C.
Monroe County’s Profile reported that 9.53% of its population was housed in correctional or juvenile
institutions while Hardy County showed no figures in that category according to the 2004 Area
Resource File. Neither county reported any residents in mental health hospitals. Hardy County is
wholly designated as mental health professional shortage area and partially designated as a primary
care professional shortage area. Monroe County is wholly designated as primary care professional
shortage area, but has no mental health professional shortage designation. More Monroe County
residents needed but did not receive treatment for alcohol use (6.53% vs. 6.0%) and needed but did not
receive treatment for drug use (2.91% vs. 2.35%) according to the National Survey on Drug Use and
Health, 2002-2004. Monroe County had a greater proportion of residents reporting serious
psychological problems (13.66% vs. 11.07%) and a greater suicide rate (0.014% vs. 0.0079%) than
Hardy County. Hardy County has 135 substance abuse treatment facilities within a 100 mile radius
while Monroe County has about 52. Neither has an in-patient facility located in the county though
Monroe County’s out-patient facility treats co-occurring mental health and substance abuse disorders
and offers detoxification. Both counties have programs that treat adolescents.
Data for Monroe County show that 6.88% of residents exhibit alcohol abuse or dependence vs. 6.39%
for Hardy County, both less than the 6.93% for the state. Monroe County has a 3.33% rate of abuse or
dependence on any illicit drugs (compared to 2.77% for Hardy), which is greater than the state average
of 3.08%. Monroe County also has a higher rate of past month nonprescription painkiller use (6.58%
vs. 4.54%), past month tobacco use (39.45% vs. 37.88%) and past month cigarette smoking (31.58%
vs. 29.74%) than Hardy County. However, Hardy County showed greater past month use of alcohol
(39.05% vs. 28.58%) and past month binge alcohol use (19.65% vs. 17.39%). Monroe County had
more past month use of marijuana (5.08% vs. 4.83%), greater past year use of marijuana (10.01% vs.
9.26%), greater past month use of illicit drugs (7.08% vs. 6.51%), greater past month illicit drug use
other than marijuana (4.04% vs. 3.48%) and greater past year cocaine use (2.48% vs. 2.05%) than
Hardy County.
Both counties have prevention coalitions and applied for funds through the state’s Substance Abuse
and Mental Health Services Administration Strategic Prevention Framework-State Incentive Grant
192
(SPF-SIG) initial planning program, though neither county was selected to receive funding for 20072008. Hardy County has a dedicated sheriff’s deputy present in its schools. The 4-H program through
the county extension offices organizes activities for youth in both counties. Both counties indicate that
the faith community also provides support for prevention of substance abuse.
7.5 Phase 3: Onsite Focus Group and Key Informant Interviews
Community members were identified in the target counties using key leaders or contacts. Key contacts
were the researcher’s essential link “inside” the population of interest and were used to facilitate the
recruitment of participants who could provide meaningful data. Identities of key leaders in each
community were provided by members of the Coalition on Appalachian Substance Abuse Policy
(CASAP). These leaders were asked to provide contact information for community members who
were associated with substance abuse and mental health education, prevention, treatment, etc. as well
as concerned citizens. All community members lived and/or worked in the targeted county and
represented at least one predetermined stakeholder group. Multiple stakeholders are essential to
integrating a broad-based coalition with values diversity for long-term effectiveness. Seeking out
multiple community stakeholders was a condition of the methodology to ensure depth of data.
Focus groups were comprised of a diverse set of community members, including representatives of
multiple stakeholder groups such as law enforcement, medical and mental health practitioners, school
personnel, business representatives, county extension agents, social service providers and county
administrators. These stakeholders were presumed to be aware of the county’s substance abuse and
mental health issues. Participants were contacted initially by mail. The letter was followed within a
week by a personal telephone confirmation. In a few instances, email was used for contact when no
address or phone number were supplied.
Six focus group interviews were conducted between July and September of 2007 in Kentucky,
Virginia, and West Virginia. The six focus groups were conducted at neutral sites in the selected
counties including county libraries, community colleges and, in one case, the county courthouse. Prior
to data collection, the focus group moderator explained the purpose of session, ground rules for
confidentiality, and conduct and methods that would assure anonymity of the participants. Each focus
group discussion was audio-taped and transcribed with identifiers removed prior to analysis. Trained
facilitators used structured focus group moderator guides that were developed specifically for the
study. All discussions followed the predetermined format of the guides. Each of the focus groups
lasted between 45 and 75 minutes with an average of 5.5 participants (range 4 to 7 persons).
Following focus group interviews, key informant interviews were conducted by phone with selected
members from each of the six counties. Key informant interviews were conducted with representatives
of stakeholder groups that were underrepresented at the county’s focus group. Key informant
interviews also followed a structured interview guide and lasted between 25-35 minutes. The
methodology was reviewed and approved by the ETSU Institutional Review Board to assure
appropriate informed consent for participation.
The sections below provide a composite of the responses to questions from the focus group interview
guides, supplemented by responses from the key informant interviews. Themes were captured around
each question discussed in the focus group interviews. Each of the focus groups’ notes was also
classified and compared according to general themes within each state and between all the states. The
concept of community dialog was incorporated into the focus group reports. The discussion among
focus group participants who were deeply involved in the life of the communities indicated their
193
firsthand knowledge of the issues. Descriptions of the substance abuse or mental health issues or
“themes” in the counties demonstrated familiarity with the topics. Key informant interviews reiterated
many of these themes.
Prior to focus group and key informant interviews, county data profile sheets prepared by NORC (see
Appendix D) were provided to each participating individual. The county profile sheet provided data
on socio-economic characteristics, substance abuse and mental health problems, access to treatment,
institutional characteristics (i.e., mental health institutions, correctional facility, etc), cigarette smoking
and tobacco use, alcohol use and binge drinking, and marijuana and other illicit drug use.
Reactions to Secondary Data in County Profiles Provided by NORC
Four out of the six counties said the profiles (see Appendix D) were fairly accurate, but all expressed
uncertainty about the definitions and data collection methods used. Both West Virginia counties noted
inaccuracies in the population and population density numbers and raised questions about these
specific numbers. The following are comments from the groups about the data profiles that were
distributed and discussed.
Item #1: Socio-demographic characteristics
Median home value may not be a good indicator in rural counties with relative proximity to large
urban areas (e. g., Washington DC) because of the influx of new residents for retirement or a
second home. These individuals tend to be older, more educated and more affluent. Some may
build homes with higher property values. One county representative noted: “People who retire
here skew the county income data. The true local residents are poor.” Another person suggested
that a different poverty indicator may provide a more reliable picture, such as the percentage of
county students participating in the free lunch program at school: “Fifty percent of all students in
the county are on the free or reduced school lunch program.” The high school graduation rate was
questioned in two counties because the inclusion of individuals receiving a GED was not known.
Item #2: Overview of substance abuse and mental health
Some county representatives had questions about where and how the data were obtained for the
county profiles. Some people expressed concern over how the measures were defined. For
example, one measure looks at alcohol abuse and dependence as a single data element. One
respondent mentioned that these are two distinctively different measures: “Alcohol abuse and
alcohol dependence are two different things, so the data doesn’t reflect that.”
Item #3: Access to treatment
Questions were raised about how the access to treatment data was procured and the sources of the
data. Sources for this item were not identified on the profiles. The difference between those
needing help and those seeking help were stated as a simple percentage of the total population.
Item #4: Institutional characteristics
Representatives from each of the counties expressed confusion about what was meant by
“institutional characteristics.” The presence of a correctional facility is a local determinant that
194
does not indicate if persons were incarcerated outside the county, and thus may have
disproportionately increased the county percentage of persons in correctional/juvenile institutions
when a correctional facility was located within county borders. The designation “health
professional shortage area” was not understood by most respondents.
Item #5: Cigarette smoking and tobacco use/ Items #6: Alcohol use and binge drinking/ and Item
#7: Marijuana and other illicit drug use
Respondents from most of the counties indicated that the data were fairly accurate, and the high
perceived great risk of tobacco use was not a surprise. One respondent asked if the numbers
included smokeless tobacco use. Some respondents questioned the data collection methods, citing
the unreliability of self reporting known to be used in some data sources.
Most counties expressed a desire to be compared to other Appalachian counties in their states or to
regional data.
Overall Impressions of Substance Abuse and Mental Health Problems in their Communities
All communities indicated that prescription drug abuse was prevalent. The use, acquisition, and
distribution of the non-prescribed pain relievers contributed to criminal behavior and involved
community social networks and created an alternative economic layer to the community. In addition,
most communities believed that prescription drug use was a result of the relative ease of access to
dealers or other procurement methods. One respondent noted that drugs are acquired or stolen from
family members: “Prescription abusers first deplete the family. They empty out the medicine cabinets
before seeking other sources for drugs.” Other common drugs of choice included alcohol, tobacco,
marijuana, inhalants, and methamphetamine. Law enforcement officers and counselors confirmed a
smaller presence for heroin, cocaine, ecstasy, and other illegal drugs but said use and choice was a
function of ease of access, cost, and cultural preference.
Respondents from most of the communities indicated that drugs were easy to obtain and could be
obtained locally. Participants reported that students seem to have a great deal of knowledge regarding
drugs and many could identify local drug dealers. People from all of the communities indicated that in
a small county “everyone knows everyone,” and as such, discretion was difficult. One respondent
noted: “Drug dealers are on every street corner and we tend to know who they are.”
Some people discussed the procurement of drugs out-of-county and out-of-state. People from all of the
counties reported that their emergency rooms, pharmacies, dentists and doctors have experienced
people with habitual and extensive drug-seeking behaviors. Some counties’ offices and institutions
have taken steps to curb this behavior through specific prescription dispensing management practices.
The Kentucky counties were somewhat familiar with the Kentucky All Schedule Electronic Reporting
System (KASPER) procedures. KASPER tracks controlled substance prescriptions dispensed within
the state and shows all scheduled prescriptions for an individual over a specified time period, the
prescriber, and the dispenser. Designed to be a source of information for practitioners and
pharmacists, and an investigative tool for law enforcement, KASPER has some lag (real time) between
filing and access by other system users that has been initially exploited by drug seekers.
195
Some community leaders indicated that substance abuse was underreported. Participants perceived a
collective denial of substance abuse, contrasted with individual awareness of specific dealers, users,
habits and behaviors. Multiple factors were identified that influence this finding:
Cultural and family factors contribute to the denial of the existence of substance abuse and its
severity.
Small communities reported the existence of stigma for seeking help and that many parents
reject complicity or accountability for the behavior of children or other family members.
Substance use is often seen as a coping mechanism and is sometimes accepted as a normal
behavior in many communities.
Substance use is often not acknowledged as abuse until the behavior becomes harmful or
criminal. As indicated by one focus group participant: “Substance abuse is significantly
underreported and indication of abuse comes out in different kinds of ways such as
unemployment.”
All counties expressed knowledge of regional substance use problems and knew that other nearby
counties experienced similar issues. Participants from counties were aware of national trends and
noted that their area mirrored what was happening in the nation. The regional news media reach across
state boundaries in most cases so that rural and urban people receive and share the same information.
No community was informed in advance of its status of being selected because of high or low county
substance abuse indicators. Interestingly, all communities perceived that their own substance abuse
was high. The following is a list of factors contributing to substance abuse cited by communities:
Substance abuse can often be the result of self-medication for underlying factors such as
depression, anxiety, and deeper psychological trauma, such as child abuse;
Geographical isolation (limited transportation, rurality) and distance from services;
Societal and cultural factors like stoicism, self-reliance or pride;
Economic stressors like loss of community resources and scarcity of worthwhile employment;
The use of substances to escape from problems;
Intergenerational modeling of substance use behavior by parents engaging in the behavior,
having a positive attitude towards the behavior, and/or allowing child substance use;
Societal factors including peer pressure, poor family values, expectations, and media marketing
of prescription drugs as a “cure all”;
The break-down of family and community values;
Boredom;
Limited recreational opportunities for youth; and
Few positive adult role models.
Participants in one focus group noted that children today lack goal-setting skills and that hope is in
short supply. One person noted: “Our kids have generational poverty and they don’t have a clue about
how to achieve goals.” On the other hand, participants from a few communities indicated that residing
in a small rural community can also serve as a protective factor against substance use and creates a
cohesive, self-aware unit where people are likely to know and help each other. One community
representative noted the “presence of a lot of traditional ‘moral people’” and that “families are close
and churches are abundant.” These were factors thought to contribute to lower rates of substance use.
Conversely “poor moral fiber” was believed to be a factor that promotes substance abuse and
196
addiction. The availability of fulfilling employment and greater relative wealth was thought to be a
deterrent in a few of the communities. Communities that reported broader educational opportunities,
more after school programs (including sports and music), and awareness of the consequences of drug
abuse were less likely to indicate higher levels of substance abuse.
Some state and local data are collected by counties or entities within counties, especially in preparing
funding applications. Purchased or state-provided school youth surveys are primary sources of data
that communities can use to gauge local situations and benchmark to national trends. The following is
a list of surveys being used to collect primary data on substance use, as well as personal factors
affecting substance use.
Parents' Resource Institute for Drug Education (PRIDE) Survey from National Survey
Associates - the PRIDE survey measures the prevalence of alcohol, tobacco, and drug use by
students in grades 6-12 and was reportedly used by one county in West Virginia and both
Virginia counties in the last two years. Available at: http://www.pridesurveys.com
Kentucky Incentive for Prevention Survey (KIPS) - KIPS measures substance use among 6th, 8th,
10th, and 12th grade students. School specific data is provided to local school administrators
and is publicly available in regional aggregated data sets. Available at:
http://mhmr.ky.gov/MHSAS/sa_kipsurvey.asp
Search Institute’s 40 Developmental Assets Survey - this survey measures such factors as
positive relationships, skills enhancement, and health promoting activities among school aged
children and was used by one county in West Virginia within the past four years. Available at:
http://www.search-institute.org
In addition to surveys, some communities rely on other secondary data. The following are additional
data items that were suggested.
Emergency Management Services - overdose response calls, overdose deaths.
Local Police Reports - DUI arrests, drug related arrests.
In most cases, the case study counties did not seem to seek out and use locally available data. While
communities presumed a problem with substance abuse, additional data did not seem to be a valuable
resource except for grant application purposes. One person from a Department of Social Services
summarized this attitude, saying: “We need to get away from wasting money collecting and looking at
data, and use this money on prevention.”
In looking at mental health problems in their communities, most county groups observed that
preexisting mental health issues often manifest as substance abuse problems; that is, people often
abuse substances as a way to cope with a mental health issue. One focus group participant noted:
“Mental health problems are often a result of a situation in one’s life that results in substance use and
abuse as a way to cope with one’s problems.” This “self-medication” is perceived to occur especially
when depression and anxiety are the underlying issues. In one county, a treatment specialist reported
that the majority of people seen for addiction have underlying depression. This complex relationship
is seen to be affected both by the long term and often severe economic issues faced by mountain
197
communities and their resident families, and the documented prevailing Appalachian cultural attitudes
of self-reliance.
Individuals from most counties indicated that they lacked adequate mental health services and that
access to care was a contributing problem to the prevalence of mental health issues. None of the
counties had inpatient treatment and most reported a limited scope of mental health services. Often
treatment was provided by psychologists/psychiatrists practicing in the county for a few days per
week. One individual noted: “For every 1,000 people who have trouble with alcohol, we have one
bed. Their insurance card will tell you how long it will take to detox because that is how long they can
stay.”
According to focus group participants, a cultural stigma is attached to seeking mental health care.
Some people would not seek treatment even if the services were available because of fear of being
observed, and judged, by family and peers. One person noted: “We are a proud people and do not
typically ask for help.” Treatment costs were also reported to be a major barrier in most counties.
Many Appalachian communities have large numbers of residents with no insurance or limited
insurance benefit packages that prevent them from seeking or receiving services. One best practice
strategy was identified in Kentucky: some anti-drug coalition groups provide one-time referrals and
payment for substance abuse treatment with funding from federal sources. Transportation issues,
parental denial of children’s mental health conditions, and multi-generational acceptance of mental
health issues were mentioned as barriers in all counties.
Among mental health and substance abuse treatment services most often cited as missing was a lack of
residential treatment facilities within the counties. Residential placement in other counties was
difficult but was the typical avenue for people requiring residential treatment. Additionally, counties
indicated that additional school prevention programs would be desirable. Only two of the six counties
had well developed prevention programs. These counties were using nationally based model programs
such as “Lifeskills Training” by Gilbert Botvin. Other counties had limited programs which were more
modest in scope. Dearth of funding or state restrictions sometimes limited the institutional purchases
of science-based classroom prevention packages.
The need for greater law enforcement resources was cited in several counties. Individuals across
counties perceived that in rural areas, local, county and even state police presence are overwhelmed
with day to day operations. Specifically, it was noted that police have insufficient funding for
adequate law enforcement to address and control criminal activities related to substance use and
distribution. For example, one county had two officers to patrol 575 square miles. Additionally, law
enforcement professionals acknowledged that only a small percentage of criminal activity due to
substance use was curbed due to their efforts. One individual noted: “We can’t keep up with the calls
we do get, let alone prevent anything.” In one county, law enforcement facilities were used as a last
resort for mental health emergencies (i.e., holding an individual in a county jail) when appropriate
treatment was not immediately available.
7.6 Phase 4: Development of Community Resource Inventory
As part of the case study process, each county was asked to identify existing community programs that
it considered “exceptional” or “best practices.” Existing research defines best practices as a technique,
activity or methodology that, through research, experience and replication, reliably provides:
198
Effective and desired result(s);
Ethical and equitable outcome(s);
Adaptability to similar environments; and
Opportunities for innovation.
While few counties felt they provided adequate services to their communities, all were able to list
mental health and substance abuse programs and services in their counties that met these criteria for
“best practices.” However, some respondents noted that the use of best practice programs and services
is limited by financial and other constraints.
Model services and program activities varied due to state and local financial and human resources. All
counties but one had some form of anti-drug coalition comprised of concerned stakeholders. The
presence of program activities by churches, schools and community groups also contributed to a sense
that positive alternatives to substance abuse were available. Treatment services varied, but all counties
had access to outpatient treatment. However, the degree of community utilization and perceived
competence varied (see Tables 7.2 and 7.3).
The following programs were mentioned as available within the participating counties:
Mental Health
All counties in the study have access to outpatient treatment facilities within the county. However,
individuals felt these facilities were underused and that the drug problem within the county was greater
than reported. Only two counties (Wayne County, KY and Bland County, VA) had additional
independent substance abuse/mental health providers within the county. No county had inpatient
facilities for either substance abuse or mental health and most reported difficulty placing those needing
long term outpatient treatment. Special programs include the Rockbridge Community Services Board
PACE (Parenting Assessment Consultation and Education), which models appropriate parenting. The
FMRS Health System in Monroe County (WV), a not-for-profit behavioral health organization, offers
the Mother Program, a women’s substance abuse treatment program and ADAPT for adolescents.
Schools
Individuals across counties noted that the schools were integral to the dissemination of prevention
programs and activities. In some counties, adolescent and family outpatient counseling took place at
the schools because it was the most accessible environment for students and parents. Most school
systems are bound to use evidence-based, proven prevention programs that may be purchased if funds
are available. Only one school system reported using the DARE activities. Wayne County (KY) and
Bland County (VA) were using LifeSkills4Kids. Beginning Alcohol and Addictions Basic Education
Studies (BABES) is a classroom-based primary alcohol prevention program for children 5-8 years of
age that is being implemented in Wayne County (KY). Other counties use Protecting Me/Protecting
You from the Mothers Against Drunk Driving (MADD), a 5-year classroom alcohol prevention
program for grades 1-5. Too Good for Drugs (Wayne County, KY) for elementary and middle school
students and Parenting Wisely (Bland County, VA), for children 9-18 years, are both science-based,
field-tested SAMHSA model programs. Monroe County (WV) touted having a school-based wellness
center in each county school.
199
Justice and Law Enforcement
One county (Morgan County, KY) anticipated a drug court which will rotate regionally to ameliorate
judicial overload. Wayne County also participates in the Kentucky Drug Court Program. Bath County
(VA) combines its family and juvenile courts and Bland County (VA) has a youth case management
worker. Bland County (VA) and Hardy County (WV) have had representatives of the sheriff’s
department in the schools; individuals in both counties indicated that they made a substantial
contribution with respect to providing a needed law enforcement presence.
Faith Community Programs
Representatives from all counties said that church and faith-based programs were important to the
quality of life and health in the community. Morgan County (KY) has an after school program called
Lifeline that was considered an outstanding contribution, as was Bath County’s (VA) Camp
ACCOVAC, administered by the Adventist Christian church. Morgan County (KY) respondents said
that the many vacation bible schools were a deterrent to drug activity. Both West Virginia counties
actively use their ministerial association for referrals. Bland County (VA) worked with Hope
Ministries Center, a Southern Baptist mission which provides some health and dental care.
Other Community Programs
Youth mentoring programs were present in all communities, provided by local community agencies
and organizations such as Kiwanis clubs and county extension service 4-H programs. These programs
often work through the schools or offer summer and weekend programs to alleviate boredom and
provide esteem-building activities for youth. In Hardy County (WV), the school counselors actively
partnered with county extension agencies involved extensively in youth programs to provide wellness
activities including substance use prevention, wellness, health, and self-esteem activities.
Drug coalitions also play a visible role in attracting attention and money to address substance use
issues and provide a focus for program activities in communities. Kentucky has received federal
money to organize Operation UNITE anti-drug coalitions through the efforts of Congressman Hal
Rogers. These coalitions are well-supported in the state and work closely with law enforcement
agencies. In Virginia, Bland County has the advantage of a progressive county administration that has
been assertive in organizing and seeking funding for prevention activities, while Bath County has
relied on prevention efforts through the schools. The Hardy County (WV) Prevention Partnership and
the Monroe County (WV) Prevention Coalition include tobacco, alcohol, and drug use prevention as
part of their agendas, with funding from the West Virginia Tobacco Settlement Foundation. Wayne
County (KY) and Bath County (VA) mentioned the presence of Assistance for Alcohol and Substance
Abuse Prevention (ASAP) programs, a workplace education, prevention and testing service offered
through employers, though only Virginia offers workmen’s compensation for ASAP program use. The
presence of an active multi-stakeholder prevention coalition is a function of community interest in the
issues, but acquires significance and weight through state and federal recognition and funding. The
degree of prevention awareness and treatment availability may be functions of that recognition (see
Tables 7.2 and 7.3).
200
7.7 Phase 5: Key Findings
Key findings were developed based on an analysis of the textural data derived from the interviews and
focus groups. Using an induction method, the analysis focused on the organization of broad
conceptual categories and then more refined coding for underlying themes. Finally, the textural data
was triangulated with secondary data profiles, and county descriptors with the researcher’s field notes
to produce an understanding of the incidence of and explanation for disparities in mental health status,
substance abuse prevalence and access to treatment services in these Appalachian communities.
Key Findings
The national data sets used in the County Profiles painted a different picture of county
problems than county representatives felt were important because the profiles did not clearly
illustrate local factors. Local data sets are essential to understanding the depth of the substance
use and mental health issues faced by residents at the county level. However, focus groups
stated that local data is not always sought or used effectively in education or planning. Some
stakeholders said that local data collection is not as important or useful as other applications
because the issues are assumed to be well-understood and money used for data collection is
more urgently needed for basic services. With better coordinated data collection,
documentation and analysis, localities may be better equipped to access resources at state and
federal levels.
Several common themes emerged from the case studies regarding barriers to use of services
including social stigma for those who seek care, lack of transportation, non-recognition of
roots of substance use behaviors, multi-generational patterns of substance abuse behaviors, and
erosion of the power of family and community networks to assist in personal coping skills.
These multiple factors must be taken into account when prescribing ways to increase access to
mental health treatment and reduce the prevalence of substance abuse in Appalachia.
Appalachian communities have a sense of regional awareness of mental health and substance
abuse issues and express willingness to share facilities and solutions. None of the six focus
group sites had residential treatment facilities and those seeking treatment had to travel over 30
miles to receive even short term residential treatment. Individuals in these communities felt
that substance use and mental health disparities were issues not only in their community but
also throughout the rest of the state, and region.
Focus groups members were concerned with destruction of community social infrastructure,
family values and workforce viability due to substance abuse, and wanted better conditions for
all citizens of their counties. The well being of youth was of paramount importance to rural
counties as evidenced by the emphasis on prevention and awareness of substance abuse in
schools and youth-programs settings.
Solutions to mental health and substance use issues were understood by communities to be
community-based and family-based; solutions were thought to be more effective when actively
supported by other local institutions like schools, churches and courts. Communities with more
diverse programs to address substance abuse and mental health seemed more confident that
they were able to have a positive impact on their citizens.
Moral and cultural decline in general was noted most often as the reason for substance use.
Factors such as irresponsible parenting, effects of the media, two-income families, decreased
personal expectations, poverty, poor job prospects, easy access to prescription drugs, peer
pressure, boredom and curiosity about drugs were cited as causes of this decline. Communities
201
saw solutions to substance use in programs or activities that addressed one or more of these
issues.
Each of the sites reported that substance use and mental health problems were the result of cooccurrence and not the result of a single cause.
The following are some of the limitations or special considerations related to the case studies.
Respondents
The respondents who participated in the focus groups and key informant interviews were provided by
contacts within the substance abuse/mental health arena in each county. Most respondents were
members of local antidrug coalitions, treatment facilities or other public figures in the county. Focus
groups met during the work day. Some potential respondents were unable to participate because of the
time or personal schedules. While a comparable representation was sought from similar stakeholders
or constituents in each county, not every stakeholder group was represented.
Counties
In this report the terms “county” and “community” are often used interchangeably. Both terms refer an
Appalachian concept of cultural identity which defines the parameters of place identity. A community
exhibits membership boundaries within a pattern of beliefs and behavior for the dominant cultural
group. The unit of identity in a rural setting is the county where the largest “urban area” may be the
county seat. In this study, all county seats were towns of fewer than 6,000. In Appalachian counties,
the social constructs of a county seat seem to be representative of the county as a whole. The
attachment is to the county “community.” Attachment to the Appalachian portion of the state or
surrounding counties and to regional Appalachian affiliations which may cross state lines was evident
in the focus groups when participants mentioned the desire for comparison to other counties in the
region.
Though the counties selected for inclusion in the case study pilot were based on objective rankings, in
fact, the four counties on the border of Virginia and West Virginia were close in geographic proximity
and had similar demographic profiles with similarities in attitudes, concerns, issues, barriers, and
services. The two Kentucky counties were farther apart in geographic proximity. Individuals from all
counties expressed the desire to be measured against comparable rural Appalachian counties.
Individuals from all six counties felt that the uniqueness of the Appalachian region made an accurate
comparison of an Appalachian region to a non-Appalachian region difficult.
Substance abuse concentration
The problems associated with substance use seemed to be of greater importance to focus group
participants than did problems associated with mental health. Substance abuse was the opening topic
of discussion and featured in seven of the twelve survey protocol questions. It was a problem that
touched more stakeholders in the community notwithstanding the interrelatedness of the issues.
Data sets comparison
202
Three sources of potential data emerged from the study: The data sets used by NORC to compile the
County Profiles, the sets suggested by CASAP through a Delphi Process, and the data used by the
counties in the case studies. NORC used nationally available, proven and accessible data sets to
prepare the county profiles. Some of these numbers were calculated based on county population size.
Not all of the data sets suggested by CASAP through the Delphi process are available nationally or
state by state at the county level. Data is also not collected or reported consistently from state to state.
However, these suggestions – gathered from Appalachian researchers, educators and practitioners –
were examples of ideal data to use to measure high/low substance abuse prevalence and mental health
access.
The county/community data postulated by local decision makers was reported in focus groups and key
information interviews in the six Appalachian county case studies. While other data sets may also be
used by counties, these were reported as being useful or desirable. Some data sets corresponded to sets
from other sources and are grouped on the same line.
The use of secondary data, collected at state and local levels, is being encouraged by the Community
Anti-Drug Coalitions of America (CADCA), the Robert Wood Johnson Foundation, Join Together,
and Substance Abuse and Mental Health Services Administration’s Strategic Prevention FrameworkState Incentive Grant program as the most reliable way for local agencies to assess current need and
project the scope of substance abuse issues and treatments. The reality is that finding and using local
data in a coherent way is difficult for some local groups because of cost, cooperation, presumptions of
knowledge and small sample size. Table 7.4 below also demonstrates the gaps in available data for
planning at the local level.
Researchers from ETSU drew the following conclusions about the case studies data:
Regional substance abuse and mental health leaders do not have uniformly available county
and state data sets from which to draw conclusive measurements, but they do know what types
of data would be useful to formulate a local response to the issues.
National researchers do not have enough reliable county-level data from which to draw
conclusive analyses. This conclusion is based on questions and reactions to county profiles in
the case study.
Appalachian counties and communities do not report using nationally-available data sets to
make decisions about local responses to substance abuse and mental health issues. They may
use state data, especially when it supports applications for grant funding of prevention
programs, but anecdotal evidence informs decision making.
Assessing the Communities’ Dialogues: Strengths and Gaps in Prevention and Treatment
Each of the six focus groups and sets of key informant interviews represents a community’s dialogue
about its substance abuse and mental health issues. Profiled below is the commentary regarding
community perceptions of their own strengths and treatment gaps with regard to substance abuse and
mental health needs and services. The final section summarizes elements of the six separate dialogues
and offers conclusions.
In relation to prevention and treatment services available to address substance abuse and mental health
issues, the counties chosen for this case study exhibited many strengths. These strengths are
203
characteristics of the counties that can be seen as deterrents to substance abuse behavior or those that
promote local treatment options. These strengths are essentially features that contribute to preventive
and protective factors in the community. The model programs listed in Table 7.2 represent some of
these strengths. Additionally, a listing of strengths is provided in Table 7.3. The focus groups,
informants and the inventories also identified areas of need and gaps in the prevention and treatment
continuum. In Table 7.3, the gaps in the prevention/treatment continuum are concentrated under the
“gaps identified from the interviews” and “gaps identified from the focus groups.”
Each community discussion demonstrated cognizance of both the protective factors and the disposition
to risk associated with rurality and the Appalachian culture. Small town culture was mentioned as an
asset by people representing each of the case study counties. One individual described the benefits of a
rural community: “We look out for each other.” Another individual noted the close-knit nature of the
community: “If you do something, [your] parents will know before you get home.” Additionally,
focus group participants noted that other factors may affect a community’s disposition to risk,
including the demands of single-parent households, dual-income families, poor parental examples, and
normative risk behaviors in the media, music, films and television. Others noted that the propensity
for youth to use drugs was exacerbated by the small town atmosphere, moral decline, peer pressure and
proliferation of outside influences like television and the internet. According to participants,
individuals and the community face internal and external realities that create tension and uncertainty,
and may contribute to the use of drugs and alcohol.
Distance between the county and illicit drug distribution sources was not always seen as a protective
factor, as the nearest medicine cabinet could be a pharmacopeia of useable or saleable drugs.
Poverty in rural areas was discussed as a potential protective factor to substance abuse. One focus
group participant commented that relative rural poverty was a protective factor because it limited the
purchase of drugs.
All communities saw a relationship between employment and substance abuse, whether the use was
caused by addiction to painkillers resulting from job-related injury, recreational habituation, or the
numbing depression from a dead end job. In one community with adequate employment opportunities,
county officials said that employers learned to look the other way and only required drug testing when
a safety violation or accident occurred, preferring a workforce that was functional regardless of
substance use.
The risks posed by place are related to the perception of relative isolation from legal consequences,
covert use of substances, lack of a range of activities for youth, and diminished employment
opportunities. These risks were not listed as gaps but were seen as a conditional quality of the nature
of the rural setting.
Common strengths among all the counties surveyed were the state-supported networks of behavioral
health treatments services. These multi-county agencies furnish both mental health and substance
abuse treatment on an outpatient basis. No county had any in-county residential treatment facility and
relied on referrals to residential facilities at distances of at least 30 to 50 miles. Transportation to
treatment on a sustainable basis was difficult for those with limited means.
Faith-based prevention activities and some informal counseling for substance abuse and mental health
were provided in each of the counties. Stakeholders from each county mentioned that the presence of
204
churches, youth programs, a strong faith community, and positive adult and family models were
factors that contributed to the moral fiber of the community and offered protective qualities.
The presence of school-based prevention activities, curriculum, after-school youth activities, and
multi-generational events were central to the perception of a positive community atmosphere.
Stakeholders from counties that had such activities noted that they felt the community was committed
to creating a positive environment where drugs are not the answer to boredom, lack of jobs, and
despair. Parenting classes, agricultural extension programs, wellness classes, health camps, mentoring
programs, sports, and recreation were some ways that communities worked to prevent drug use and
promote mental health.
The array of anti-drug coalition activities is an important strength of the rural communities surveyed.
Operation UNITE, an organization that is active in both Kentucky counties, seeks to prevent illegal
drug use, coordinate treatment, provide support to families and friends of substance abusers, and
educate the public about the dangers of drugs. UNITE was started with federal funding. Bland, Hardy
and Monroe Counties each had multi-stakeholder coalitions supported by state and regional agencies
that functioned to raise awareness about the dangers of drug use.
Outstanding local leadership was a positive asset in several communities. Local “champions”
mobilized action and coordinated prevention activities. Individuals working in the school systems,
county governance, and public health noted that local leadership was a positive asset to their
communities. Leaders became apparent as participants talked about the issues and solutions in their
communities. These individuals could be a local county extension agent, the county executive, the
school resource officer, a concerned counselor, or a public health official. Common to these
individuals was recognition of the necessity to involve others from all parts of the community to tackle
the problem on many fronts.
Access to treatment, including transportation, payment options, privacy issues, stigma, choice of
facilities and cultural or family bias, were uniformly identified as gaps in the continuum of care for
substance abuse and mental health. The paucity of long term care residential treatment facilities and
after-care programs was also discovered. The continuity of treatment modalities was a concern.
Counties recognized that treatment constituted a long term commitment to recovery and recovery
maintenance. Some modalities are provided in volunteer settings (e.g. Alcoholics Anonymous and
Narcotics Anonymous and local drop in centers). Counties lacked reliable volunteers and locations for
the groups to meet, and experienced cultural barriers for women and youth.
The need for treatment options for women was suggested in two county focus groups, while the need
for more school intervention and action prevention programs was mentioned in three county focus
groups. Individuals from both Virginia counties noted the need for better emergency mental health
plans because their counties are geographically situated far from appropriate emergency mental health
care; county providers were often forced to improvise in emergency mental health situations. One
county said that another access to treatment issue was that employed individuals had difficulty
securing time off during work hours which added to the stigma attached to seeking care; thus, another
gap to mental health treatment are the service hours available for treatment.
These Appalachian communities have strengths and assets within their counties and some gaps in
services that are not evident from national data sets. Generalizing strengths and gaps in treatment and
prevention from these six counties to other Appalachian counties may be speculative at this time.
205
Definitive descriptions can only be made through individual assessments of each Appalachian county’s
response to the substance abuse and mental health issues. However, we recognized from these
communities that:
Substance abuse resulting from the distribution of prescription drugs as much or more than
alcohol and tobacco is a prime concern to government officials, law enforcement and
justice personnel, health departments, educators and the public.
Nearly every person interviewed admitted they had been touched in some way by substance
abuse issues among family and friends.
Socioeconomic realities and community culture are two factors that affect substance abuse
and mental health issues.
Individuals from case study communities indicated the need to address local problems
locally. They are trying to implement successful new strategies to restore their
communities and to help individuals to engage in healthy behaviors and lead productive
lives.
7.8 Discussion and Conclusions
The case studies revealed that the deeper story about Appalachian substance abuse and mental health
disparities cannot be captured using nationally available data sets only. Analyses of substance use
prevalence and mental health status using national data must be supplemented by additional local data
that contains information about the institutional populations, law enforcement, EMS, etc.
Through direct participation in focus groups and interviews, key respondents described the diversity of
the rural Appalachian counties – despite their similarities across socio-economic indicators. The onsite visits to the six counties were important to understanding the variety of local substance abuse and
mental health issues found in each county. Some leaders acknowledged that there are insufficient
resources to cope with the effects of substance distribution, abuse, and addiction. Other leaders
appeared to be in denial of the substance abuse and mental health issues in their communities.
Findings from the focus groups revealed that the steps needed to ameliorate substance use and mental
health treatment access issues are largely dependent on the local community’s recognition of these
problems. In addition, other factors that also have an influence on access to treatment include state
resources, local economic conditions, the community’s culture and commitment to resolving the
issues, transportation options, viable payment alternatives, and mobilization of key community
members.
Individuals from each of the county sites reported that substance abuse and mental health issues are
often co-occurring. These issues are complex and any approach must consider the relationship
between mental health and substance abuse, as some people may abuse substances to deal with anxiety
or other serious mental health problems. In other situations, substance abuse may precipitate or
exacerbate mental health issues. Policy makers must address prevention and access to treatment issues
as well. This research suggests that substance abuse and mental health issues are typically cooccurring disorders that impact the community at large. Additional research in other areas of
Appalachia should be conducted to test the reliability of these results.
206
Table 7.2. Model Programs (Best Practices) from Appalachian Twinned-County Focus Groups
Kentucky
Morgan
School
Faith-based
Champions for
Drug-Free
Kentucky
Too Good for
Drugs
Lifeline after
school program
Ministerial
Association
Church VBS
programs
Wayne
LifeSkills4Kids
BABES
Second Step
Too Good for
Drugs
Champions
Against Drugs
Church
activities
Law
Enforcement
Community
Prevention
Medical
Mental
Health
Operation
UNITE
Hooked on
Fishing
School
programs and
clubs
Summer
activities
Operation
UNITE –
DAAD
Hooked on
Fishing
Celebrate
Recovery
Neighbors
United
Morgan Co.
ASAP
Wayne Co.
ASAP
Pathways, Inc.
Adanta
Behavioral
Health Services
Virginia
Bath
Safe and Drug
Free Schools
program
After Prom
activities
Camp Kovacs
Churches
ACCESS
emergency
mental health
care
Prevention
Task Force
ASAP alcohol
prevention
Rockbridge
Community
Services Board:
PEPPACE
Phoenix
Preferred
Health Care
Bland
West Virginia
Hardy
Monroe
LifeSkills4Kids
Parenting
Wisely
DARE
Protecting
Me/Protecting
You
Character
Education
Tobacco
Prevention
Hope Ministries
Churches
Health
Choices Camp
School
Enforcement
Officer
Officer in
Schools
Operation
CADDY
Hardy Co.
Prevention
Partnership
Family
Resource
Center
Community
Action
Monroe Co.
Prevention Coalition
Mt. Rogers
Community
Services Board.
Potomac
Highlands
Guild
AA
AA
FRMS Health
Systems:
Mother Program
ADAPT for
adolescents
Family
Resource
Center
Strengthening
Families
program
Drug and
alcohol
education K12
School Partnerships
School-based
wellness center
Sports
After school
activities
Tobacco programs
Tobacco
programs
Ministerial
Association
Churches
Ministerial
Association
Churches
AA
Narcotics
Anonymous
Judicial
Drug court
(rotating)
Other
Kiwanis Club
AA
Drug Court
Wayne Co.
Hotline
Youth
Empowerment
Network
4-H clubs
Kiwanis Club
Bath Co.
Combined
Courts
Parks and
outdoor
recreation
4-H
207
Mt. Rogers
Youth Case
Mgt.
Virginia
National Guard
activities
4-H
Parks
4-H
4-H
Summer programs
West Virginia
Prevention
Resource
Table 7.3. Strengths and Treatment Gaps for Twinned Counties Study
Kentucky
Wayne
Morgan
Virginia
Bath
Bland
West Virginia
Hardy
Monroe
Strengths
(See also
Model
programs)
Strong faith
community;
school drug
testing; nuclear
families; small
town culture
Church programs;
positive adult and
family models;
after school
programs;
publicizing drug
mortalities
Recreation
opportunities;
churches; youth
programs;
rurality; lack of
jobs(income to
buy drugs)
Parental
involvement;
churches; outreach
programs; teachers
who listen; lack of
gang activity;
small town
atmosphere
Relative wealth;
employment
opportunities;
education; strong
rural families;
churches; small
community
culture;
mandatory
employee drug
screening
Strengths
from
Inventories
Adanta Behavior
Health Services
including
adolescent and
female
treatment;
Phoenix
Preferred Care
services; UNITE
coalition
activities; inschool
prevention
programs; AA;
county extension
youth programs;
community
center; state
Champions
program
Pathways, Inc.
mental health and
counseling
services,
drug court; church
involvement; state
Champions
program; UNITE
coalition activities;
school prevention
programs; after
school care;
Kiwanis
community
programs
Rockbridge
Community
Services Board
services; school
prevention
efforts;
knowledgeable
sheriff’s drug
officer;
recreation
facilities;
concerned DHS
personnel
Mt. Rogers
Community
Services Board
services; school
enforcement
officer; classroom
prevention
programs; VA
National Guard
programs;
vigorous county
administration
involvement; drug
coalition activities
Potomac
Highlands Guild
services including
adolescent
treatment; sheriff
officer in schools;
Making Healthy
Choices 4-H/
school camp; AA,
county extension
youth programs
Profiles:
5.81% of
population
5.67% of
population
7.36% of
population
2.45% of
population
2.91% of
population
2.61% of
population
Gaps
identified
from focus
groups
Residential
treatment; more
school
prevention
programs
Gaps
identified
from
Inventories
Access* to
residential
treatment
30-day +
Residential
treatment; faithbased youth
residence; half-way
houses; treatment
for women; Action
programs in
schools; more state
involvement
Access* to
residential
treatment
Needing but
not receiving
treatment for
alcohol use
Profiles:
Needing but
not receiving
treatment for
drug use
7.05% of
population
Summer youth
programs;
strict
medication
controls at
health centers
and mental
health
facilities;
ruralness;
small
community
setting and
culture
FRMS Health
System
Mother
program and
adolescent
program;
school
partnerships;
school-based
wellness
centers; after
school
activities;
concerned
county health
department;
county
extension
youth
programs
6.00% of
population
6.35% of
population
2.575% of
population
2.35% of
population
2.91% of
population
Drug coalition;
Prevention
programs in
schools; local
residential
beds; adequate
emergency
mental health
plan
Local hot line that
is not tied to 911;
better total health
care
More AA
programs, more
law enforcement;
prevention
programs for
adults; treatment
options for women
More
treatment
facilities;
specific local
data
Access* to
residential and
outpatient
treatment;
school
prevention
programs
Access* to
treatment,
residential
treatment
Access* to
treatment,
residential
treatment
Access* to
treatment,
residential
treatment
*Access to treatment: transportation, payment options, privacy issues in rural community, and treatment choice within the
community.
208
Table 7.4. Gaps In Available Data For Planning At the Local Level
NORC** DATA
SOURCES Used for Preparation of County
Profiles and as measure of high/low
substance abuse prevalence/mental health
status in Appalachian counties
2000 median home value from US
Census*
Percentage of persons in correctional or
juvenile institutions from Area Resource
file (calculated)*
Area Resource File (calculated from past
3 years and population size)
CASAP* DELPHI PROCESS DATA
SETS suggested as measures of high/low
substance abuse prevalence/mental health
status in Appalachian counties
COMMUNITY/COUNTY DATA
(from case studies) as measure of
county level substance abuse
prevalence/mental health status
Socio-economic status
Poverty rates
Per capita incarceration rate for drug
offense
Substance abuse related arrests per
capita/1,000
Drunk & impaired driving arrests
Suicide rate
Overdose death Rates
Child Abuse and Neglect reports
Drug related Child Protective Services
interventions/ Social Service
investigations
Birth Certificate data on maternal
smoking and substance abuse
Prescription rates of abused drugs
Service utilization rates for Substance
Abuse /Mental Health treatment
Mortality from alcohol or drug related
causes
Accident rates from AOD related causes
Substance abuse screening tests
conducted by schools and employers
Behavioral Risk Factor Survey
Alcohol abuse or dependence in past year
from 2002-2004 National Survey on Drug
Use and Health (pooled)
Abuse or dependence of any illicit drugs
in past year from 2002-2004 National
Survey on Drug Use and Health(pooled)
Non-prescription use of pain killers in
past year from 2002-2004 National
Survey on Drug Use and Health(pooled)
Percentage of persons having serious
psychological distress problems in past
year from 2002-2004 National Survey on
Drug Use and Health (pooled)
209
(Partial correlation) local EMS
data (response calls, ODs)
Table 7.4. Gaps In Available Data For Planning At the Local Level
NORC** DATA
SOURCES Used for Preparation of County
Profiles and as measure of high/low
substance abuse prevalence/mental health
status in Appalachian counties
CASAP* DELPHI PROCESS DATA
SETS suggested as measures of high/low
substance abuse prevalence/mental health
status in Appalachian counties
COMMUNITY/COUNTY DATA
(from case studies) as measure of
county level substance abuse
prevalence/mental health status
Percentage of persons in mental health
hospitals or institutions from Area
Resource file (calculated)
Index on Health Professional Shortage
Area status from 2003 codes of HPSA for
Primary Medical Care and for Mental
Health from the Area Resource file
School Surveys: KIPS, PRIDE,
Search Institute’s 40
Developmental Assets
Community Planning
Assessments
Local Police Reports
Anecdotal information from
teachers, churches, community
members
Note: Variables marked with an asterix (*) indicate that the variable used is a proxy for the variable suggested by CASAP
through the Delphi process.
Case Study Appendix of Model Programs
Model programs or best practices demonstrate a technique, activity or methodology that through
research, experience and replication, reliably provides:
Effective and desired result(s);
Ethical and equitable outcome(s);
Adaptability to similar environments; and
Opportunities for innovation.
Through the National Registry of Evidence-based Programs and Practices (NREPP)
(http://nrepp.samhsa.gov), the Substance Abuse and Mental Health Services Administration
(SAMHSA) has designated the following programs as effective models to address substance abuse and
mental health: Too Good for Drugs; Parenting Wisely; Life Skills Training; Protecting Me/Protecting
You; and Strengthening Families.
The following are examples of programs being used in the focus group counties:
KY-ASAP (Agency for Substance Abuse Policy)
KY-ASAP was created in 2000 by the Kentucky General Assembly to promote the reduction of
alcohol, tobacco and other drug use in Kentucky by working with communities to help them identify
210
existing needs and resources. There are currently 72 local ASAP boards that cover 111 of 120 counties
in the Commonwealth. The local boards consist of stakeholders in each county or multi-county
jurisdiction. ASAP has become a vital part of substance abuse prevention and treatment efforts in
many of Kentucky’s communities. http://odcp.ky.gov/kyasap.htm
Champions for a Drug Free Kentucky – Kentucky Office of Drug Control Policy
Champions for a Drug-Free Kentucky was established in 1986. The Champions coalitions promote the
prevention of alcohol, tobacco and other drugs along with the reduction of violence in Kentucky
communities. The Champions program provides assistance for communities desiring to form a
coalition and provides state oversight and funding opportunities for established coalitions. Ninety-five
Champions coalitions have been established in 104 counties throughout the state. Champions
coalitions function as a substance abuse prevention catalyst. The coalitions are comprised of people
who care about the quality of life in their communities. http://odcp.ky.gov/champions.htm
Life Skills 4 Kids
Life Skills 4 Kids from The Million Dollar Machine (MDM) is a comprehensive Life Skills
Enrichment Program designed to benefit children in grades K-6 with Robot-Taught Assembly
Programs. The program includes major components that also address the learning objectives of
Character Education, Health Education and Drug Prevention. http://www.lifeskills4kids.com
BABES
The Beginning Alcohol and Addictions Basic Education Studies (BABES) is a primary prevention
program designed to teach children how to live a happy, healthy, drug and tobacco free life. Trained
volunteers using puppets impart information designed to enable children to grasp the importance of
good decision making skills. This program is designed to help children understand and develop skills
necessary to cope with unhappy situations, promote self-esteem, define peer pressure and make good
choices. http://www.aodc.org/BABES.html
Second Step
Based on more than 15 years of classroom application and the most current academic, social, and
emotional research, the Second Step curriculum focuses on three essential competencies: empathy,
impulse control and problem solving, and anger management. The Second Step program teaches
Elementary students how to deal with emotions, resist impulsive behavior, resolve conflict, solve
problems and understand the consequences of their actions. Teachers model and reinforce the skills
taught in the lesson. http://www.cfchildren.org/programs/ssp/overview
Too Good for Drugs
Too Good For Drugs™ (K–8) is a school-based prevention program designed to reduce risk factors
and enhance protective factors related to alcohol, tobacco and other drug (ATOD) use among students.
Too Good For Drugs™ (K-8) has a separate, developmentally-appropriate curriculum for each grade
level. Each curriculum builds on earlier grade levels with an instructional design to enable students to
learn and retain skills. http://www.mendezfoundation.org/educationcenter/tgfd/index.htm
211
Safe and Drug Free Schools
The Office of Safe and Drug-Free Schools (OSDFS) administers, coordinates, and recommends policy
for improving quality and excellence of programs and activities that are designed to provide financial
assistance for drug and violence prevention activities and activities that promote the health and well
being of students in elementary and secondary schools, and institutions of higher education.
http://www.ed.gov/about/offices/list/osdfs/index.html
D.A.R.E.
D.A.R.E. (Drug Abuse Resistance Education) is a collaborative program between local law
enforcement and local schools to educate students about the personal and social consequences of
substance abuse and violence. D.A.R.E.'s primary mission is to provide children with the information
and skills they need to live drug-and-violence-free lives, to equip them with tools to enable children to
avoid negative influences, and to allow them to focus on their strengths. It seeks to establish positive
relationships between students and law enforcement, teachers, parents, and other community leaders.
http://www.dare.com
Parenting Wisely
Parenting Wisely is a self-administered, interactive, multimedia CD-ROM program that reduces family
conflict and child behavior problems by improving parenting skills and enhancing family
communication and mutual support, supervision, and discipline. Parents can use it alone, in a group, or
with a practitioner. The program targets parents with children 9 to 18 years of age.
Parenting Wisely, developed at Ohio University, is an alternative or complement to existing family
interventions. The developer used his knowledge of the Functional Family Therapy model and
experience with program dissemination to create a program that would reduce or eliminate many of the
barriers that keep at-risk families from receiving good family interventions. The resulting prototype, an
interactive computer disk, was field-tested in 11 southern (Appalachia) Ohio counties under an Office
of Juvenile Justice and Delinquency Prevention Formula Grant. http://www.familyworksinc.com/
Protecting Me/Protecting You
Protecting You/Protecting Me® (PY/PM®) is an alcohol use prevention curriculum for children in
grades 1-5. PY/PM works to reach children before they have fully shaped their attitudes and opinions
about alcohol use and educates them about their role in preventing it. The curriculum focuses on the
effects of alcohol on the developing brain during the first 21 years of life. http://www.pypm.org
Virginia Tobacco Settlement
Funds from the Virginia Tobacco Settlement Foundation fund programs like All Stars, Al’s Pals,
Creating Lasting Families, Not On tobacco, Positive Action, Project Alert, Project EX, Project Toward
No Tobacco Use, Ending Nicotine Dependence, Helping Teens Stop Using Tobacco (TAP),
212
Intervening with Teen Tobacco Users (TEG), Know Your Body, Life Skills Training, Project Toward
No Drug Use, Skills for Adolescence, and Too Good for Drugs. http://www.vtsf.org
Virginia National Guard Drug Demand Reduction Program (DDRP)
The Virginia National Guard supports coordinated community education and prevention programs and
works with at-risk youth to develop values, skills and self discipline.
http://vko.va.ngb.army.mil/VirginiaGuard
Drug Coalitions
Operation UNITE
Launched in April 2003 by Fifth District Congressman Harold “Hal” Rogers, Operation UNITE serves
29 counties in southern and eastern Kentucky. It is divided into five coalition service regions. Every
county has at least one UNITE coalition and conducts its own program activities. Morgan and Wayne
Counties each have a volunteer coalition. Operation UNITE’s mission is to rid communities of illegal
drug use through undercover narcotics investigations and the coordination of treatment for substance
abusers; the goal is to provide support to families and friends of substance abusers and public
education about the dangers of drug use. UNITE educates and activates individuals by developing and
empowering community coalitions to refuse to accept or tolerate drug culture.
Wayne County Operation UNITE: Sponsors Neighbors UNITED, a community watch activity;
Celebrate Recovery, a faith-based support program; Hooked on Fishing Not on Drugs and Kid’s
Fishing Derby (http://www.futurefisherman.org ), a copyrighted program of the Future Fisherman
Organization; three school anti-drug clubs; Red Ribbon Week at the schools; a Back-to-School Bash
fair; the safe and drug-free graduation bowling activity; safe Halloween activities; and a Christmas
parade.
Morgan County UNITE: Sponsors six school anti-drug clubs; Hooked on Fishing; various speakers;
joint activities with other community groups and schools and the Kentucky Drug Endangered Children
network; EMT training about drugs; neighborhood watch training; Red Ribbon Week activities; and
safe Halloween activities. Morgan County UNITE also helps to fund a local adult circuit drug court.
http://www.operationunite.org
Bland County (VA) CADDY: Organized in 2006 with help from a matching grant from the
Appalachian Regional Commission as a result of participation in a regional Appalachian substance
abuse conference, Operation CADDY (Coalition Against Drugs Destroying Youth) in Bland County
(VA) seeks to increase the knowledge of community leaders about the importance of providing
positive alternatives and protective factors for youth, young adults and their families and effective
implementation of comprehensive prevention programs.
Hardy County (WV) Prevention Partnership: A function of the West Virginia Prevention Resource
Center Office community development initiative, the partnership counts over 50 stakeholders from
education, medicine, law enforcement, county extension offices, the media, mental and behavioral
treatment, churches, and government as members.
213
Monroe County (WV) Prevention Coalition: A community wide partnership dedicated to reducing
substance abuse, underage use, and associated risky behaviors through effective prevention strategies
that include: policy setting; education; communication; programming; mentoring; and role modeling.
Community Services
ASAP programs
Alcohol and Substance Abuse Prevention (ASAP), a workplace substance abuse and prevention
program available in Kentucky and Virginia, was developed to implement and maintain programs
which aim to reduce the incidence of drug and alcohol abuse in the workplace and deter drug and
alcohol use. http://www.asap-programs.com
County Extension Services
State county extension services with offices in each U.S. county function as agencies within the U.S.
Department of Agriculture through state land grant colleges. Children and families at risk for negative
outcomes such as infant mortality, malnourishment, child abuse and neglect, poor health, substance
abuse, teenage pregnancy, crime, violence, and academic underachievement are served by these
agencies. 4-H clubs and activities are youth organizations administered by the Cooperative Extension
System with the mission of "engaging youth to reach their fullest potential while advancing the field of
youth development."
While all counties in the study have active cooperative extension services, Hardy County (WV)
cooperative extension co-sponsors a Health Choices camp for elementary and middle school youth
during the school day, in conjunction with school staff, that reinforces healthy behaviors including
alcohol, substance use and tobacco prevention activities. http://www.csrees.usda.gov/Extension
Alcoholics Anonymous (AA)
Alcoholics Anonymous® groups are locally organized and based on a fellowship of men and women
who share experiences to support each other to solve common problems and help others recover from
alcoholism. Bath, Bland, Hardy, Monroe, and Wayne counties all have active AA meetings. Narcotics
Anonymous is a similarly organized community-based association of recovering drug addicts. Only
Wayne County (KY) has meetings of Narcotics Anonymous.
http://www.alcoholics-anonymous.org
County Profiles
The county profiles used during the site visits are included as Appendix D at the end of this report.
214
CHAPTER 8: Conclusions
As the first effort to explore substance abuse and mental health issues and access to treatment
services within Appalachia, and between Appalachia and the rest of the United States, this report
augments the scant body of literature in these areas. In doing so, we hope to inform the direction of
substance abuse and mental health research and policy in Appalachia, and provide information to
better allocate and target resources to eliminate substance use and mental health disparities within
the region. Analyses included in this report explore patterns across Appalachian sub-regions, across
levels of economic development within the region, within Appalachian coal-mining areas, and
between Appalachia and the rest of the United States.
Overall Conclusions
This study provides an in-depth synthesis of the available data on substance abuse and mental health
disorders, and access to treatment services, in Appalachia. There are several findings worthy of
emphasis given their consistency across the Appalachian region, and across data sets. The
consistency of these findings suggests possible areas of focus for targeting region-wide resources to
eliminate Appalachian mental health and substance use disparities. Findings demonstrate that:
Mental health is a key area of concern in Appalachia. Independent from substance abuse, mental
health diagnoses for serious psychological distress and major depressive disorder are
proportionately higher in Appalachia than in the rest of the nation. This is an important finding in
that it suggests that Appalachian disparities in mental health status do not appear to arise as a result
of higher levels of co-occurrence with substance abuse. Consistent with this finding, hospital
discharge data show that Appalachian residents have a lower proportion of diagnoses for substance
abuse only, and for co-occurring substance abuse and mental health problems, as compared to the
rest of the nation.
It is important to note, however, that findings from the case studies and from discussions with
members of the Coalition on Appalachian Substance Abuse Policy (CASAP) suggest that medical
care system factors related to reimbursement could encourage under-reporting of comorbidity rates
within the region. While this study has not identified any evidence that suggests that underreporting happens more often in Appalachia than in other regions, future work should explore this
issue. Specifically, studies should investigate whether any systematic bias exists in the way mental
health and substance abuse coverage and payment is managed within the Appalachian Region.
While alcohol is the predominant substance of abuse both nationally and within Appalachia, use
patterns differ. Proportionately fewer Appalachian adults used alcohol in the past year, as
compared to adults nationally. Among those who did use alcohol, proportionately fewer
Appalachian adults reported binge alcohol use and heavy alcohol use in the past year as compared
to adults nationally. Among adolescents, however, heavy alcohol use was a greater problem within
Appalachia than outside of Appalachia. For Appalachian coal mining areas, the proportion of
people entering treatment for alcohol abuse is lower than in other areas of Appalachia.
Methamphetamine is not as large of a problem within Appalachia as is widely believed. Findings
do not support that methamphetamine use is higher in Appalachia than elsewhere in the nation.
215
Rather, methamphetamine use and admission rates are demonstrably lower across Appalachia.
While regional trends show that methamphetamine use is rising, the rate of increase is similar to
that of the rest of the nation. While there are likely to be “pockets of abuse” within the region,
rates are lower within the region as a whole.
The growing proportion of admissions for primary abuse of other opiates and synthetics is a key
issue in Appalachia. Admission rates for the primary abuse of other opiates and synthetics26 are
higher in Appalachia than in the rest of the nation. Further, while rates are rising both across the
nation and in Appalachia, the rate of increase in Appalachia is greater. This is particularly the case
in Appalachian coal mining areas.
In many ways, access to treatment is better in Appalachia when compared to the rest of the
nation. In terms of accepted forms of payment, and availability of substance abuse family
counseling and mental health assessment upon admission, we see that access to treatment is better
in Appalachia when compared to the rest of the U.S. Overall, proportionately more adults in the
Appalachian region with mental health problems received outpatient mental health treatment
counseling services and prescription medical services in the past year, as compared to adults outside
the Appalachian region. There is no significant difference between Appalachian adolescents and
adults and adolescents and adults outside of the region in terms of the proportion of persons who
need but do not receive treatment for an illicit drug problem.
Outpatient rehabilitation is the most common setting for substance abuse treatment in
Appalachia. Access to inpatient treatment, and short and long-term non-hospital residential
treatment for substance abuse or mental health illnesses, is less common within the Appalachian
region. Findings from the national household survey indicate that outpatient rehabilitation is the
most common setting for substance abuse treatment in Appalachia. Of the people over age 18 who
received substance abuse treatment at a specialty facility in the past year, proportionately fewer
people in Appalachia received treatment at an inpatient rehabilitation facility than people outside of
Appalachia. At the same time, utilization rates of hospital inpatient services, the private doctor’s
office, and emergency room services are all higher in the Appalachian region than outside of the
Appalachian region. One interpretation of this finding is that people who have severe substance
abuse problems have not received appropriate outpatient treatment or regular inpatient services, and
as a result, use more expensive emergency room services. The case study counties also reported
having access to outpatient treatment, but difficulties in getting access to inpatient and long-term
residential treatment facilities. In fact, no case study county had inpatient facilities for either
substance abuse or mental health and most reported difficulty placing those needing long term
outpatient treatment. Results from the survey of substance abuse treatment facilities indicate that
significantly fewer Appalachian facilities offer short term and long-term non-hospital residential
substance abuse treatment when compared to facilities outside the Appalachian region.
Barriers to treatment for substance abuse and mental illnesses exist within the Appalachian
region, including transportation issues, cultural factors, and stigma. The case studies revealed a
number of specific barriers to accessing treatment for substance abuse and mental health illnesses,
including: stigma; transportation availability; limited payment options; privacy issues; choice of
facilities; and cultural and family barriers.
26
These drugs include codeine, hydrocodone, hydromorphone, meperidine, morphine, opium, oxycodone, pentazocine,
propoxyphene, tramadol, and any other drug with morphine-like effects except methadone.
216
Better data are needed at the local level to inform policy and allocate resources to more
effectively address substance abuse and mental health problems in the Appalachian region.
Findings from the case studies showed that community-level substance abuse treatment and mental
health leaders do not have uniformly available county and state data from which to draw
conclusions about the magnitude of substance abuse and mental health issues within their
communities. Additionally, they do not generally use nationally-available data sets to make
decisions about local response to substance abuse and mental health issues. While they may use
state data, especially when it supports applications for grant funding for prevention programs, more
often than not, anecdotal evidence is most often used as the basis for informing local decision
making. These findings do not suggest a disregard for the data, but rather the lack of utility in how
data are presented and a disconnect between the levels of analysis (generally state or regional) and
the level of service delivery (local). Improved data collection at the national, state and local levels,
including larger sample sizes, may lead to more informed community-level decision making with
respect to resource allocation and program development.
Taken together, these findings suggest that disparities do exist in the Appalachian region for
specific substance use and mental health disorders. While some of these disparities exist across the
Appalachian region, even more can be learned by looking at a more granular level. Specifically,
findings demonstrate particular disparities related to Appalachian sub-region, county economic
distress level, and within coal-mining areas. A sampling of these findings is highlighted below:
Findings Across Appalachian Sub-Regions (Northern; Central; Southern)
The central Appalachian region had the highest proportion of admissions with other opiates
or synthetics as the primary reason for admission.
The highest prevalence of mood disorders occurs in the northern Appalachian sub-region.
The central sub-region of Appalachia has the greatest density of admissions for psychiatric
problems – both substance-related and non-substance-related.
Non-medical use of prescription drugs among adolescents is higher in the central and
southern sub-regions of Appalachia, as compared to the northern sub-region.
Findings Across Economic Status Levels (Attainment; Competitive; Transitional; At-Risk;
Distressed)
There is a positive relationship between the economic development levels and private
insurance for both adults and adolescents; distressed and at-risk counties have the lowest
rates of private insurance, and competitive and attainment counties have the highest rates of
private insurance.
Medicare and Medicaid/CHIP payments are highest in at-risk and distressed counties and
lowest in competitive and attainment counties.
Competitive and attainment counties have the lowest rates of non-medical use of
prescription drugs among adolescents, followed by transitional counties and distressed and
at-risk counties.
217
Patients in the Appalachian region are more likely to be admitted through the emergency
department than patients outside of the Appalachian region. This disparity appears to be
concentrated in at-risk and transitional counties, as compared to other counties.
Findings for the Appalachian Coal Mining Region
Proportionately more females than males were admitted to treatment in coal mining areas
than in other areas of Appalachia.
People less than 24 years of age accounted for more admissions in coal mining areas than in
other areas.
The percentage of admissions with heroin use and other opiates or synthetics use as the
primary, secondary or tertiary reason for treatment is significantly higher in coal mining
areas than in other parts of the Appalachian region.
Other illicit drug use and non-medical use of prescription drugs are also cited more as the
primary, secondary or tertiary reasons for treatment in coal mining areas than in other areas.
Implications for Policy Interventions
Among the notable findings from this study were differences in patterns of substance use and
mental health status among adolescents as compared to adults. This suggests that targeted
interventions are needed for the prevention and treatment of both substance abuse and mental health
concerns.
Adolescents
While Appalachian adolescents demonstrate similar substance use patterns for cocaine, marijuana,
and methamphetamine, rates of non-medical use of psychotherapeutics, cigarettes, and heavy
alcohol use are higher as compared to adolescents across the United States. Non-medical use of
psychotherapeutics is a problem for adolescents nationwide, with rates exceeding those of adults.
Rates for Appalachian adolescents are even higher. Similarly, for adolescents, rates of heavy
alcohol use were higher in Appalachia than outside of Appalachia.
The picture of substance use and mental health concerns among Appalachian adolescents becomes
even clearer when analyses are conducted by county economic status level, suggesting that
economic status plays a key role in mental health and substance abuse issues. Findings demonstrate
that adolescents in distressed and at-risk Appalachian counties – compared to adolescents in other
Appalachian counties – have the highest rate of non-medical use of psychotherapeutics. Cigarette
and alcohol use are also key concerns for adolescents in Appalachia. Proportionately more
adolescents reported heavy alcohol use inside Appalachia than outside of Appalachia. Similarly,
proportionately more adolescents used cigarettes in Appalachia than outside of Appalachia; usage
was higher for lifetime use, past year use, and past-month use.
On the positive side, proportionately more treatment facilities in Appalachia offer substance abuse
family counseling than in facilities outside of Appalachia. This suggests a regional understanding of
the need for treatment services for adolescents and their families. While adolescents in at-risk and
218
distressed counties have the lowest rate of private health insurance, we see that across Appalachia,
more adolescents have Medicaid/ CHIP coverage than adolescents in other areas of the country.
Several federally-commissioned nationwide efforts are underway to explore substance use and
mental health challenges facing adolescents, and to raise awareness about mental health, and
alcohol and drug abuse.27 Such efforts are needed, and should be expanded/targeted toward at-risk
and distressed areas in Appalachia. Both quantitative and qualitative findings from this study
suggest that preventive measures are needed to address substance abuse and mental health issues
among Appalachian adolescents. While treatment is important, there is a clear need for an
“upstream” approach focused on prevention. Given that our case study findings suggest that
problems often arise due to issues such as boredom and lack of hope, community interventions may
appropriately focus on school/after-school settings.
This is not to say that medical treatment is unimportant, however. Given the magnitude of many of
the problems seen among Appalachian adolescents, treatment is clearly needed. While many
Appalachian facilities do treat adolescents, there still remain cost/insurance barriers that need to be
addressed. It is essential that policymakers and community leaders consider both treatment and
prevention measures as they craft interventions to reduce the burden of substance use and mental
health concerns among Appalachian adolescents.
Many Appalachian communities are clearly doing their part in working to prevent drug use and
promote mental health. Case study communities report active school-based prevention activities,
after-school youth activities, anti-drug coalition activities, mentoring programs, wellness classes,
health camps, mentoring programs, sports, and recreational activities. Community representatives
from the case study counties have described the utility of and growing demand for programs such as
Beginning Alcohol and Addictions Basic Education Studies (BABES), Too Good For Drugs™ (K–
8), D.A.R.E. (Drug Abuse Resistance Education), LifeSkills4Kids, and others. Future work should
explore the effectiveness of community-based prevention programs in Appalachia.
Adults
Whereas substance abuse issues are of primary concern among Appalachian adolescents, overall
substance abuse rates among Appalachian adults are proportionately lower as compared to adults
nationally. This is true across substances, including alcohol, non-medical use of
psychotherapeutics, marijuana, methamphetamine, and cocaine. While substance use rates are
lower, however, we see proportionately higher rates of serious psychological distress and major
depressive episodes as compared to adults nationally, suggesting that mental health concerns may
be of primary interest when targeting efforts towards Appalachian adults. Importantly, these mental
health concerns occur independent from substance use, rather than as a result of co-occurring
disorders.
A look at hospital discharge data shows specific mental health conditions that appear more
prevalent within the Appalachian region, with significantly more Appalachian adults having
diagnoses of: anxiety disorders; delirium, dementia, and amnesic and other cognitive disorders;
developmental disorders (includes communication disorders, developmental disabilities, intellectual
27
http://www.helpingamericasyouth.gov/conf-tsu.cfm
219
disabilities, learning disorders, and motor skill disorders); impulse control disorders; and personality
disorders.
In looking at treatment, an important finding is that Appalachian adults are more likely to access
treatment through the emergency room, especially in distressed and at-risk counties. This suggests
that Appalachian adults are more likely to seek treatment later, and may be less likely to recognize
the magnitude of their mental health and substance use issues. This is consistent with findings that
Appalachian residents are more likely to report stigma, not feeling the need for treatment, and fear
of commitment, as reasons for not seeking treatment. Similar findings are also reflected in the case
studies, where community participants reported cultural barriers, stigma, and stoicism as reasons for
Appalachian residents not seeking treatment.
Among substances of abuse, alcohol remains the predominant concern among Appalachian adults.
While overall use rates, heavy use rates and binge drinking rates are all lower as compared to adults
nationally, alcohol is the mostly widely used and abused substance within the region, and the
primary reason for Appalachian adults seeking substance abuse treatment. Interestingly, the
dynamics of substance use and abuse differ within the coal mining region of Appalachia, with
treatment rates for alcohol use being lower than in other parts of the region. The percentage of
admissions for heroin use and other opiates or synthetics use as the primary, secondary or tertiary
reason for treatment is significantly higher in coal mining areas than in other parts of the
Appalachian region, however.
As with adolescents, these findings suggest the need for targeted initiatives to address mental health
and substance abuse issues among Appalachian adults. The nature of these issues differs among
adolescents and adults, however, with mental health concerns rising as a primary area of concern
among adults. Perhaps the most critical finding relative to Appalachian adults is the need to focus
on these mental health concerns, independent from substance abuse, and to develop programs to
overcome cultural barriers to treatment and issues of stigma that may result in more admissions
occurring through emergency room settings.
One caveat to this recommendation is the finding that, within the coal mining region of Appalachia,
abuse of heroin and other opiates and synthetics appears to be a primary substance abuse concern.
Targeted prevention and treatment efforts are needed to address these concerns.
Key Recommendations to Guide Future Policy and Research Efforts
This study is the first effort to investigate the state of mental health status and substance abuse
prevalence at the most granular level possible across Appalachia. While our research has provided
a picture of the state of the region, much remains to be learned about mental health status and
substance abuse prevalence in Appalachia, and access to treatment services.
We believe there are any number of recommendations that could be offered to guide future policy
and research efforts. We offer four key recommendations to stimulate and improve future research
efforts, and thereby inform mental health and substance abuse policy and community-level
programs:
220
1. Richer data are needed to enable analyses at the county and community levels to fully
understand the extent of substance abuse and mental health problems in Appalachia.
Recognizing that interventions take place at the community level, and that substance use and
mental health patterns differ from community to community, local-level data are clearly needed
to most appropriately target initiatives and ensure the optimal use of limited resources. While
our findings are instructive in guiding the allocation of region-wide resources, and targeting
resources based on factors such as Appalachian sub-region and county economic development
level, local-level data are needed to inform local interventions. Our case study findings also
revealed that better coordinated data collection, documentation and analysis are needed for
Appalachian communities to access resources at state and federal levels. This study serves as a
call to action to improve primary data collection with representative sampling in and for the
Appalachian region. Leadership from the federal, regional, and local levels is needed to ensure
that researchers and practitioners have access to more comprehensive data sets to explore these
issues across the Appalachian region.
2. Studies are needed to determine the quality of substance abuse and mental health
services being delivered in Appalachian treatment facilities.
Studies are needed to determine the quality of services being delivered in Appalachian treatment
facilities. The data only tell us that a service, such as inpatient detoxification, is offered; we do
not know about the quality of the service delivered, or whether the service has been received by
the patient. Thus, our findings cannot speak to the quality of care received in Appalachian
treatment facilities versus other facilities nationwide. Such studies would answer questions such
as:
How do we measure the quality of services delivered across the region?
Do patients perceive the services they receive to be of a high quality?
Are there differences in the quality of services being delivered for co-occurring and nonco-occurring disorders?
3. Future work should include outcome assessments and other evaluations of the
effectiveness of clinical and community-based mental health and substance abuse
interventions in Appalachia.
We know little about the effectiveness of clinical treatments and community-based prevention
programs and interventions in Appalachia. Outcome assessments and evaluations of the
221
effectiveness of mental health and substance abuse interventions in Appalachia are needed.
Studies are needed to address the following questions:
Are interventions perceived as effective in treating mental health and substance abuse
disorders in the region?
Are community-based interventions effective in preventing illness?
Are patients placed on waiting lists for certain services?
What are the clinical outcomes of specific interventions?
4. Creative solutions should be explored to address concerns over the lack of available
inpatient care.
Findings indicate that there are regional difficulties in accessing inpatient treatment services. At
the same time, the data show that utilization rates of hospital inpatient services, private
physicians, and emergency room services are all higher in the Appalachian region than outside
of the Appalachian region. One possible interpretation of these finding is that people who have
severe substance abuse problems have not received appropriate outpatient treatment and may
not have access to inpatient services at drug treatment facilities, and as a result, use more
expensive hospital inpatient and emergency room services. The case study findings were
consistent with this interpretation, as counties reported difficulties in accessing inpatient
facilities for either substance abuse or mental health, and difficulties in placing those needing
long term outpatient treatment. One possible cost effective way to create an inpatient treatment
infrastructure in the Appalachian region may be to pool resources across counties and develop
regional inpatient treatment units.
By providing an in-depth analysis and synthesis of available data on substance abuse and mental
health disorders, and access to treatment services in Appalachia, we believe this study can be useful
in targeting region-wide resources to eliminate Appalachian mental health and substance abuse
disparities. At the same time, however, we recognize that more work needs to be done to promote
community level analyses. Only then will Appalachian communities have sufficient understanding
of the nature of the substance use and mental health issues within their communities to address these
concerns effectively. A major finding of this study is that data collection efforts should be
strengthened to encourage such granular analyses at the county and community levels. When
supplemented with studies exploring the quality of services being delivered and the effectiveness of
both medical and community-based interventions in Appalachia, communities will be fully
empowered to make effective decisions on resource allocation and develop both prevention and
treatment initiatives responsive to the unique and complex interplay of socioeconomic, cultural, and
health system factors in the Appalachian region.
222
APPENDIX A: Data Sources
Source Information
CHAPTER 2:
National Survey on Drug
Use and Health
(NSDUH), Substance
Abuse and Mental Health
Services Administration
(SAMHSA)
Population and
Contents of
Investigation
Substance use and
mental disorders
among civilian, noninstitutionalized
population of the
U.S., age 12 or older.
Years: 2000 – 2004
Type of source: Data from
treatment facilities
CHAPTER 4:
Healthcare Cost and
Utilization Project,
(HCUP), Nationwide
Inpatient Sample, Agency
for Healthcare Research
and Quality (AHRQ)
Years: 2004
Type of source: Discharge
data from community
hospitals
CHAPTER 5:
National Survey of
Substance Abuse
Treatment Services (NSSATS), Substance Abuse
and Mental Health Services
Administration
(SAMHSA)
Number of Appalachian States
Included: 13
Number of Appalachian Counties
Included: 352
Sample Size: 217,978 respondents
Type of source: Household
survey data
Comparing Regional Data
to the U.S.
Number of Appalachian Facilities
Included: N/A
Years: 2002 – 2005
CHAPTER 3:
Treatment Episode Data
Set (TEDS), Substance
Abuse and Mental Health
Services Administration
(SAMHSA)
Characteristics of the Data
Location,
characteristics, and
utilization of all
alcohol and drug
treatment facilities
and services, both
public and private,
throughout the 50
States, the District of
Columbia, and other
U.S. jurisdictions.
Number of Appalachian States
Included: 12 (Excludes WV)
Substance abuse and
mental disorder
related clinical and
resource use
information available
from discharge
abstracts of records
of hospital stays from
about 1,000 hospitals
sampled to
approximate a 20
percent stratified
sample of U.S.
community hospitals.
Number of Appalachian States
Included: 6 (Includes NC, KY, VA,
WV, NY, MD)
Demographic and
substance abuse
characteristics of
annual admissions to
treatment for abuse
of alcohol and drugs
in facilities that
report to individual
State administrative
data systems.
Number of Appalachian States
Included: 13
Number of Appalachian Counties
Included: 195
Appalachian counties are compared to
non-Appalachian counties for the
following variables: demographic
characteristics; health insurance status;
lifetime, past year, and past month
substance use; substance dependence or
abuse, mental health measures, and
receipt of substance use treatment; access
to alcohol treatment; access to drug
treatment; reasons for not receiving
substance use treatment; and reasons for
not receiving mental health treatment.
Data from Appalachia is compared to
U.S. data for the primary substance of
abuse at the time of admission to
treatment between 2000 and 2004.
Number of Appalachian Facilities
Included: N/A
Sample Size: 511,217 total
admissions
Number of Appalachian Counties
Included: 45
Number of Appalachian Hospitals
Included: 52
Sample Size: 5,666,341 inpatient
stays total
Number of Appalachian Counties
Included: 318
Number of Appalachian Facilities
Included: 891
Appalachian counties are compared to
non-Appalachian counties for the
following variables: demographic
characteristics across economic
development status level; hospital stay
characteristics; presence of MHSA;
subtype of MHSA stays; comorbidity
status; diagnoses contain alcohol use
disorder; diagnoses contain mental health
disorder; principal reason for
hospitalization was alcohol use; principal
reason for hospitalization was drug use;
and types of SAMH diagnoses for
adolescents and adults.
Appalachian counties are compared to
non-Appalachian counties for the
following variables: Ownership of
substance abuse treatment facilities;
characteristics of substance abuse
treatment facilities (accredited by
Commission on Accreditation of
Rehabilitation Facilities, licensed/
certified by public health department,
arrangements/ contracts with managed
Source Information
Population and
Contents of
Investigation
Characteristics of the Data
to the U.S.
Years: 2005
Sample Size: 13,367 substance
abuse treatment facilities
Type of source: Data on
admissions to substance
abuse treatment services
CHAPTER 6:
Coal Mining Data from
HCUP and TEDS
See above in HCUP
and TEDS.
HCUP
Number of Appalachian Counties
Included: 45 (25 coal mining, 20
non-coal mining)
Years: 2004, 2005
Sample Size: 167,957 total
hospital admissions (76,083
admissions from coal mining
Appalachian counties; 91,874
from non-coal mining
Appalachian counties)
Type of source: Data from
HCUP and TEDS, see
above
Comparing Regional Data
TEDS
care organizations, receives public
funds); services offered at substance
abuse treatment cacilities, facilities
offering inpatient detoxification services;
primary focus of substance abuse
facilities; facilities accepting adolescents;
facilities using a sliding fee scale;
facilities offering free or no charge
treatment; facilities that accept Medicare;
facilities that accept Medicaid; facilities
that accept state financed health
insurance; and facilities that accept
private health insurance.
No comparisons are made between the
Appalachian region and the U.S., as this
was not the scope of this chapter. Rather,
we compare coal-producing Appalachian
counties to non-coal producing
Appalachian counties for the following
variables: heroin use as primary,
secondary, or tertiary reason for
treatment; other opiates or synthetics use
as primary, secondary, or tertiary reason
for treatment; characteristics of hospital
stays; characteristics of admissions to
substance abuse specialty treatment;
treatment-related characteristics of
admissions to substance abuse treatment;
and substance abuse characteristics of
admissions to substance abuse treatment.
Number of Appalachian Counties
Included: (86 coal mining)
Sample Size: 511,317 total
hospital admissions (211,380
admissions from coal mining
Appalachian counties; 299,837
from non-coal mining
Appalachian counties)
CHAPTER 7:
Case Studies with
Twinned Appalachian
Counties
Six counties were
selected using a
‘socioeconomic
twinning’
methodology, and
community
stakeholders
participated in
discussions about
perceptions of mental
health and substance
abuse issues in their
communities.
Number of Appalachian Counties
Included: 6
Number of Appalachian States
Included: 3
224
While this chapter was qualitative in
nature, NORC produced county profiles
of substance abuse and mental health
characteristics that compared countylevel data for six Appalachian counties in
three states to state-level data.
APPENDIX B: Literature Review of the Prevalence of Substance Abuse
and Mental Health Disorders, Access to Treatment Services, and
Disparities in Appalachia
Introduction
In Appendix B, we provide a review of the literature related to substance abuse and mental health
disorders in Appalachia, access to treatment services, and related disparities in Appalachia. When
Appalachia-specific literature has not been available, we have referenced literature on rural
substance abuse and mental health disparities as a proxy for Appalachia.
Methods
In order to obtain the most relevant articles for this review, we conducted extensive searches using
PubMed, Sociological Abstracts, Lexis/Nexis and Google Scholar. We also used articles cited in
relevant journals as sources of information and drew upon reports commissioned by government
agencies such as ARC and SAMHSA. Finally, we obtained recommended literature sources from
experts in Appalachian research, rural research, and mental health and substance abuse research. A
special focus was placed on articles with an Appalachia-wide focus, articles with county-level data
obtained from nationally-representative datasets, and articles that offered potential solutions for
reducing mental health and substance abuse disparities.
We have organized our findings using Kilbourne et al’s conceptual framework for advancing health
disparities research (Kilbourne et al, 2006). Using an epidemiological framework, Kilbourne et al
divided disparities research into three phases: detection (defining disparities and identifying
vulnerable populations), understanding (identifying the causes and contributing factors of
disparities), and reducing disparities (identifying successful interventions and policies which lead
to a reduction in disparities).
DETECTION
Overall Prevalence of Substance Abuse and Mental Health Disorders
Though substance abuse is often assumed to be an urban problem, data have consistently shown no
significant difference in rates of mental health disorders and drug and alcohol abuse between rural
and non-rural areas (Hartley, Bird and Dempsey 1999, Robertson and Donnermeyer 1998,
Leuekefeld et al 2002). These findings have also been supported by large national surveys: data
from the 2004 National Survey on Drug Use and Health found that 8.2% of those living in nonmetropolitan areas met criteria for past year alcohol and/or drug abuse, compared to 9.6% in
metropolitan areas (SAMHSA Office of Applied Studies, 2005) and the 1991 Comorbidity Survey
found no statistical difference in the prevalence of mental health or substance use disorders between
urban and rural residents (Simmons and Havens 2006).
Differences in prevalence do exist based on type of substance used, however. For example, many
states in the Appalachian region have smoking rates that are higher than the national average
(Doescher et al 2006) and women in West Virginia were found to have the highest rate of pre-natal
225
smoking (Song and Fish 2006). OxyContin® has been mentioned frequently in the media as a major
problem in Appalachia and rural areas, and the data, while scant, support that contention.
Leukenfeld et al (2005) explored prescription drug use, health services utilization, and health
problems in rural Appalachian Kentucky. As part of a larger project designed to examine the
effectiveness of two HIV/AIDS risk reduction interventions, Leukenfeld et al studied 295 subjects
on felony probation from one of 30 Appalachian counties in Eastern Kentucky. Subjects were
divided into two groups: those who had ever used OxyContin and those who had never used
OxyContin. Findings suggested statistical differences between the OxyContin-using and non-using
subjects. OxyContin users reported greater use of other substances and more emergency room
treatments for drug overdose more often than the non-users. Additionally, OxyContin users sought
detoxification and self-help more often than the non-users.
In addition, research conducted by the Maine Rural Health Research Center has demonstrated that
2.8% of young adults in the smallest rural areas use OxyContin® as compared to 1.7% of urban
young adults, and similarly that young adults in the smallest rural areas report methamphetamine
use at nearly twice the rate of urban young adults (2.9% vs. 1.5%). Differences for both OxyContin
and methamphetamine, while appearing small, were in fact statistically significant (Maine Rural
Health Research Center, June 2007).
Findings from the Maine Rural Health Research Center also noted that while OxyContin and
methamphetamine rates were higher in small rural areas, the rates of alcohol abuse were particularly
striking. Children aged 12-17 from the smallest rural areas are more likely to have used alcohol,
engaged in binge drinking (defined as having 5 or more drinks on a single occasion), heavy drinking
(defined as binge drinking on 5 or more occasions within a month) and driving under the influence
(DUI) than urban children. Among young adults, the highest rates of binge drinking, heavy
drinking, and DUI are seen in larger, non-adjacent rural areas. Findings demonstrated that fortyeight percent of young adults in larger rural areas have engaged in binge drinking in the past month
(Maine Rural Health Research Center, 2007).
Though there are many nationally representative surveys that provide insight into the prevalence of
mental health and substance use disorders in Appalachia and rural areas, it is important to
understand the limitations of these data. Hartley et al (2002) suggest that survey data based on self
report may represent an underestimation of true mental health and substance use disorder
prevalence. For example, rural areas have higher suicide rates which may be indicative of greater
unreported prevalence of depressive disorders. Furthermore, hospital based data may under-report
drug and alcohol related injury due to the restrictions of laws that allow insurers to refuse payment
for services rendered due to drug or alcohol use. Prescription drug data may also be problematic.
For example, Anglin and White’s 1999 study of prescription drug problems in Eastern Kentucky
describe a scenario where Eastern Kentucky clinics were chastised for seemingly over prescribing
Tylenol Three (a specific dosage of Tylenol with Codeine), when in reality, they had a majority of
patients who were insured through Medicaid and Tylenol Three was the only pain medicine on the
formulary. It appeared that they were over-prescribing this medication, but in fact, they were underprescribing the wider variety of painkillers.
Disparities in Treatment Utilization and Access
Kilbourne et al define disparities as “observed clinically and statistically significant differences in
health outcomes or health care use between socially distinct vulnerable and less vulnerable
226
populations that are not explained by the effect of selection bias.” The authors identify vulnerable
populations as people who face physical, psychological and/or social health risks because of
“differences in underlying social status” due to multiple factors such as race/ethnicity, gender, rural
residence and Appalachian residence. Rurality is likely a key factor driving disparities in treatment
access and utilization for Appalachian residents, and race/ethnicity may also play a role in driving
disparities within certain Appalachian sub-regions.
Several studies have found that compared to urban residents, rural individuals are less likely to
utilize drug and alcohol treatment (Warner and Leukefeld 2001, Simmons and Havens 2006). This
is likely at least partially attributable to the availability of specialty mental health treatment and
substance abuse treatment, which has been shown to be significantly lower in rural areas (Hartley et
al 1999, SAMHSA 2003). Further, Fortnay et al found that increased travel time, a common rural
concern, was associated with poor treatment compliance and health outcomes regarding chronic
conditions (Fortnay et al 1999). However, distance from treatment services may be a less important
factor than access to a car for personal use or having a friend or relative willing to provide
transportation (Arcury et al 2005).
Disparities in treatment utilization may be higher among nonwhite Appalachian residents. The
Great Smoky Mountains Study, which compared white and Native American Appalachian youth in
Western North Carolina, found similar opportunities to access treatment among white and Native
American children, but that Native American children utilized fewer services (Costello et al 1997).
They also found that Native American children had higher rates of substance abuse and co-morbid
substance abuse and mental health disorders. Another study, based on the Great Smoky Mountains
study, compared white children with African-American children (Angold et al 2002), finding that
despite similar prevalence of mental health and substance use disorders and no difference in ability
to access treatment, African-American youth had lower usage of specialty mental health services.
UNDERSTANDING
The Relationship Between Rural Residence and Disparities in Treatment Access in
Appalachia
We have described above that despite having similar prevalence of mental health and substance use
disorders, rural residents experience disparities in treatment utilization and access. Socioeconomic
conditions as well as cultural factors serve as barriers to treatment utilization in Appalachia. Factors
relating to the health care system also contribute to the problems of substance abuse and lack of
treatment.
It is impossible to discuss disparities in Appalachia without a discussion of socioeconomic
conditions. Economic decline based on struggles in the mining and farming industries have resulted
in out-migration and dismantling of kinship networks (Goodrum et al 2004). Recently, researchers
have drawn comparisons between these rural areas and highly distressed urban ghettos, describing
their similar problems of economic deprivation, lack of opportunity, social isolation and
disintegrating kinship networks (Schoenberger et al 2006).
Cultural factors also contribute to the disparities in treatment utilization and access among rural and
Appalachian people. Multiple authors have cited the rural values of individualism and self reliance
as a barrier to treatment utilization (Leukefeld et al 2002, Schoenberger et al 2006). For example,
227
Warner and Leukefeld’s study of rural-urban differences in substance abuse treatment utilization
among prisoners in Kentucky found that the most common reason that rural prisoners did not seek
substance abuse treatment was because they did not think they had a problem. This was the key
determinant of lower rates of treatment utilization among rural prisoners, even though rural
prisoners indicated higher rates of substance use than urban prisoners. Data from the Treatment
Episode Data Set (TEDS) found that people in rural treatment centers were more likely to have been
referred to treatment through the criminal justice system than people in urban treatment centers
(SAMHSA, 2005), indicating that those attending rural treatment centers may have not recognized
that they had a substance abuse problem. High rates of co-morbid substance abuse and mental
health disorders can also be explained by the problem of lack of recognition of a need for treatment.
Simmons and Havens have suggested that these high rates of co-morbid conditions are caused by
people with mental health disorders not knowing to seek treatment for their mental health
conditions, and instead, medicating with drugs and alcohol.
Lack of adequate insurance and other health care system issues also contribute to both the
prevalence of substance use disorders and access/utilization. Anglin and White’s study of an
Eastern Kentucky community clinic serving a distressed uninsured and under-insured Appalachian
area identified various problems with prescription drug misuse. They found that due to financial
constraints, informal networks of prescription sharing develop, causing prescription misuse. This
misuse is not due to patients wanting to abuse drugs, but because patients are unable to afford
appropriate supplies of their medications and have to pool their resources within their communities.
They also state that some who become reliant on pain medication did so because they were unable
to afford treatment for the chronic condition causing their pain. Havens et al (2006) found that the
highest rates of OxyContin® prescribing among Kentucky Medicaid recipients occurred in the
ARC-designated distressed Appalachian counties as opposed to non-Appalachian counties and nondistressed Appalachian counties and called for further research into the cause of this overprescribing.
Clearly, disparities in treatment access and utilization in Appalachia result from a complex interplay
of rurality, socioeconomic, cultural, and health system factors.
REDUCING DISPARITIES
Key strategies for reducing disparities are education (both geared towards prevention and treatment
options), improved surveillance tools, criminal justice system issues (treatment in prison, drug
courts) and heath system issues (culturally-competent healthcare delivery and increased staffing in
rural areas). The literature related to substance abuse and mental health disparities in Appalachia
suggests several methods to reduce disparities related to prevalence and treatment.
Education is a critical method for overcoming disparities in both prevalence and treatment access.
Leukefeld et al found that rural substance abusers in a Kentucky prison had a much later onset of
drug and alcohol use than urban prisoners. This indicates that there is a greater window of
opportunity for rural young people and that preventive efforts may be a good option for
Appalachian youth. This becomes especially critical because rates of methamphetamine and
OxyContin® use are higher among rural youth, as described above. Educating both providers and
consumers regarding signs of a substance abuse or mental health disorder is also critical because of
the lack of recognition of having a substance abuse problem described above. Community-level
228
education about the benefits of treatment would provide a great benefit in rural and Appalachian
areas. Mental health-related education may also be helpful for African-American and Native
American parents due to the lower rates of mental health services utilization among AfricanAmerican and Native American children with mental health disorders.
Improved surveillance systems are also needed to allow policymakers and stakeholders to better
understand of the impact of substance abuse in Appalachia. Cicero et al describe a surveillance
system set up to detect high rates of OxyContin® and other prescription drug diversion. Using a
network of key informants, the authors developed a surveillance system to show when an area is
having an increased problem, allowing stakeholders to know when a particular diverted drug is
becoming a problem in their community. Leukefeld et al used a unique method to improve
estimation of drug injection prevalence in rural Kentucky (2002) which also provided insight
regarding the numbers of injection drug users who are not in treatment. This type of data will allow
state and local governments to more effectively allocate resources and address disparities.
A best practice to reduce the impact of substance abuse (and especially methamphetamine abuse) in
Appalachia may be the use of drug courts. This recommendation was generated through a meeting
of Appalachian stakeholders organized by East Tennessee State University in 2005. The potential
benefits of this strategy can be seen based on the TEDS data described above, which found that
people in rural treatment centers were more likely in treatment as a result of a court order. Other
authors (Kubiak et al 2006, Mateyoke-Schrivner et al 2004, Warner and Leukefeld 2001) found the
usage of drug courts and/or treatment within prisons and jails to be a key opportunity for reducing
disparities in treatment utilization among rural and Appalachian substance abusers. Given that a
lack of recognition of a substance abuse problem is a key barrier to treatment entry, drug courts and
prison/jail in-house treatment offer a unique opportunity to ensure treatment access for a population
that is hard to identify and unlikely to self-select into treatment.
Finally, the health care system also can provide opportunities to address substance use and mental
health disparities in the Appalachian region. Rural areas have fewer available treatment facilities
and those that do exist are often understaffed. Mental health staff in rural health centers can access a
large number of vulnerable patients and are essential to improving access to mental health services
(Van Hook and Ford 1998). Telemedicine and self help groups may also reduce these disparities,
although transportation may be a problem in accessing self-help groups in rural areas (Ralph in
Hartley, 1999).
Health care providers in Appalachia, especially when providing information about sensitive topics
such as mental health and substance abuse, should be trained in effective communication and
culturally competent healthcare delivery (Behringer and Friedell 2006, Anglin and White 1999).
Clinicians who are able to gain the trust of patients can be more effective in increasing awareness of
these issues. Furthermore, clinicians who are more familiar with Appalachian cultural norms will be
better equipped to understand their patient’s struggles. Anglin and White also call for greater
oversight regarding written prescriptions of commonly diverted drugs so that providers who are
over prescribing for financial benefit are identified, a key issue in areas with high rates of
prescription drug diversion.
229
WHAT HAVE WE LEARNED?
Much remains to be learned about mental health status and substance abuse prevalence in
Appalachia. Studies have found that substance use is higher in Appalachia than the rest of the
nation for certain types of substances. While a body of research has explored mental health status
in rural communities, few studies have explored mental health status in Appalachian communities
specifically. Future research should explore geographic and demographic trends across
Appalachian sub-regions and states, and within Appalachian counties.
The literature also suggests that disparities in access to and utilization of treatment for substance
abuse and mental health disorders in Appalachia result from a complex interplay of socioeconomic,
cultural, and health system factors. Some studies indicate that there is a relationship between rural
residence and disparities in treatment access in Appalachia, but further research must be done on
this topic. Research should also investigate the impact of socioeconomic, cultural and health
system factors on treatment access and utilization at the state and county levels in Appalachia.
Studies have suggested that race and ethnicity may play a role in driving disparities within certain
Appalachian sub-regions. Specifically, studies have demonstrated that non-white Appalachian
residents have lower utilization of treatment services, including specialty mental health services,
and higher rates of substance abuse and co-morbid substance abuse and mental health disorders.
Literature has identified various mechanisms to reduce disparities related to treatment access and
utilization in Appalachia – methods include education, cultural competency training for providers,
surveillance systems, and changes to the health care system (e.g., more mental health staff in rural
health centers, health care via telemedicine, and treatment via self help groups). Future research
should explore the effectiveness of these methods in specific Appalachian communities.
Overall, research to date does not provide a comprehensive understanding of substance abuse
prevalence and mental health status, and disparities in access to and utilization of treatment services
in Appalachia. Moving forward, research should investigate more granular patterns and trends
related to substance abuse prevalence and mental health status in Appalachia. The identification of
geographic and demographic patterns within specific sub-regions, counties, and communities will
enable policy makers to design targeted policy interventions to reduce disparities and improve
access to treatment services.
230
Bibliography
Anglin MK and White JC. (1999) Poverty, Healthcare and Problems of Prescription Medication: A
Case Study. Substance Use and Misuse 34(14) 2073-2093.
Angold A, Erkanli A, Farmer EMZ, Fairbank JA, Burns BJ, Keeler G, and Costello EJ. (2002)
Psychiatric Disorder, Impairment and Service Use in Rural African American and White Youth.
Arch Gen Psychiatry, 59, 893-901.
Arcury TA, Preisser JS, Gesler WM, and Powers JM. (2005). Access to Transportation and Health
Care Utilization in a Rural Region. The Journal of Rural Health, 21(1), 31-38.
Behringer B and Friedell GH. (2006) Appalachia: Where Place Matters In Health. Preventing
Chronic Disease: Public Health Research, Practice and Policy. 3(4), 1-4.
Black DA and Sanders SG. (2004). Labor Market Performance, Poverty and Income Inequality in
Appalachia. Report to the Appalachian Regional Commission.
Bradley DH, Herzenberg SA and Wial H. (2001) An Assessment of Labor Force Participation Rates
and Underemployment in Appalachia. Report to the Appalachian Regional Commission.
Cicero TJ, Inciardi JA and Muñoz A. (2005) Trends in Abuse of OxyContin® and Other Opioid
Analgesics in the United States: 2002-2004. The Journal of Pain 6(10), 662-672.
Diala CC, Muntaner C and Walrath C. (2004) Gender, Occupational and Socioeconomic Correlates
of Alcohol and Drug Abuse among U.S. Rural, Metropolitan and Urban Residents. The American
Journal of Drug and Alcohol Abuse 30(2), 409-428.
Doescher MP, Jackson JE, Jerant A, and Hart LG. (2006) Prevalence and Trends in Smoking: A
National Rural Study. The Journal of Rural Health, 22(2), 112-118.
Feldman JJ, Makuc DM, Kleinman JC and Cornoni-Huntley J. (1989). National Trends in
Educational Differentials in Mortality. American Journal of Epidemiology, 129(5), 919-933.
Feser E and Sweeney S. (2003) Out-Migration, Depopulation, and the Geography of US Economic
Distress. International Regional Science Review, 26(1), 38-67.
Garrity TF, Hiller ML, Staton M, Webster JM and Leukefeld CG. (2002) Factors Predicting Illness
and Health Services Use among Male Kentucky Prisoners with a History of Drug Abuse. The
Prison Journal, 82(3), 295-313.
Goodrum S, Wiese HJ and Leukefeld CG. (2004). Urban and Rural Differences in the Relationship
Between Substance Abuse and Violence. International Journal of Offender Therapy and
Comparative Criminology, 48(5), 613-628.
Halverson, J. (2004) An Analysis of Disparities in Health Status and Access to Care in the
Appalachian Region. Report to Appalachian Regional Commission, September 2004.
231
Hartley D, Britain C and Sulzbacher S. (2002). Behavioral Health: Setting the Rural Health
Research Agenda. The Journal of Rural Health, 18(Suppl), 242-255.
Hartley D, Bird DC, and Dempsey P. Rural Mental Health and Substance Abuse. Rural Health in
the United States. New York: Oxford University Press, 1999.
Hartley D, Agger M and Miller M. (1998). Effects of Managed Mental Health Care on Service Use
in Rural Areas. Working Paper #16. Maine Rural Research Center.
Hartley D. (2004) Rural Health Disparities, Population Health and Rural Culture. American Journal
of Public Health, 94(10), 1675-1678.
Havens JR, Talbert JC, Walker R, Leedham C and Leukefeld CG. (2006). Trends in ControlledRelease Oxycodone (OxyContin®) Prescribing among Medicaid Recipients in Kentucky, 19982002. The Journal of Rural Health 22(3) 276-278.
Herman-Stahl MA, Krebs CP, Kroutil LA, and Heller DC. (2006) Risk and Protective Factors for
Nonmedical Use of Prescription Stimulants and Methamphetamine among Adolescents. Journal of
Adolescent Health 39, 374-380.
Isserman AM. (2005) In the National Interest: Defining Rural and Urban Correctly in Research and
Public Policy. International Regional Science Review, 28(4), 465-499.
Isserman AM and Westervelt J. (2006) 1.5 Million Missing Numbers: Overcoming Employment
Suppression in County Business Patterns Data. International Regional Science Review, 29(3), 311335.
Keefe, S. (2005). Appalachian Cultural Competency: A Guide For Medical, Mental Health, And
Social Service Professionals. Knoxville: University of Tennessee Press, 2005.
Kubiak SP, Arfken CL, Swartz JA and Koch AL. (2006) Treatment at the front end of the criminal
justice continuum: the association between arrest and admission into specialty substance abuse
treatment. Substance Abuse Treatment, Prevention and Policy 1:20.
Leukefeld C, McDonald HS, Mateyoke-Scribner A, Roberto H, Walker R, Webster M, and Garrity
T. (2005) Prescription Drug Use, Health Services Utilization, and Health Problems in Rural
Appalachian Kentucky. Journal of Drug Issues Summer 2005, 631-644.
Leukefeld CG, Narevic E, Hiller ML, Staton M, Logan TK, Gillespie W, Webster JM, Garrity TF
and Purvis R. (2002) Alcohol and Drug Use among Rural and Urban Incarcerated Substance
Abusers. International Journal of Offender Therapy and Comparative Criminology 46(6), 715-728.
Leukefeld CG, Logan TK, Farabee D and Clayton, R. (2002) Drug Use and AIDS: Estimating
Injection Prevalence in a Rural State. Substance Use and Misuse, 37(5-7), 767-782.
Logan TK, Schenck JE, Leukefeld CG, Meyers J and Allen S. (1999) Rural Attitudes, Opinions and
Drug Use. Substance Abuse and Misuse 34(4&5), 545-565.
232
Maine Rural Health Research Center. (June 2007) Substance Abuse Among Rural Youth: A Little
Meth and a Lot of Booze. Research and Policy Brief. University of Southern Maine, Muskie
School of Public Health. Supported by the federal Office of Rural Health Policy, Health Resources and
Services Administration, U.S. Department of Health and Human Services, CA#U1CRH03716.
Mateyoke-Scrivner A, Webster JM, Staton M and Leukefeld C. (2004) Treatment Retention
Predictors of Drug Court Participants in a Rural State. The American Journal of Drug and Alcohol
Abuse 30(3), 605-625.
Miller JW, Gfroerer JC, Brewer RD, Naimi TS, Mokdad A and Giles WH. (2004) Prevalence of
Adult Binge Drinking: A Comparison of Two National Surveys. American Journal of Preventive
Medicine 27(3), 197-204.
Partridge MD and Rickman DS. (2005) High Poverty Nonmetropolitan Counties in America: Can
Economic Development Help? International Regional Science Review, 28(4), 41-440.
Pollard KM (2003). Appalachia at the Millennium: An Overview of Results from Census 2000.
Report for Appalachian Regional Commission.
Plein LC. (2001). Welfare Reform in a Hard Place: The West Virginia Experience. Rockefeller
Report, No. 13.
Probst JC, Moore CG and Baxley EG. (2005) Update: Health Insurance and Utilization of Care
Among Rural Adolescents. The Journal of Rural Health, 21(4), 279-287.
Robertson E and Donnermeyer JF. (1998). Patterns of Drug Use among Nonmetropolitan and Rural
Adults. Substance Use and Misuse 33(10), 2109-2129.
Robertson EB, Sloboda Z, Boyd GM, Beatty L and Kozel NJ, eds. (1997) Rural Substance Abuse:
State of Knowledge and Issues. NIDA Research Monograph 168.
Office of Applied Studies. Substance Abuse and Mental Health Services Administration. Treatment
Admissions in Rural Areas: 2003. The DASIS Report, September 30, 2005.
Office of Applied Studies. Substance Abuse and Mental Health Services Administration. Distance
to Substance Abuse Treatment Facilities among Those with Alcohol Dependence or Abuse. The
DASIS Report, August 23, 2002.
Office of Applied Studies. Substance Abuse and Mental Health Services Administration.
Methamphetamine/Amphetamine Treatment Admissions in Urban and Rural Areas: 2004. The
DASIS Report, Issue 27, 2006.
Office of Applied Studies. Substance Abuse and Mental Health Services Administration. Substance
Abuse or Dependence in Metropolitan and Non-Metropolitan Areas: 2004 Update. The NSDUH
Report, October 7, 2005.
233
Schoeneberger ML, Leukefeld CG, Hiller ML and Godlaski T. (2006). Substance Abuse among
Rural and Very Rural Drug Users at Treatment Entry. The American Journal of Drug and Alcohol
Abuse, 32, 87-110.
Smedley BD, Stith AY and Nelson AR, eds. (2003) Unequal Treatment: Confronting Racial and
Ethnic Disparities in Healthcare. Washington DC: The National Academies Press, 215-234.
Song H and Fish M. (2006) Demographic and Psychosocial Characteristics of Smokers and
Nonsmokers in Low-Socioeconomic Status Rural Appalachian 2-Parent Families in Southern West
Virginia. The Journal of Rural Health, 22(1), 83-87.
Van Hook MP and Ford ME. (1998) The linkage model for delivering mental health services in
rural communities: benefits and challenges. Health & Social Work 23(1), 53-60.
Warner, BD and Leukefeld CG. (2001) Rural-Urban Differences in Substance Use and Treatment
Utilization among Prisoners. American Journal of Drug and Alcohol Abuse 27(2), 265-280.
Weber B, Jensen L, Miller K, Mosley J, and Fisher M. (2005). A Critical Review of Rural Poverty
Literature: Is There Truly a Rural Effect? International Regional Science Review, 28(4), 381-414.
Wood LE. (2005). Trends in National and Regional Economic Distress: 1960-2000. Report to the
Appalachian Regional Commission.
Wood LE and Bischak GA. (2000). Progress and Challenges in Reducing Economic Distress in
Appalachia: An Analysis of National and Regional Trends Since 1960. Report to the Appalachian
Regional Commission.
Woodward A. (2004). Access to Substance Abuse Treatment and Mental Health Services: A
Literature Review. In Health Services Utilization by Individuals with Substance Abuse and Mental
Disorders. Council, CL, ed., Department of Health and Human Services, Substance Abuse and
Mental Health Services Administration, Office of Applied Studies.
http://oas.samhsa.gov/HSR/ch2.htm
234
APPENDIX C: Results from the 2005 National Survey on Drug Use and
Health: National Findings
Note: Estimates are based on combined 2004 – 2005 data.
Table 2.1A Demographic Characteristics and Health Insurance among Persons Aged 12 or
Older, by Age Group and Appalachian Region Status: Numbers in Thousands, Annual
Averages Based on 2002-2005
Demographic
Characteristic/Health
Insurance
HISPANIC ORIGIN
AND RACE
Not Hispanic or
Latino
White
Black or African
American
Other2
Hispanic or Latino
EDUCATION
< High School
High School
Graduate
Some College
College Graduate
CURRENT
EMPLOYMENT
Full-Time
Part-Time
Unemployed
Other3
HEALTH
INSURANCE
Private
Medicare
Medicaid/CHIP4
AGE GROUP
12-17
Appalachian
Region1
Outside
Appalachia
18 or Older
Appalachian
Outside
Region1
Appalachia
1,826
19,099
17,590
170,094
1,579
212
13,922
3,545
15,851
1,330
135,270
22,629
34
49
1,632
4,106
408
351
12,195
26,025
N/A
N/A
N/A
N/A
3,653
6,889
33,182
61,045
N/A
N/A
N/A
N/A
4,090
3,308
49,674
52,219
N/A
N/A
N/A
N/A
N/A
N/A
N/A
N/A
9,161
2,144
616
6,020
109,116
25,854
7,047
54,103
1,268
14
502
15,771
202
5,442
12,844
3,928
1,607
140,071
34,575
15,331
Source: SAMHSA, Office of Applied Studies, National Survey on Drug Use and Health, 2002, 2003, 2004, and 2005.
*Low precision; no estimate reported.
N/A: Not applicable.
1
Appalachian region is defined as all areas covered by the 410 designated counties in 13 states.
Includes respondents reporting American Indian or Alaska Native, Native Hawaiian or Other Pacific Islander, Asian, and Two or
More Races.
3
The Other Employment category includes retired persons, disabled persons, homemakers, students, or other persons not in the labor
force.
4
CHIP is the Children's Health Insurance Program. Individuals aged 19 or younger are eligible for this plan.
2
235
Table 2.2A Lifetime, Past Year, and Past Month Substance Use among Persons Aged 12 or
Older, by Substance, Age Group, and Appalachian Region Status: Numbers in Thousands,
Annual Averages Based on 2002-2005
Substance
AGE GROUP
12-17
Appalachian
Region1
MARIJUANA USE
Lifetime
Past Year
Past Month
COCAINE USE
Lifetime
Past Year
Past Month
METHAMPHETAMINE
USE
Lifetime
Past Year
Past Month
ALCOHOL USE
Past Year
Binge Alcohol Use2
Heavy Alcohol Use2
CIGARETTE USE
Lifetime
Past Year
Past Month
PAST YEAR NONMEDICAL
USE OF
PSYCHOTHERAPEUTICS3
Outside
Appalachia
18 or Older
Outside
Appalachian
Appalachia
Region1
355
270
131
4,440
3,402
1,777
6,855
1,498
878
84,818
20,283
11,820
47
36
10
581
409
131
2,097
389
139
31,432
4,913
1,899
26
13
6
296
170
58
714
75
32
10,656
1,140
479
633
198
54
7,897
2,454
588
10,948
3,697
1,216
137,605
47,995
14,326
690
446
306
198
6,844
4,256
2,690
2,027
13,606
6,191
5,543
1,013
141,234
59,583
51,961
11,632
Source: SAMHSA, Office of Applied Studies, National Survey on Drug Use and Health, 2002, 2003, 2004, and 2005.
*Low precision; no estimate reported.
1
Appalachian region is defined as all areas covered by the 410 designated counties in 13 states.
Binge Alcohol Use is defined as drinking five or more drinks on the same occasion (i.e., at the same time or within a couple of
hours of each other) on at least 1 day in the past 30 days. Heavy Alcohol Use is defined as drinking five or more drinks on the same
occasion on each of 5 or more days in the past 30 days; all heavy alcohol users are also binge alcohol users.
3
Nonmedical use of prescription-type psychotherapeutics includes the nonmedical use of pain relievers, tranquilizers, stimulants, or
sedatives and does not include over-the-counter drugs.
2
236
Table 2.3A Substance Dependence or Abuse, Mental Health Measures, and Receipt of
Substance Use Treatment in the Past Year among Persons Aged 12 or Older, by Age Group
and Appalachian Region Status
Dependence or Abuse/Mental
Health/Receipt of Treatment
AGE GROUP
Numbers in Thousands, Annual Averages Based on 2002-2005
12-17
Appalachian
Region1
DEPENDENCE OR ABUSE2
Illicit Drugs3
Alcohol
Both Illicit Drugs and
Alcohol3
Illicit Drugs or Alcohol3
PAST YEAR SERIOUS
PSYCHOLOGICAL DISTRESS4
PAST YEAR MAJOR
DEPRESSIVE EPISODE5
PAST YEAR RECEIPT OF
SPECIALTY TREATMENT
FOR ILLICIT DRUG OR
ALCOHOL USE3,6
MENTAL HEALTH
TREATMENT/COUNSELING7
Inpatient
Outpatient
Prescription Medication
Outside
Appalachia
18 or Older
Appalachian
Outside
Region1
Appalachia
97
111
47
1,202
1,351
542
444
1,156
187
5,277
15,686
2,470
162
N/A
2,010
N/A
1,414
2,426
18,493
22,999
165
2,043
1,460
14,970
17
163
155
1,879
N/A
N/A
2,429
25,304
N/A
N/A
N/A
N/A
N/A
N/A
160
1,303
2,155
1,668
13,891
20,645
*Low precision; no estimate reported.
N/A: Not applicable.
1
Appalachian region is defined as all areas covered by the 410 designated counties in 13 states.
2
Dependence or abuse is based on definitions found in the 4th edition of the Diagnostic and Statistical Manual of Mental Disorders (DSM-IV).
3
Illicit Drugs include marijuana/hashish, cocaine (including crack), heroin, hallucinogens, inhalants, or prescription-type psychotherapeutics used
non-medically.
4
Serious Psychological Distress (SPD) is defined as having a score of 13 or higher on the K6 scale. Due to questionnaire changes, these combined
2004 and 2005 estimates are not comparable with 2004 and earlier estimates published in prior NSDUH reports. See Section B.4.4 in Appendix B of
the Results from the 2005 National Survey on Drug Use and Health: National Findings. Estimates are based on combined 2004-2005 data.
5
Major Depressive Episode (MDE) is defined as a period of at least 2 weeks when a person experienced a depressed mood or loss of interest or
pleasure in daily activities and had a majority of the symptoms for depression as described in the 4th edition of the Diagnostic and Statistical Manual
of Mental Disorders (DSM-IV). Estimates are based on combined 2004-2005 data.
6
Received Substance Use Treatment at a Specialty Facility refers to treatment received at a hospital (inpatient), rehabilitation facility (inpatient or
outpatient), or mental health center in order to reduce or stop illicit drug or alcohol use, or for medical problems associated with illicit drug or
alcohol use. Estimates include persons who received treatment specifically for illicit drugs or alcohol, as well as persons who received treatment but
did not specify for what substance(s).
7
Mental Health Treatment/Counseling is defined as having received inpatient care or outpatient care or having used prescription medication for
problems with emotions, nerves, or mental health. Respondents were not to include treatment for drug or alcohol use. Respondents with unknown
treatment/counseling information were excluded. Estimates were based only on responses to items in the Adult Mental Health Service Utilization
module.
Source: SAMHSA, Office of Applied Studies, National Survey on Drug Use and Health, 2002, 2003, 2004, and 2005.
237
Table 2.4A Demographic Characteristics and Health Insurance among Persons Aged 12 or
Older Residing in Appalachian Region, by Age Group and Appalachian Sub-region
Demographic
Characteristic/Health
Insurance
AGE GROUP
Numbers in Thousands, Annual Averages Based on 2002-2005
12-17
Central
Southern
Northern
18 or Older
Central
Southern
835
165
826
7,875
1,597
8,117
777
38
160
2
642
172
7,463
269
1,546
28
6,842
1,034
19
18
4
3
12
28
143
86
24
21
242
243
N/A
N/A
N/A
N/A
N/A
N/A
1,296
3,352
497
648
1,861
2,889
N/A
N/A
N/A
N/A
N/A
N/A
1,806
1,507
306
169
1,978
1,633
N/A
N/A
N/A
N/A
N/A
N/A
N/A
N/A
N/A
N/A
N/A
N/A
3,911
1,023
288
2,739
698
146
62
713
4,552
975
266
2,568
617
4
191
84
1
71
566
9
239
5,893
1,775
647
1,032
451
233
5,918
1,702
727
Northern
HISPANIC ORIGIN
AND RACE
Not Hispanic or
Latino
White
Black or African
American
Other1
Hispanic or Latino
EDUCATION
< High School
High School
Graduate
Some College
College Graduate
CURRENT
EMPLOYMENT
Full-Time
Part-Time
Unemployed
Other2
HEALTH
INSURANCE
Private
Medicare
Medicaid/CHIP3
*Low precision; no estimate reported.
NOTE: Appalachian region is defined as all areas covered by the 410 designated counties in 13 states.
N/A: Not applicable.
1
Includes respondents reporting American Indian or Alaska Native, Native Hawaiian or Other Pacific Islander, Asian, and Two or More Races.
2
The Other Employment category includes retired persons, disabled persons, homemakers, students, or other persons not in the labor force.
3
CHIP is the Children's Health Insurance Program. Individuals aged 19 or younger are eligible for this plan.
Source: SAMHSA, Office of Applied Studies, National Survey on Drug Use and Health, 2002, 2003, 2004, and 2005.
238
Table 2.5A Lifetime, Past Year, and Past Month Substance Use among Persons Aged 12 or
Older Residing in Appalachian Region, by Substance, Age Group, and Appalachian Sub-region
Substance
AGE GROUP
Numbers in Thousands, Annual Averages Based on 2002-2005
12-17
Central
Southern
Northern
18 or Older
Central
Southern
164
128
64
30
21
7
162
121
59
3,094
713
438
535
107
61
3,226
678
379
19
15
5
4
3
1
25
19
4
937
181
65
125
27
7
1,035
181
67
10
4
1
3
1
1
13
8
4
315
21
5
34
5
1
365
50
26
313
105
28
49
14
4
272
79
21
5,515
1,958
654
705
226
66
4,727
1,513
496
304
203
141
77
71
41
29
18
315
202
136
103
6,125
2,799
2,511
395
1,219
598
537
104
6,262
2,794
2,495
514
Northern
MARIJUANA USE
Lifetime
Past Year
Past Month
COCAINE USE
Lifetime
Past Year
Past Month
METHAMPHETAMINE
USE
Lifetime
Past Year
Past Month
ALCOHOL USE
Past Year
Binge Alcohol Use1
Heavy Alcohol Use1
CIGARETTE USE
Lifetime
Past Year
Past Month
PAST YEAR
NONMEDICAL USE OF
PSYCHOTHERAPEUTICS2
*Low precision; no estimate reported.
NOTE: Appalachian region is defined as all areas covered by the 410 designated counties in 13 states.
1
Binge Alcohol Use is defined as drinking five or more drinks on the same occasion (i.e., at the same time or within a couple of hours of
each other) on at least 1 day in the past 30 days. Heavy Alcohol Use is defined as drinking five or more drinks on the same occasion on
each of 5 or more days in the past 30 days; all heavy alcohol users are also binge alcohol users.
2
Nonmedical use of prescription-type psychotherapeutics includes the nonmedical use of pain relievers, tranquilizers, stimulants, or
sedatives and does not include over-the-counter drugs.
Source: SAMHSA, Office of Applied Studies, National Survey on Drug Use and Health, 2002, 2003, 2004, and 2005.
239
Table 2.6A Substance Dependence or Abuse, Mental Health Measures, and Receipt of Substance Use Treatment in
the Past Year among Persons Aged 12 or Older Residing in Appalachian Region, by Age Group and Appalachian
Sub-region
Dependence or Abuse/Mental
Health/Receipt of Treatment
AGE GROUP
Numbers in Thousands, Annual Averages Based on 2002-2005
12-17
Central
Southern
Northern
18 or Older
Central
Southern
46
56
24
5
7
3
47
48
19
192
574
87
50
78
20
202
504
81
77
N/A
10
N/A
75
N/A
680
1,123
108
270
626
1,034
74
15
76
638
177
645
7
1
9
79
9
67
N/A
N/A
N/A
1,085
248
1,095
N/A
N/A
N/A
N/A
N/A
N/A
N/A
N/A
N/A
57
554
946
16
120
232
87
628
977
Northern
DEPENDENCE OR ABUSE1
Illicit Drugs2
Alcohol
Both Illicit Drugs and
Alcohol2
Illicit Drugs or Alcohol2
PAST YEAR SERIOUS PSYCHOLOGICAL
DISTRESS3
PAST YEAR MAJOR DEPRESSIVE
EPISODE4
PAST YEAR RECEIPT OF SPECIALTY
TREATMENT FOR ILLICIT DRUG OR
ALCOHOL USE2,5
MENTAL HEALTH
TREATMENT/COUNSELING6
Inpatient
Outpatient
Prescription Medication
*Low precision; no estimate reported.
NOTE: Appalachian region is defined as all areas covered by the 410 designated counties in 13 states.
N/A: Not applicable.
1
Dependence or abuse is based on definitions found in the 4th edition of the Diagnostic and Statistical Manual of Mental Disorders (DSM-IV).
2
Illicit Drugs include marijuana/hashish, cocaine (including crack), heroin, hallucinogens, inhalants, or prescription-type psychotherapeutics used non-medically.
3
Serious Psychological Distress (SPD) is defined as having a score of 13 or higher on the K6 scale. Due to questionnaire changes, these combined 2004 and 2005 estimates are not
comparable with 2004 and earlier estimates published in prior NSDUH reports. See Section B.4.4 in Appendix B of the Results from the 2005 National Survey on Drug Use and Health:
National Findings. Estimates are based on combined 2004-2005 data.
4
Major Depressive Episode (MDE) is defined as a period of at least 2 weeks when a person experienced a depressed mood or loss of interest or pleasure in daily activities and had a
majority of the symptoms for depression as described in the 4th edition of the Diagnostic and Statistical Manual of Mental Disorders (DSM-IV). Estimates are based on combined 20042005 data.
5
Received Substance Use Treatment at a Specialty Facility refers to treatment received at a hospital (inpatient), rehabilitation facility (inpatient or outpatient), or mental health center in
order to reduce or stop illicit drug or alcohol use, or for medical problems associated with illicit drug or alcohol use. Estimates include persons who received treatment specifically for
illicit drugs or alcohol, as well as persons who received treatment but did not specify for what substance(s).
6
Mental Health Treatment/Counseling is defined as having received inpatient care or outpatient care or having used prescription medication for problems with emotions, nerves, or mental
health. Respondents were not to include treatment for drug or alcohol use. Respondents with unknown treatment/counseling information were excluded. Estimates were based only on
responses to items in the Adult Mental Health Service Utilization module.
Source: SAMHSA, Office of Applied Studies, National Survey on Drug Use and Health, 2002, 2003, 2004, and 2005.
240
Table 2.7A Demographic Characteristics and Health Insurance among Persons Aged 12 or Older Residing in Appalachian
Region, by Age Group and Appalachian Socioeconomic Status
Demographic Characteristic/
Health Insurance
AGE GROUP
Numbers in Thousands, Annual Averages Based on 2002-2005
At-Risk or
Distressed
HISPANIC ORIGIN AND
RACE
Not Hispanic or Latino
White
Black or African American
Other1
Hispanic or Latino
EDUCATION
< High School
High School
Graduate
Some College
College Graduate
CURRENT EMPLOYMENT
Full-Time
Part-Time
Unemployed
Other2
HEALTH INSURANCE
Private
Medicare
Medicaid/CHIP3
12-17
Transitional
Competitive or
Attainment
At-Risk or
Distressed
18 or Older
Transitional
Competitive or
Attainment
306
273
29
3
3
1,073
964
89
20
29
446
341
94
11
17
2,981
2,683
258
40
33
10,463
9,665
586
211
148
4,146
3,503
486
157
170
N/A
N/A
N/A
N/A
N/A
N/A
871
1,261
2,142
4,186
641
1,443
N/A
N/A
N/A
N/A
N/A
N/A
554
329
2,511
1,771
1,025
1,208
N/A
N/A
N/A
N/A
N/A
N/A
N/A
N/A
N/A
N/A
N/A
N/A
1,321
292
137
1,265
5,445
1,305
346
3,514
2,395
547
133
1,241
162
3
125
765
6
280
341
5
96
1,906
765
426
7,725
2,352
911
3,212
811
270
*Low precision; no estimate reported. NOTE: Appalachian region is defined as all areas covered by the 410 designated counties in 13 states. N/A: Not applicable.
1
Includes respondents reporting American Indian or Alaska Native, Native Hawaiian or Other Pacific Islander, Asian, and Two or More Races.
2
The Other Employment category includes retired persons, disabled persons, homemakers, students, or other persons not in the labor force.
3
CHIP is the Children's Health Insurance Program. Individuals aged 19 or younger are eligible for this plan.
Source: SAMHSA, Office of Applied Studies, National Survey on Drug Use and Health, 2002, 2003, 2004, and 2005.
241
Table 2.8A Lifetime, Past Year, and Past Month Substance Use among Persons Aged 12 or Older Residing in Appalachian
Region, by Substance, Age Group, and Appalachian Socioeconomic Status
Substance
AGE GROUP
Numbers in Thousands, Annual Averages Based on 2002-2005
At-Risk or
Distressed
12-17
Transitional
Competitive
or Attainment
At-Risk or
Distressed
18 or Older
Transitional
Competitive
or Attainment
MARIJUANA USE
Lifetime
Past Year
Past Month
COCAINE USE
Lifetime
Past Year
Past Month
METHAMPHETAMINE USE
Lifetime
Past Year
Past Month
ALCOHOL USE
Past Year
Binge Alcohol Use1
Heavy Alcohol Use1
CIGARETTE USE
Lifetime
Past Year
Past Month
PAST YEAR NONMEDICAL
USE OF
PSYCHOTHERAPEUTICS2
61
43
18
210
163
80
84
65
33
983
178
91
4,065
945
566
1,806
374
221
9
7
3
31
24
6
7
6
2
248
40
13
1,233
258
94
616
91
32
6
3
2
16
8
3
4
2
1
59
12
4
448
50
16
208
14
12
97
31
9
383
126
34
153
41
11
1,314
462
144
6,586
2,324
800
3,047
910
271
135
79
58
35
416
272
186
124
139
94
62
39
2,260
1,127
1,018
166
8,079
3,746
3,357
636
3,267
1,319
1,168
211
*Low precision; no estimate reported.
NOTE:
Appalachian region is defined as all areas covered by the 410 designated counties in 13 states.
\
1
Binge Alcohol Use is defined as drinking five or more drinks on the same occasion (i.e., at the same time or within a couple of hours of each other) on at least 1 day in the past
30 days. Heavy Alcohol Use is defined as drinking five or more drinks on the same occasion on each of 5 or more days in the past 30 days; all heavy alcohol users are also
binge alcohol users.
2
Nonmedical use of prescription-type psychotherapeutics includes the nonmedical use of pain relievers, tranquilizers, stimulants, or sedatives and does not include over-thecounter drugs.
Source: SAMHSA, Office of Applied Studies, National Survey on Drug Use and Health, 2002, 2003, 2004, and 2005.
242
Table 2.9A Substance Dependence or Abuse, Mental Health Measures, and Receipt of Substance Use Treatment in the Past
Year among Persons Aged 12 or Older Residing in Appalachian Region, by Age Group and Appalachian Socioeconomic
Status
Dependence or Abuse/Mental
Health/Receipt of Treatment
Numbers in Thousands, Annual
Averages Based on 2002-2005
DEPENDENCE OR ABUSE1
Illicit Drugs2
Alcohol
Both Illicit Drugs and
Alcohol2
Illicit Drugs or Alcohol2
PAST YEAR SERIOUS
PSYCHOLOGICAL DISTRESS3
PAST YEAR MAJOR
DEPRESSIVE EPISODE4
PAST YEAR RECEIPT OF
SPECIALTY TREATMENT
FOR ILLICIT DRUG OR
ALCOHOL USE2,5
MENTAL HEALTH
TREATMENT/COUNSELING6
Inpatient
Outpatient
Prescription Medication
AGE GROUP
At-Risk or
Distressed
16
16
6
12-17
Transitional
Competitive
or Attainment
At-Risk or
Distressed
20
22
8
77
142
28
62
73
33
18 or Older
Transitional
279
717
123
Competitive or
Attainment
89
297
37
26
102
34
191
873
349
N/A
N/A
N/A
521
1,265
640
28
93
45
313
745
402
3
11
3
17
102
36
N/A
N/A
N/A
480
1,392
557
N/A
N/A
N/A
N/A
N/A
N/A
N/A
N/A
N/A
34
258
427
83
761
1,229
42
284
499
*Low precision; no estimate reported.
NOTE: Appalachian region is defined as all areas covered by the 410 designated counties in 13 states.
N/A: Not applicable.
1
Dependence or abuse is based on definitions found in the 4th edition of the Diagnostic and Statistical Manual of Mental Disorders (DSM-IV).
Illicit Drugs include marijuana/hashish, cocaine (including crack), heroin, hallucinogens, inhalants, or prescription-type psychotherapeutics used nonmedically.
Serious Psychological Distress (SPD) is defined as having a score of 13 or higher on the K6 scale. Due to questionnaire changes, these combined 2004 and 2005 estimates are not comparable with 2004 and earlier estimates
published in prior NSDUH reports. See Section B.4.4 in Appendix B of the Results from the 2005 National Survey on Drug Use and Health: National Findings. Estimates are based on combined 2004-2005 data.
4
Major Depressive Episode (MDE) is defined as a period of at least 2 weeks when a person experienced a depressed mood or loss of interest or pleasure in daily activities and had a majority of the symptoms for depression as
described in the 4th edition of the Diagnostic and Statistical Manual of Mental Disorders (DSM-IV). Estimates are based on combined 2004-2005 data.
5
Received Substance Use Treatment at a Specialty Facility refers to treatment received at a hospital (inpatient), rehabilitation facility (inpatient or outpatient), or mental health center in order to reduce or stop illicit drug or
alcohol use, or for medical problems associated with illicit drug or alcohol use. Estimates include persons who received treatment specifically for illicit drugs or alcohol, as well as persons who received treatment but did not
specify for what substance(s).
6
Mental Health Treatment/Counseling is defined as having received inpatient care or outpatient care or having used prescription medication for problems with emotions, nerves, or mental health. Respondents were not to include
treatment for drug or alcohol use. Respondents with unknown treatment/counseling information were excluded. Estimates were based only on responses to items in the Adult Mental Health Service Utilization module.
2
3
Source: SAMHSA, Office of Applied Studies, National Survey on Drug Use and Health, 2002, 2003, 2004, and 2005.
243
Table 2.10A Access to Alcohol Treatment among Persons Aged 12 or Older, by Age Group and Appalachian Region Status:
Numbers in Thousands
Annual Averages Based on 2002-2005
Age 12-17
Appalachian Region
Outside Appalachia
Age 18 or Older
Appalachian Region
Outside Appalachia
Access to Alcohol Treatment1,2
Needed But Not Received Alcohol Treatment
105
1,286
1,103
14,901
Felt Need for Alcohol Treatment
4
42
63
796
Felt Need for Alcohol Treatment and Made No
Effort
2
28
41
505
*Low precision; no estimate reported.
NOTE: Received Alcohol Treatment at a Specialty Facility refers to treatment received at a hospital (inpatient), rehabilitation facility (inpatient or outpatient), or mental health center
in order to reduce or stop alcohol use, or for medical problems associated with alcohol use.
1
Needing But Not Receiving Treatment refers to respondents classified as needing treatment for alcohol, but have not received treatment for an alcohol problem at a specialty facility
(i.e., drug and alcohol rehabilitation facilities [inpatient or outpatient], hospitals [inpatient only], and mental health centers).
2
Felt Need for Treatment includes persons who did not receive but felt they needed treatment for an alcohol problem, as well as persons who received treatment at a location other
than a specialty facility but felt they needed additional treatment.
Source: SAMHSA, Office of Applied Studies, National Survey on Drug Use and Health, 2002, 2003, 2004, and 2005.
244
Table 2.11A Access to Drug Treatment among Persons Aged 12 or Older, by Age Group and Appalachian Region Status:
Numbers in Thousands
Annual Averages Based on 2002-2005
Age 12-17
Appalachian Region
Outside Appalachia
Age 18 or Older
Appalachian Region
Outside Appalachia
Access to Drug Treatment1,2
Needed But Not Received Treatment for an
Illicit Drug Problem
Felt Need for Treatment for an Illicit Drug
Problem
91
1,124
388
4,763
5
72
51
729
Felt Need for Treatment for an Illicit Drug
Problem and Made No Effort
3
55
43
462
*Low precision; no estimate reported.
NOTE: Illicit Drugs include marijuana/hashish, cocaine (including crack), heroin, hallucinogens, inhalants, or prescription-type pychotherapeutics used nonmedically.
NOTE: Received Illicit Drug Treatment at a Specialty Facility refers to treatment received at a hospital (inpatient), rehabilitation facility (inpatient or outpatient), or mental health
center in order to reduce or stop illicit drug use, or for medical problems associated with illicit drug use.
1
Needing But Not Receiving Treatment refers to respondents classified as needing treatment for illicit drugs, but have not received treatment for an illicit drug problem at a
specialty facility (i.e., drug and alcohol rehabilitation facilities [inpatient or outpatient], hospitals [inpatient only], and mental health centers.
2
Felt Need for Treatment includes persons who did not receive but felt they needed treatment for an illicit drug problem, as well as persons who received treatment at a location
other than a specialty facility but felt they needed additional treatment.
Source: SAMHSA, Office of Applied Studies, National Survey on Drug Use and Health, 2002, 2003, 2004, and 2005.
245
Table 2.12A Reasons for Not Receiving Substance Use Treatment and Locations of Treatment by Age Group and Appalachian
Region Status
Numbers in Thousands, Annual Averages Based on 2002-2005
Reasons for Not Receiving Drug or Alcohol Treatment among Persons
Who Needed But Did Not Receive Treatment at a Specialty Facility1
Cost/Insurance Barriers2
Not Ready to Stop Using
Stigma3,7
Did Not Know Where to Go for Treatment
Did Not Feel Need for Treatment/Could Handle the Problem
Without Treatment4,7
Did Not Have Time7
Treatment Would Not Help7
Other Access Barriers5
Locations Where Past Year Substance Treatment was Received
among Persons Who Received Treatment at a Specialty Facility6
Self-Help Group
Outpatient Rehabilitation
Inpatient Rehabilitation
Mental Health Center
Hospital Inpatient
Private Doctor's Office
Emergency Room
Prison or Jail
Age 12-17
Appalachian Region
Outside
Appalachia
Age 18 or Older
Appalachian
Outside Appalachia
Region
*
*
*
*
*
11
24
18
9
11
*
*
*
*
*
366
399
223
127
141
*
*
*
4
4
11
*
*
*
45
41
143
*
*
*
*
*
*
*
*
83
109
67
69
59
26
33
21
89
106
57
75
54
30
28
12
1,218
1,273
843
791
628
239
301
173
*Low precision; no estimate reported.
- Needing But Not Receiving Treatment refers to respondents classified as needing treatment for illicit drugs or alcohol, but have not received treatment for an illicit drug or alcohol problem at a specialty facility.
- Felt Need for Treatment includes persons who did not receive but felt they needed treatment for an illicit drug or alcohol problem, as well as persons who received treatment at a location other than a specialty
facility but felt they needed additional treatment.
1
Respondents could indicate multiple reasons; thus, these response categories are not mutually exclusive.
2
Includes reasons of "No health coverage and could not afford cost," "Had health coverage but did not cover treatment or did not cover cost," and other-specify responses of "Could not afford cost; health coverage
not indicated."
3
Includes reasons of "Might cause neighbors/community to have negative opinion," "Might have negative effect on job," "Did not want others to find out," and other-specify responses of
"Ashamed/embarrassed/afraid" and "Afraid would have trouble with the police/social services."
4
Includes reasons of "Did not feel need for treatment," "Could handle the problem without treatment," and other-specify responses of "Could do it with support of family/friends/ others," and "Could do it through
religion/spirituality."
5
Includes reasons of "No transportation/inconvenient," "No program having type of treatment," "No openings in a program," and other-specify responses of "No program had counselor/doctors with whom you
were comfortable," "Services desired were unavailable or you were currently ineligible," and "Attempted to get treatment but encountered delays."
6
Respondents could indicate multiple locations of treatment; thus, these response categories are not mutually exclusive.
7
Estimates are based only on combined 2003-2005 data. Source: SAMHSA, Office of Applied Studies, National Survey on Drug Use and Health, 2002, 2003, 2004, and 2005.
246
Table 2.13A Reasons for Not Receiving Mental Health Treatment among Persons Aged 12 or Older, by Age Group and
Appalachian Region Status: Numbers in Thousands
Annual Averages Based on 2002-2005
Age 12-17
Appalachian Region
Outside Appalachia
Age 18 or Older
Appalachian Region Outside Appalachia
Reasons for Not Receiving Mental Health
Treatment/Counseling among Persons with an Unmet Need
for Mental Health Treatment1,2
Cost/Insurance Barriers2
Did Not Feel Need for Treatment/Could
Problem Without Treatment3,7
Stigma
Services
7
Did Not Have Time
5,7
Treatment Would Not Help
Fear of Being Committed/Have to Take
6,7
Other Access Barriers
N/A
406
4,745
N/A
N/A
339
3,293
N/A
N/A
253
2,193
N/A
N/A
114
1,881
N/A
N/A
122
1,549
N/A
N/A
86
993
N/A
N/A
107
755
N/A
N/A
37
558
Handle the
4,7
Did not Know Where to Go for
N/A
Medicine
*Low precision; no estimate reported.
N/A: Not applicable.
NOTE: Unmet Need for Mental Health Treatment/Counseling is defined as a perceived need for treatment that was not received.
NOTE: Estimates represent reasons for not receiving mental health treatment/counseling for all persons aged 18 or older with an unmet need for treatment, including those with unknown
mental health treatment/counseling information.
NOTE: Mental Health Treatment/Counseling is defined as having received inpatient care or outpatient care or having used prescription medication for problems with emotions, nerves, or
mental health. Respondents were not to include treatment for drug or alcohol use. Respondents with unknown treatment/counseling information were excluded. Estimates were
based only on responses to items in the Adult Mental Health Service Utilization module.
1
Respondents could indicate multiple reasons; thus, these response categories are not mutually exclusive.
Includes reasons of "Could not afford," "Health insurance does not pay enough," "Health insurance does not cover mental health treatment," and other-specify responses of "No health
insurance."
3
Includes reasons of "Did not feel need for treatment," "Could handle problem without treatment," and other-specify responses of "Work on problems with family/friends" and "Work on
problems through religion/spirituality."
4
Includes reasons of "Might cause neighbors/community to have negative opinion," "Might have negative effect on job," "Concerned about confidentiality," "Did not want others to find
out," and other-specify responses of "Ashamed/embarrassed/afraid," "Concerned how court system would treat me," and "Concerned how it would affect future insurability."
5
Includes reasons of "Did not feel need for treatment," "Could handle problem without treatment," and other-specify responses of "Work on problems with family/friends" and "Work on
problems through religion/spirituality."
6
Includes reasons of "No transportation/inconvenient" and other-specify responses of "Too much red tape/hassle to get services," "No openings/long waiting lists/delays," "Services
unavailable/limited in area," "Attempted to get treatment but unsuccessful in finding help," and "Could not find program/counselor comfortable with."
7
Estimates are based only on combined 2003-2005 data.
2
Source: SAMHSA, Office of Applied Studies, National Survey on Drug Use and Health, 2002, 2003, 2004, and 2005.
247
Table 2.14A Access to Alcohol Use Treatment among Persons Aged 12 or Older, by Age Group and Appalachian SubRegion: Numbers in Thousands
Annual Averages Based on 2002-2005
Northern
Age 12-17
Central
Southern
Age 18 or Older
Northern
Central
Southern
1,2
Access to Alcohol Treatment
Needed But Not Received Alcohol Treatment
53
7
46
541
74
488
Felt Need for Alcohol Treatment
2
1
1
28
9
26
Felt Need for Alcohol Treatment and Made
No Effort
1
1
0
12
8
20
*Low precision; no estimate reported.
NOTE: Received Alcohol Treatment at a Specialty Facility refers to treatment received at a hospital (inpatient), rehabilitation facility (inpatient or outpatient), or mental
health center in order to reduce or stop alcohol use, or for medical problems associated with alcohol use.
1
Needing But Not Receiving Treatment refers to respondents classified as needing treatment for alcohol, but have not received treatment for an alcohol problem at a
specialty facility (i.e., drug and alcohol rehabilitation facilities [inpatient or outpatient], hospitals [inpatient only], and mental health centers).
2
Felt Need for Treatment includes persons who did not receive but felt they needed treatment for an alcohol problem, as well as persons who received treatment at a
location
other than a specialty facility but felt they needed additional treatment.
Source: SAMHSA, Office of Applied Studies, National Survey on Drug Use and Health, 2002, 2003, 2004, and 2005.
248
Table 2.15A Access to Drug Use Treatment among Persons Aged 12 or Older, by Age Group and Appalachian Sub-Region:
Numbers in Thousands
Annual Averages Based on 2002-2005
Access to Drug Treatment
Northern
Age 12-17
Central
Southern
Northern
Age 18 or Older
Central
Southern
1,2
Needed But Not Received Treatment for an
Illicit Drug Problem
Felt Need for Treatment for an Illicit Drug
Problem
Felt Need for Treatment for an Illicit Drug
Problem and Made No Effort
43
5
42
170
46
172
3
1
2
19
8
24
1
0
1
13
8
23
*Low precision; no estimate reported.
NOTE: Illicit Drugs include marijuana/hashish, cocaine (including crack), heroin, hallucinogens, inhalants, or prescription-type pychotherapeutics used nonmedically.
NOTE: Received Illicit Drug Treatment at a Specialty Facility refers to treatment received at a hospital (inpatient), rehabilitation facility (inpatient or outpatient), or mental
health center in order to reduce or stop illicit drug use, or for medical problems associated with illicit drug use.
1
Needing But Not Receiving Treatment refers to respondents classified as needing treatment for illicit drugs, but have not received treatment for an illicit drug problem at a
specialty facility (i.e., drug and alcohol rehabilitation facilities [inpatient or outpatient], hospitals [inpatient only], and mental health centers.
2
Felt Need for Treatment includes persons who did not receive but felt they needed treatment for an illicit drug problem, as well as persons who received treatment at a location
other than a specialty facility but felt they needed additional treatment.
Source: SAMHSA, Office of Applied Studies, National Survey on Drug Use and Health, 2002, 2003, 2004, and 2005.
249
Table 2.16A Reasons for Not Receiving Mental Health Treatment among Persons Aged 12 or Older, by Age Group and
Appalachian Sub-Region: Numbers in Thousands
Annual Averages Based on 2002-2005
Northern
Age 12-17
Central
Southern
Northern
Age 18 or Older
Central
Reasons for Not Receiving Mental Health Treatment/Counseling among Persons with an Unmet Need for Mental Health Treatment
Southern
1,2
Cost/Insurance Barriers2
N/A
N/A
N/A
172
*
198
Did Not Feel Need for Treatment/Could
Handle the Problem Without Treatment3,7
N/A
N/A
N/A
160
*
145
N/A
N/A
N/A
121
*
106
Did not Know Where to Go for Services
N/A
N/A
N/A
51
*
53
7
N/A
N/A
N/A
53
*
60
Treatment Would Not Help
N/A
N/A
N/A
54
*
*
Fear of Being Committed/Have to Take
Medicine
N/A
N/A
N/A
41
8
58
N/A
N/A
N/A
21
*
16
4,7
Stigma
Did Not Have Time
5,7
6,7
Other Access Barriers
*Low precision; no estimate reported.
N/A: Not applicable.
NOTE: Unmet Need for Mental Health Treatment/Counseling is defined as a perceived need for treatment that was not received.
NOTE: Estimates represent reasons for not receiving mental health treatment/counseling for all persons aged 18 or older with an unmet need for treatment, including those with unknown mental
health treatment/counseling information.
NOTE: Mental Health Treatment/Counseling is defined as having received inpatient care or outpatient care or having used prescription medication for problems with emotions, nerves, or mental
health. Respondents were not to include treatment for drug or alcohol use. Respondents with unknown treatment/counseling information were excluded. Estimates were based only on
responses to items in the Adult Mental Health Service Utilization module.
1
Respondents could indicate multiple reasons; thus, these response categories are not mutually exclusive.
Includes reasons of "Could not afford," "Health insurance does not pay enough," "Health insurance does not cover mental health treatment," and other-specify responses of "No health insurance."
Includes reasons of "Did not feel need for treatment," "Could handle problem without treatment," and other-specify responses of "Work on problems with family/friends" and "Work on problems
through religion/spirituality."
4
Includes reasons of "Might cause neighbors/community to have negative opinion," "Might have negative effect on job," "Concerned about confidentiality," "Did not want others to find out," and
other-specify responses of "Ashamed/embarrassed/afraid," "Concerned how court system would treat me," and "Concerned how it would affect future insurability."
5
Includes reasons of "Did not feel need for treatment," "Could handle problem without treatment," and other-specify responses of "Work on problems with family/friends" and "Work on problems
through religion/spirituality."
6
Includes reasons of "No transportation/inconvenient" and other-specify responses of "Too much red tape/hassle to get services," "No openings/long waiting lists/delays," "Services unavailable/limited
in area," "Attempted to get treatment but unsuccessful in finding help," and "Could not find program/counselor comfortable with."
7
Estimates are based only on combined 2003-2005 data.
Source: SAMHSA, Office of Applied Studies, National Survey on Drug Use and Health, 2002, 2003, 2004, and 2005.
2
3
250
Table 2.17A Access to Alcohol Use Treatment among Persons Aged 12 or Older, by Age Group and Appalachian
Socioeconomic Status: Numbers in Thousands
Age 12-17
Annual Averages Based on 2002-2005
At-Risk or
Distressed
Age 18 or Older
Transitional
Competitive or
Attainment
At-Risk or
Distressed
Transitional
Competitive or
Attainment
Access to Alcohol Treatment1,2
Needed But Not Received Alcohol Treatment
15
69
21
135
681
286
Felt Need for Alcohol Treatment
2
1
0
13
31
19
Felt Need for Alcohol Treatment and Made
No Effort
1
1
0
9
24
8
*Low precision; no estimate reported.
NOTE: Received Alcohol Treatment at a Specialty Facility refers to treatment received at a hospital (inpatient), rehabilitation facility (inpatient or outpatient), or mental health center in order to
reduce or stop alcohol use, or for medical problems associated with alcohol use.
1
2
Needing But Not Receiving Treatment refers to respondents classified as needing treatment for alcohol, but have not received treatment for an alcohol problem at a specialty facility (i.e., drug and
alcohol rehabilitation facilities [inpatient or outpatient], hospitals [inpatient only], and mental health centers).
Felt Need for Treatment includes persons who did not receive but felt they needed treatment for an alcohol problem, as well as persons who received treatment at a location other than a specialty
facility but felt they needed additional treatment.
Source: SAMHSA, Office of Applied Studies, National Survey on Drug Use and Health, 2002, 2003, 2004, and 2005.
251
Table 2.18A Access to Drug Treatment among Persons Aged 12 or Older, by Age Group and Appalachian Socioeconomic
Status: Numbers in Thousands
Age 12-17
Annual Averages Based on 2002-2005
Access to Drug Treatment1,2
Needed But Not Received Treatment for an
Illicit Drug Problem
Felt Need for Treatment for an Illicit Drug
Problem
Felt Need for Treatment for an Illicit Drug
Problem and Made No Effort
At-Risk or
Distressed
Age 18 or Older
Transitional
Competitive or
Attainment
At-Risk or
Distressed
Transitional
Competitive or
Attainment
14
58
18
68
240
79
1
2
1
9
29
13
1
1
1
8
23
12
*Low precision; no estimate reported.
NOTE: Illicit Drugs include marijuana/hashish, cocaine (including crack), heroin, hallucinogens, inhalants, or prescription-type pychotherapeutics used nonmedically.
NOTE: Received Illicit Drug Treatment at a Specialty Facility refers to treatment received at a hospital (inpatient), rehabilitation facility (inpatient or outpatient), or mental health
center in order to reduce or stop illicit drug use, or for medical problems associated with illicit drug use.
1
Needing But Not Receiving Treatment refers to respondents classified as needing treatment for illicit drugs, but have not received treatment for an illicit drug problem at a
specialty facility (i.e., drug and alcohol rehabilitation facilities [inpatient or outpatient], hospitals [inpatient only], and mental health centers.
2
Felt Need for Treatment includes persons who did not receive but felt they needed treatment for an illicit drug problem, as well as persons who received treatment at a location
other than a specialty facility but felt they needed additional treatment.
Source: SAMHSA, Office of Applied Studies, National Survey on Drug Use and Health, 2002, 2003, 2004, and 2005.
252
Table 2.19A Reasons for Not Receiving Mental Health Treatment/Counseling among Persons Aged 12 or Older, by Age
Group and Appalachian Socioeconomic Status: Numbers in Thousands, Annual Averages Based on 2002-2005
Age 12-17
At-Risk or
Distressed
Transitional
Age 18 or Older
Competitive or
Attainment
At-Risk or
Distressed
Transitional
Reasons for Not Receiving Mental Health Treatment/Counseling among Persons with an Unmet Need for Mental Health Treatment1,2
N/A
N/A
N/A
68
260
Cost/Insurance Barriers2
Did Not Feel Need for Treatment/Could
Handle the Problem Without Treatment3,7
Competitive or
Attainment
79
N/A
N/A
N/A
67
152
*
N/A
N/A
N/A
60
135
*
Did not Know Where to Go for Services
N/A
N/A
N/A
19
75
21
7
N/A
N/A
N/A
23
69
30
Treatment Would Not Help
N/A
N/A
N/A
11
44
*
Fear of Being Committed/Have to Take
Medicine
N/A
N/A
N/A
27
56
23
N/A
N/A
N/A
4
25
8
4,7
Stigma
Did Not Have Time
5,7
6,7
Other Access Barriers
*Low precision; no estimate reported.
N/A: Not applicable.
NOTE: Unmet Need for Mental Health Treatment/Counseling is defined as a perceived need for treatment that was not received.
NOTE: Estimates represent reasons for not receiving mental health treatment/counseling for all persons aged 18 or older with an unmet need for treatment, including those with unknown mental
health treatment/counseling information.
NOTE: Mental Health Treatment/Counseling is defined as having received inpatient care or outpatient care or having used prescription medication for problems with emotions, nerves, or mental
health. Respondents were not to include treatment for drug or alcohol use. Respondents with unknown treatment/counseling information were excluded. Estimates were based only on
responses to items in the Adult Mental Health Service Utilization module.
1
2
3
4
5
6
7
Respondents could indicate multiple reasons; thus, these response categories are not mutually exclusive.
Includes reasons of "Could not afford," "Health insurance does not pay enough," "Health insurance does not cover mental health treatment," and other-specify responses of "No health insurance."
Includes reasons of "Did not feel need for treatment," "Could handle problem without treatment," and other-specify responses of "Work on problems with family/friends" and "Work on problems
through religion/spirituality."
Includes reasons of "Might cause neighbors/community to have negative opinion," "Might have negative effect on job," "Concerned about confidentiality," "Did not want others to find out," and
other-specify responses of "Ashamed/embarrassed/afraid," "Concerned how court system would treat me," and "Concerned how it would affect future insurability."
Includes reasons of "Did not feel need for treatment," "Could handle problem without treatment," and other-specify responses of "Work on problems with family/friends" and "Work on problems
through religion/spirituality."
Includes reasons of "No transportation/inconvenient" and other-specify responses of "Too much red tape/hassle to get services," "No openings/long waiting lists/delays," "Services unavailable/limited
in area," "Attempted to get treatment but unsuccessful in finding help," and "Could not find program/counselor comfortable with."
Estimates are based only on combined 2003-2005 data.
Source: SAMHSA, Office of Applied Studies, National Survey on Drug Use and Health, 2002, 2003, 2004, and 2005.
253
Table 2.1B Demographic Characteristics and Health Insurance among Persons Aged 12 or Older, by Age Group and
Appalachian Region Status: Standard Errors of Percentages, Annual Averages Based on 2002-2005
AGE GROUP
Demographic
12-17
18 or Older
Characteristic/Health
1
Insurance
Appalachian Region
Outside Appalachia
Appalachian Region1
Outside Appalachia
HISPANIC ORIGIN AND
RACE
Not Hispanic or Latino
White
Black or African American
Other2
Hispanic or Latino
EDUCATION
< High School
High School Graduate
Some College
College Graduate
CURRENT EMPLOYMENT
Full-Time
Part-Time
Unemployed
Other3
HEALTH INSURANCE
Private
Medicare
Medicaid/CHIP4
0.30
0.85
0.80
0.25
0.30
0.28
0.36
0.27
0.17
0.28
0.27
0.69
0.55
0.24
0.27
0.20
0.29
0.20
0.14
0.20
N/A
N/A
N/A
N/A
N/A
N/A
N/A
N/A
0.61
0.68
0.54
0.71
0.20
0.21
0.19
0.27
N/A
N/A
N/A
N/A
N/A
N/A
N/A
N/A
0.73
0.39
0.20
0.71
0.24
0.13
0.07
0.24
0.92
0.18
0.86
0.32
0.05
0.28
0.68
0.72
0.42
0.24
0.25
0.13
*Low precision; no estimate reported.
N/A: Not applicable.
1
Appalachian region is defined as all areas covered by the 410 designated counties in 13 states.
Includes respondents reporting American Indian or Alaska Native, Native Hawaiian or Other Pacific Islander, Asian, and Two or More Races.
3
The Other Employment category includes retired persons, disabled persons, homemakers, students, or other persons not in the labor force.
4
CHIP is the Children's Health Insurance Program. Individuals aged 19 or younger are eligible for this plan.
2
Source: SAMHSA, Office of Applied Studies, National Survey on Drug Use and Health, 2002, 2003, 2004, and 2005.
254
Table 2.2B Lifetime, Past Year, and Past Month Substance Use among Persons Aged 12 or Older, by Substance, Age
Group, and Appalachian Region Status: Standard Errors of Percentages, Annual Averages Based on 2002-2005
Substance
AGE GROUP
12-17
18 or Older
Appalachian Region1 Outside Appalachia Appalachian Region1 Outside Appalachia
MARIJUANA USE
Lifetime
0.60
0.18
0.64
0.23
Past Year
0.53
0.16
0.29
0.11
Past Month
0.38
0.12
0.21
0.09
Lifetime
0.23
0.07
0.41
0.16
Past Year
0.20
0.06
0.14
0.05
Past Month
0.09
0.04
0.09
0.03
Lifetime
0.17
0.05
0.25
0.09
Past Year
0.13
0.04
0.05
0.02
Past Month
0.12
0.02
0.04
0.02
0.70
0.22
0.74
0.23
0.43
0.15
0.51
0.18
0.22
0.07
0.29
0.10
Lifetime
0.70
0.22
0.61
0.21
Past Year
0.61
0.18
0.64
0.20
Past Month
0.55
0.15
0.61
0.19
0.51
0.13
0.23
0.09
COCAINE USE
METHAMPHETAMINE USE
ALCOHOL USE
Past Year
2
Binge Alcohol Use
2
Heavy Alcohol Use
CIGARETTE USE
PAST YEAR NONMEDICAL
USE OF
PSYCHOTHERAPEUTICS3
*Low precision; no estimate reported.
1
Appalachian region is defined as all areas covered by the 410 designated counties in 13 states.
Binge Alcohol Use is defined as drinking five or more drinks on the same occasion (i.e., at the same time or within a couple of hours of each other) on at least 1 day in the past 30 days. Heavy Alcohol Use is
defined as drinking five or more drinks on the same occasion on each of 5 or more days in the past 30 days; all heavy alcohol users are also binge alcohol users.
3
Nonmedical use of prescription-type psychotherapeutics includes the nonmedical use of pain relievers, tranquilizers, stimulants, or sedatives and does not include over-the-counter drugs.
Source: SAMHSA, Office of Applied Studies, National Survey on Drug Use and Health, 2002, 2003, 2004, and 2005.
2
255
Table 2.3B Substance Dependence or Abuse, Mental Health Measures, and Receipt of Substance Use Treatment in the Past
Year among Persons Aged 12 or Older, by Age Group and Appalachian Region Status
Dependence or Abuse/Mental Health/Receipt of
Treatment
(Standard Errors of Percentages, Annual Averages
Based on 2002-2005)
DEPENDENCE OR ABUSE2
Illicit Drugs3
Alcohol
Both Illicit Drugs and Alcohol3
Illicit Drugs or Alcohol3
PAST YEAR SERIOUS PSYCHOLOGICAL
DISTRESS4
PAST YEAR MAJOR DEPRESSIVE EPISODE5
PAST YEAR RECEIPT OF SPECIALTY
TREATMENT FOR ILLICIT DRUG OR ALCOHOL
USE3,6
MENTAL HEALTH TREATMENT/COUNSELING7
Inpatient
Outpatient
Prescription Medication
AGE GROUP
12-17
Appalachian
Region1
Outside
Appalachia
18 or Older
Appalachian
Outside
Region1
Appalachia
0.32
0.37
0.23
0.43
0.10
0.11
0.07
0.13
0.16
0.26
0.08
0.29
0.05
0.10
0.03
0.10
N/A
N/A
0.74
0.22
0.61
0.14
0.19
0.04
0.57
0.09
0.18
0.04
N/A
N/A
N/A
N/A
N/A
N/A
N/A
N/A
0.43
0.13
0.33
0.41
0.14
0.04
0.11
0.13
*Low precision; no estimate reported.
N/A: Not applicable
Appalachian region is defined as all areas covered by the 410 designated counties in 13 states.
2
Dependence or abuse is based on definitions found in the 4th edition of the Diagnostic and Statistical Manual of Mental Disorders (DSM-IV).
3
Illicit Drugs include marijuana/hashish, cocaine (including crack), heroin, hallucinogens, inhalants, or prescription-type psychotherapeutics used nonmedically.
4
Serious Psychological Distress (SPD) is defined as having a score of 13 or higher on the K6 scale. Due to questionnaire changes, these combined 2004 and 2005 estimates are not comparable with
2004 and earlier estimates published in prior NSDUH reports. See Section B.4.4 in Appendix B of the Results from the 2005 National Survey on Drug Use and Health: National Findings. Estimates
are based on combined 2004-2005 data.
5
Major Depressive Episode (MDE) is defined as a period of at least 2 weeks when a person experienced a depressed mood or loss of interest or pleasure in daily activities and had a majority of the
symptoms for depression as described in the 4th edition of the Diagnostic and Statistical Manual of Mental Disorders (DSM-IV). Estimates are based on combined 2004-2005 data.
6
Received Substance Use Treatment at a Specialty Facility refers to treatment received at a hospital (inpatient), rehabilitation facility (inpatient or outpatient), or mental health center in order to reduce
or stop illicit drug or alcohol use, or for medical problems associated with illicit drug or alcohol use. Estimates include persons who received treatment specifically for illicit drugs or alcohol, as well as
persons who received treatment but did not specify for what substance(s).
7
Mental Health Treatment/Counseling is defined as having received inpatient care or outpatient care or having used prescription medication for problems with emotions, nerves, or mental health.
Respondents were not to include treatment for drug or alcohol use. Respondents with unknown treatment/counseling information were excluded. Estimates were based only on responses to items in the
Adult Mental Health Service Utilization module.
1
Source: SAMHSA, Office of Applied Studies, National Survey on Drug Use and Health, 2002, 2003, 2004, and 2005.
256
Table 2.4B Demographic Characteristics and Health Insurance among Persons Aged 12 or Older Residing in Appalachian
Region, by Age Group and Appalachian Subregion: Standard Errors of Percentages, Annual Averages Based on 2002-2005
Demographic
AGE GROUP
Characteristic/Health
12-17
18 or Older
Insurance
North
Central
South
North
Central
South
HISPANIC ORIGIN AND
RACE
Not Hispanic or Latino
White
Black or African American
Other1
Hispanic or Latino
EDUCATION
< High School
High School Graduate
Some College
College Graduate
CURRENT EMPLOYMENT
Full-Time
Part-Time
Unemployed
Other2
HEALTH INSURANCE
Private
Medicare
Medicaid/CHIP3
0.32
0.93
0.77
0.30
0.32
0.83
1.21
0.48
0.86
0.83
0.55
1.61
1.55
0.42
0.55
0.20
0.56
0.41
0.27
0.20
0.77
1.30
0.87
0.42
0.77
0.51
1.36
1.11
0.43
0.51
N/A
N/A
N/A
N/A
N/A
N/A
N/A
N/A
N/A
N/A
N/A
N/A
0.71
0.83
0.70
0.75
2.26
2.52
1.48
1.80
0.98
1.14
0.91
1.30
N/A
N/A
N/A
N/A
N/A
N/A
N/A
N/A
N/A
N/A
N/A
N/A
0.92
0.48
0.26
0.89
2.61
1.15
0.75
2.69
1.18
0.68
0.34
1.09
0.99
0.14
0.87
2.90
0.32
3.05
1.66
0.35
1.60
0.76
0.81
0.50
2.34
2.71
2.05
1.19
1.19
0.68
*Low precision; no estimate reported.
NOTE: Appalachian region is defined as all areas covered by the 410 designated counties in 13 states.
N/A: Not applicable.
1
Includes respondents reporting American Indian or Alaska Native, Native Hawaiian or Other Pacific Islander, Asian, and Two or More Races.
2
The Other Employment category includes retired persons, disabled persons, homemakers, students, or other persons not in the labor force.
3
CHIP is the Children's Health Insurance Program. Individuals aged 19 or younger are eligible for this plan.
Source: SAMHSA, Office of Applied Studies, National Survey on Drug Use and Health, 2002, 2003, 2004, and 2005.
257
Table 2.5B Lifetime, Past Year, and Past Month Substance Use among Persons Aged 12 or Older Residing in Appalachian
Region, by Substance, Age Group, and Appalachian Subregion
Substance
AGE GROUP
12-17
18 or Older
Standard Errors of Percentages, Annual
North
Central
South
North
Central
South
Averages Based on 2002-2005
MARIJUANA USE
Lifetime
0.75
1.75
1.01
0.84
1.90
1.02
Past Year
0.64
1.50
0.91
0.40
0.81
0.46
Past Month
0.50
0.70
0.66
0.29
0.60
0.34
Lifetime
0.25
0.63
0.41
0.46
1.01
0.72
Past Year
0.23
0.61
0.36
0.19
0.36
0.24
Past Month
0.12
0.30
0.15
0.12
0.17
0.17
Lifetime
0.20
0.57
0.29
0.30
0.52
0.45
Past Year
0.10
0.32
0.27
0.05
0.20
0.09
Past Month
0.06
0.28
0.24
0.03
0.04
0.08
0.84
1.99
1.21
0.80
2.42
1.28
Binge Alcohol Use
0.56
0.92
0.72
0.65
1.44
0.85
Heavy Alcohol Use1
0.33
0.63
0.36
0.42
0.71
0.47
Lifetime
0.85
2.39
1.19
0.66
1.70
1.10
Past Year
0.76
1.92
1.03
0.78
1.95
1.09
Past Month
0.69
1.47
0.92
0.76
1.90
1.03
0.48
1.24
0.96
0.26
0.75
0.40
COCAINE USE
METHAMPHETAMINE USE
ALCOHOL USE
Past Year
1
CIGARETTE USE
PAST YEAR NONMEDICAL USE
OF PSYCHOTHERAPEUTICS2
*Low precision; no estimate reported. NOTE: Appalachian region is defined as all areas covered by the 410 designated counties in 13 states.
1
Binge Alcohol Use is defined as drinking five or more drinks on the same occasion (i.e., at the same time or within a couple of hours of each other) on at least 1 day in the past 30 days. Heavy Alcohol Use is
defined as drinking five or more drinks on the same occasion on each of 5 or more days in the past 30 days; all heavy alcohol users are also binge alcohol users.
Nonmedical use of prescription-type psychotherapeutics includes the nonmedical use of pain relievers, tranquilizers, stimulants, or sedatives and does not include over-the-counter drugs.
Source: SAMHSA, Office of Applied Studies, National Survey on Drug Use and Health, 2002, 2003, 2004, and 2005.
2
258
Table 2.6B Substance Dependence or Abuse, Mental Health Measures, and Receipt of Substance Use Treatment in the Past
Year among Persons Aged 12 or Older Residing in Appalachian Region, by Age Group and Appalachian Subregion: Standard
Errors of Percentages, Annual Averages Based on 2002-2005
Dependence or Abuse/Mental
Health/Receipt of Treatment
AGE GROUP
North
DEPENDENCE OR ABUSE1
Illicit Drugs2
12-17
Central
South
North
18 or Older
Central
South
0.39
0.64
0.56
0.19
0.50
0.27
Alcohol
0.45
0.88
0.67
0.38
0.54
0.41
Both Illicit Drugs and Alcohol2
0.27
0.50
0.40
0.11
0.28
0.13
Illicit Drugs or Alcohol2
0.53
0.94
0.73
0.41
0.66
0.47
N/A
N/A
N/A
0.82
2.38
1.31
0.73
1.59
1.04
0.66
2.05
1.02
0.13
0.35
0.26
0.12
0.14
0.14
N/A
N/A
N/A
0.52
1.48
0.71
PAST YEAR SERIOUS
PSYCHOLOGICAL DISTRESS3
PAST YEAR MAJOR
DEPRESSIVE EPISODE4
PAST YEAR RECEIPT OF
SPECIALTY TREATMENT FOR
ILLICIT DRUG OR ALCOHOL
USE2,5
MENTAL HEALTH
TREATMENT/COUNSELING6
Inpatient
N/A
N/A
N/A
0.14
0.33
0.24
Outpatient
N/A
N/A
N/A
0.38
0.98
0.57
Prescription Medication
N/A
N/A
N/A
0.50
1.44
0.68
*Low precision; no estimate reported.
NOTE: Appalachian region is defined as all areas covered by the 410 designated counties in 13 states.
N/A: Not applicable.
1
Dependence or abuse is based on definitions found in the 4th edition of the Diagnostic and Statistical Manual of Mental Disorders (DSM-IV).
2
Illicit Drugs include marijuana/hashish, cocaine (including crack), heroin, hallucinogens, inhalants, or prescription-type psychotherapeutics used nonmedically.
3
Serious Psychological Distress (SPD) is defined as having a score of 13 or higher on the K6 scale. Due to questionnaire changes, these combined 2004 and 2005 estimates are not comparable with
2004 and earlier estimates published in prior NSDUH reports. See Section B.4.4 in Appendix B of the Results from the 2005 National Survey on Drug Use and Health: National Findings. Estimates
are based on combined 2004-2005 data.
4
Major Depressive Episode (MDE) is defined as a period of at least 2 weeks when a person experienced a depressed mood or loss of interest or pleasure in daily activities and had a majority of the
symptoms for depression as described in the 4th edition of the Diagnostic and Statistical Manual of Mental Disorders (DSM-IV). Estimates are based on combined 2004-2005 data.
5
Received Substance Use Treatment at a Specialty Facility refers to treatment received at a hospital (inpatient), rehabilitation facility (inpatient or outpatient), or mental health center in order to reduce
or stop illicit drug or alcohol use, or for medical problems associated with illicit drug or alcohol use. Estimates include persons who received treatment specifically for illicit drugs or alcohol, as well as
persons who received treatment but did not specify for what substance(s).
6
Mental Health Treatment/Counseling is defined as having received inpatient care or outpatient care or having used prescription medication for problems with emotions, nerves, or mental health.
Respondents were not to include treatment for drug or alcohol use. Respondents with unknown treatment/counseling information were excluded. Estimates were based only on responses to items in the
Adult Mental Health Service Utilization module.
Source: SAMHSA, Office of Applied Studies, National Survey on Drug Use and Health, 2002, 2003, 2004, and 2005.
259
Table 2.7B Demographic Characteristics and Health Insurance among Persons Aged 12 or Older Residing in Appalachian
Region, by Age Group and Appalachian Socioeconomic Status: Standard Errors of Percentages, Annual Averages Based on
2002-2005
Demographic Characteristic/Health
Insurance
AGE GROUP
At-Risk or
Distressed
HISPANIC ORIGIN AND RACE
Not Hispanic or Latino
12-17
Transitional
Competitive or
Attainment
At-Risk or
Distressed
18 or Older
Transitional
Competitive or
Attainment
0.37
0.40
0.57
0.44
0.25
0.82
White
1.40
0.88
2.48
1.63
0.67
1.97
Black or African
American
Other1
1.35
0.76
2.44
1.39
0.55
1.49
0.30
0.27
0.73
0.37
0.29
0.65
Hispanic or Latino
0.37
0.40
0.57
0.44
0.25
0.82
< High School
N/A
N/A
N/A
1.58
0.77
1.24
High School Graduate
N/A
N/A
N/A
1.44
0.89
1.44
Some College
N/A
N/A
N/A
1.06
0.75
1.11
College Graduate
N/A
N/A
N/A
1.01
0.79
1.89
Full-Time
N/A
N/A
N/A
1.83
0.90
1.55
Part-Time
N/A
N/A
N/A
0.69
0.55
0.84
Unemployed
N/A
N/A
N/A
0.52
0.26
0.42
N/A
N/A
N/A
1.97
0.86
1.39
Private
1.99
1.14
2.04
1.83
0.72
1.71
Medicare
0.33
0.15
0.57
1.70
0.91
1.42
Medicaid/CHIP3
1.88
1.14
1.73
1.21
0.51
0.83
EDUCATION
CURRENT EMPLOYMENT
Other
2
HEALTH INSURANCE
*Low precision; no estimate reported.
NOTE: Appalachian region is defined as all areas covered by the 410 designated counties in 13 states. N/A: Not applicable.
1
Includes respondents reporting American Indian or Alaska Native, Native Hawaiian or Other Pacific Islander, Asian, and Two or More Races.
2
The Other Employment category includes retired persons, disabled persons, homemakers, students, or other persons not in the labor force.
3
CHIP is the Children's Health Insurance Program. Individuals aged 19 or younger are eligible for this plan.
Source: SAMHSA, Office of Applied Studies, National Survey on Drug Use and Health, 2002, 2003, 2004, and 2005.
260
Table 2.8B Lifetime, Past Year, and Past Month Substance Use among Persons Aged 12 or Older Residing in Appalachian
Region, by Substance, Age Group, and Appalachian Socioeconomic Status, 2002 - 2005
Substance
AGE GROUP
12-17
At-Risk or
Distressed
18 or Older
Transitional
Competitive or
Attainment
At-Risk or
Distressed
Transitional
Competitive or
Attainment
MARIJUANA USE
Lifetime
1.54
0.82
1.19
1.47
0.79
1.38
Past Year
1.25
0.72
1.13
0.50
0.39
0.59
Past Month
0.70
0.53
0.83
0.32
0.29
0.46
Lifetime
0.51
0.33
0.31
0.72
0.50
0.97
Past Year
0.42
0.30
0.26
0.22
0.20
0.27
Past Month
0.29
0.12
0.14
0.14
0.13
0.18
Lifetime
0.52
0.25
0.22
0.30
0.32
0.64
Past Year
0.31
0.20
0.12
0.14
0.07
0.10
Past Month
0.28
0.18
0.10
0.07
0.04
0.10
Past Year
1.61
0.91
1.78
1.71
0.86
1.67
Binge Alcohol Use1
0.97
0.58
0.79
1.08
0.66
1.07
Heavy Alcohol Use1
0.45
0.30
0.47
0.53
0.37
0.65
Lifetime
1.75
0.92
1.41
1.29
0.77
1.38
Past Year
1.56
0.85
1.13
1.51
0.78
1.35
Past Month
1.33
0.77
1.06
1.51
0.74
1.28
1.00
0.70
0.86
0.47
0.30
0.53
COCAINE USE
METHAMPHETAMINE USE
ALCOHOL USE
CIGARETTE USE
PAST YEAR NONMEDICAL USE OF
PSYCHOTHERAPEUTICS2
*Low precision; no estimate reported. Standard Errors of Percentages, Annual Averages Based on 2002-2005. NOTE: Appalachian region is defined as all areas covered by the 410 designated counties in 13 states.
1
Binge Alcohol Use is defined as drinking five or more drinks on the same occasion (i.e., at the same time or within a couple of hours of each other) on at least 1 day in the past 30 days. Heavy Alcohol Use is defined
as drinking five or more drinks on the same occasion on each of 5 or more days in the past 30 days; all heavy alcohol users are also binge alcohol users.
2
Nonmedical use of prescription-type psychotherapeutics includes the nonmedical use of pain relievers, tranquilizers, stimulants, or sedatives and does not include over-the-counter drugs.
Source: SAMHSA, Office of Applied Studies, National Survey on Drug Use and Health, 2002, 2003, 2004, and 2005.
261
Table 2.9B Substance Dependence or Abuse, Mental Health Measures, and Receipt of Substance Use Treatment in the Past
Year among Persons Aged 12 or Older Residing in Appalachian Region, by Age Group and Appalachian Socioeconomic
Status: Standard Errors of Percentages, Annual Averages Based on 2002-2005
Dependence or Abuse/Mental
AGE GROUP
Health/Receipt of Treatment
12-17
18 or Older
At-Risk or Transitional Competitive
At-Risk or Transitional Competitive
Distressed
or
Distressed
or
Attainment
Attainment
DEPENDENCE OR ABUSE1
Illicit Drugs2
Alcohol
Both Illicit Drugs and Alcohol2
0.71
0.70
0.41
0.88
0.46
0.50
0.33
0.58
0.53
0.61
0.30
0.73
0.34
0.45
0.16
0.56
0.21
0.33
0.11
0.36
0.32
0.61
0.17
0.72
PAST YEAR SERIOUS
PSYCHOLOGICAL DISTRESS3
N/A
N/A
N/A
1.62
0.82
1.93
PAST YEAR MAJOR DEPRESSIVE
EPISODE4
1.52
0.69
1.53
1.35
0.64
1.67
PAST YEAR RECEIPT OF
SPECIALTY TREATMENT FOR
ILLICIT DRUG OR ALCOHOL
USE2,5
0.34
0.20
0.20
0.16
0.12
0.18
MENTAL HEALTH
TREATMENT/COUNSELING6
N/A
N/A
N/A
1.19
0.54
0.92
Inpatient
N/A
N/A
N/A
0.32
0.14
0.35
Outpatient
N/A
N/A
N/A
0.94
0.42
0.66
Prescription Medication
N/A
N/A
N/A
1.11
0.52
0.87
Illicit Drugs or Alcohol2
NOTES:
*Low precision; no estimate reported. NOTE:Appalachian region is defined as all areas covered by the 410 designated counties in 13 states. N/A: Not applicable.
1
Dependence or abuse is based on definitions found in the 4th edition of the Diagnostic and Statistical Manual of Mental Disorders (DSM-IV).
2
Illicit Drugs include marijuana/hashish, cocaine (including crack), heroin, hallucinogens, inhalants, or prescription-type psychotherapeutics used nonmedically.
3
Serious Psychological Distress (SPD) is defined as having a score of 13 or higher on the K6 scale. Due to questionnaire changes, these combined 2004 and 2005 estimates are not
comparable with 2004 and earlier estimates published in prior NSDUH reports. See Section B.4.4 in Appendix B of the Results from the 2005 National Survey on Drug Use and
Health: National Findings. Estimates are based on combined 2004-2005 data.
262
Table 2.9B Substance Dependence or Abuse, Mental Health Measures, and Receipt of Substance Use Treatment in the Past
Year among Persons Aged 12 or Older Residing in Appalachian Region, by Age Group and Appalachian Socioeconomic
Status: Standard Errors of Percentages, Annual Averages Based on 2002-2005
4
Major Depressive Episode (MDE) is defined as a period of at least 2 weeks when a person experienced a depressed mood or loss of interest or pleasure in daily activities and had a
majority of the symptoms for depression as described in the 4th edition of the Diagnostic and Statistical Manual of Mental Disorders (DSM-IV). Estimates are based on combined
2004-2005 data.
NOTES (Cont):
5
Received Substance Use Treatment at a Specialty Facility refers to treatment received at a hospital (inpatient), rehabilitation facility (inpatient or outpatient), or mental health
center in order to reduce or stop illicit drug or alcohol use, or for medical problems associated with illicit drug or alcohol use. Estimates include persons who received treatment
specifically for illicit drugs or alcohol, as well as persons who received treatment but did not specify for what substance(s).
6
Mental Health Treatment/Counseling is defined as having received inpatient care or outpatient care or having used prescription medication for problems with emotions, nerves, or
mental health. Respondents were not to include treatment for drug or alcohol use. Respondents with unknown treatment/counseling information were excluded. Estimates were
based only on responses to items in the Adult Mental Health Service Utilization module.
Source: SAMHSA, Office of Applied Studies, National Survey on Drug Use and Health, 2002, 2003, 2004, and 2005.
263
Table 2.10B Access to Alcohol Treatment among Persons Aged 12 or Older, by Age Group and Appalachian Region Status:
Standard Errors of Percentages, Annual Averages Based on 2002-2005
Age 12-17
Age 18 or Older
Appalachian
Outside
Appalachian
Outside
Region
Appalachia
Region
Appalachia
Access to Alcohol Treatment1,2
Needed But Not Received Alcohol
0.37
0.11
0.26
0.09
Treatment
Felt Need for Alcohol Treatment
0.05
0.02
0.07
0.02
Felt Need for Alcohol Treatment and
0.03
0.02
0.05
0.02
Made No Effort
*Low precision; no estimate reported.
NOTE: Received Alcohol Treatment at a Specialty Facility refers to treatment received at a hospital (inpatient), rehabilitation facility (inpatient or outpatient), or mental health
center in order to reduce or stop alcohol use, or for medical problems associated with alcohol use.
1
Needing But Not Receiving Treatment refers to respondents classified as needing treatment for alcohol, but have not received treatment for an alcohol problem at a specialty
facility (i.e., drug and alcohol rehabilitation facilities [inpatient or outpatient], hospitals [inpatient only], and mental health centers).
2
Felt Need for Treatment includes persons who did not receive but felt they needed treatment for an alcohol problem, as well as persons who received treatment at a location other
than a specialty facility but felt they needed additional treatment.
Source: SAMHSA, Office of Applied Studies, National Survey on Drug Use and Health, 2002, 2003, 2004, and 2005.
264
Table 2.11B Access to Drug Treatment among Persons Aged 12 or Older, by Age Group and Appalachian Region Status:
Standard Errors of Percentages, Annual Averages Based on 2002-2005
Age 12-17
Age 18 or Older
Appalachian
Outside
Appalachian
Outside Appalachia
Region
Appalachia
Region
Access to Drug Treatment1,2
Needed But Not Received Treatment
0.32
0.10
0.15
0.05
for an Illicit Drug Problem
Felt Need for Treatment for an Illicit
0.06
0.02
0.05
0.02
Drug Problem
Felt Need for Treatment for an Illicit
0.05
0.02
0.05
0.02
Drug Problem and Made No Effort
*Low precision; no estimate reported.
NOTE: Illicit Drugs include marijuana/hashish, cocaine (including crack), heroin, hallucinogens, inhalants, or prescription-type pychotherapeutics used nonmedically.
NOTE: Received Illicit Drug Treatment at a Specialty Facility refers to treatment received at a hospital (inpatient), rehabilitation facility (inpatient or outpatient), or mental health
center in order to reduce or stop illicit drug use, or for medical problems associated with illicit drug use.
1
Needing But Not Receiving Treatment refers to respondents classified as needing treatment for illicit drugs, but have not received treatment for an illicit drug problem at a
specialty facility (i.e., drug and alcohol rehabilitation facilities [inpatient or outpatient], hospitals [inpatient only], and mental health centers.
2
Felt Need for Treatment includes persons who did not receive but felt they needed treatment for an illicit drug problem, as well as persons who received treatment at a location
other than a specialty facility but felt they needed additional treatment.
Source: SAMHSA, Office of Applied Studies, National Survey on Drug Use and Health, 2002, 2003, 2004, and 2005.
265
Table 2.12B Reasons for Not Receiving Substance Use Treatment and Locations of Treatment among Persons Aged 12 or
Older, by Age Group and Appalachian Region Status: Standard Errors of Percentages, Annual Averages Based on 2002-2005
Age 12-17
Appalachian Region
Outside Appalachia
Reasons for Not Receiving Drug or Alcohol Treatment among Persons
Who Needed But Did Not Receive Treatment at a Specialty Facility1
Cost/Insurance Barriers2
Not Ready to Stop Using
Stigma3,7
Did Not Know Where to Go for Treatment
Did Not Feel Need for Treatment/Could Handle the Problem Without
Treatment4,7
Did Not Have Time7
Treatment Would Not Help7
Other Access Barriers5
Locations Where Past Year Substance Treatment was Received among
Persons Who Received Treatment at a Specialty Facility6
Self-Help Group
Outpatient Rehabilitation
Inpatient Rehabilitation
Mental Health Center
Hospital Inpatient
Private Doctor's Office
Emergency Room
Prison or Jail
Age 18 or Older
Appalachian Region
Outside Appalachia
*
*
*
*
*
3.46
4.21
4.55
2.35
3.77
*
*
*
*
*
2.39
2.36
2.29
1.42
1.78
*
*
*
2.00
2.23
3.09
*
*
*
1.17
0.94
1.61
*
*
*
*
*
*
*
*
2.54
2.20
2.62
2.48
2.48
1.73
2.01
1.75
4.88
4.46
4.65
5.14
4.95
3.63
3.35
1.96
1.77
1.67
1.81
1.86
1.71
1.24
1.30
0.93
*Low precision; no estimate reported.
NOTE: Respondents were classified as needing treatment for an illicit drug or alcohol problem if they met at least one of three criteria during the past year: (1) dependent on illicit drugs or alcohol;
(2) abuse of illicit drugs or alcohol; or (3) received treatment for an illicit drug or alcohol problem at a specialty facility (i.e., drug and alcohol rehabilitation facilities [inpatient or outpatient], hospitals
[inpatient only], and mental health centers). Illicit Drugs include marijuana/hashish, cocaine (including crack), heroin, hallucinogens, inhalants, or prescription-type psychotherapeutics used nonmedically.
NOTE: Needing But Not Receiving Treatment refers to respondents classified as needing treatment for illicit drugs or alcohol, but have not received treatment for an illicit drug or alcohol problem at a
specialty facility. Felt Need for Treatment includes persons who did not receive but felt they needed treatment for an illicit drug or alcohol problem, as well as persons who received treatment at a
location other than a specialty facility but felt they needed additional treatment.
1
Respondents could indicate multiple reasons; thus, these response categories are not mutually exclusive.
2
Includes reasons of "No health coverage and could not afford cost," "Had health coverage but did not cover treatment or did not cover cost," and other-specify responses of "Could not afford cost; health
coverage not indicated."
3
Includes reasons of "Might cause neighbors/community to have negative opinion," "Might have negative effect on job," "Did not want others to find out," and other-specify responses of
"Ashamed/embarrassed/afraid" and "Afraid would have trouble with the police/social services."
4
Includes reasons of "Did not feel need for treatment," "Could handle the problem without treatment," and other-specify responses of "Could do it with support of family/friends/ others," and "Could do it
through religion/spirituality."
5
Includes reasons of "No transportation/inconvenient," "No program having type of treatment," "No openings in a program," and other-specify responses of "No program had counselor/doctors with whom
you were comfortable," "Services desired were unavailable or you were currently ineligible," and "Attempted to get treatment but encountered delays."
6
Respondents could indicate multiple locations of treatment; thus, these response categories are not mutually exclusive.
7
Estimates are based only on combined 2003-2005 data.
Source: SAMHSA, Office of Applied Studies, National Survey on Drug Use and Health, 2002, 2003, 2004, and 2005.
266
Table 2.13B Reasons for Not Receiving Mental Health Treatment among Persons Aged 12 or Older, by Age Group and
Appalachian Region Status: Standard Errors of Percentages, Annual Averages Based on 2002-2005
Age 12-17
Appalachian
Outside Appalachia
Region
Reasons for Not Receiving Mental
Health Treatment/Counseling among
Persons with an Unmet Need for
Mental Health Treatment1,2
Cost/Insurance Barriers2
Did Not Feel Need for
Treatment/Could Handle the Problem
Without Treatment3,7
Stigma4,7
Did not Know Where to Go for Services
Did Not Have Time7
Treatment Would Not Help5,7
Fear of Being Committed/Have to Take
Medicine
Other Access Barriers6,7
Age 18 or Older
Appalachian Region
Outside
Appalachia
N/A
N/A
N/A
N/A
2.36
2.89
0.81
0.87
N/A
N/A
N/A
N/A
N/A
N/A
N/A
N/A
N/A
N/A
2.35
1.40
1.80
1.79
1.44
0.72
0.63
0.65
0.58
0.36
N/A
N/A
0.93
0.46
*Low precision; no estimate reported.
N/A: Not applicable.
NOTE: Unmet Need for Mental Health Treatment/Counseling is defined as a perceived need for treatment that was not received.
NOTE: Estimates represent reasons for not receiving mental health treatment/counseling for all persons aged 18 or older with an unmet need for treatment, including those with unknown mental health
treatment/counseling information.
NOTE: Mental Health Treatment/Counseling is defined as having received inpatient care or outpatient care or having used prescription medication for problems with emotions, nerves, or mental
health. Respondents were not to include treatment for drug or alcohol use. Respondents with unknown treatment/counseling information were excluded. Estimates were based only on
responses to items in the Adult Mental Health Service Utilization module.
1
2
3
4
5
6
7
Respondents could indicate multiple reasons; thus, these response categories are not mutually exclusive.
Includes reasons of "Could not afford," "Health insurance does not pay enough," "Health insurance does not cover mental health treatment," and other-specify responses of "No health insurance."
Includes reasons of "Did not feel need for treatment," "Could handle problem without treatment," and other-specify responses of "Work on problems with family/friends" and "Work on problems
through religion/spirituality."
Includes reasons of "Might cause neighbors/community to have negative opinion," "Might have negative effect on job," "Concerned about confidentiality," "Did not want others to find out," and otherspecify responses of "Ashamed/embarrassed/afraid," "Concerned how court system would treat me," and "Concerned how it would affect future insurability."
Includes reasons of "Did not feel need for treatment," "Could handle problem without treatment," and other-specify responses of "Work on problems with family/friends" and "Work on problems
through religion/spirituality."
Includes reasons of "No transportation/inconvenient" and other-specify responses of "Too much red tape/hassle to get services," "No openings/long waiting lists/delays," "Services unavailable/limited
in area," "Attempted to get treatment but unsuccessful in finding help," and "Could not find program/counselor comfortable with."
Estimates are based only on combined 2003-2005 data.
Source: SAMHSA, Office of Applied Studies, National Survey on Drug Use and Health, 2002, 2003, 2004, and 2005.
267
Table 2.14B Access to Alcohol Use Treatment among Persons Aged 12 or Older, by Age Group and Appalachian SubRegion: Standard Errors of Percentages, Annual Averages Based on 2002-2005
Age 12-17
Age 18 or Older
North
Central
South
North
Central
South
Access to Alcohol Treatment1,2
Needed But Not Received Alcohol
0.43
0.88
0.66
0.37
0.54
0.41
Treatment
Felt Need for Alcohol Treatment
0.07
0.27
0.07
0.11
0.21
0.10
Felt Need for Alcohol Treatment and
0.05
0.20
0.04
0.05
0.21
0.09
Made No Effort
*Low precision; no estimate reported.
NOTE: Received Alcohol Treatment at a Specialty Facility refers to treatment received at a hospital (inpatient), rehabilitation facility (inpatient or outpatient), or mental health
center in order to reduce or stop alcohol use, or for medical problems associated with alcohol use.
1
Needing But Not Receiving Treatment refers to respondents classified as needing treatment for alcohol, but have not received treatment for an alcohol problem at a specialty
facility (i.e., drug and alcohol rehabilitation facilities [inpatient or outpatient], hospitals [inpatient only], and mental health centers).
2
Felt Need for Treatment includes persons who did not receive but felt they needed treatment for an alcohol problem, as well as persons who received treatment at a location
other than a specialty facility but felt they needed additional treatment.
Source: SAMHSA, Office of Applied Studies, National Survey on Drug Use and Health, 2002, 2003, 2004, and 2005.
268
Table 2.15B Access to Drug Use Treatment among Persons Aged 12 or Older, by Age Group and Appalachian Sub-Region:
Standard Errors of Percentages, Annual Averages Based on 2002-2005
Age 12-17
Age 18 or Older
North
Central
South
North
Central
South
1,2
Access to Drug Treatment
Needed But Not Received Treatment for an
0.38
0.64
0.55
0.18
0.49
0.26
Illicit Drug Problem
Felt Need for Treatment for an Illicit Drug
0.08
0.15
0.08
0.06
0.23
0.08
Problem
Felt Need for Treatment for an Illicit Drug
0.05
0.15
0.08
0.05
0.23
0.08
Problem and Made No Effort
*Low precision; no estimate reported.
NOTE: Illicit Drugs include marijuana/hashish, cocaine (including crack), heroin, hallucinogens, inhalants, or prescription-type pychotherapeutics used nonmedically.
NOTE: Received Illicit Drug Treatment at a Specialty Facility refers to treatment received at a hospital (inpatient), rehabilitation facility (inpatient or outpatient), or mental
health center in order to reduce or stop illicit drug use, or for medical problems associated with illicit drug use.
1
Needing But Not Receiving Treatment refers to respondents classified as needing treatment for illicit drugs, but have not received treatment for an illicit drug problem at a
specialty facility (i.e., drug and alcohol rehabilitation facilities [inpatient or outpatient], hospitals [inpatient only], and mental health centers.
2
Felt Need for Treatment includes persons who did not receive but felt they needed treatment for an illicit drug problem, as well as persons who received treatment at a location
other than a specialty facility but felt they needed additional treatment.
Source: SAMHSA, Office of Applied Studies, National Survey on Drug Use and Health, 2002, 2003, 2004, and 2005.
269
Table 2.16B Reasons for Not Receiving Mental Health Treatment among Persons Aged 12 or Older, by Age Group and
Appalachian Sub-Region: Standard Errors of Percentages, Annual Averages Based on 2002-2005
Reasons for Not Receiving Mental Health
Treatment/Counseling among Persons
with an Unmet Need for Mental Health
Treatment1,2
Cost/Insurance Barriers2
Did Not Feel Need for
Treatment/Could Handle the Problem
Without Treatment3,7
Stigma4,7
Did not Know Where to Go for
Services
Did Not Have Time7
Treatment Would Not Help5,7
Fear of Being Committed/Have to
Take Medicine
Other Access Barriers6,7
North
Age 12-17
Central
South
North
Age 18 or Older
Central
N/A
N/A
N/A
N/A
N/A
N/A
2.86
3.42
*
*
4.19
5.17
N/A
N/A
N/A
N/A
N/A
N/A
3.04
1.84
*
*
4.12
2.36
N/A
N/A
N/A
N/A
N/A
N/A
N/A
N/A
N/A
2.07
2.46
1.63
*
*
2.53
3.40
*
2.64
N/A
N/A
N/A
1.31
*
1.65
South
*Low precision; no estimate reported.
N/A: Not applicable.
NOTE: Unmet Need for Mental Health Treatment/Counseling is defined as a perceived need for treatment that was not received.
NOTE: Estimates represent reasons for not receiving mental health treatment/counseling for all persons aged 18 or older with an unmet need for treatment, including those with unknown mental
health treatment/counseling information.
NOTE: Mental Health Treatment/Counseling is defined as having received inpatient care or outpatient care or having used prescription medication for problems with emotions, nerves, or mental
health. Respondents were not to include treatment for drug or alcohol use. Respondents with unknown treatment/counseling information were excluded. Estimates were based only on
responses to items in the Adult Mental Health Service Utilization module.
1
2
3
4
5
6
7
Respondents could indicate multiple reasons; thus, these response categories are not mutually exclusive.
Includes reasons of "Could not afford," "Health insurance does not pay enough," "Health insurance does not cover mental health treatment," and other-specify responses of "No health insurance."
Includes reasons of "Did not feel need for treatment," "Could handle problem without treatment," and other-specify responses of "Work on problems with family/friends" and "Work on problems
through religion/spirituality."
Includes reasons of "Might cause neighbors/community to have negative opinion," "Might have negative effect on job," "Concerned about confidentiality," "Did not want others to find out," and
other-specify responses of "Ashamed/embarrassed/afraid," "Concerned how court system would treat me," and "Concerned how it would affect future insurability."
Includes reasons of "Did not feel need for treatment," "Could handle problem without treatment," and other-specify responses of "Work on problems with family/friends" and "Work on problems
through religion/spirituality."
Includes reasons of "No transportation/inconvenient" and other-specify responses of "Too much red tape/hassle to get services," "No openings/long waiting lists/delays," "Services unavailable/limited
in area," "Attempted to get treatment but unsuccessful in finding help," and "Could not find program/counselor comfortable with."
Estimates are based only on combined 2003-2005 data.
Source: SAMHSA, Office of Applied Studies, National Survey on Drug Use and Health, 2002, 2003, 2004, and 2005.
270
Table 2.17B Access to Alcohol Use Treatment among Persons Aged 12 or Older, by Age Group and Appalachian
Socioeconomic Status: Standard Errors of Percentages, Annual Averages Based on 2002-2005
Age 12-17
Age 18 or Older
At-Risk or Transitional Competitive At-Risk or Transitional Competitive
Distressed
or
Distressed
or
Attainment
Attainment
Access to Alcohol Treatment1,2
Needed But Not Received Alcohol
0.67
0.49
0.61
0.44
0.33
0.58
Treatment
Felt Need for Alcohol Treatment
0.25
0.05
0.08
0.14
0.07
0.19
Felt Need for Alcohol Treatment and
0.17
0.03
0.03
0.12
0.07
0.11
Made No Effort
*Low precision; no estimate reported.
NOTE: Received Alcohol Treatment at a Specialty Facility refers to treatment received at a hospital (inpatient), rehabilitation facility (inpatient or outpatient), or mental health
center in order to reduce or stop alcohol use, or for medical problems associated with alcohol use.
1
Needing But Not Receiving Treatment refers to respondents classified as needing treatment for alcohol, but have not received treatment for an alcohol problem at a specialty
facility (i.e., drug and alcohol rehabilitation facilities [inpatient or outpatient], hospitals [inpatient only], and mental health centers).
2
Felt Need for Treatment includes persons who did not receive but felt they needed treatment for an alcohol problem, as well as persons who received treatment at a location
other than a specialty facility but felt they needed additional treatment.
Source: SAMHSA, Office of Applied Studies, National Survey on Drug Use and Health, 2002, 2003, 2004, and 2005.
271
Table 2.18B Access to Drug Treatment among Persons Aged 12 or Older, by Age Group and Appalachian Socioeconomic
Status: Standard Errors of Percentages, Annual Averages Based on 2002-2005
Age 12-17
Age 18 or Older
At-Risk or Transitional Competitive At-Risk Transitional Competitive
Distressed
or
or
or
Attainment Distressed
Attainment
Access to Drug Treatment1,2
0.69
0.46
0.50
0.32
0.20
0.30
Needed But Not Received Treatment for
an Illicit Drug Problem
0.19
0.06
0.12
0.11
0.06
0.13
Felt Need for Treatment for an Illicit
Drug Problem
Felt Need for Treatment for an Illicit
0.15
0.05
0.09
0.11
0.05
0.13
Drug Problem and Made No Effort
*Low precision; no estimate reported.
NOTE: Illicit Drugs include marijuana/hashish, cocaine (including crack), heroin, hallucinogens, inhalants, or prescription-type pychotherapeutics used nonmedically.
NOTE: Received Illicit Drug Treatment at a Specialty Facility refers to treatment received at a hospital (inpatient), rehabilitation facility (inpatient or outpatient), or mental
health center in order to reduce or stop illicit drug use, or for medical problems associated with illicit drug use.
1
Needing But Not Receiving Treatment refers to respondents classified as needing treatment for illicit drugs, but have not received treatment for an illicit drug problem at a
specialty facility (i.e., drug and alcohol rehabilitation facilities [inpatient or outpatient], hospitals [inpatient only], and mental health centers.
2
Felt Need for Treatment includes persons who did not receive but felt they needed treatment for an illicit drug problem, as well as persons who received treatment at a location
other than a specialty facility but felt they needed additional treatment.
Source: SAMHSA, Office of Applied Studies, National Survey on Drug Use and Health, 2002, 2003, 2004, and 2005.
272
Table 2.19B Reasons for Not Receiving Mental Health Treatment/Counseling for Persons with an Unmet Need for Mental
Health Treatment, by Age Group and Appalachian Socioeconomic Status: Based on 2002-2005
At-Risk or
Distressed
Reasons for Not Receiving Mental Health
Treatment/Counseling among Persons
with an Unmet Need for Mental Health
Treatment1,2
Cost/Insurance Barriers2
Did Not Feel Need for Treatment/Could
Handle the Problem Without
Treatment3,7
Stigma4,7
Did not Know Where to Go for Services
Did Not Have Time7
Treatment Would Not Help5,7
Fear of Being Committed/Have to Take
Medicine
Other Access Barriers6,7
Age 12-17
Transitional
Competitive
or
Attainment
At-Risk or
Distressed
Age 18 or Older
Transitional
Competitive
or
Attainment
N/A
N/A
N/A
N/A
N/A
N/A
4.29
5.71
3.26
3.26
4.70
*
N/A
N/A
N/A
N/A
N/A
N/A
N/A
N/A
N/A
N/A
N/A
N/A
N/A
N/A
N/A
4.66
2.27
3.26
2.16
3.67
2.92
1.93
2.42
2.03
1.63
*
3.16
4.04
*
3.34
N/A
N/A
N/A
1.34
1.34
2.02
*Low precision; no estimate reported.
N/A: Not applicable.
NOTE: Unmet Need for Mental Health Treatment/Counseling is defined as a perceived need for treatment that was not received.
NOTE: Estimates represent reasons for not receiving mental health treatment/counseling for all persons aged 18 or older with an unmet need for treatment, including those with unknown mental health
treatment/counseling information.
NOTE: Mental Health Treatment/Counseling is defined as having received inpatient care or outpatient care or having used prescription medication for problems with emotions, nerves, or mental health.
Respondents were not to include treatment for drug or alcohol use. Respondents with unknown treatment/counseling information were excluded. Estimates were based only on responses to items
in the Adult Mental Health Service Utilization module.
1
Respondents could indicate multiple reasons; thus, these response categories are not mutually exclusive.
2
Includes reasons of "Could not afford," "Health insurance does not pay enough," "Health insurance does not cover mental health treatment," and other-specify responses of "No health insurance."
3
Includes reasons of "Did not feel need for treatment," "Could handle problem without treatment," and other-specify responses of "Work on problems with family/friends" and "Work on problems through
religion/spirituality."
4
Includes reasons of "Might cause neighbors/community to have negative opinion," "Might have negative effect on job," "Concerned about confidentiality," "Did not want others to find out," and otherspecify responses of "Ashamed/embarrassed/afraid," "Concerned how court system would treat me," and "Concerned how it would affect future insurability."
5
Includes reasons of "Did not feel need for treatment," "Could handle problem without treatment," and other-specify responses of "Work on problems with family/friends" and "Work on problems through
religion/spirituality."
6
Includes reasons of "No transportation/inconvenient" and other-specify responses of "Too much red tape/hassle to get services," "No openings/long waiting lists/delays," "Services unavailable/limited in
area," "Attempted to get treatment but unsuccessful in finding help," and "Could not find program/counselor comfortable with."
7
Estimates are based only on combined 2003-2005 data.
Source: SAMHSA, Office of Applied Studies, National Survey on Drug Use and Health, 2002, 2003, 2004, and 2005.
273
APPENDIX D: County-Level Data Profiles for Appalachian Case Studies
Profile of Bath County, VA
1. Sociodemographic Characteristics
3. Access to Treatment
Bath
County
Population, 2006 estimate
4,814
Population density per square
mile, 2000
9.5
Percentage of urban
population, 2000
0%
Median home value, dollars,
2000
$79,700
Persons below poverty,
percent, 2004
7.3%
High school graduates,
percent of persons age 25+,
2000
74%
Virginia
Treatment Access Gap
7,642,884
84.9%
$125,400
9.5%
81.5%
Sources: Population estimates from U.S. Census Bureau State & County Facts. State-level urban population variable from U.S. Department
of Agriculture. All other variables from the U.S. Census Bureau, 2000. Map from www.epodunk.com.
7.36
8
178.8
Percentage of Bath County
Population
Socio-Demographics
7
6
5
2.61
4
3
2
1
0
Needing but not receiving Needing but not receiving
treatment for alcohol use
treatment for drug use
Source: National Survey on Drug Use and Health, 2002-2004.
4. Institutional Characteristics
2. Overview of Substance Abuse and Mental Health
Bath
County
Substance Abuse and Mental Health Problems
in the Last Year
Percen tag e o f B ath C o u n ty Po p u latio n
Substance Abuse or Mental Health Problem in the
Past Year
Bath
Virginia
County
Alcohol abuse or
7.82
7.67
dependence (%)
Abuse or dependence of
3.06
3.01
any illicit drugs (%)
Non-prescription use of
4.94
5.05
painkillers (%)
Serious psychological
8.59
8.91
distress problem (%)
Suicide rate (%)
0
0.018
Institutional Characteristics
10
9
8
7
6
5
8.59
7.82
4.94
4
3
2
1
0
3.06
Alcohol abuse or
dependence (%)
Abuse or
dependence of
any illicit drugs
(%)
Non-prescription
Serious
use of painkillers
psychological
(%)
distress problem
(%)
% In
correctional/juvenile
institutions
0.12
1.21
% In mental health
hospitals/institutions
0
0.028
Proportion of mental
health professional
shortage area
None
Proportion of primary
care health
professional shortage
area
Source: Area Resource File, 2004.
Sources: National Survey on Drug Use and Health, 2002-2004, and the Area Resource File, 2004.
275
Virginia
Whole
None
39.13
Partial
0.00
Whole
60.87
None
26.09
Partial
26.09
Whole
47.83
2
Profile of Bath County, VA
5. Cigarette Smoking and Tobacco Use
7. Marijuana and Other Illicit Drug Use
Cigarette Smoking and Tobacco Use
(% of Bath County population)
Bath
Virginia
County
Any tobacco use,
past month
31.67
32.55
Cigarette
smoking, past
month
26.61
27.42
Perceived great
risk of smoking 1
or more packs of
cigarettes/day
70.11
% of Adults Age 12 or Older Who Used Illicit Drug Use
Bath County
Virginia
Cigarette Smoking and Tobacco Use
Any tobacco use,
past month
Any illicit drug use in the past
month
Any illicit drug use other than
marijuana in the past month
Cocaine use in the past year
31.67
Cigarette smoking,
past month
26.61
7.63
7.63
3.92
3.86
2.31
2.34
% of Adults Age 12 or Older Who Used Marijuana
69.72
Perception of
Smoking 1 or more
packs of
cigarettes/day
Sources: National Survey on Drug Use and Health, 20022004.
70.11
0
10
20
30
40
50
60
70
Marijuana use, past month
5.65
5.75
Marijuana use, past year
9.58
9.82
Annual rate of first use of
marijuana
1.82
1.98
80
Percent of Bath County Population
Sources: National Survey on Drug Use and Health, 2002-2004..
6. Alcohol Use and Binge Drinking
Alcohol Use and Binge Drinking,
% of Adults 12 or Older
Bath County
50.48
Alcohol, past month
50.48
46.32
Alcohol, past month, ages 12 - 20
31.93
31.31
Binge alcohol, past month
22.90
22.11
Binge alcohol, past month, ages 12
- 20
23.22
23.42
Perceived great risk of binge
drinking
41.18
Percent of Bath County
Population
60
50
23.22
40
30
20
10
0
Alcohol, past
m onth
Alcohol, past
m onth, ages 12 - 20
Sources: National Survey on Drug Use and Health, 2002-2004.
Prepared by Zhiwei Zhang, Ph.D., Alycia Infante, M.P.A., Michael Meit, M.A., M.P.H., NORC
276
Binge Drinking in Bath County
Virginia
43.07
Percent of Bath County Population
Alcohol Use in Bath County
45
41.18
40
31.93
35
30
25
22.9
20
15
10
5
0
Binge alcohol, past
month
Binge alcohol, past
month, ages 12 - 20
Perceived great risk of
binge drinking
3.
Profile of Bland County, VA
3. Access to Treatment
1. Socio-demographic Characteristics
Virginia
Population, 2006 estimate
6,903
7,642,884
Population density per
square mile, 2000
19.1
178.8
Percentage of urban
population, 2000
0%
Median home value, dollars,
2000
$71,500
$125,400
Persons below poverty,
percent, 2004
11.9%
9.5%
High school graduates,
percent of persons age 25+,
2000
70.9%
84.9%
81.5%
Treatment Access Gap
7.05
8
Percen tag e o f B lan d C o u n ty
Po p u latio n
Bland
County
Socio-Demographics
7
6
5
2.57
4
3
2
1
0
Sources: Population estimates from U.S. Census Bureau State & County Facts. State-level urban population variable from U.S. Department
of Agriculture. All other variables from the U.S. Census Bureau, 2000. Map from www.epodunk.com.
Needing but not receiving Needing but not receiving
treatment for alcohol use treatment for drug use
Source: National Survey on Drug Use and Health, 2002-2004.
Substance Abuse or Mental Health Problem in the
Past Year
Bland
Virginia
County
Alcohol abuse or
dependence (%)
7.52
7.67
Abuse or dependence of any
illicit drugs (%)
2.95
3.01
Non-prescription use of
painkillers (%)
5.16
Serious psychological
distress problem (%)
9.22
8.91
Suicide rate (%)
0.029
0.018
5.05
Percen tag e o f B lan d C o u n ty Po p u latio n
2. Overview of Substance Abuse and Mental Health
4. Institutional Characteristics
Substance Abuse and Mental Health Problems
in the Last Year
10
9
8
Institutional Characteristics
9.22
Bland
County
7.52
7
6
5.16
5
4
3
Virginia
% In
correctional/juvenile
institutions
8.59
1.21
% In mental health
hospitals/institutions
0
0.028
Proportion of mental
health professional
shortage area
Whole
2.95
2
1
0
Alcohol abuse or
dependence (%)
Abuse or
dependence of
any illicit drugs
(%)
Non-prescription
Serious
use of painkillers
psychological
(%)
distress problem
(%)
Proportion of primary
care health
professional shortage
area
Sources: National Survey on Drug Use and Health, 2002-2004, and the Area Resource File, 2004.
Prepared by Zhiwei Zhang, Ph.D., Alycia Infante, M.P.A., Michael Meit, M.A., M.P.H., NORC
277
Source: Area Resource File, 2004.
Whole
None
39.13
Partial
0
Whole
60.87
None
26.09
Partial
26.09
Whole
47.83
2
Profile of Bland County, VA
5. Cigarette Smoking and Tobacco Use
7. Marijuana and Other Illicit Drug Use
Cigarette Smoking and Tobacco Use
(% of Bland Co. population)
Bland
Virginia
County
Any tobacco use,
past month
33.43
32.55
Cigarette
smoking, past
month
28.22
27.42
Perceived great
risk of smoking 1
or more packs of
cigarettes/day
69.32
% of Adults Age 12 or Older Who Used Illicit Drugs
Bland
Virginia
County
Any illicit drug use in the past
7.63
7.63
month
Any illicit drug use other than
3.79
3.86
marijuana in the past month
Cocaine use in the past year
2.37
2.34
Cigarette Smoking and Tobacco Use
Any tobacco use,
past month
33.43
Cigarette smoking,
past month
28.22
% of Adults Age 12 or Older Who Used Marijuana
69.72
Perception of
Smoking 1 or more
packs of
cigarettes/day
Sources: National Survey on Drug Use and Health, 20022004.
69.32
0
10
20
30
40
50
60
70
80
Percent of Bland County Population
Marijuana use, past month
5.84
5.75
Marijuana use, past year
10.06
9.82
Annual rate of first use of
marijuana
2.14
1.98
Sources: National Survey on Drug Use and Health, 2002-2004.
6. Alcohol Use and Binge Drinking
Percent of Bland County
Population
42.15
30.69
45
40
35
30
25
20
15
10
5
0
Alcohol, past
m onth
Alcohol, past
m onth, ages 12 20
Alcohol Use and Binge Drinking,
% of Adults 12 or Older
Bland
County
Alcohol, past month
42.15
46.32
Alcohol, past month, ages 12 - 20
30.69
31.31
Binge alcohol, past month
21.32
22.11
Binge alcohol, past month, ages 12
- 20
23.61
23.42
Perceived great risk of binge
drinking
44.95
Sources: National Survey on Drug Use and Health, 2002-2004.
Prepared by Zhiwei Zhang, Ph.D., Alycia Infante, M.P.A., Michael Meit, M.A., M.P.H., NORC
278
Binge Drinking in Bland County
Virginia
43.07
Percent of Bland County Population
Alcohol Use in Bland County
50
44.95
45
40
35
30
25
21.32
23.61
Binge alcohol, past
month
Binge alcohol, past
month, ages 12 - 20
20
15
10
5
0
Perceived great risk of
binge drinking
3.
Profile of Hardy County, WV
3. Access to Treatment
1. Socio-demographic Characteristics
West
Virginia
Population, 2006 estimate
13,420
1,818,470
Population density per
square mile, 2000
21.7
75.1
Percentage of urban
population, 2000
0%
55.18%
Median home value, dollars,
2000
$74,700
$ 72,800
Persons below poverty,
percent, 2004
12.5%
16.2%
High school graduates,
percent of persons age 25+,
2000
70.3%
75.2%
Abuse or dependence of
any illicit drugs (%)
2.77
Non-prescription use of
painkillers (%)
Serious psychological
distress problem (%)
Suicide rate (%)
4.54
11.07
0.0079
6.93
3.08
5.67
12.26
Percen tag e o f H ard y C o u n ty Po p u latio n
6.39
6.00
5.00
4.00
2.35
3.00
2.00
1.00
Needing but not receiving Needing but not receiving
treatment for alcohol use treatment for drug use
2. Overview of Substance Abuse and Mental Health
Alcohol abuse or
dependence (%)
6.00
-
Sources: Population estimates from U.S. Census Bureau State & County Facts. State-level urban population variable from U.S. Department
of Agriculture. All other variables from the U.S. Census Bureau, 2000. Map from www.epodunk.com.
Substance Abuse or Mental Health Problem in the
Past Year
Hardy
West
County
Virginia
Treatment Access Gap
Percen tag e o f H ard y Co u n ty
Po p u latio n
Hardy
County
Socio-Demographics
Source: National Survey on Drug Use and Health, 2002-2004.
4. Institutional Characteristics
Institutional Characteristics
Substance Abuse and Mental Health Problems
in the Last Year
12
Hardy
County
11.07
10
8
6.39
6
West Virginia
% In
correctional/juvenile
institutions
0
0.63
% In mental health
hospitals/institutions
0
0.066
Proportion of mental
health professional
shortage area
Whole
4.54
4
2.77
2
0
Alcohol abuse or
dependence (%)
0.013
Abuse or
dependence of
any illicit drugs
(%)
Serious
Non-prescription
use of painkillers psychological
distress problem
(%)
(%)
Sources: National Survey on Drug Use and Health, 2002-2004, and the Area Resource File, 2004.
Prepared by Zhiwei Zhang, Ph.D., Alycia Infante, M.P.A., Michael Meit, M.A., M.P.H., NORC
Proportion of primary
care health
professional shortage
area
Source: Area Resource File, 2004.
279
Part
None
25.45%
Partial
40.00%
Whole
34.55%
None
54.55%
Partial
1.82%
Whole
43.64%
2
Profile of Hardy County, WV
5. Cigarette Smoking and Tobacco Use
7. Marijuana and Other Illicit Drug Use
Cigarette Smoking and Tobacco Use
(% of Hardy County population)
Hardy
West
County
Virginia
Any tobacco use,
past month
37.88
38.45
Cigarette
smoking, past
month
29.74
30.76
Perceived great
risk of smoking 1
or more packs of
cigarettes/day
67.73
% of Adults Age 12 or Older Who Used Illicit Drug Use
Hardy
West
County
Virginia
Any illicit drug use in the past
6.51
7.12
month
Any illicit drug use other than
3.48
3.82
marijuana in the past month
Cocaine use in the past year
2.05
2.51
Cigarette Smoking and Tobacco Use
Any tobacco use,
past month
37.88
Cigarette smoking,
past month
29.74
% of Adults Age 12 or Older Who Used Marijuana
67.36
67.73
Perception of
Smoking 1 or more
packs of
cigarettes/day
Sources: National Survey on Drug Use and Health, 20022004.
0
10
20
30
40
50
60
70
80
Percent of Hardy County Population
Marijuana use, past month
4.83
5.32
Marijuana use, past year
9.26
9.74
Annual rate of first use of
marijuana
1.54
1.53
Sources: National Survey on Drug Use and Health, 2002-2004..
6. Alcohol Use and Binge Drinking
39.05
29.15
Percent of Hardy County
Population
40
35
30
25
20
15
10
5
0
Alcohol, past
m onth
Alcohol, past
m onth, ages 12 20
Alcohol Use and Binge Drinking,
% of Adults 12 or Older
Hardy
County
Alcohol, past month
39.05
36.00
Alcohol, past month, ages 12 - 20
29.15
28.14
Binge alcohol, past month
19.65
19.38
Binge alcohol, past month, ages 12
- 20
21.05
21.17
Perceived great risk of binge
drinking
41.64
Sources: National Survey on Drug Use and Health, 2002-2004.
Prepared by Zhiwei Zhang, Ph.D., Alycia Infante, M.P.A., Michael Meit, M.A., M.P.H., NORC
280
Binge Drinking in Hardy County
West
Virginia
41.51
Percent of Hardy County Population
Alcohol Use in Hardy County
45
41.64
40
35
30
25
19.65
21.05
Binge alcohol, past
month
Binge alcohol, past
month, ages 12 - 20
20
15
10
5
0
Perceived great risk of
binge drinking
3.
Profile of Monroe County, WV
3. Access to Treatment
1. Socio-demographic Characteristics
West
Virginia
Population, 2006 estimate
13,510
1,818,470
Population density per
square mile, 2000
30.8
75.1
Percentage of urban
population, 2000
10.3%
Median home value, dollars,
2000
$64,700
Persons below poverty,
percent, 2004
14.3%
16.2%
High school graduates,
percent of persons age 25+,
2000
73.7%
75.2%
55.18%
$72,800
6.88
6.93
Abuse or dependence of
any illicit drugs (%)
3.33
3.08
Non-prescription use of
painkillers (%)
6.58
Serious psychological
distress problem (%)
13.66
12.26
Suicide rate (%)
0.014
0.013
5.67
P e rcen ta g e o f M o n ro e C o u n ty P o p u latio n
2. Overview of Substance Abuse and Mental Health
Alcohol abuse or
dependence (%)
6.53
7
6
5
2.91
4
3
2
1
0
Needing but not receiving Needing but not receiving
treatment for alcohol use
treatment for drug use
Sources: Population estimates from U.S. Census Bureau State & County Facts. State-level urban population variable from U.S. Department
of Agriculture. All other variables from the U.S. Census Bureau, 2000. Map from www.epodunk.com.
Substance Abuse or Mental Health Problem in the
Past Year
Monroe
West
County
Virginia
Treatment Access Gap
Percentage of Monroe County
Population
Monroe
County
Socio-Demographics
Source: National Survey on Drug Use and Health, 2002-2004.
4. Institutional Characteristics
Substance Abuse and Mental Health Problems
in the Last Year
Institutional Characteristics
16
13.66
14
Monroe
County
West Virginia
12
10
8
6.88
6.58
6
3.33
4
2
0
Alcohol abuse or
dependence (%)
Abuse or
dependence of
any illicit drugs
(%)
Serious
Non-prescription
use of painkillers psychological
distress problem
(%)
(%)
Sources: National Survey on Drug Use and Health, 2002-2004, and the Area Resource File, 2004.
Prepared by Zhiwei Zhang, Ph.D., Alycia Infante, M.P.A., Michael Meit, M.A., M.P.H., NORC
% In
correctional/juvenile
institutions
9.53
0.63
% In mental health
hospitals/institutions
0
0.066
Proportion of mental
health professional
shortage area
None
Proportion of primary
care health
professional shortage
area
Source: Area Resource File, 2004.
281
Whole
None
25.45%
Partial
40.00%
Whole
34.55%
None
54.55%
Partial
1.82%
Whole
43.64%
2
Profile of Monroe County, WV
5. Cigarette Smoking and Tobacco Use
7. Marijuana and Other Illicit Drug Use
Cigarette Smoking and Tobacco Use
(% of Monroe County population)
Monroe
West
County
Virginia
Any tobacco use,
past month
39.45
38.45
Cigarette
smoking, past
month
31.59
30.76
Perceived great
risk of smoking 1
or more packs of
cigarettes/day
66.60
% of Adults Age 12 or Older Who Used Illicit Drug Use
Monroe
West
County
Virginia
Any illicit drug use in the past
7.08
7.12
month
Any illicit drug use other than
4.04
3.82
marijuana in the past month
Cocaine use in the past year
2.48
2.51
Cigarette Smoking and Tobacco Use
Any tobacco use,
past month
39.45
Cigarette smoking,
past month
31.59
% of Adults Age 12 or Older Who Used Marijuana
67.36
Perception of
Smoking 1 or more
packs of
cigarettes/day
Sources: National Survey on Drug Use and Health, 20022004.
66.6
0
10
20
30
40
50
60
70
Percent of Monroe County Population
Marijuana use, past month
5.08
5.32
Marijuana use, past year
10.01
9.74
Annual rate of first use of
marijuana
1.35
1.53
Sources: National Survey on Drug Use and Health, 2002-2004.
6. Alcohol Use and Binge Drinking
28.58
Percent of Monroe
County Population
29
28
Alcohol Use and Binge Drinking,
% of Adults 12 or Older
Monroe
County
Alcohol, past month
28.58
West
Virginia
36.00
Alcohol, past month, ages 12 - 20
24.73
28.14
Binge alcohol, past month
17.39
19.38
Binge alcohol, past month, ages 12
- 20
18.96
21.17
Perceived great risk of binge
drinking
43.30
24.73
27
26
25
24
23
22
Alcohol, past
m onth
Alcohol, past
m onth, ages 12 20
Sources: National Survey on Drug Use and Health, 2002-2004.
Prepared by Zhiwei Zhang, Ph.D., Alycia Infante, M.P.A., Michael Meit, M.A., M.P.H., NORC
282
41.51
Binge Drinking in Monroe County
Percent of Monroe County Population
Alcohol Use in Monroe County
50
43.3
45
40
35
30
25
17.39
18.96
Binge alcohol, past
month
Binge alcohol, past
month, ages 12 - 20
20
15
10
5
0
Perceived great risk of
binge drinking
Profile of Morgan County, KY
1. Socio-demographic Characteristics
3. Access to Treatment
Morgan
County
Kentucky
Population, 2006 estimate
14,306
4,206,074
Population density per
square mile, 2000
36.6
101.7
Percentage of urban
population, 2000
20.7%
18.3%
Median home value,
dollars, 2000
$55,400
$86,700
Persons below poverty,
percent, 2004
27%
16.3%
High school graduates,
percent of persons age 25+,
2000
56.4
74.1
Treatment Access Gap
5.67
6
Percent of Morgan County
Population
Socio-Demographics
5
4
2.91
3
2
1
0
Sources: Population estimates from U.S. Census Bureau State & County Facts. All other variables from the U.S. Census Bureau, 2000,
unless otherwise indicated. Map from www.epodunk.com.
5.95
6.47
Abuse or dependence of any
illicit drugs (%)
3.37
3.11
Non-prescription use of
painkillers (%)
6.83
6.79
Serious psychological
distress problem (%)
12.61
11.37
Suicide rate
0.0215
0.0153
Source: National Survey on Drug Use and Health, 2002-2004.
Institutional Characteristics
Substance Abuse and Mental Health Problems in the Last Year
14
Percent of Morgan County Population
Alcohol abuse or
dependence (%)
Needing but not
receiving
treatm ent for
drug use
4. Institutional Characteristics
2. Overview of Substance Abuse and Mental Health
Substance Abuse or Mental Health Problem in the
Past Year
Morgan
Kentucky
County
Needing but not
receiving
treatm ent for
alcohol use
Morgan
County
12.61
12
10
8
5.95
3.37
2
0
% Alcohol
abuse or
dependence
% In
correctional/juvenile
institutions
11.93
0.798
% In mental health
hospitals/institutions
0.208
0.0485
Proportion of mental
health professional
shortage area
Whole
Proportion of primary
care health
professional shortage
area
Whole
6.83
6
4
Kentucky
% Abuse or
% Nondependence of prescription use
any illicit drugs
of painkillers
% Serious
psychological
distress
problem
Sources: National Survey on Drug Use and Health, 2002-2004, and the Area Resource File, 2004.
Prepared by Zhiwei Zhang, Ph.D., Alycia Infante, M.P.A., Michael Meit, M.A., M.P.H., NORC
283
Source: Area Resource File, 2004.
None
Whole
45.1%
54.9%
None
Partial
Whole
25.5%
3.9%
70.6%
2
Profile of Morgan County, KY
5. Cigarette Smoking and Tobacco Use
Cigarette Smoking and Tobacco Use
(% of Morgan Co. population)
Morgan
Kentucky
County
Any tobacco use,
past month
43.42
Cigarette
smoking, past
month
37.54
Perceived great
risk of smoking 1
or more packs of
cigarettes/day
61.67
7. Marijuana and Other Illicit Drug Use
% of Adults Age 12 or Older Who Used Illicit Drug Use
Morgan
Kentucky
County
Any illicit drug use in the past
7.91
8.22
month
Any illicit drug use other than
4.60
4.57
marijuana in the past month
Cocaine use in the past year
2.48
2.49
Cigarette Smoking and Tobacco Use
Any tobacco use, past month
40.06
61.67
34.55
37.54
Cigarette smoking, past month
% of Adults Age 12 or Older Who Used Marijuana
62.15
Perceived great risk of smoking 1 or
more packs of cigarettes/day
Sources: National Survey on Drug Use and Health, 20022004.
43.42
0
10 20 30 40 50 60 70
Percent of Morgan County Population
Marijuana use, past month
5.19
5.56
Marijuana use, past year
9.25
9.61
Annual rate of first use of
marijuana
1.42
1.52
Sources: National Survey on Drug Use and Health, 2002-2004..
6. Alcohol Use and Binge Drinking
% of Adults 12 or Older Who Had
Alcohol Use and Binge Drinking
Percen t o f M o rg an C o u n ty
Po p u latio n
30.06
30.5
30
29.5
29
28.5
28
27.5
27
26.5
26
25.5
25
26.8
Alcohol, past month
Alcohol, past month,
ages 12 - 20
Morgan
County
Kentucky
Alcohol, past month
30.06
36.15
Alcohol, past month, ages 12 - 20
26.80
27.60
Binge alcohol, past month
18.75
19.26
Binge alcohol, past month, ages 12
- 20
20.20
18.79
Perceived great risk of binge
drinking
43.92
Sources: National Survey on Drug Use and Health, 2002-2004..
Prepared by Zhiwei Zhang, Ph.D., Alycia Infante, M.P.A., Michael Meit, M.A., M.P.H., NORC
284
42.85
Binge Drinking in Morgan County
Percent of Morgan County Population
Alcohol Use in Morgan County
50
43.92
45
40
35
30
25
20
18.75
20.2
15
10
5
0
Binge alcohol,
past m onth
Binge alcohol,
past m onth, ages
12 - 20
Perceived great
risk of binge
drinking
Profile of Wayne County, KY
1. Socio-demographic Characteristics
3. Access to Treatment
Wayne
County
5.81
Population, 2006 estimate
20,504
Population density per
square mile, 2000
43.4
101.7
Percentage of urban
population, 2000
31.1%
18.3%
Median home value,
dollars, 2000
$55,400
$86,700
Persons below poverty,
percent, 2004
23.4%
16.3%
High school graduates,
percent of persons age 25+,
2000
57.8%
Abuse or dependence of any
illicit drugs (%)
2.74
Non-prescription use of
painkillers (%)
5.85
Serious psychological
distress problem (%)
11.40
Suicide rate
0.0100
6.47
3.11
6.79
4
2.45
3
2
1
74.1%
Needing but not
receiving
treatm ent for
alcohol use
Needing but not
receiving
treatm ent for
drug use
Source: National Survey on Drug Use and Health, 2002-2004.
4. Institutional Characteristics
Institutional Characteristics
Substance Abuse and Mental Health Problems in the Last Year
Wayne
County
12
Perc ent of Wa yne C ounty Population
6.03
5
0
2. Overview of Substance Abuse and Mental Health
Alcohol abuse or
dependence (%)
6
4,206,074
Sources: Population estimates from U.S. Census Bureau State & County Facts. All other variables from the U.S. Census Bureau, 2000,
unless otherwise indicated. Map from www.epodunk.com.
Substance Abuse or Mental Health Problem in the
Past Year
Wayne
Kentucky
County
Treatment Access Gap
Kentucky
Percent of Wayne County
Population
Socio-Demographics
11.4
10
8
6.03
6
5.85
4
2.74
2
Kentucky
% In correctional/
juvenile institutions
0.141
0.798
% In mental health
hospitals/institutions
0.0251
0.0485
Proportion of mental
health professional
shortage area
None
Proportion of
primary care health
professional shortage
area
Whole
None
45.1%
Whole
54.9%
None
25.5%
Partial
3.9%
Whole
70.6%
11.37
0
0.0153
% Alcohol
abuse or
dependence
% Abuse or
% Non% Serious
dependence of prescription use psychological
any illicit drugs of painkillers
distress
problem
Sources: National Survey on Drug Use and Health, 2002-2004, and the Area Resource File, 2004.
Prepared by Zhiwei Zhang, Ph.D., Alycia Infante, M.S., Michael Meit, M.S., NORC
285
Source: Area Resource File, 2004.
2
Profile of Wayne County
5. Cigarette Smoking and Tobacco Use
7. Marijuana and Other Illicit Drug
Cigarette Smoking and Tobacco Use
(% of Wayne Co. population)
Wayne
Kentucky
County
Any tobacco use,
past month
40.65
40.06
Cigarette
smoking, past
month
34.25
34.55
Perceived great
risk of smoking 1
or more packs of
cigarettes/day
60.74
% of Adults Age 12 or Older Who Used Illicit Drug Use
Cigarette Smoking and Tobacco Use
Any tobacco use,
past month
40.65
Cigarette smoking,
past month
Any illicit drug use in the past
month
Any illicit drug use other than
marijuana in the past month
Cocaine use in the past year
34.25
Wayne
County
6.43
Kentucky
8.22
4.01
4.57
2.19
2.49
% of Adults Age 12 or Older Who Used Marijuana
62.15
Perception of
Smoking 1 or more
packs of
cigarettes/day
Sources: National Survey on Drug Use and Health, 20022004..
60.74
0
10
20
30
40
50
60
70
Percent of Wayne County Population
Marijuana use, past month
4.40
5.56
Marijuana use, past year
7.42
9.61
Annual rate of first use of
marijuana
1.42
1.52
Sources: National Survey on Drug Use and Health, 2002-2004..
6. Alcohol Use and Binge Drinking
% of Adults 12 or Older Who Had
Alcohol Use and Binge Drinking
32.01
25.72
Percen t of Wayn e Co u nty
Po pu lation
35
Wayne
County
Alcohol, past month
32.01
36.15
25
Alcohol, past month, age 12 - 20
25.72
27.60
20
Binge alcohol use in past month
17.71
19.26
30
15
10
5
0
Alcohol, past month
Alcohol, past month,
ages 12 - 20
Binge alcohol use in past month,
age 12- 20
17.59
Perceived great risk of binge
drinking
43.89
Sources: National Survey on Drug Use and Health, 2002-2004.
Prepared by Zhiwei Zhang, Ph.D., Alycia Infante, M.S., Michael Meit, M.S., NORC
286
Binge Drinking in Wayne County
Kentucky
18.79
42.85
Percent of Wayne County Population
Alcohol Use in Wayne County
50
43.89
45
40
35
30
25
20
17.71
17.59
Binge alcohol,
past m onth
Binge alcohol,
past m onth, ages
12 - 20
15
10
5
0
Perception of
risk of binge
drinking
References
1
Economic Overview. 2008. Appalachian Regional Commission. http://www.arc.gov/index.do?nodeId=26.
Halverson JA, Byrd RC, Ma L, Harner EJ. November 2004. An Analysis of Disparities in Health Status and Access
to Health Care in the Appalachian Region. Appalachian Regional Commission. www.arc.gov.
3
Maine Rural Health Research Center. June 2007. Substance Abuse Among Rural Youth: A Little Meth and a Lot of
Booze. Research and Policy Brief. University of Southern Maine, Muskie School of Public Health. Supported by the
federal Office of Rural Health Policy, Health Resources and Services Administration, U.S. Department of Health and
Human Services, CA#U1CRH03716.
4
Robertson EB, Sloboda Z, Boyd GM, Beatty L and Kozel NJ, eds. 1997. Rural Substance Abuse: State of Knowledge
and Issues. NIDA Research Monograph 168.
5
Office of Applied Studies. 2006. Substance Abuse and Mental Health Services Administration.
Methamphetamine/Amphetamine Treatment Admissions in Urban and Rural Areas: 2004. The DASIS Report, Issue 27.
6
Van Hook MP and Ford ME. 1998. The linkage model for delivering mental health services in rural communities:
benefits and challenges. Health & Social Work 23(1), 53-60.
7
Warner, BD and Leukefeld CG. 2001. Rural-Urban Differences in Substance Use and Treatment Utilization among
Prisoners. American Journal of Drug and Alcohol Abuse 27(2), 265-280.
8
Logan TK, Schenck JE, Leukefeld CG, Meyers J and Allen S. 1999. Rural Attitudes, Opinions and Drug Use.
Substance Abuse and Misuse 34(4&5), 545-565.
9
Keefe S. (2005). Appalachian Cultural Competency: A Guide For Medical, Mental Health, And Social Service
Professionals. Knoxville: University of Tennessee Press, 2005.
10
Cicero TJ, Inciardi JA and Muñoz A. 2005. Trends in Abuse of OxyContin® and Other Opioid Analgesics in the
United States: 2002-2004. The Journal of Pain 6(10), 662-672.
11
Van Hook MP and Ford ME. 1998. The linkage model for delivering mental health services in rural communities:
benefits and challenges. Health & Social Work 23(1), 53-60.
12
Hartley D, Bird DC, and Dempsey P. Rural Mental Health and Substance Abuse. Rural Health in the United States.
New York: Oxford University Press, 1999.
13
Hartley D, Bird DC, and Dempsey P. Rural Mental Health and Substance Abuse. Rural Health in the United States.
New York: Oxford University Press, 1999.
14
County Economic Status and Distressed Areas in the Appalachian Region, Fiscal Year 2007. Appalachian Regional
Commission, September 2006. http://gold.ky.gov/NR/rdonlyres/A86FCF1F-6FDE-4B45-AE77AA46451F50A6/0/ARCCountyEconomicStatusDistAreasFY2007Kentucky.pdf.
15
U.S. Department of Health and Human Services, Substance Abuse and Mental Health Services Administration. Office
of Applied Studies. National Survey on Drug Use and Health. Sample Design. https://oas.samhsa.gov/nsduh.
16
U.S. Department of Health and Human Services, Substance Abuse and Mental Health Services Administration.
National Survey on Drug Use and Health. https://nsduhweb.rti.org.
17
U.S. Department of Health and Human Services, Substance Abuse and Mental Health Services Administration.
Office of Applied Studies. Statistical Methods and Limitations of the Data.
http://www.oas.samhsa.gov/nhsda/2k2nsduh/Results/appB.htm.
18
Whitbeck K, Johnson D, HA Cauce. 1998. Mental disorder and comorbidity among runaway and homeless
adolescents. Journal of Adolescent Health (35)2: 132-140.
19
Bailey SL, Camlin CS, Ennett ST. 1998. Substance use and risky behavior among homeless and runaway youth.
Journal of Adolescent Health 23:378-388.
20
U.S. Department of Health and Human Services, Substance Abuse and Mental Health Services Administration.
Office of Applied Studies. Statistical Methods and Limitations of the Data.
http://www.oas.samhsa.gov/nhsda/2k2nsduh/Results/appB.htm.
21
Gfroerer J, Epstein J, Wright D. August 2004. Estimating substance abuse treatment need by state. Editorial in
Addiction 99(8):938-939.
22
Office of Applied Studies. 2006. Substate estimates from the 2002-2004 National Surveys on Drug Use and Health.
Rockville, MD: Substance Abuse and Mental Health Services Administration.
23
Office of Applied Studies. 2006. Substate estimates from the 2002-2004 National Surveys on Drug Use and Health.
Rockville, MD: Substance Abuse and Mental Health Services Administration.
24
Marker D. 2001. Producing small area estimates from national surveys: methods for minimizing use of indirect
estimators. Survey Methodology, 27, 2, 183-188.
2
287
25
U.S. Dept. of Health and Human Services, Substance Abuse and Mental Health Services Administration, Office of
Applied Studies. TREATMENT EPISODE DATA SET (TEDS), 2004, Chapter 1. Prepared by Synectics for
Management Decisions, Incorporated. ICPSR04626-v1. Ann Arbor, MI: Inter-university Consortium for Political and
Social Research [producer and distributor], 2007-02-22.
http://www.oas.samhsa.gov/TEDSdischarges/2k4/TEDSD2k4Chp1.htm#limit
26
U.S. Dept. of Health and Human Services, Substance Abuse and Mental Health Services Administration, Office of
Applied Studies. http://www.oas.samhsa.gov/dasis.htm.
27
U.S. Dept. of Health and Human Services, Substance Abuse and Mental Health Services Administration, Office of
Applied Studies. http://www.oas.samhsa.gov/dasis.htm.
28
Treatment Episode Data Set (TEDS), 2005. Substance Abuse and Mental Health Data Archive. Study No. 4626.
University of Michigan, Inter-University Consortium for Political and Social Research
http://www.icpsr.umich.edu/cocoon/SAMHDA/STUDY/04626.xml#methodology.
29
Birnbaum HG, Reynolds J, Jetley G, Zhang M, Vallow S. Sept. 2004. "Costs of prescription opioid analgesic abuse
in the United States in 2001: A societal perspective." Annals of Epidemiology 14(8):616 – 617.
30
"Increasing morbidity and mortality associated with abuse of methamphetamine--United States, 1991-1994." Dec.
1995. Morbidity and Mortality Weekly Report 44 (47):882 - 886.
31
Hopfer CJ, Mikulich SK, Crowley TJ. Oct. 2000. "Heroin use among adolescents in treatment for substance use
disorders." Journal of the American Academy of Child and Adolescent Psychiatry 39 (10):1316 - 1323.
32
Office of Applied Studies, "Heroin--Changes In How It Is Used: 1995-2005." The DASIS Report. Rockville, MD:
Substance Abuse and Mental Health Services Administration, April 26, 2007.
33
Mark TL, Woody GE, Juday T, Kleber HD. 2001. "The economic costs of heroin addiction in the United States."
Drug and Alcohol Dependence 61 (2):195 - 206.
34
Colliver JD, Kroutil LA, Dai L, Gfroerer JC. Sept. 2006. "Misuse of Prescription Drugs: Data from the 2002, 2003,
and 2004 National Surveys on Drug Use and Health." Analytic Series A-28. SMA 06-4192, Rockville, MD: United
States Department of Health and Human Services, Substance Abuse and Mental Health Services Administration, Office
of Applied Studies.
35
Howell EM, Heiser N, Cherlow A, Mason M, Ewell D, Rotwein. Winter 2000. "Identifying pregnant substance
abusers and studying their treatment using birth certificates, Medicaid claims, and state substance abuse treatment data."
Journal of Drug Issues 30 (1):205 - 224.
36
Office of Applied Studies. Jan. 7, 2005. "Smoked Methamphetamine/Amphetamines: 1992-2002." The DASIS
Report . Rockville, MD: Substance Abuse and Mental Health Services Administration.
37
Office of Applied Studies. Dec 3, 2004. "Characteristics of Primary Heroin Injection and Inhalation Admissions:
2002." The DASIS Report. Rockville, MD: United States Department of Health and Human Services, Substance Abuse
and Mental Health Services Administration.
38
Office of Applied Studies. May 7, 2004. "Characteristics of Primary Phencyclidine (PCP) Admissions: 2001." The
DASIS Report. Rockville, MD: Substance Abuse and Mental Health Services Administration, Office of Applied Studies.
39
Dennis ML, Babor T, Roebuck, C.; Donaldson, J., "Changing the focus: The case for recognizing and treating
marijuana use disorders." Addiction. Forthcoming.
40
Office of National Drug Control Policy. Nov 2006. "Inventory of State Substance Abuse Preventions and Treatment
Activities and Expenditures." NCJ 216918, Washington, DC: Executive Office of the President.
41
National Institute of Drug Abuse. April 2005. "Treatment Trends." NIDA Infofacts. Bethesda, MD: United States
Department of Health and Human Services, National Institutes of Health, National Institute of Drug Abuse.
42
Stoil MJ. 1999. "Treatment policy... What treatment policy?." Behavioral Health Management 19(5):6 - 7.
43
Office of Applied Studies. Sept. 30, 2003. "Treatment Admissions in Rural Areas: 2003." The DASIS Report.
Rockville, MD: Substance Abuse and Mental Health Services Administration, Office of Applied Studies.
44
Substance Abuse and Mental Health Services Administration, Office of Applied Studies. May 9, 2003. "Analyzing
Geographic Areas Within TEDS ." The DASIS Report. Arlington, VA: Synectics for Management Decisions, Inc.
45
Office of Applied Studies. Aug 6, 2004. "Treatment Admissions in Urban and Rural Areas Involving Abuse of
Narcotic Painkillers: 2002 Update." The DASIS Report. Rockville, MD: Substance Abuse and Mental Health Services
Administration.
46
Foster SE. Jan 2000. "No place to hide: Substance abuse in mid-size cities and rural America." New York: National
Center on Addiction and Substance Abuse (CASA) at Columbia University.
47
U.S. Dept. of Health and Human Services, Substance Abuse and Mental Health Services Administration, Office of
Applied Studies. TREATMENT EPISODE DATA SET (TEDS), 2005 [Computer file]. Prepared by Synectics for
Management Decisions, Incorporated. ICPSR04626-v1. Ann Arbor, MI: Inter-university Consortium for Political and
Social Research [producer and distributor], 2007-02-22.
288
48
U.S. Dept. of Health and Human Services, Substance Abuse and Mental Health Services Administration, Office of
Applied Studies. http://wwwdasis.samhsa.gov/webt/information.htm.
49
U.S. Dept. of Health and Human Services, Agency for Healthcare Research and Quality. Data Sources: Substance
Abuse and Mental Health Services Administration.
http://www.ahrq.gov/qual/nhdr06/datasources/Substance_Abuse_and_Mental_Health_Services_Administration.htm
50
U.S. Dept. of Health and Human Services, Substance Abuse and Mental Health Services Administration, Office of
Applied Studies. http://wwwdasis.samhsa.gov/webt/information.htm.
51
U.S. Dept. of Health and Human Services, Substance Abuse and Mental Health Services Administration, Office of
Applied Studies. http://www.oas.samhsa.gov/2k3/disclosureTX/disclosureTX.cfm.
52
U.S. Dept. of Health and Human Services, Substance Abuse and Mental Health Services Administration, Office of
Applied Studies. TREATMENT EPISODE DATA SET (TEDS), 2005 [Computer file]. Prepared by Synectics for
Management Decisions, Incorporated. ICPSR04626-v1. Ann Arbor, MI: Inter-university Consortium for Political and
Social Research [producer and distributor], 2007-02-22.
53
Gerstein D. R. and Zhang Z. 2001. Treatment Outcomes for Different Types of Substance Abuse . Caliber/NED
Contract no. 270-97-7016. Rockville, MD: Substance Abuse and Mental Health Services Administration, Center for
Substance Abuse Treatment, Department of Health and Human Services.
54
Bass F. Pain medicine use has nearly doubled. The Washington Post. August 20, 2007. Available online at
http://www.washingtonpost.com/wp-dyn/content/article/2007/08/20/AR2007082000147.html. Accessed April 4, 2008.
55
Hammack L. Overdose deaths rise sharply. The Roanoke Times. September 16, 2007. Available online at
http://www.roanoke.com/news/roanoke/wb/xp-132191. Accessed April 4, 2008.
56
Miroff N. A dark addiction. The Washington Post. January 14, 2008. Available online at
http://www.washingtonpost.com/wp-dyn/content/story/2008/01/12/ST2008011201184.html. Accessed April 4, 2008.
57
Miroff N. A dark addiction. The Washington Post. January 14, 2008. Available online at
http://www.washingtonpost.com/wp-dyn/content/story/2008/01/12/ST2008011201184.html. Accessed April 4, 2008.
58
Anglin, M.D., Hser, Y.-I. & Grella, C.E. 1997. Drug addiction and treatment careers among clients in DATOS.
Psychology of Addictive Behaviors, 11, 308-323.
59
Hser, Y.-I., Grella, C. E., Hsieh, S.-C., Anglin, M.D. & Brown, B.S. 1999. Prior treatment experience related to
process and outcomes in DATOS. Drug and Alcohol Dependence, 57, 137-150.
60
Zhang, Z., Friedmann, P.D. & Gerstein, D.R. 2003. Does retention matter? Treatment duration and improvement in
drug use. Addiction, 98, 673-684.
61
Andersen, R. & Newman, J. F. 1973. Societal and individual determinants of medical care utilization in the United
States. Milbank Memorial Fund Quarterly: Health and Society, 51(1), 95-124.
62 “Care of Adults With Mental Health and Substance Abuse Disorders in U.S. Community Hospitals, 2004.” HCUP
Fact Book No. 10: (1). http://www.ahrq.gov/data/hcup/factbk10/factbk10a.htm#ExecSumm.
63
Overview of HCUP. Agency for Healthcare Research and Quality, Rockville, MD. http://www.hcupus.ahrq.gov/overview.jsp.
64
HCUP Fact Book No. 10: Care of Adults With Mental Health and Substance Abuse Disorders in U.S. Community
Hospitals, 2004. http://www.ahrq.gov/data/hcup/factbk10/factbk10d.htm#Source.
65
HCUP: The Design of the Nationwide Inpatient Sample, 2004. Agency for Healthcare Research and Quality. August
8, 2006. Accessed September 6, 2007. http://www.hcupus.ahrq.gov/db/nation/nis/reports/NIS_2004_Design_Report.pdf.
66
HCUP: The Design of the Nationwide Inpatient Sample, 2004. Agency for Healthcare Research and Quality. August
8, 2006. Accessed September 6, 2007. http://www.hcupus.ahrq.gov/db/nation/nis/reports/NIS_2004_Design_Report.pdf.
67
HCUP NIS Database Documentation. Healthcare Cost and Utilization Project (HCUP). August 2007
Agency for Healthcare Research and Quality, Rockville, MD. www.hcupus.ahrq.gov/db/nation/nis/nisdbdocumentation.jsp.
68
CA Russo, RM Andrews, and R M Coffey. July 2006. “Racial and Ethnic Disparities in Potentially Preventable
Hospitalizations.” HCUP Statistical Brief no. 12. http://www.hcup-us.ahrq.gov/reports/statbriefs/sb10.pdf.
69
HJ Chen. 2005. “Mental Illness and Principal Diagnoses Among Asian American and Pacific Islander Users of
Emergency Services.” Issues in Mental Health Nursing 26:1061-1079.
70
TL Mark, JD Dilonardo, M Chalk, RM Coffey. 2002. “Trends in inpatient detoxification services, 1992–1997.”
Journal of Substance Abuse Treatment 23(4):253-260.
71
Russo CA and Elixhauser A. Hospitalizations for Alcohol Abuse Disorders, 2003. HCUP Statistical Brief # 4. May
2006. Agency for Healthcare Research and Quality. Rockville, MD. http://www.hcupus.ahrq.gov/reports/statbriefs/sb4.pdf.
289
72
CA Russo, RM Andrews, and R M Coffey. July 2006. “Racial and Ethnic Disparities in Potentially Preventable
Hospitalizations.” HCUP Statistical Brief no. 12. Available at http://www.hcupus.ahrq.gov/reports/statbriefs/sb10.pdf.
73
Elixhauser A, Weinick RM, Betancourt JR, Andrews RM. 2002. “Differences between Hispanics and Non-Hispanic
Whites in Use of Hospital Procedures for Cerebrovascular Disease.” Ethnicity and Disease. 12(1):29–37.
74
Xiao H, Campbell ES, Song KS. 2002. “A Trend Analysis of Organ Transplantation Among Ethnic Groups.” Journal
of the National Medical Association 94(1):15–20.
75
Fischer TK, Viboud C, Parashar U, Malek M, Steiner C, Glass R, and Simonsen L. 2007. “Hospitalizations and
Deaths from Diarrhea and Rotavirus among Children <5 Years of Age in the United States, 1993 2003.” The Journal
of Infectious Diseases 195: 1117–1125.
76
Hospitalizations for Ambulatory Care–Sensitive Conditions. The Commonwealth Fund. December 2006.
http://www.commonwealthfund.org/snapshotscharts/snapshotscharts_show.htm?doc_id=375794
77
Kuo C, Jamieson DJ, McPheeters ML, Meikle SF, and Posner SF. February 2007. “Injury hospitalizations of
pregnant women in the United States, 2002.” American Journal of Obstetrics & Gynecology 196(2):161e1-161e6.
78
Janjua N, Nasar A, Lynch JK, Qureshi AI. June 2007. “Thrombolysis for Ischemic Stroke in Children: Data From the
Nationwide Inpatient Sample.” Stroke 38(6):1850-1854.
79
VY Dombrovskiy. November 2005. “Facing the challenge: Decreasing case fatality rates in severe sepsis despite
increasing hospitalizations.” Critical Care Medicine 33(11):2555-2562.
80
SS Saleh and EL Hannan. January 2004. “Carotid endarterectomy utilization and mortality in 10 states.” American
Journal of Surgery 187(1)14-20.
81
HCUP NIS Database Documentation. Healthcare Cost and Utilization Project (HCUP). Sources of NIS Data and
State Specific Restrictions. August 2007
Agency for Healthcare Research and Quality, Rockville, MD. http://www.hcupus.ahrq.gov/db/nation/nis/nis_2004_stspecific_restr.jsp
82
HCUP NIS Database Documentation. Healthcare Cost and Utilization Project (HCUP). Sources of NIS Data and
State Specific Restrictions. August 2007
83
Uniform Facility Data Set Survey. 1999. Available at: http://wwwdasis.samhsa.gov/99ufds/ch_1_0.htm
84
Chapter 1: Description of the National Survey of Substance Abuse Treatment Services (N-SSATS). Available at
http://wwwdasis.samhsa.gov/05nssats/NSSATS2k5Chp1.htm.
85
U.S. Department of Health and Human Services, Substance Abuse and Mental Health Services Administration, Office
of Applied Studies. NATIONAL SURVEY OF SUBSTANCE ABUSE TREATMENT SERVICES (N-SSATS), 2004:
[UNITED STATES] [Computer file]. ICPSR04256-v2. Arlington, VA: Synectics for Management Decisions, Inc.
[producer], 2004. Ann Arbor, MI: Inter-university Consortium for Political and Social Research [distributor], 2006-0801.
86
Facilities Offering Special Treatment Programs or Groups, 2005. Drug and Alcohol Services Information System
(DASIS). June 14, 2007. http://www.oas.samhsa.gov/2k7/ServicesTX/servicesTX.htm
87
U.S. Dept. of Health and Human Services, Substance Abuse and Mental Health Services Administration, Office of
Applied Studies. NATIONAL SURVEY OF SUBSTANCE ABUSE TREATMENT SERVICES (N-SSATS), 2005:
[UNITED STATES] [Computer file]. ICPSR04469-v1. Arlington, VA: Synectics for Management Decisions, Inc.
[producer], 2005. Ann Arbor, MI: Inter-university Consortium for Political and Social Research [distributor], 2006-1024.
88
Office of Applied Studies, "National Survey of Substance Abuse Treatment Services (N-SSATS): 2005. Data on
Substance Abuse Treatment Facilities." Data on Substance Abuse Treatment Facilities, DASIS Series: S-34. (SMA) 064206, Rockville, MD: Department of Health and Human Services, Substance Abuse and Mental Health Services
Administration, Office of Applied Studies, Jul 2006. http://wwwdasis.samhsa.gov/05nssats/NSSATS2k5TOC.htm.
89
Office of Applied Studies, "National Survey of Substance Abuse Treatment Services (N-SSATS): 2005. Data on
Substance Abuse Treatment Facilities." Data on Substance Abuse Treatment Facilities, DASIS Series: S-34. (SMA) 064206, Rockville, MD: Department of Health and Human Services, Substance Abuse and Mental Health Services
Administration, Office of Applied Studies, Jul 2006. http://wwwdasis.samhsa.gov/05nssats/NSSATS2k5TOC.htm.
90
Office of Applied Studies, "National Survey of Substance Abuse Treatment Services (N-SSATS): 2005. Data on
Substance Abuse Treatment Facilities." Data on Substance Abuse Treatment Facilities, DASIS Series: S-34. (SMA) 064206, Rockville, MD: Department of Health and Human Services, Substance Abuse and Mental Health Services
Administration, Office of Applied Studies, Jul 2006. http://wwwdasis.samhsa.gov/05nssats/NSSATS2k5TOC.htm.
91
Office of Applied Studies, "National Survey of Substance Abuse Treatment Services (N-SSATS): 2005. Data on
Substance Abuse Treatment Facilities." Data on Substance Abuse Treatment Facilities, DASIS Series: S-34. (SMA) 06-
290
4206, Rockville, MD: Department of Health and Human Services, Substance Abuse and Mental Health Services
Administration, Office of Applied Studies, Jul 2006. http://wwwdasis.samhsa.gov/05nssats/NSSATS2k5TOC.htm.
92
Office of Applied Studies, "National Survey of Substance Abuse Treatment Services (N-SSATS): 2005. Data on
Substance Abuse Treatment Facilities." Data on Substance Abuse Treatment Facilities, DASIS Series: S-34. (SMA) 064206, Rockville, MD: Department of Health and Human Services, Substance Abuse and Mental Health Services
Administration, Office of Applied Studies, Jul 2006. http://wwwdasis.samhsa.gov/05nssats/NSSATS2k5TOC.htm.
93
Office of Applied Studies, "National Survey of Substance Abuse Treatment Services." N-SSATS Profile - United
States 2005. Rockville, MD: United States Department of Health and Human Services, Substance Abuse and Mental
Health Services Administration, 2005. http://wwwdasis.samhsa.gov/webt/state_data/US05.pdf.
94
U.S. Department of Health and Human Services, Substance Abuse & Mental Health Services Administration.
Substance Abuse Treatment Locator. http://findtreatment.samhsa.gov/
95
Chriqui JF, Terry-McElrath Y, McBride DC, Eidson SS, VanderWaal CJ. July 2007. Does State Certification or
Licensure Influence Outpatient Substance Abuse Treatment Program Practices? Journal of Behavioral Health Services
& Research 34(3):309-328.
96
Office of Applied Studies, "Facilities Offering Special Treatment Programs or Groups: 2005." The DASIS Report.
Rockville, MD: Substance Abuse and Mental Health Services Administration, Jun 14, 2007.
http://www.icpsr.umich.edu/cgi/CITATIONS/search?&study=4469&method=study&path=SAMHDA.
97
Office of Applied Studies, "Facilities Offering Special Programs or Groups for Women: 2005." The DASIS Report.
35, Rockville, MD: United States Department of Health and Human Services, Substance Abuse and Mental Health
Services Administration, 2005. http://www.oas.samhsa.gov/2k6/womenTx/womenTX.cfm.
98
Mark T, Song X, Vandivort R, Duffy S, Butler J, Coffey R, Schabert V. Characterizing substance abuse programs
that treat adolescents. Journal of Substance Abuse Treatment 31(1): 59-65.
99
Olmstead T and Sindelar J. To what extent are key services offered in treatment programs for special populations?
Journal of Substance Abuse Treatment 27(1): 9-15.
100
Mojtabai R. Which Substance Abuse Treatment Facilities Offer Dual Diagnosis Programs? August 2004. American
Journal of Drug & Alcohol Abuse 30(3):525-536.
101
Montoya ID. Differences in Drug Treatment Services Based on Profit Status. Sept. 2006. Journal of Psychoactive
Drugs, 38(3): 219-228.
102
Office of Applied Studies, "Facilities Operating Opioid Treatment Programs: 2005." The DASIS Report. Rockville,
MD: United States Department of Health and Human Services, Substance Abuse and Mental Health Services
Administration, 2006.
http://www.icpsr.umich.edu/cgi/CITATIONS/search?&study=4469&method=study&path=SAMHDA.
103
Heinrich CJ and Hill CJ. The Role of State Policies in the Adoption of Naltrexone for Substance Abuse Treatment.
Presentation to the AcademyHealth Annual Research Meeting, Orlando FL. June 4, 2007.
http://209.85.165.104/search?q=cache:HVeZC8E1NwoJ:www.academyhealth.org/2007/monday/oceanic1/hillc.ppt+NSSATS&hl=en&ct=clnk&cd=53&gl=us.
104
Chapter 1: Description of the National Survey of Substance Abuse Treatment Services (N-SSATS). Available at
http://wwwdasis.samhsa.gov/05nssats/NSSATS2k5Chp1.htm.
105
1999 Uniform Facility Data Set (UFDS) Survey. Rockville, MD: Department of Health and Human Services,
Substance Abuse and Mental Health Services Administration. http://wwwdasis.samhsa.gov/99ufds/ch_4_0.htm.
106
Berge, M. and Thompson, E. (2001) A Study on the Current Economic Impacts of the Appalachian Coal Industry
and Its Future in the Region. Washington, D.C.: Appalachian Regional Commission.
107
Miroff, Nick. 2008. A dark addiction: Miners Caught in Western VA’s Spiraling Rates of Painkiller Abuse.
Washington Post, January 13, 2008 A1, A9-A11.
108
Zhang, Z., Huang, L.X., & Brittingham, A.M. 1999. Worker Drug Use and Workplace Policies and Programs:
Results from the 1994 and 1997 NHSDA, (DHHS Publication No. SMA 99-3352, Analytic Series, A-11). Rockville,
MD: Substance Abuse and Mental Health Services Administration, Office of Applied Studies.
109
Zhang, Z. & Snizek, W.E. 2003. Occupation, job characteristics, and the use of alcohol and other drugs. Social
Behavior and Personality 31:395-412.
110
Larson, S. L., Eyerman, J., Foster, M. S., & Gfroerer, J. C. 2007. Worker Substance Use and Workplace Policies and
Programs (DHHS Publication No. SMA 07-4273, Analytic Series A-29). Rockville, MD: Substance Abuse and Mental
Health Services Administration, Office of Applied Studies.
111
Miroff N. A dark addiction. The Washington Post. January 14, 2008. Available online at
http://www.washingtonpost.com/wp-dyn/content/story/2008/01/12/ST2008011201184.html. Accessed April 4, 2008.
112
U.S. Geological Survey (2008) National Coal Resources Data System.
http://energy.er.usgs.gov/products/databases/CoalQual/index.htm.
291
113
Berge, M. and Thompson, E. 2001. A Study on the Current Economic Impacts of the Appalachian Coal Industry and
Its Future in the Region. Washington, D.C.: Appalachian Regional Commission.
114
Health Professional Shortage Area. Primary Medical Care Designation Area. Health Services and Resources
Administration. U.S. Department of Health and Human Services. http://bhpr.hrsa.gov/Shortage/hpsacritpcm.htm
115
Health Professional Shortage Area. Primary Medical Care Designation Area. Health Services and Resources
Administration. U.S. Department of Health and Human Services. http://bhpr.hrsa.gov/Shortage/hpsacritmental.htm
116
As there are only three counties in Maryland and six counties in South Carolina in the Appalachian region and also
due to the lack of measurement variability, the Maryland socio-demographic distance matrix, the Maryland substance
and metal health distance matrix, and the South Carolina substance abuse and mental health matrix were not calculated.
292


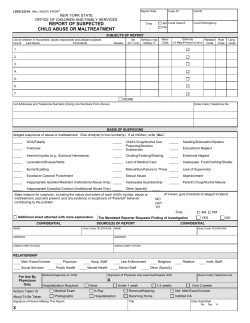

© Copyright 2026