
Outcomes with Esophageal Cancer Radiation Therapy O A
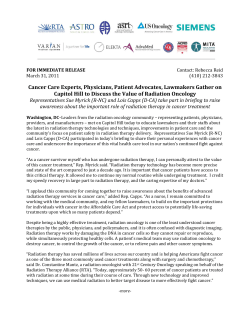
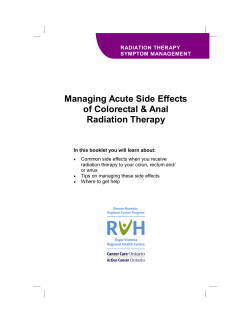
ORIGINAL ARTICLE
Outcomes with Esophageal Cancer Radiation Therapy
Zhen Zhang, MD, PhD,* Yuan Chen, MD,† Yanzhi Chen, MD,‡ Melenda Jeter, MD, MPH,§
Wayne L. Hofstetter, MD,储 Jaffer Ajani, MD,¶ Stephen G. Swisher, MD,储 Joe Y. Chang, MD, PhD,§
Pamela K. Allen, PhD,§ James D. Cox, MD,§ Ritsuko Komaki, MD,§ and Zhongxing X. Liao, MD§
Purpose: Esophageal cancer is the seventh leading cause of cancer
death worldwide and is responsible for 4% of the cancer deaths in
the United States annually. Changing epidemiologic patterns and
expanded treatment options have brought this often deadly cancer to
the forefront.
Methods and Materials: To characterize epidemiological
changes, the effect of treatment advances, and patient outcomes
over time, we retrospectively reviewed 756 consecutive esophageal cancer cases treated between 1985 to 2003 at The University
of Texas M. D. Anderson Cancer Center in Houston. For purposes of evaluation, cases were divided into four cohorts of
approximately 5 years each. Men make up 75% or more of the
patients with esophageal cancer, most patients have adenocarcinoma in the gastroesophageal junction, and almost 75% have
stage II or III disease.
Results: Three-year overall survival improved from 16.7% (1985–
1989) to 35.2% (2000 –2003). By multivariate Cox regression analysis, significant reductions in relative risk were associated with
having good performance status (relative risk [RR] ⫽ 0.68 [95%
confidence interval (CI) ⫽ 0.56 – 0.83]; p ⬍ 0.001), being treated in
the most recent interval (2000 –2003) than in the first (1985–1989)
(RR ⫽ 0.63 [95% CI ⫽ 0.44 – 0.88]; p ⫽ 0.007), with improved
therapies, including induction chemotherapy plus concurrent chemoradiotherapy (RR ⫽ 0.68 [CI ⫽ 0.56 – 0.84]; p ⬍ 0.001), explaining the reductions.
Conclusion: Although fully delineated comparisons must await
incorporation and study of data through 2007, this analysis
suggests that multimodality management that has been adapted in
recent years may be associated with the improvements in out*Department of Radiation Oncology, Fudan University Cancer Hospital,
Shanghai; †Department of Oncology, Tongji Hospital, Tongji Medical
College, Hua Zhong University of Science and Technology, Wuhan;
‡Department of Radiation Oncology, The First Affiliated Hospital, China
University of Medical Science, Shengyang; The People’s Republic of
China.; Departments of §Radiation Oncology, 储Thoracic and Cardiovascular Surgery, and ¶Gastrointestinal Medical Oncology and Digestive
Diseases, The University of Texas M. D. Anderson Cancer Center,
Houston, Texas.
Address for correspondence: Zhongxing Liao, MD, Department of Radiation
Oncology, Unit 97, The University of Texas M. D. Anderson Cancer
Center, Houston, Texas 77030. E-mail: [email protected]
Presented at the Forty-sixth Annual Meeting of the American Society of
Therapeutic Radiology and Oncology, Atlanta, Georgia, 2004.
None of the authors have a conflict of interest with the text in this
manuscript.
Copyright © 2009 by the International Association for the Study of Lung
Cancer
ISSN: 1556-0864/09/0407-0001
Journal of Thoracic Oncology • Volume 4, Number 7, July 2009
comes of these cases of largely stage II and III esophageal
adenocarcinoma found at the gastroesophageal junction.
Key Words: Esophageal neoplasms, Radiotherapy, Radiation therapy, Treatment outcome, Outcome assessment (health care).
(J Thorac Oncol. 2009;4: 000–000)
O
ne of the world’s deadliest cancers, esophageal cancer
has been demanding more attention in the last three
decades because of changing epidemiologic patterns and
expanded treatment options.1– 4 Worldwide, esophageal
cancer is the seventh leading cause of cancer death, and its
5-year relative survival rate in the United States is 14.9%.1,5 It
represents the seventh most deadly cancer in U.S. men,
responsible for 4% of all cancer deaths annually.1 In men,
incidence is highest in China (21.6/100,000), some African
nations (19.2–12.5/100,000), and Kazakhstan (19.1/100,000).
In the United States, incidence is 2.1/100,000 in men and
1.2/100,000 in women and increasing, and in 2008, 16,470
new cases are anticipated along with 14,280 deaths.1,4,6
Pathogenesis of esophageal cancer remains largely
undefined, but an increase in the incidence of adenocarcinoma and a shift to a predominately lower esophageal
gastroesophageal junction location have caused associations to be drawn to gastroesophageal reflux and Barrett
esophagus, conditions recognized as risk factors along
with achalasia, tobacco and/or alcohol use, caustic injury,
a history of cancer and cancer treatment.3
Advancements in imaging technology such as
2-fluoro-2-deoxy-D-glucose–positron emission tomography -(PET) scanning and endoscopic sonography allow
more accurate staging and have led to better selection of
patients for different treatment modalities. New chemotherapy drugs and new combinations may have had a
significant impact on controlling distant metastasis. Also
advancing control are radiation technique improvements,
specifically three-dimensional conformal radiotherapy
techniques, which allow better strategic targeting of tumor
volume and improved sparing of normal tissue and thus an
increased therapeutic ratio.7
In this report, we review our experience at The
University of Texas M. D. Anderson Cancer Center, from
1985 to December 2003, where we included 765 consecutive patients with primary esophageal cancer who received radiotherapy as the sole treatment or as a compo-
1
Journal of Thoracic Oncology • Volume 4, Number 7, July 2009
Zhang et al.
nent of multimodal therapy. The purpose of this study was
to characterize changes in the epidemiology of esophageal
cancer, identify changes in the diagnostic process and in
treatment, and analyze the impact of these changes on
long-term outcome using multivariate statistical analysis
for these patients.
METHODS
Patient Population
We retrospectively reviewed records of 843 consecutive patients with primary esophageal cancer who underwent radiation therapy at The University of Texas M. D.
Anderson Cancer Center between January 1985 and December 2003. Seven hundred fifty-six patients who received radiation therapy with definitive intent either as the
sole treatment or as a component of multimodality therapy
were included in this analysis. Patients with metastatic
disease and those treated with palliative intent (radiation
dose ⬍30 Gy) have been excluded. Patients were grouped
by 5-year intervals chosen because of major shifts in the
standard of radiotherapy care for esophageal cancer. January 1985, when computed tomography (CT) became the
routine diagnostic evaluation was chosen as the beginning
of the first interval so stage migration could be minimized.
Assignment to interval was made by date of diagnosis.
This retrospective chart review study was approved by the
institutional review board and informed consent was
waived. The study was compliant with the HIPPA regulations.
Staging and Modality
Patients were staged using technology available at the
time and physician preference. Cancer stage was retrospectively
classified according to the American Joint Committee on Cancer
1997 staging manual.8 Endoscopy was not routinely performed until 2000 when endoscopic ultrasounography became commonplace. When 2-fluoro-2-deoxy-D-glucose–PET
became available around 2000, it was performed at the
treating physician’s determination.
Radiation Treatment
Treatment options have traditionally been based on
disease histology, tumor site, and stage of disease. Since
1985, more and more patients have been undergoing chemotherapy simultaneously with radiotherapy, and use of
radiation as a method of down-staging disease before
surgery has expanded.
Until 1999 all patients were treated with two-dimensional radiation therapy; using high-energy photons with
cobalt-60 to 18-MV photons with accelerated (3 Gy per
fraction once a day to 30 Gy) or conventional (1.8 –2.0 Gy
per fraction once a day to at least 45 Gy) fractionation. We
used same doses of radiation for definitive and neoadjuvant treatments. The initial target volume encompassed the
primary tumor with a minimal 5-cm margin in the cephalad
and caudal directions and a 2-cm margin radially. If
conventional fractionation was used, the subclinical disease was treated to at least 45 Gy before the field size was
2
reduced. Radiation dose was determined by the treating
physician according to the accepted practice at the time of
treatment. Individual and total doses were not corrected for
inhomogeneity of the irradiated tissue. The dose prescriptions point before 1999 was usually to isocenter.
Beginning in 1999, three-dimensional conformal radiation became the standard of care, and radiation dose
came to be prescribed to the isodose volume that covered
the target of interest. Starting in 2001, patients also underwent intensity-modulated radiation. All patients treated
in 1999 and subsequently have had a three-dimensional
treatment plan before initiation of radiation therapy. All
patients underwent CT simulation. Patients were immobilized with a customized vacuum-locked cradle. The gross
tumor volume was defined as any visible tumor on the
image, clinical target volume was defined as the gross
tumor volume plus a 2- to 5-cm margin superior to the
highest extension of the tumor and a 4- to 5-cm margin
inferior to the lowest extension with a 2-cm radial margin,
planning target volume was defined as the clinical target
volume plus a 5-mm margin. Individual and total doses
were corrected for the heterogeneity of irradiated tissue
when three-dimensional or intensity-modulated radiation
technique was used.
Chemotherapy
Chemotherapy included primarily 5-fluorouracil (5-FU),
platinum, and taxanes, given as neoadjuvant, concurrent,
or adjuvant modality. CPT-11 was used in recent years as
well. Concurrent chemotherapy was usually platinum- or
5-FU-based and started on day 1 with radiation therapy.
Cisplatin was administered at a dose of 20 mg/m2 on days
1 to 5. In all, 5-FU was administered at a dose of 300
mg/m2/d as a continuous infusion, 5 days per week, using
a portable electronic pump from Monday to Friday during
radiotherapy. Patients did not receive chemotherapy on
weekends.
Surgery
Decision on surgery was made in a multidisciplinary
esophageal cancer tumor board. All patients who were
considered a candidate for surgery were recommended to
have esophagectomy. Patients whose tumor was not resectable, who had significant comorbidities, or who refused
surgery were not operated on, and they were offered other
definitive treatment such as chemoradiation instead. In
patients who underwent surgery, esophagectomy was performed 6 to 8 weeks after the completion of concurrent
chemotherapy and radiation therapy. Surgical procedure
selection was at the discretion of the operating surgeon and
included total thoracic esophagectomy (n ⫽ 11), transthoracic esophagectomy (n ⫽ 225), transhiatal esophagectomy
(n ⫽ 48), and radical en bloc esophagectomy (n ⫽ 12).
Sixty-eight cases had other or unknown surgical procedures.
Follow-Up
Follow-up evaluations were performed every 3 to 4
months after treatment until a patient’s death. Follow-up
evaluations included a clinical examination, barium swal-
Copyright © 2009 by the International Association for the Study of Lung Cancer
Journal of Thoracic Oncology • Volume 4, Number 7, July 2009
low, and chest radiography. CT scans, esophogastroduodenoscopy, and biopsies were performed when indicated.
Disease recurrence was documented as it occurred, but
only the first site of failure was noted in this study. The
treatment implemented for recurrence was at the discretion
of the treating physician and consisted of any modality
deemed appropriate for the situation. All patients were
followed by direct evaluation or phone interview until
death or up to the current study.
Statistical Analysis
Multivariable analysis was used to identify factors
associated with long-term survival. The nonparametric
Cuzick Trend Test was used in contingency tables to
provide a test of trend across three or more ordered
groups.9 The survival function was analyzed using time to
event Kaplan-Meier estimation of the survival function.10,11 The log-rank test for trend was carried out for the
Kaplan-Meier survival analysis to assess the equality of
the survivor function across cohort groups.12 The equality
of means for continuous variables was assessed using
Linear regression to test means across groups (e.g., mean
age across cohorts).13 A value of 0.05 or less was considered to be statistically significant. All tests were two-sided.
Survival time was calculated from the diagnosis date to the
first occurrence of the considered event (local-regional disease
progression, distant metastasis, or death). Overall survival was
defined as the time between date of diagnosis and date of death
from any cause. Local-regional progression free survival was
defined as the time between date of diagnosis and the time at
which during or after treatment that locoregional recurrence or
disease progression was detected. Distant metastasis–free survival was defined as the time between date of diagnosis to the
date during or after treatment that the distant metastasis was first
detected. Progression-free survival was defined as the time
between date of diagnosis and the date during or after treatment
when disease, either locoregional disease or distant metastasis,
was detected.
Cox’s proportional hazard model12 was used for multivariate analysis to assess the effect of patient characteristics
and other prognostic factors of significance on the end points.
All variables with a significance level of 0.25 or less on
univariate analysis were entered into the model, and backward elimination was carried out. The final model consisted
of variables with a significance value of less than or equal to
0.05 or of biologic significance to the model. Interaction
variables were assessed. The estimated hazard is reported.
The Wald test was used to assess the role of covariates in the
model.14 All statistical analyses were carried out using
Stata/SE 10.0 for Windows.13
RESULTS
Patient and Disease Characteristics
From 1985 to 2003 in the populations studied, increases
were observed in the male-to-female ratio, in the proportion
of cases with kps score ⬎90%, ⬍5% weight loss, and no
symptom of dysphagia, and in the proportion of cases that
were adenocarcinoma, and in the proportion of cases with
Esophageal Cancer Radiation Therapy
primary tumor located in the lower esophagus and gastroesophageal junction (Table 1). The median age remained
stable. Adenocarcinoma became the predominant histology in
the third interval (1995–1999), when adenocarcinomas were
located most commonly at the lower esophagus and esophageal-gastric junction, and it remained dominant in the last
interval.
Preclinical Evaluation
Ninety-five percent or more of the patients had a CT
scan as part of their staging work-up in every interval, except
the earliest, when only 76.5% of patients had a CT scan of the
chest for staging. There was a significant increase in staging
by endoscopic ultrasonography, and its use increased to
80.3% in the most recent interval in comparison with 10.4%
or less in the first 2 study intervals. PET was used as a
pretreatment evaluation in 54.8% of patients in the last study
interval when it became available. There was a significant
decrease in the use of barium swallow as a pretreatment
evaluation modality (Table 1).
Treatment
Significant changes to treatment included increases in
the use of chemotherapy, particularly its concurrent use with
radiotherapy (Table 2). The median dose of radiation therapy
remained relatively stable-from 45 to 50 Gy-except for the
1990 –1994 interval, when 30 Gy at 3-Gy per fraction given
in 10 daily fractions was used as standard definitive radiation
therapy dose. Concurrent chemotherapy and radiation therapy, induction chemotherapy plus concurrent chemoradiation, and use of taxanes, have increased dramatically over
time. The proportion of patients undergoing esophagectomy
also increased slightly over the study period, ranging from
33.0 to 45.9% (p ⫽ 0.015).
Outcomes
The median follow-up time for the entire study population was 16.4 months (range, 0.5–238.3 months), the median follow-up time for the surviving patients was 61.4
(range, 0.6 –238.3) months, and the median follow-up time
for each cohort was 12.7,11.1,19.7, and 19.7 months, respectively. At time of analysis, 134 of the 756 patients
(17.7%) are alive. The Kaplan-Meier median overall survival (OS) estimate for the entire population was 17.4
months. Three-year overall survival for the entire population was 27.1%, and 5-year overall survival was 19.1%
(Figure 1A). The rates of 3-year Kaplan-Meier survival
was significantly different between cohorts, with the last 2
groups having significantly higher survival rates (1995–
1999, 32.7%; 2000 –2003, 35.2%) than the first (1985–
1989, 16.7%) (Figure 1B), which was nonetheless better
than the rate for 1990 –1994 (11.8%) (Table 3). The
interval with the lowest overall survival rate was that in
which the dose of radiation therapy was lowest (1990 –
1994). Similarly, rates for progression-free survival and
locoregional progression free survival were lowest during
this same period (Table 3).
Univariate analysis of factors that significantly affected survival is summarized in Table 4. Patient- and
Copyright © 2009 by the International Association for the Study of Lung Cancer
3
Journal of Thoracic Oncology • Volume 4, Number 7, July 2009
Zhang et al.
TABLE 1. Patient and Disease Characteristics by Cohort
Characteristic
Patients number
Ethnic group
Caucasian
Non-Caucasian
Gender
Male
Female
Median age in years (range)
ⱖ90
⬍90
Weight loss
⬍5%
ⱖ5%
Dysphagia
Yes
No
Staging tests
Barium swallow
Yes
No
CT chest
Yes
No
Endoscopic ultrasonography
Yes
No
PET
Yes
No
Disease
Barretts esophagus
Yes
No
Histology
ADC
SCC
Tumor location
Lower/EGJ
Mid/Upper
Stage
I
II
III
IV
Unknown
1985–1989
1990–1994
1995–1999
2000–2003
115
144
218
279
Cuzrick Trend Test p
0.001
83
32
72.2%
27.8%
109
35
75.7%
24.3%
184
34
84.4%
15.6%
236
43
84.6%
15.4%
86
29
64
74.8%
25.2%
(33–86)
106
38
62
73.6%
26.4%
(24–88)
177
41
63.5
81.2%
18.8%
(32–87)
235
44
63
84.2%
15.8%
(33–87)
26
89
22.6%
77.4%
84
60
58.3%
41.7%
126
92
57.8%
42.2%
141
138
50.5%
49.5%
42
73
36.5%
63.5%
46
98
31.9%
68.1%
92
126
42.2%
57.8%
154
125
55.2%
44.8%
106
9
92.2%
7.8%
133
11
92.4%
7.6%
191
17
87.6%
12.4%
215
64
77.1%
22.9%
104
11
90.4%
9.6%
117
27
81.3%
18.8%
196
22
89.9%
10.1%
218
61
78.1%
21.9%
88
27
76.5%
23.5%
137
7
95.1%
4.9%
211
7
96.8%
3.2%
267
12
95.7%
4.3%
1
114
0.9%
99.1%
15
129
10.4%
89.6%
78
140
35.8%
64.2%
224
55
80.3%
19.7%
0
115
0.0%
100.0%
0
144
0.0%
100.0%
1
127
0.5%
99.5%
153
126
54.8%
45.2%
12
103
10.4%
89.6%
15
129
10.4%
89.6%
54
164
24.8%
75.2%
37
242
13.3%
86.7%
50
65
43.5%
56.5%
65
79
45.1%
54.9%
143
75
65.6%
34.4%
201
78
72.0%
28.0%
96
19
83.5%
16.5%
117
27
81.2%
18.8%
193
25
88.5%
11.5%
248
31
88.9%
11.1%
4
53
23
32
3
3.5%
46.1%
20.0%
27.8%
2.6%
2
29
65
45
3
1.4%
20.1%
45.1%
31.3%
2.1%
12
92
69
40
5
5.5%
42.2%
31.7%
18.3%
2.3%
4
91
114
61
9
1.4%
32.6%
40.9%
21.9%
3.2%
0.005
0.6374a
KPS⬍0.001
⬍0.001
⬍0.001
0.012
⬍0.001
⬍0.001
⬍0.001
0.231
⬍0.001
0.036
0.772
a
Cuzick Trend Test was utilized for all analyses on this table except for age parameter where Linear Regression was used.
ADC, adenocarcinoma; SCC, squamous cell carcinoma; EGJ, esophagogastrol junction; PET, positron emission tomography.
disease-related factors that favorably affected overall survival
and that were associated with a reduced average relative risk
(RR) were good Karnofsky performance status and not having
dysphagia. Undergoing endoscopic ultrasonography or
PET–tests that are used in more than half of patients now
but were used in less than 1% in the first cohort– has been
4
associated with reduced risk (RR ⫽ 0.53 [CI ⫽ 0.45–
0.62], p ⬍ 0.0001; and RR ⫽ 0.72 [CI ⫽ 0.58 – 0.88], p ⫽
0.002; for EUS and PET, respectively) with univariate
analysis, but they were no longer associated with significant reductions with multivariate analysis. A separate
analysis was performed to assess the effect of PET on
Copyright © 2009 by the International Association for the Study of Lung Cancer
Journal of Thoracic Oncology • Volume 4, Number 7, July 2009
Esophageal Cancer Radiation Therapy
TABLE 2. Treatment Characteristics by Cohort
Characteristic
Patients (Total)
Radiotherapy dose (Gy)a
Median (range)
Any chemotherapy
Yes
No
Paclitaxel chemo
Yes
No
Concurrent CRT
Concurrent CRT
Induction chemo ⫹ concurrent CRT
No concurrent CRT
Adjuvant therapy
Yes
No
Surgery
Yes
No
1985–1989
1990–1994
1995–1999
2000–2003
115
144
218
279
Cuzrick Trend Test p
⬍0.001a
45
(30–70)
30
(30–66)
45
(30–66)
50.4
(30–67)
78
37
67.8%
32.2%
107
37
74.3%
25.7%
205
13
94.0%
6.0%
265
14
95.0%
5.0%
0
115
0.0%
100.0%
10
134
6.9%
93.1%
69
149
31.7%
68.3%
145
134
52.0%
48.0%
36
24
55
31.3%
20.9%
47.8%
67
28
49
46.5%
19.5%
34.0%
121
76
21
55.5%
34.9%
9.6%
148
102
29
53.0%
36.6%
10.4%
15
100
13.0%
87.0%
15
129
10.4%
89.6%
16
202
7.3%
92.7%
8
271
2.9%
97.1%
38
77
33.0%
67.0%
57
87
39.6%
60.4%
100
118
45.9%
54.1%
128
151
45.9%
54.1%
⬍0.001
⬍0.001
⬍0.001
⬍0.001
0.015
a
Cuzick Trend Test was utilized for all analyses on this table except for radiation dose parameter where Linear Regression was used.
Chemo, chemotherapy, CRT, chemoradiation.
survival for the last cohort. The result showed no difference, in the rates of 3 year OS were 37.7% and 32.1% (p ⫽
0.48) in patients who had and who did not have PET as a
pretreatment evaluation, respectively, suggesting that
stage migration believed to be caused by the use of PET
had minimal influence on OS.
Adversely affecting overall survival and associated
with a higher than average RR were weight loss (RR ⫽
1.03 [CI ⫽ 1.02–1.04], p ⬍ 0.001) and Barrett esophagus
(RR ⫽ 1.29 [CI ⫽ 1.03–1.62], p ⫽ 0.02), not being white
(RR ⫽ 1.41 [CI ⫽ 1.16 –1.72, p ⫽ 0.001]), squamous
histology and, having disease of clinical stage III or IV
disease.
Treatment factors associated with a reduced RR for
overall survival by univariate Cox regression analysis included undergoing treatment after 1995, undergoing surgery
(Figure 2A), undergoing concurrent chemoradiation, undergoing induction chemotherapy plus concurrent chemotherapy
(Figure 2B), undergoing paclitaxel chemotherapy (Figure
2C), and undergoing three-dimensional radiotherapy (Table
4). Since paclitaxel was only used for the last two cohorts of
patients, a separate analysis was performed to assess the
effect of this drug on survival for patients treated during these
two cohorts only. The rates for 3-year survival were 43.4%
and 29.9%, and median survival times were 24.4 (range,
36.6 –50.1) and 18.8 (range, 21.8 –32.3) months in patients
who were treated with and without paclitaxel, respectively
(p ⬍ 0.0001), confirming the favorable effect on OS of
paclitaxel.
Outcome factors adversely affecting overall survival
were having residual tumor after surgery, or not having a
complete response after treatments.
Multivariate Cox regression analysis confirmed that
having lower stage disease at diagnosis, having a good
Karnofsky performance score, being treated in the last
cohort, and having received induction chemotherapy plus
concurrent chemoradiotherapy significantly reduced risk in
these patients and that having clinical stage III or IV
disease or not having complete response after treatments
significantly adversely affected overall survival (Table 5).
DISCUSSION
In this review of radiotherapy used to treat esophageal
cancer at The University of Texas M. D. Anderson Cancer
Center between 1985 and 2003, trends noted nationally are
observed locally. These include increasing numbers of cases,
an increasing proportion of cases with adenocarcinoma, an
increasing proportion of cases with disease in the distal third
of the esophagus, and an increasing use of drugs in therapy.
The clinical stage of the cases has varied over time with the
2000 –2003 cohort having twice the percentage of stage III
and considerably fewer stage II cases compared with the
1985–1989 cohort. This shift in clinical stage may have been
the result of more extensive pretreatment evaluation, especially the common clinical use of functional image. These
also echo findings from a study of esophageal cancer by the
Commission on Cancer of the American College of Surgeons.2 The commission’s data was collected in 1994 and
encompassed 46% of the patients diagnosed that year. Investigators noted that rates of adenocarcinoma had been rising,
the location of tumors had shifted to the lower third of the
esophagus, and an association to Barrett esophagus was more
commonly made.2
Copyright © 2009 by the International Association for the Study of Lung Cancer
5
Journal of Thoracic Oncology • Volume 4, Number 7, July 2009
Zhang et al.
FIGURE 1. A, Overall survival for all patients. 3-year overall
survival was 27.1%, and 5-year overall survival was 19.1%.
B, Overall survival of the cohorts. Kaplan-Meier survival was
statistically significant between the cohorts with the last two
cohorts (1995–1999, 35.2%; 2000 –2003, 35.2%) having
higher 3-year rates than the first 2 (1985–1989, 16.7%;
1990 –1994, 11.8%) (log-rank test of trend p value ⬍0.001).
One noteworthy finding of this study was nonwhite race
was associated with higher risk of death from esophageal
cancer, regardless of treatment received. Members of the
nonwhite population encompass racial and ethnic minorities,
including those who do not speak the dominant language,
those with problems accessing and successfully navigating
the health care system, and those likely to be socioeconomically disadvantaged and be less well educated than whites.
These differences and the resulting marginalization can have
dramatic negative effects, as evidenced in the increased RR in
this population.
In our series, 3-year overall survival rates improved
from 16.7% (1985–1989) to 35.2% (2000 –2003), and the
overall survival rates were similar for the last two cohorts.
Parallel to this moderate improvement in survival was a
number of significant advancement in diagnostic and treatment modalities in the management of esophageal cancer
during the study period. First, a trend of more rigorous
staging using endoscopic ultrasonography and functional image of PET was observed during these times, which could
cause stage migration. However, there was no significant
change in stage distribution throughout the studied period.
Separate analysis of the effect of PET on survival of last
cohort showed no difference, suggesting that the survival
effect of stage migration would be minimal. Second, more
dramatic reductions in risk were associated with being treated
with recent therapies, including concurrent chemoradiation,
paclitaxel-containing chemotherapy, and three-dimensional
radiotherapy that has enabled us to increase radiation dose to
50.4 Gy with concurrent chemotherapy without increasing
toxicity.15 Improving rates further will depend on overcoming
the challenges of achieving control of locoregional disease,
residual disease postsurgery, and metastasis. Overall, our data
is supported by a national series using 5-year relative survival
rates, with significant improvements also reported.1
Evidence has indicated that combined radiation and
chemotherapy promote better survival rates over radiotherapy
alone.16,17 but results from phase III studies of preoperative
chemoradiation followed by surgery compared with surgery
alone have resulted in mixed findings.18 –20 Of these, the one
that found clear advantage to multimodal therapy in overall
survival enrolled fewer than 60 patients in each arm20 and
another enrolling 43 found none.19 However, another with
282 patients evaluated found preoperative chemotherapy
could prolong disease-free survival and survival free of locoregional disease but not overall survival.18
In the current study, undergoing surgery after concurrent chemoradiation was associated with higher survival.
However, this improvement of outcome was probably the
TABLE 3. Three-year Survival of the Four Cohorts (1985–2003)
End Points
Median survival (month)
Overall survival (%)
Progression-free survival (%)
Distant metastasis–free survival
(%)
Locoregional progression free
survival (%)
1985–1989 (95% CI)
1990–1994 (95% CI)
1995–1999 (95% CI)
2000–2003 (95% CI)
Log Rank Test
of Trend p
12.9
16.7 (10.5–24.1)
49.5 (36.0–61.6)
67.3 (52.3–78.6)
11.1
11.8 (7.2–17.7)
16.0 (10.2–23.0)
39.5 (28.4–50.4)
20.1
32.7 (26.5–39.1)
34.5 (27.8–41.4)
51.0 (43.2–58.2)
20.4
35.2 (29.5–41.0)
28.7 (21.3–36.5)
36.4 (27.7–45.1)
⬍0.001
⬍0.001
0.0006
70.9 (57.4–80.8)
30.4 (22.1–39.1)
54.4 (46.3–61.7)
57.6 (47.6–66.3)
⬍0.001
CI, confidence interval.
6
Copyright © 2009 by the International Association for the Study of Lung Cancer
Journal of Thoracic Oncology • Volume 4, Number 7, July 2009
Esophageal Cancer Radiation Therapy
TABLE 4. Univariate Cox Regression Analysis of Factors Affecting Overall Survival
Factors
Patient characteristics
Age
Non-white
No alcoholism
No dysphagia
Karnofsky performance score (kps)
Weight loss
Staging tests
Barium swallow
CT chest
Endoscopic ultrasonography
PET study
Disease characteristics
Barrett esophagus
Squamous histology
Mid/lower/GEJ tumor
Clinical stage III
Clinical stage IV
Treatment characteristics
1990–1994
1995–1999
2000–2003
Surgery
Induction chemo plus concurrent CRTa
Concurrent CRT
Taxanes chemotherapyb
Three-dimensional (3D) radiotherapy
Total radiation dose
Outcome characteristics
Residual tumor after surgery
No complete response to treatmentsc
Relative Risk
95% Confidence Interval
p>Z
1.01
1.41
0.84
0.59
0.58
1.03
1.01–1.02
1.16–1.72
0.71–0.99
0.46–0.74
0.50–0.68
1.02–1.04
⬍0.001
⬍0.001
0.04
⬍0.001
⬍0.001
⬍0.001
Continuous
White
Alcoholism
Dysphagia
kps ⬍ 90
Continuous
0.83
0.81
0.53
0.28
0.67–1.02
0.60–1.11
0.45–0.62
0.33–0.50
0.08
0.19
⬍0.001
⬍0.001
No
No
No
No
1.29
1.36
0.87
1.35
2.76
1.03–1.62
1.16–1.60
0.69–1.09
1.12–1.63
2.23–3.42
0.02
⬍0.001
0.23
0.002
⬍0.001
No Barrett esophagus
Adenocarcinoma
Cervical/upper esophagus
Stage I/II
Stage I/II
1.09
0.62
0.57
0.46
0.64
0.39
0.56
0.71
0.97
0.85–1.40
0.48–0.78
0.45–0.73
0.39–0.54
0.53–0.77
0.33–0.46
0.47–0.67
0.60–0.84
0.97–0.99
0.51
⬍0.001
⬍0.001
⬍0.001
⬍0.001
⬍0.001
⬍0.001
⬍0.001
⬍0.001
1985–1989
No surgery
Concurrent CRT
No concurrent CRT
No taxanes
No 3D conformal
Continuous
2.12
3.56
1.48–3.12
2.99–4.24
⬍0.001
⬍0.001
No residual disease
Complete response to all treatment
Comparison Group
barium swallow
CT chest
endoscopic ultrasonography
PET
Only patients (n ⫽ 602, 230 who received induction plus concurrent, 372 concurrent CRT) who received concurrent CRT were included in the analysis.
The results from a separate comparative analysis including patients who were treated during last two cohorts was consistent with the result from the above analysis, which
included patients from all 4 cohorts.
c
Completer response to treatment indicates that patient had complete response after non-surgical treatment, or R0 resection after surgery.
Chemo, chemotherapy; CRT, chemoradiation; CT, computed tomography.
a
b
combined result of patient selection, disease resectability, and
surgical boost of the primary tumor. In univariate analysis,
failing to achieve tumor control at surgery was associated in
our study with increased risk (RR ⫽ 2.29 [CI ⫽ 1.59 –3.30],
p ⬍ 0.001), and presurgical therapy is an attempt to circumvent residual disease postsurgery. In Germany, Stahl et al.21
undertook a randomized trial to assess the effect of surgery on
overall survival of 172 patients with locally advanced squamous cell esophageal cancer (T3 or T4) who underwent
chemotherapy and radiotherapy. With a median follow-up of
6 years, investigators found local progression-free survival
was better in the surgery with chemoradiotherapy group than
in the group undergoing chemoradiotherapy alone (RR, 2.1;
95% CI, 1.3–3.5). The surgery group also had significantly
higher treatment-related mortality compared with the group
treated without surgery (12.8% versus 3.5%, respectively; p ⫽
0.03). Though overall survival was determined to be equivalent
between the two treatment arms, the single independent factor
that predicted overall survival was clinical response to induction
chemotherapy (RR, 0.30; 95% CI, 19 – 0.47; p ⬍ 0.0001).
Therefore, investigators concluded that locoregional control
in advanced squamous cell esophageal carcinoma could be
improved by adding surgery to chemoradiotherapy but that
such a change did not favorably affect overall survival when
measured at a median of 6 years’ follow-up (range, 1.4 –9.3
years) and was associated with a treatment-related mortality
rate significantly higher than that observed in the nonsurgical
group. Three recent meta-analyses have examined the value
of combining therapies to treat esophageal cancer with inconsistent conclusions in respect of survival benefit adding
surgery to chemoradiation for esophageal cancer patients.22–24 Additional randomized trials are required to resolve these differences.
One important observation of the current study is that
the outcome of patients treated in the 1990 –1994 interval,
when the standard radiation dose was 30 Gy in 10 fractions,
Copyright © 2009 by the International Association for the Study of Lung Cancer
7
Journal of Thoracic Oncology • Volume 4, Number 7, July 2009
Zhang et al.
FIGURE 2. A, Overall survival by surgical treatment status. Undergoing surgery was associated with reduced risk (RR ⫽ 0.46
[CI ⫽ 0.39 – 0.54], p ⬍ 0.001); B, Induction chemotherapy plus concurrent chemotherapy. Undergoing induction chemotherapy
plus concurrent chemoradiation was associated with reduced relative risk (RR ⫽ 0.64 [CI ⫽ 0.53–0.77], p ⬍ 0.001); C, Taxane (paclitaxel) therapy. Undergoing paclitaxel chemotherapy reduced relative risk (RR ⫽ 0.56 [CI ⫽ 0.47–0.67], p ⬍ 0.001).
TABLE 5. Multivariate Cox Regression Analysis of Factors
Affecting Overall Survival
Factors
Patient characteristics
Karnofsky performance score
Disease characteristics
Clinical stage III
Clinical stage IV
Treatment characteristics
1990–1994
1995–1999
2000–2003
Induction chemo plus
concurrent CRT
Outcome characteristics
No complete response to
treatments
Relative
Risk
95% Confidence
Interval
p>Z
0.68
0.56–0.83
⬍0.001
1.53
2.36
1.22–1.93
1.79–3.11
⬍0.001
⬍0.001
1.01
0.79
0.63
0.68
0.70–1.45
0.57–1.10
0.44–0.88
0.56–0.84
0.97
0.16
0.007
⬍0.001
2.65
2.13–3.29
⬍0.001
CRT, chemoradiation.
had the poorest survival measured by all end points used. In
a meta-analysis, investigators found that the probability of
complete response increased with the dose of radiotherapy,24
therefore, the poor outcome 1990 –1994 might be associated
with the low total radiation dose (30 Gy in 10 fractions) used
during this period, confirming a previous report by Zhang et
al.25 It is noteworthy that 30 Gy of total radiation given with
rapid fractionation was, at one time, the definitive treatment
chosen in our institution for prospective clinical trials. It was
estimated that a 30-Gy total dose of radiation given in 10
fractions was considered radiobiologically equivalent to a
standard 4.5-week (45 Gy in 25 fractions) program with a
shortened overall treatment time.26,27 However, the Radiation
Therapy Oncology Group trial 94 – 0528 that investigated the
possibility of intensification of the radiation dose failed to
show any benefit in survival in the high-dose (64.8 Gy) arm.
In fact, there were no differences between the high-dose and
the standard-dose (50.4 Gy) arms in the median survival time
(13.0 versus 18.1 months), 2-year survival rate (31% versus
40%), and rate of local-regional failure or local-regional
8
disease persistence (52% versus 56%). Taking together, we
could conclude that, for esophageal cancer and when chemotherapy is given concurrently with radiation, at least 50 Gy is
needed to achieve reasonable local control, and surgical
resection after chemoradiation could remove the residual
disease, hence increase local control of the cancer. Another
observation from the current study was that during 1985–
1989, the best rates of progression free survival, distant
metastasis free survival, and the local regional progression
free survival were reported. The overall survival, however,
was moderate. With the limitation of a retrospective review,
one could only speculate that follow-up tests for disease
progression was not as rigorous as the cohorts treated during
the later periods and the event of disease progression might
have been under reported.
Limitations of this study include (a) its retrospective
nature; (b) the tendency of stage to be revised over time
because of differences in diagnostic evaluation technology,
reductions in tumor because of presurgical therapy, and
restaging at surgery; and the (c) short follow-up for the last
interval. In particular, because the stage of the patients’
disease could not be as reliably measured as other factors (for
example, age), stage of disease is less reliable as a data point.
Poorer diagnostic technology in the early cohorts meant that
clinical stage was more likely to be revised in the earlier
cohorts than in the later ones. Likewise, differences in presurgical or postsurgical therapy might have affected outcome
statistics.
These findings demonstrate that the changes in esophageal cancer epidemiology noted nationally are observed
locally, that the improved survival rates coincided with more
rigorous pretreatment staging, increased use of combined
modality and new drugs and technology in treatment. Furthermore, improved and more aggressive salvage therapies
may also contributed to the improved outcomes of patients
who were treated in the more recent years. Achieving further
improvements in survival rates will depend on conducting
well-planned, sufficiently powered randomized controlled trials using the most promising radiation and chemotherapeutic
tools. The benefits of these tools, including promising molecular targeted agents, new and more effective chemothera-
Copyright © 2009 by the International Association for the Study of Lung Cancer
Journal of Thoracic Oncology • Volume 4, Number 7, July 2009
peutic drugs and three-dimensional radiation therapy, are
only beginning to be recognized and managed to produce the
best results. Building on the therapies that are producing
improved survival rates will also require controlling postoperative complications and reducing toxicities associated with
combination therapy. This will also continue to increase in
importance as more and more of these patients live longer
posttherapy and additional efforts to minimize normal tissue
toxicity must be undertaken to avoid negative effects on
quality of life29 and to improve posttherapy quality of life.30
ACKNOWLEDGMENTS
Supported by the Radiologic Society of North America,
Research and Education Program’s grant to teach teachers
from emerging nations.
REFERENCES
1. Society AC: Cancer Facts and Figures 2008, American Cancer Society,
2008.
2. Daly J, Fry W, Little A, et al. Esophageal cancer: results of an American
College of Surgeons Patient Care Evaluation Study. J Am Coll Surg
2000;190:562–573.
3. Enzinger PC, Mayer RJ M: Esophageal cancer. JAMA 2003;349:2241–
2252.
4. Finley R. Esophageal cancer: results of an American College of Surgeons Patient Care Evaluation Study. Am J Coll Surg 2000;190:573–
574.
5. Patti M, Li R, Tedesco P, et al. Esophageal cancer. 2006. http://emedicine.
medscape.com/article/277930-overview.
6. Ferlay J, Bray F, Pisani P, et al. Globocan 2002: Cancer incidence,
mortality, and prevalence worldwide, Lyon, France: IARC Press, 2001.
7. Pollack A, Zagars GK, Starkschall G, et al. Prostate cancer radiation
dose response: results of the M. D. Anderson phase III randomized trial.
Int J Radiat Oncol Biol Phy 2002;53:1097–105.
8. Fleming I. AJCC Cancer Staging Manual. Philadelphia, PA: LippincottRaven; 1997.
9. Cuzock J. A Wilcoxon-type test for trend. Stat Med 1985;4:87–90.
10. Kalbfleisch J, Prentice R. The Statistical Analysis of Failure Time Data.
New York: Wiley; 20002.
11. Klein J, Moeschberger M. Survival Analysis: Techniques for Censored
and Truncated Data. New York: Springer; 2003.
12. Cox D. Regression models and life tables. J Roy Stat Soc Series B
1972;34:187–229.
13. StataCorp 2007: Stata statistical software: Release 10. College Station,
TX, StataCorp LP.
14. American Cancer Society: What is cancer of the esophagus? 2006.
15. Wang SL, Liao Z, Vaporciyan AA, et al. Investigation of clinical and
dosimetric factors associated with postoperative pulmonary complications in esophageal cancer patients treated with concurrent chemoradiotherapy followed by surgery. Int J Radiat Oncol Biol Phys 2006;64:692–
699.
Esophageal Cancer Radiation Therapy
16. Cooper J, Guo M, Herskovic A, et al. Chemoradiotherapy of locally
advanced esophageal cancer: long-term follow-up of a prospective
randomized trial (RTOG 85– 01). Radiation Therapy Oncology Group.
JAMA 1999;281:1623–1627.
17. Smith T, Ryan L, Douglass HJ, et al. Combined chemoradiotherapy vs.
radiotherapy alone for early stage squamous cell carcinoma of the
esophagus: a study of the Eastern Cooperative Oncology Group. Int J
Radiat Oncol Biol Phys 1998;42:269 –276.
18. Bosset J, Gignoux M, Triboulet J, et al. Chemoradiotherapy followed by
surgery compared with surgery alone in squamous-cell cancer of the
esophagus. New Eng J Med 1997;337:161–167.
19. Urba S, Orringer M, Turrisi A, Iannettoni M, Forastiere A, Strawderman
M. Randomized trial of preoperative chemoradiation versus surgery
alone in patients with locoregional esophageal carcinoma. J Clin Oncol
2001;19:305–313.
20. Walsh T, Noonan N, Hollywood D, et al. A comparison of multimodal
therapy and surgery for esophageal adenocarcinoma. New Eng J Med
1996;335:462– 467.
21. Stahl M, Stuschke M, Lehmann N, et al. Chemoradiation with and
without surgery in patients with locally advanced squamous cell carcinoma of the esophagus. J Clin Oncol 2005;23:2310 –2317.
22. Urschel J, Vasan H, Blewett C. A meta-analysis of randomized controlled trials that compared neoadjuvant chemotherapy and surgery to
surgery alone for resectable esophageal cancer. Am J Surg. 2002;183:
274 –279.
23. Fiorica F, Di Bona D, Schepis F, et al. Preoperative chemoradiotherapy
for oesophageal cancer: a systematic review and meta-analysis. Gut
2004;53:925–930.
24. Geh J, Bond S, Bentzen S, et al. Systematic overview of preoperative
(neoadjuvant) chemoradiotherapy trials in oesophageal cancer: evidence
of a radiation and chemotherapy dose response. Radiother Oncol 2006;
78:236 –244.
25. Zhang Z, Liao Z, Jin J, et al. Dose-response relationship in locoregional
control for patients with stage II–III esophageal cancer treated with
concurrent chemotherapy and radiotherapy. Int J Radiat Oncol Biol Phys
2005;61:656 – 664.
26. Pisters PW, Abbruzzese JL, Janjan NA, et al. Rapid-fractionation preoperative chemoradiation, pancreaticoduodenectomy, and intraoperative
radiation therapy for resectable pancreatic adenocarcinoma. J Clin Oncol
1998;16:3843–3850.
27. Spitz FR, Abbruzzese JL, Lee JE, et al. Preoperative and postoperative
chemoradiation strategies in patients treated with pancreaticoduodenectomy for adenocarcinoma of the pancreas. J Clin Oncol 1997;15:928 –
937.
28. Minsky B, Pajak T, Ginsberg R, et al. INT 0123 (Radiation Therapy
Oncology Group 94 – 05) phase III trial of combined-modality therapy for
esophageal cancer: high-dose versus standard-dose radiation therapy. J Clin
Oncol 2002;20:1167–1174.
29. Ishikura S, Nihei K, Ohtsu A, et al. Long-term toxicity after definitive
chemoradiotherapy for squamous cell carcinoma of the thoracic esophagus. J Clin Oncol 2003;21:2697–2702.
30. Hofstetter W, Swisher S, Correa A, et al. Treatment outcome of resected
esophageal cancer. Ann Surg 2002;236:1–10.
Copyright © 2009 by the International Association for the Study of Lung Cancer
9


© Copyright 2026