
Smile line assessment comparing quantitative measurement and visual estimation
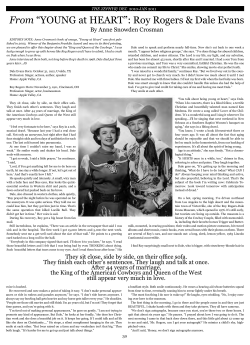
ORIGINAL ARTICLE
Smile line assessment comparing quantitative
measurement and visual estimation
Pieter Van der Geld,a Paul Oosterveld,b Jan Schols,c and Anne Marie Kuijpers-Jagtmand
Nijmegen, The Netherlands
Introduction: Esthetic analysis of dynamic functions such as spontaneous smiling is feasible by using digital
videography and computer measurement for lip line height and tooth display. Because quantitative measurements are time-consuming, digital videography and semiquantitative (visual) estimation according to
a standard categorization are more practical for regular diagnostics. Our objective in this study was to
compare 2 semiquantitative methods with quantitative measurements for reliability and agreement. Methods:
The faces of 122 male participants were individually registered by using digital videography. Spontaneous
and posed smiles were captured. On the records, maxillary lip line heights and tooth display were digitally
measured on each tooth and also visually estimated according to 3-grade and 4-grade scales. Two raters
were involved. An error analysis was performed. Reliability was established with kappa statistics. Results:
Interexaminer and intraexaminer reliability values were high, with median kappa values from 0.79 to 0.88. Agreement of the 3-grade scale estimation with quantitative measurement showed higher median kappa values (0.76)
than the 4-grade scale estimation (0.66). Differentiating high and gummy smile lines (4-grade scale) resulted in
greater inaccuracies. The estimation of a high, average, or low smile line for each tooth showed high reliability
close to quantitative measurements. Conclusions: Smile line analysis can be performed reliably with a 3-grade
scale (visual) semiquantitative estimation. For a more comprehensive diagnosis, additional measuring is
proposed, especially in patients with disproportional gingival display. (Am J Orthod Dentofacial Orthop
2011;139:174-80)
O
rofacial esthetics refers to dynamic facial expressions, such as smiling and speaking. The movements of the lips are the controlling factor for
tooth and gingival display. According to the principles
of visual perception, a harmonic and symmetric composition of teeth, visible gingiva, buccal corridors, and lips
is a requirement for an esthetic and pleasing smile.1 This
“smile composition” is framed by the lips; in this way,
the arrangement of the teeth and the visible gingiva is
dictated by the outline of the lips and the height of
the smile line. The outline of the lips affects visual constructs such as the buccal corridors and the smile arc.2
From the Department of Orthodontics and Oral Biology, Radboud University
Nijmegen Medical Centre, Nijmegen, The Netherlands.
a
Researcher; private practice, Vught, The Netherlands.
b
Assistant professor, research methodology and biostatistics.
c
Clinic director.
d
Professor and chair.
The authors report no commercial, proprietary, or financial interest in the
products or companies described in this article.
Reprint requests to: Anne Marie Kuijpers-Jagtman, Department of Orthodontics and Oral Biology, Radboud University Nijmegen Medical Centre, 309
Tandheelkunde, PO Box 9101, 6500 HB Nijmegen, The Netherlands; e-mail,
[email protected].
Submitted, June 2008; revised and accepted, September 2009.
0889-5406/$36.00
Copyright Ó 2011 by the American Association of Orthodontists.
doi:10.1016/j.ajodo.2009.09.021
174
A smile line that displays the entire length of the teeth
and some gingival tissue is associated with youth. In
contrast, a smile line with only a portion of the teeth
results in a less youthful smile.3 Moreover, it was found
recently that size and visibility of teeth, and upper lip position were critical factors in the self-perception of smile
attractiveness.4 Participants, smiling with their teeth
entirely displayed including some gingival display, perceived their smile line as the most esthetic. Therefore,
from a dental esthetic and patient point of view, the
height and course of the smile line are important aspects
of orthodontic diagnosis, treatment planning, and adequate long-term results.5
Static analysis of the smile with the photographic
methods available in the past inevitably led to a posed
smile as the starting point for an orthodontic diagnosis,
since this was supposed to be the most reproducible
smile.6,7 This is, however, contrary to normal life,
where smiles are not displayed in static but in
dynamic situations. This drawback of photography has
been overcome by contemporary videographic and
computer technologies. Analysis of orofacial esthetics
during spontaneous smiling and speaking is now
feasible because the optimal record can be selected
from a video registration.3,8-10 The use of digital
Van der Geld et al
videography to capture an authentic spontaneous smile
combined with digital measurements has been tested
lately, and it appeared to be reliable, reproducible, and
valid for use in clinical practice.9 Moreover, it was found
that a posed smile showed reduced smile line heights,
tooth display, and smile width, compared with a spontaneous smile.11 Spontaneous smiling records were therefore recommended for diagnostic purposes.
In spite of the digitized methods, performing smile line
measurements is, however, relatively time-consuming
and therefore less feasible for regular diagnostic use in
clinical practice. Next to the quantitative measurements,
a qualitative12,13 and a semiquantitative approach14,15
to determine the height of the smile line are proposed in
the dental literature. In the qualitative approach, the
clinician observes the smile line and makes a judgment
about its height. A disadvantage of the qualitative
analysis is that it lacks standardization and objective
criteria. With a semiquantitative approach, the lip line
height and tooth display are visually and rationally
estimated with a scale. Lip line height and tooth display
can, for instance, be classified as a high, average, or low
smile line. The semiquantitative approach is a more
formal and more objective method than the qualitative
approach, and still it has the advantage that it is easy
and quick to use. With the focus on daily patient care,
the combination of digital videography and visual
estimation of lip line height and tooth display on the
images could be an efficient way of dynamic soft-tissue
analysis.
Since semiquantitative estimations of lip line heights
and tooth display are easier to perform and efficient, and
do not require dedicated computer software, the question is whether this approach is justified for use in clinical practice. Therefore, the objectives of this study were
to test the reliability and validity of semiquantitative estimation of the smile line and to make a comparison with
quantitative measurements.
MATERIAL AND METHODS
Of 1069 military men on an air force base, 122 were
randomly selected from 3 age cohorts (20-25, 35-40,
and 50-55 years). Inclusion criteria were full maxillary
and mandibular dental arches up to and including the
first molars and white ethnicity. The research proposal
was approved by the ethical committee of the Academic
Centre of Dentistry Amsterdam, The Netherlands. Informed consent was obtained from the participants
according to the guidelines of that institution.
Of each participant, a video recording was made of
a spontaneous smile of joy, a posed social smile, and
full dentition with the aid of cheek retractors. The full
175
dentition was measured to obtain the actual lengths of
the tooth crowns. The video recordings were made in
a setup consisting of a chair with a digital video camera
(XM 1 [3 CCD], Canon, Tokyo, Japan), a television set,
and 2 spotlights mounted in front of the chair. The television screen was placed at eye level. When the visual
axis was horizontal, the subjects kept their heads mainly
in a natural head position.16,17 The video camera was
adjusted to the subject’s mouth level and continuously
registered the face. To prompt spontaneous smiling,
the subjects watched television fragments of practical
jokes, which had been assessed by a panel as the
funniest from a film of 50 practical jokes. The subjects
were unaware of the exact aim of the study. While
watching television, the subjects wore glasses with
a clipped-on reference standard to enable calibration
in a digital measurement program. In this way, a maximum spontaneous smile was recorded with minimal
intrusion of the subject. After the video registration,
the digital recordings were transferred to a computer.
Then, the dynamics of smiling could be observed image
by image. The video images of smiling with maximum
visibility of teeth and gingivae, referred to as the records,
were selected.
The records of spontaneous and posed smiles were
measured with the help of the Digora program for dental
radiography (Orion Corporation Soredex, Helsinki,
Finland). For each record, the measurement program
was recalibrated with the filmed reference standard.
Tooth length was measured on the full dentition record to obtain the clinical crown length. Teeth and gingival display were measured on the spontaneous and
posed smiling records. In the maxilla, a central incisor,
a lateral incisor, a canine, a first premolar, a second premolar, and a first molar were measured on the right and
left sides alternately to exclude possible interferences of
asymmetries. The most incisal point of each tooth and
the lip edge were marked with a digital horizontal line,
parallel to the interpupil line (Fig 1). The vertical distance
between these lines was measured (Fig 1). Tooth display
during smiling was calculated as a percentage of the
clinical crown length as measured on the full dentition
record. In case of a high lip line, gingival display above
the cervical margin was expressed in millimeters. Sometimes, the upper and lower lips covered both the gingival
margin and the incisal point. In that case, lip line height
was denoted as not measurable. If a tooth was not
visible, lip line height was coded as missing.
An extensive reliability study and a more detailed
description were reported earlier (Table I).9 The reliability
was expressed by means of the generalizability coefficient, which is comparable with the intraclass correlation. The generalizability coefficient allows a reliability
American Journal of Orthodontics and Dentofacial Orthopedics
February 2011 Vol 139 Issue 2
Van der Geld et al
176
Table I. Digital videographic measurement: generaliz-
ability coefficients (GC) and standard errors of
measurement in millimeters (SEM) for spontaneous
smiling
Maxilla
Anterior teeth
GC, SEM
Interexaminer agreement 0.98, 0.4
Intraexaminer agreement 0.99, 0.3
Premolars First molar
GC, SEM GC, SEM
0.98, 0.5 0.91, 1.1
1.0, 0.2
0.99, 0.3
4 mm of gingiva was classified as a gummy smile line
(Fig 2).4,18 The other 3 categories were identical to the
categories of the 3-grade scale.
To determine the intraexaminer reliability for the 3grade and 4-grade scales’ semiquantitative estimations,
all records were assessed twice by an examiner (P.G.)
with a time interval of 2 weeks. To determine the interexaminer reliability, all records were assessed by a second
examiner.
Statistical analysis
Fig 1. Digital videographic method: measurement of
maxillary central incisor. Line 1, Most incisal point; line
2, lip edge; line 3, interpupil line.
estimate when several sources of error are present: in this
case, teeth and ratings. The data obtained with the digital videographic measurement method were used in this
study as the gold standard.
For the semiquantitative estimation, the lip line
heights on the spontaneous and posed smiling records
were visually classified according to a scale. Two classification concepts were used: a 3-grade scale, which has
been used before, and a 4-grade scale.14,15
According to the 3-grade scale, a lip line height that
showed less than 75% of the tooth was visually classified
as a low smile line. A lip line height that showed 75% to
100% of the tooth and less than 1 mm of gingival display
was visually classified as an average smile line. A lip line
height that showed the total cervico-incisal length of
a tooth and a continuous band of gingiva (minimum,
1 mm) was visually classified as a high smile line.
In the 4-grade scale, a gummy smile line was added
as the fourth category. Based on the results of perception studies in which smile line heights displaying
more than 4 mm of gingiva were perceived as less
attractive, a lip line height that showed more than
February 2011 Vol 139 Issue 2
The measured tooth display and lip line heights were
recoded into the above-described ordinal values of the
semiquantitative estimation: low, average, high, and
gummy smile line categories. Cohen kappa statistics
were used to establish both interexaminer and intraexaminer reliability values and the accuracy of the semiquantitative estimation of smile line height in relation
to the quantitative measurements. All of these analyses
were performed for each tooth. According to the conventions, kappa statistics of 0.40, 0.60, and 0.80 were
considered moderate, substantial, and almost perfect,
respectively.19
An error analysis was performed for further investigation of sources, which might lead to differences (errors)
between semiquantitative estimations and quantitative
measurements. The errors were correlated with the actual tooth length and the smile line height relative to
the gingival margin. The significance level of P \0.05
was chosen. This meant that, with a sample size of
122, correlations of .25 can be detected with a power
of .80.
RESULTS
Table II shows the interexaminer and intraexaminer
agreement values for the 2 concepts of semiquantitative
estimation for both spontaneous and posed smiles. No
substantial differences were noted between the values
of interexaminer and intraexaminer reliability. The median values of the 3-grade scale estimation were considered almost perfect.19 For the 4-grade scale estimation,
American Journal of Orthodontics and Dentofacial Orthopedics
Van der Geld et al
177
Fig 2. Four categories of smile line height: (left to right) low, average, high, and gummy.
Table II. Kappa statistics (K) and percentages (%) of interexaminer and intraexaminer agreement for semiquantitative
estimation of lip line heights of the maxillary teeth during spontaneous and posed smiling
Interexaminer agreement
Spontaneous smiling
3-grade scale estimation
4-grade scale estimation
Posed smiling
3-grade scale estimation
4-grade scale estimation
Intraexaminer agreement
Spontaneous smiling
3-grade scale estimation
4-grade scale estimation
Posed smiling
3-grade scale estimation
4-grade scale estimation
Central
incisor K, %
Lateral
incisor K, %
Canine
K, %
First
premolar K, %
Second
premolar K, %
First
molar K, %
Median
K, %
0.89, 94
0.83, 91
0.84, 91
0.81, 88
0.85, 91
0.83, 89
0.88, 95
0.79, 86
0.75, 92
0.73, 83
0.93, 97
0.77, 84
0.87, 93
0.81, 87
0.88, 93
0.87, 92
0.85, 91
0.83, 90
0.74, 84
0.70, 81
0.89, 95
0.78, 85
0.88, 95
0.80, 86
0.90, 95
0.89, 93
0.88, 94
0.82, 88
0.95, 94
0.92, 96
0.77, 87
0.73, 82
0.86, 92
0.82, 88
0.84, 93
0.76, 84
0.73, 91
0.75, 84
0.91, 96
0.81, 87
0.85, 93
0.79, 86
0.86, 92
0.85, 91
0.87, 92
0.86, 91
0.79, 87
0.73, 82
0.84, 91
0.73, 81
0.92, 96
0.89, 92
0.82, 90
0.72, 79
0.85, 92
0.79, 87
in which the gummy smile line was included, the kappa
values were slightly lower and were considered substantial to almost perfect.
Table III shows the kappa statistics and percentages
of agreement between semiquantitative estimations
and quantitative measurements of tooth display and
lip line height. The anterior-tooth kappa values varied
between substantial and almost perfect, for both spontaneous and posed smiling. The posterior-tooth kappa
values for spontaneous smiling varied between moderate and substantial. Kappa values for posed smiling varied between substantial and almost perfect.
In Figure 3, the quantitative and semiquantitative
percentages of tooth display and lip line height in the
sample are shown according to the 4-grade scale. For
both spontaneous and posed smiling, the gummy smile
line category was mostly overestimated in the semiquantitative judgment, especially for the second premolar.
The analyses of differences between semiquantitative
and quantitative ratings in the 4-grade scale showed significant correlations for rating errors associated with
smile line height of spontaneous smiling (central incisor:
r 5 0.20, P 5 0.026; second premolar: r 5 –0.26, P 5
0.007). No correlations were found for the 3-grade scale
analyses of differences.
DISCUSSION
When examining the whole range of lip-tooth relationships in a smile, simply observing a patient’s smile
without any quantification is not an adequate starting
point for an evidence-based decision regarding orthodontic therapy. Therefore, a record is required for a dynamic smile analysis. By using records of spontaneous
smiling next to posed smiling, diagnostics can be improved so that they approach the daily perceptions of
patients by their social environment.11 In this study,
records were analyzed by measurements as well as by
visual and rational estimations. Visual estimation and
perception can be less accurate than measuring and susceptible to interference. A reason for this is the cooperation of different parts of the brain in which retinal
stimuli are associated with recognition, the visual
American Journal of Orthodontics and Dentofacial Orthopedics
February 2011 Vol 139 Issue 2
Van der Geld et al
178
Table III. Kappa statistics (K) and percentages (%) of agreement between semiquantitative estimation and quantitative measurement of the lip line heights of the maxillary teeth during spontaneous and posed smiling
Spontaneous smiling
3-grade scale estimation
4-grade scale estimation
Posed smiling
3-grade scale estimation
4-grade scale estimation
Central
incisor K, %
Lateral
incisor K, %
Canine
K, %
First
premolar K, %
Second
premolar K, %
First
molar K, %
Median
K, %
0.81, 90
0.77, 87
0.76, 87
0.70, 80
0.75, 85
0.72, 81
0.71, 84
0.58, 71
0.58, 85
0.55, 70
0.77, 90
0.62, 73
0.76, 86
0.66, 78
0.86, 91
0.84, 90
0.72, 83
0.66, 78
0.73, 83
0.67, 78
0.75, 86
0.60, 71
0.89, 95
0.71, 80
0.77, 88
0.61, 71
0.76, 87
0.67, 78
processing. Interference by visual processing can be a visual illusion: eg, if 2 teeth are the same length, the wider
tooth seems shorter; or if 2 teeth are the same size, the
whiter one appears larger.1 By perceptual grouping, another interference of visual processing, the observation
of single objects is less accurate, because perception of
the whole is prior to that of its parts.20 This makes visual
perception not suitable for all types of estimation. For
example, visual estimation of tooth-size discrepancies
in dental arches was found to have low sensitivity and
specificity.21 However, a study into detection and activity assessment of primary coronal caries lesions showed
high accuracy of visual estimation combined with probing.22 The starting point for this study was to develop an
efficient and practical method for smile line determination combined with videography. Therefore, the reliability of the semiquantitative approach for smile line
determination was tested on videographic records.
The 3-grade scale semiquantitative estimation is
a commonly used approach in orthodontics and esthetic
dentistry for the estimation of the smile line in the total
anterior maxillary region. To prevent interfering factors
of perceptual grouping as a result of visual processing
in this study, the classification was used on the tooth
level. When the smile line is estimated on each tooth,
a rater must observe more carefully. Because the maxillary posterior region must also be considered part of the
esthetic zone, the smile line was estimated up to the first
molar.5,15,23 A drawback of the 3-grade scale is that no
difference is made between high and gummy smile
lines. Gummy smiles can be considered a serious
esthetic problem.24 Smiles entirely displaying the teeth
including more than 4 mm of gingiva were judged
negatively, and disproportional gingival display was
correlated with personality characteristics such as lower
self-esteem and neuroticism.4,18 Therefore, in this study,
a fourth category was added to the semiquantitative
classification to distinguish gummy smile lines exceeding
4 mm of gingival display.
The sample was restricted to Dutch military men. At
first, this sample seems to be a limitation of this study.
February 2011 Vol 139 Issue 2
It can result among others in a restriction of range for
age and sex. However, since our aim was to test the reliability of smile line assessment as a method, confounding of the results by age or sex was not expected.
Furthermore, this sample was randomly selected from
3 age cohorts. It is likely that all smile line categories
were represented.
Although esthetic analysis is popular in contemporary orthodontics, relatively little research has been
done regarding the reliability. Until now, no researchers
have reported a reliability analysis of the semiquantitative estimation of the smile line. Basting et al25 compared smile line height determination between the
semiquantitative and quantitative approaches but
focused only on the average smile line height. Table II
shows substantial or almost perfect kappa statistics for
semiquantitative estimation with little difference between the values of interexaminer and intraexaminer
agreement. The 3-grade scale estimation showed the
highest reproducibility with median kappa statistics
considered almost perfect.
The agreement between the 3-grade scale estimation and the quantitative measurement method was
substantial to almost perfect for both spontaneous
and posed smiling except for moderate agreement
of the second premolar during spontaneous smiling.
For the second premolar, a discrepancy was noted
between the relatively low kappa and the high percentage of agreement in the 3-category estimation. This
was due to the high proportion of high smile lines in
the study sample. In classifications with a high proportion of 1 category, high agreement percentages could
be due to chance alone. The kappa coefficient corrects
for this base rate agreement. By the addition of the extra grade scale of the gummy smile line, the agreement
between the semiquantitative and the quantitative
approaches also decreased. Especially in the premolar
area during spontaneous smiling, the agreement was
moderate. When combining both reproducibility and
validity, the 3-grade scale estimation showed the
highest reliability.
American Journal of Orthodontics and Dentofacial Orthopedics
Van der Geld et al
179
Fig 3. Percentages of the quantitative measurement (Q) and semiquantitative estimation (SQ) of tooth
display and lip line height according to the 4-grade scale of the maxillary incisors, canine, premolars,
and first molar: A, spontaneous smiling; B, posed smiling.
To learn from estimation errors, analyses of the differences between the semiquantitative and quantitative
approaches were performed and correlated with possible
interfering factors on visual processing such as actual
tooth length and smile line height. The estimation errors
were, however, relatively low, since the kappa statistics
in Table III varied between moderate and almost perfect.
The correlations with interfering factors were therefore
not significant; they were weak and found only in the
4-grade scale estimation for smile line height. Relatively
more estimation errors were made for central incisors
with higher smile lines. For the second premolars, no estimation errors were made in the relatively large highest
grade scale. The negative correlation seems mainly due
to estimation errors as a result of overestimation of the
grade scales below.
These results indicate that the 3-grade scale estimation is a reliable means for determination of the smile
American Journal of Orthodontics and Dentofacial Orthopedics
February 2011 Vol 139 Issue 2
Van der Geld et al
180
line and thereby an instrument for clinical practice. Smile
line discrepancies and the total smile line height can be
efficiently determined in this way. Moreover, the 3-grade
scale offers a good means of communication regarding
smile line height with colleagues or patients, but it
allows a certain degree of variability as proposed by
Ker et al.26 Although high gum lines can easily be detected without a scale, this study shows that the estimation of the height of the smile lines in teeth with more
than 4 mm of gingival display is less accurate, and
gingival display then seems to be overestimated.
In general, when a complete low smile line is determined, intrusion therapy in adolescents should be
avoided. Reduced tooth display as a result of lip coverage
during smiling, speaking, and even at rest is associated
with aging. Intrusion therapy will lead to a premature
aged oral appearance, and tooth display will be even
more reduced by sagging of the lips in middle age. If an
average smile line height is determined, orthodontic intrusion should also be avoided, including unwanted side effects of active therapy such as flattening of the smile arc.
In patients in whom a complete high smile line is
determined, it should be kept in mind that smiles that
include some gingival display are perceived as most
esthetic.4 However, when the balance between the
amount of tooth and gingival display is lost, for instance,
as a result of altered passive eruption, vertical maxillary
excess, short upper lip, or increased lip elevation with
smiling, additional digital measurement of lip line height
and tooth display is proposed for orthodontic diagnosis
and treatment planning.27,28 The exact values can guide
the decision for orthodontics or gingivectomy in milder
cases and maxillary osteotomies in more severe cases.
CONCLUSIONS
Smile line analysis can be performed reliably with
a semiquantitative estimation by using a 3-grade scale.
For a more comprehensive diagnosis, additional measuring is proposed for patients with disproportional gingival
display.
REFERENCES
1. Lombardi RE. The principles of visual perception and their clinical
application to denture esthetics. J Prosthet Dent 1973;29:358-82.
2. Moskowitz M, Nayyar A. Determinants of dental esthetics: a rationale for smile analysis and treatment. Compend Contin Educ Dent
1995;16:1164-6.
3. Sarver DM, Ackerman MB. Dynamic smile visualization and quantification: part 1. Evolution of the concept and dynamic records for
smile capture. Am J Orthod Dentofacial Orthop 2003;124:4-12.
4. Van der Geld P, Oosterveld P, Van Heck G, Kuijpers-Jagtman AM.
Smile attractiveness. Self-perception and influence on personality.
Angle Orthod 2007;77:759-65.
February 2011 Vol 139 Issue 2
5. Van der Geld P, Oosterveld P, Kuijpers-Jagtman AM. Age related
changes of the dental aesthetic zone at rest and during spontaneous smiling and speech. Eur J Orthod 2008;30:366-73.
6. Rigsbee OH 3rd, Sperry TP, BeGole EA. The influence of facial animation on smile characteristics. Int J Adult Orthod Orthognath
Surg 1988;3:233-9.
7. Ackerman JL, Ackerman MB, Brensinger CM, Landis JR. A morphometric analysis of the posed smile. Clin Orthod Res 1998;1:2-11.
8. Tarantili VV, Halazonetis DJ, Spyropoulos MN. The spontaneous
smile in dynamic motion. Am J Orthod Dentofacial Orthop 2005;
128:8-15.
9. Van der Geld P, Oosterveld P, Van Waas M, Kuijpers-Jagtman AM.
Digital videographic measurement of tooth display and lip position
in smiling and speech: reliability and clinical application. Am J Orthod Dentofacial Orthop 2007;131:301.e1-8.
10. Trotman CA, Faraway JJ, Losken HW, van Aalst JA. Functional
outcomes of cleft lip surgery. Part II: quantification of nasolabial
movement. Cleft Palate Craniofac J 2007;45:598-606.
11. Van Der Geld P, Oosterveld P, Berge SJ, Kuijpers-Jagtman AM.
Tooth display and lip position during spontaneous and posed
smiling in adults. Acta Odontol Scand 2008;66:207-13.
12. Mack MR. Perspective of facial esthetics in dental treatment planning. J Prosthet Dent 1996;75:169-76.
13. Zachrisson BU. Esthetic factors involved in anterior tooth display
and the smile: vertical dimension. J Clin Orthod 1998;23:432-45.
14. Tjan AH, Miller GD, The JG. Some esthetic factors in a smile.
J Prosthet Dent 1984;51:24-8.
15. Maulik C, Nanda R. Dynamic smile analysis in young adults. Am J
Orthod Dentofacial Orthop 2007;132:307-15.
16. Cooke MS, Wei SH. The reproducibility of natural head posture:
a methodological study. Am J Orthod Dentofacial Orthop 1988;
93:280-8.
17. Rosetti Y, Tadary B, Pablanc C. Optimal contributions of head and
eye positions to spatial accuracy in man tested by visually directed
pointing. Exp Brain Res 1994;97:487-96.
18. Kokich V, Kiyak H, Shapiro P. Comparing the perception of dentists
and lay people to altered dental esthetics. J Esthet Dent 1999;11:
311-24.
19. Landis JR, Koch GG. The measurement of observer agreement for
categorical data. Biometrics 1977;33:159-74.
20. Wertheimer M. Gestalt theory. In: Ellis WD, editor. A source book
of gestalt psychology. New York: Humanities Press; 1938. p. 1-11.
21. Othman S, Harradine N. Tooth size discrepancies in an orthodontic
population. Angle Orthod 2007;77:668-74.
22. Ekstrand KR, Martignon S, Ricketts DJ, Qvist V. Detection and activity assessment of primary coronal caries lesions: a methodologic
study. Oper Dent 2007;32:225-35.
23. Kapagiannidis D, Kontonasaki E, Bikos P, Koidis P. Teeth and
gingival display in the premolar area during smiling in relation
to gender and age. J Oral Rehabil 2005;32:830-7.
24. Peck S, Peck L. Selected aspects of the art and science of facial
esthetics. Semin Orthod 1995;1:105-26.
25. Basting RT, da Trindade RS, Florio FM. Comparative study of smile
analysis by subjective and computerized methods. Oper Dent
2006;31:652-9.
26. Ker AJ, Chan R, Fields HW, Beck M, Rosenstiel S. Esthetics and
smile characteristics from the layperson’s perspective: a computer-based survey study. J Am Dent Assoc 2008;139:1318-27.
27. Arnett GW, Bergman RT. Facial keys to orthodontic diagnosis and
treatment planning—part II. Am J Orthod Dentofacial Orthop
1993;103:395-411.
28. Garber DA, Salama MA. The aesthetic smile: diagnosis and treatment. Periodontol 2000 1996;11:18-28.
American Journal of Orthodontics and Dentofacial Orthopedics


© Copyright 2026