
Objective Activities
When you have completed this activity, go to Status Check.
Student Activity:
Algebra 1A
Unit 4
Finding the Domain and
Range of a Function
Name _________________________________________ Date ____________________________
Objective
In this activity, you will learn how to find the domain and range of a function.
Activities
A function is a pairing of each number in a given set with exactly one number in another set.
Starting with a number called an input, the function associates it with exactly one number called
an output. The set of all input values is called the domain of a function. The set of all output values
is called the range of a function.
1. Examples
A. What is the domain and range of the relation {(1, 3), (2, 6 ), (3, 9 ), (4, 12 )}?
domain = {1, 2, 3, 4}
range = {3, 6, 9, 12}
B. Complete the input–output table for the function y = 2 x − 4 .
Input x
Output y
–2
0
2
y = 2x − 4
y = 2(− 2 ) − 4
Substitute –2 for x.
y = −4 − 4
Simplify.
y = −8
y = 2x − 4
y = 2(0 ) − 4
Substitute 0 for x.
y = 0−4
Simplify.
y = −4
y = 2x − 4
y = 2(2 ) − 4
Substitute 2 for x.
y = 4−4
Simplify.
y=0
Input x
Output y
–2
0
2
–8
–4
0
Permission is granted to instructors to copy and distribute this work sheet for instructional purposes only. Copyright © 2005 PLATO Learning, Inc. All rights reserved. PLATO® is a
registered trademark of PLATO Learning, Inc. PLATO Learning is a trademark of PLATO Learning, Inc.
1
2. Practice
1. Make an input–output table for the function using the domain –4, –2, 0, 2, and 4. Then,
state the range of the function.
A. y = x + 5
B. y = −10 x
C. y = 3.2 x
D. y = 12 − 3x
A.
Input x
Output y
–4
–2
0
2
4
B.
Input x
Output y
–4
–2
0
2
4
C.
Input x
Output y
–4
–2
0
2
4
Input x
Input y
–4
–2
0
2
4
D.
Permission is granted to instructors to copy and distribute this work sheet for instructional purposes only. Copyright © 2005 PLATO Learning, Inc. All rights reserved. PLATO® is a
registered trademark of PLATO Learning, Inc. PLATO Learning is a trademark of PLATO Learning, Inc.
2
3. Making Connections
Boyle’s Law is a gas law that relates the volume and pressure of an ideal gas held at a constant
⎛1⎞
temperature. Boyle’s Law can be expressed as P = k ⎜ ⎟ , where P is pressure, V is volume, and
⎝V ⎠
atm
for a gas sample in a balloon.
k = 3,000
mL
A. Make an input–out table to show how the change in volume affects gas pressure.
Input V
(mL)
1,000
1,500
2,000
2,500
3,000
Output P
(atm)
B. According to Boyle’s Law, how does an increase in volume affect gas pressure?
Permission is granted to instructors to copy and distribute this work sheet for instructional purposes only. Copyright © 2005 PLATO Learning, Inc. All rights reserved. PLATO® is a
registered trademark of PLATO Learning, Inc. PLATO Learning is a trademark of PLATO Learning, Inc.
3
When you have completed this activity, go to Status Check.
Student Activity:
Algebra 1A
Unit 1
Identifying and Using Properties of
Operations on Real Numbers
Name _________________________________________
Date____________________________
Objectives
In this activity, you will learn and practice the commutative properties of addition and multiplication,
the associative properties of addition and multiplication, and the distributive property of multiplication
over addition.
Activities
Number Properties
Property
Type
Definition
Addition
The sum of two numbers is the same
regardless of the order of the addends.
When two numbers are multiplied together,
the product is the same regardless of the
order of the multiplicands.
Commutative
Multiplication
Addition
Associative
Multiplication
Distributive
Addition
Addition
Identity
Multiplication
When three or more numbers are added,
the sum is the same regardless of the order
of addition.
When three or more numbers are
multiplied, the product is the same
regardless of the order of multiplication.
The sum of two numbers times a third
number is equal to the sum of each addend
times the third number.
Example
5+8 = 8+5
9 × 3 = 3× 9
(4 + 2) + 7 = 4 + (2 + 7 )
(7 × 4) × 5 = 7 × (4 × 5)
2(4 + 8) = 2 × 4 + 2 × 8
The sum of any number and zero is that
number.
4+0 = 4
The product of any number and one is that
number.
2 ×1 = 2
Permission is granted to instructors to copy and distribute this work sheet for instructional purposes only. Copyright © 2005 PLATO Learning, Inc. All rights reserved. PLATO® is a
registered trademark of PLATO Learning, Inc. PLATO Learning is a trademark of PLATO Learning, Inc.
1
1. Practice
Match each property with its example.
__ 1. Commutative Property of
Multiplication
__ 2. Associative Property of Addition
__ 3. Multiplication Identity Property
__ 4. Distributive Property
__ 5. Associative Property of Multiplication
A. 3(4 + w) = 12 + 3w
B. 6 × 3 = 3 × 6
C. 7 + 0 = 7
D. (5 + 8) + 3 = 5 + (8 + 3)
E. 6 + 2 = 2 + 6
__ 6. Commutative Property of Addition
F. 9 × 1 = 9
__ 7. Additive Identity Property
G. 5 × (2 × 3) = (5 × 2 ) × 3
Permission is granted to instructors to copy and distribute this work sheet for instructional purposes only. Copyright © 2005 PLATO Learning, Inc. All rights reserved. PLATO® is a
registered trademark of PLATO Learning, Inc. PLATO Learning is a trademark of PLATO Learning, Inc.
2
2. Making Connections
A. Find the sum of 48, 89, 52, 11, and 36. Explain how the commutative and associative properties of
addition can help you find the sum using mental math.
______________________________________________________________________
______________________________________________________________________
______________________________________________________________________
______________________________________________________________________
______________________________________________________________________
______________________________________________________________________
B. Are 6ab and 4ba like terms? Explain your reasoning.
_____________________________________________________________________
_____________________________________________________________________
_____________________________________________________________________
_____________________________________________________________________
_____________________________________________________________________
_____________________________________________________________________
C. You order baseball caps with your team logo. Each cap costs $9.95. There is a design fee of $60.00
and an embroidery charge of $1.50 per cap. Write an expression to find the total cost of c baseball
caps. What is the total cost for 20 baseball caps? for 45 baseball caps?
Permission is granted to instructors to copy and distribute this work sheet for instructional purposes only. Copyright © 2005 PLATO Learning, Inc. All rights reserved. PLATO® is a
registered trademark of PLATO Learning, Inc. PLATO Learning is a trademark of PLATO Learning, Inc.
3
When you have completed this activity, go to Status Check.
Algebra 1A
Unit 3
Student Activity:
Finding x- and y-intercepts
of a Linear Equation
Name _________________________________________
Date____________________________
Objective
In this activity, you will learn to find the intercepts of a linear equation.
Activities
An intercept is the point in which the object that is being graphed crosses, or intersects, the x- or
y-axis, much like the intersection that you would find when two streets cross in a city or town.
The x-intercept of a graph is the x-coordinate of the point where the graph crosses the x-axis.
The y-intercept of a graph is the y-coordinate of the point where the graph crosses the y-axis.
To find the x-intercept of a line, substitute 0 for y in the equation and solve for x.
To find the y-intercept of a line, substitute 0 for x in the equation and solve for y.
Permission is granted to instructors to copy and distribute this work sheet for instructional purposes only. Copyright © 2005 PLATO Learning, Inc. All rights reserved. PLATO® is a
registered trademark of PLATO Learning, Inc. PLATO Learning is a trademark of PLATO Learning, Inc.
1
1. Example
Find the intercepts of the graph of y = 2x – 4.
To find the x-intercept,
let y = 0 and solve for x.
To find the y-intercept,
Let x = 0 and solve for y.
y = 2x – 4
0 = 2x – 4
4 = 2x
2=x
(2, 0)
y = 2x – 4
y = 2(0) – 4
y = –4
(0, –4)
Permission is granted to instructors to copy and distribute this work sheet for instructional purposes only. Copyright © 2005 PLATO Learning, Inc. All rights reserved. PLATO® is a
registered trademark of PLATO Learning, Inc. PLATO Learning is a trademark of PLATO Learning, Inc.
2
2. Practice
Find the intercepts of the graph of the equation.
1. y = 4 x − 2
2. x + 5 y = 10
3. 3x − 9 y = −27
4. y = 3x − 12
5. 6 x + 8 y = 24
6. y = −0.75 x + 3.0
7. y = 7
8. x = 3
9. y = 2 x − 6
3. Making Connections
An athlete runs cross country. After x minutes, the number of miles from the school y is given by
3x + 18y = 36. Find the intercepts. What do the intercepts represent?
Permission is granted to instructors to copy and distribute this work sheet for instructional purposes only. Copyright © 2005 PLATO Learning, Inc. All rights reserved. PLATO® is a
registered trademark of PLATO Learning, Inc. PLATO Learning is a trademark of PLATO Learning, Inc.
3
When you have completed this activity, go to Status Check.
Student Activity:
Algebra 1A
Unit 3
Slope-Intercept Form
Name _________________________________________
Date____________________________
Objective
In this activity, you will learn and apply the slope-intercept form of the equation of a line.
Activities
The slope-intercept form of the equation of a line with slope m and y-intercept b is
y = mx + b
1. Examples
A. Find the slope and y-intercept of the line 3x + 4 y = 12 .
Using the original
equation,
3x + 4 y = 12
subtract 3x from
both sides.
− 3x
Now the equation
is in
y = mx + b
Form.
4 y = −3x + 12
Divide by 4
4y
3x 12
=−
+
4
4
4
to solve for y.
y=−
− 3x
3
x+3
4
3
The slope of the line is − , and the y-intercept is 3.
4
Permission is granted to instructors to copy and distribute this work sheet for instructional purposes only. Copyright © 2005 PLATO Learning, Inc. All rights reserved. PLATO® is a
registered trademark of PLATO Learning, Inc. PLATO Learning is a trademark of PLATO Learning, Inc.
1
B. Find the equation of the line with a slope of 3 and a y-intercept of 1.
The slope of the line is 3, so m = 3; the y-intercept 1, so b = 1.
Substituting into y = mx + b , we obtain y = 3x + 1 for the equation of the line.
C. Graph linear equations using the slope-intercept form.
Linear equations can easily be graphed using the slope-intercept form. In example B, the slope
is 3 and the y-intercept is 1. Therefore, beginning with the ordered pair (0, 1), the line can be
easily graphed using the slope.
The slope can be read, on the right side of the y-intercept, as rising 3 units on the y-axis and
moving to the right 1 unit on the x-axis; or, on the left side of the y-intercept, moving to the left 1
unit on the x-axis and falling 3 units on the y-axis.
Permission is granted to instructors to copy and distribute this work sheet for instructional purposes only. Copyright © 2005 PLATO Learning, Inc. All rights reserved. PLATO® is a
registered trademark of PLATO Learning, Inc. PLATO Learning is a trademark of PLATO Learning, Inc.
2
2. Practice
A. Find the slope and y-intercept of the following equations:
1. y = 3x − 3
2. 4 x + 5 y = −9
3. x − 4 y = 9
4. 2 x − 3 y = 6
B. Graph x + 2y = 6 using the slope-intercept form.
3. Making Connections
If points pass through or lie on the same straight line, they are said to be collinear. Determine
whether the given 3 points are collinear.
A. (1, 5), (–2, –1), and (–3, –4)
B. (0, 3), (1, 1), and (2, –1)
Permission is granted to instructors to copy and distribute this work sheet for instructional purposes only. Copyright © 2005 PLATO Learning, Inc. All rights reserved. PLATO® is a
registered trademark of PLATO Learning, Inc. PLATO Learning is a trademark of PLATO Learning, Inc.
3
When you have completed this activity, go to Status Check.
Student Activity:
Algebra 1A
Unit 3
Point-Slope Form
Name _________________________________________
Date____________________________
Objective
In this activity, you will learn and apply the point-slope form of the equation of a line.
Activities
The Point-Slope Form of an equation is the nonvertical line that passes through a given point (x, y)
with a slope of m is
y – y1 = m(x – x1)
1. Example
A. Write an equation in point-slope form of a line that passes through the point (1, –2) and has a
2
slope of − then rewrite the equation in slope-intercept form.
3
y − y1 = m( x − x1 )
2
y − (−2) = − ( x − 1)
3
2
y + 2 = − ( x − 1)
3
2
2
y+2=− x+
3
3
2
4
y=− x−
3
3
Substitute for m, x1, and y1.
Simplify (point-slope form).
Use distributive property.
Subtract 2 from each side (slope-intercept form).
Write in point-slope form.
Permission is granted to instructors to copy and distribute this work sheet for instructional purposes only. Copyright © 2005 PLATO Learning, Inc. All rights reserved. PLATO® is a
registered trademark of PLATO Learning, Inc. PLATO Learning is a trademark of PLATO Learning, Inc.
1
B. Write the equation of the line shown.
First, find the slope:
m=
y 2 − y1
2 −1
1
=
=
x 2 − x1 1 − (−1) 2
Then, use the slope and either point to write the point-slope form:
y − y1 = m( x − x1 )
1
y − 2 = ( x − 1)
2
1
1
y − 2 = (x − )
2
2
1
3
y= x+
2
2
Write in point-slope form.
Substitute for m, x1, and y1.
Use distributive property.
Add 2 to each side (point-slope form).
2. Practice
Write the point-slope form of the equation of the line that passes through the point and has the
given slope. Then rewrite the equation in slope-intercept form.
A. (1, 3), m = 2
B. (–6, 5), m =
1
3
Permission is granted to instructors to copy and distribute this work sheet for instructional purposes only. Copyright © 2005 PLATO Learning, Inc. All rights reserved. PLATO® is a
registered trademark of PLATO Learning, Inc. PLATO Learning is a trademark of PLATO Learning, Inc.
2
Write an equation of the line.
C.
D.
Permission is granted to instructors to copy and distribute this work sheet for instructional purposes only. Copyright © 2005 PLATO Learning, Inc. All rights reserved. PLATO® is a
registered trademark of PLATO Learning, Inc. PLATO Learning is a trademark of PLATO Learning, Inc.
3
3. Making Connections
A line contains the points (a, b ) and (a + 3, b + 3) . Find the slope of the line.
Permission is granted to instructors to copy and distribute this work sheet for instructional purposes only. Copyright © 2005 PLATO Learning, Inc. All rights reserved. PLATO® is a
registered trademark of PLATO Learning, Inc. PLATO Learning is a trademark of PLATO Learning, Inc.
4
When you have completed this activity, go to Status Check.
Algebra 1A
Unit 3
Student Activity:
Parallel and Perpendicular Lines
and Their Slopes
Name _________________________________________
Date____________________________
Objective
In this activity, you will learn the relationship between parallel lines and perpendicular lines and
their slopes.
Activities
Two lines are parallel if they do not intersect in the same plane. Parallel lines have the same
slope.
Two lines are perpendicular if their slopes are negative reciprocals of each other. (A vertical line and
a horizontal line in the same plane are also perpendicular.)
Permission is granted to instructors to copy and distribute this work sheet for instructional purposes only. Copyright © 2005 PLATO Learning, Inc. All rights reserved. PLATO® is a
registered trademark of PLATO Learning, Inc. PLATO Learning is a trademark of PLATO Learning, Inc.
1
1. Examples
A. Show that the line through the points A (3, 3) and B (6, –3) is perpendicular to the line through
the points C (4, 2) and D (8, 4).
( )
( )
4−2 2 1
−3−3 −6
and slope CD =
= =
=
= −2
8−4 4 2
6−3
3
⎛1⎞
Since (− 2)⎜ ⎟ = −1 , the lines AB and CD are perpendicular.
⎝2⎠
slope AB =
B. Decide whether the graphs of the two equations y = −5 x + 3 and 5 x + y = 9 are parallel lines.
Explain your answer.
Place both equations in slope-intercept form. (Since y = −5 x + 3 is already in the appropriate
form you only have to place 5 x + y = 9 in slope-intercept form.)
Begin with original equation:
Subtract 5 x from both sides:
5x + y = 9
y = −5 x + 9
The lines are parallel. They both have a slope of –5.
C. Graph the line that goes through point (–3, 1) and is parallel to the line whose equation
is y = −2 x + 5 .
Graph the equation y = −2 x + 5 . (The equation is already in slope-intercept form.)
The slope is –2 and the y-intercept is 5.
Permission is granted to instructors to copy and distribute this work sheet for instructional purposes only. Copyright © 2005 PLATO Learning, Inc. All rights reserved. PLATO® is a
registered trademark of PLATO Learning, Inc. PLATO Learning is a trademark of PLATO Learning, Inc.
2
2. Practice
A. Graph the line that goes through point (3, 8) and is parallel to the line whose equation
is 6 y − 10 x = 30 .
Permission is granted to instructors to copy and distribute this work sheet for instructional purposes only. Copyright © 2005 PLATO Learning, Inc. All rights reserved. PLATO® is a
registered trademark of PLATO Learning, Inc. PLATO Learning is a trademark of PLATO Learning, Inc.
3
B. Fill in the blank.
Determine if the line containing points A and B is perpendicular, parallel, or neither to the line
containing points C and D.
1. A (5, 1), B (2, –1), C (8,1), and D (2, 3)
2. A (–4, –4), B (0, –1), C (2, –3), and D (–4, 5)
3. A (4, 0), B (1, 9), C (5, 3), and D (0, 6)
4. A (4, –3), B (5, 1), C (2, 4), and D (3, 8)
Permission is granted to instructors to copy and distribute this work sheet for instructional purposes only. Copyright © 2005 PLATO Learning, Inc. All rights reserved. PLATO® is a
registered trademark of PLATO Learning, Inc. PLATO Learning is a trademark of PLATO Learning, Inc.
4
3. Making Connections
The graphs y = 2 x + 1 and 2 y + x = 2 contain 2 sides of a rectangle. If 1 vertex of the rectangle
has coordinates (6, 3), draw the rectangle.
Permission is granted to instructors to copy and distribute this work sheet for instructional purposes only. Copyright © 2005 PLATO Learning, Inc. All rights reserved. PLATO® is a
registered trademark of PLATO Learning, Inc. PLATO Learning is a trademark of PLATO Learning, Inc.
5
When you have completed this activity, go to Status Check.
Algebra 1A
Unit 4
Student Activity:
Approximating
a Line of Best Fit
Name _________________________________________
Date____________________________
Objective
In this activity, you will learn to approximate the line of best fit for a scatter plot.
Activities
When real world data is plotted, it often forms a scatter plot instead of a straight line. Sometimes a
trend can be found from the data in a scatter plot. We can approximate a line of best fit to
determine that trend. If a value needs to be found outside the scatter plot we extend the
approximated line of best fit to find that value.
Step 1. Prepare a scatter plot of the data.
Use the real-world data and place them on a coordinate plane.
Step 2. Estimate a line of best fit.
Use a clear ruler and position the straight edge so that the plotted points are as close to the
straight edge as possible.
Step 3. Determine 2 points on the line of best fit.
Find 2 points that are either on or closest to the line of best fit.
Step 4. Calculate the slope.
Find the slope of the line for the 2 points that you have chosen.
Step 5. Write an equation for the line.
Write an approximate equation for the line of best fit using 1 of the points and the slope.
Step 6. Predict data that was not plotted using the line of best fit.
Extrapolate data that are not found in the original data set by using the equation for the line
of best fit.
Permission is granted to instructors to copy and distribute this work sheet for instructional purposes only. Copyright © 2005 PLATO Learning, Inc. All rights reserved. PLATO® is a
registered trademark of PLATO Learning, Inc. PLATO Learning is a trademark of PLATO Learning, Inc.
1
1. Example
The data in the table show the practice time before each game and the corresponding successful
free throws that Joe made during the game.
A. Graph the data and draw a line that corresponds closely to the data.
B. Write an equation of your line.
C. Predict the approximate number of free throws that Joe should make if he practiced 4 hours.
Hours of
Practice
0.50
0.75
1.00
1.25
1.50
1.75
2.00
2.25
2.50
2.75
3.00
Number of
Successful
Free Throws
1
1
2
3
3
4
3
4
4
5
6
Step 1. Prepare a scatter plot of the data.
Permission is granted to instructors to copy and distribute this work sheet for instructional purposes only. Copyright © 2005 PLATO Learning, Inc. All rights reserved. PLATO® is a
registered trademark of PLATO Learning, Inc. PLATO Learning is a trademark of PLATO Learning, Inc.
2
Step 2. Estimate a line of best fit.
Step 3. Determine 2 points on the line of best fit.
(1, 2) and (2.75, 5)
Step 4. Calculate the slope.
5−2
3
=
≈ 1.71
2.75 − 1 1.75
Step 5. Write an equation for the line.
y − y1 = m( x − x1 )
y − 2 = 1.71( x − 1)
y − 2 = 1.71x − 3.42
y = 1.71x − 1.42
Permission is granted to instructors to copy and distribute this work sheet for instructional purposes only. Copyright © 2005 PLATO Learning, Inc. All rights reserved. PLATO® is a
registered trademark of PLATO Learning, Inc. PLATO Learning is a trademark of PLATO Learning, Inc.
3
Step 6. Predict data that were not plotted using the line of best fit.
If Joe practices for a total of 4 hours, how many free throws should he expect to make in
the next game?
y = 1.71x − 1.42
y = 1.71( 4 ) − 1.42
y = 5.42
Joe should expect to make about 5 free throws.
2. Practice
Use the information provided below to complete these tasks:
A. Graph the data and draw a line that corresponds closely to the data.
B. Write an equation of your line.
C. Based upon your line of best fit, predict the price of 12 bushels of pluots.
Farmers sometimes add a newly created hybrid fruit to their fields to increase revenue. The
pluot (a smooth-skinned genetic cross between a plum and an apricot) was introduced to the
home garden market in 1989 and is a very popular hybrid fruit today. Shady Hills has recently
added pluots to its fields. This table shows the price per bushel based upon volume sold.
Bushels
Sold
0.5
1.0
2.0
3.0
4.0
5.0
6.0
7.0
8.0
9.0
Price
(dollar per bushel)
42
40
39
37
36
34
33
31
30
28
Permission is granted to instructors to copy and distribute this work sheet for instructional purposes only. Copyright © 2005 PLATO Learning, Inc. All rights reserved. PLATO® is a
registered trademark of PLATO Learning, Inc. PLATO Learning is a trademark of PLATO Learning, Inc.
4
3. Making Connections
A. Tabitha grew daisies for her science project. She studied the relationship between the number
of times (t) she watered the plants each week and their height (h) in centimeters. The
prediction equation for Tabitha’s experiment is h = 0.25t + 0.4 . Using the equation for the line of
best fit, predict the height of each plant after a specified number of waterings.
1. 3 waterings
2. 6 waterings
3. 10 waterings
4. 15 waterings
B. Explain how to select a pair of points to find a line that approximates the line of best fit.
Permission is granted to instructors to copy and distribute this work sheet for instructional purposes only. Copyright © 2005 PLATO Learning, Inc. All rights reserved. PLATO® is a
registered trademark of PLATO Learning, Inc. PLATO Learning is a trademark of PLATO Learning, Inc.
5
When you have completed this activity, go to Status Check.
Algebra 1A
Unit 4
Student Activity:
Using the Distance Formula in
Linear Relations and Systems
Name _________________________________________
Date____________________________
Objective
In this activity, you will apply the distance formula to linear relations.
Activities
The distance formula was derived from the Pythagorean theorem, a 2 + b 2 = c 2 as shown in this
diagram.
The distance d between the points (x1, y1) and (x2, y2) is
d=
(x 2 − x1 )2 + ( y 2 − y1 )2
Permission is granted to instructors to copy and distribute this work sheet for instructional purposes only. Copyright © 2005 PLATO Learning, Inc. All rights reserved. PLATO® is a
registered trademark of PLATO Learning, Inc. PLATO Learning is a trademark of PLATO Learning, Inc.
1
1. Examples
A. Find the distance between (3, 2) and (6, 6).
d=
d=
d=
(x 2 − x1 )2 + ( y 2 − y1 )2
(6 − 3)2 + (6 − 2)2
(3)2 + (4)2
d = 9 + 16
d = 25
d =5
Write the distance formula.
Substitute.
Simplify.
Simplify.
Simplify.
Simplify.
B. Find the distance between (2, –4) and (5, 6).
d=
d=
d=
(x 2 − x1 )2 + ( y 2 − y1 )2
(5 − 2)2 + (6 − (−4) )2
(3)2 + (10)2
d = 9 + 100
d = 109
d ≈ 10.44
Write the distance formula.
Substitute.
Simplify.
Simplify.
Simplify.
Use a calculator to approximate.
2. Practice
Use the distance formula to find the distance between each pair of points.
A. (3, 7), (7, 7)
B. (9, 2), (10, 4)
C. (5, 3), (8, 3)
D. (7, 3), (6, 2)
E. (2, 0), (8, 4)
F. (3, 1), (7, 6)
G. (1, 5), (0, 5)
H. (0, 3), (5, 5)
Permission is granted to instructors to copy and distribute this work sheet for instructional purposes only. Copyright © 2005 PLATO Learning, Inc. All rights reserved. PLATO® is a
registered trademark of PLATO Learning, Inc. PLATO Learning is a trademark of PLATO Learning, Inc.
2
3. Making Connections
Dave walked 2 miles north and 3 miles east. Starting from the same point, Sandra walked 2 miles
south and 3 miles east. How far apart are Dave and Sandra? (Hint: draw a diagram.)
Permission is granted to instructors to copy and distribute this work sheet for instructional purposes only. Copyright © 2005 PLATO Learning, Inc. All rights reserved. PLATO® is a
registered trademark of PLATO Learning, Inc. PLATO Learning is a trademark of PLATO Learning, Inc.
3
When you have completed this activity, go to Status Check.
Algebra 1A
Unit 4
Student Activity:
Using the Midpoint Formula
in Linear Relations
Name _________________________________________
Date____________________________
Objective
In this activity, you will apply the midpoint formula to linear relations.
Activities
The midpoint of a line segment is found halfway between its endpoints; therefore it divides the
segment into 2 equal parts.
The midpoint between (x1, y1) and (x2, y2) is
(x , y ) = ⎛⎜ x1 + x 2 , y 1 +
⎝
2
y2 ⎞
⎟
2
⎠
1. Examples
Find the midpoint of each line segment whose endpoints are given.
A. (4, 6), (6, –2)
⎛ x1 + x 2 y1 + y 2 ⎞
,
⎜
⎟ = ( x, y )
2 ⎠
⎝ 2
Write the midpoint equation.
⎛4+6 6−2⎞
,
⎜
⎟ = ( x, y )
2 ⎠
⎝ 2
Substitute.
⎛ 10 4 ⎞
⎜ , ⎟ = (5, 2)
⎝ 2 2⎠
Simplify.
B. (–4, –5), (–6, –7)
⎛ x1 + x 2 y1 + y 2 ⎞
,
⎜
⎟ = ( x, y )
2 ⎠
⎝ 2
⎛ − 4 + (−6) − 5 + (−7) ⎞
,
⎜
⎟ = ( x, y )
2
2
⎝
⎠
⎛ − 10 − 12 ⎞
,
⎜
⎟ = (–5, – 6)
2 ⎠
⎝ 2
Write the midpoint equation.
Substitute.
Simplify.
Permission is granted to instructors to copy and distribute this work sheet for instructional purposes only. Copyright © 2005 PLATO Learning, Inc. All rights reserved. PLATO® is a
registered trademark of PLATO Learning, Inc. PLATO Learning is a trademark of PLATO Learning, Inc.
1
2. Practice
Find the midpoint of each line segment whose endpoints are given.
A. (3, 7), (7, 7)
B. (8, 1), (2, 3)
C. (7, 5), (5, –9)
D. (0, –6), (–4, 2)
E. (–7, 4), (–3, 6)
F. (–2, –4), (8, 2)
G. (–5, –3), (–7, –1)
H. (–8, 0), (0, –8)
Permission is granted to instructors to copy and distribute this work sheet for instructional purposes only. Copyright © 2005 PLATO Learning, Inc. All rights reserved. PLATO® is a
registered trademark of PLATO Learning, Inc. PLATO Learning is a trademark of PLATO Learning, Inc.
2
3. Making Connections
A. Is a point that is equidistant from two points always the midpoint of the segment between
them? Explain your answer?
B. Could you find one endpoint of a segment given the other endpoint and the midpoint? If so,
demonstrate by finding the endpoint of the segment with one endpoint (–4, 7) and (2, 5) as a
midpoint.
C. Laura works in the Quality Assurance department of a Compact Disc (CD) manufacturing
company. If the CD is 120 mm in diameter and the hole is 17 mm, how far from the edge of the
CD should the edge of the hole be located?
Permission is granted to instructors to copy and distribute this work sheet for instructional purposes only. Copyright © 2005 PLATO Learning, Inc. All rights reserved. PLATO® is a
registered trademark of PLATO Learning, Inc. PLATO Learning is a trademark of PLATO Learning, Inc.
3
When you have completed this activity, go to Status Check.
Algebra 1A
Unit 4
Student Activity:
Graphing Linear Inequalities
in 2 Variables
Name _________________________________________
Date____________________________
Objective
In this activity, you will learn and practice graphing linear inequalities in 2 variables.
Activities
A linear inequality in x and y is an inequality that can be written ax + by ≤ c , ax + by ≥ c , ax + by < c ,
and ax + by > c . An ordered pair (x, y) is a solution of a linear inequality if the inequality is true when
the values of x and y are substituted into the inequality. There are several steps involved in
graphing linear inequalities.
1. Graph the Boundary Line
(Pretend that there is an equals sign and then graph using any appropriate method to graph the
line.) The boundary line separates the rectangular coordinate system into half-planes; 1 half-plane
will make the inequality true and be its solution.
Solid Boundary Line
If the equation contains a < or > sign, a solid boundary line must be used due to the equals sign
being present.
Dashed Boundary Line
If the equation contains a < or > sign (no equals sign present), then a dashed line is used to
represent the boundary.
2. Plug in a Test Point that Is Not on the Boundary Line
Pick a point on either side of the boundary line and plug it into the original problem. (This will help
to determine which side of the boundary line is the solution.)
3. Shade the Solutions
If the test point is a solution, shade the half-plane that contains the test point.
If the test point is not a solution, shade the other half-plane.
Permission is granted to instructors to copy and distribute this work sheet for instructional purposes only. Copyright © 2005 PLATO Learning, Inc. All rights reserved. PLATO® is a
registered trademark of PLATO Learning, Inc. PLATO Learning is a trademark of PLATO Learning, Inc.
1
4. Example
Graph x + y ≤ 3 .
Step 1. Graph the boundary line.
To graph the boundary line, represent the inequality with the equation x + y = 3 , and use
the x- and y-intercepts to help graph the line.
Because the value of y on the x-intercept is 0, and x + 0 = 3 , then x = 3 .
The x-intercept is (3, 0).
Because the value of x on the y-intercept is 0, and 0 + y = 3 , then y = 3 .
The x-intercept is (0, 3).
The boundary line can be represented by:
The boundary line is solid because the inequality in the original equation is <.
As you can see, the boundary line divides the graph into half-planes.
Step 2. Plug in a test point that is not on the boundary line.
A simple test point is (0, 0). It is a point that is not on the boundary line.
Permission is granted to instructors to copy and distribute this work sheet for instructional purposes only. Copyright © 2005 PLATO Learning, Inc. All rights reserved. PLATO® is a
registered trademark of PLATO Learning, Inc. PLATO Learning is a trademark of PLATO Learning, Inc.
2
Step 3. Shade the solutions.
x+ y ≤3
0+0≤3
true
0≤3
Because the test point (0, 0) is a solution, shade the region that contains the test point.
5. Guided Practice
Graph each inequality.
A. Graph y − 2 x ≤ 1 .
B. Graph x − y > −4 .
Permission is granted to instructors to copy and distribute this work sheet for instructional purposes only. Copyright © 2005 PLATO Learning, Inc. All rights reserved. PLATO® is a
registered trademark of PLATO Learning, Inc. PLATO Learning is a trademark of PLATO Learning, Inc.
3
(For help with guided practice, please review the last 2 pages of this handout).
6. Practice
Find which ordered pairs from a given set are part of the solution set for the inequality.
Problem A. y > 4 x
{(–2, –8) (0, 0) (2, 10) (3, 12)}
Problem B. 2 y + 3x ≤ 9
{(–1, 8) (0, 0) (2, 2) (3, 2)}
Graph each inequality.
C. 3x – y < 2
D. y – 2x < 1
E. y < 3x – 1
F. y > 2x – 1
Permission is granted to instructors to copy and distribute this work sheet for instructional purposes only. Copyright © 2005 PLATO Learning, Inc. All rights reserved. PLATO® is a
registered trademark of PLATO Learning, Inc. PLATO Learning is a trademark of PLATO Learning, Inc.
4
Permission is granted to instructors to copy and distribute this work sheet for instructional purposes only. Copyright © 2005 PLATO Learning, Inc. All rights reserved. PLATO® is a
registered trademark of PLATO Learning, Inc. PLATO Learning is a trademark of PLATO Learning, Inc.
5
7. Making Connections
Tickets prices for a production sponsored by the drama club are $5.00 for adults and $3.00 for
students. To cover the expenses for the concert, a total of $150.00 must be made from ticket
sales. Use a graph to determine how many of each type of ticket must be sold to cover the
expenses.
Determine the maximum number of tickets that must be sold if only adults attend.
Determine the maximum number of tickets that must be sold if only students attend.
Permission is granted to instructors to copy and distribute this work sheet for instructional purposes only. Copyright © 2005 PLATO Learning, Inc. All rights reserved. PLATO® is a
registered trademark of PLATO Learning, Inc. PLATO Learning is a trademark of PLATO Learning, Inc.
6
8. Guided Practice
Problem A
Step 1. Graph the boundary line by making a table of ordered pairs.
By inserting –1, 0, and 1 in for x the following ordered pairs are then obtained:
(–1, –1), (0, 1), and (1, 3)
The boundary line is solid.
y − 2x ≤ 1
Step 2. Using (0, 0) as the test point, 0 − 2(0) ≤ 1 true
0 ≤1
Step 3. Because the test point is true, shade the region that contains the test point.
Permission is granted to instructors to copy and distribute this work sheet for instructional purposes only. Copyright © 2005 PLATO Learning, Inc. All rights reserved. PLATO® is a
registered trademark of PLATO Learning, Inc. PLATO Learning is a trademark of PLATO Learning, Inc.
7
Problem B
Step 1. Graph the boundary line by finding the x- and y- intercepts.
The boundary line is dashed.
x − y > −4
Step 2. Using (0, 0) as the test point, 0 − 0 > −4
0−4
true
Step 3. Because the test point is true, shade the region that contains the test point.
Permission is granted to instructors to copy and distribute this work sheet for instructional purposes only. Copyright © 2005 PLATO Learning, Inc. All rights reserved. PLATO® is a
registered trademark of PLATO Learning, Inc. PLATO Learning is a trademark of PLATO Learning, Inc.
8
When you have completed this activity, go to Status Check.
Algebra 1A
Unit 4
Student Activity:
Solving Systems of Linear
Inequalities by Graphing
Name _________________________________________
Date____________________________
Objective
In this activity, you will learn to solve a system of inequalities by graphing.
Activities
A System of Linear Inequalities is a system made up of 2 or more linear inequalities.
x+ y≥4
inequality 1
2x − y < 3
inequality 2
A solution of a system of linear inequalities in an ordered pair is a solution of each inequality in the
system. The graph of a system of linear inequalities is the graph of all solutions of the system. If you
have difficulty recalling the basics of graphing inequalities, review the Graphing Linear Inequalities in
Two Variables lesson.
1. Graphing a System of Linear Inequalities
Step 1. Graph the line that corresponds to each inequality. Use a dashed line for an inequality with
< or > and a solid line for an inequality with ≤ or ≥.
Step 2. Lightly shade the half-plane for each inequality.
Step 3. The region that is common to all half-planes is the solution of the system.
Permission is granted to instructors to copy and distribute this work sheet for instructional purposes only. Copyright © 2005 PLATO Learning, Inc. All rights reserved. PLATO® is a
registered trademark of PLATO Learning, Inc. PLATO Learning is a trademark of PLATO Learning, Inc.
1
2. Example
Graph the system:
y>x
y<3
Step 1. Graph each inequality.
Step 2. Lightly shade each half-plane.
Permission is granted to instructors to copy and distribute this work sheet for instructional purposes only. Copyright © 2005 PLATO Learning, Inc. All rights reserved. PLATO® is a
registered trademark of PLATO Learning, Inc. PLATO Learning is a trademark of PLATO Learning, Inc.
2
Step 3. Graph the solution (common region).
Permission is granted to instructors to copy and distribute this work sheet for instructional purposes only. Copyright © 2005 PLATO Learning, Inc. All rights reserved. PLATO® is a
registered trademark of PLATO Learning, Inc. PLATO Learning is a trademark of PLATO Learning, Inc.
3
3. Practice
Solve the systems of inequalities graphically.
A.
y>4
x≤2
B.
y< x+2
y≥5
C.
y < x+2
D.
y < −x + 4
B.
A.
C.
x+ y > 5
− 2x + y > 3
D.
Permission is granted to instructors to copy and distribute this work sheet for instructional purposes only. Copyright © 2005 PLATO Learning, Inc. All rights reserved. PLATO® is a
registered trademark of PLATO Learning, Inc. PLATO Learning is a trademark of PLATO Learning, Inc.
4
4. Making Connections
Graph the system:
− 2x + y ≥ 6
2x + 2 ≤ y
Discuss the difference in the shaded regions compared to the practice problems.
Permission is granted to instructors to copy and distribute this work sheet for instructional purposes only. Copyright © 2005 PLATO Learning, Inc. All rights reserved. PLATO® is a
registered trademark of PLATO Learning, Inc. PLATO Learning is a trademark of PLATO Learning, Inc.
5
When you have completed this activity, go to Status Check.
Algebra 1A
Unit 4
Student Activity:
Creating and Interpreting
Stem-and-Leaf Plots
Name _________________________________________
Date____________________________
Objective
In this activity, you will learn to display and interpret data on a stem and leaf plot.
Activities
Data can be shown in a variety of ways including tables, charts, and graphs. When a large amount of
data needs to be displayed, a Stem and Leaf Plot is an organized method to display it. Stem and Leaf
Plots summarize the shape of a set of data (distribution) and provide details about individual values.
Data in a Stem and Leaf Plot are arranged by place value. The leaf is the digit farthest to the right in a
number, while the stem is represented by the number or numbers to the left of the leaf.
1. Example
Thirty-two students are in your art class. After the first semester exam, your teacher wants to
determine quickly the highest and lowest scores on the test, the most frequently occurring test score,
and the number of students who received a score of 75 or better.
84
89
68
91
87
92
76
82
Art I Exam Scores
95
74
52
89
77
92
71
58
89
72
64
83
75
52
98
98
63
86
99
89
76
69
85
70
To make a Stem and Leaf Plot, place all the scores in order from least to greatest.
52
52
58
63
64
68
69
70
Art I Exam Scores
71
83
72
84
74
85
75
86
76
87
76
89
77
89
82
89
89
91
92
92
98
98
98
99
Permission is granted to instructors to copy and distribute this work sheet for instructional purposes only. Copyright © 2005 PLATO Learning, Inc. All rights reserved. PLATO® is a
registered trademark of PLATO Learning, Inc. PLATO Learning is a trademark of PLATO Learning, Inc.
1
Place the data in a Stem and Leaf Plot with a legend.
represents
the tens place
represents
the ones
place
Based upon this example, answer the questions that follow.
A. What are the highest and lowest scores on the test?
B. What is the most frequently occurring test score?
C. In what 10-point interval did most students score?
D. How many students received a score of 75 or better?
Permission is granted to instructors to copy and distribute this work sheet for instructional purposes only. Copyright © 2005 PLATO Learning, Inc. All rights reserved. PLATO® is a
registered trademark of PLATO Learning, Inc. PLATO Learning is a trademark of PLATO Learning, Inc.
2
2. Practice
Each number below represents the number of points that Caroline scored during each volleyball
match during the 2004 club season.
Points Caroline Scored Per Match
12
10
19
7
11
23
27
21
13
17
15
10
24
13
29
9
10
10
14
17
18
17
28
8
18
9
11
17
15
9
16
11
11
9
18
16
12
17
19
7
A. Make a Stem and Leaf Plot of this data.
Solution
Permission is granted to instructors to copy and distribute this work sheet for instructional purposes only. Copyright © 2005 PLATO Learning, Inc. All rights reserved. PLATO® is a
registered trademark of PLATO Learning, Inc. PLATO Learning is a trademark of PLATO Learning, Inc.
3
B. What is the range of the points Caroline scored during each match of the season?
C. What is the mean for the points she scored per match during the season?
D. What is the median of the points Caroline scored?
E. What is the mode of the data?
3. Making Connections
This Stem-and-Leaf Plot shows Mark’s test scores on his last 9 tests.
A. What is the lowest grade that Mark can receive on the next test for his mean test score to be
83 or higher? (Assume no rounding in the average.)
B. Assuming that Mark’s grade on his 10th test satisfies the requirements in part A, what is the
new median of Mark’s test scores?
Permission is granted to instructors to copy and distribute this work sheet for instructional purposes only. Copyright © 2005 PLATO Learning, Inc. All rights reserved. PLATO® is a
registered trademark of PLATO Learning, Inc. PLATO Learning is a trademark of PLATO Learning, Inc.
4
When you have completed this activity, go to Status Check.
Algebra 1A
Unit 4
Student Activity:
Creating and Interpreting
Box-and-Whisker Plots
Name _________________________________________ Date ____________________________
Objective
In this activity, you will learn to display and interpret data in a box-and-whisker plot.
Link
http://www.cdc.gov/nchs/data/nvsr/nvsr54/nvsr54_02.pdf
Activity
A box-and-whisker plot is a data display that divides a set of data into four parts. The median, or
second quartile, separates the set into two halves. The first quartile is the median of the lower half.
While the third quartile is the median of the upper half.
1. Example
Micah created a Stem and Leaf Plot for his gasoline purchases over a 3-month period. These
data can be used to display a box-and-whisker plot.
A. Find the first, second, and third quartiles of the data.
First, find the second quartile (median) and then find the first and third quartiles.
Permission is granted to instructors to copy and distribute this work sheet for instructional purposes only. Copyright © 2005 PLATO Learning, Inc. All rights reserved. PLATO® is a
registered trademark of PLATO Learning, Inc. PLATO Learning is a trademark of PLATO Learning, Inc.
1
B. Draw a box-and-whisker plot of the data.
2. Practice
A warehouse club tracked the prices of all bracelets sold on Valentine’s Day. Use these data,
in dollars, to answer the questions that follow.
180, 240, 320, 251, 117, 150, 124, 116, 126, 124,
116, 126, 124, 251, 327, 355, 210, 198, 142, 178
A. Make a box-and-whisker plot of the data.
B. What is the median price for all the bracelets sold?
C. What is the median price of the lower half of the sales?
D. What is the median price of the upper half of the sales?
Permission is granted to instructors to copy and distribute this work sheet for instructional purposes only. Copyright © 2005 PLATO Learning, Inc. All rights reserved. PLATO® is a
registered trademark of PLATO Learning, Inc. PLATO Learning is a trademark of PLATO Learning, Inc.
2
3. Making Connections
Open the preceding Centers for Disease Control link and go to page 21, Table J, to peruse the
data for multiple births occurring between 1980 and 2003. Answer the questions that follow,
using the data in column two labeled “Twins.” Place your answers in a scale of 10,000.
A. Make a box-and-whisker plot of the data.
B. What is the median number of twins born between 1980 and 2003?
C. What is the value for the upper quartile (to the nearest whole number)?
D. What is the value for the lower quartile?
Permission is granted to instructors to copy and distribute this work sheet for instructional purposes only. Copyright © 2005 PLATO Learning, Inc. All rights reserved. PLATO® is a
registered trademark of PLATO Learning, Inc. PLATO Learning is a trademark of PLATO Learning, Inc.
3
When you have completed this activity, go to Status Check.
Algebra 1A
Unit 4
Student Activity:
Creating and Interpreting
Circle Graphs
Name _________________________________________
Date____________________________
Objective
In this activity, you will learn to create and interpret circle graphs.
Activities
A circle graph displays data as sections of a circle. The entire circle represents all the data. Each
section is labeled using the actual data or using the data expressed as fractions, decimals, or
percentages of the sum of the data.
To make a circle graph, you need to find the appropriate angle measure for each section. The
sum of all the angle measures must equal 360o.
1. Examples
A. Your school cafeteria took a survey to find out what most students like to eat for lunch.
Display the data in this table in a circle graph.
Favorite Food
pizza
cheeseburgers
tacos
hot dogs
salad bar
Percent
40
30
5
5
20
1. Find the angle measure for each section.
pizza
40% of 360o = 144o
cheeseburgers 30% of 360o = 108o
tacos
5% of 360o = 18o
hot dogs
5% of 360o = 18o
salad bar
20% of 360o = 72o
2. Draw a circle using a compass.
Permission is granted to instructors to copy and distribute this work sheet for instructional purposes only. Copyright © 2005 PLATO Learning, Inc. All rights reserved. PLATO® is a
registered trademark of PLATO Learning, Inc. PLATO Learning is a trademark of PLATO Learning, Inc.
1
3. Use a protractor to draw the angle measuring 144o. Then, label the section “Pizza 40%”.
Pizza 40%
4. Draw and label the remaining sections.
5.
Write a title for the graph.
Favorite Cafeteria Food
Permission is granted to instructors to copy and distribute this work sheet for instructional purposes only. Copyright © 2005 PLATO Learning, Inc. All rights reserved. PLATO® is a
registered trademark of PLATO Learning, Inc. PLATO Learning is a trademark of PLATO Learning, Inc.
2
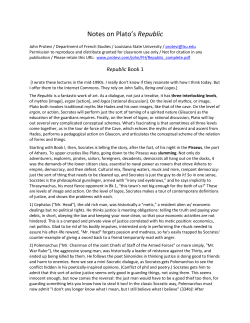
B. Use this circle graph about how students arrive at school each day to answer the questions
that follow.
How Students Arrive at School
1. What is the common form of transportation for the students?
The greatest percentage of the circle graph is represented by car, so the most common
form of transportation is cars.
2. What percentage of the students does not ride public transportation?
To determine the number of students that do not use public transportation, subtract the
percentage that use public transportation from 100%.
100 % − 20 % = 80 %
Eighty percent of the students do not use public transportation.
3. Do more students walk or ride their bikes to school?
More students walk (20%) as opposed to riding their bicycles (5%).
Permission is granted to instructors to copy and distribute this work sheet for instructional purposes only. Copyright © 2005 PLATO Learning, Inc. All rights reserved. PLATO® is a
registered trademark of PLATO Learning, Inc. PLATO Learning is a trademark of PLATO Learning, Inc.
3
C. This table shows the results of a survey that asked people which was their favorite snack.
Display the data in a circle graph.
Favorite Snack
pretzels
candy bar
cookies
fruit
energy bar
chips
People
6
2
3
4
2
3
The snack survey had 20 participants. To determine the percentage of each section of the
circle graph, divide the number of votes by the total number of participants. Multiply the
percent of each section by 360° to determine the angle of each section of the circle graph.
Favorite
Snack
pretzels
candy bar
cookies
fruit
energy bar
chips
Percentage of
Circle Graph
Angle of Each
Section (in degrees)
6
= 30%
20
2
= 10%
20
3
= 15%
20
4
= 20%
20
2
= 10%
20
3
= 15%
20
0.30 × 360 o = 108 o
Favorite
0.10 × 360 o = 36 o
0.15 × 360 o = 54 o
0.20 × 360 o = 72 o
0.10 × 360 o = 36 o
0.15 × 360 o = 54 o
2. Practice
A. Convert the following percentages into degrees of a circle graph.
1. 10%
2. 15%
3. 25%
4. 40%
5. 55%
Permission is granted to instructors to copy and distribute this work sheet for instructional purposes only. Copyright © 2005 PLATO Learning, Inc. All rights reserved. PLATO® is a
registered trademark of PLATO Learning, Inc. PLATO Learning is a trademark of PLATO Learning, Inc.
4
B. Students were randomly polled to determine their favorite color. Convert the data in the
table to percentages of the total data set.
Favorite Color
red
orange
yellow
blue
green
purple
pink
lavender
brown
black
Students
4
1
3
8
2
1
4
1
2
4
Permission is granted to instructors to copy and distribute this work sheet for instructional purposes only. Copyright © 2005 PLATO Learning, Inc. All rights reserved. PLATO® is a
registered trademark of PLATO Learning, Inc. PLATO Learning is a trademark of PLATO Learning, Inc.
5
3. Making Connections
The members of the garden club took a survey to determine which types of flowers are the
most fun to grow. The survey results were placed in a table. Use these data to do the tasks
that follow.
Plant Type
tulips
impatiens
pansies
daisies
roses
Club Members
3
1
7
3
6
A. Make a circle graph.
B. Determine which plant types must be combined to equal the votes for pansies.
C. Determine what percentage of the club members do not think that pansies are the most
fun plant to grow.
Permission is granted to instructors to copy and distribute this work sheet for instructional purposes only. Copyright © 2005 PLATO Learning, Inc. All rights reserved. PLATO® is a
registered trademark of PLATO Learning, Inc. PLATO Learning is a trademark of PLATO Learning, Inc.
6
When you have completed this activity, go to Status Check.
Student Activity:
Algebra 1A
Unit 4
Determining Whether a
Relation Is a Function
Name _________________________________________
Date____________________________
Objective
In this activity, you will learn to determine whether a relation is a function.
Activities
A relation is a set of ordered pairs. The relation may be specified by an equation, a rule, or a table.
The set of the first components of the ordered pairs is called the domain of the relation. The set of
the second components is called the range of the relation. A function is a relation such that each
element in the domain is paired with exactly 1 element in the range.
1. Example
Which relations are functions?
A. {(1, 2), (2, 3), (3, 4), (4, 5)}
function—each first element is paired with exactly 1 second element
B. {(1, 2), (1, 3), (2, 8), (3, 9)}
not a function—1 is paired with 2 and with 3
C. {(1, 3), (2, 3), (4, 3), (9, 3)}
function—each first element is paired with exactly 1 second element
D. {(-3, 9), (1, 2), (8, -4), (8, 5)}
not a function—81 is paired with –4 and with 5
2. Practice
For which of these equations is y a function of x?
A. y = 3x 3
B. xy = 1
C. y 2 = x
D. y 3 = 8 x
3. Making Connections
Write a function rule that converts h hours to m minutes. Use the function to calculate the
number of minutes in a week (168 hours).
Permission is granted to instructors to copy and distribute this work sheet for instructional purposes only. Copyright © 2005 PLATO Learning, Inc. All rights reserved. PLATO® is a
registered trademark of PLATO Learning, Inc. PLATO Learning is a trademark of PLATO Learning, Inc.
1


© Copyright 2026